📊 Market Analysis Dashboard
500 Charts with Insights + RS Analysis
April 11, 2026
Total Charts
500
Insights Files
500
High Volatility Stocks
25
Low Volatility Stocks
62
Best RS Stock
NATIONALUM
Avg RS Score
49.899
Best Month
Apr
Worst Month
Mar
📅 Average Monthly Returns
📅 Average Day of Week Returns
📊 Key Insights & Metrics
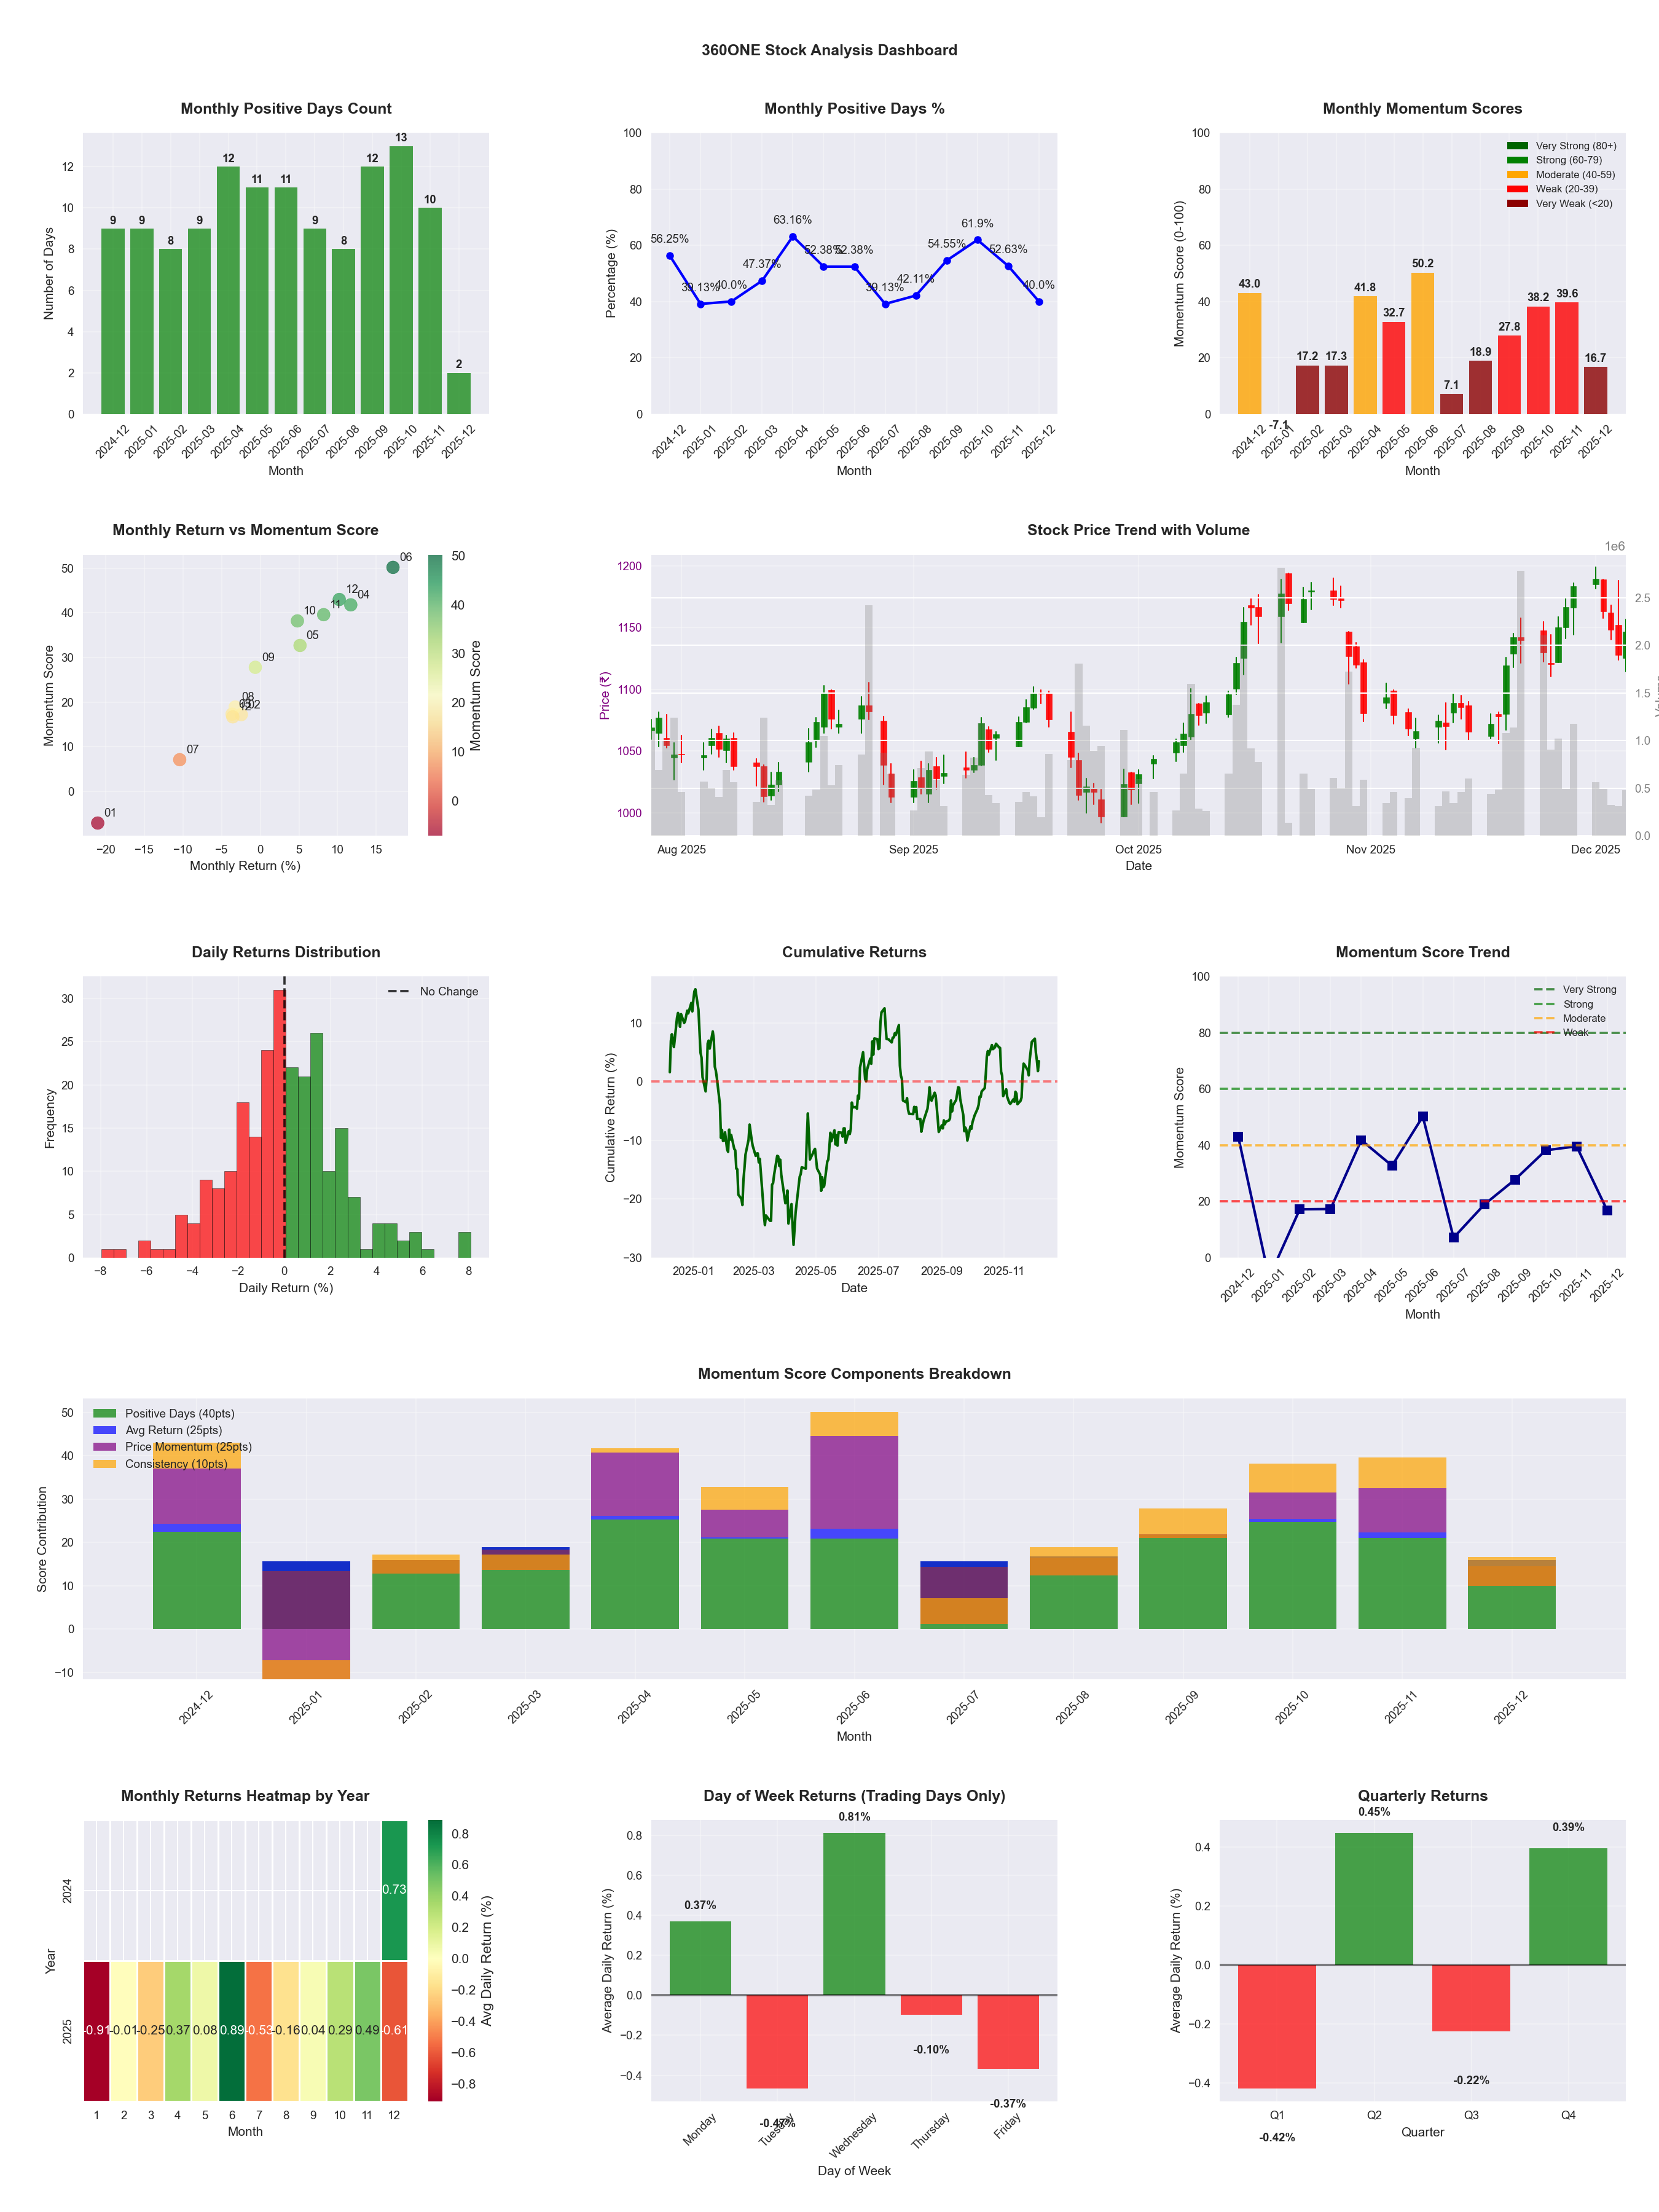
Symbol
📈 360ONE
Date
📅 2026-04-11
Volatility
🟡 2.04%
Risk Profile
⚠️ suitable for aggressive investors
Win Rate
⚠️ 49.0%
Avg Daily Return
📈 +0.09%
Max Drawdown
📉 -25.46%
IBD RS Score
📊 43.4
Weak
Market Rank
#279
Best Month
🏆 2025-06
Worst Month
📉 2026-03
Best Months to Trade
📅 Apr, Jun, Nov
Best Days to Trade
📅 Wednesday, Monday
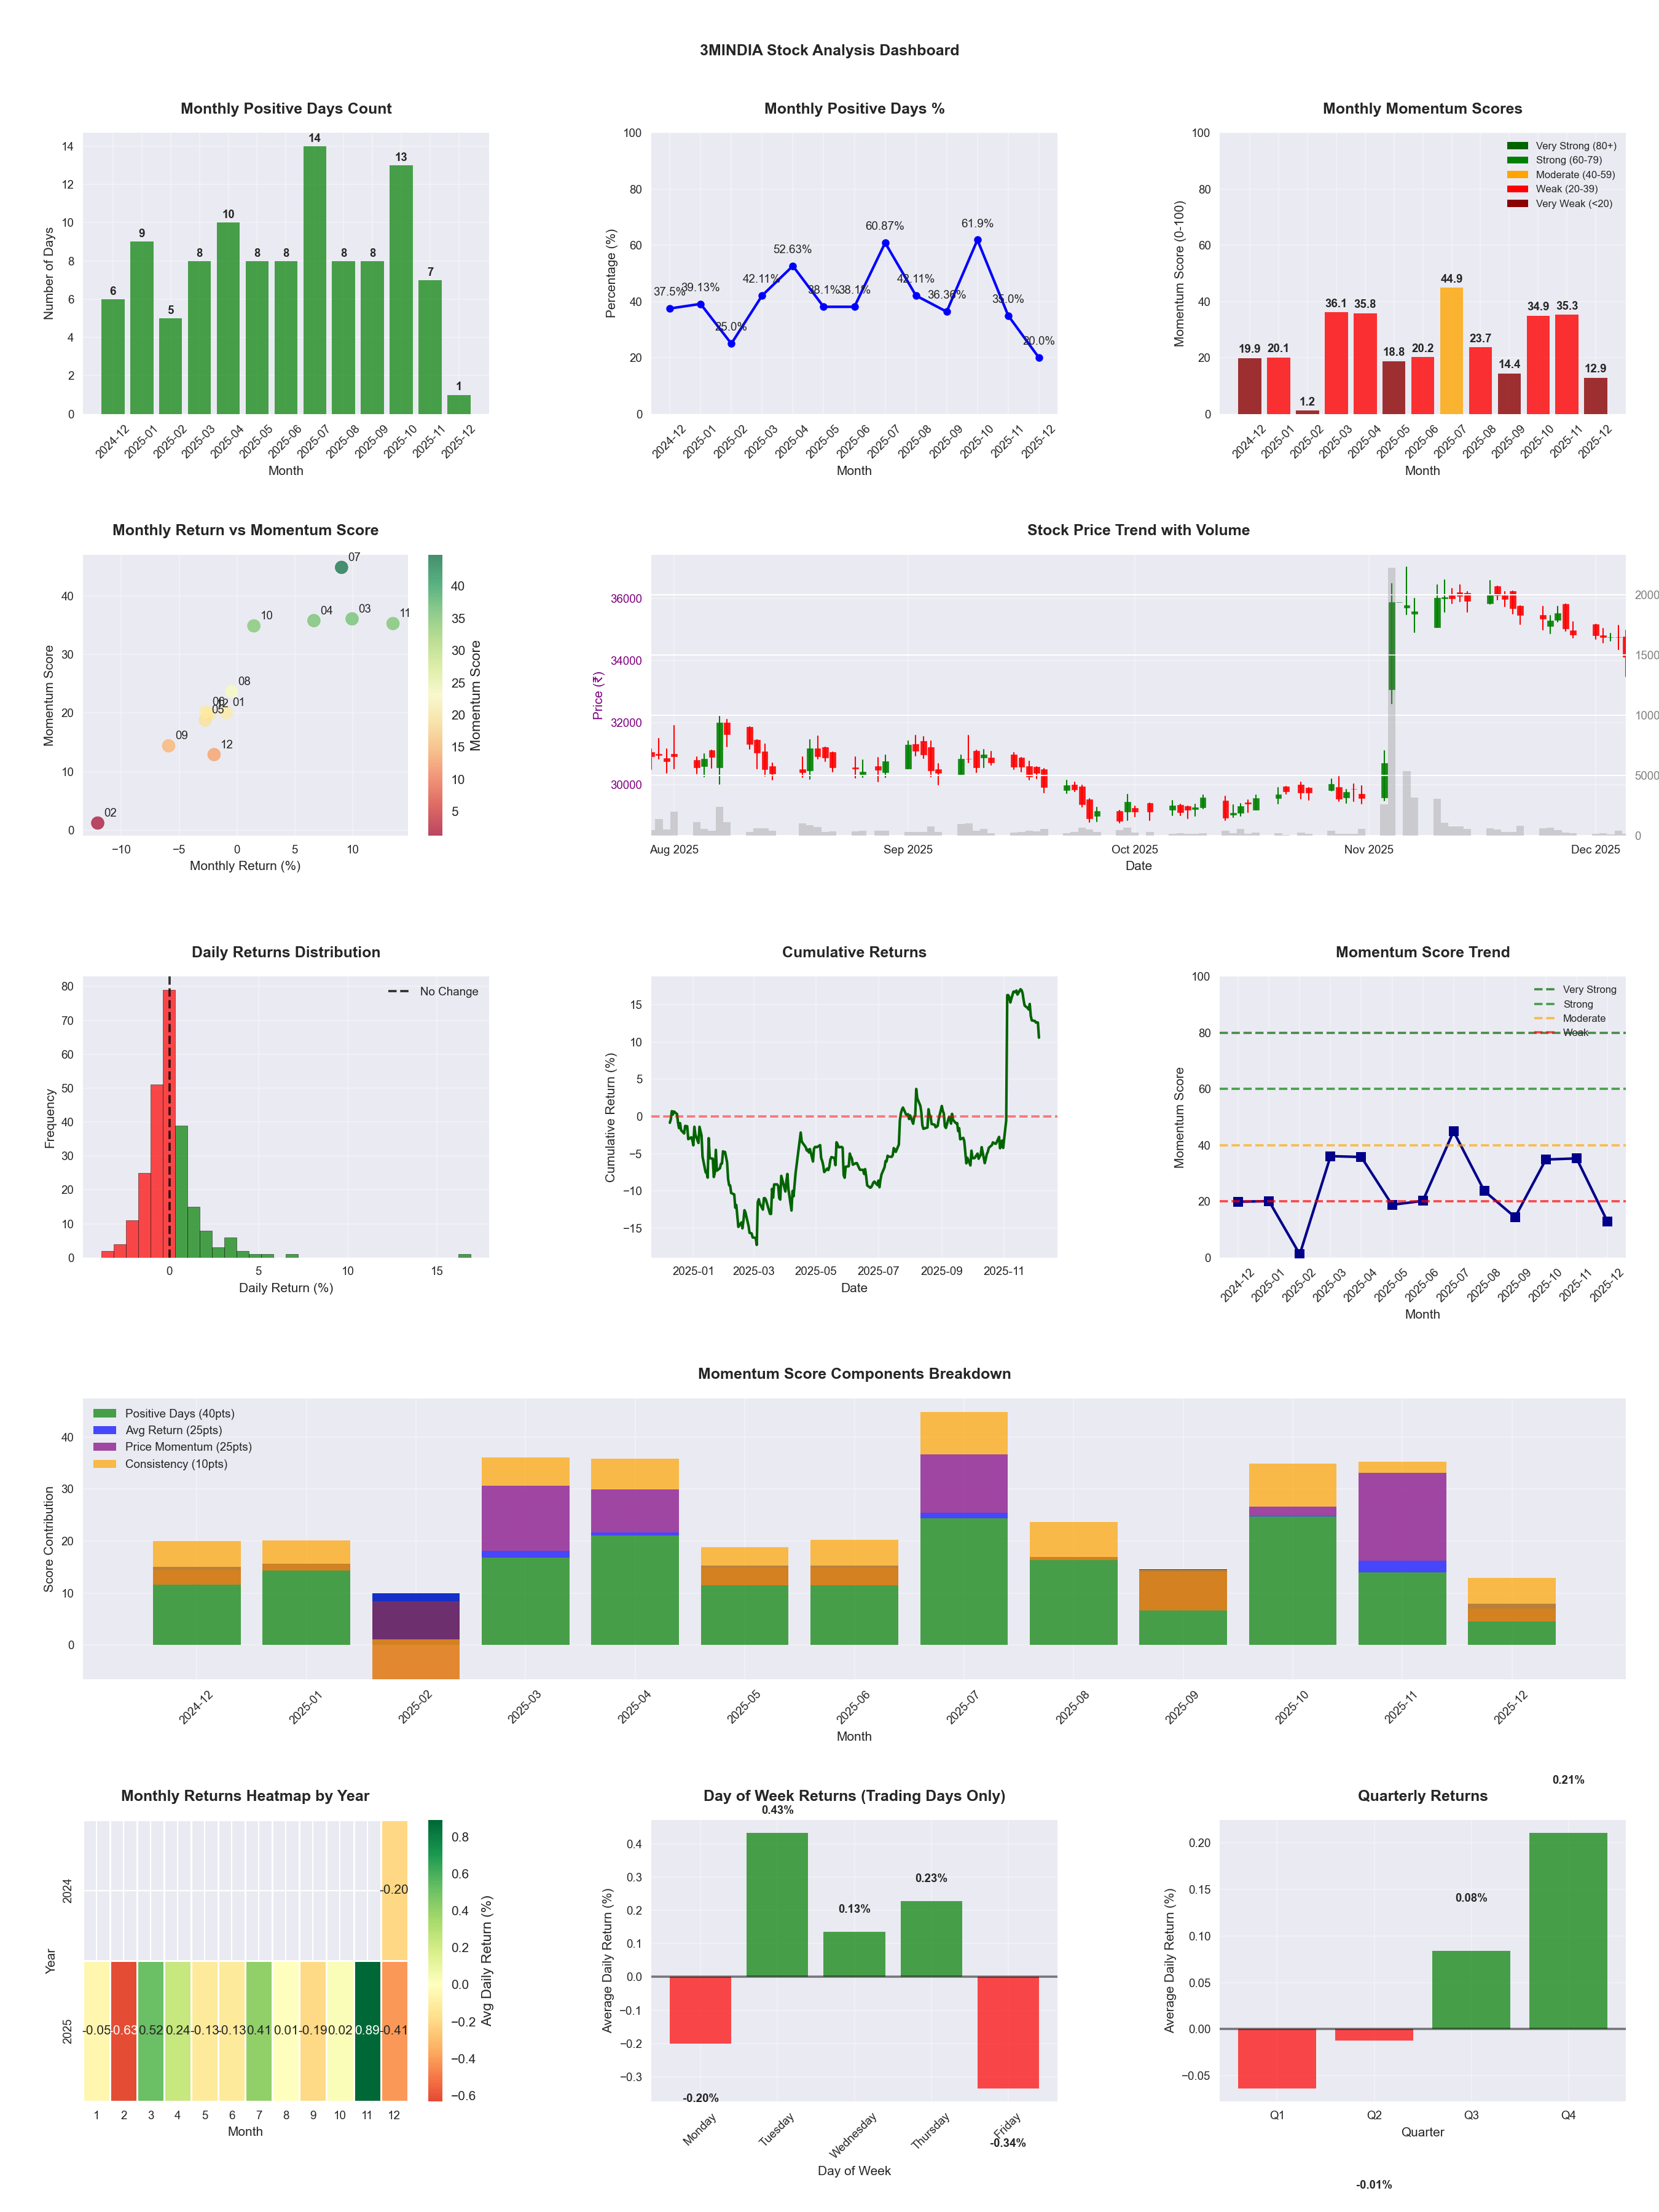
📊 Key Insights & Metrics
Symbol
📈 3MINDIA
Date
📅 2026-04-11
Volatility
🟡 1.88%
Win Rate
⚠️ 44.1%
Avg Daily Return
📈 +0.06%
Max Drawdown
📉 -22.25%
IBD RS Score
📊 63.9
Average
Market Rank
#178
Best Month
🏆 2025-07
Best Months to Trade
📅 Nov, Apr, Feb
Best Days to Trade
📅 Tuesday, Wednesday
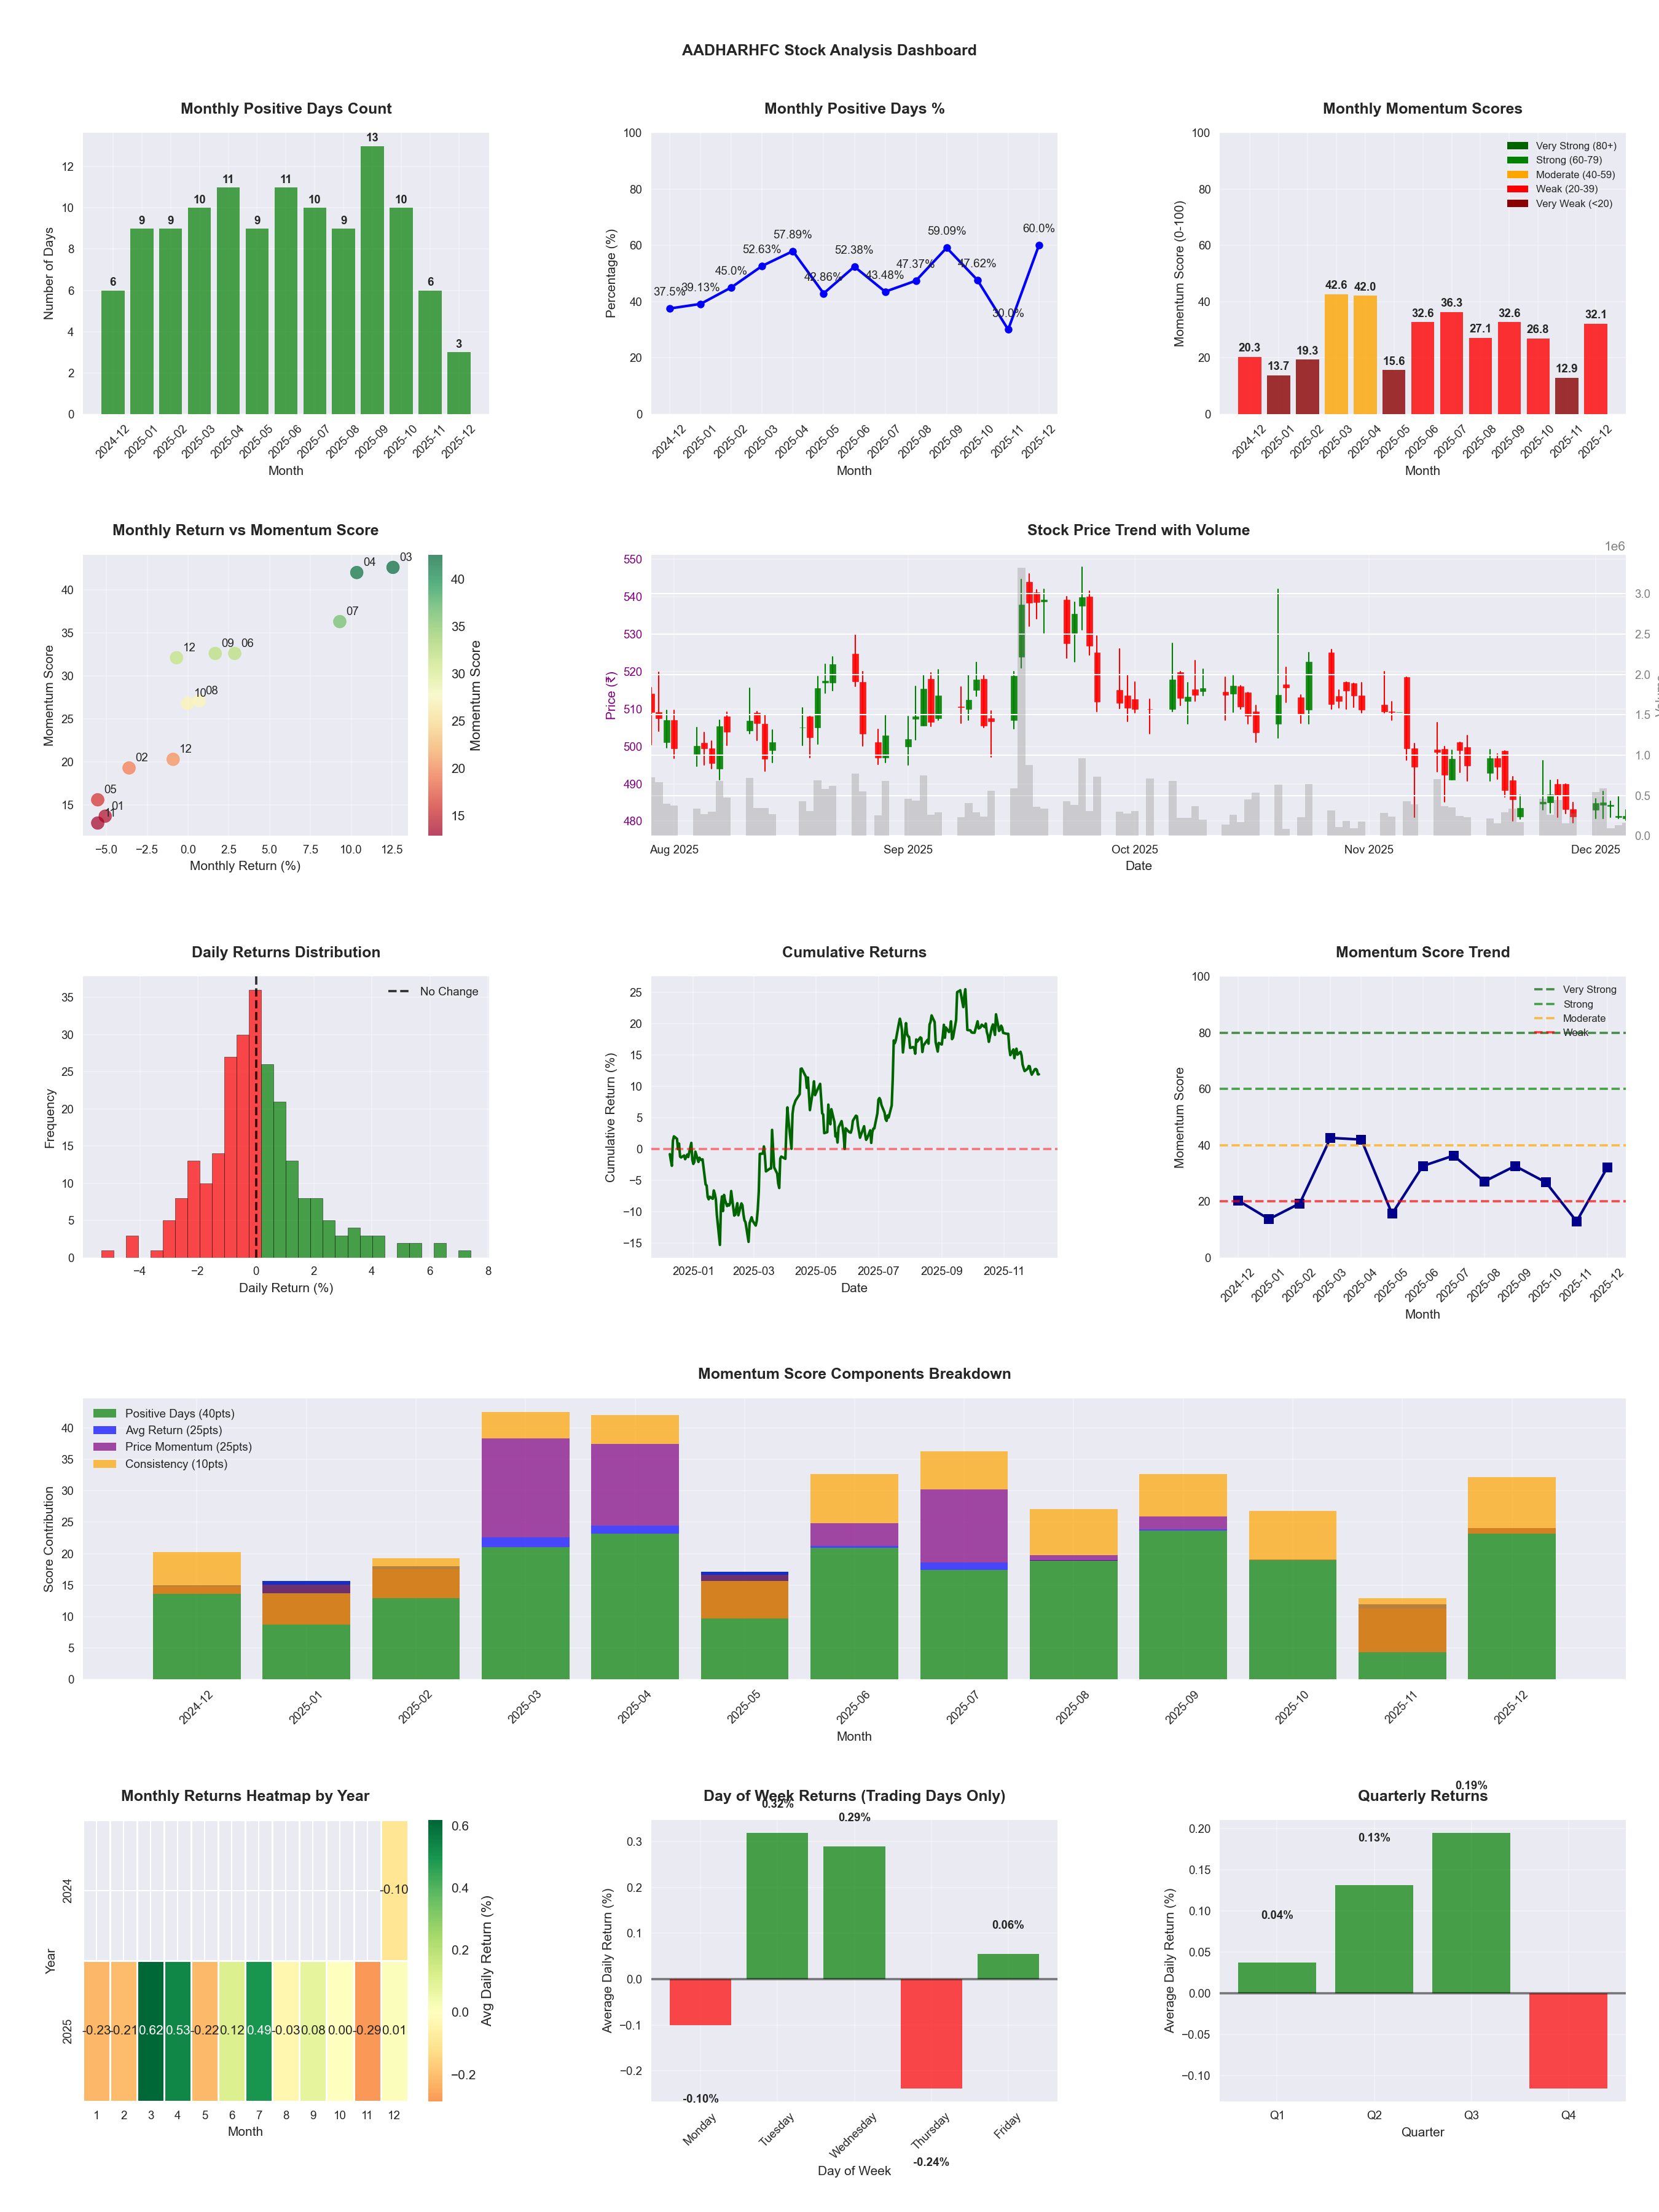
📊 Key Insights & Metrics
Symbol
📈 AADHARHFC
Date
📅 2026-04-11
Volatility
🟡 1.64%
Win Rate
⚠️ 48.0%
Avg Daily Return
📈 +0.03%
Max Drawdown
📉 -18.66%
IBD RS Score
📊 61.3
Average
Market Rank
#191
Best Month
🏆 2026-04
Worst Month
📉 2025-11
Best Months to Trade
📅 Jul, Apr, Jun
Best Days to Trade
📅 Monday, Wednesday
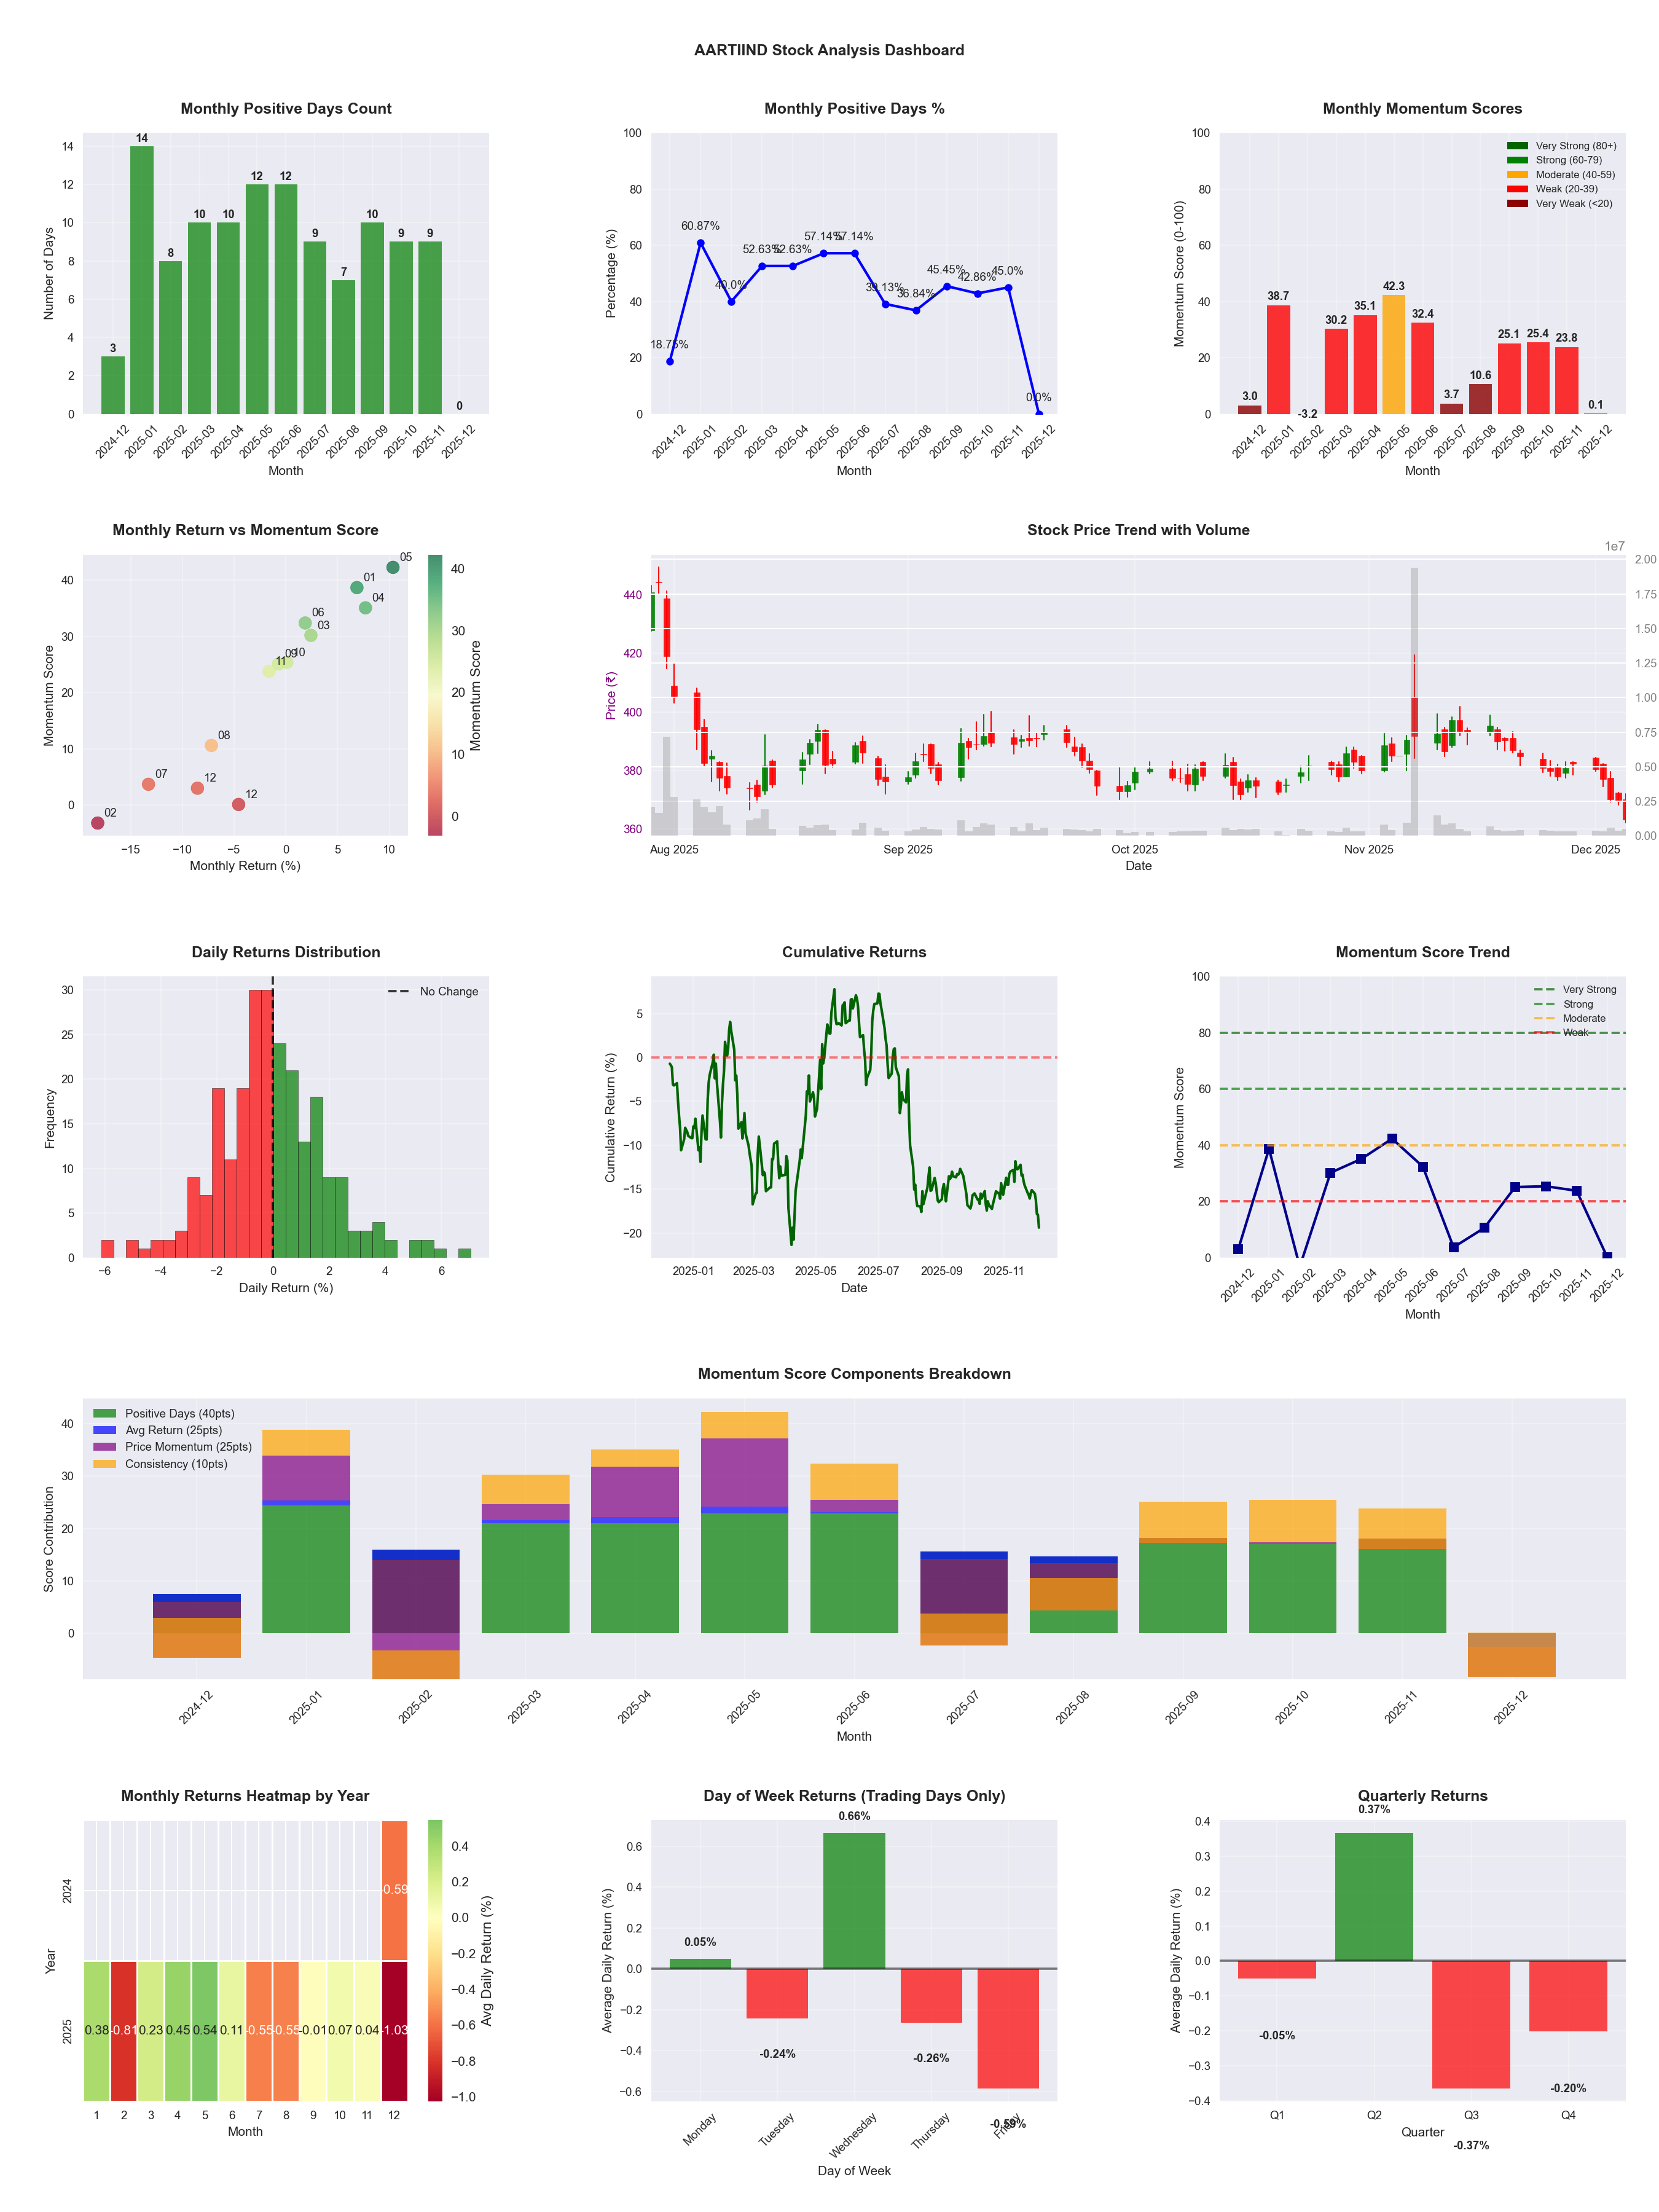
📊 Key Insights & Metrics
Symbol
📈 AARTIIND
Date
📅 2026-04-11
Volatility
🟡 2.22%
Risk Profile
⚠️ suitable for aggressive investors
Win Rate
⚠️ 45.5%
Avg Daily Return
📈 +0.07%
Max Drawdown
📉 -29.96%
IBD RS Score
📊 75.9
Strong
Market Rank
#119
Best Month
🏆 2026-02
Worst Month
📉 2025-07
Best Months to Trade
📅 Feb, Apr, May
Best Days to Trade
📅 Wednesday, Monday
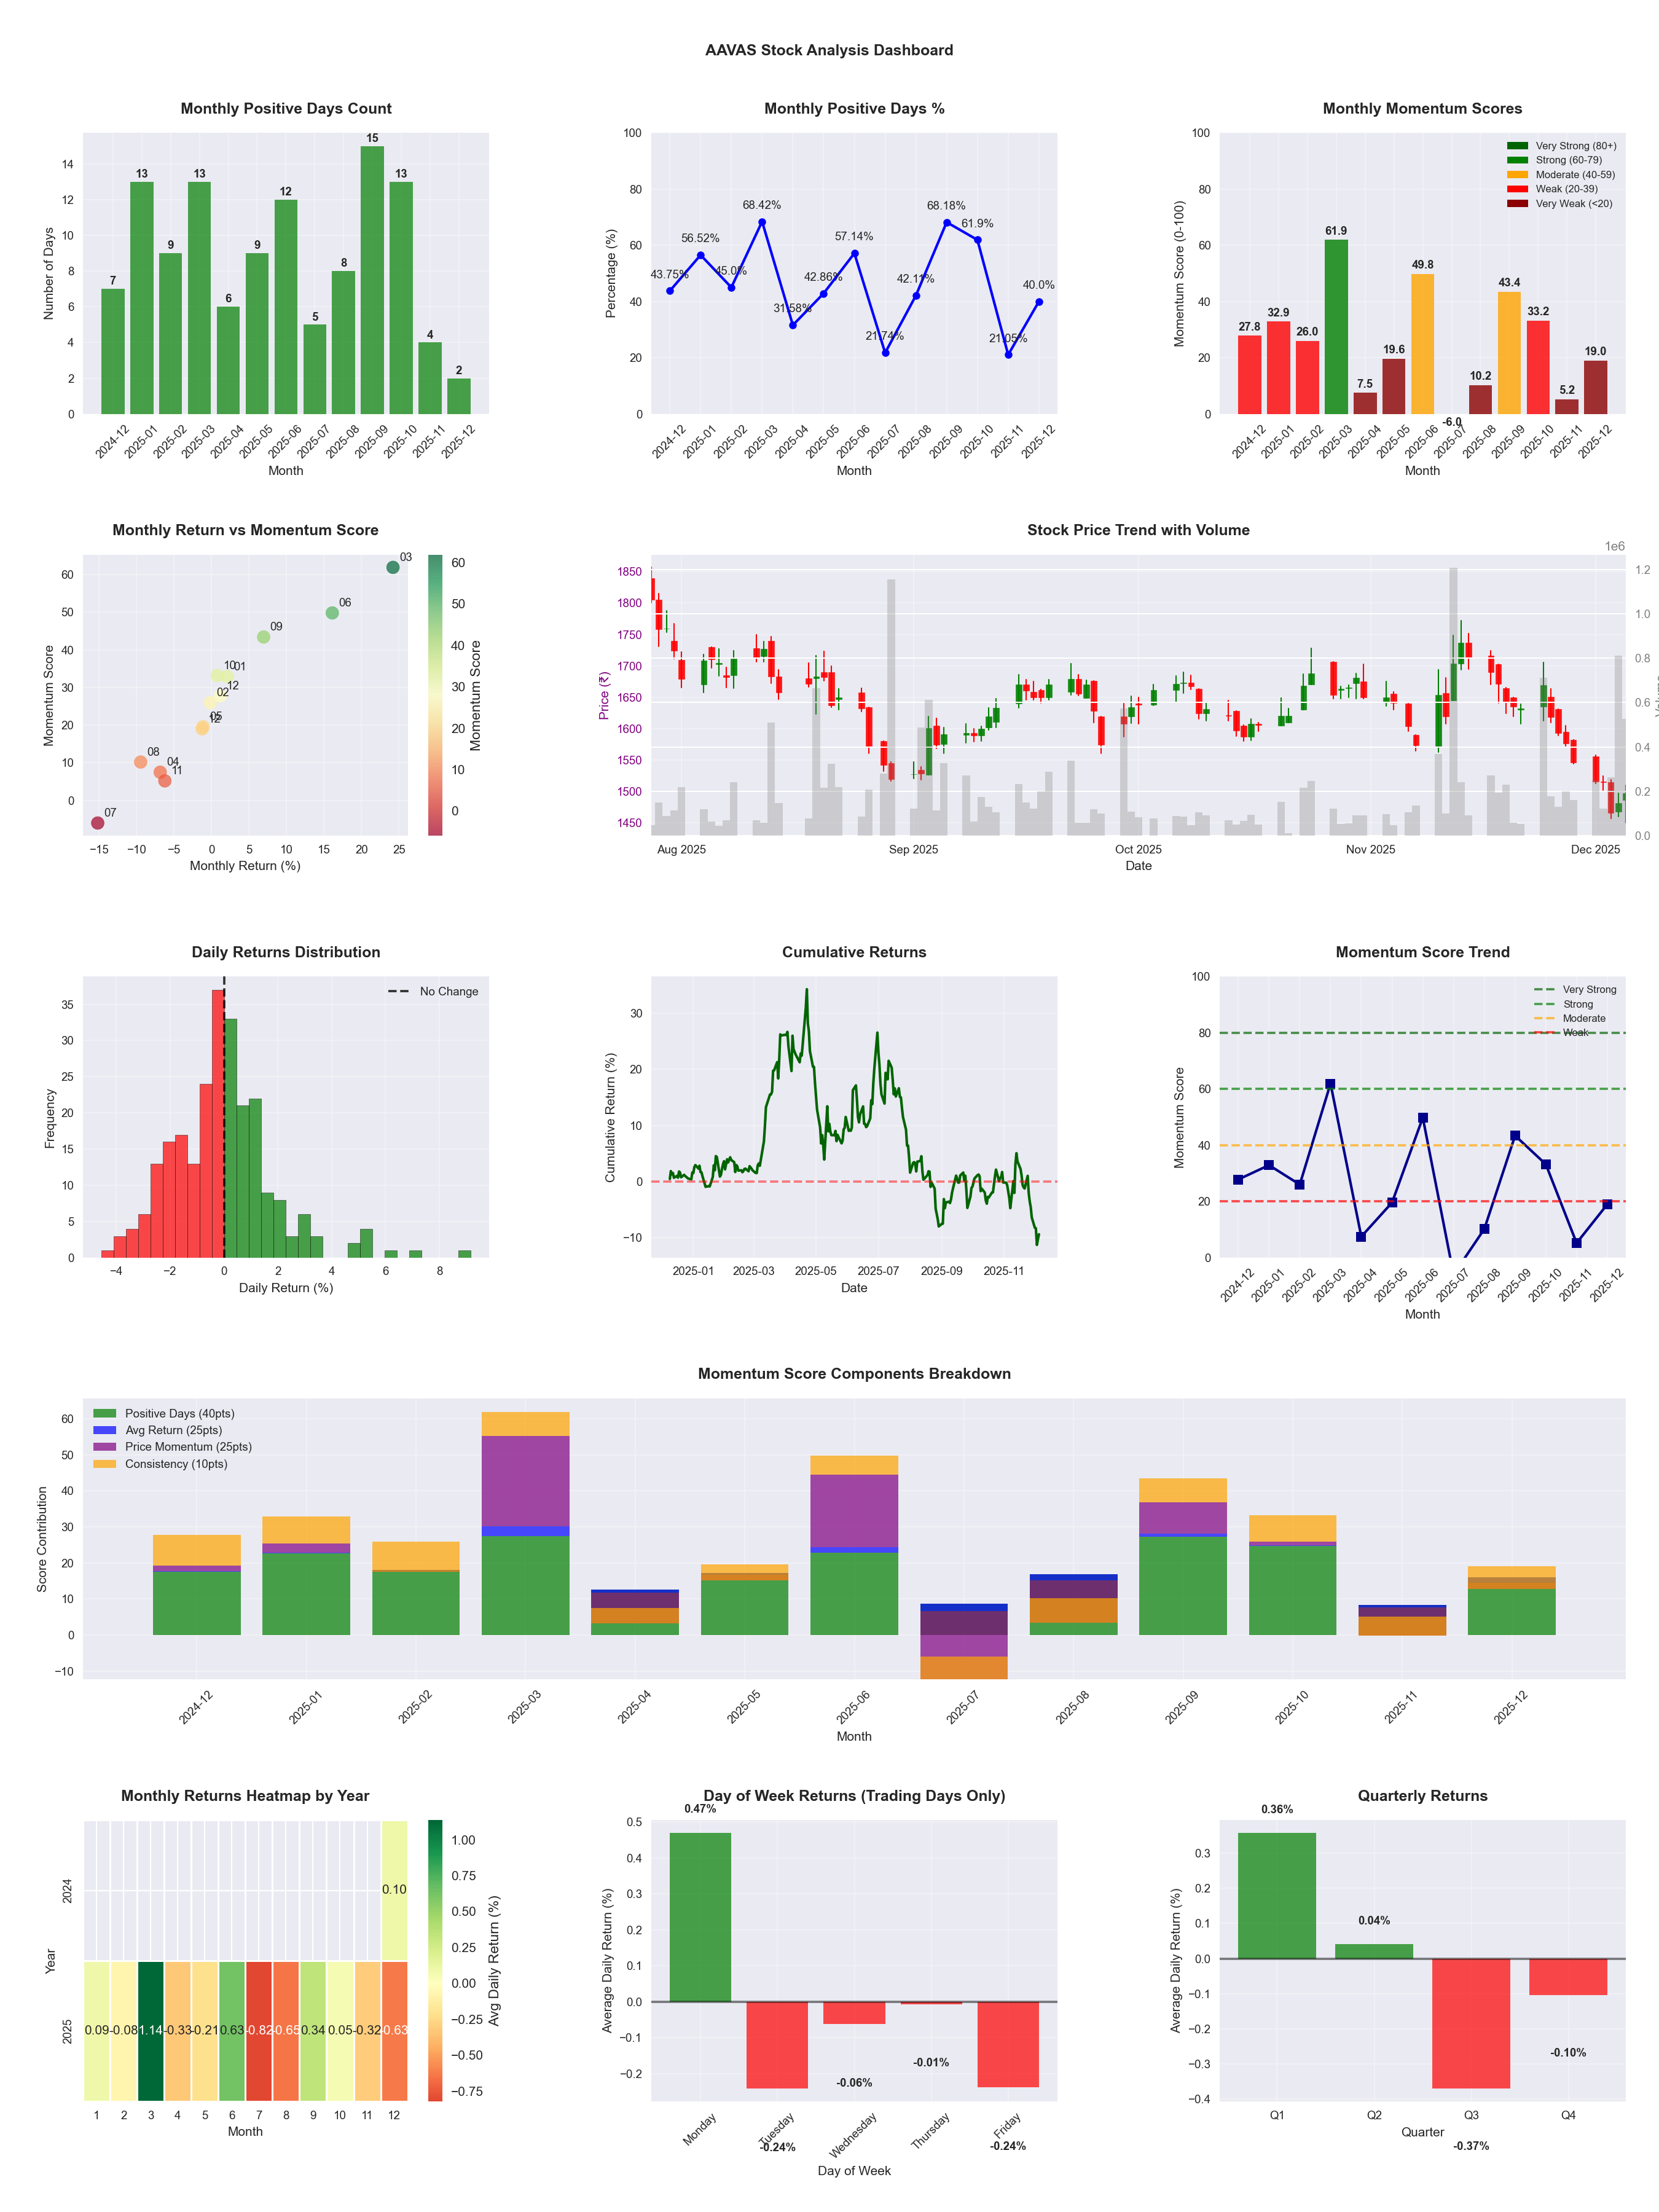
📊 Key Insights & Metrics
Symbol
📈 AAVAS
Date
📅 2026-04-11
Volatility
🟡 2.09%
Risk Profile
⚠️ suitable for aggressive investors
Win Rate
⚠️ 42.3%
Avg Daily Return
📉 -0.18%
Max Drawdown
📉 -51.64%
IBD RS Score
📊 6.9
Weak
Market Rank
#459
Best Month
🏆 2026-04
Best Months to Trade
📅 Jun, Apr, Sep
Best Days to Trade
📅 Monday, Wednesday
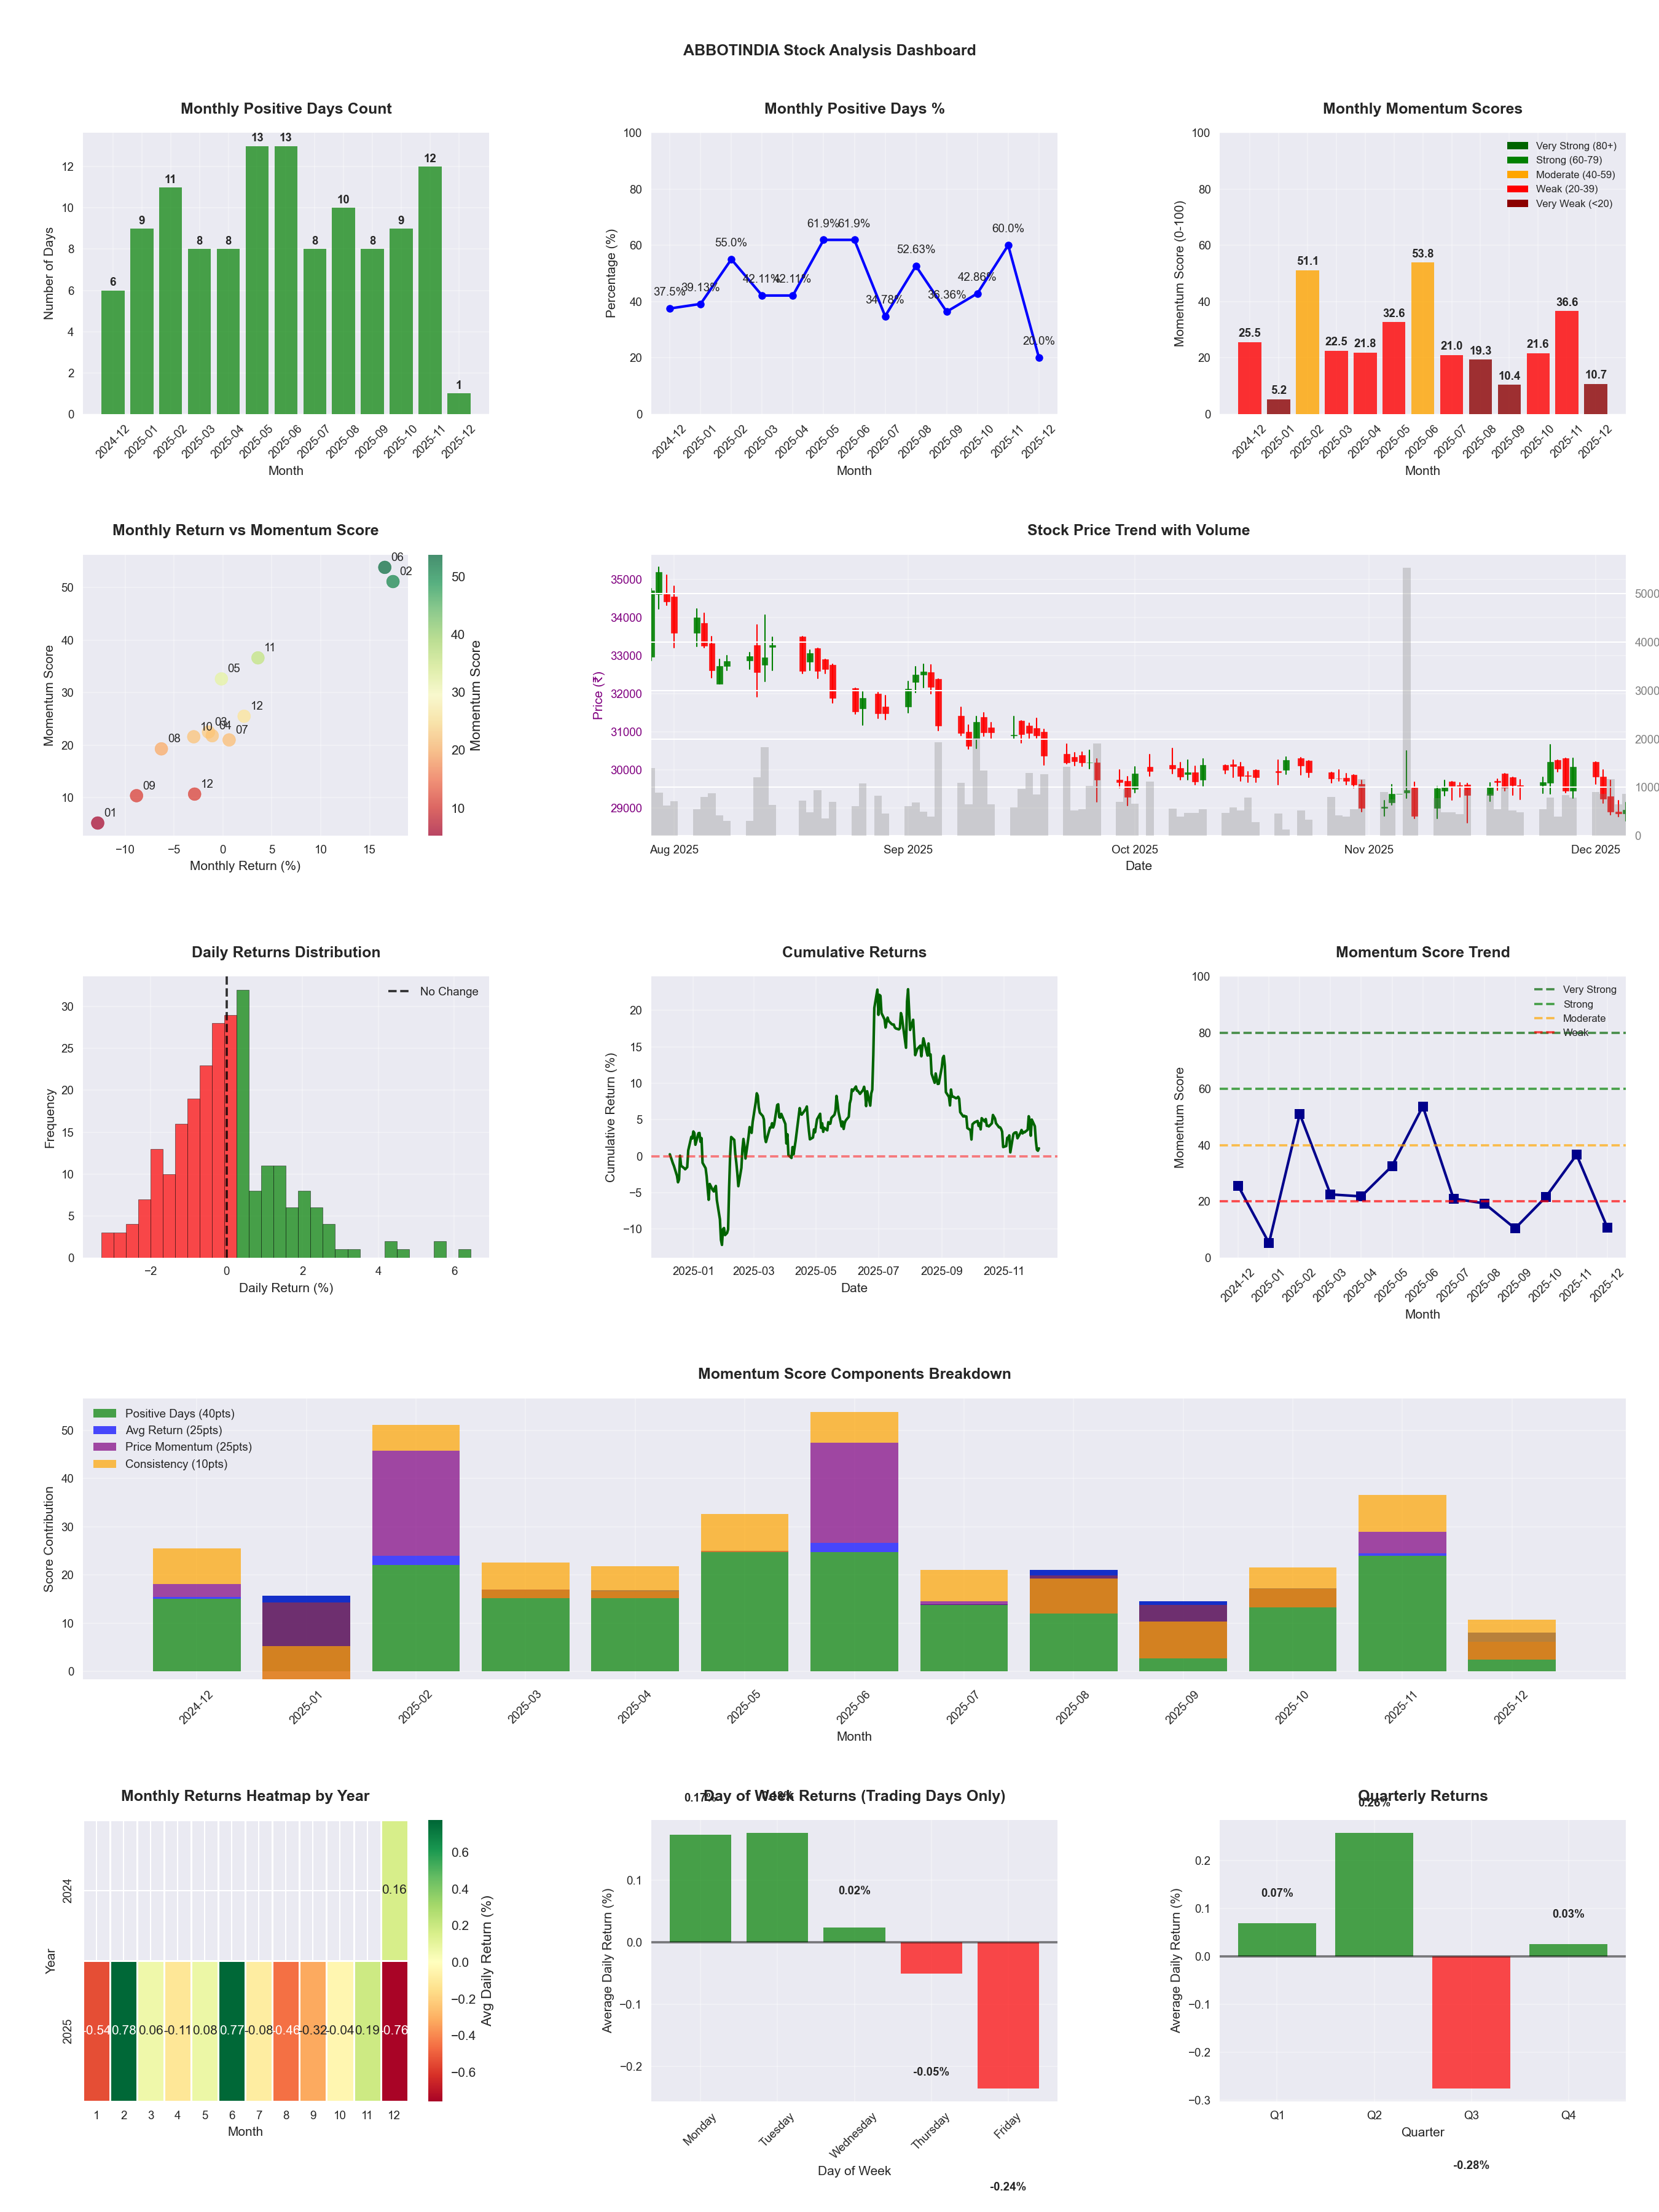
📊 Key Insights & Metrics
Symbol
📈 ABBOTINDIA
Date
📅 2026-04-11
Volatility
🟢 1.38%
Win Rate
⚠️ 45.1%
Avg Daily Return
📉 -0.04%
Max Drawdown
📉 -27.59%
IBD RS Score
📊 28.6
Weak
Market Rank
#352
Best Month
🏆 2025-06
Worst Month
📉 2025-09
Best Months to Trade
📅 Jun, Nov, May
Best Days to Trade
📅 Wednesday, Tuesday
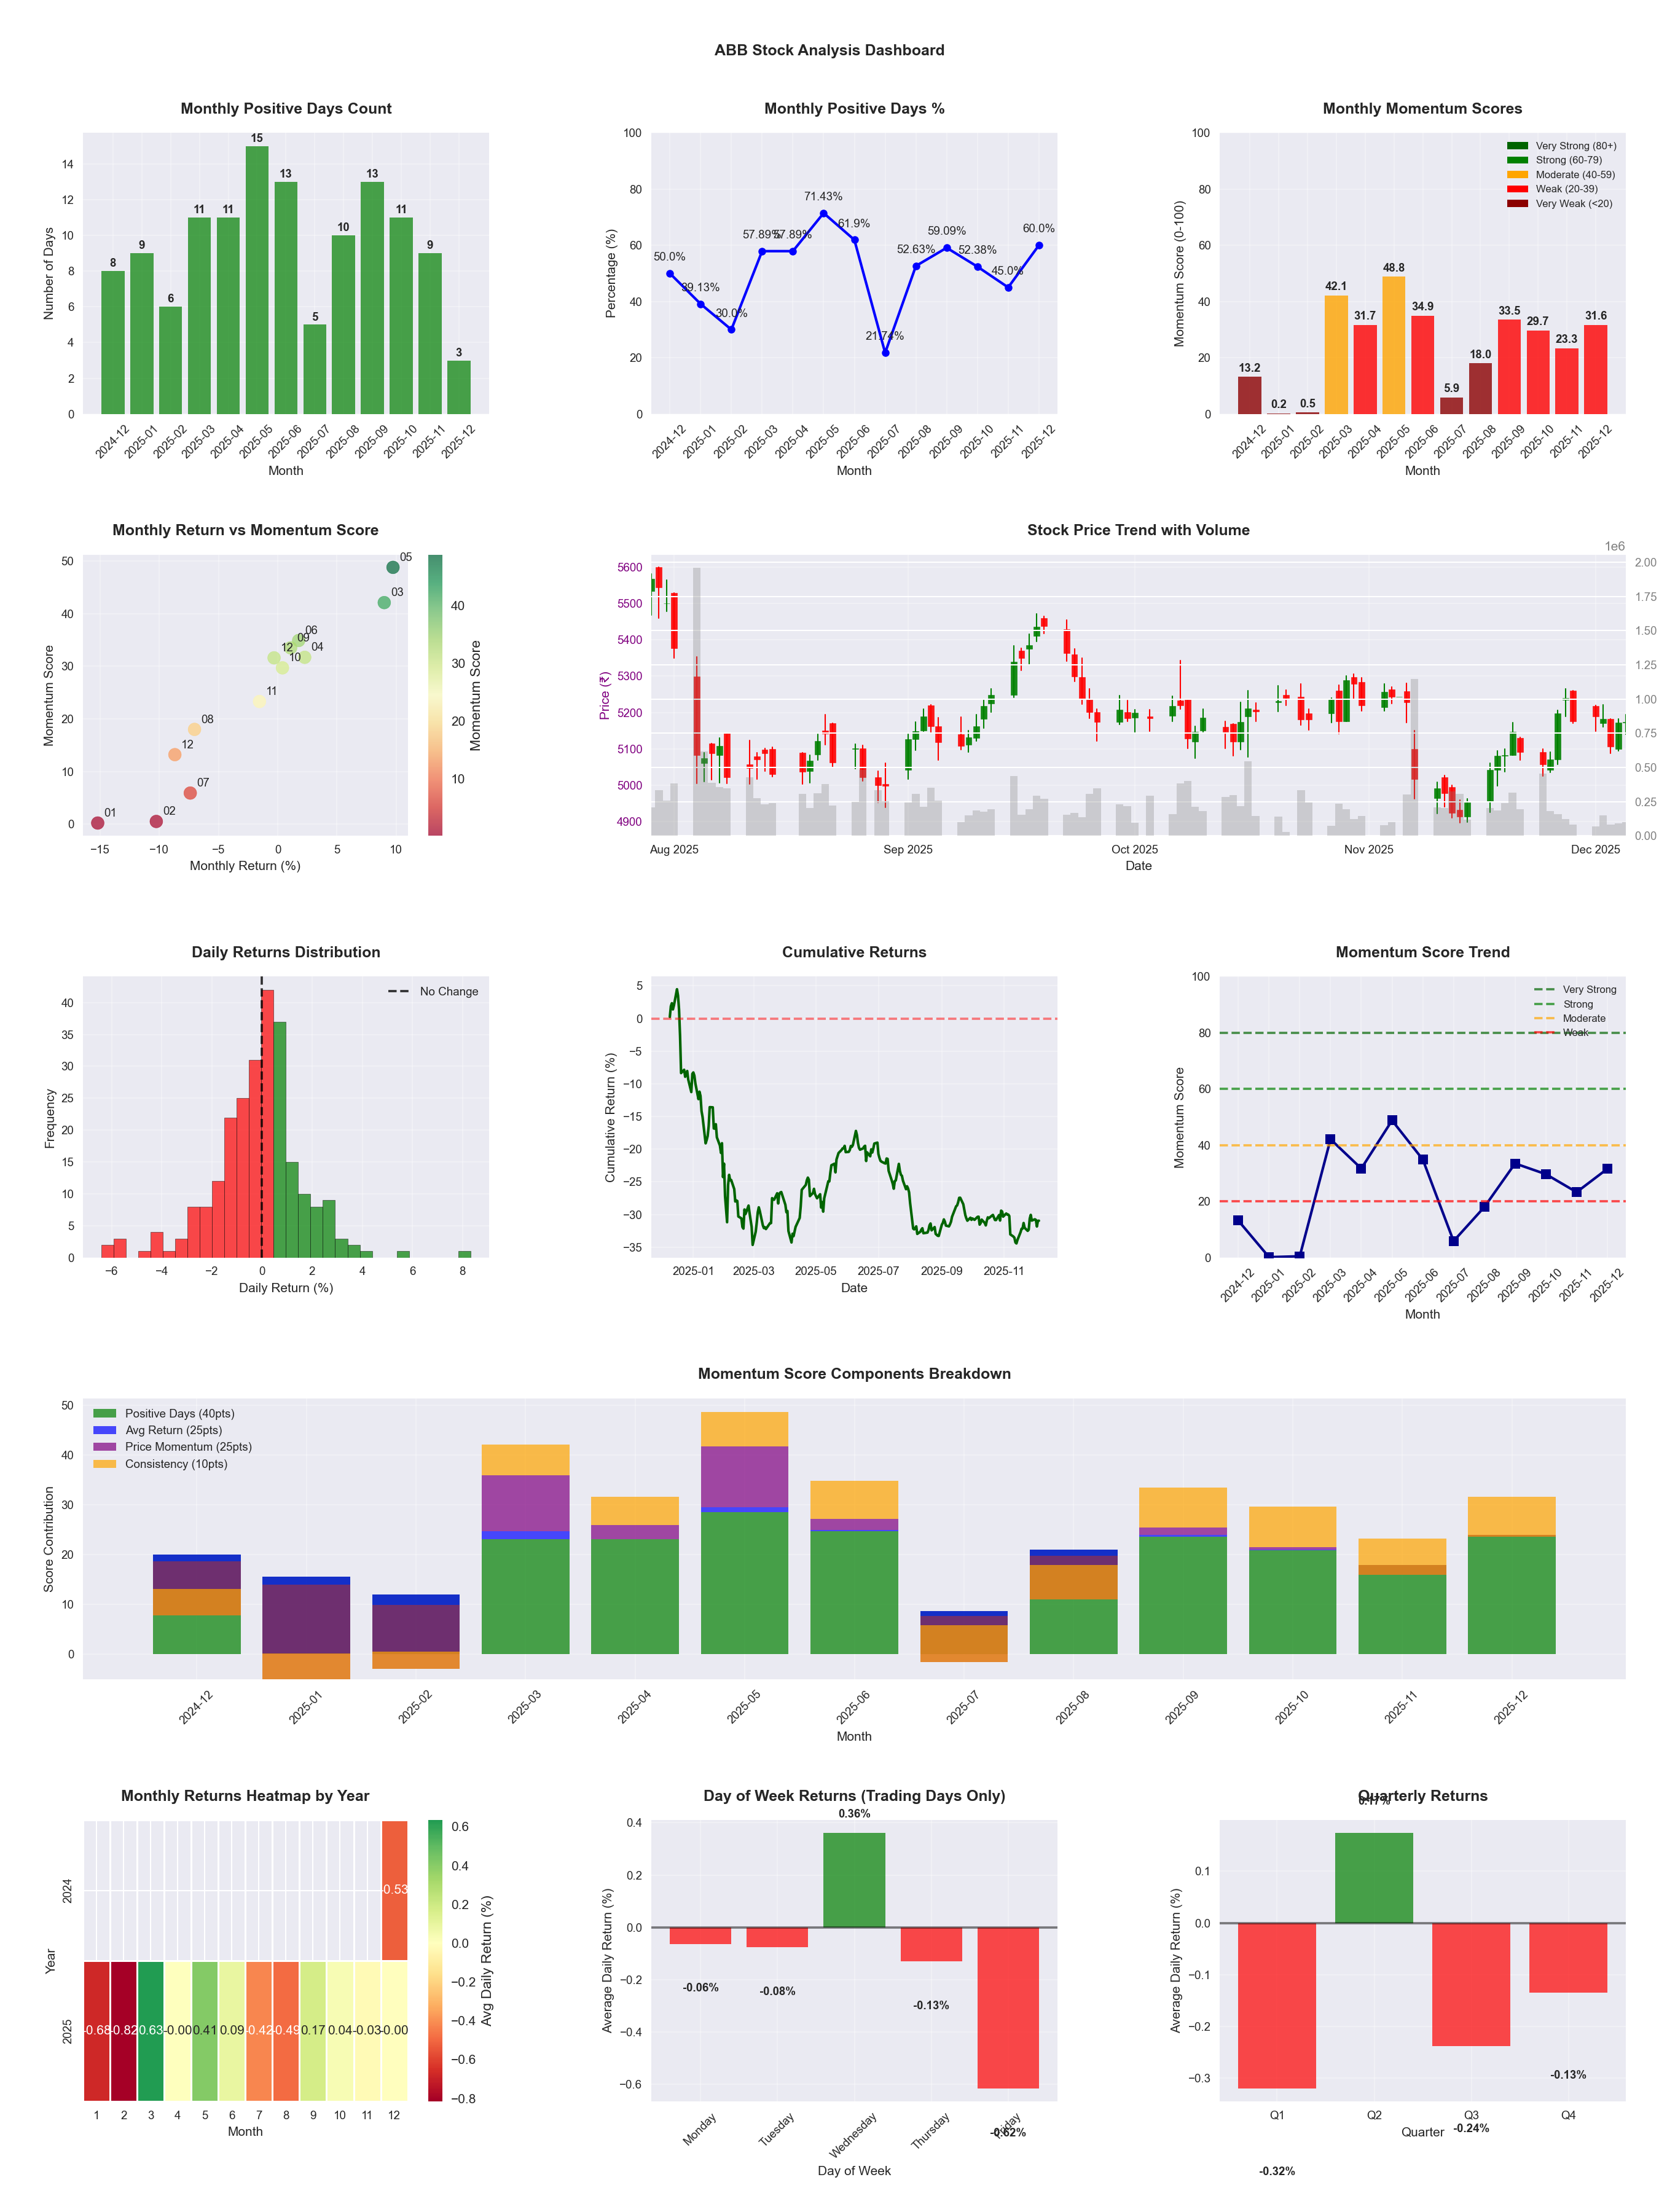
📊 Key Insights & Metrics
Symbol
📈 ABB
Date
📅 2026-04-11
Volatility
🟡 1.66%
Win Rate
⚠️ 54.9%
Avg Daily Return
📈 +0.13%
Max Drawdown
📉 -24.37%
IBD RS Score
📊 94.3
Leader
Market Rank
#28
Best Month
🏆 2026-04
Worst Month
📉 2025-07
Best Months to Trade
📅 Apr, Feb, May
Best Days to Trade
📅 Wednesday, Thursday
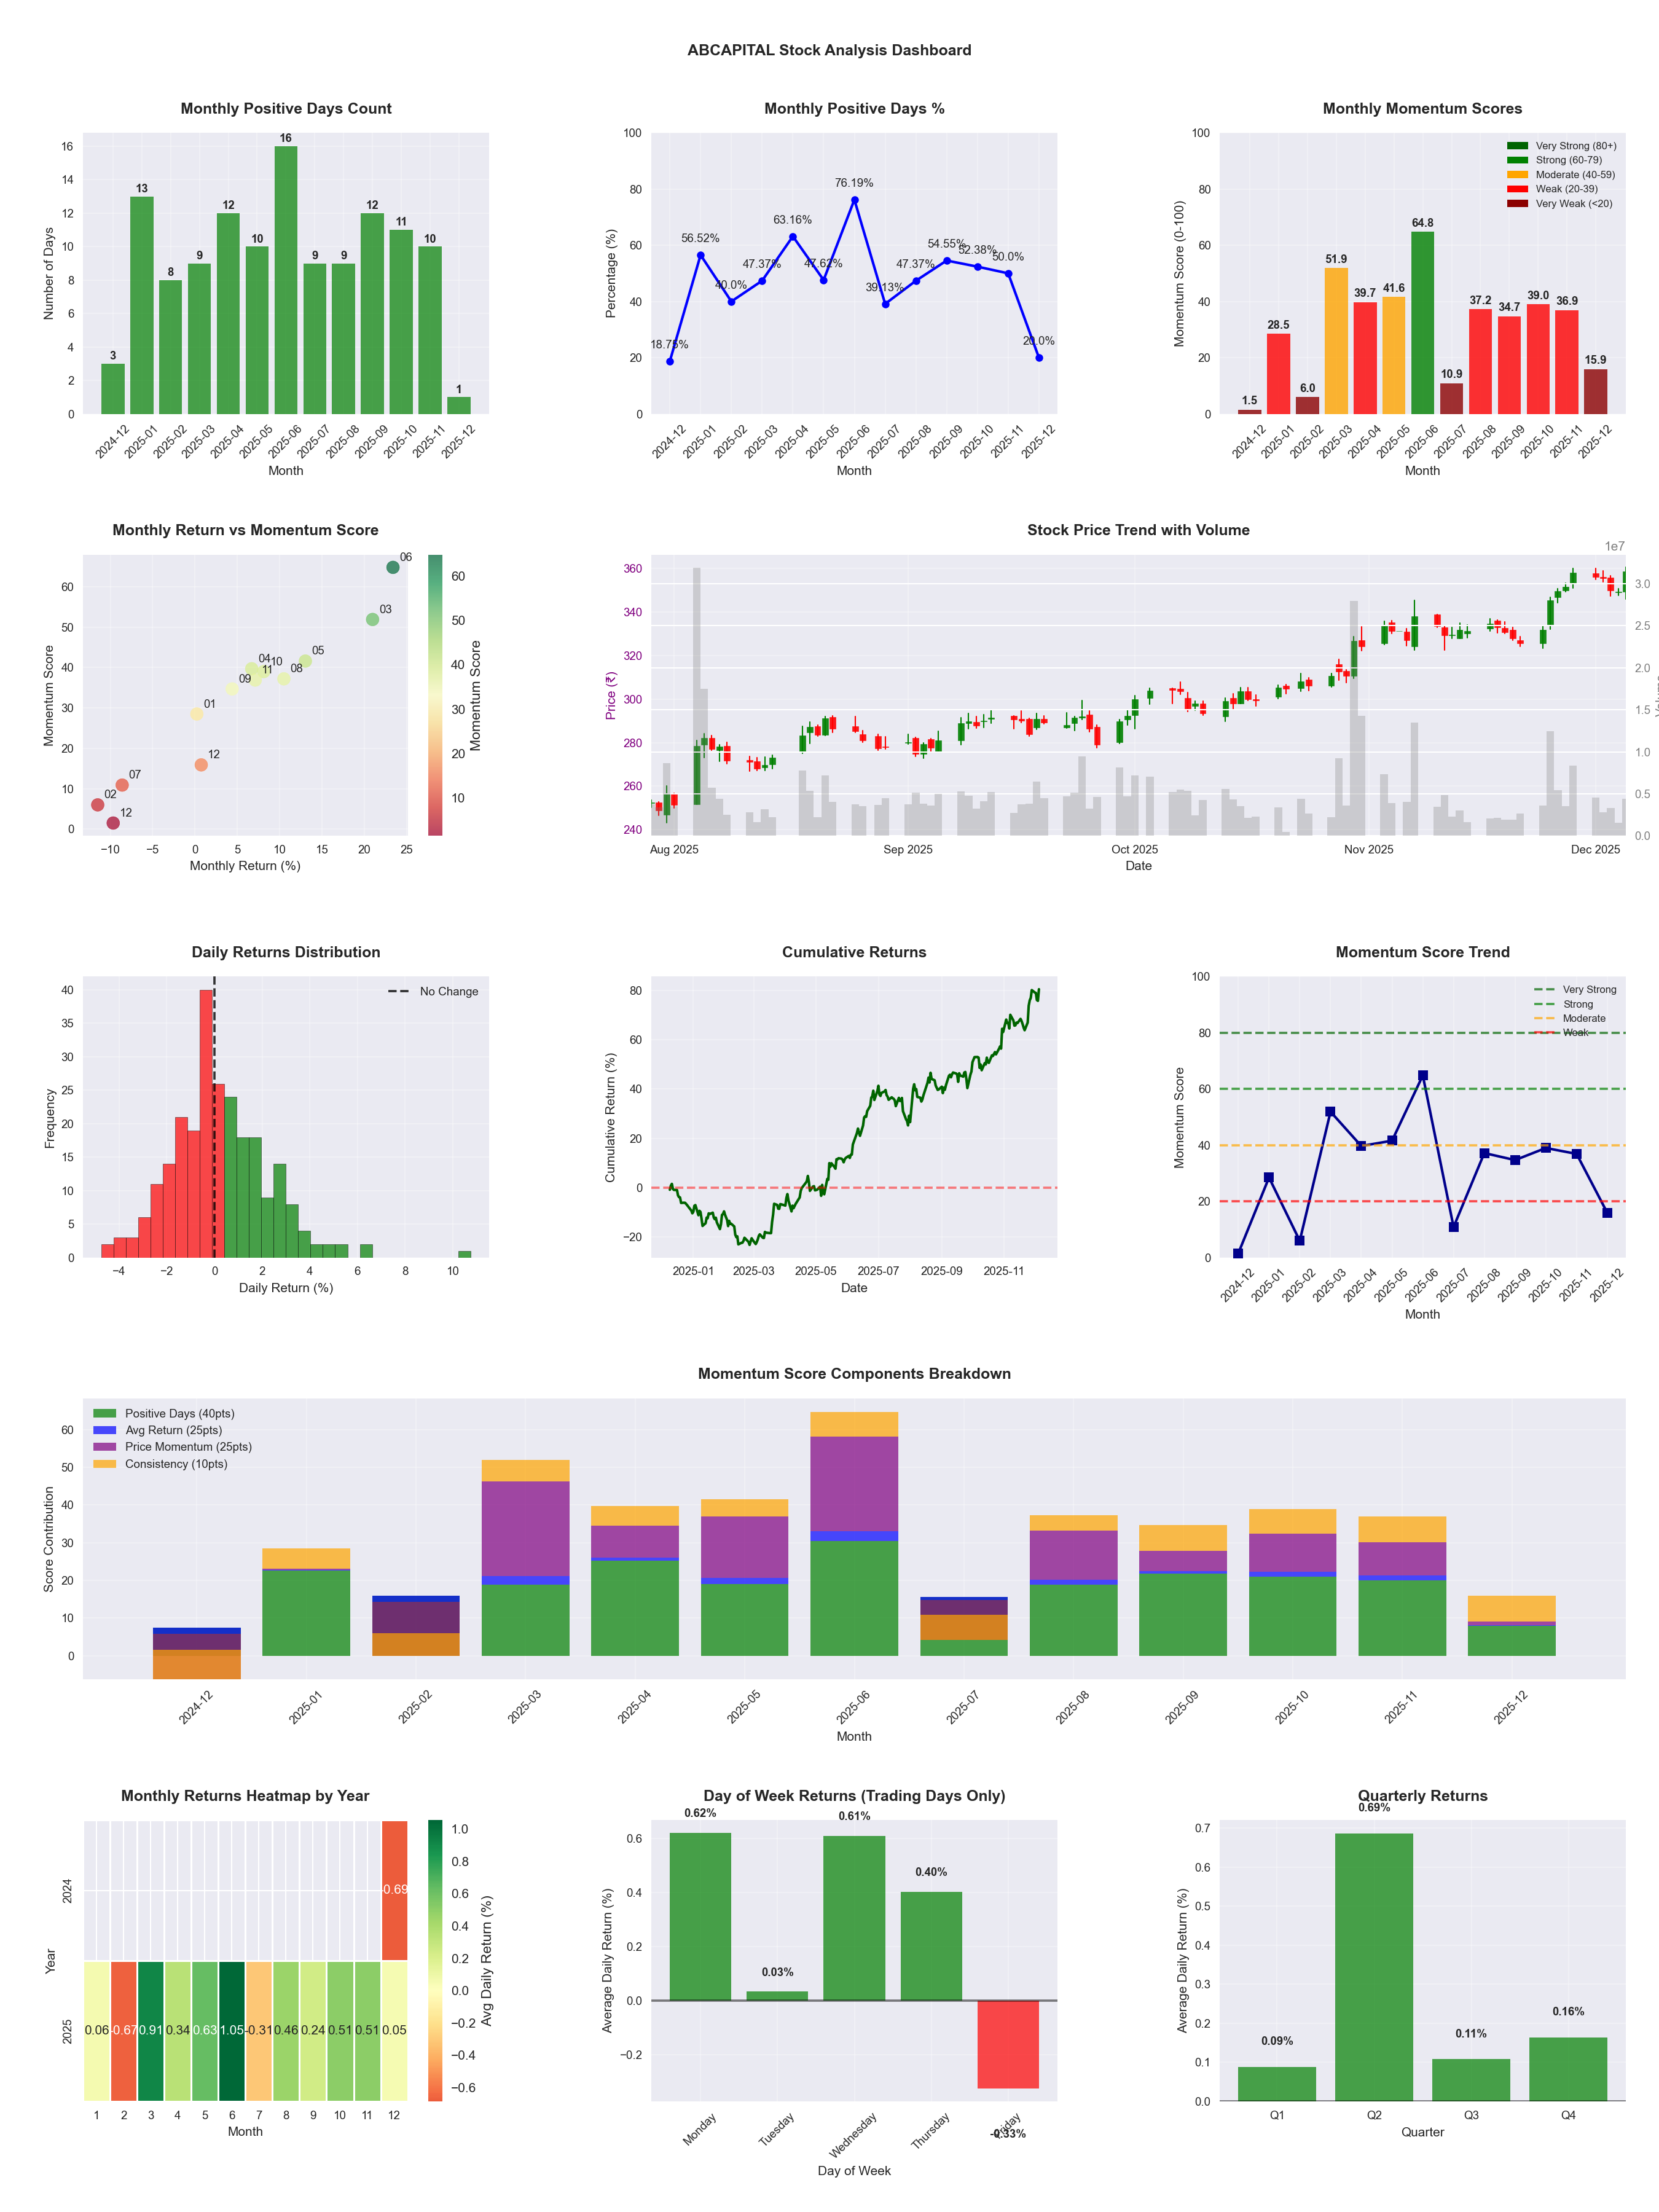
📊 Key Insights & Metrics
Symbol
📈 ABCAPITAL
Date
📅 2026-04-11
Volatility
🟡 2.12%
Risk Profile
⚠️ suitable for aggressive investors
Win Rate
⚠️ 51.6%
Avg Daily Return
📈 +0.27%
Max Drawdown
📉 -19.72%
IBD RS Score
📊 89.7
Strong
Market Rank
#51
Best Month
🏆 2025-06
Best Months to Trade
📅 Apr, Jun, May
Best Days to Trade
📅 Monday, Wednesday
📊 Key Insights & Metrics
Symbol
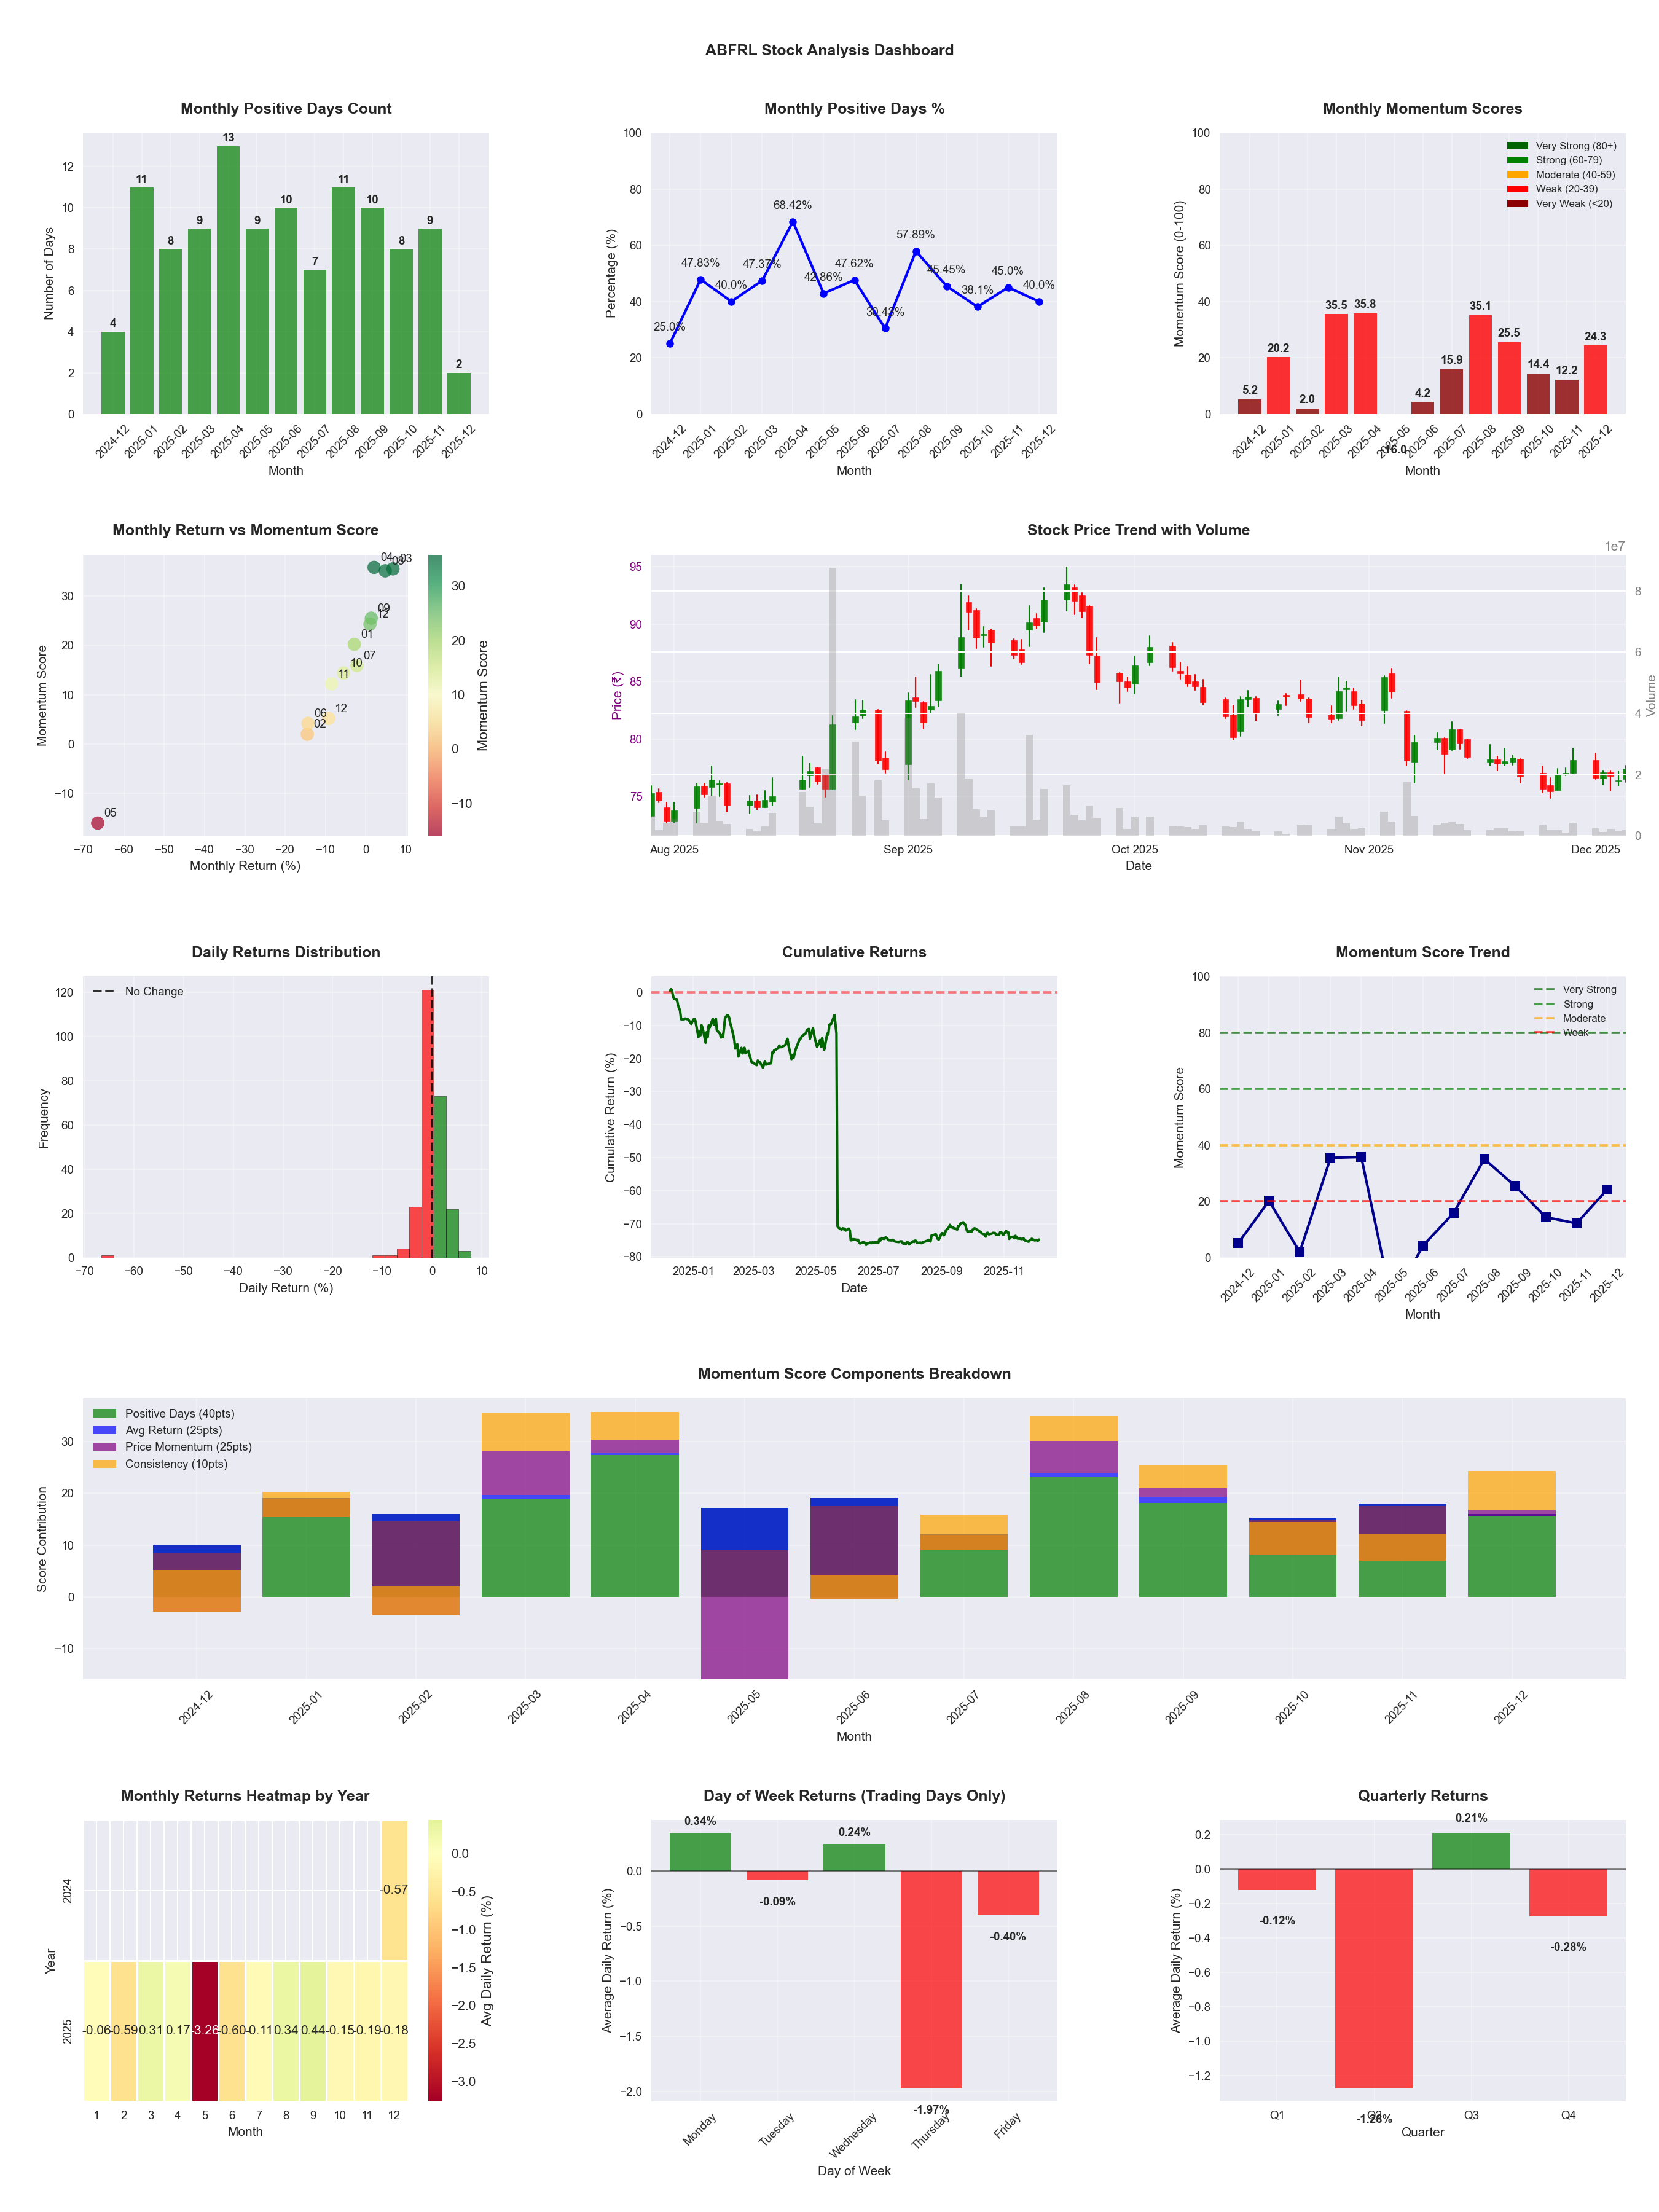
📈 ABFRL
Date
📅 2026-04-11
Volatility
🔴 4.90%
Risk Profile
⚠️ suitable for aggressive investors
Win Rate
⚠️ 43.5%
Avg Daily Return
📉 -0.38%
Max Drawdown
📉 -81.16%
IBD RS Score
📊 2.6
Weak
Market Rank
#480
Best Month
🏆 2025-04
Best Months to Trade
📅 Apr, Sep, Aug
Best Days to Trade
📅 Wednesday, Monday
📊 Key Insights & Metrics
Symbol
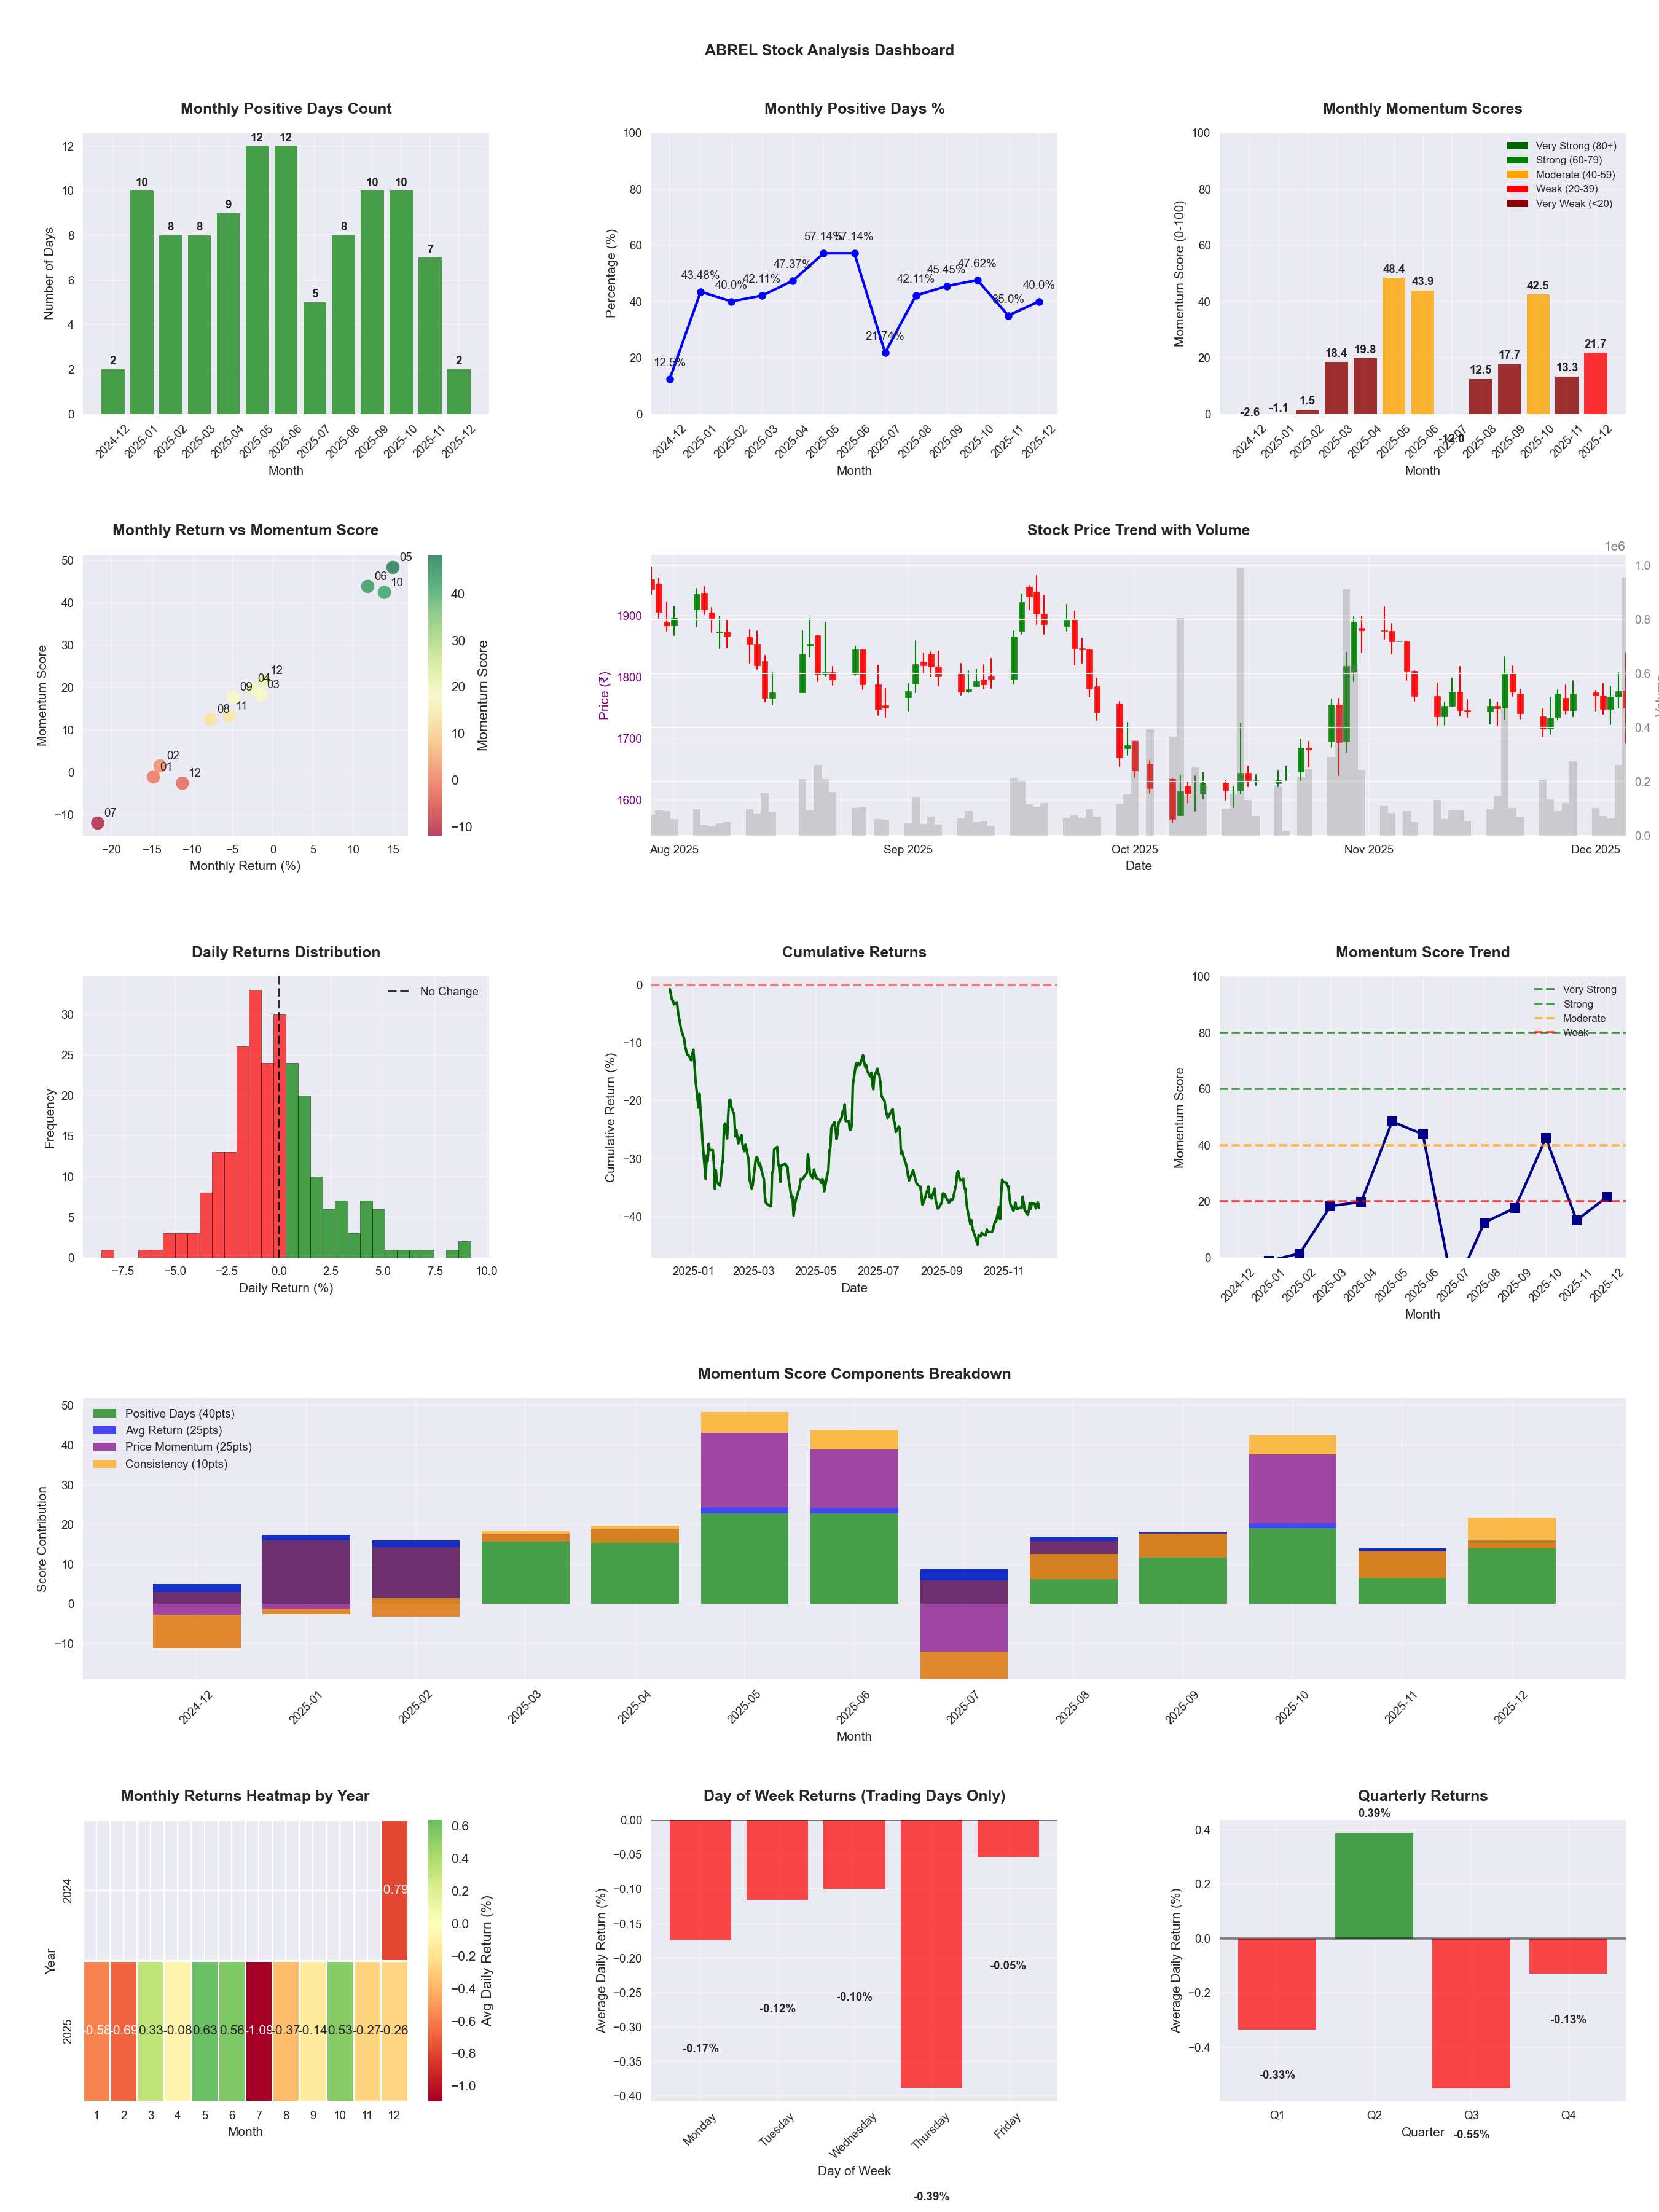
📈 ABREL
Date
📅 2026-04-11
Volatility
🟡 2.41%
Risk Profile
⚠️ suitable for aggressive investors
Win Rate
⚠️ 42.7%
Avg Daily Return
📉 -0.08%
Max Drawdown
📉 -56.20%
IBD RS Score
📊 10.3
Weak
Market Rank
#442
Best Month
🏆 2026-04
Best Months to Trade
📅 Apr, May, Jun
Best Days to Trade
📅 Wednesday, Monday
📊 Key Insights & Metrics
Symbol
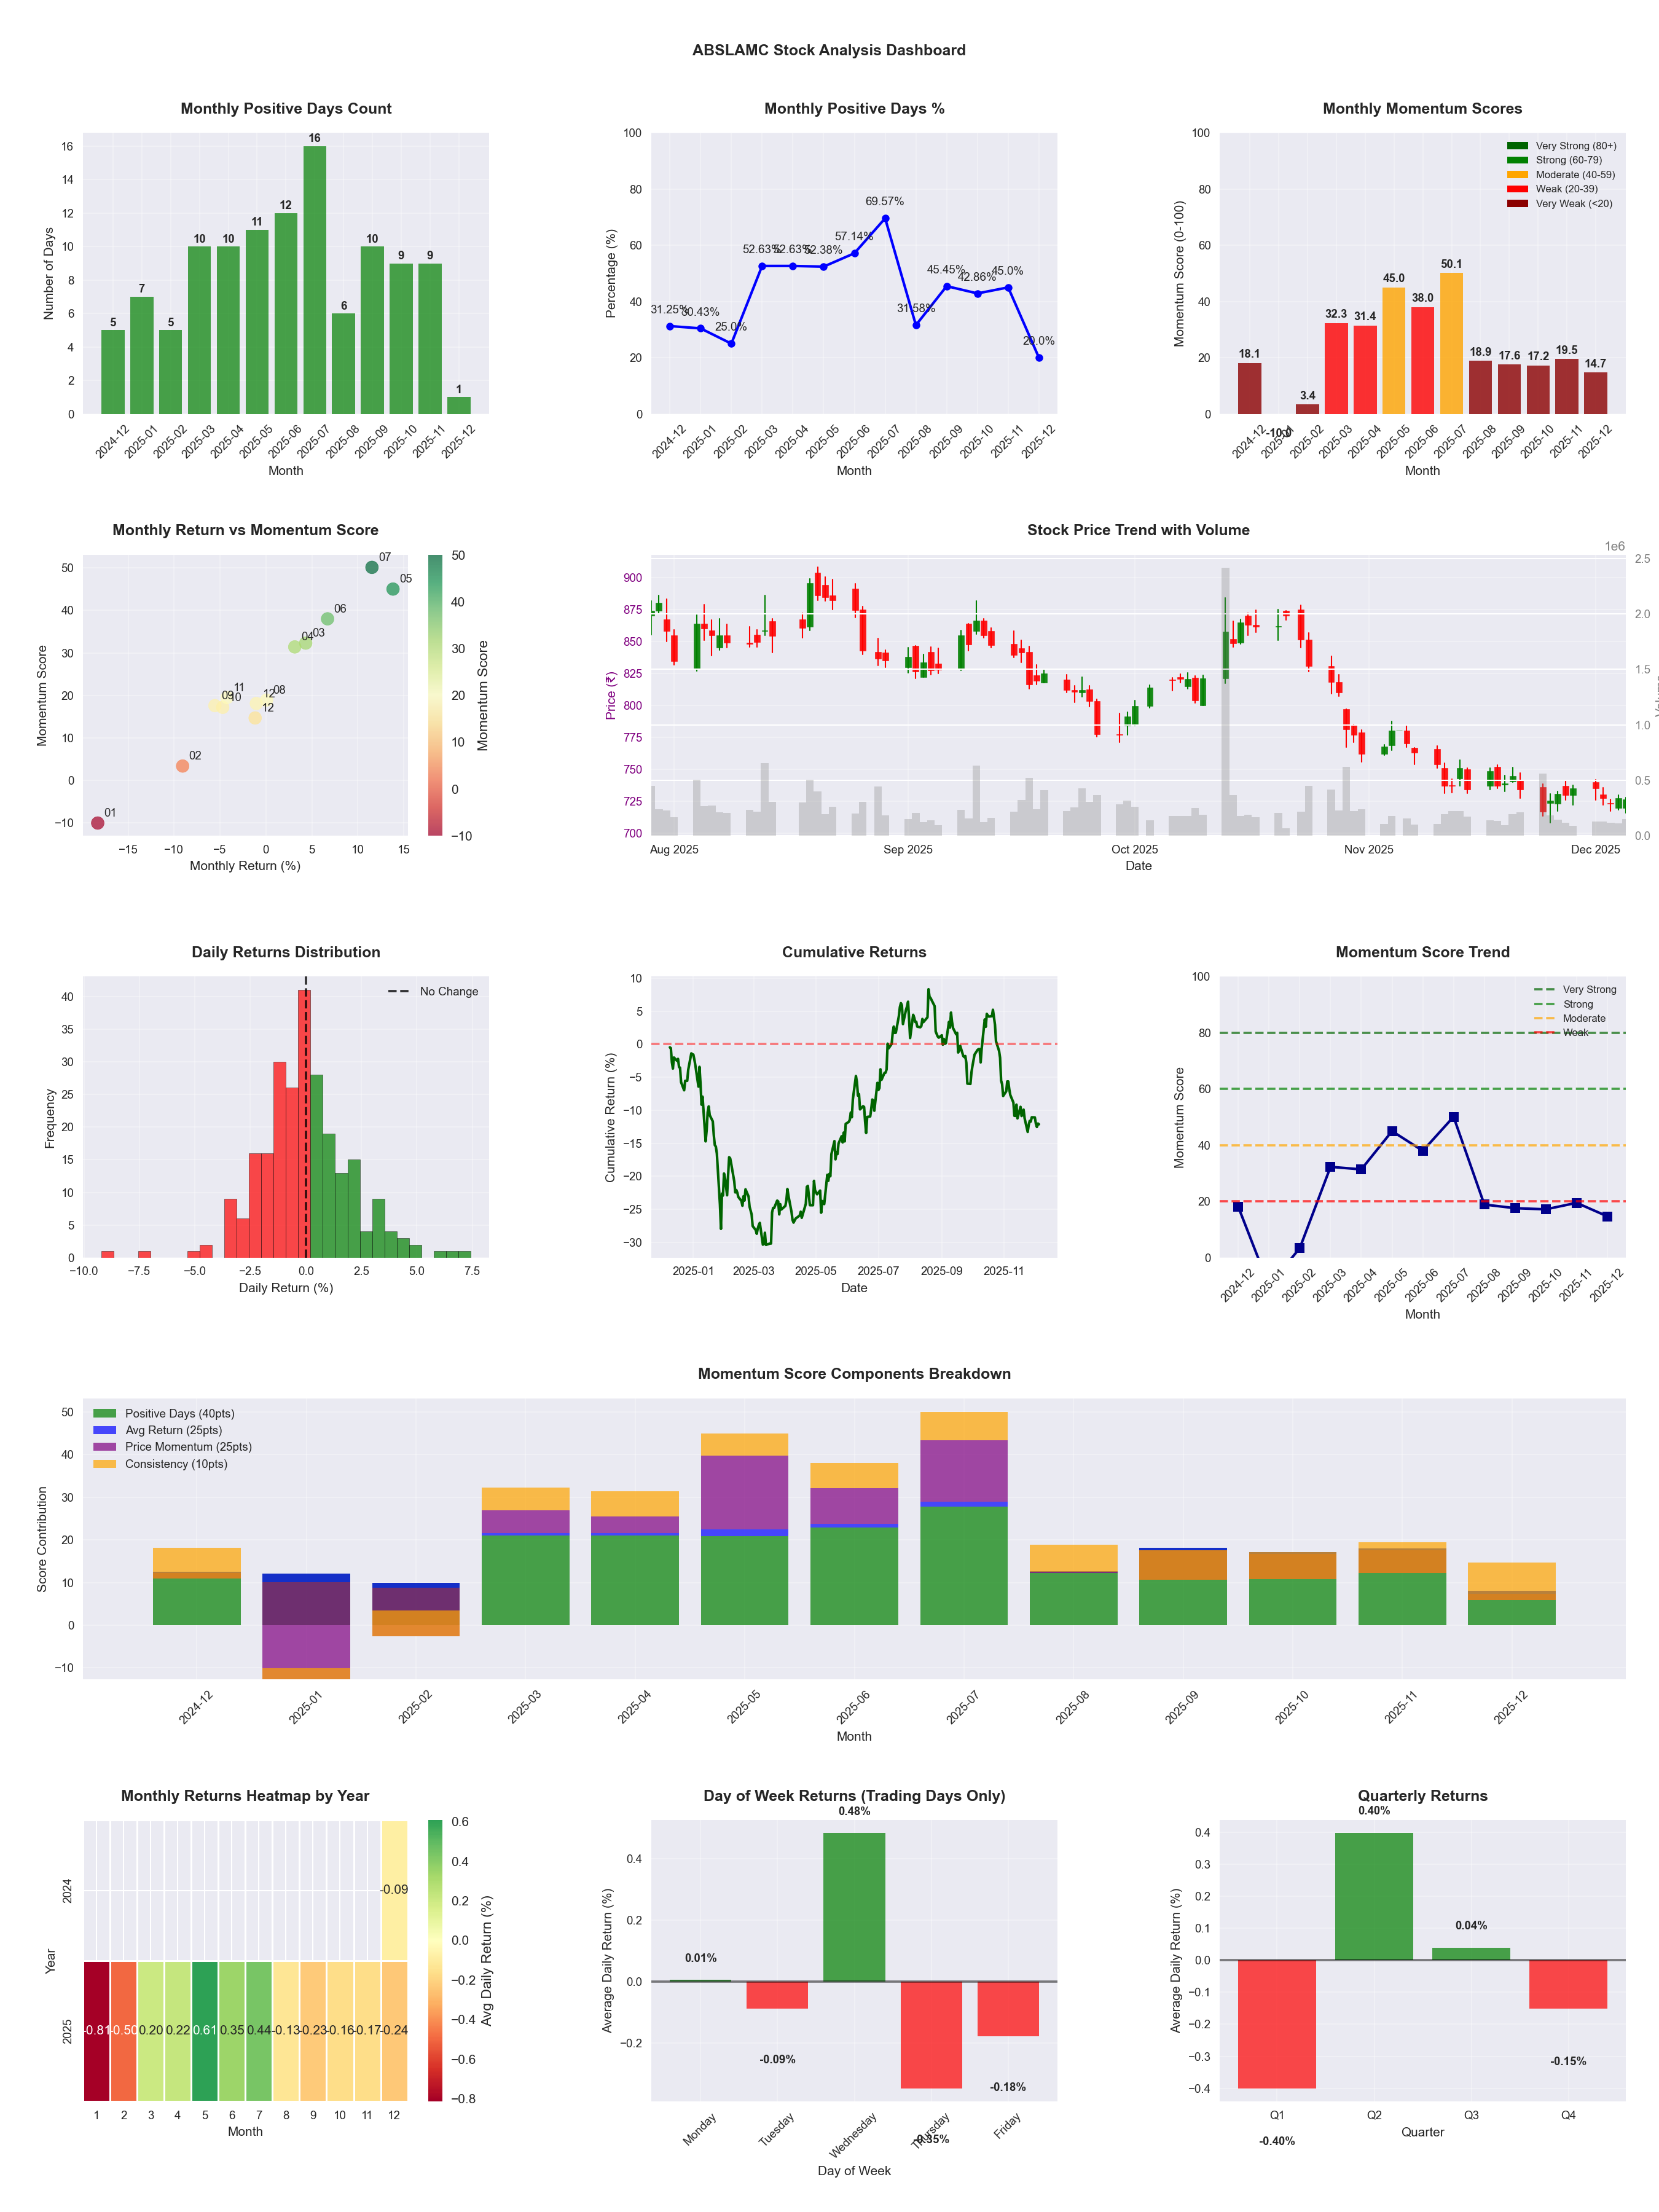
📈 ABSLAMC
Date
📅 2026-04-11
Volatility
🟡 2.18%
Risk Profile
⚠️ suitable for aggressive investors
Win Rate
⚠️ 51.6%
Avg Daily Return
📈 +0.22%
Max Drawdown
📉 -19.97%
IBD RS Score
📊 94.1
Leader
Market Rank
#29
Best Month
🏆 2026-02
Worst Month
📉 2026-01
Best Months to Trade
📅 Apr, Feb, May
Best Days to Trade
📅 Monday, Tuesday
📊 Key Insights & Metrics
Symbol
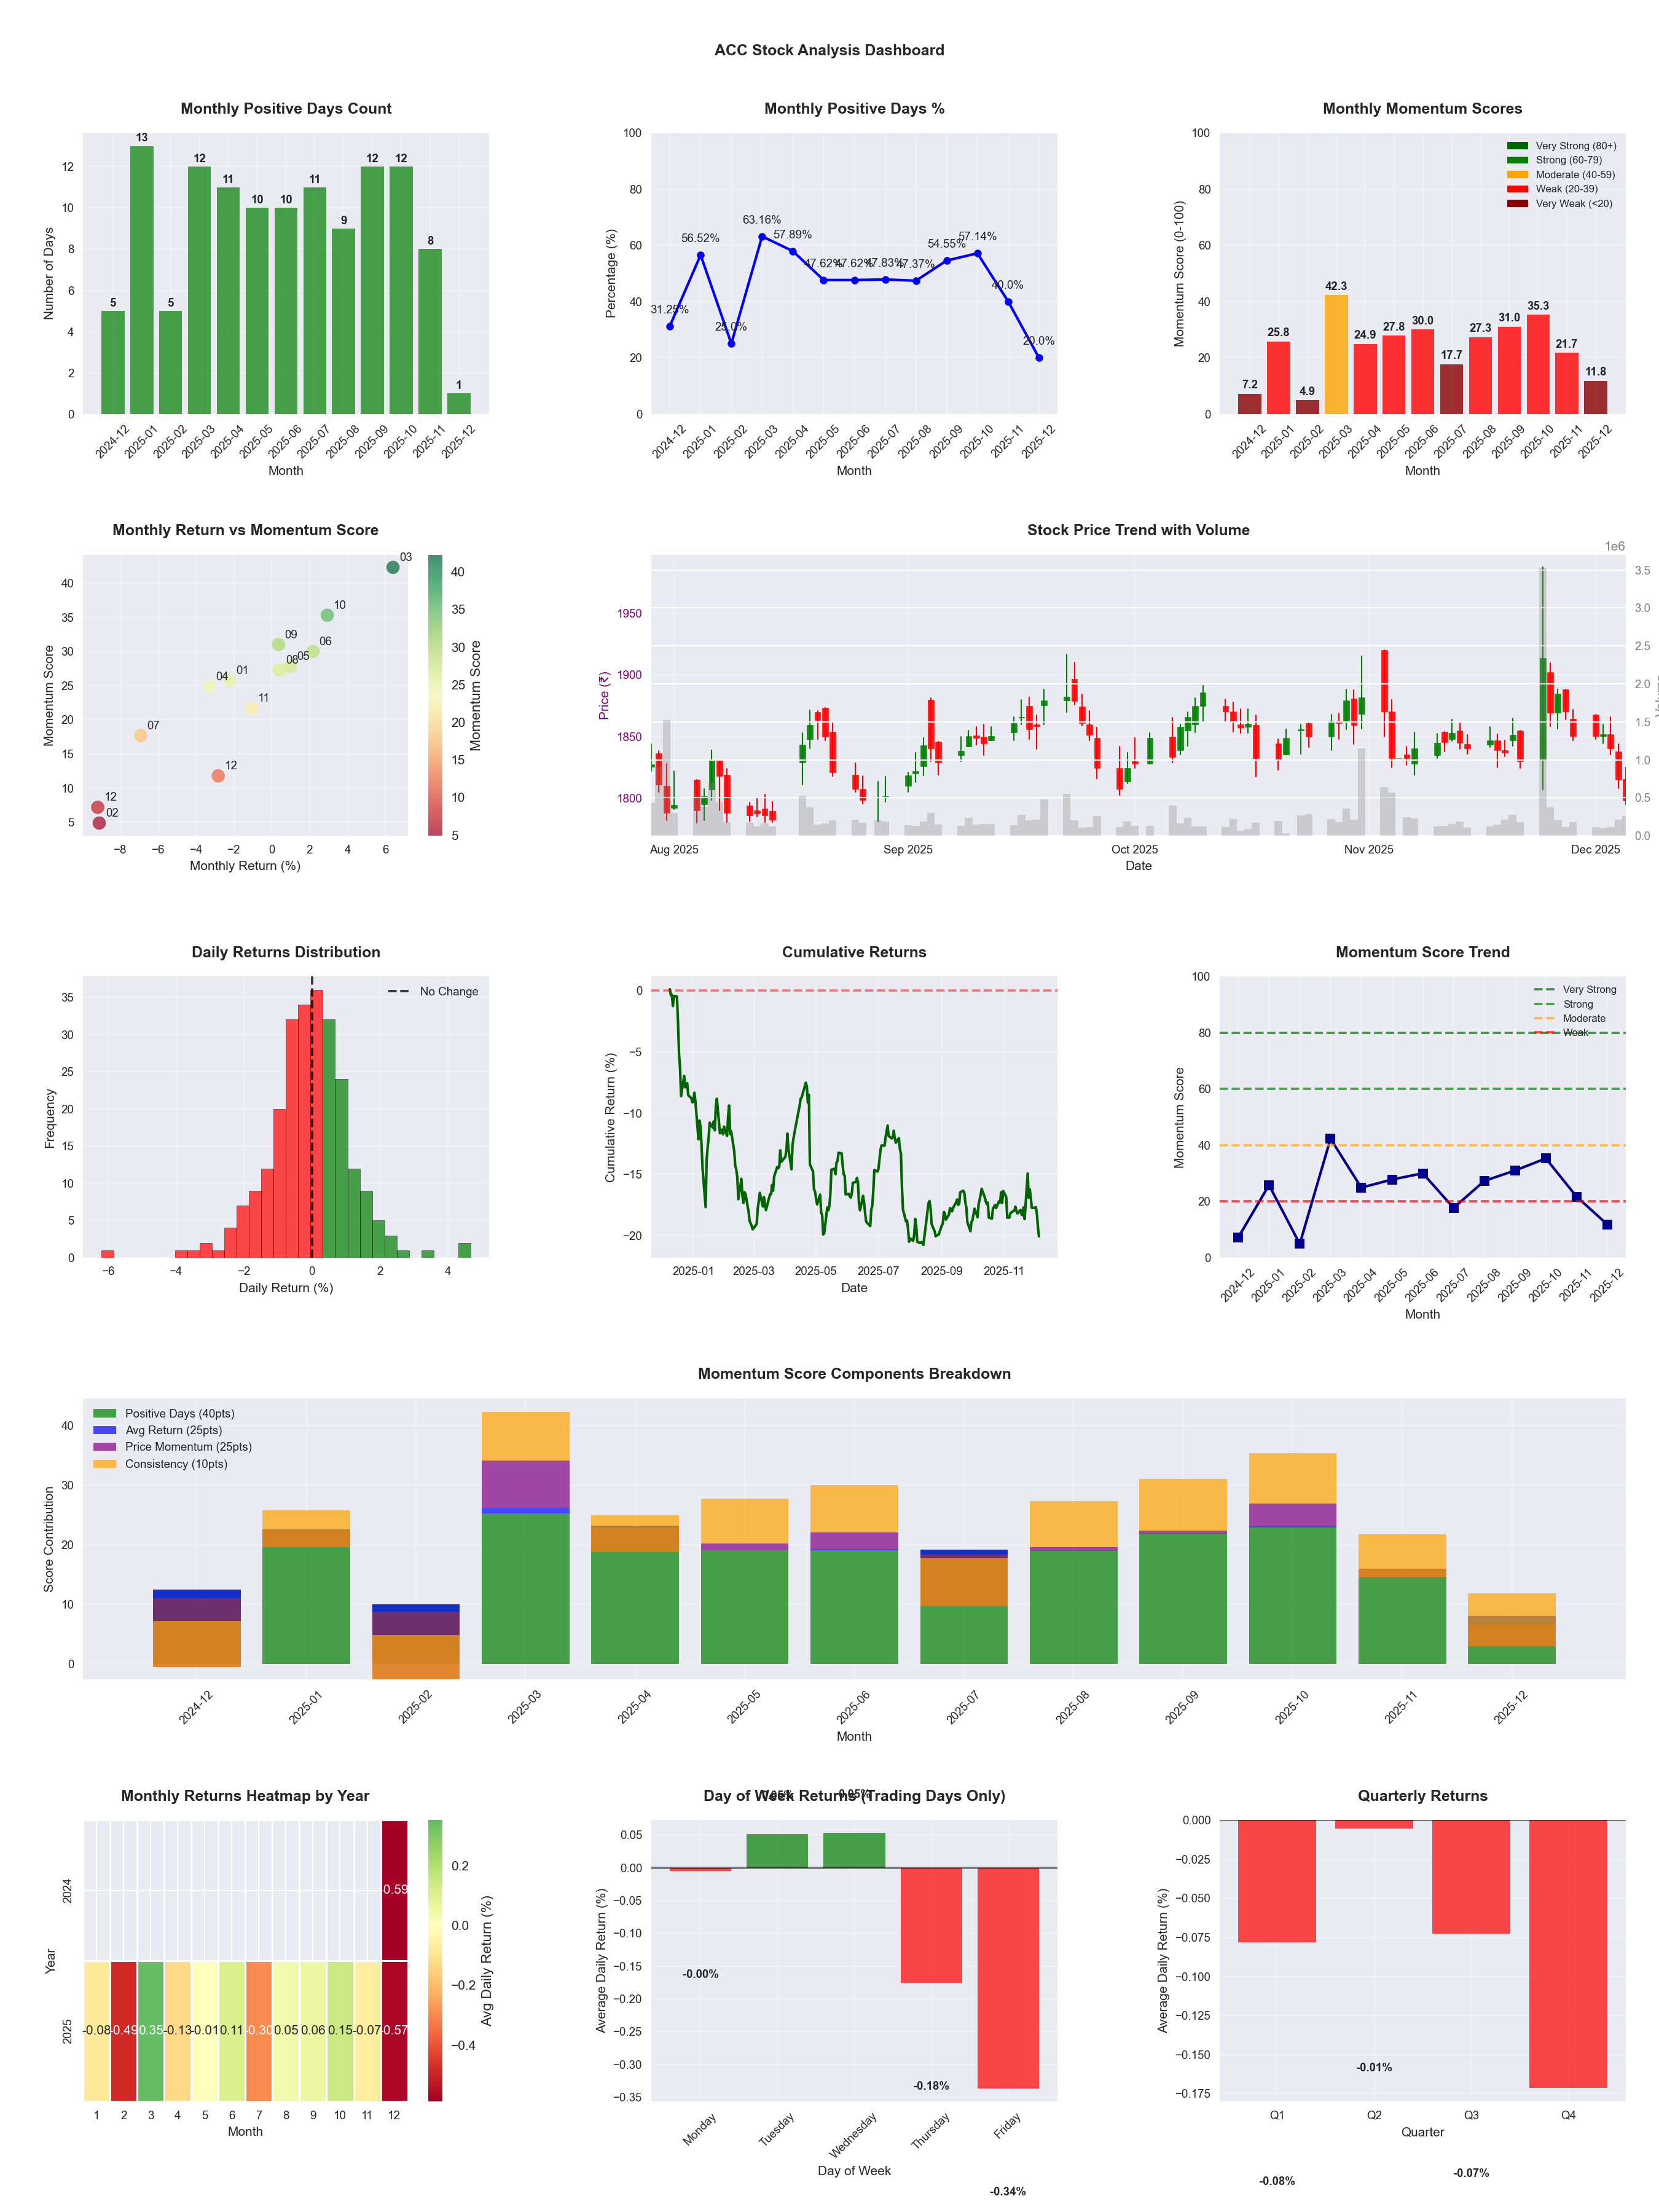
📈 ACC
Date
📅 2026-04-11
Volatility
🟢 1.40%
Win Rate
⚠️ 45.5%
Avg Daily Return
📉 -0.13%
Max Drawdown
📉 -39.68%
IBD RS Score
📊 9.9
Weak
Market Rank
#444
Best Month
🏆 2026-04
Best Months to Trade
📅 Apr, Oct, Jun
Best Days to Trade
📅 Wednesday, Monday
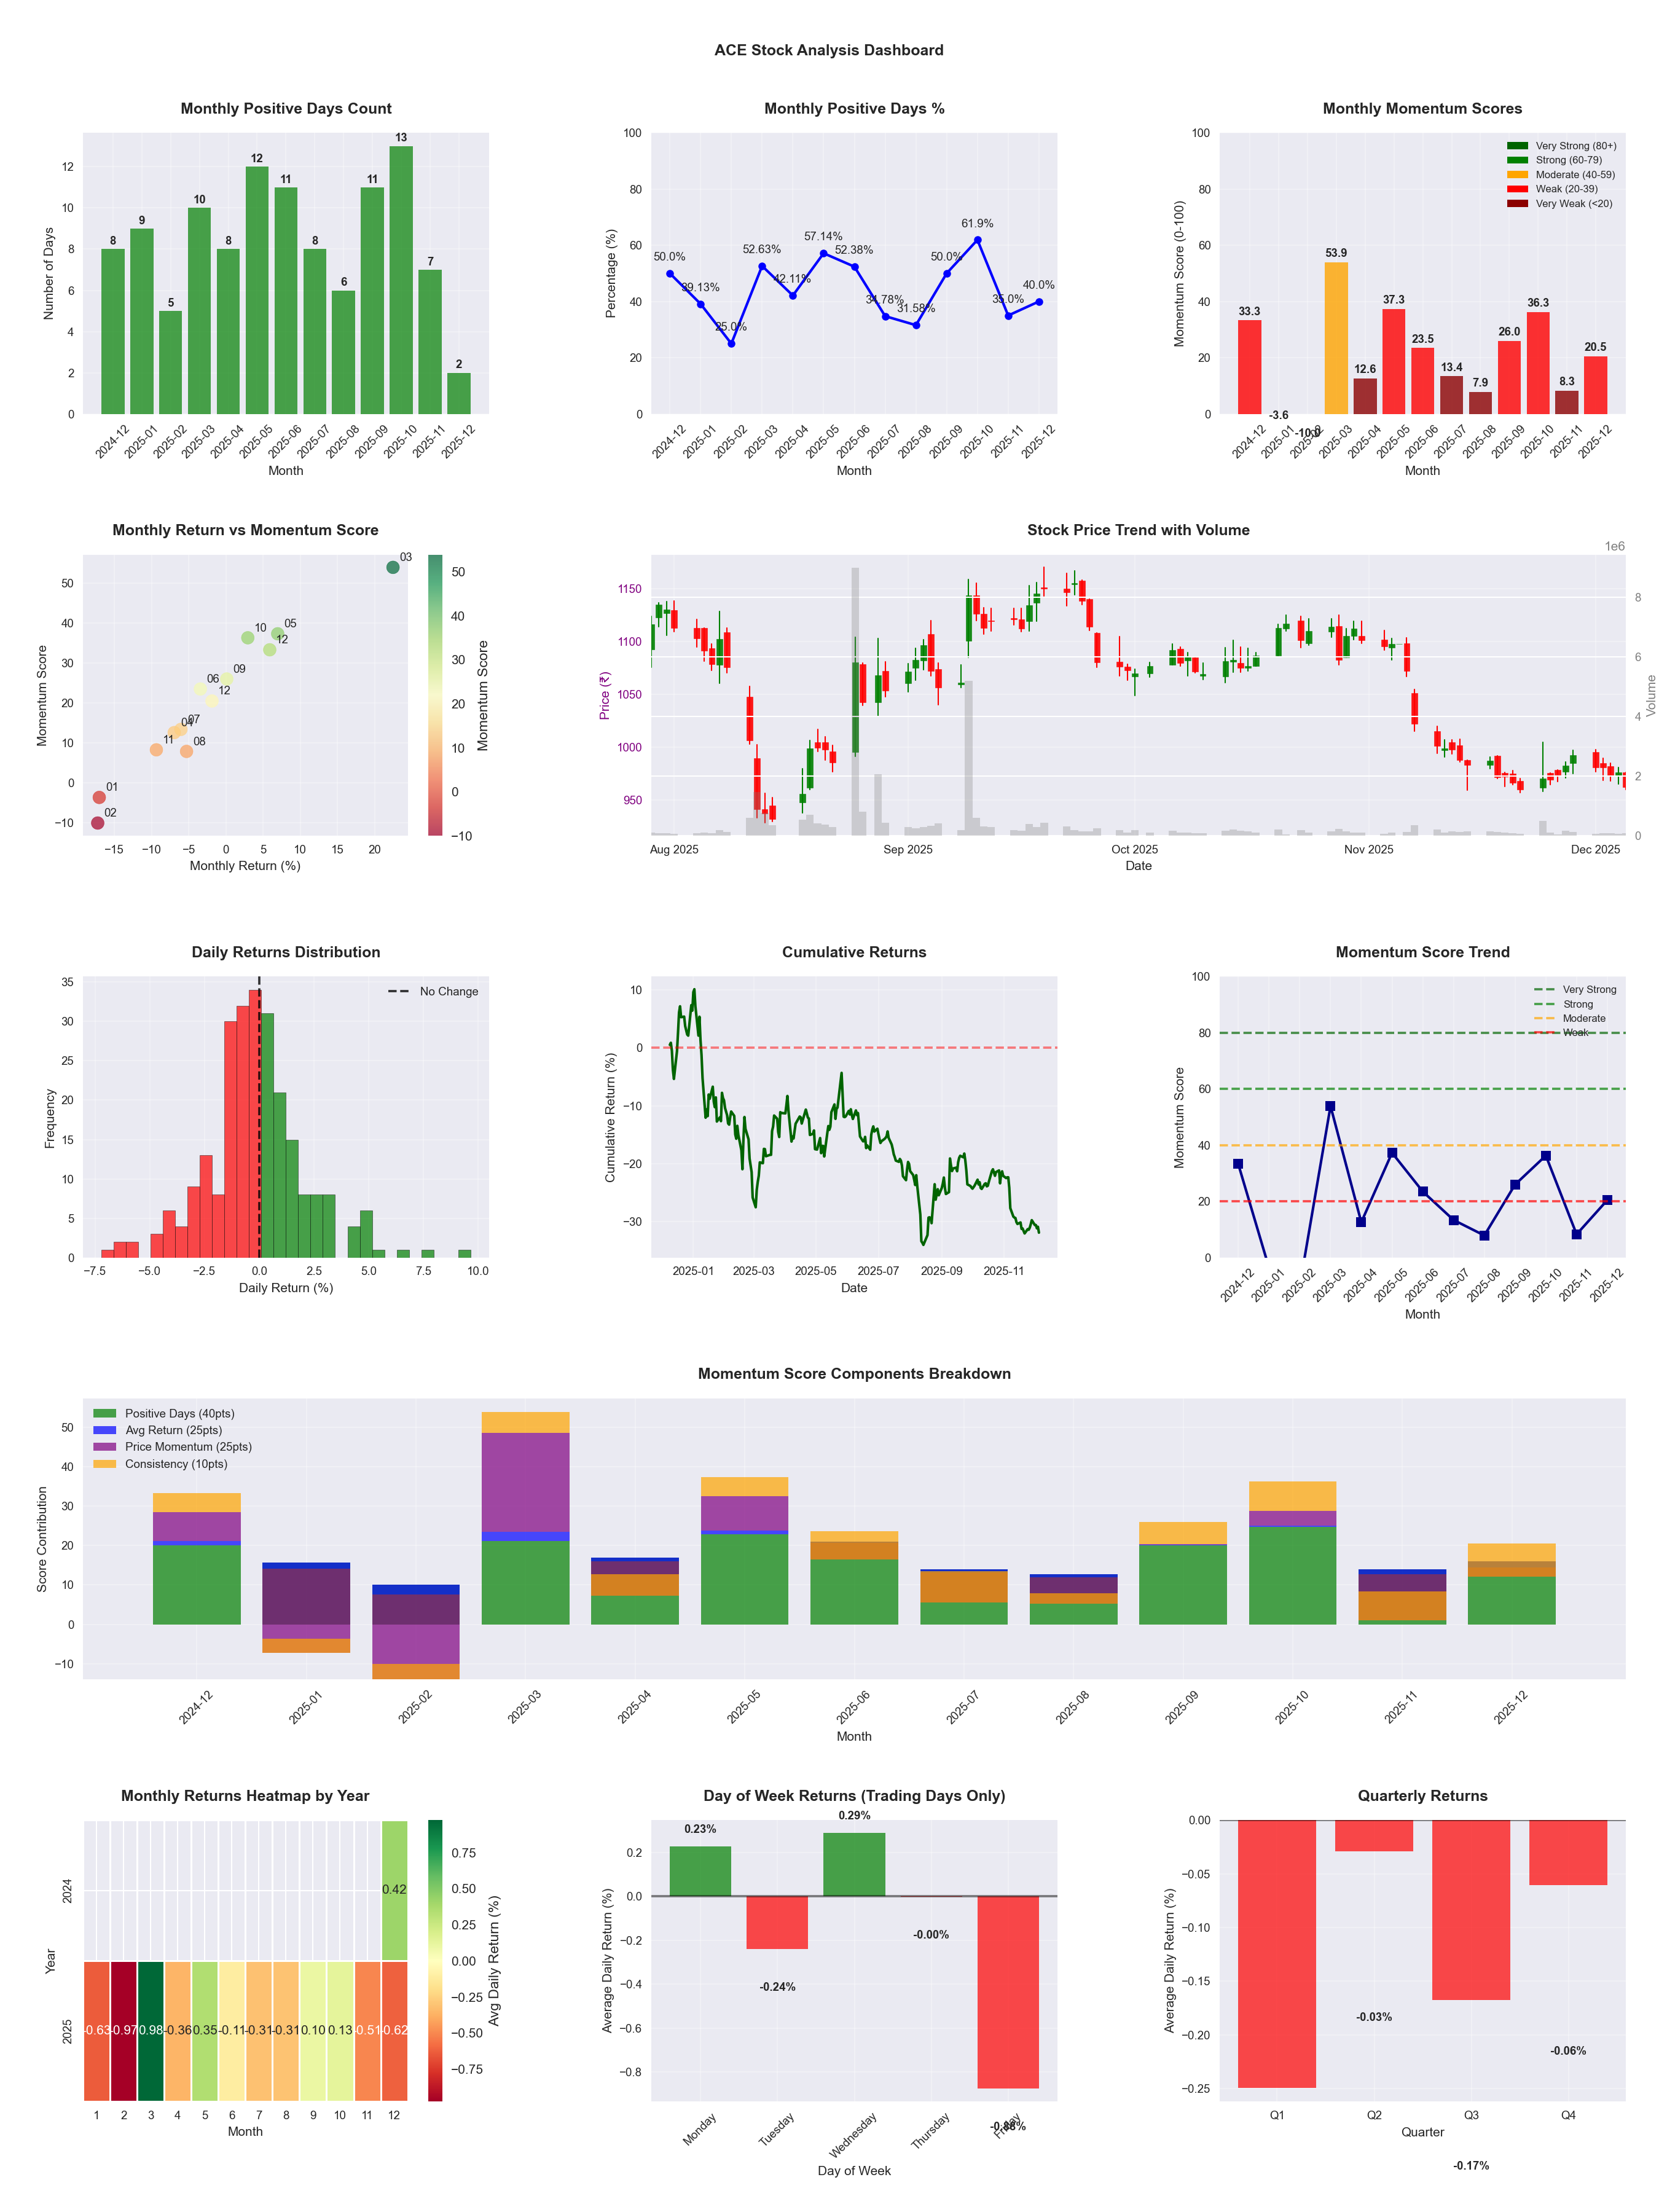
📊 Key Insights & Metrics
Symbol
📈 ACE
Date
📅 2026-04-11
Volatility
🟡 2.15%
Risk Profile
⚠️ suitable for aggressive investors
Win Rate
⚠️ 45.9%
Avg Daily Return
📉 -0.10%
Max Drawdown
📉 -44.62%
IBD RS Score
📊 31.0
Weak
Market Rank
#340
Best Month
🏆 2026-04
Worst Month
📉 2026-03
Best Months to Trade
📅 Apr, May, Feb
Best Days to Trade
📅 Monday, Wednesday
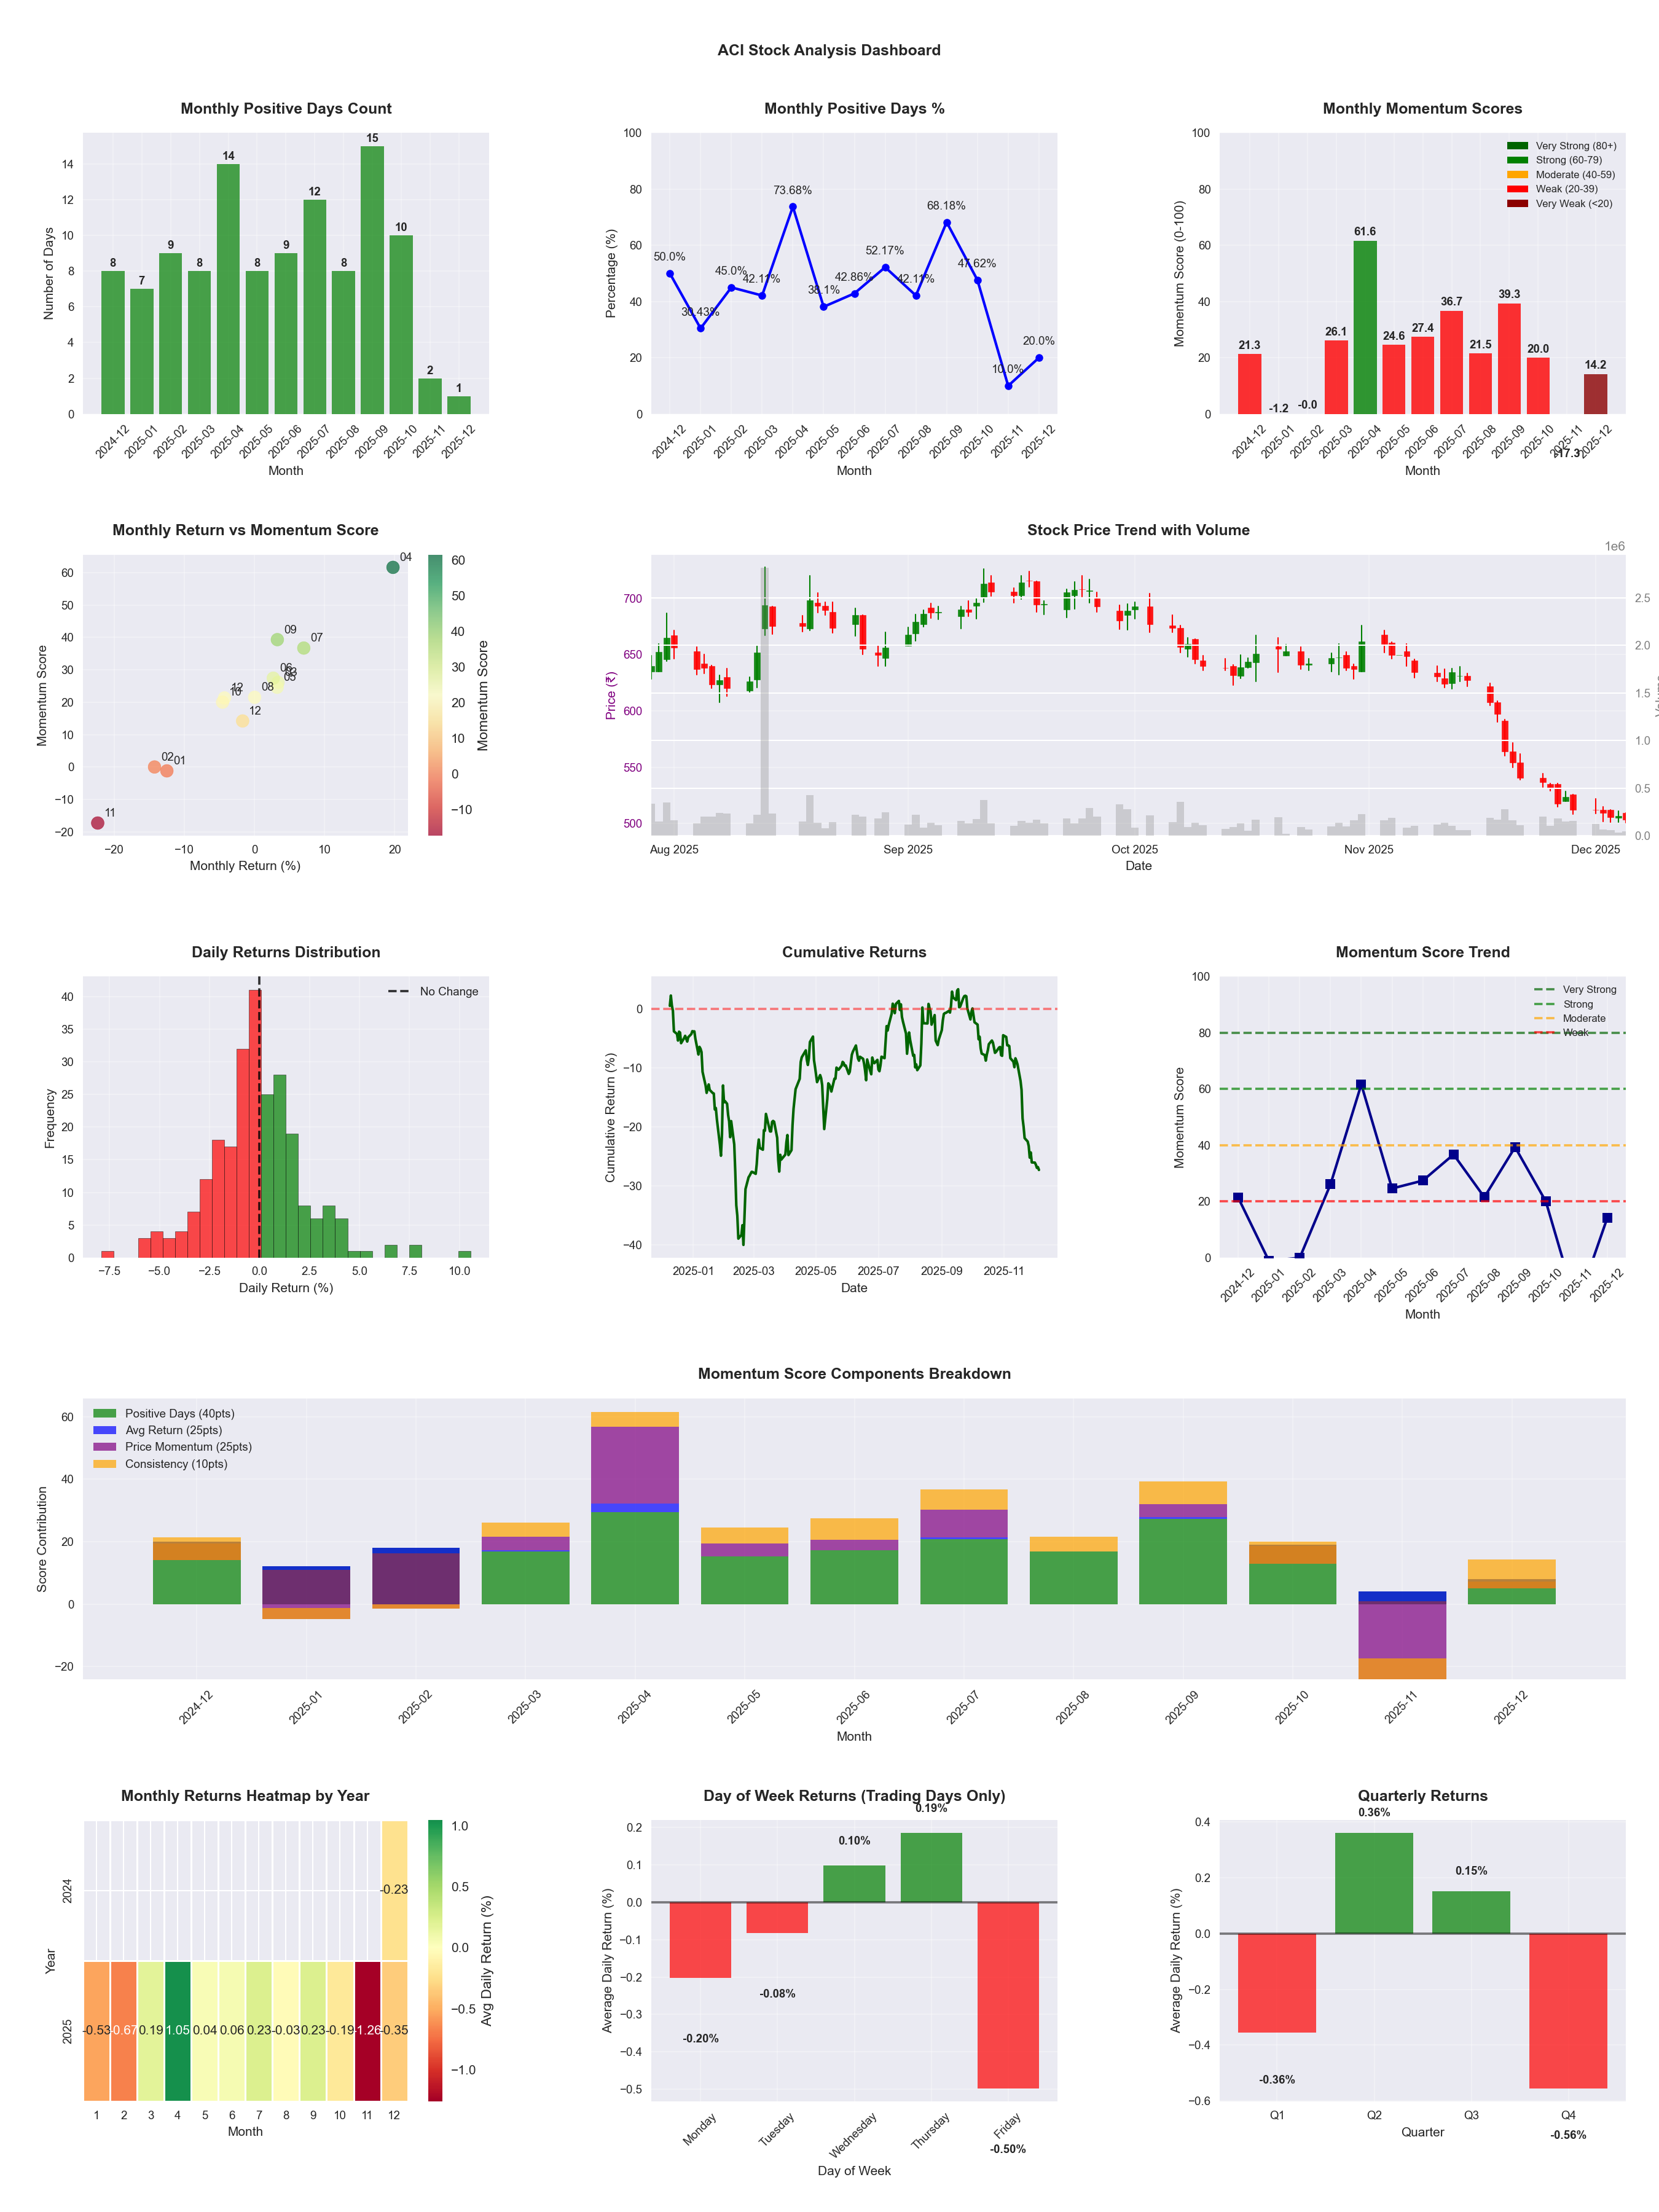
📊 Key Insights & Metrics
Symbol
📈 ACI
Date
📅 2026-03-21
Volatility
🟡 2.13%
Risk Profile
⚠️ suitable for aggressive investors
Win Rate
⚠️ 48.0%
Avg Daily Return
📈 +0.05%
Max Drawdown
📉 -31.60%
Best Month
🏆 2025-04
Best Months to Trade
📅 Apr, Dec, Sep
Best Days to Trade
📅 Wednesday, Friday
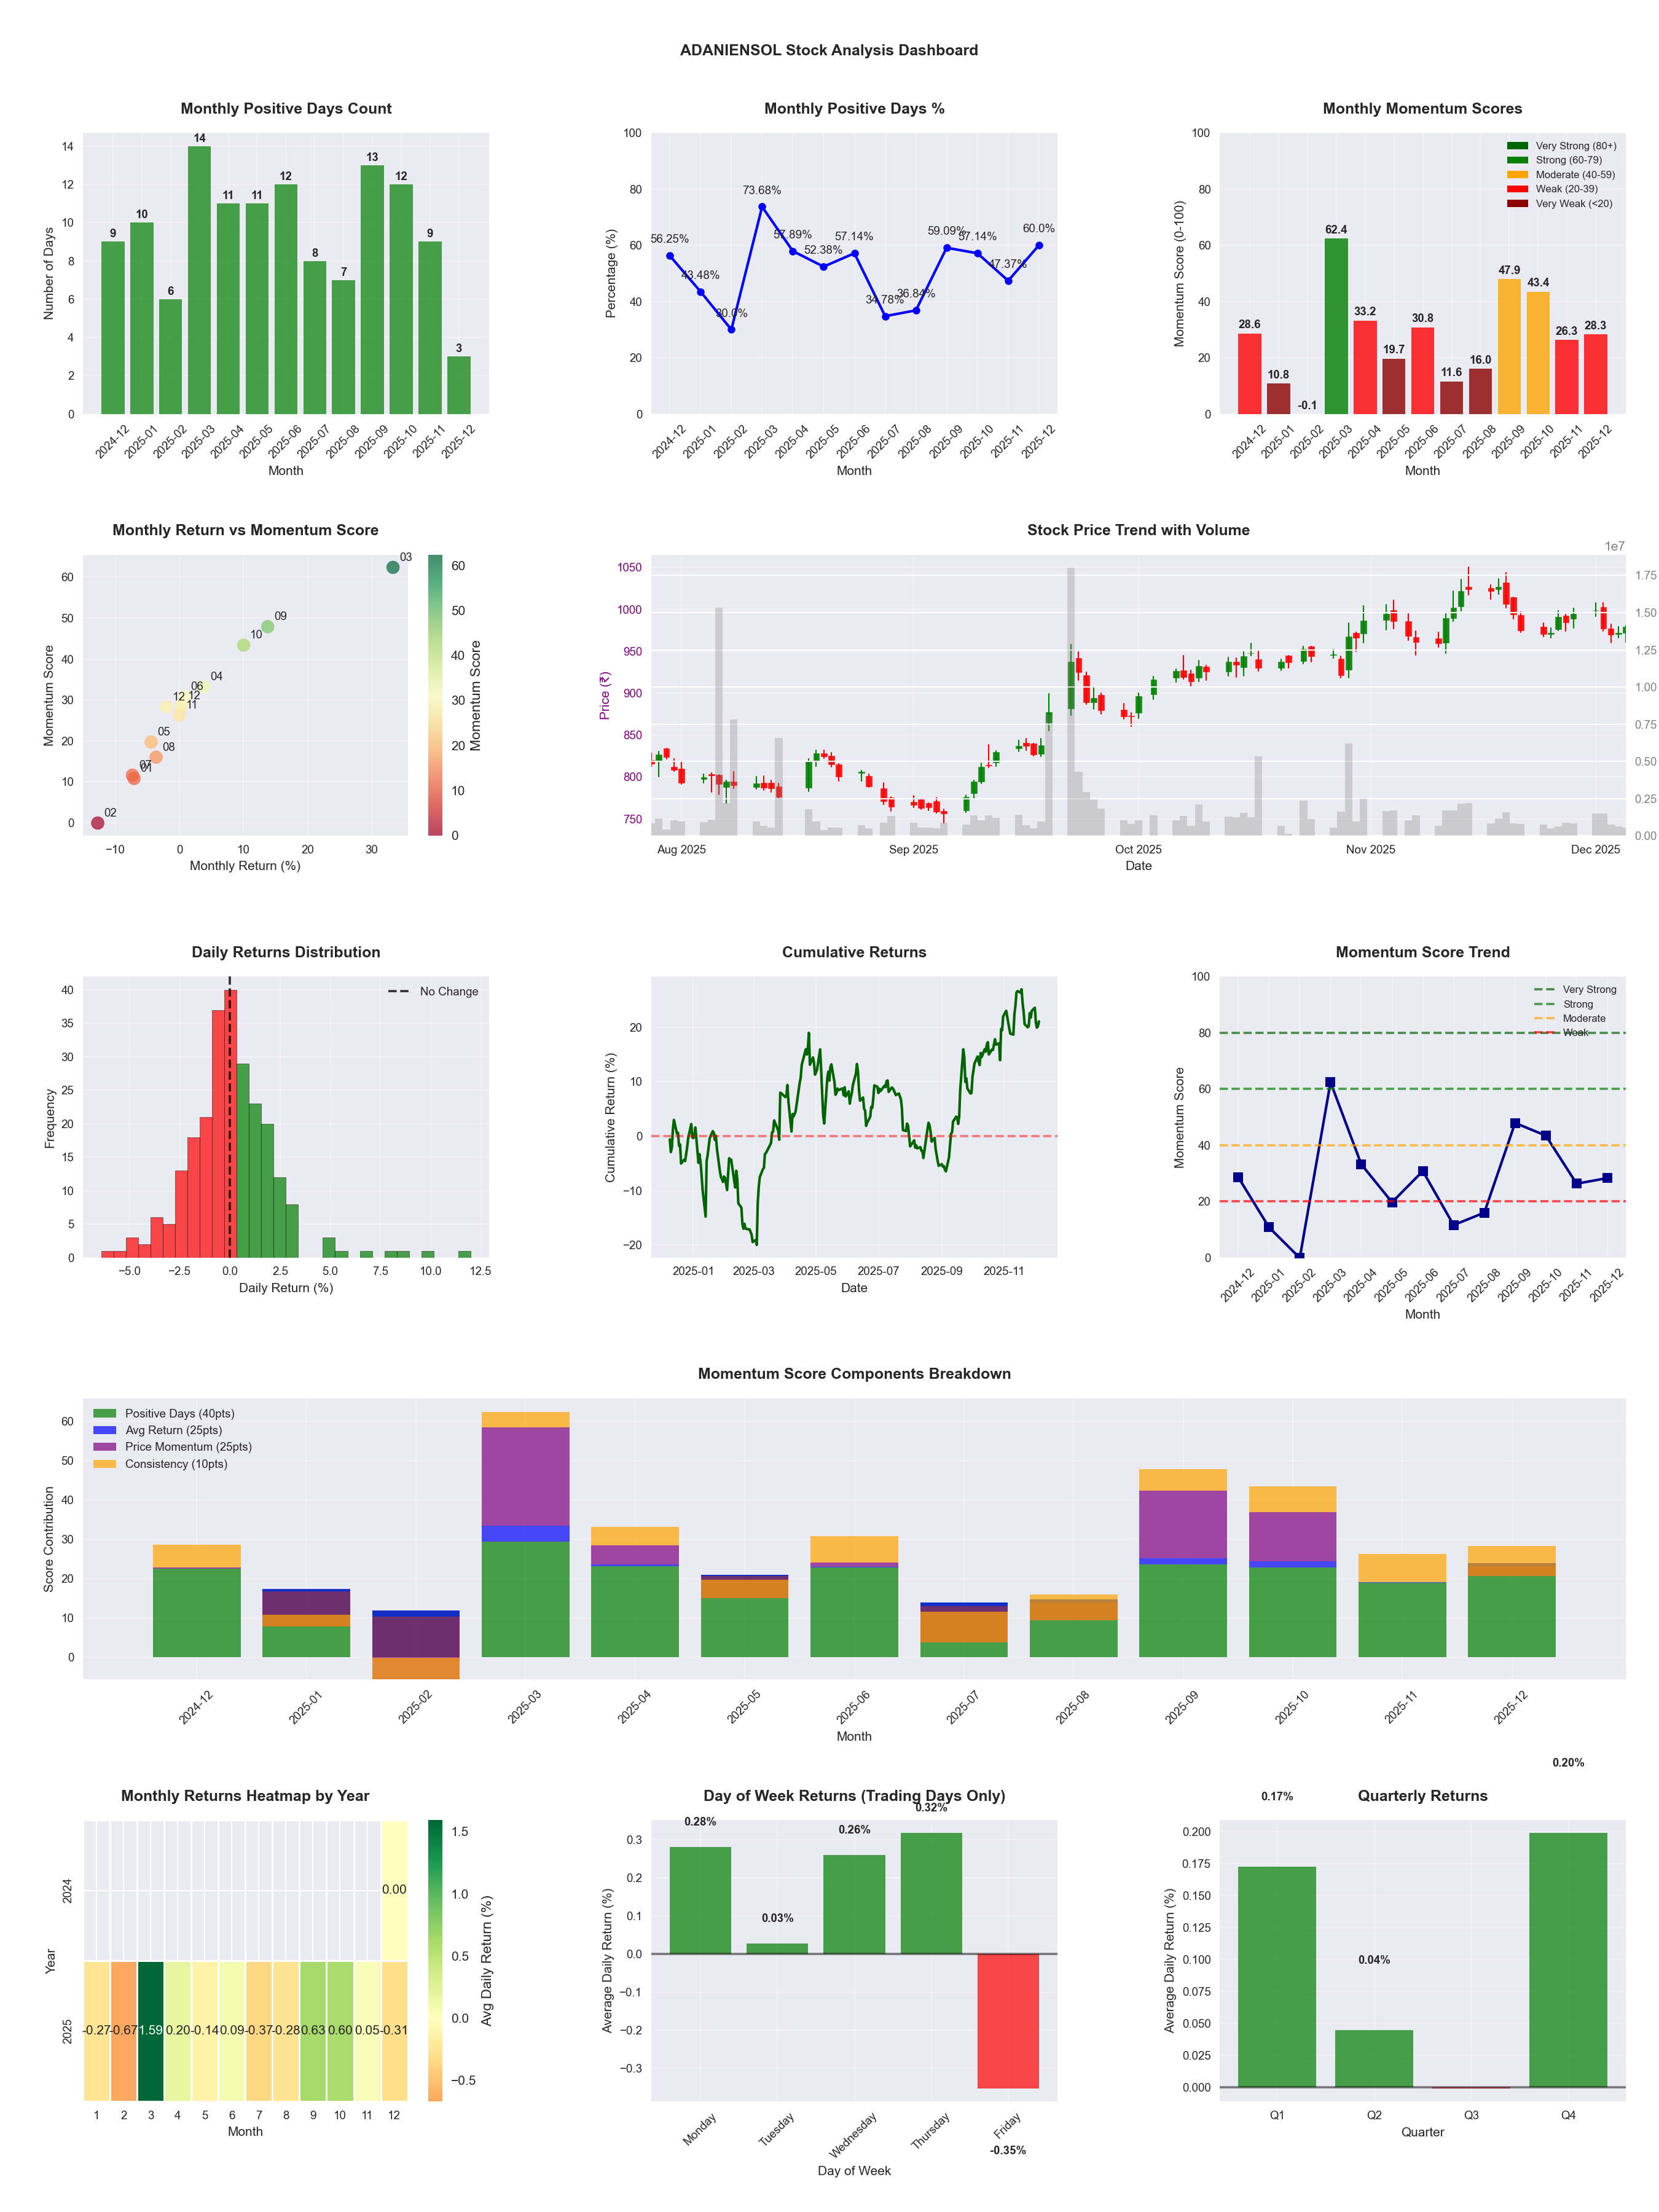
📊 Key Insights & Metrics
Symbol
📈 ADANIENSOL
Date
📅 2026-04-11
Volatility
🟡 2.35%
Risk Profile
⚠️ suitable for aggressive investors
Win Rate
⚠️ 51.8%
Avg Daily Return
📈 +0.16%
Max Drawdown
📉 -23.18%
IBD RS Score
📊 91.3
Leader
Market Rank
#43
Best Month
🏆 2026-04
Best Months to Trade
📅 Apr, Feb, Sep
Best Days to Trade
📅 Monday, Wednesday
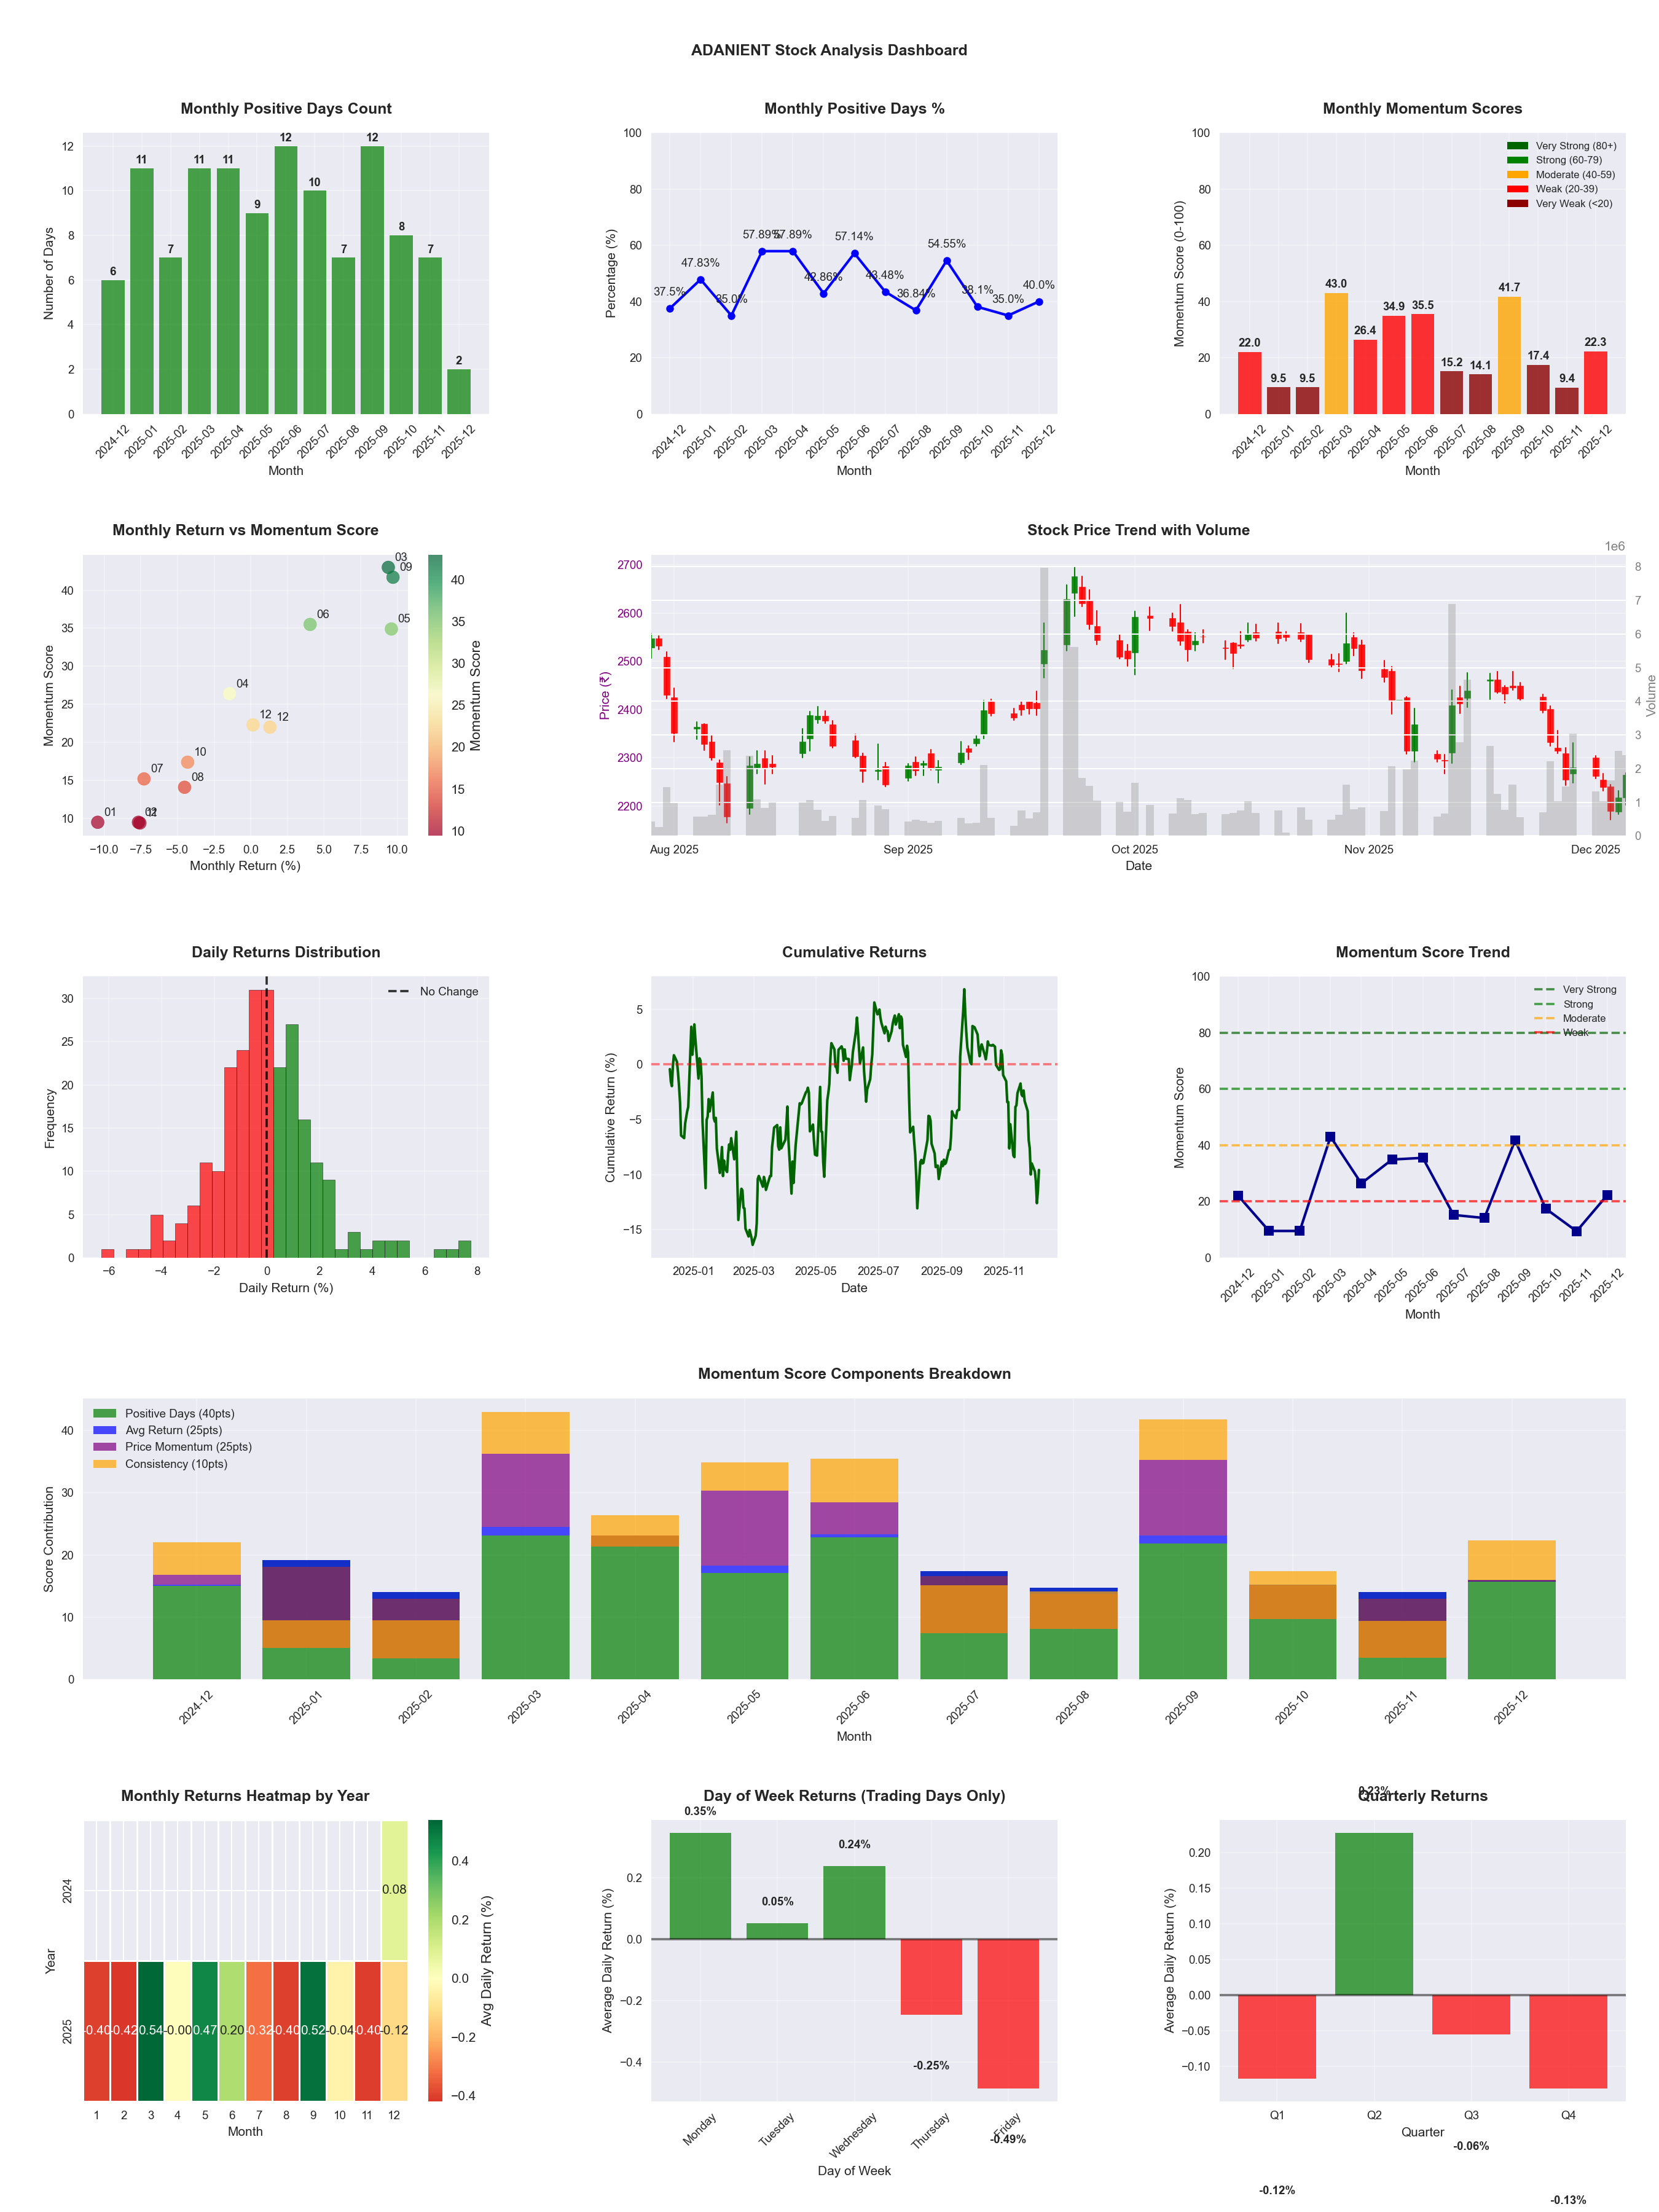
📊 Key Insights & Metrics
Symbol
📈 ADANIENT
Date
📅 2026-04-11
Volatility
🟡 2.14%
Risk Profile
⚠️ suitable for aggressive investors
Win Rate
⚠️ 44.7%
Avg Daily Return
📉 -0.02%
Max Drawdown
📉 -34.28%
IBD RS Score
📊 34.7
Weak
Market Rank
#322
Best Month
🏆 2026-04
Best Months to Trade
📅 Apr, Sep, May
Best Days to Trade
📅 Wednesday, Monday
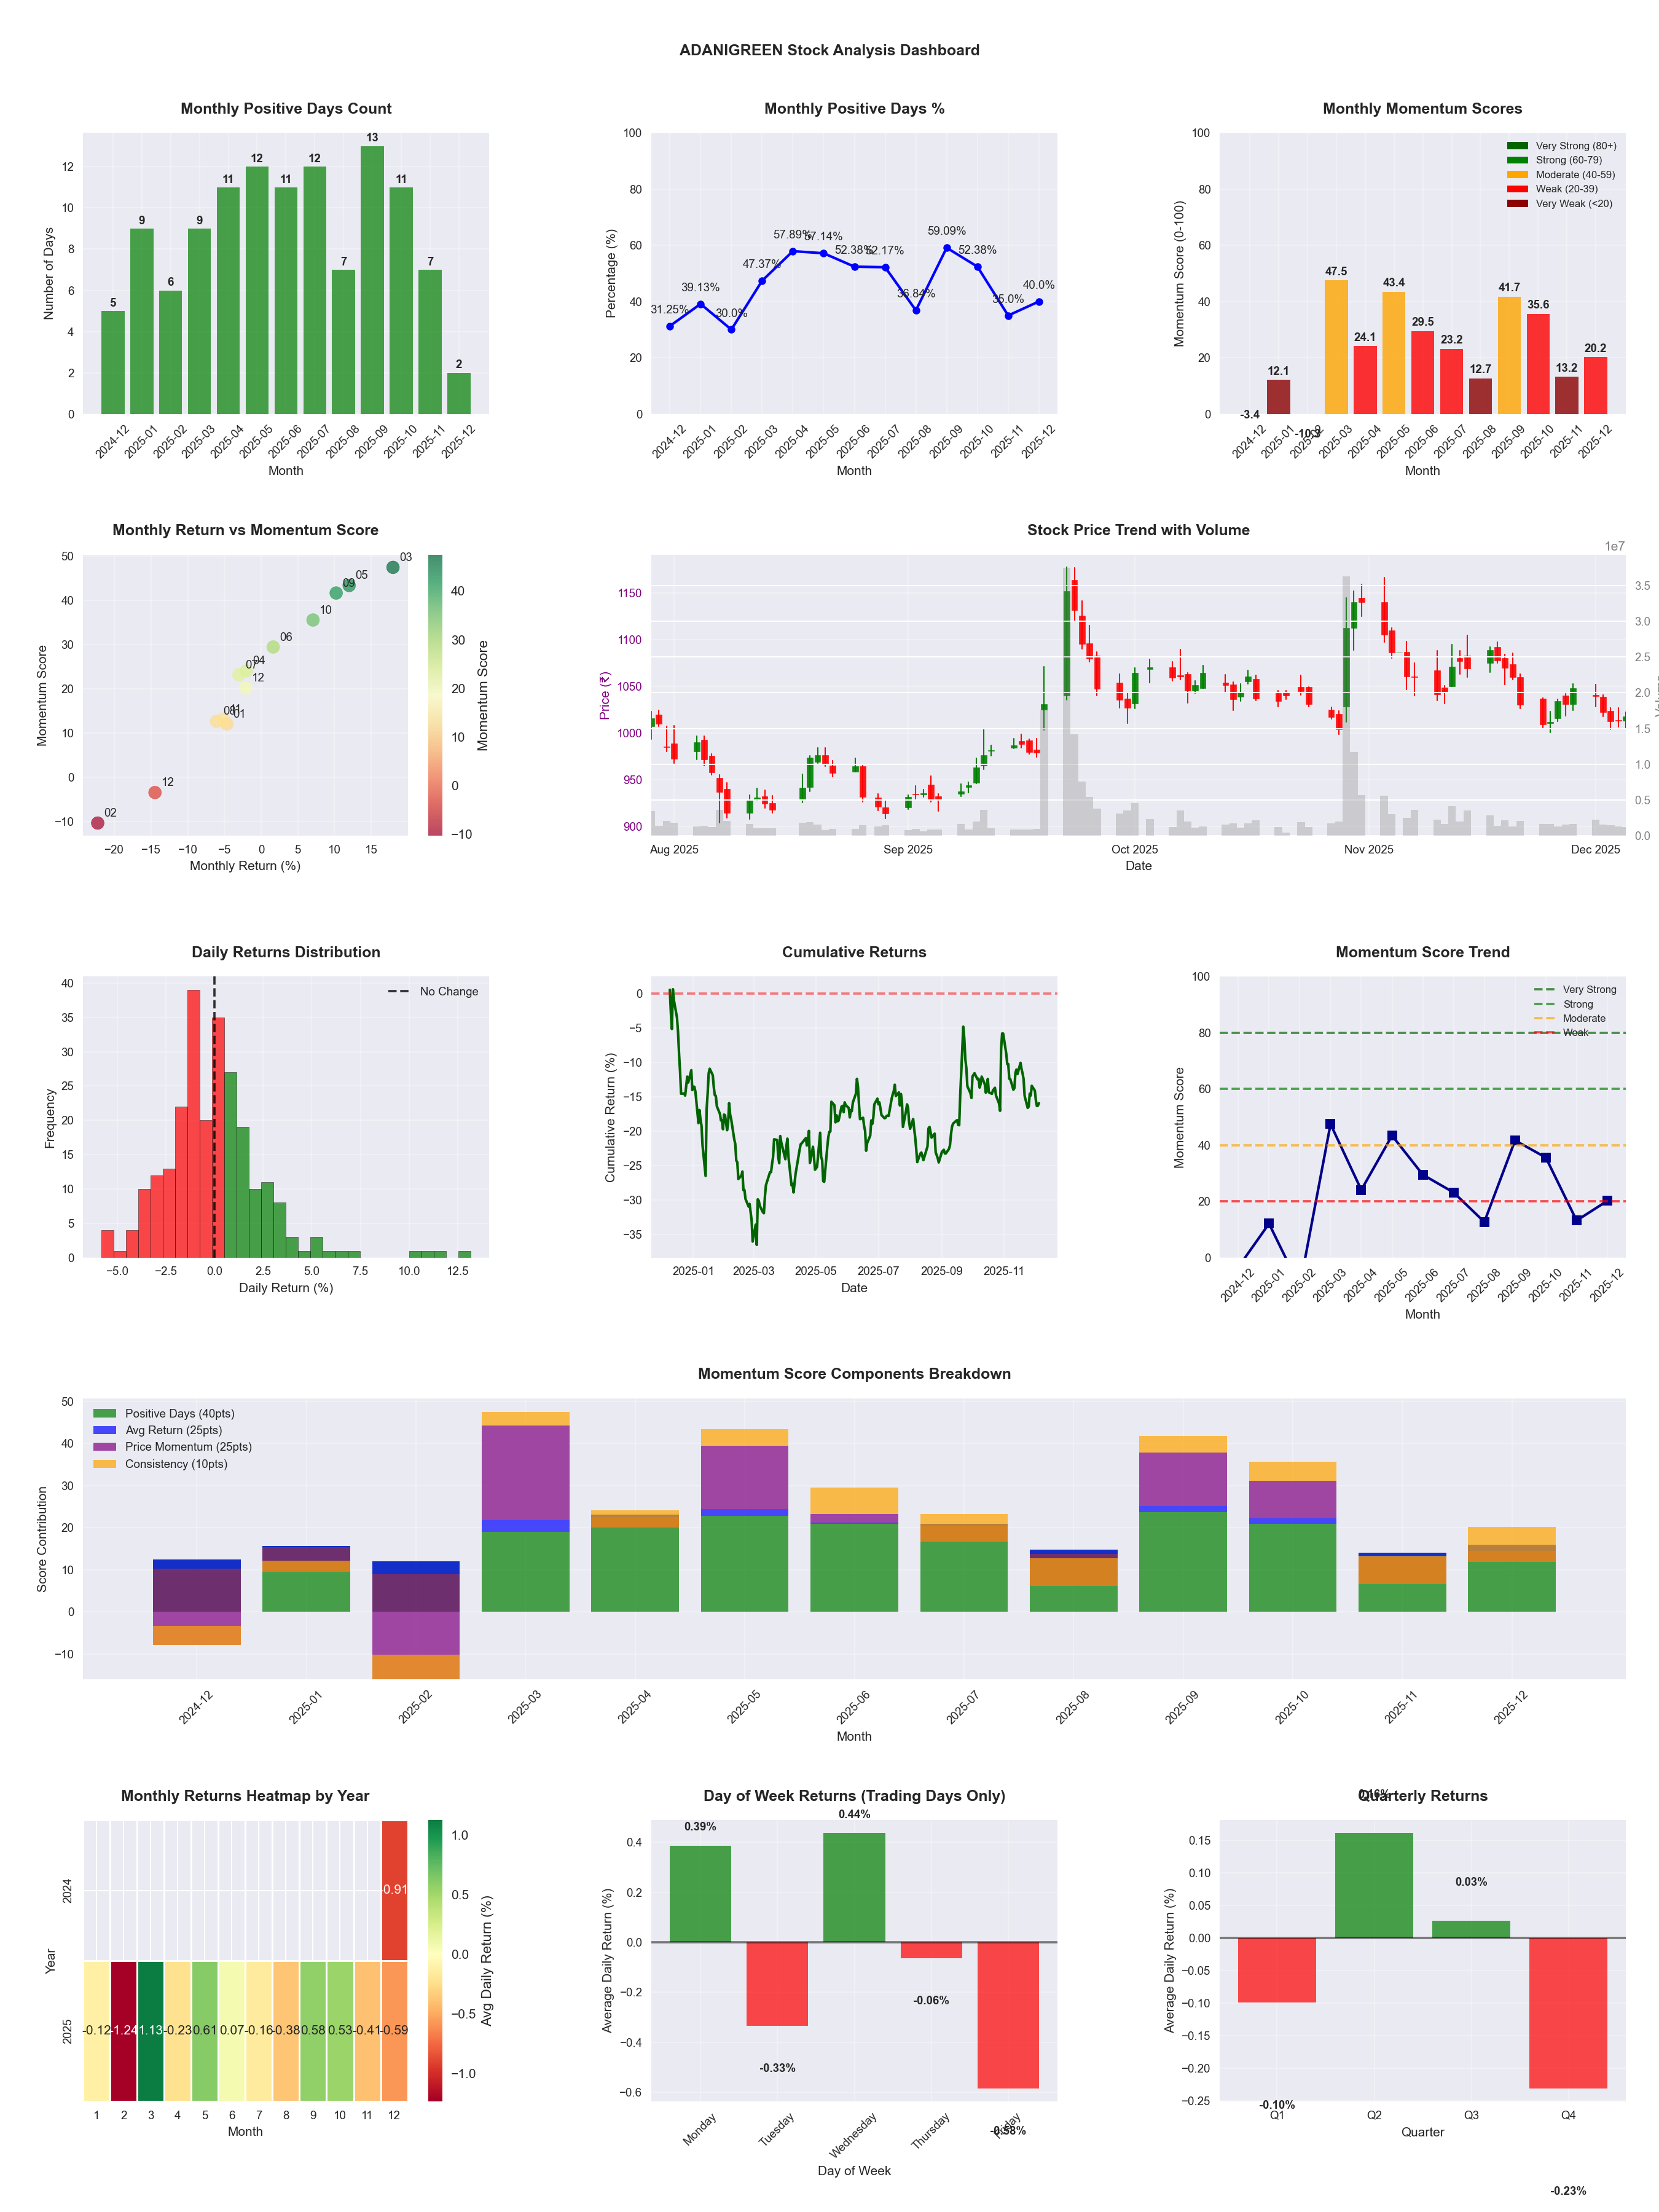
📊 Key Insights & Metrics
Symbol
📈 ADANIGREEN
Date
📅 2026-04-11
Volatility
🟡 2.69%
Risk Profile
⚠️ suitable for aggressive investors
Win Rate
⚠️ 50.4%
Avg Daily Return
📈 +0.11%
Max Drawdown
📉 -32.93%
IBD RS Score
📊 77.7
Strong
Market Rank
#110
Best Month
🏆 2026-04
Best Months to Trade
📅 Apr, May, Sep
Best Days to Trade
📅 Wednesday, Monday
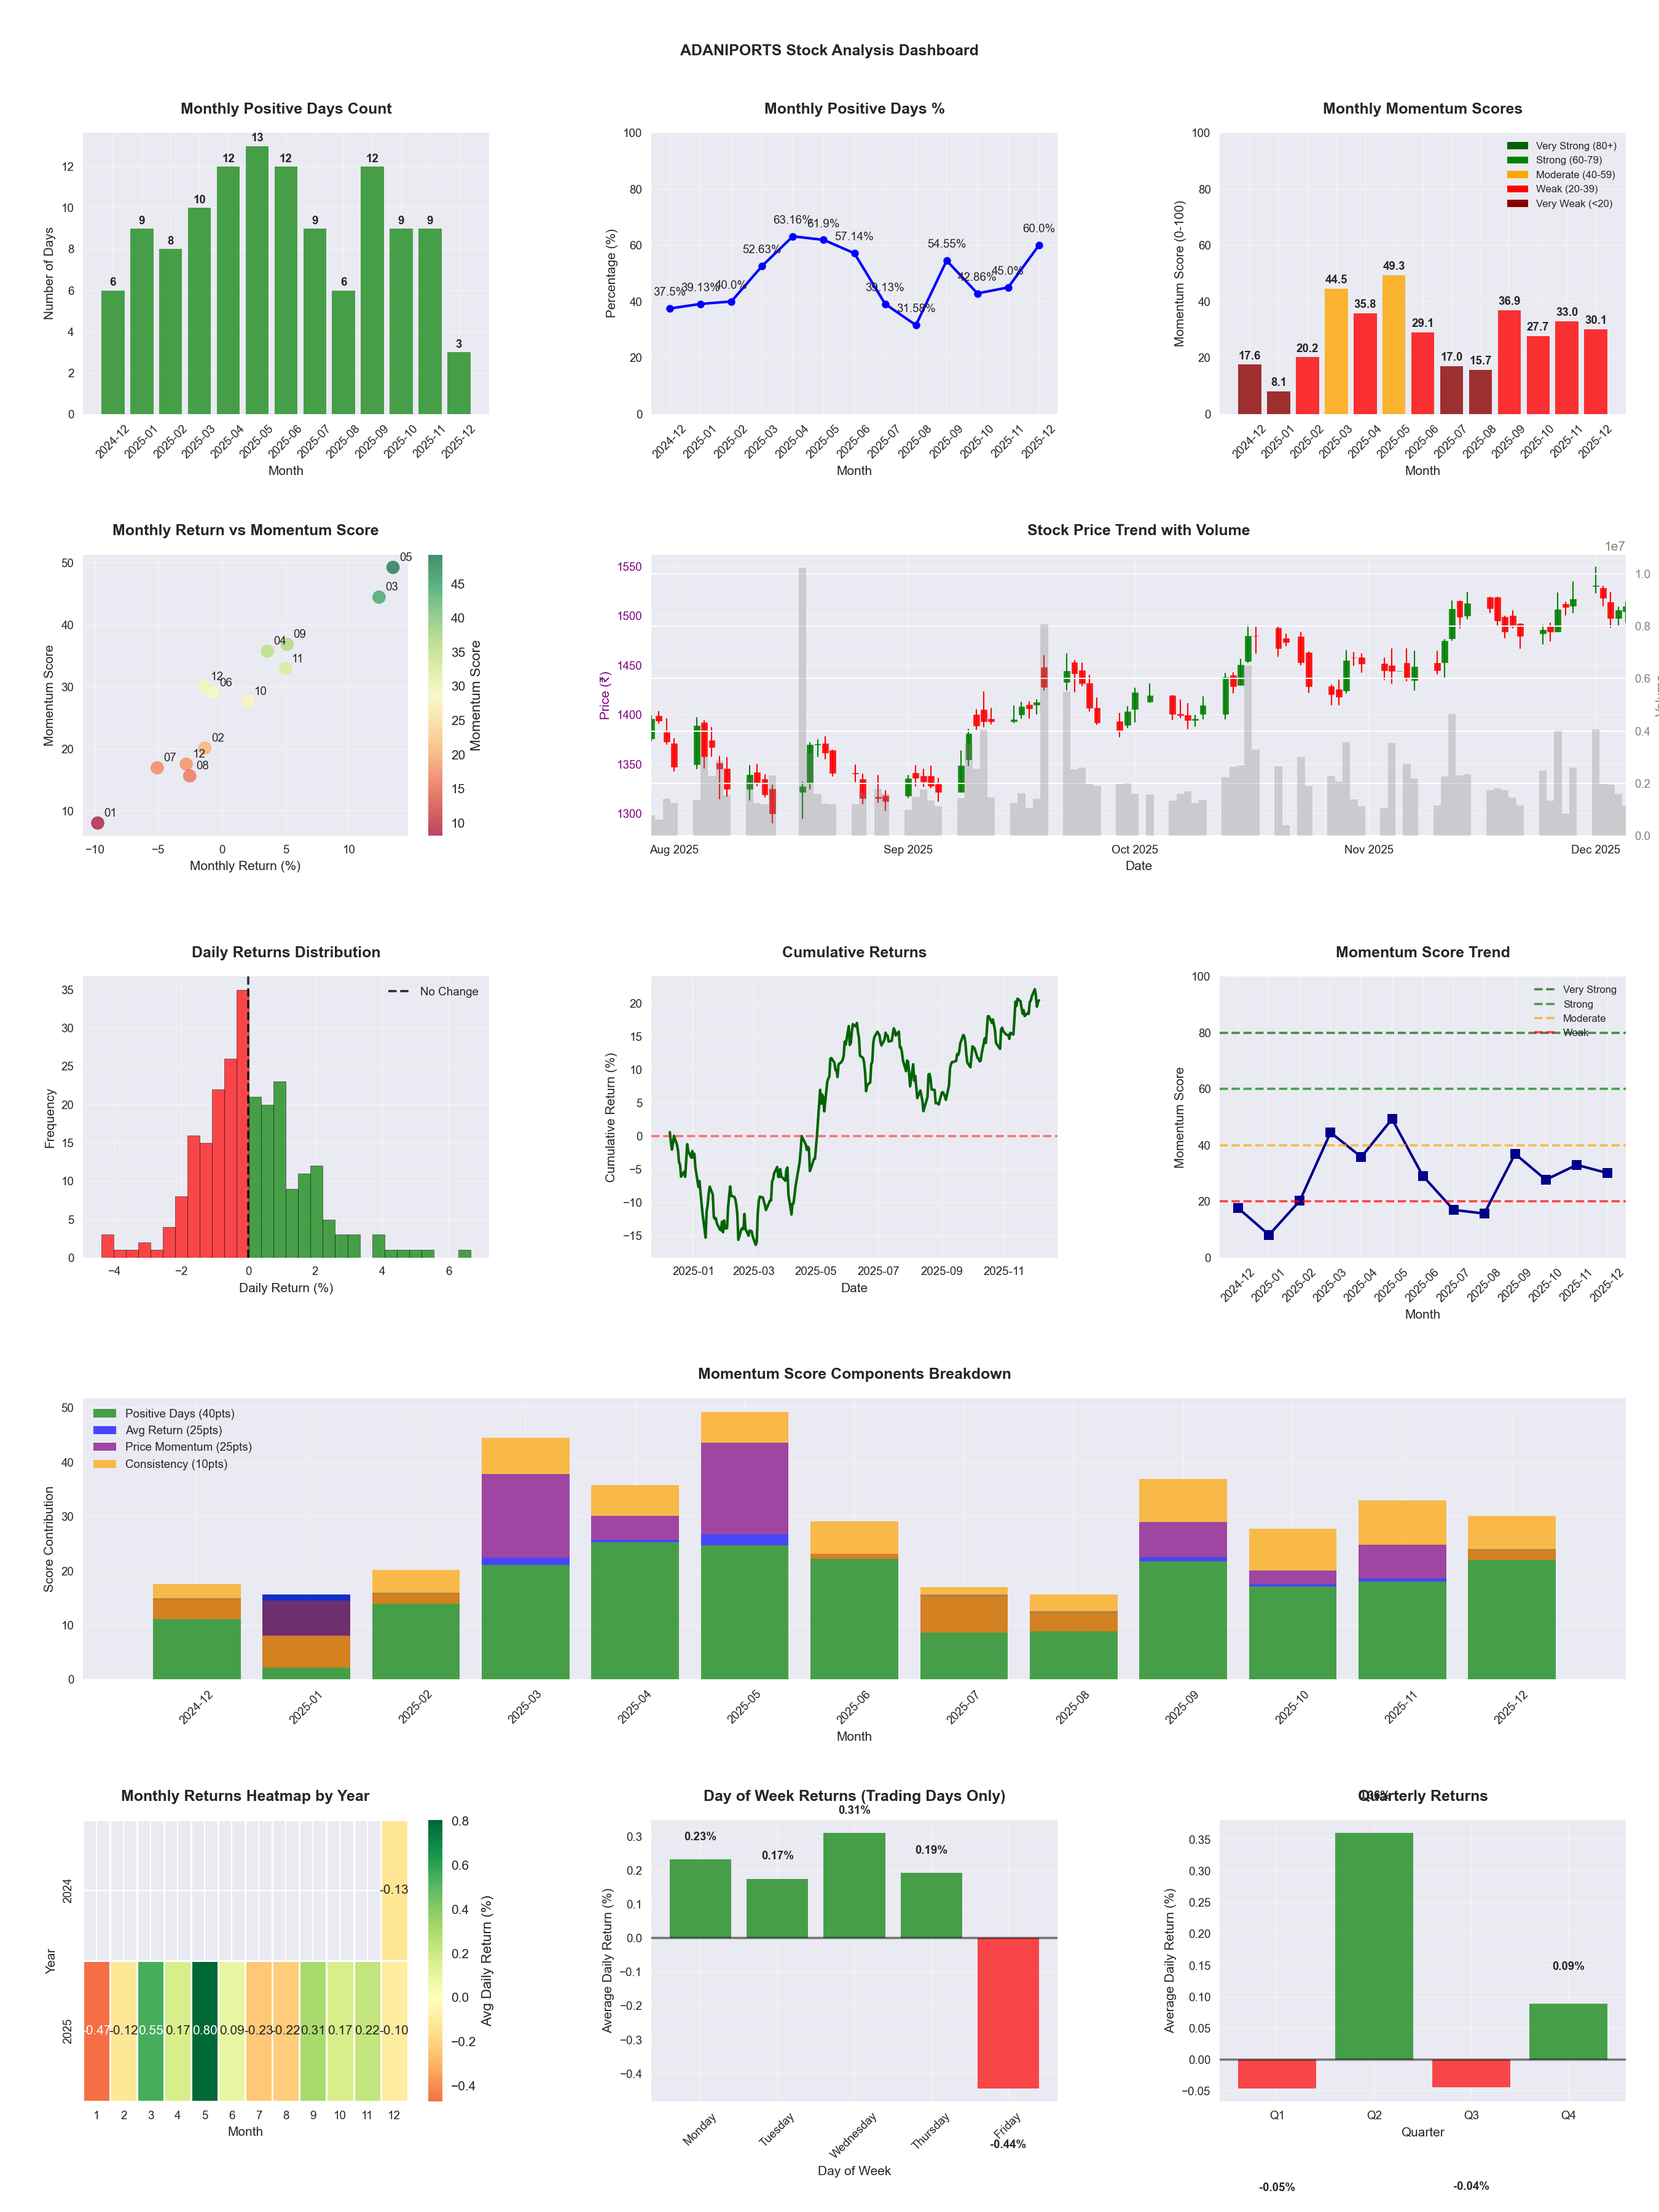
📊 Key Insights & Metrics
Symbol
📈 ADANIPORTS
Date
📅 2026-04-11
Volatility
🟡 1.77%
Win Rate
⚠️ 48.8%
Avg Daily Return
📈 +0.11%
Max Drawdown
📉 -16.98%
IBD RS Score
📊 72.2
Strong
Market Rank
#137
Best Month
🏆 2025-05
Worst Month
📉 2026-03
Best Months to Trade
📅 Apr, May, Feb
Best Days to Trade
📅 Wednesday, Tuesday
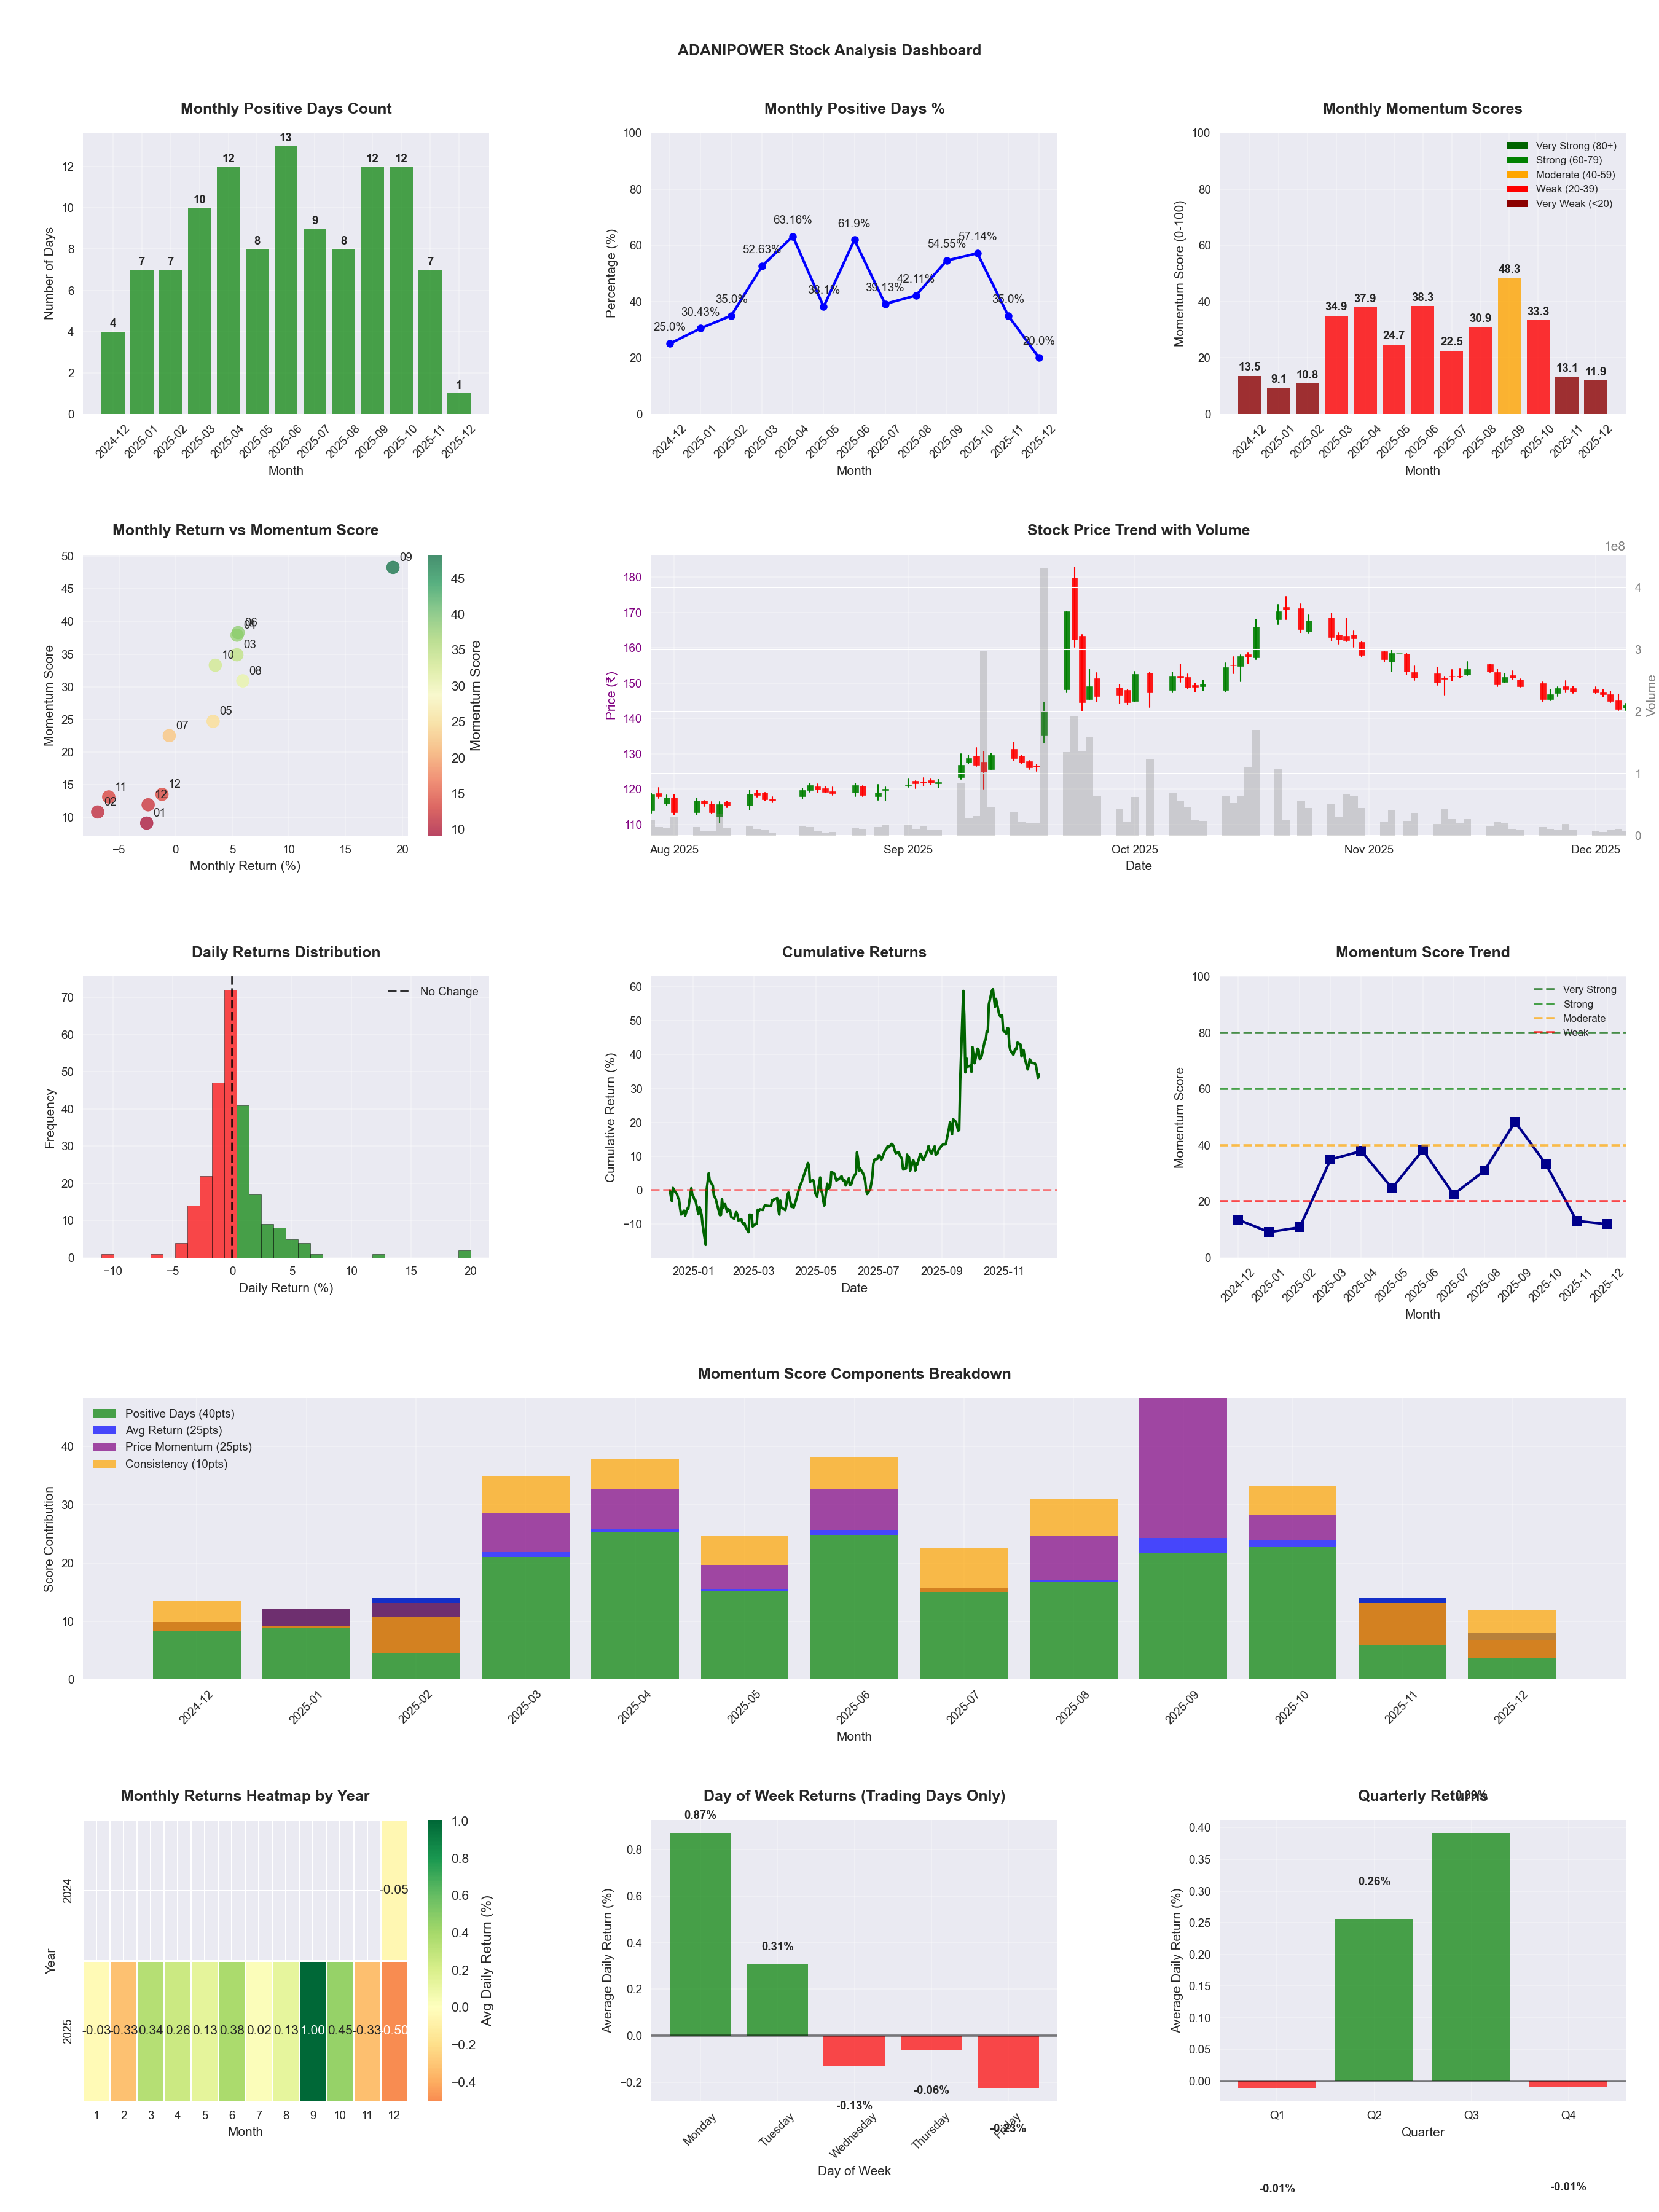
📊 Key Insights & Metrics
Symbol
📈 ADANIPOWER
Date
📅 2026-04-11
Volatility
🟡 2.68%
Risk Profile
⚠️ suitable for aggressive investors
Win Rate
⚠️ 48.4%
Avg Daily Return
📈 +0.25%
Max Drawdown
📉 -22.15%
IBD RS Score
📊 95.9
Leader
Market Rank
#20
Best Month
🏆 2026-04
Worst Month
📉 2026-01
Best Months to Trade
📅 Apr, Sep, Oct
Best Days to Trade
📅 Monday, Tuesday
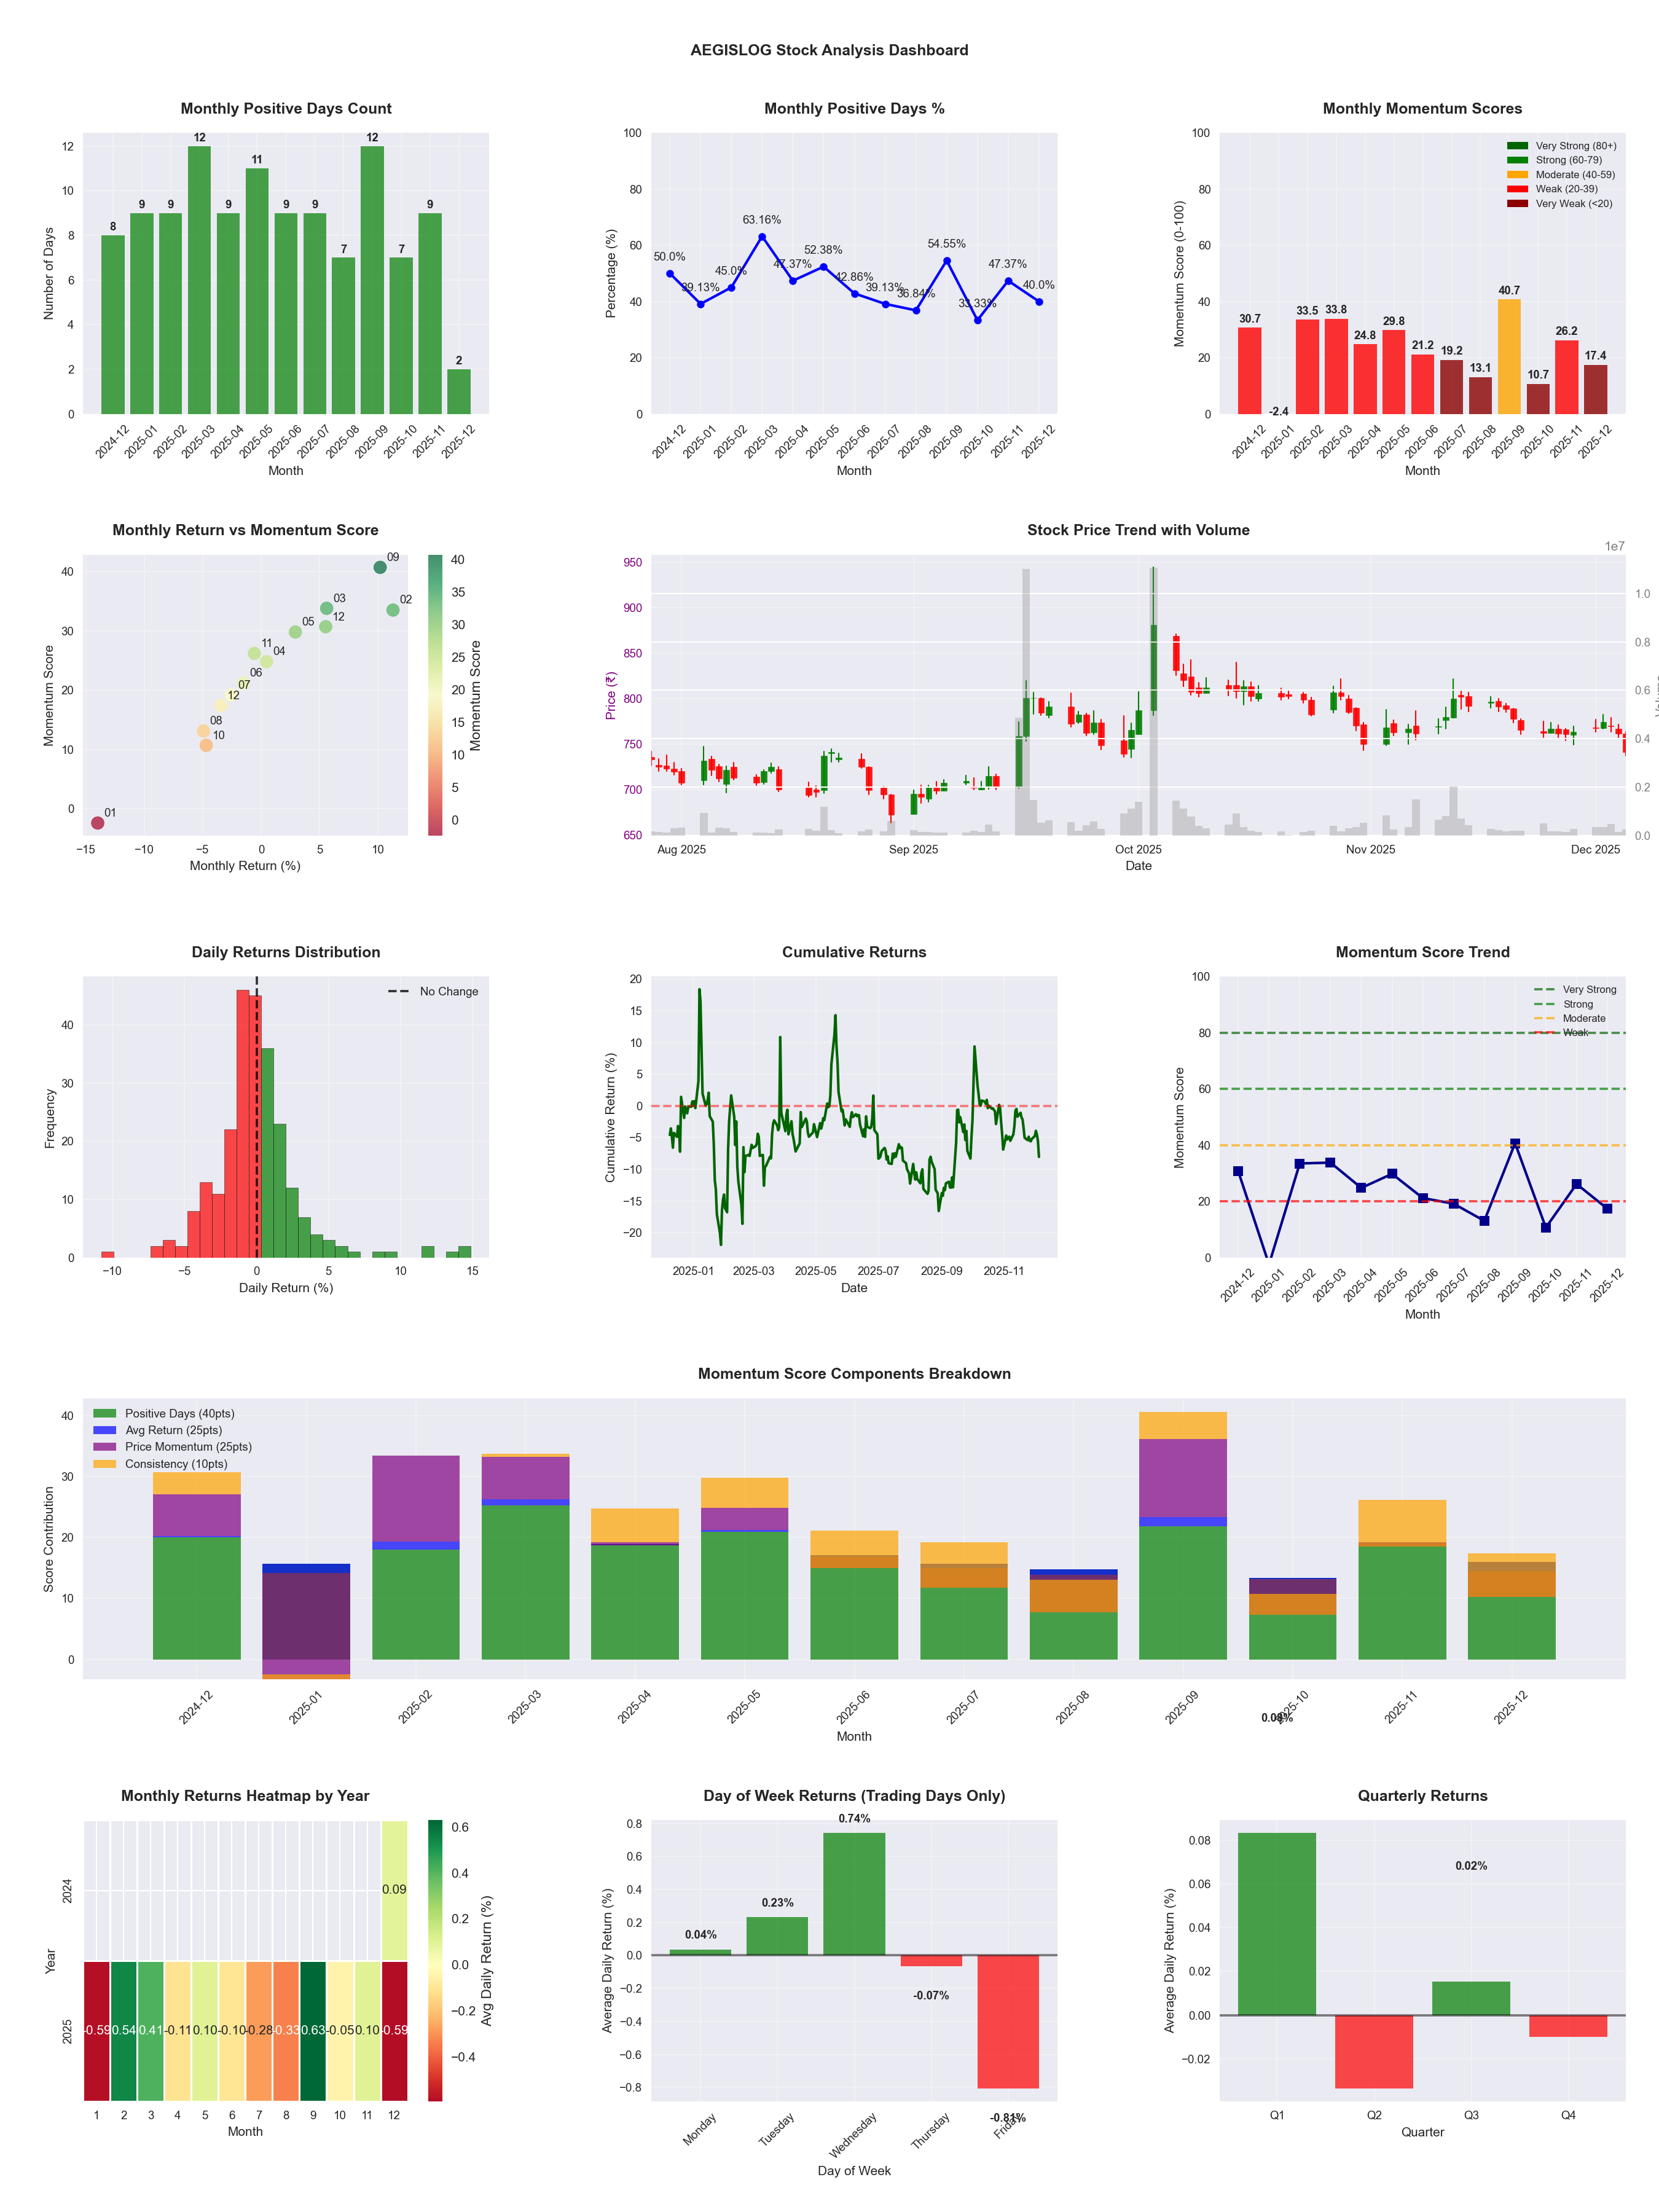
📊 Key Insights & Metrics
Symbol
📈 AEGISLOG
Date
📅 2026-04-11
Volatility
🟡 2.22%
Risk Profile
⚠️ suitable for aggressive investors
Win Rate
⚠️ 42.5%
Avg Daily Return
📉 -0.04%
Max Drawdown
📉 -36.15%
IBD RS Score
📊 18.9
Weak
Market Rank
#400
Best Month
🏆 2025-09
Worst Month
📉 2026-03
Best Months to Trade
📅 Sep, Apr, Jan
Best Days to Trade
📅 Monday, Tuesday
📊 Key Insights & Metrics
Symbol
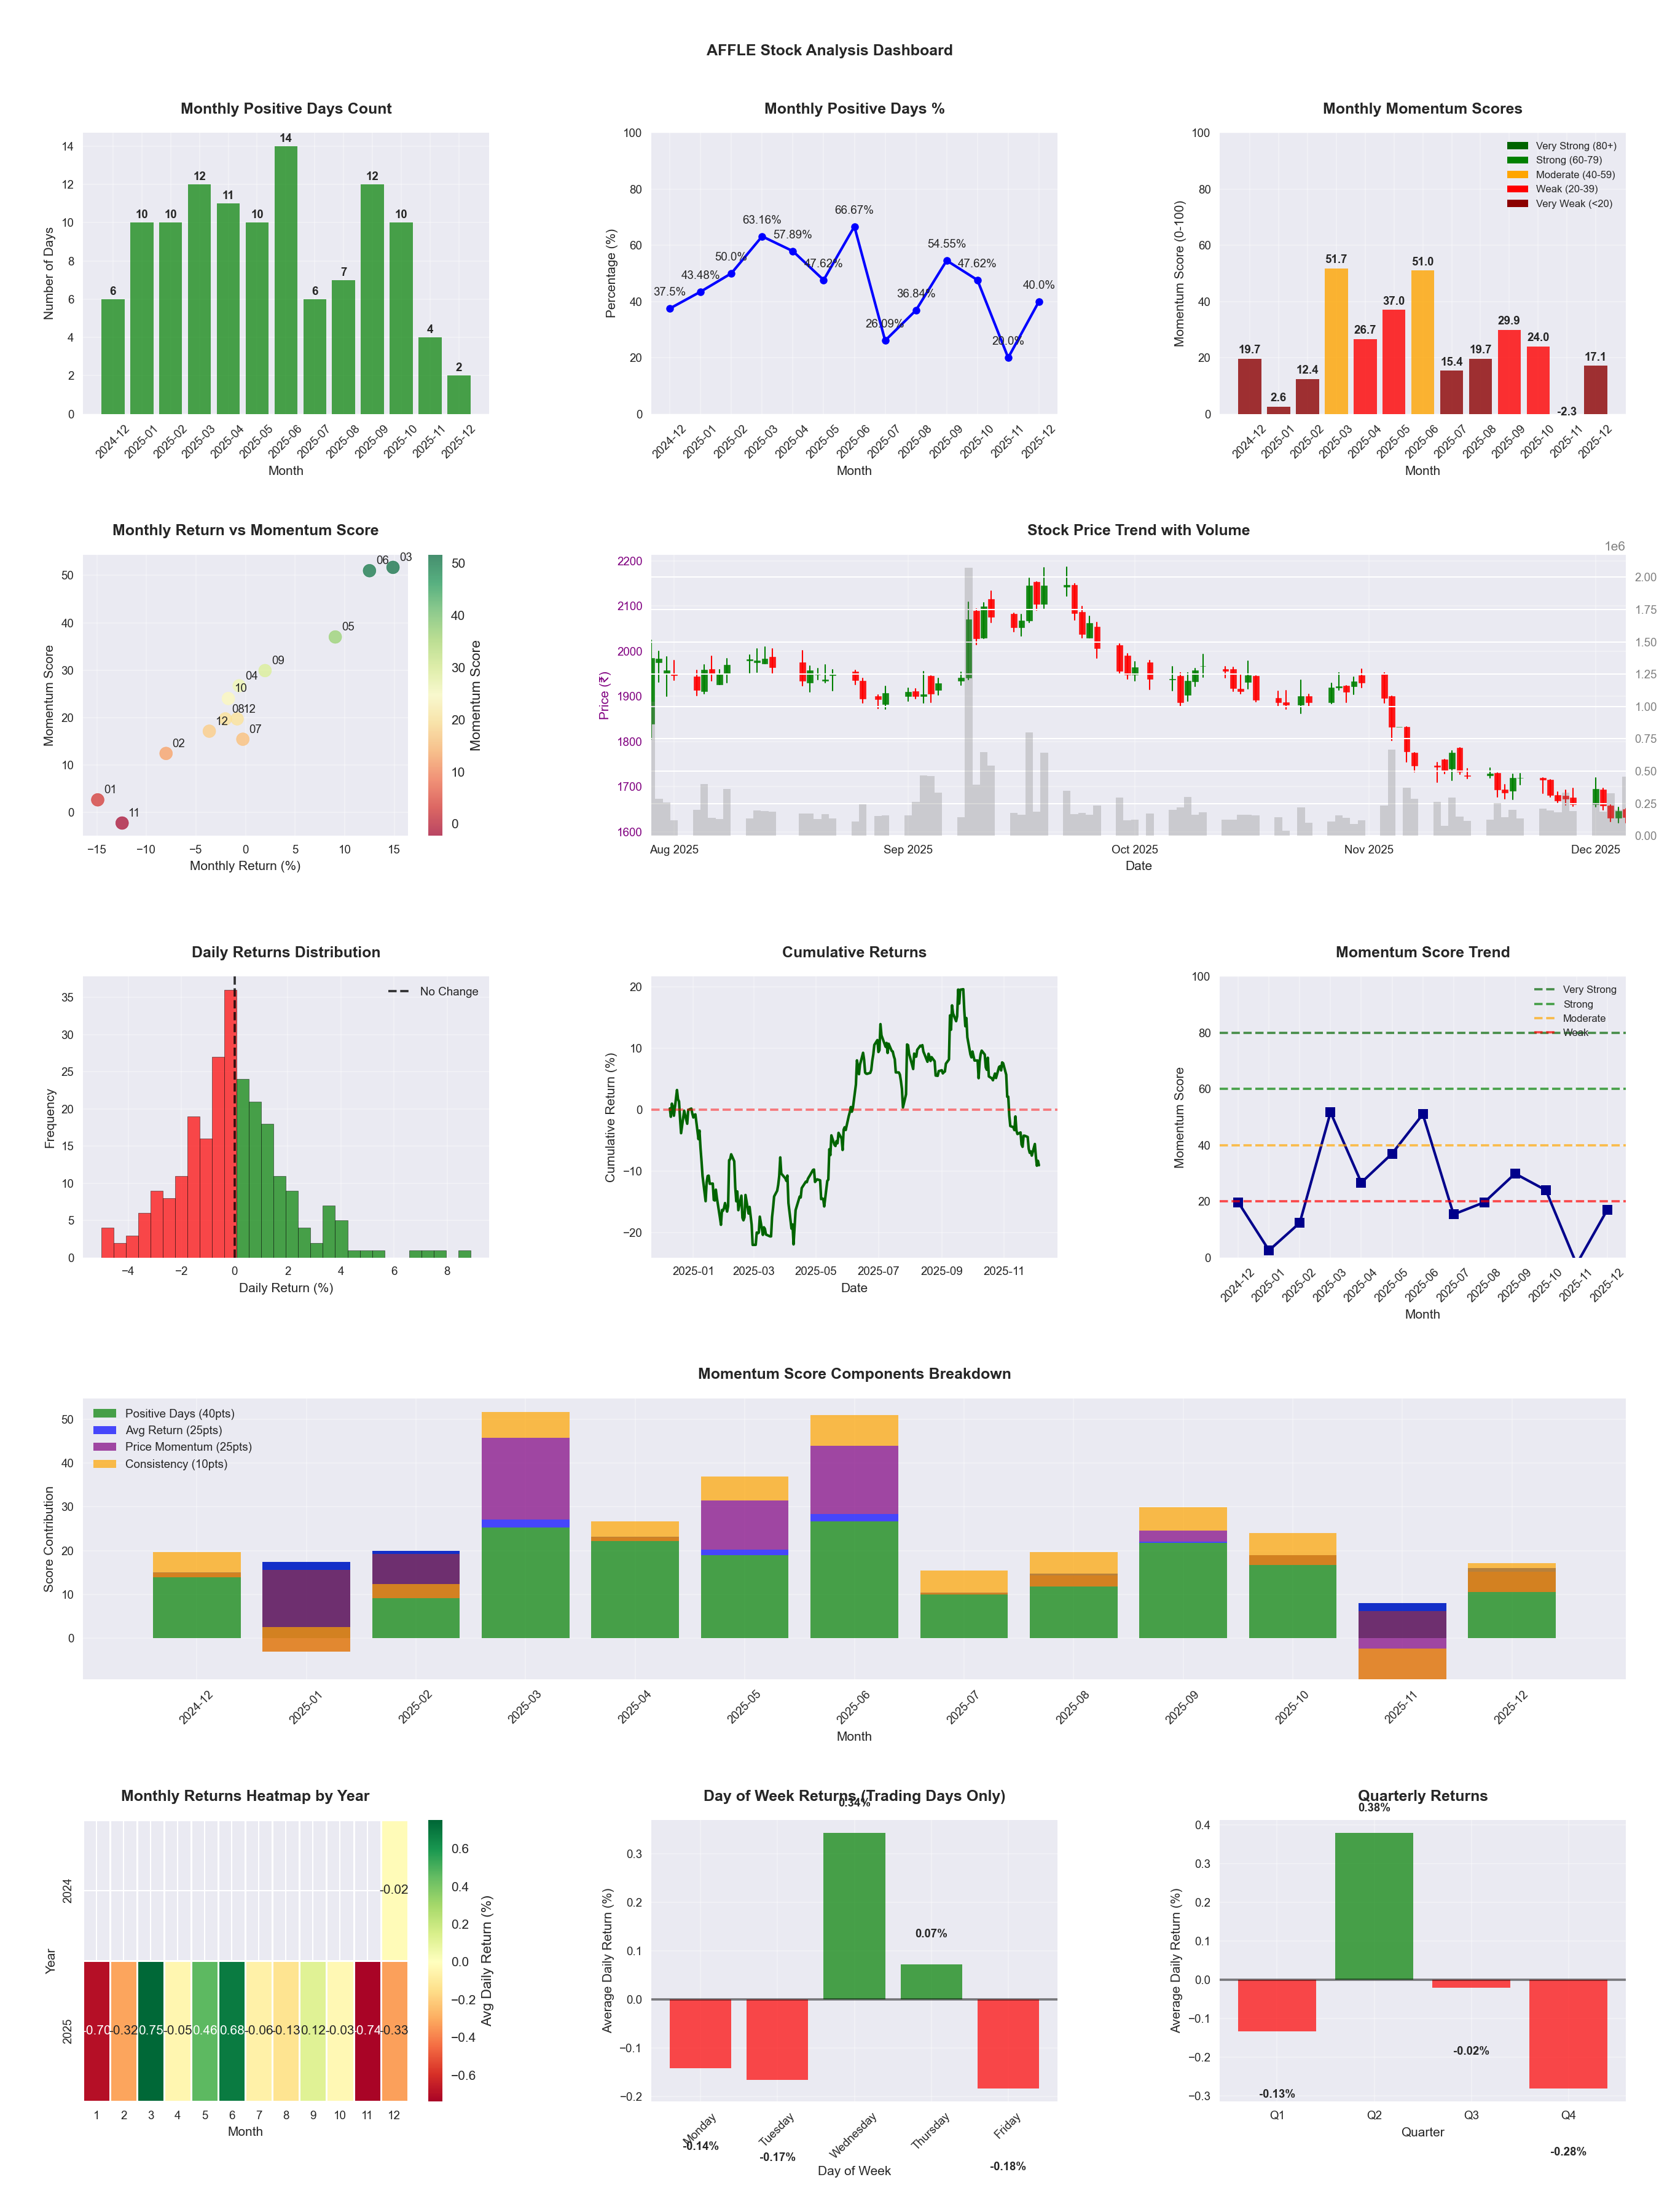
📈 AFFLE
Date
📅 2026-04-11
Volatility
🟡 1.94%
Win Rate
⚠️ 44.7%
Avg Daily Return
📉 -0.01%
Max Drawdown
📉 -40.90%
IBD RS Score
📊 11.8
Weak
Market Rank
#435
Best Month
🏆 2025-06
Best Months to Trade
📅 Jun, May, Dec
Best Days to Trade
📅 Wednesday, Monday
📊 Key Insights & Metrics
Symbol
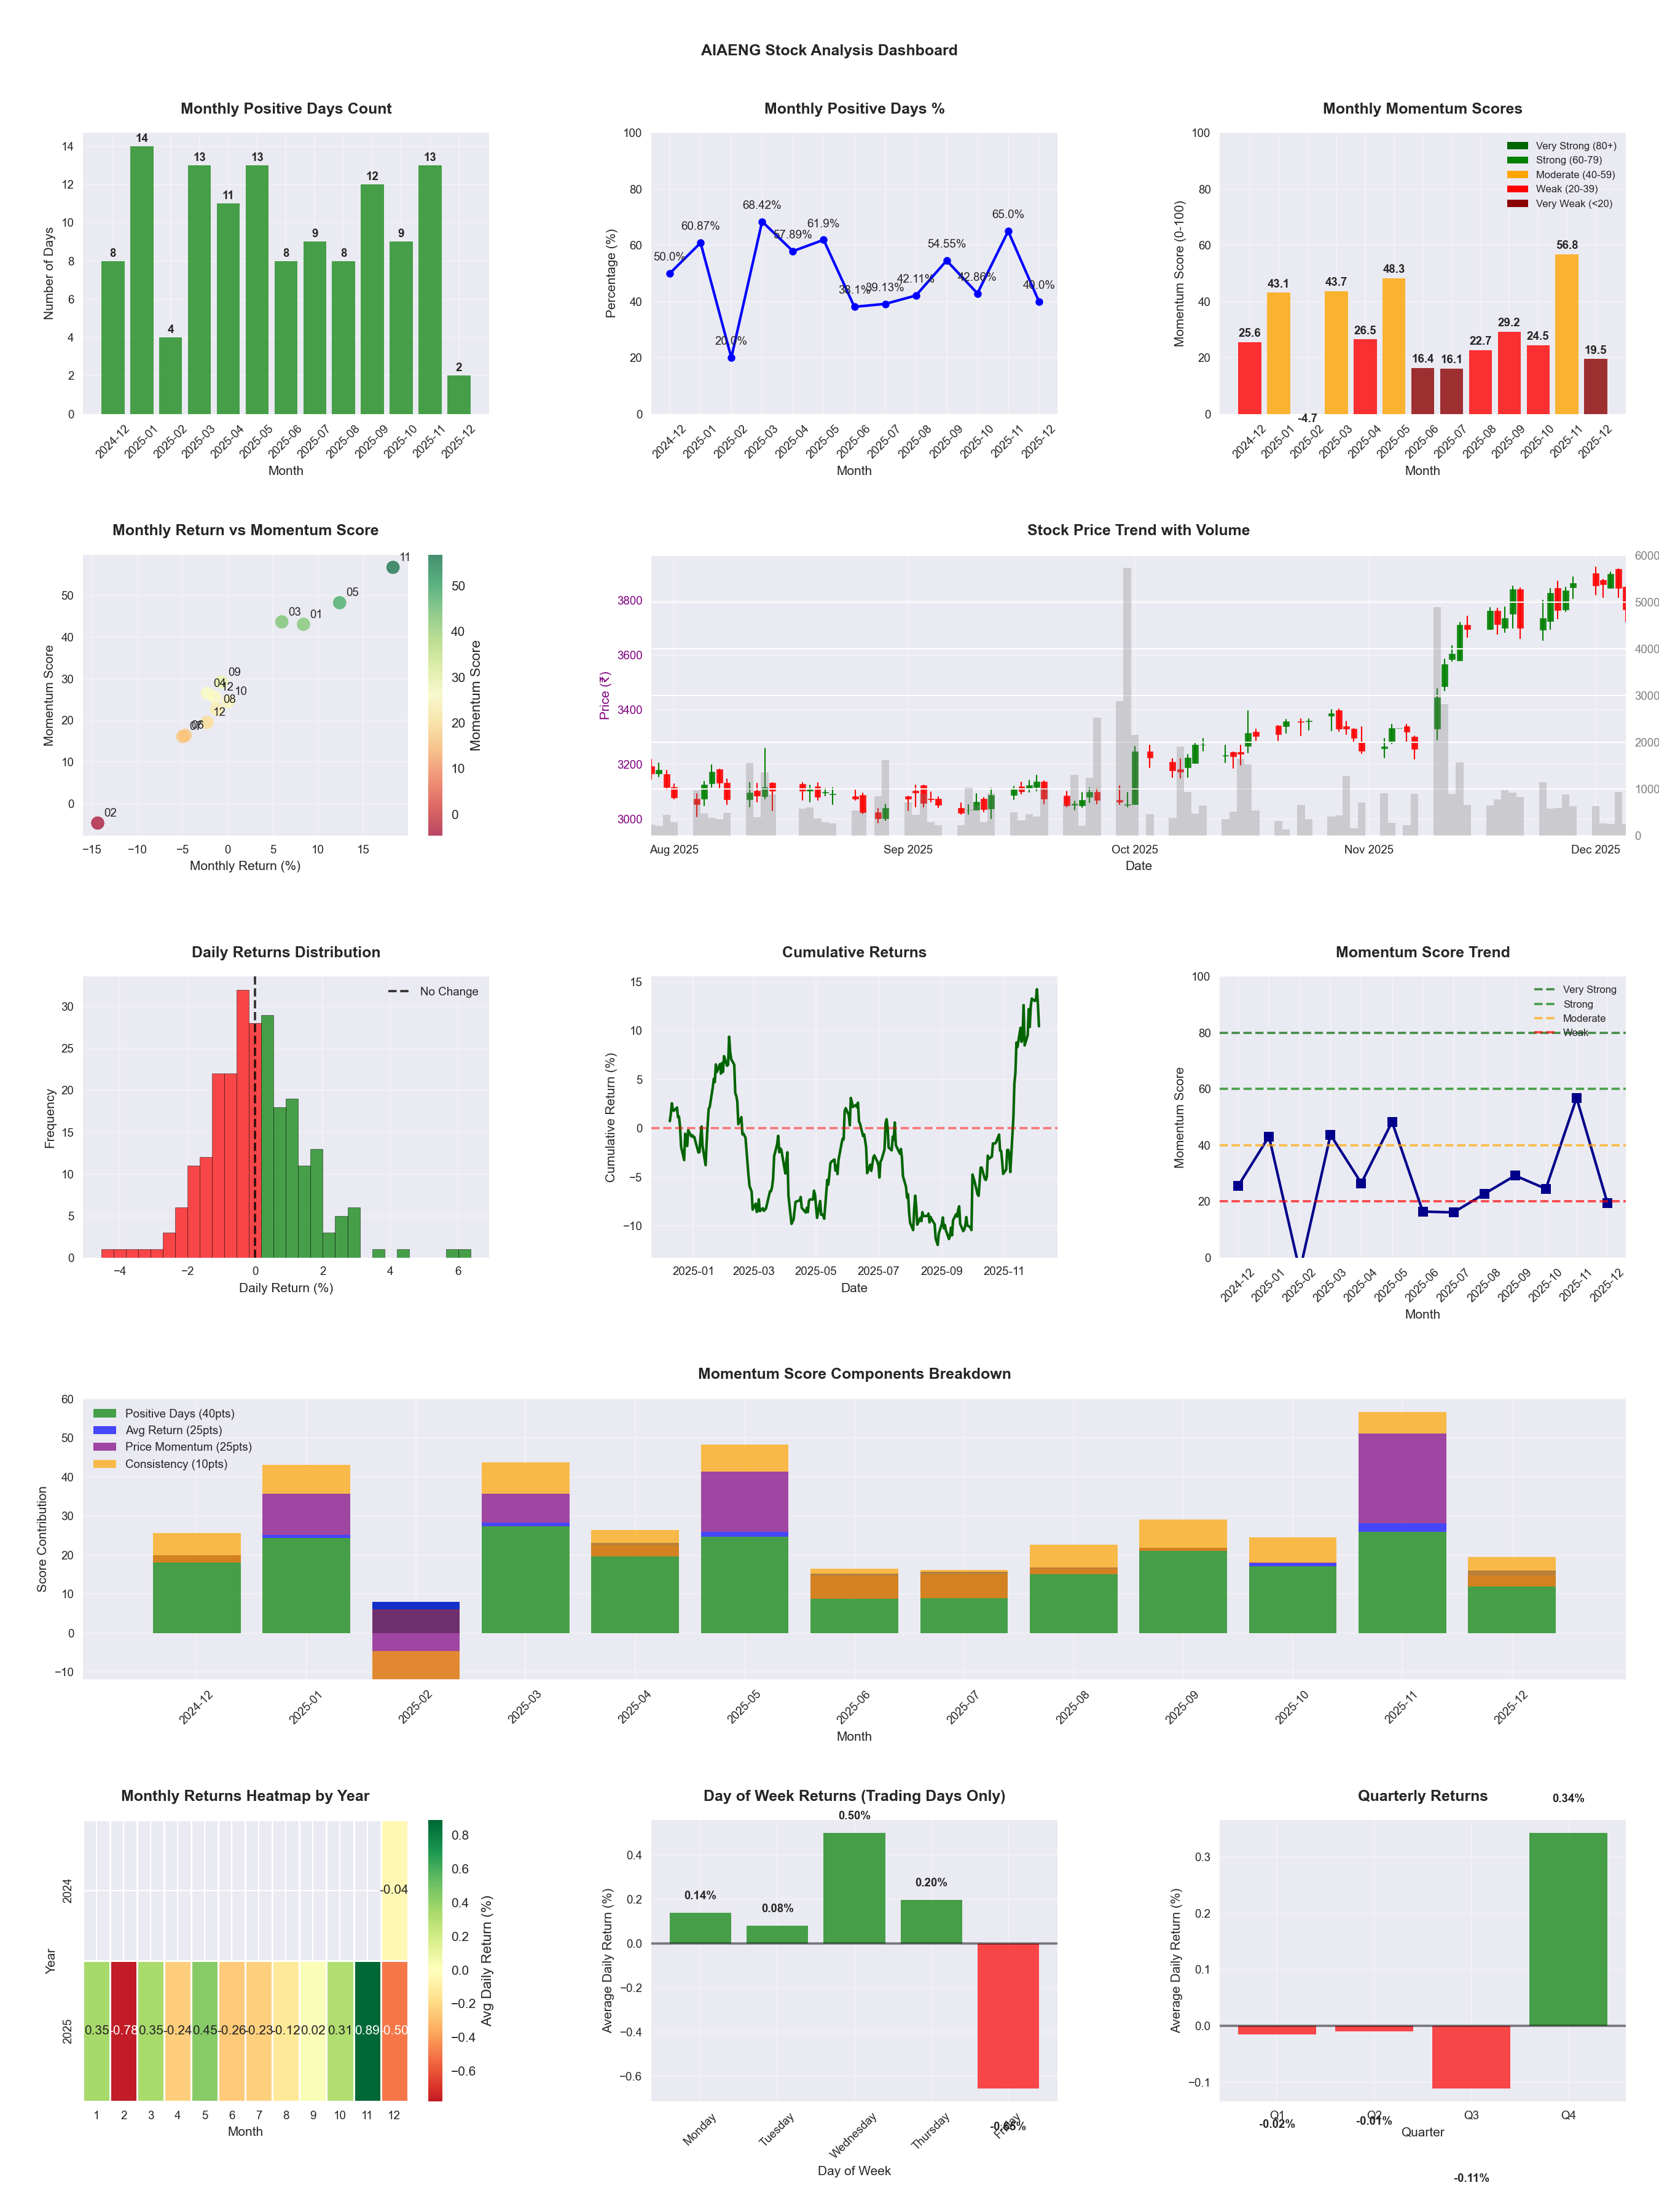
📈 AIAENG
Date
📅 2026-04-11
Volatility
🟡 1.73%
Win Rate
⚠️ 49.4%
Avg Daily Return
📈 +0.09%
Max Drawdown
📉 -19.29%
IBD RS Score
📊 73.6
Strong
Market Rank
#130
Best Month
🏆 2025-11
Worst Month
📉 2026-03
Best Months to Trade
📅 Nov, May, Oct
Best Days to Trade
📅 Tuesday, Wednesday
📊 Key Insights & Metrics
Symbol
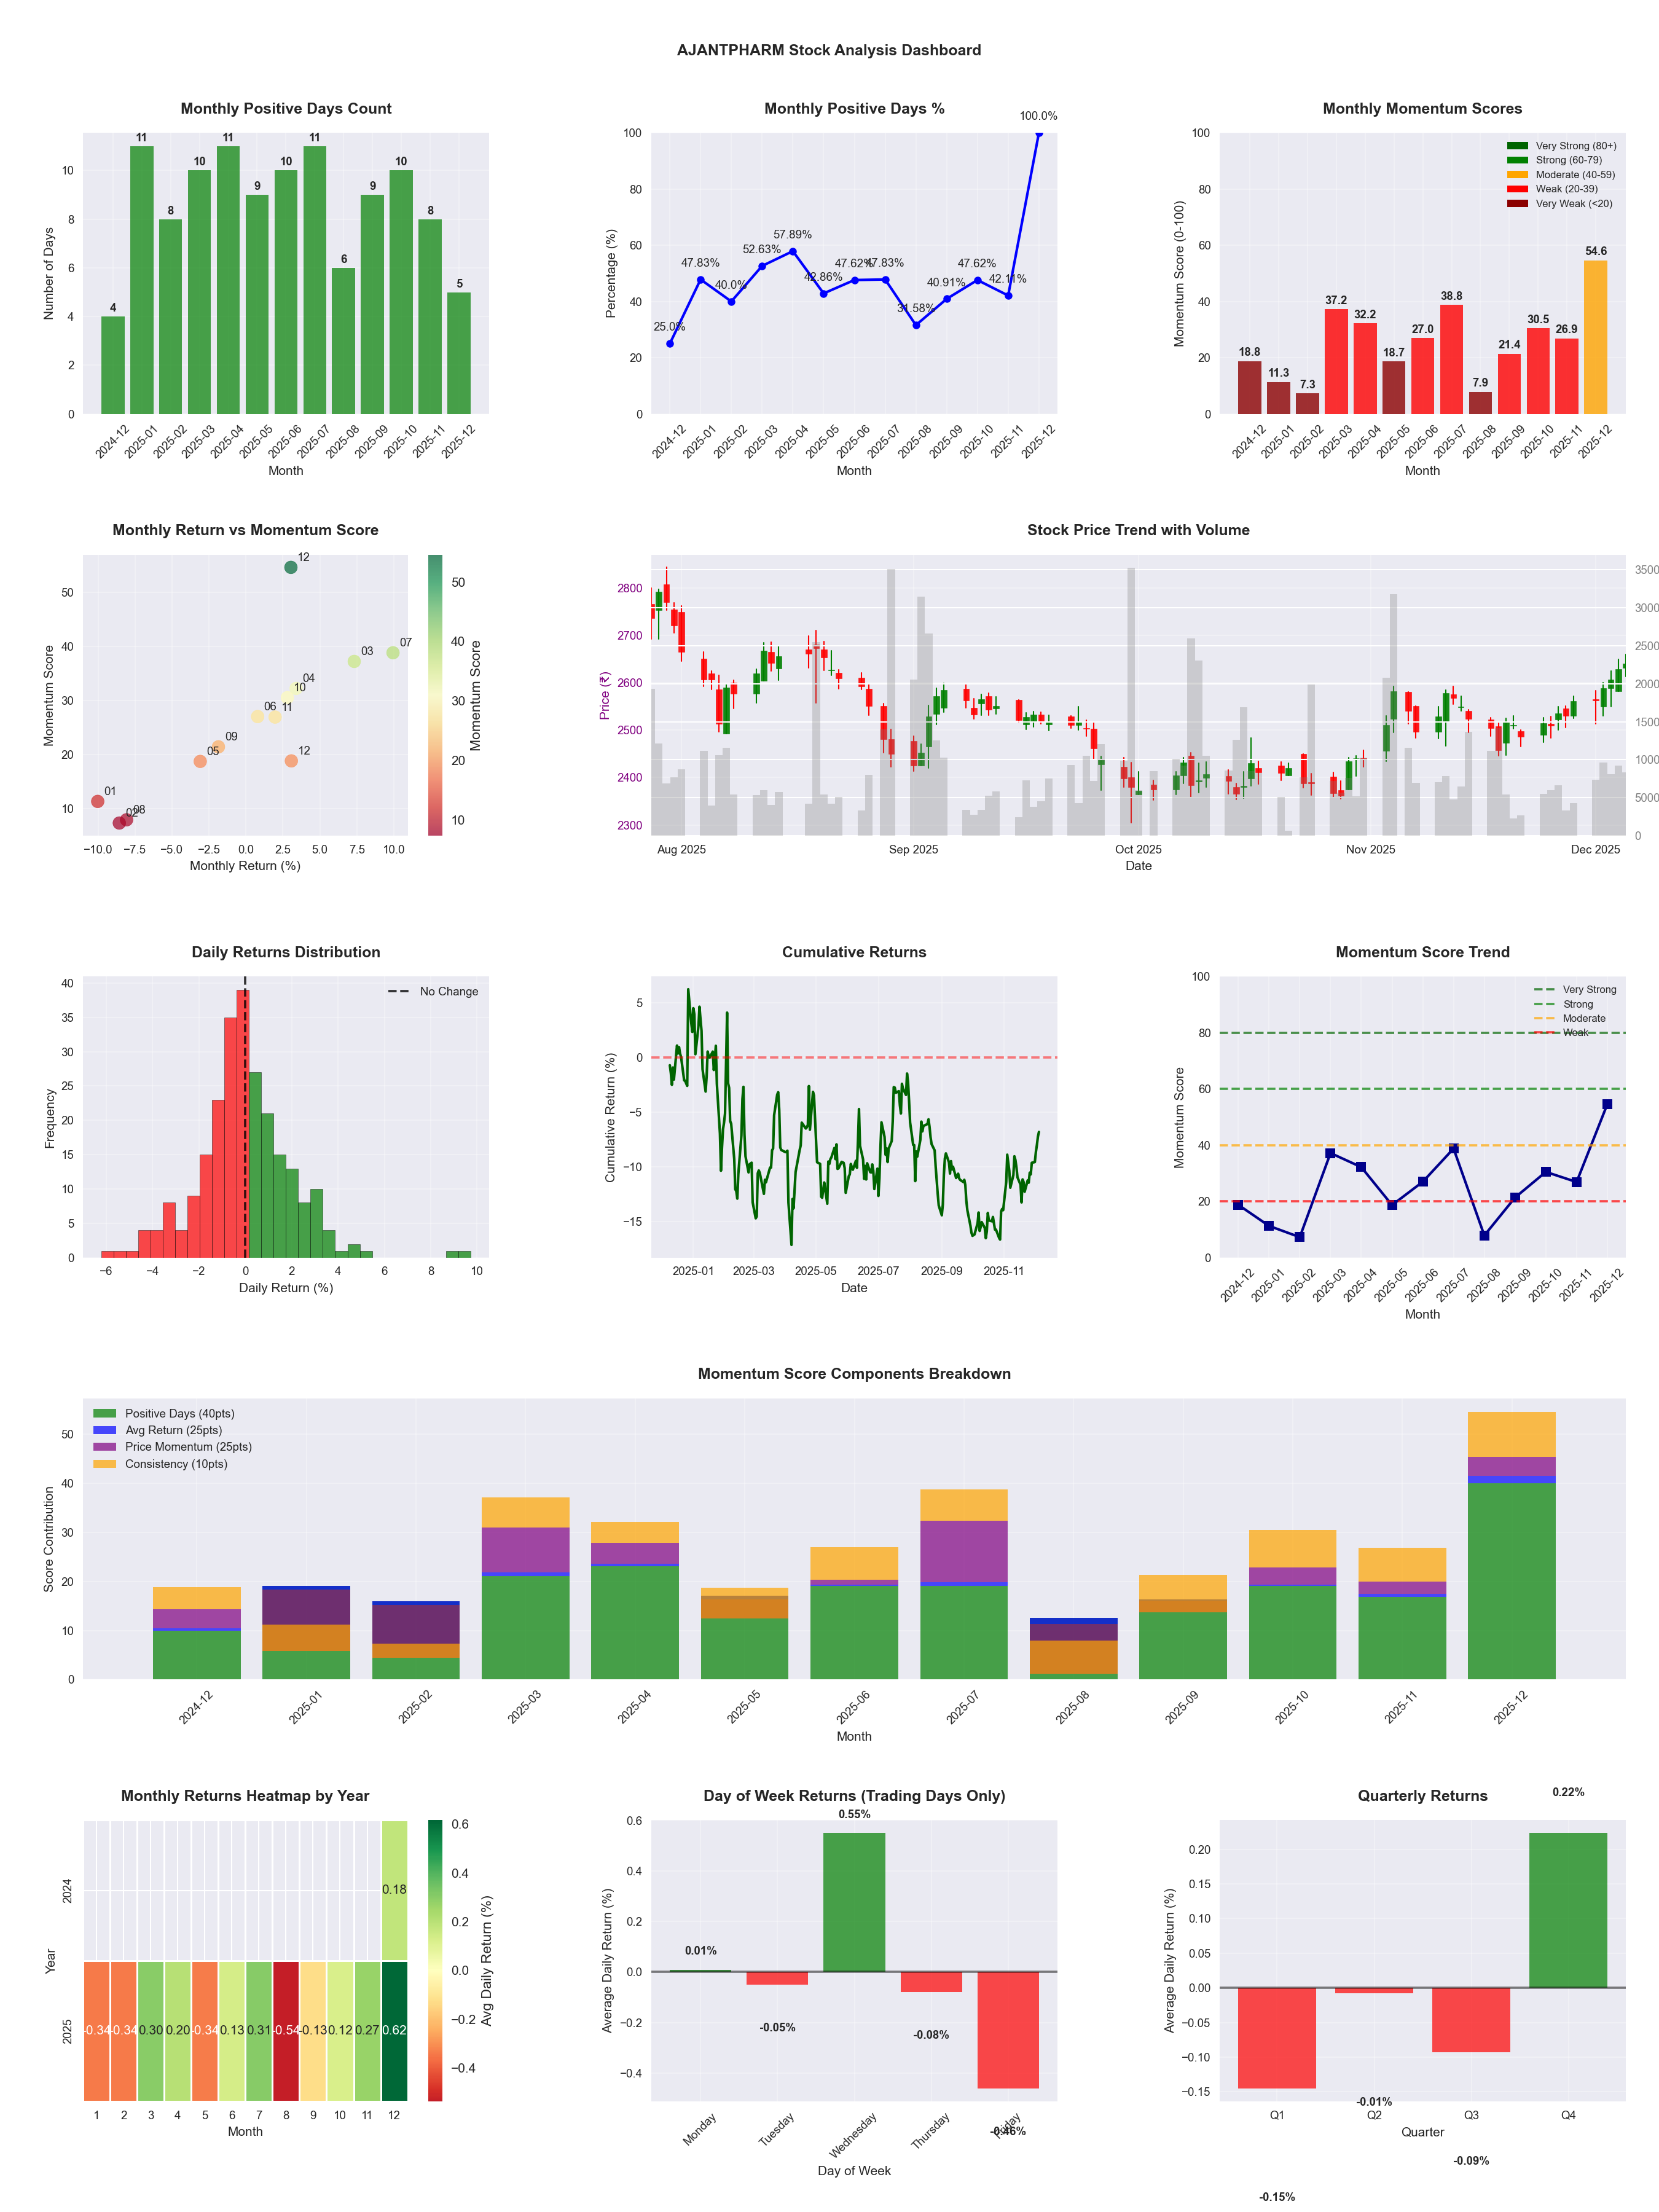
📈 AJANTPHARM
Date
📅 2026-04-11
Volatility
🟡 1.63%
Win Rate
⚠️ 48.6%
Avg Daily Return
📈 +0.05%
Max Drawdown
📉 -15.40%
IBD RS Score
📊 72.8
Strong
Market Rank
#134
Best Month
🏆 2025-12
Worst Month
📉 2025-08
Best Months to Trade
📅 Feb, Dec, Apr
Best Days to Trade
📅 Wednesday, Thursday
📊 Key Insights & Metrics
Symbol
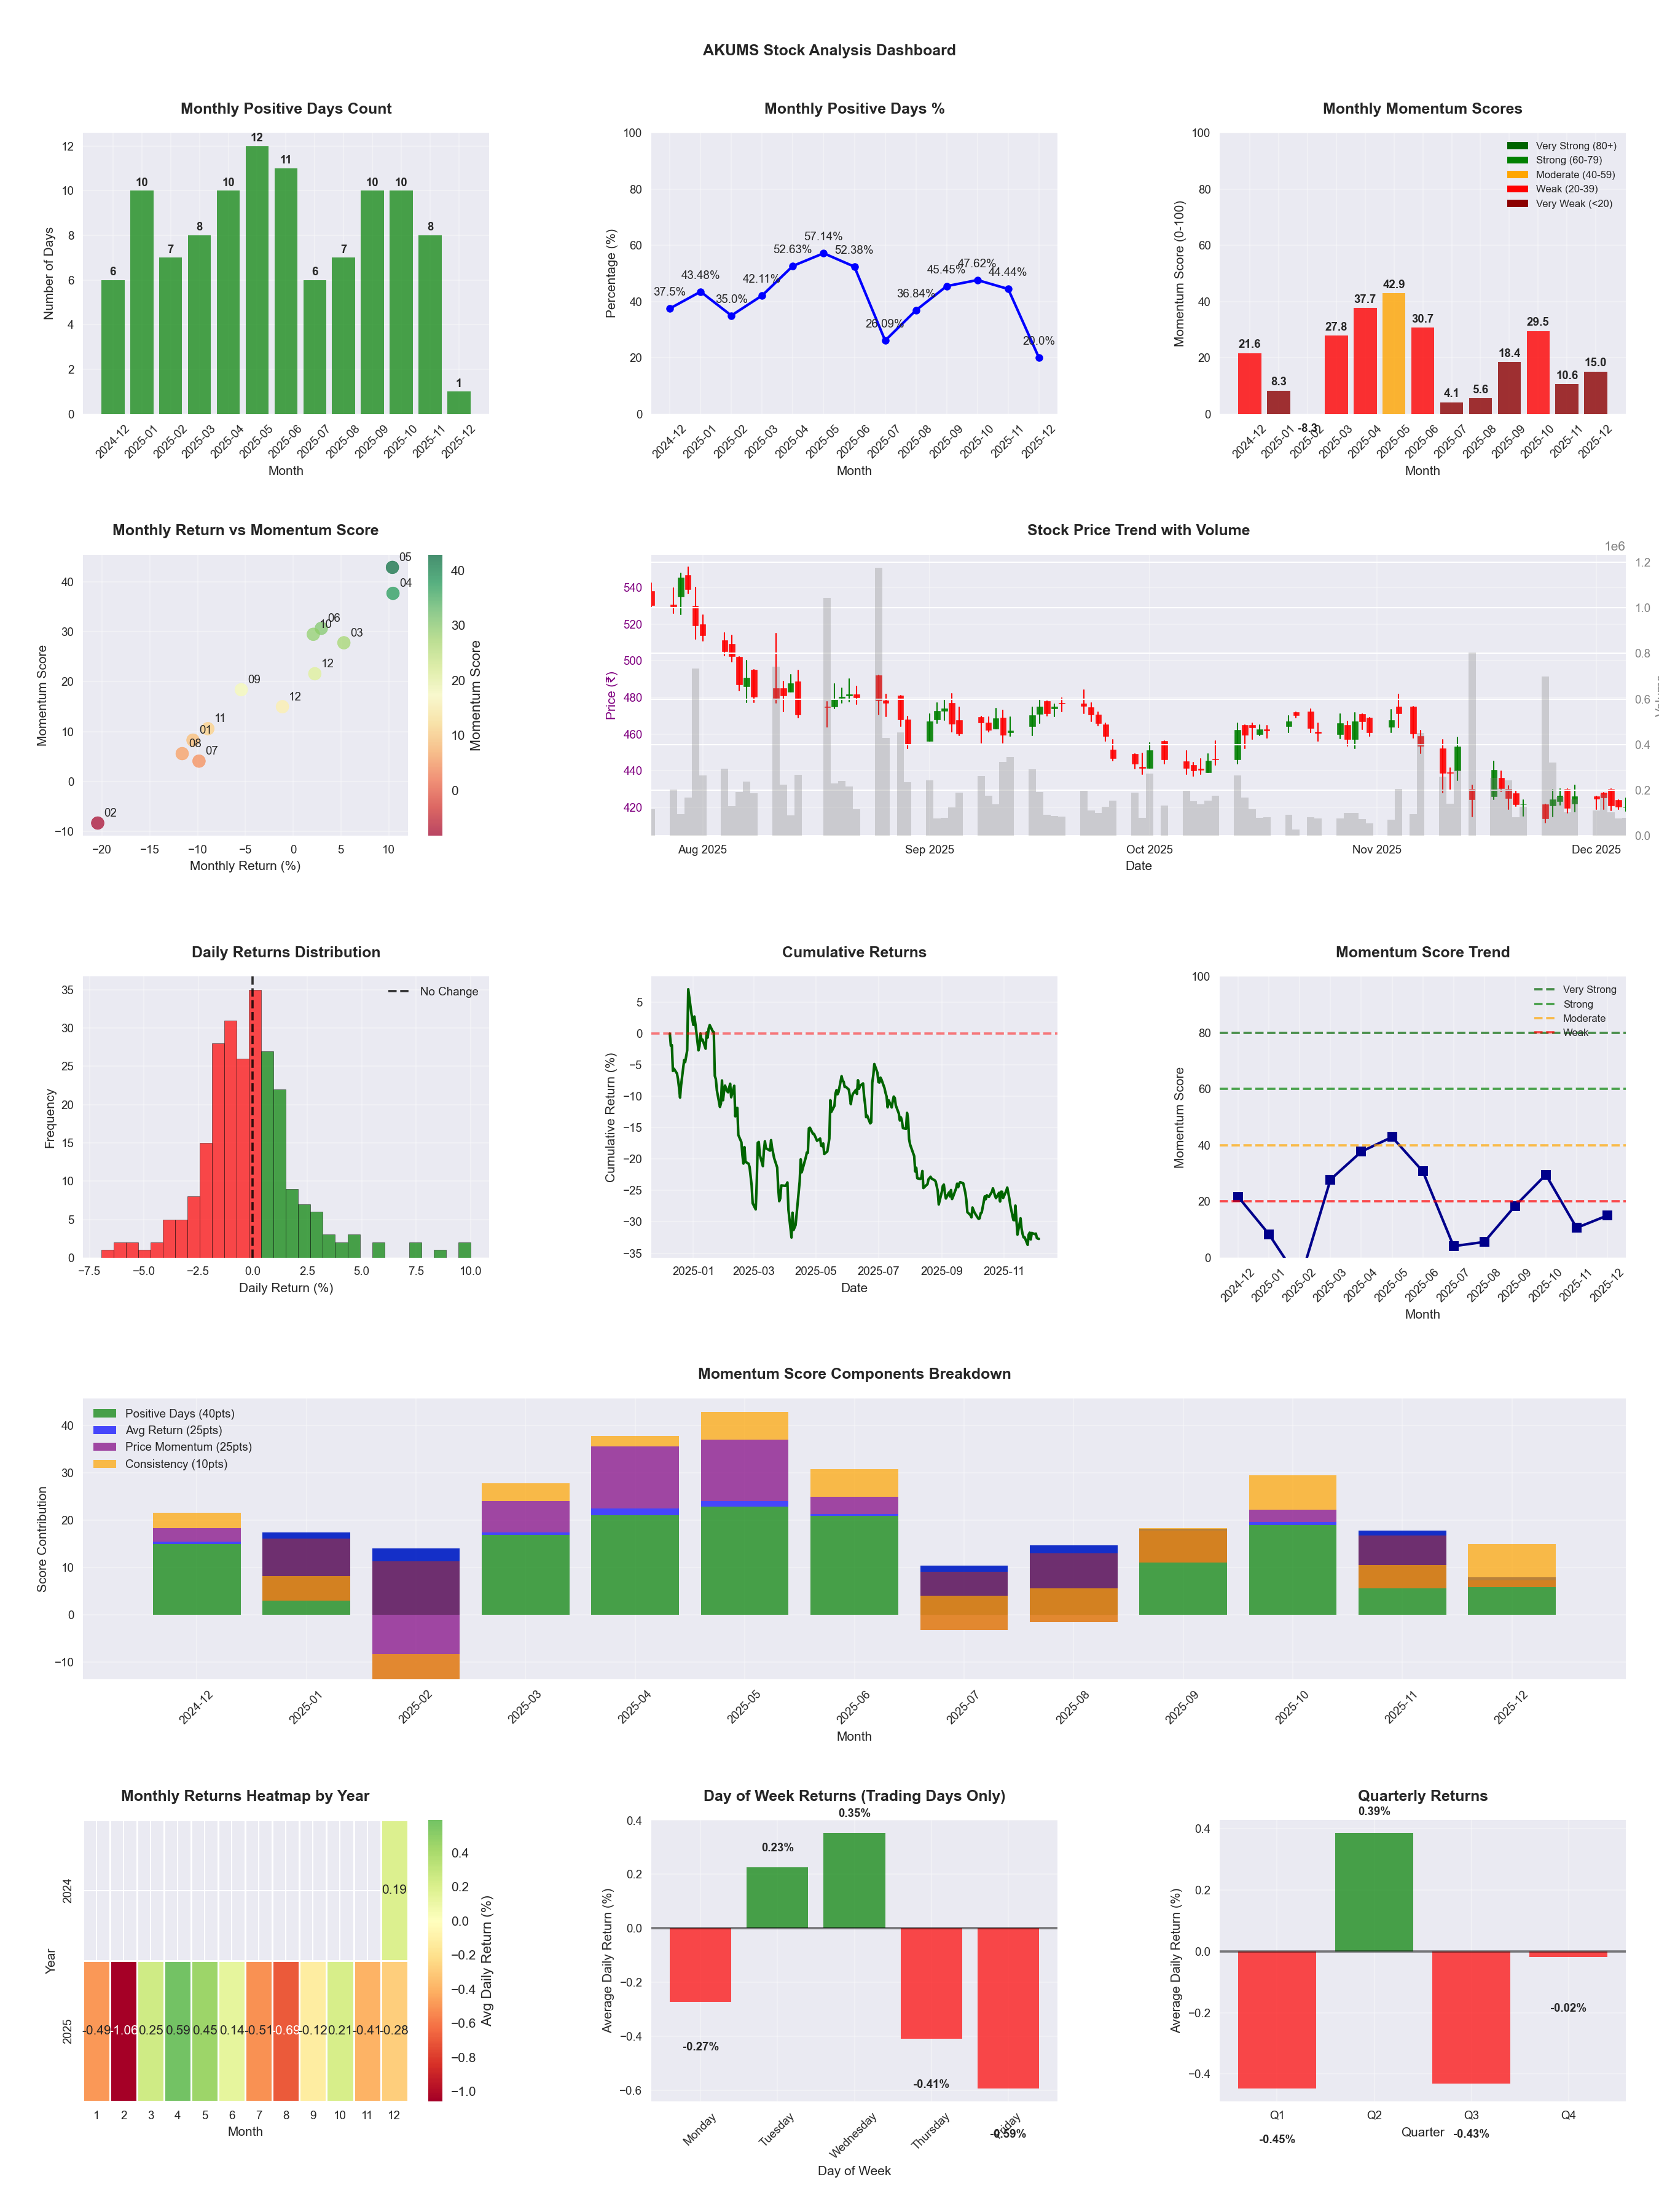
📈 AKUMS
Date
📅 2026-04-11
Volatility
🟡 2.05%
Risk Profile
⚠️ suitable for aggressive investors
Win Rate
⚠️ 46.7%
Avg Daily Return
📈 +0.09%
Max Drawdown
📉 -30.29%
IBD RS Score
📊 76.7
Strong
Market Rank
#115
Best Month
🏆 2025-05
Worst Month
📉 2025-07
Best Months to Trade
📅 Apr, Feb, May
Best Days to Trade
📅 Wednesday, Tuesday
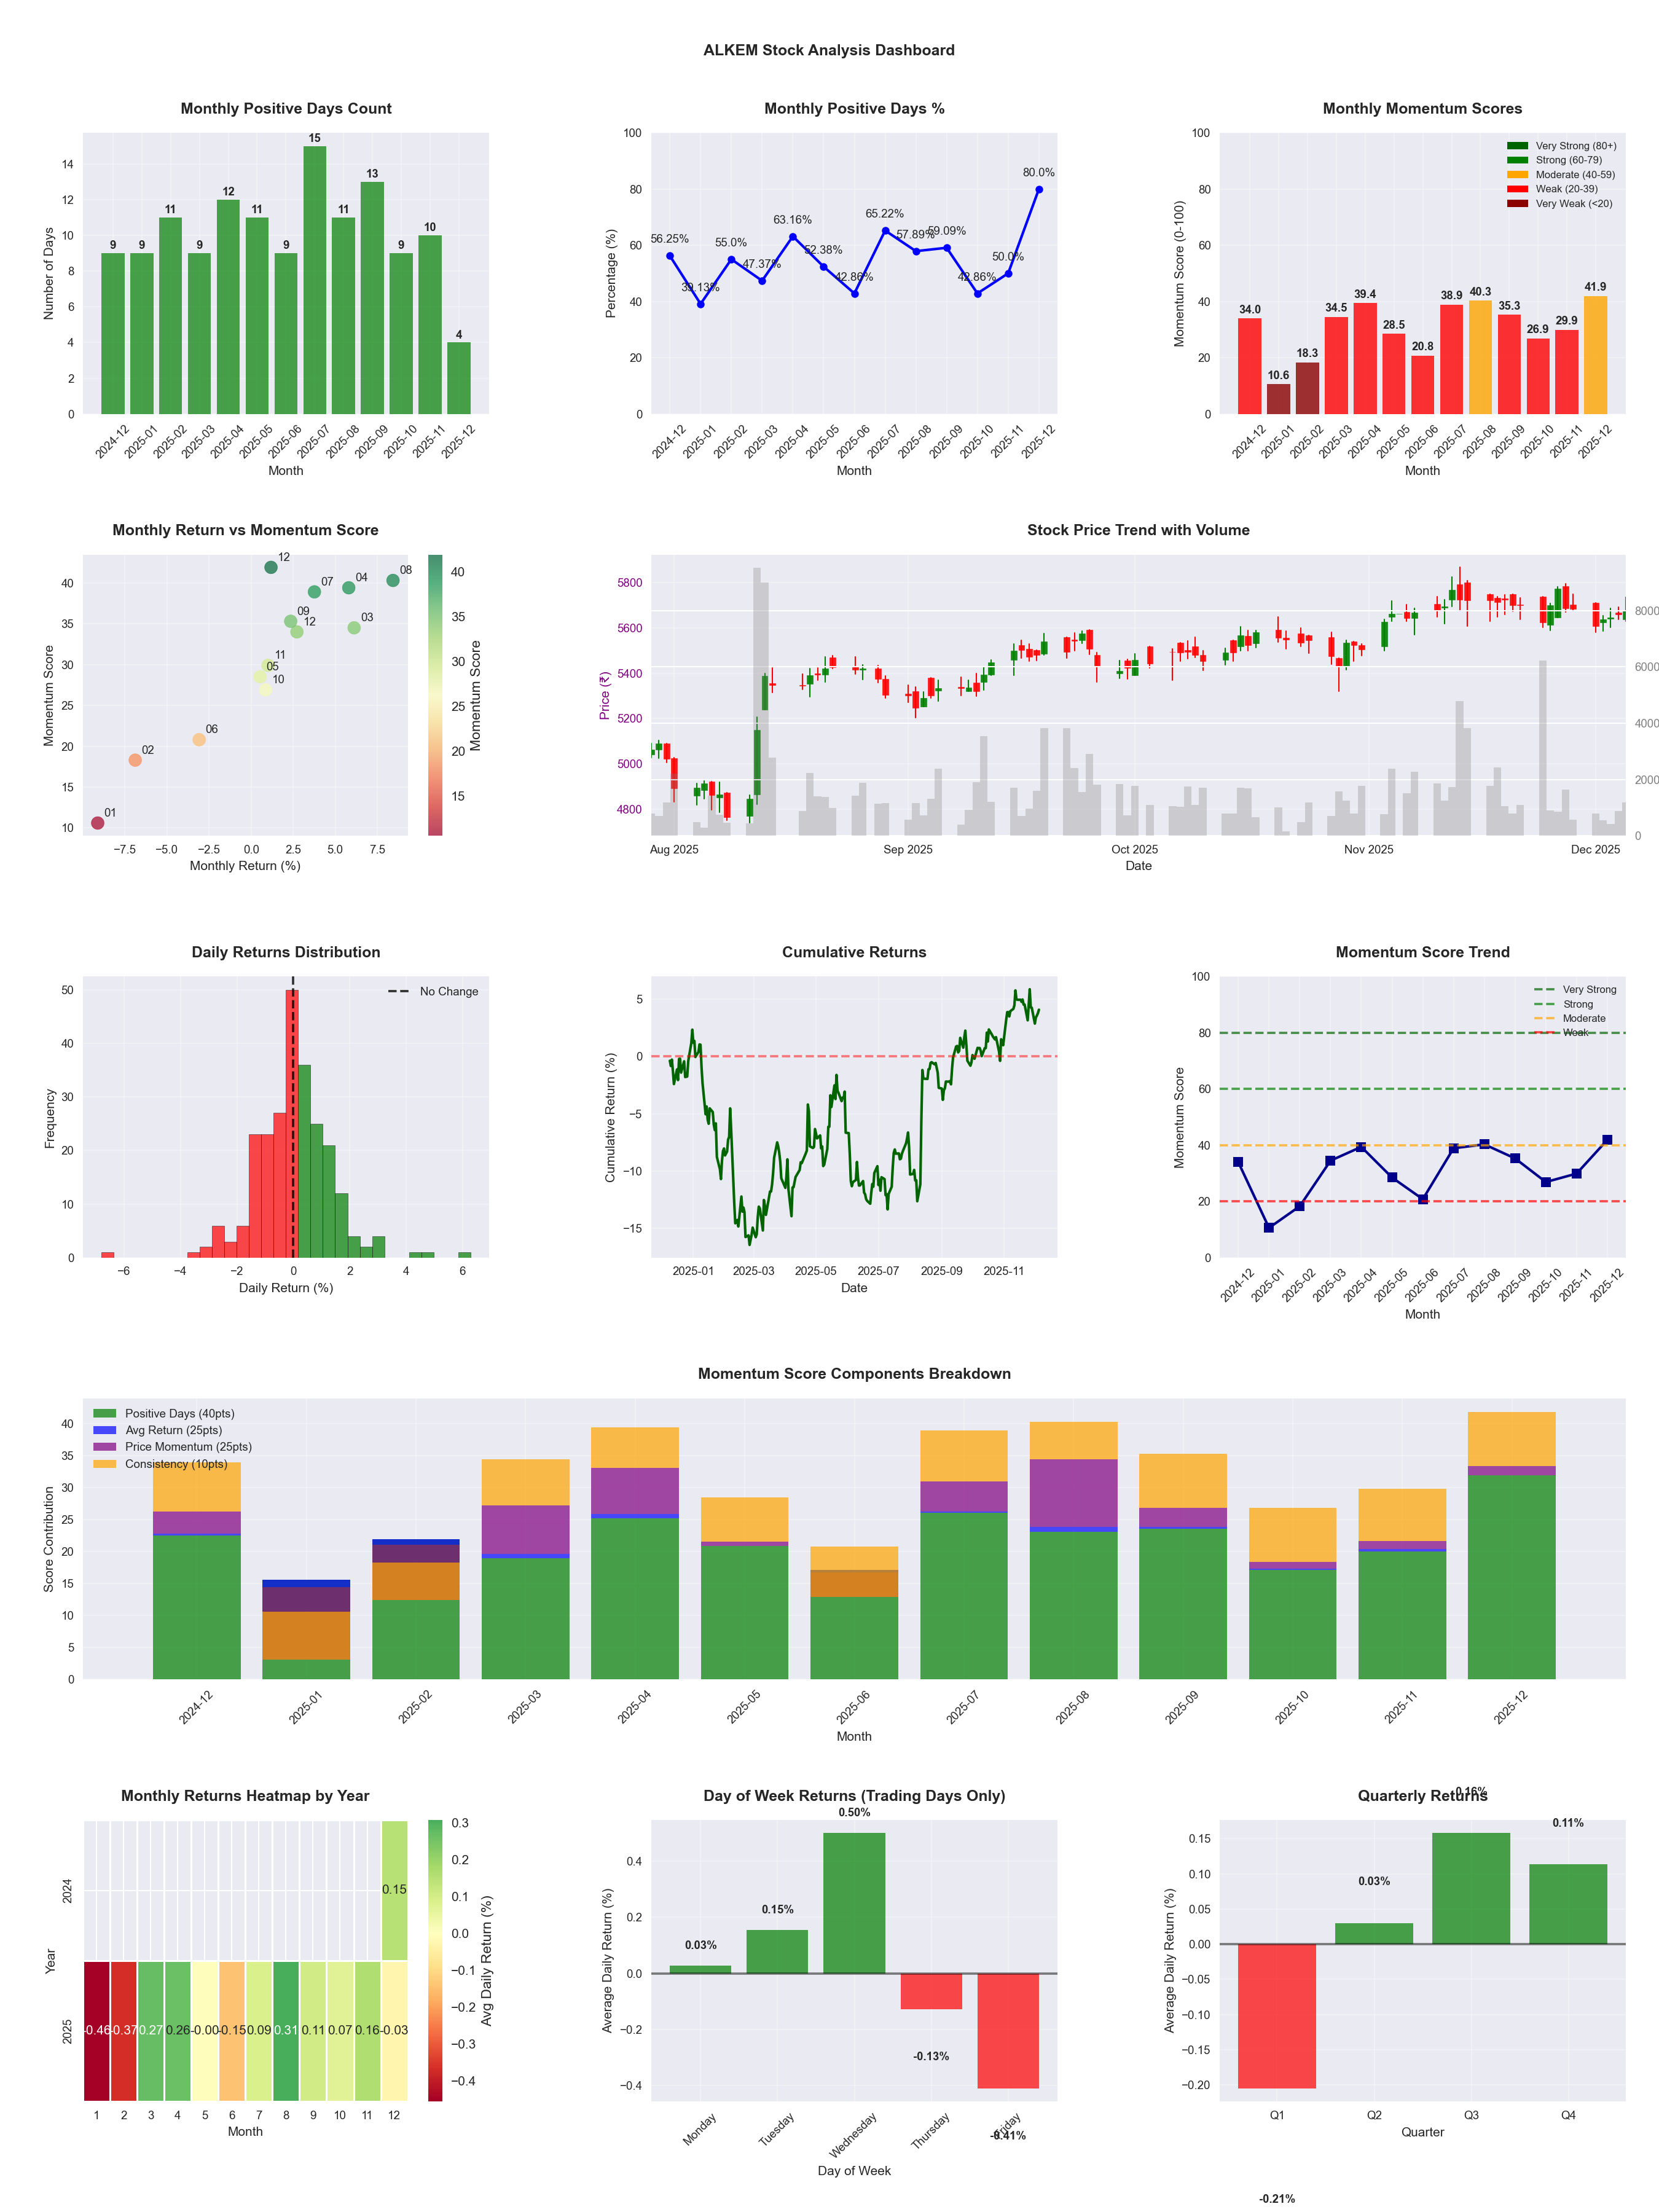
📊 Key Insights & Metrics
Symbol
📈 ALKEM
Date
📅 2026-04-11
Volatility
🟢 1.39%
Win Rate
⚠️ 52.2%
Avg Daily Return
📈 +0.06%
Max Drawdown
📉 -11.95%
IBD RS Score
📊 68.0
Average
Market Rank
#158
Best Month
🏆 2025-08
Worst Month
📉 2026-03
Best Months to Trade
📅 Apr, Aug, Nov
Best Days to Trade
📅 Wednesday, Tuesday
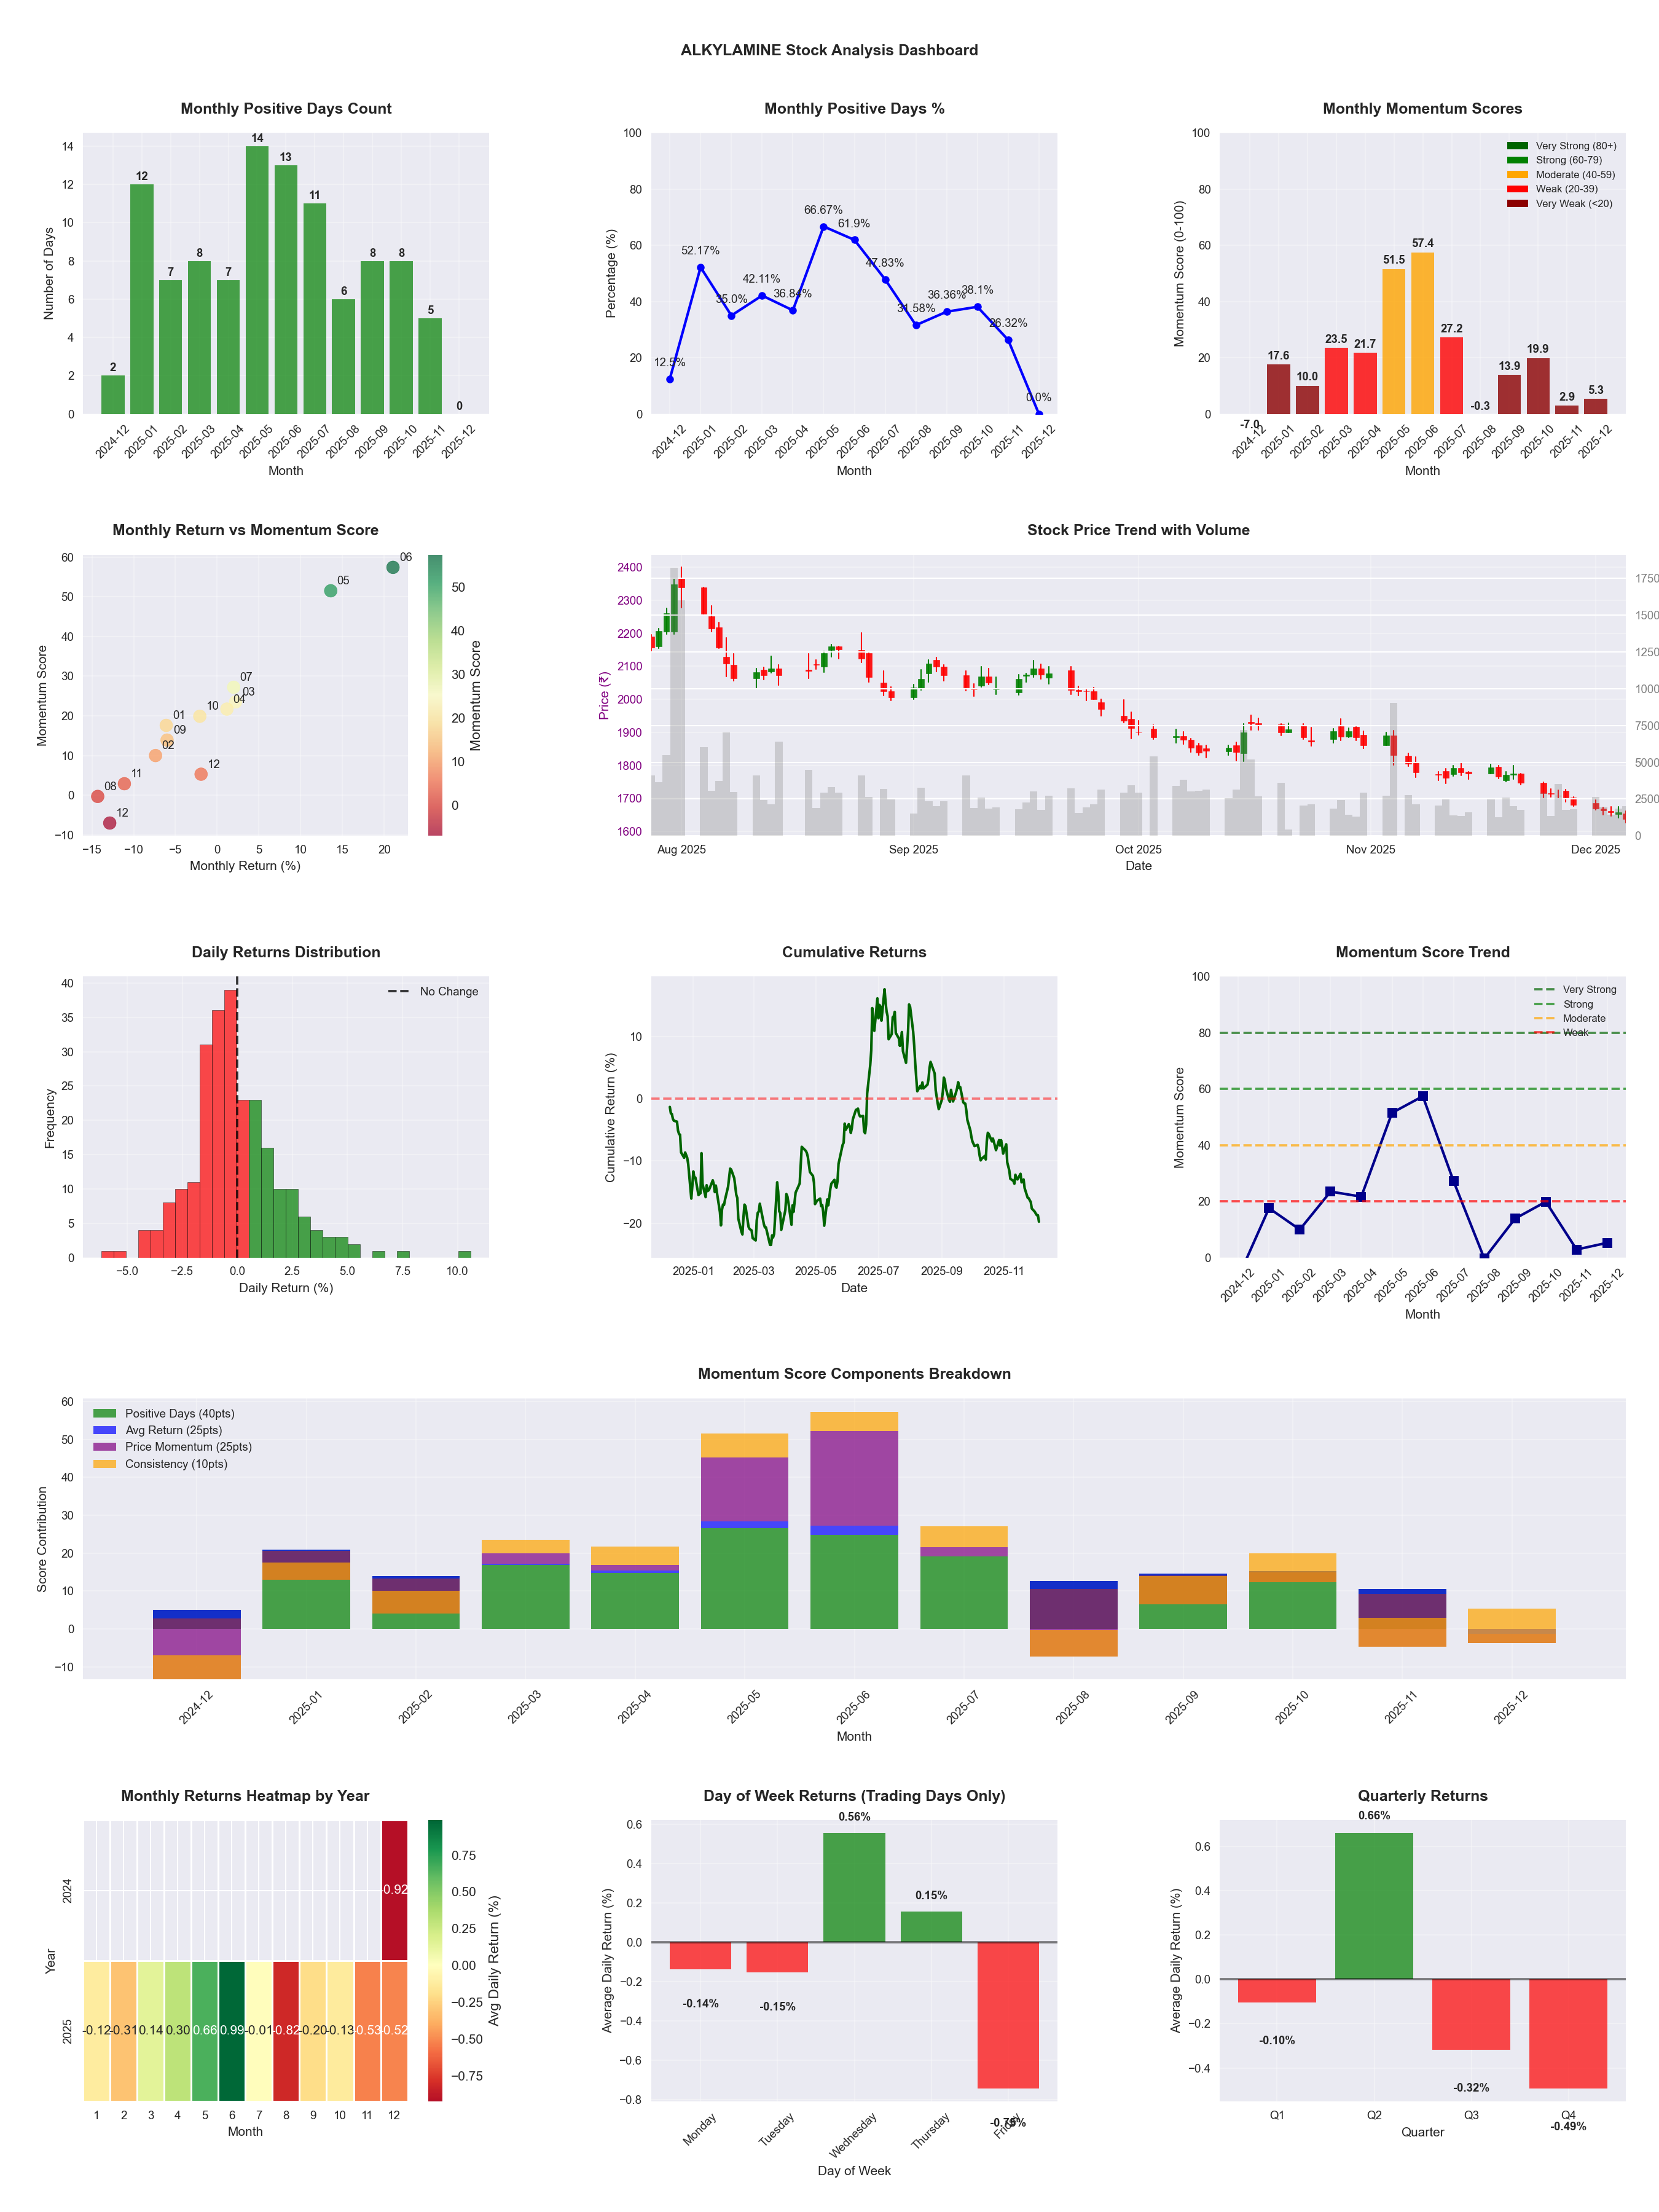
📊 Key Insights & Metrics
Symbol
📈 ALKYLAMINE
Date
📅 2026-04-11
Volatility
🟡 2.19%
Risk Profile
⚠️ suitable for aggressive investors
Win Rate
⚠️ 41.5%
Avg Daily Return
📉 -0.06%
Max Drawdown
📉 -48.64%
IBD RS Score
📊 11.6
Weak
Market Rank
#436
Best Month
🏆 2025-06
Best Months to Trade
📅 Jun, May, Apr
Best Days to Trade
📅 Wednesday, Tuesday
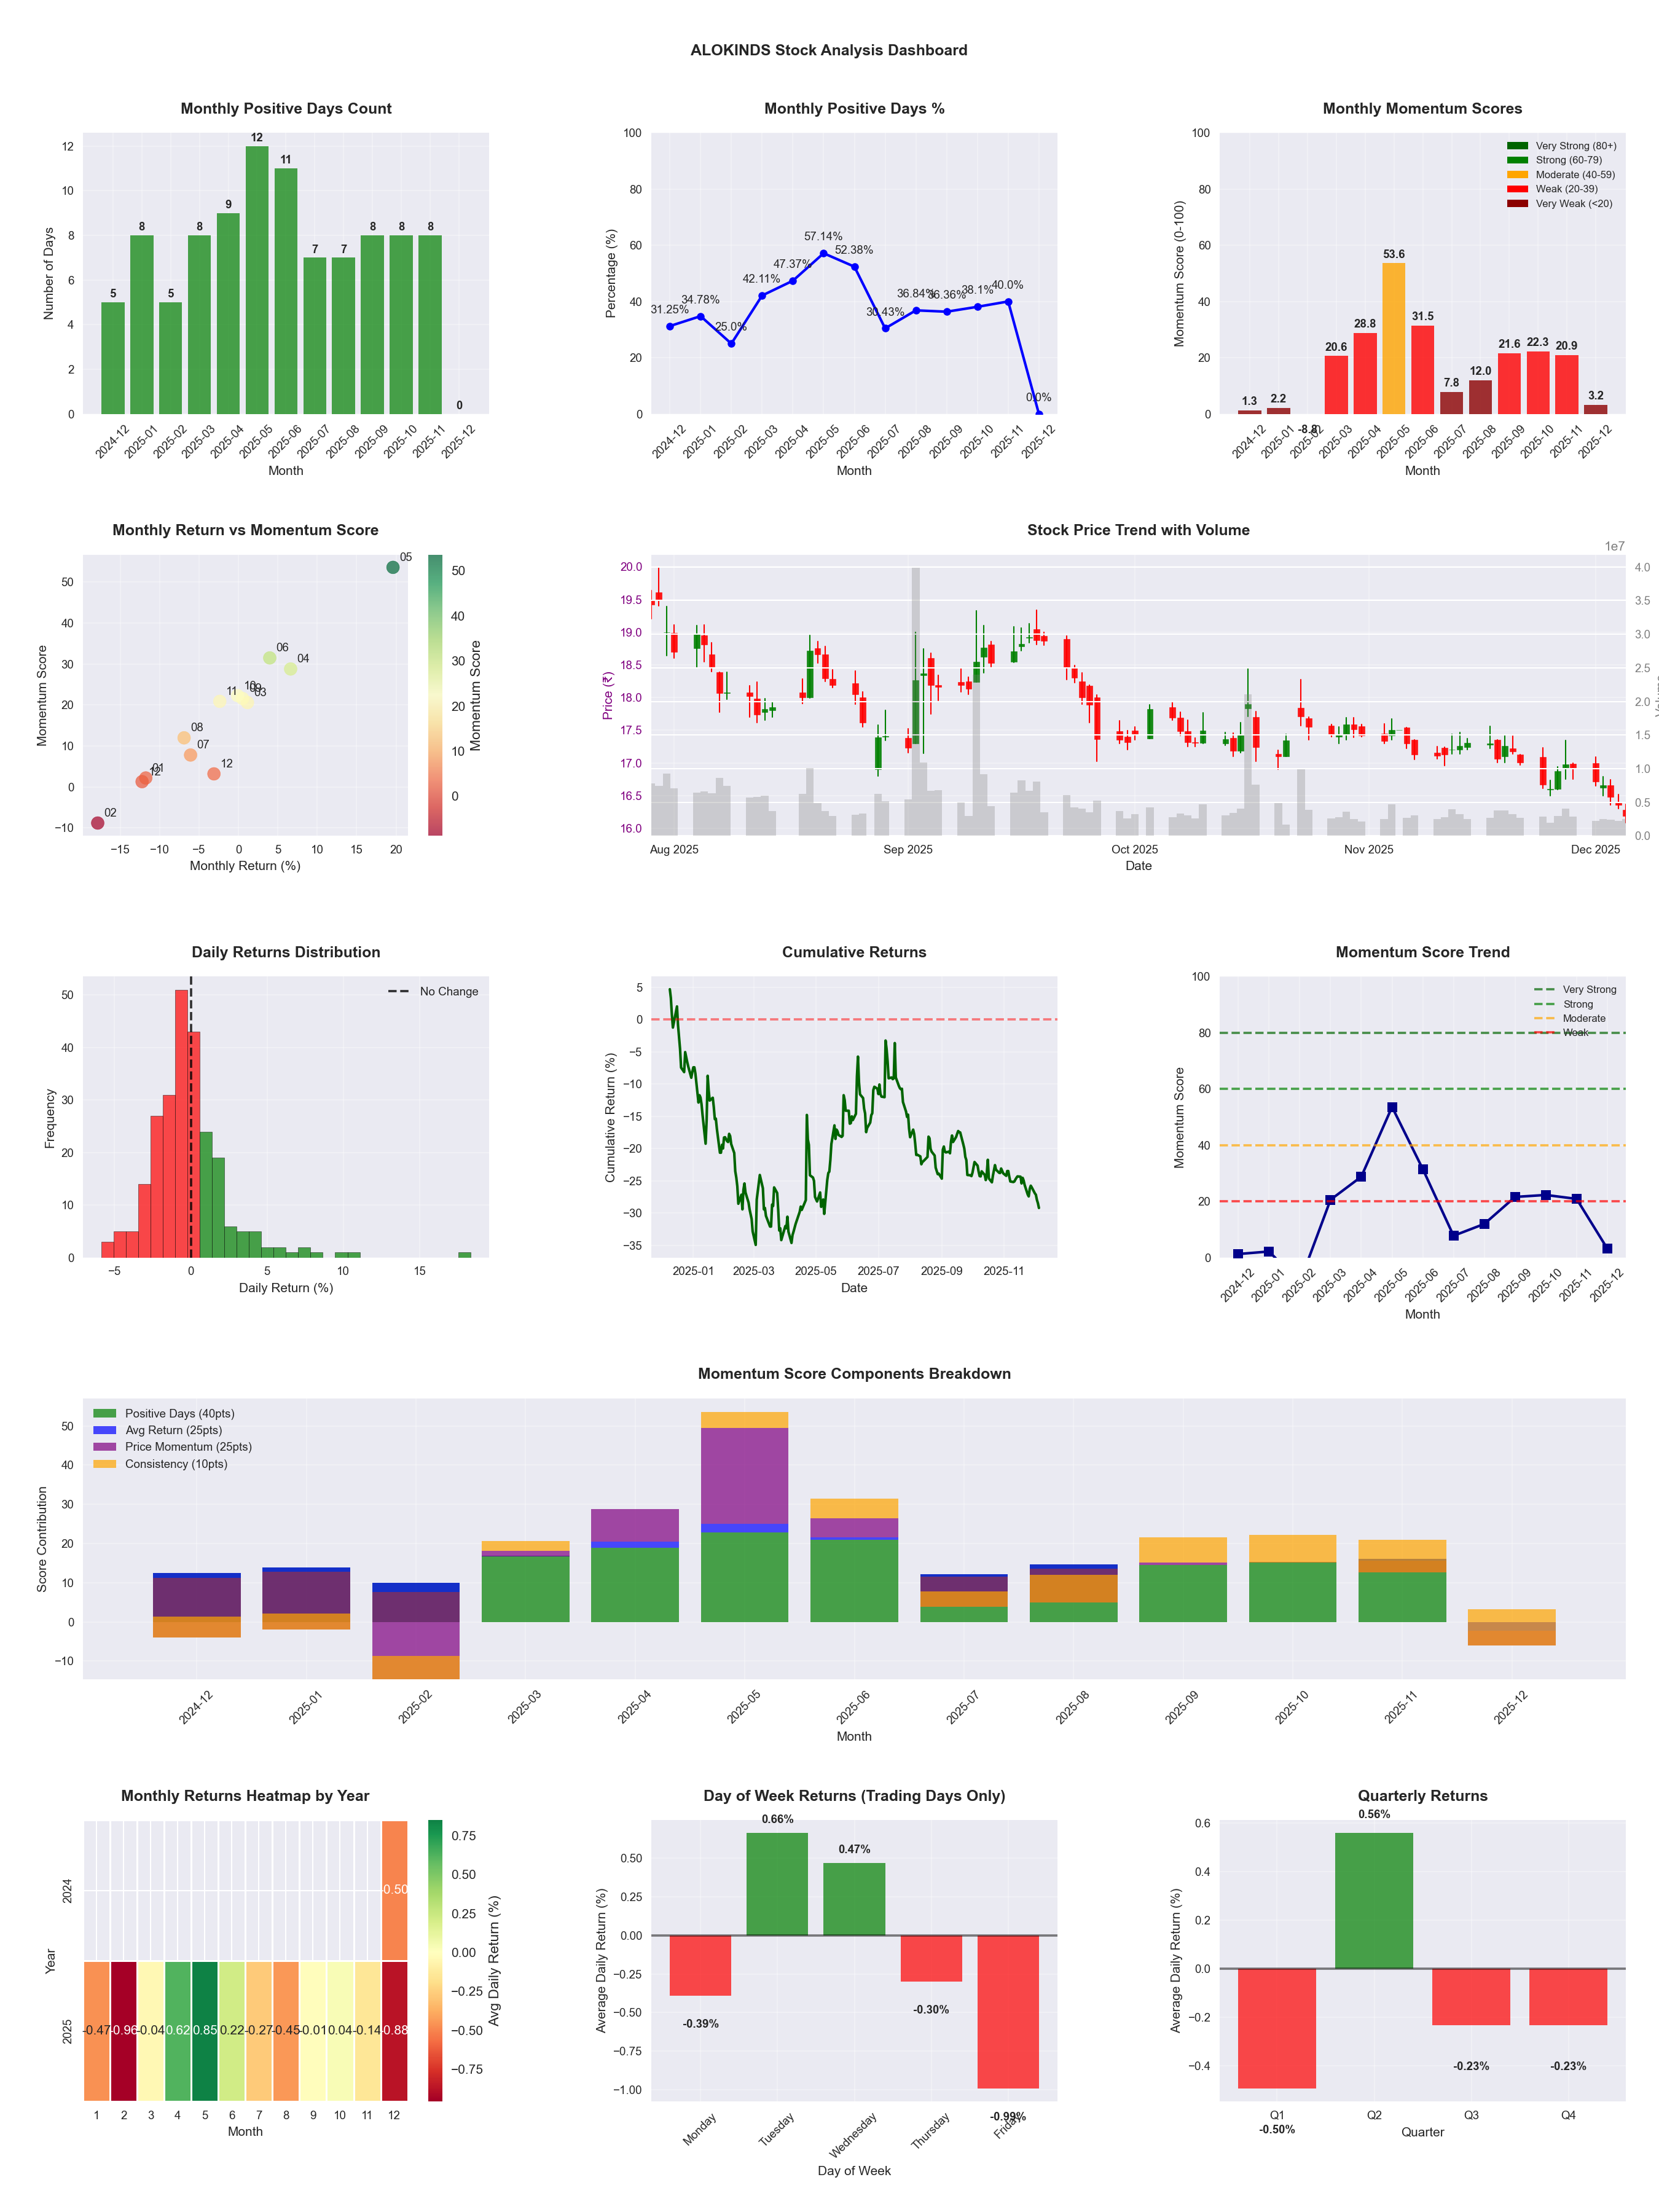
📊 Key Insights & Metrics
Symbol
📈 ALOKINDS
Date
📅 2026-04-11
Volatility
🟡 2.67%
Risk Profile
⚠️ suitable for aggressive investors
Win Rate
❌ 37.8%
Avg Daily Return
📉 -0.01%
Max Drawdown
📉 -49.48%
IBD RS Score
📊 17.8
Weak
Market Rank
#405
Best Month
🏆 2025-05
Best Months to Trade
📅 Apr, May, Jun
Best Days to Trade
📅 Tuesday, Wednesday
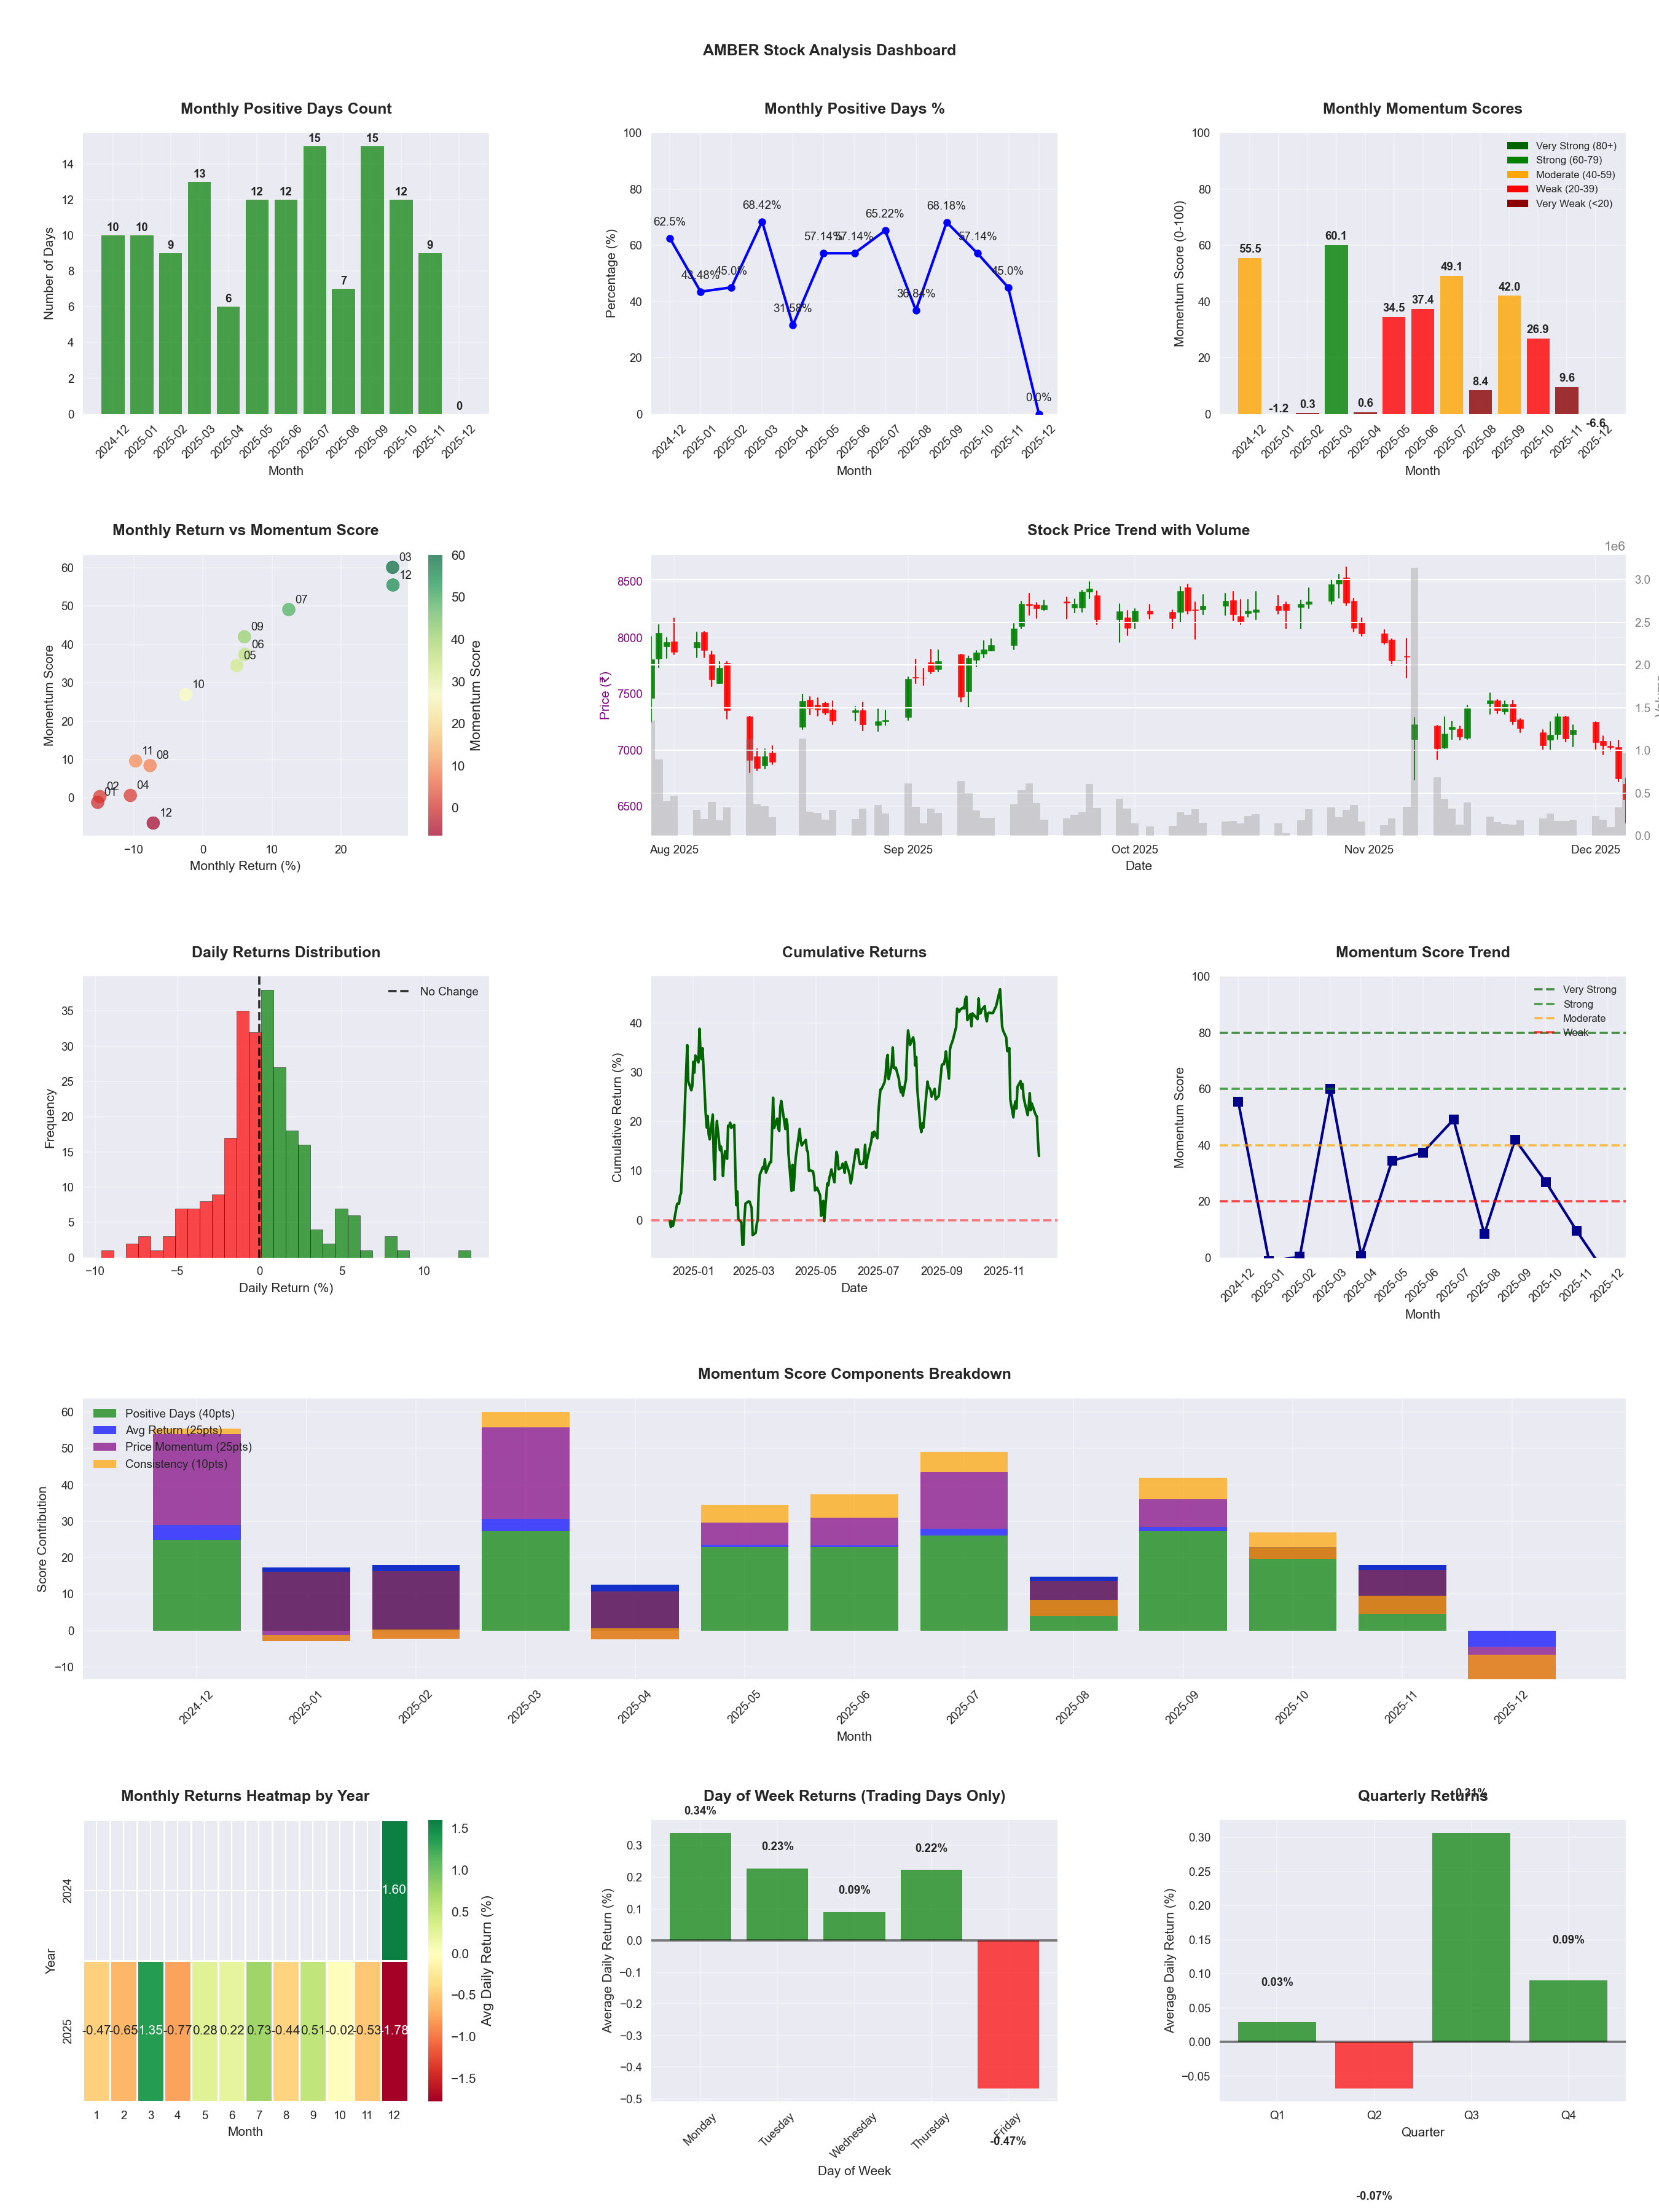
📊 Key Insights & Metrics
Symbol
📈 AMBER
Date
📅 2026-04-11
Volatility
🟡 2.45%
Risk Profile
⚠️ suitable for aggressive investors
Win Rate
⚠️ 52.4%
Avg Daily Return
📈 +0.07%
Max Drawdown
📉 -35.38%
IBD RS Score
📊 68.6
Average
Market Rank
#155
Best Month
🏆 2026-02
Best Months to Trade
📅 Feb, Jul, Sep
Best Days to Trade
📅 Tuesday, Wednesday
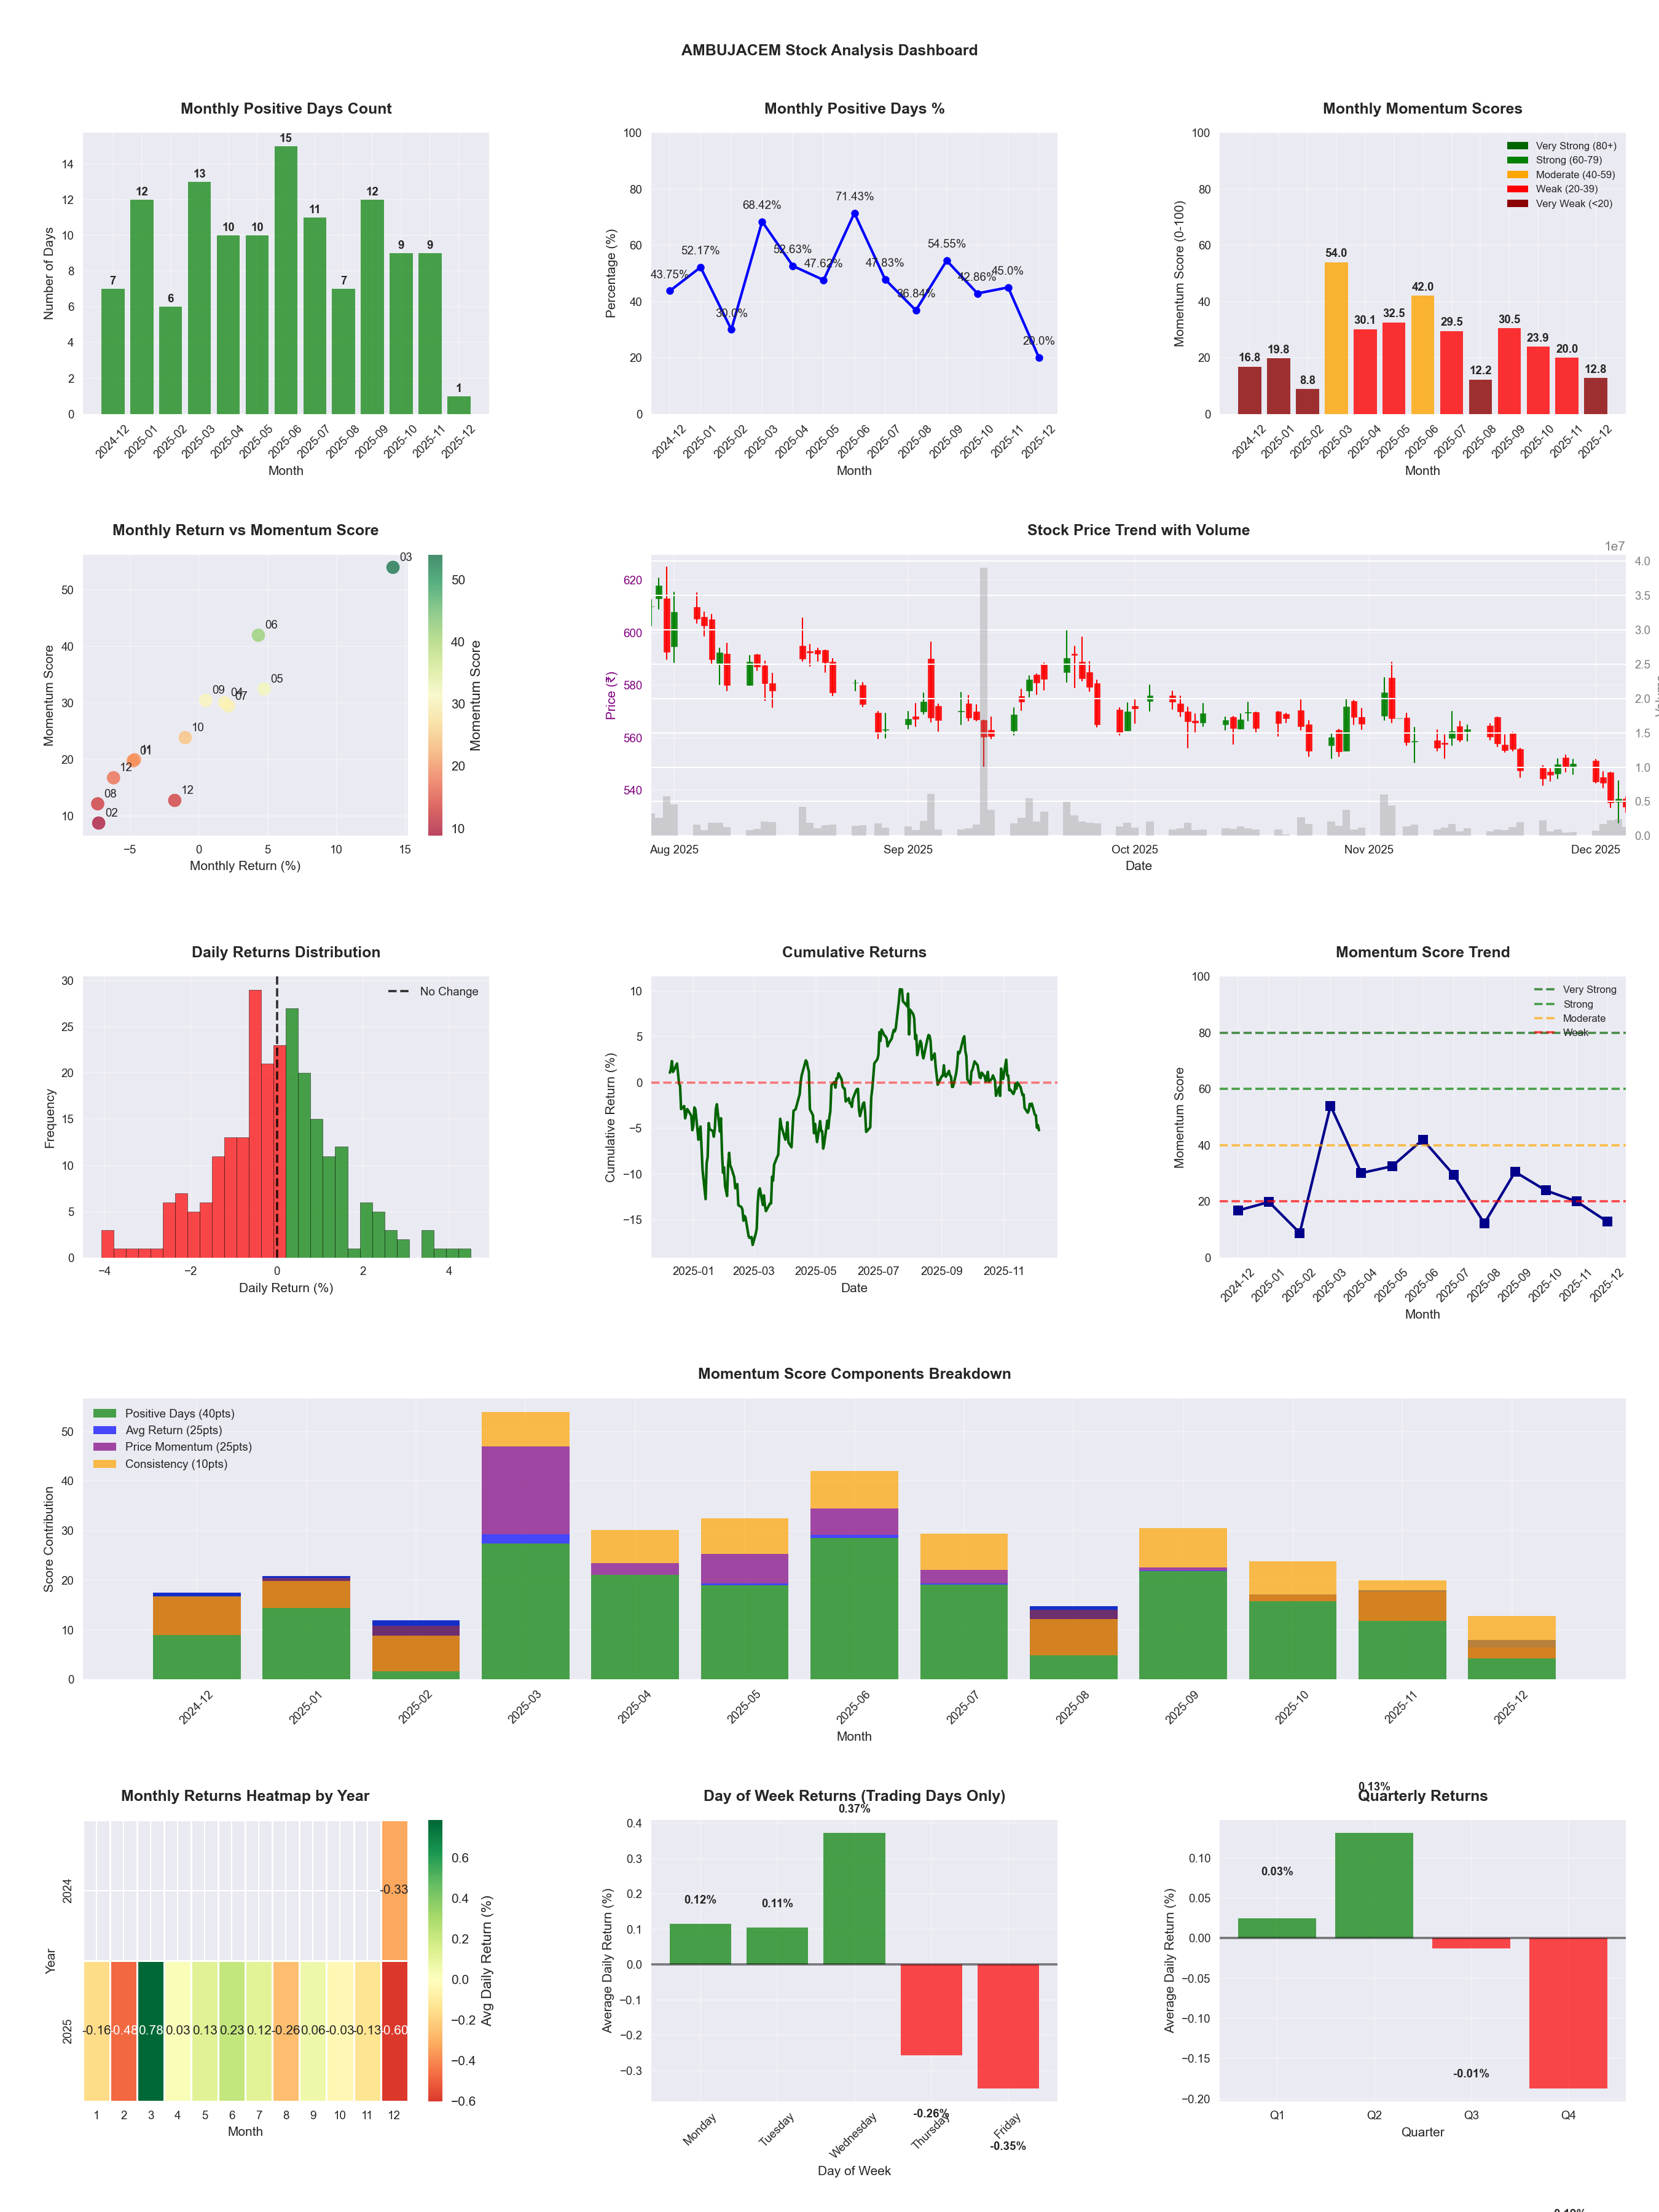
📊 Key Insights & Metrics
Symbol
📈 AMBUJACEM
Date
📅 2026-04-11
Volatility
🟡 1.62%
Win Rate
⚠️ 49.2%
Avg Daily Return
📉 -0.07%
Max Drawdown
📉 -36.29%
IBD RS Score
📊 13.0
Weak
Market Rank
#429
Best Month
🏆 2025-06
Best Months to Trade
📅 Apr, Jun, May
Best Days to Trade
📅 Wednesday, Monday
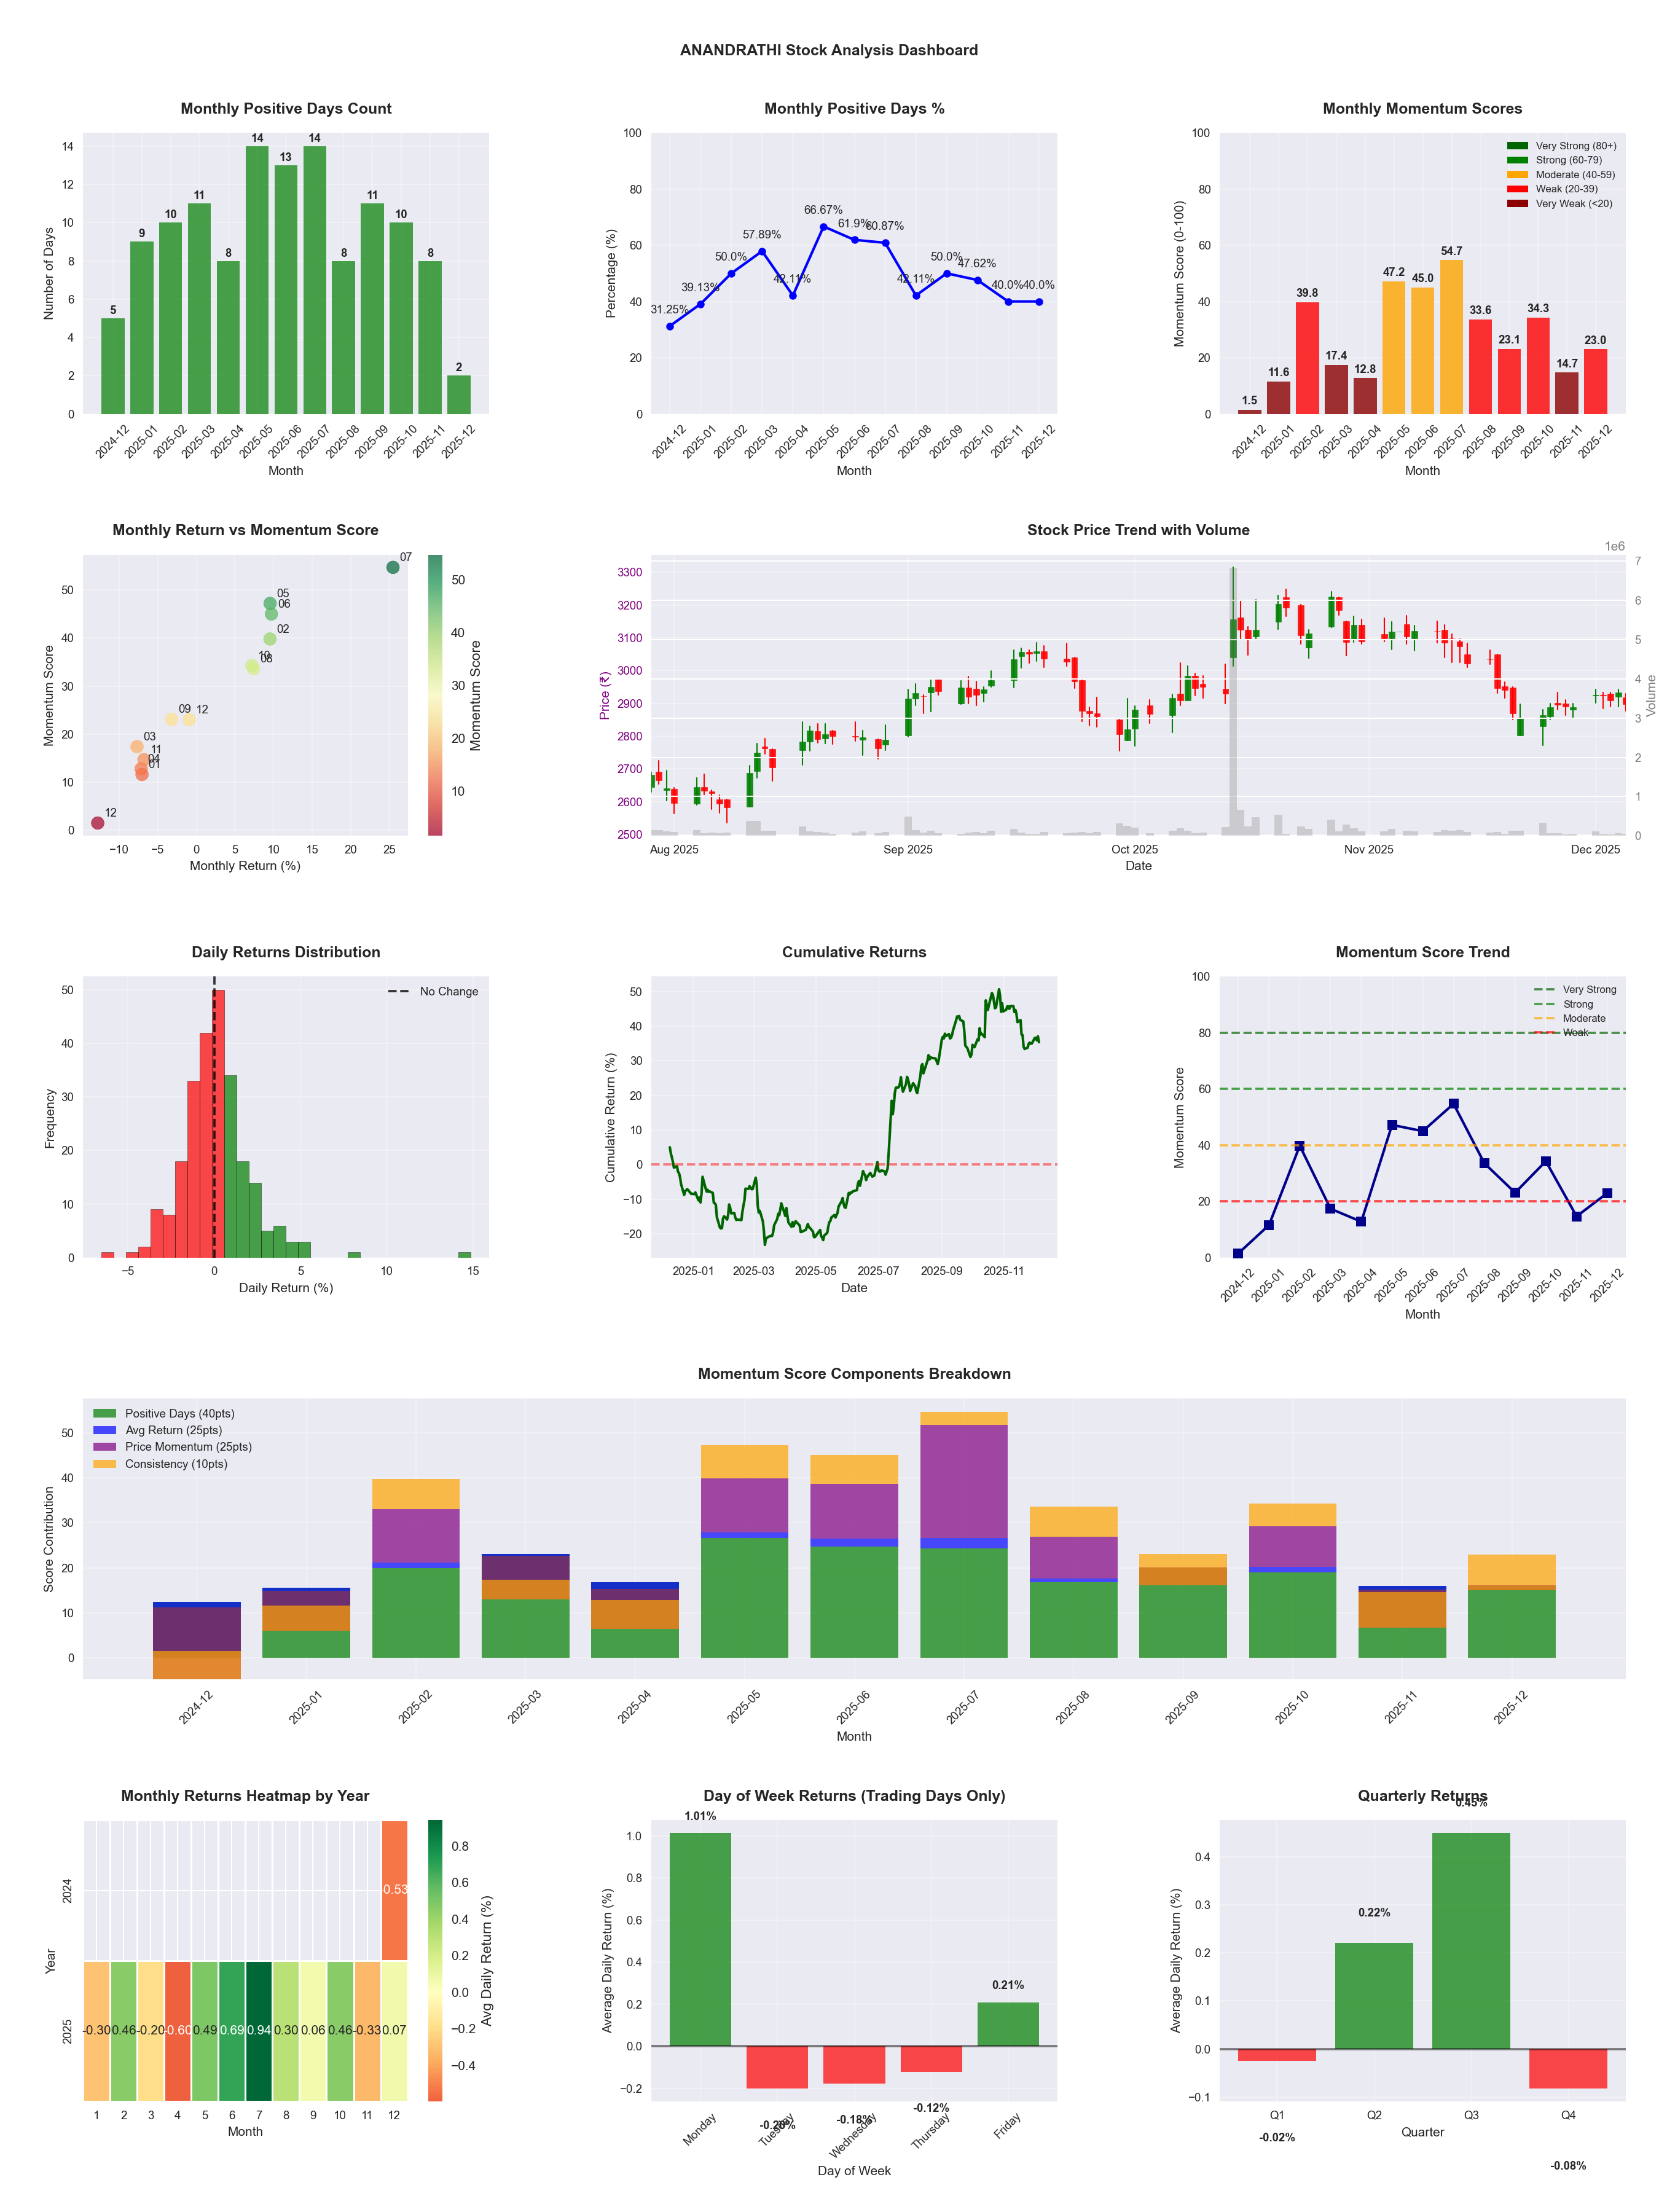
📊 Key Insights & Metrics
Symbol
📈 ANANDRATHI
Date
📅 2026-04-11
Volatility
🟡 1.80%
Win Rate
⚠️ 55.5%
Avg Daily Return
📈 +0.30%
Max Drawdown
📉 -11.98%
IBD RS Score
📊 97.4
Leader
Market Rank
#13
Best Month
🏆 2026-04
Worst Month
📉 2026-01
Best Months to Trade
📅 Jul, Jun, Apr
Best Days to Trade
📅 Monday, Wednesday
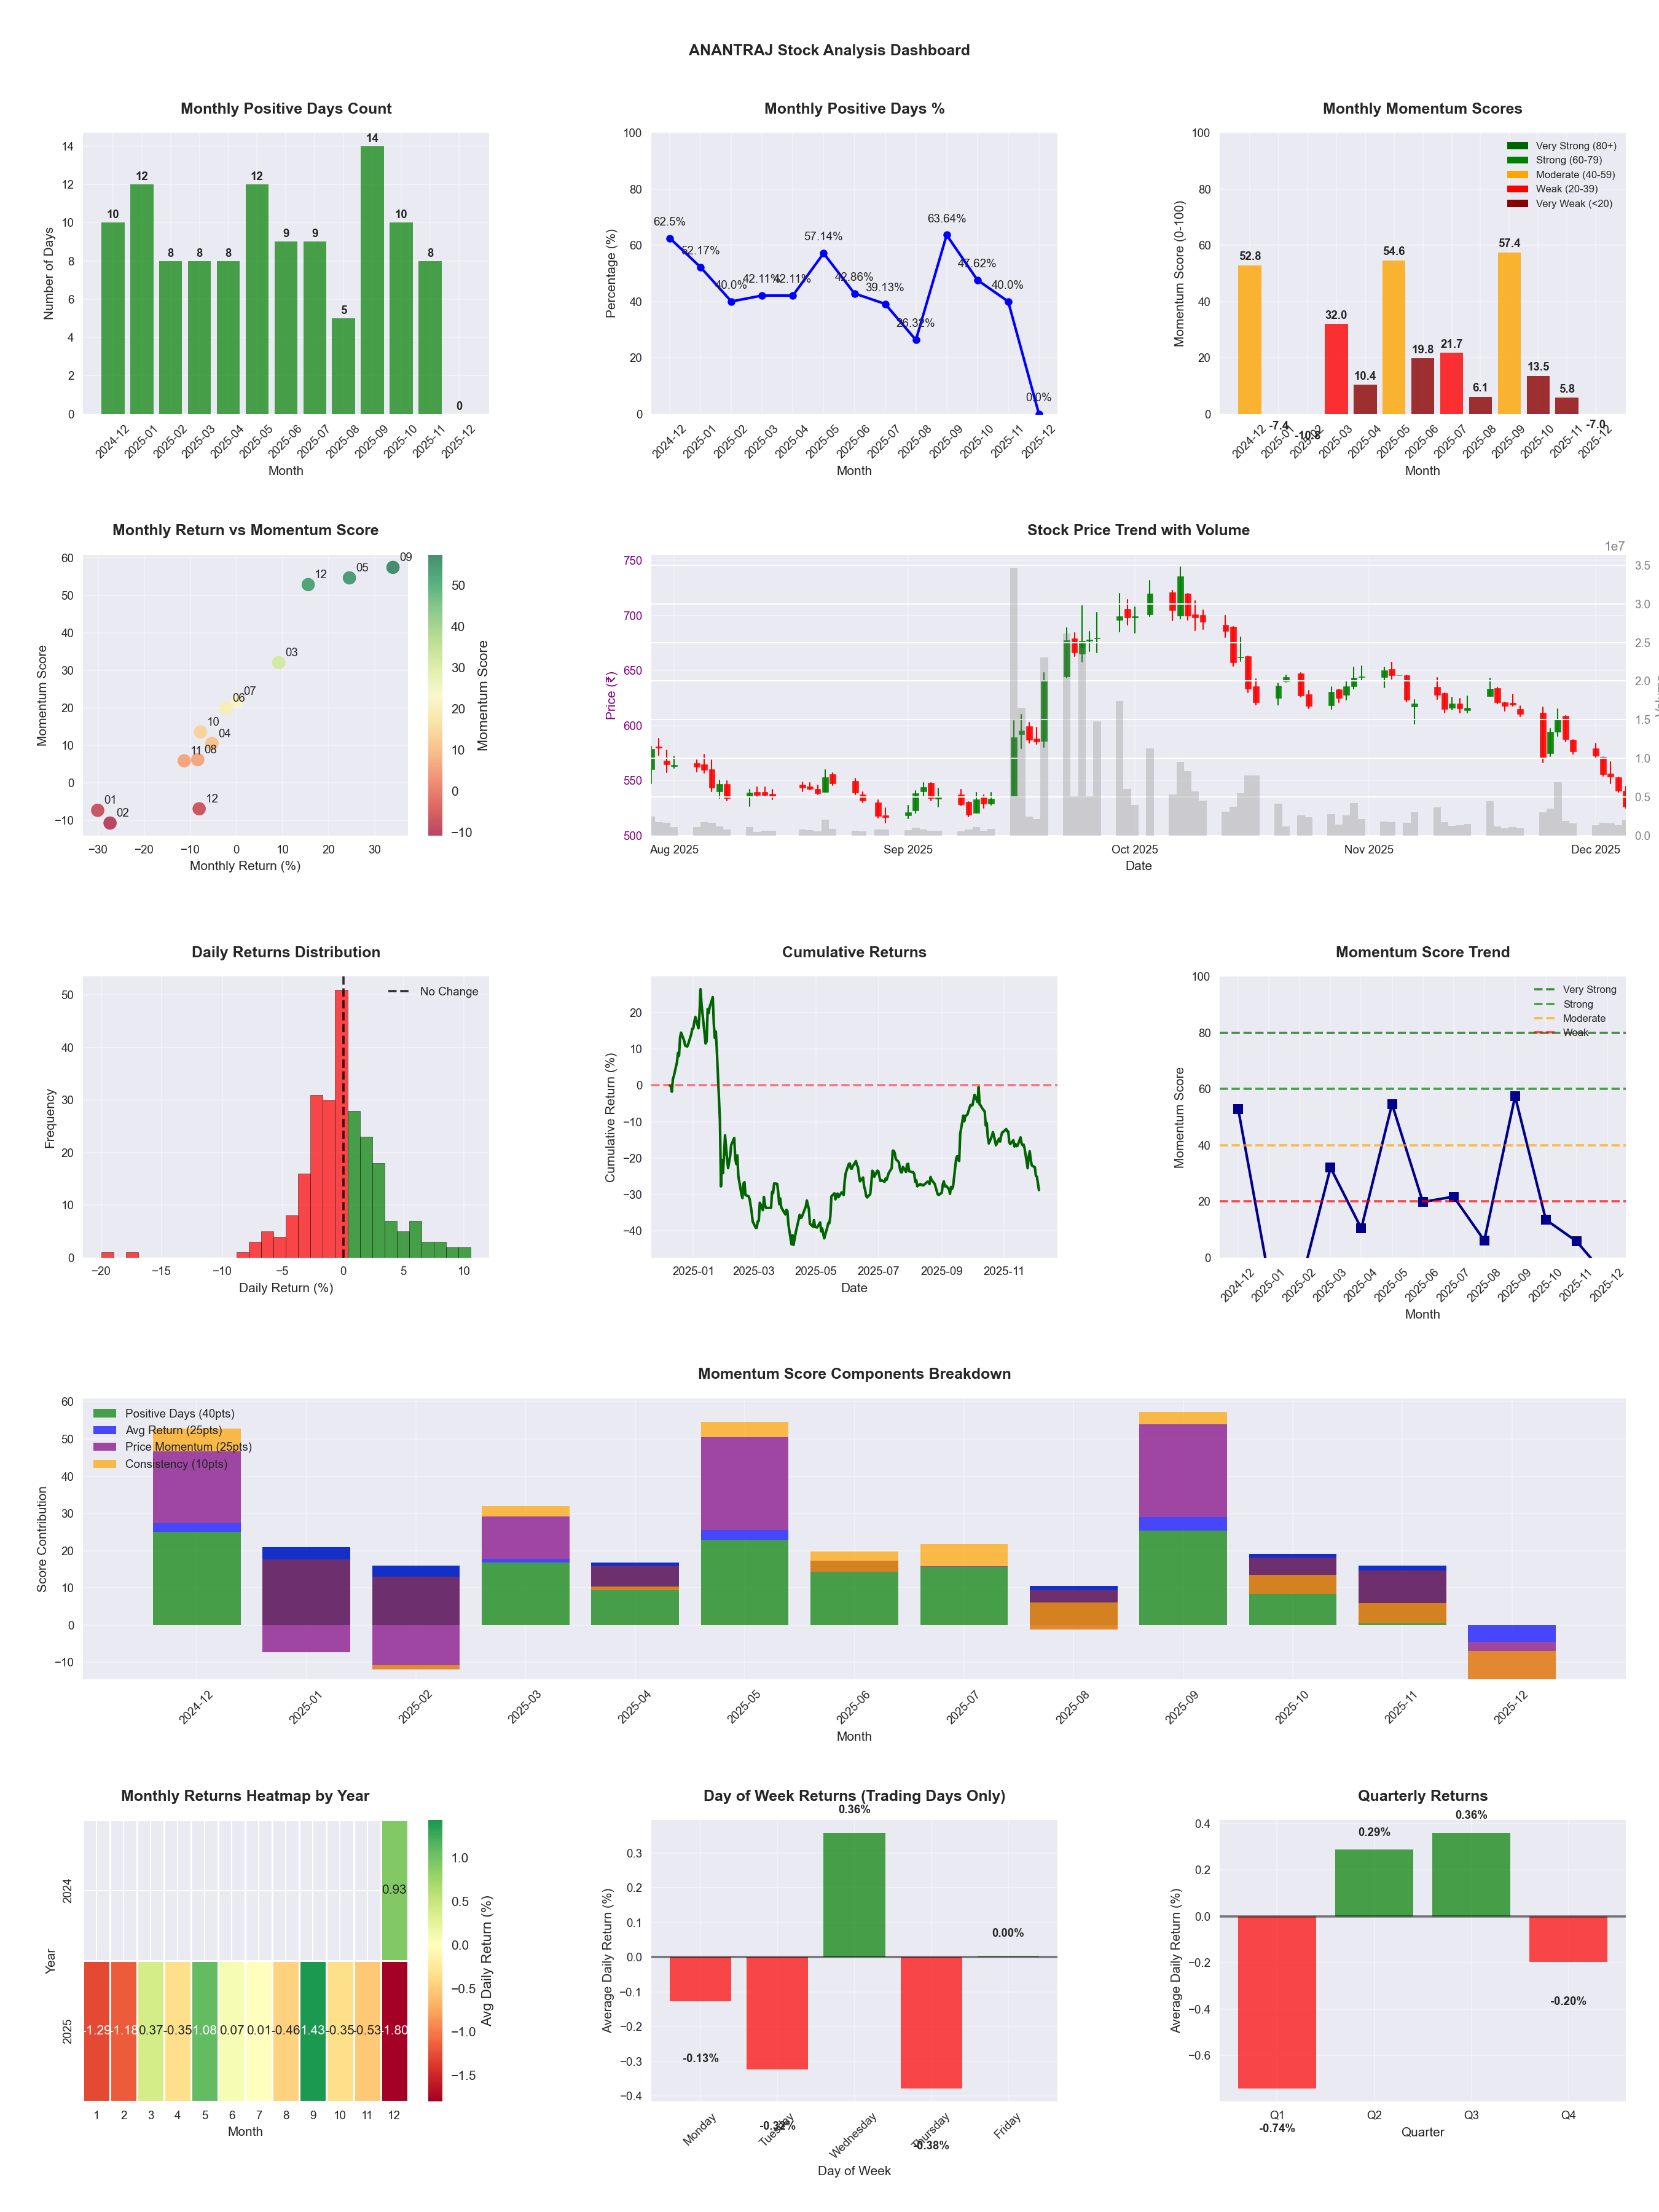
📊 Key Insights & Metrics
Symbol
📈 ANANTRAJ
Date
📅 2026-04-11
Volatility
🟡 2.86%
Risk Profile
⚠️ suitable for aggressive investors
Win Rate
⚠️ 45.5%
Avg Daily Return
📈 +0.08%
Max Drawdown
📉 -44.85%
IBD RS Score
📊 29.2
Weak
Market Rank
#349
Best Month
🏆 2025-09
Best Months to Trade
📅 Sep, Apr, May
Best Days to Trade
📅 Monday, Tuesday
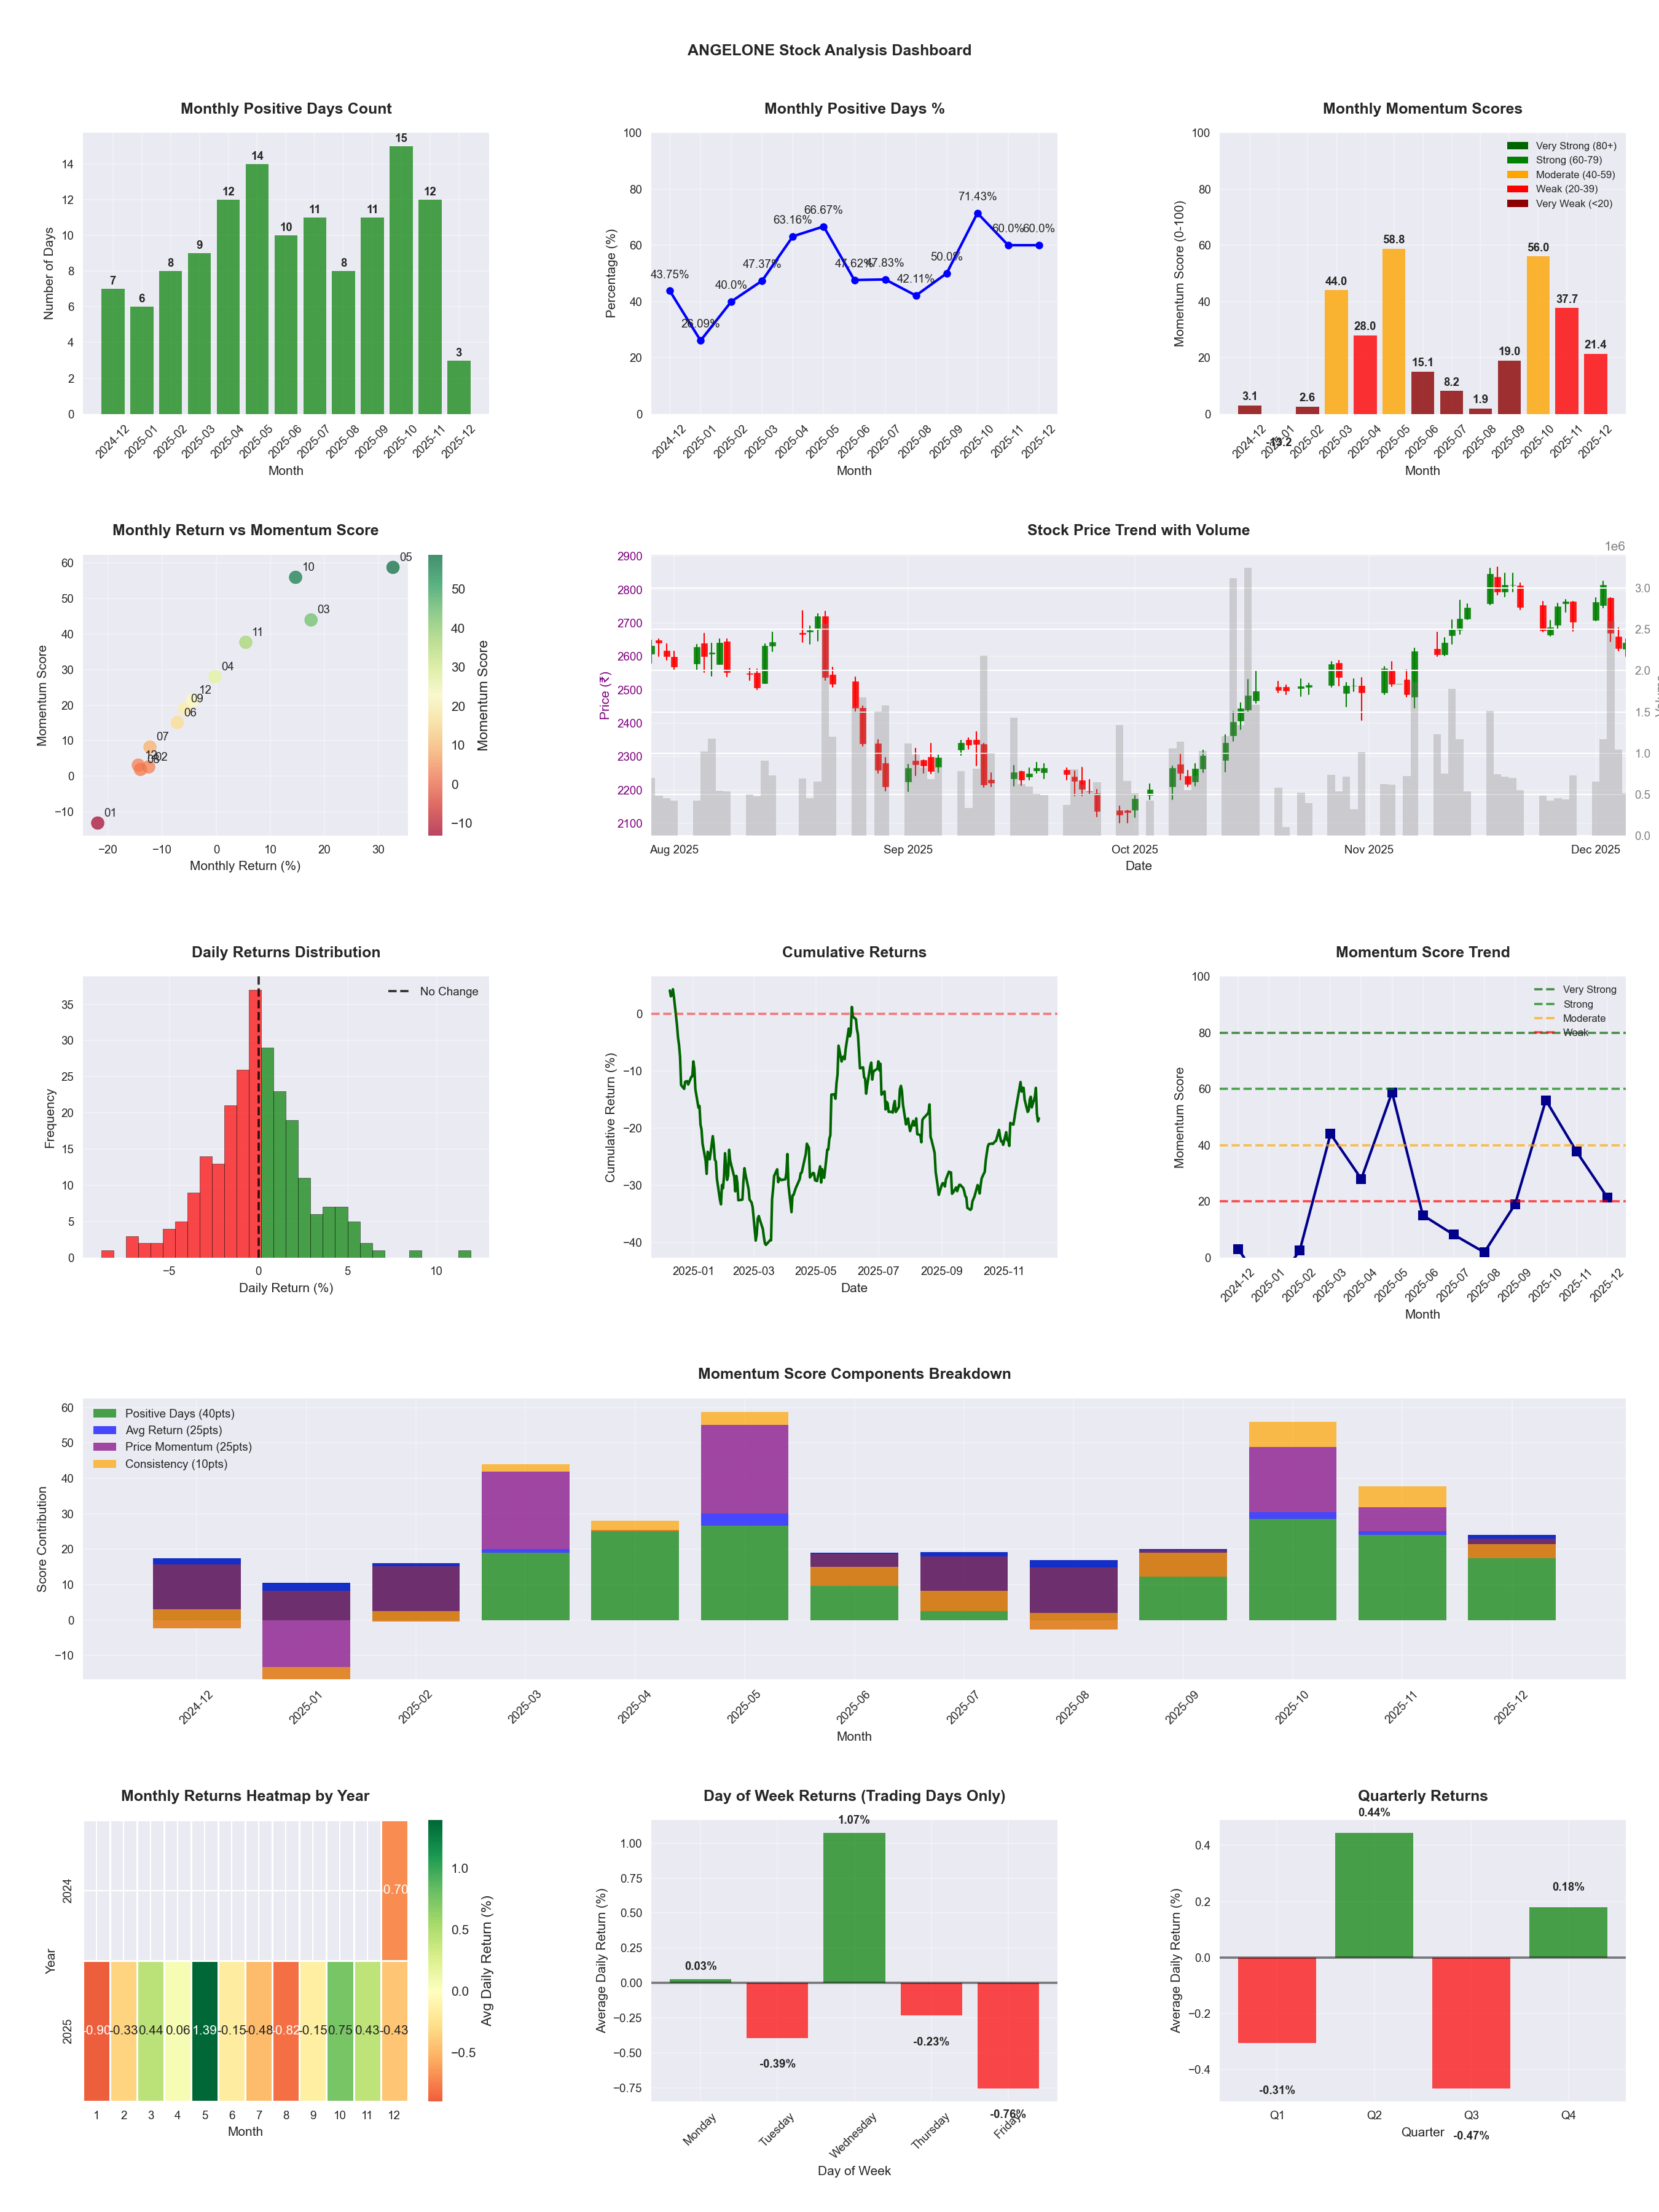
📊 Key Insights & Metrics
Symbol
📈 ANGELONE
Date
📅 2026-04-11
Volatility
🟡 2.63%
Risk Profile
⚠️ suitable for aggressive investors
Win Rate
⚠️ 51.2%
Avg Daily Return
📈 +0.13%
Max Drawdown
📉 -35.05%
IBD RS Score
📊 87.6
Strong
Market Rank
#61
Best Month
🏆 2026-04
Best Months to Trade
📅 May, Apr, Oct
Best Days to Trade
📅 Wednesday, Monday
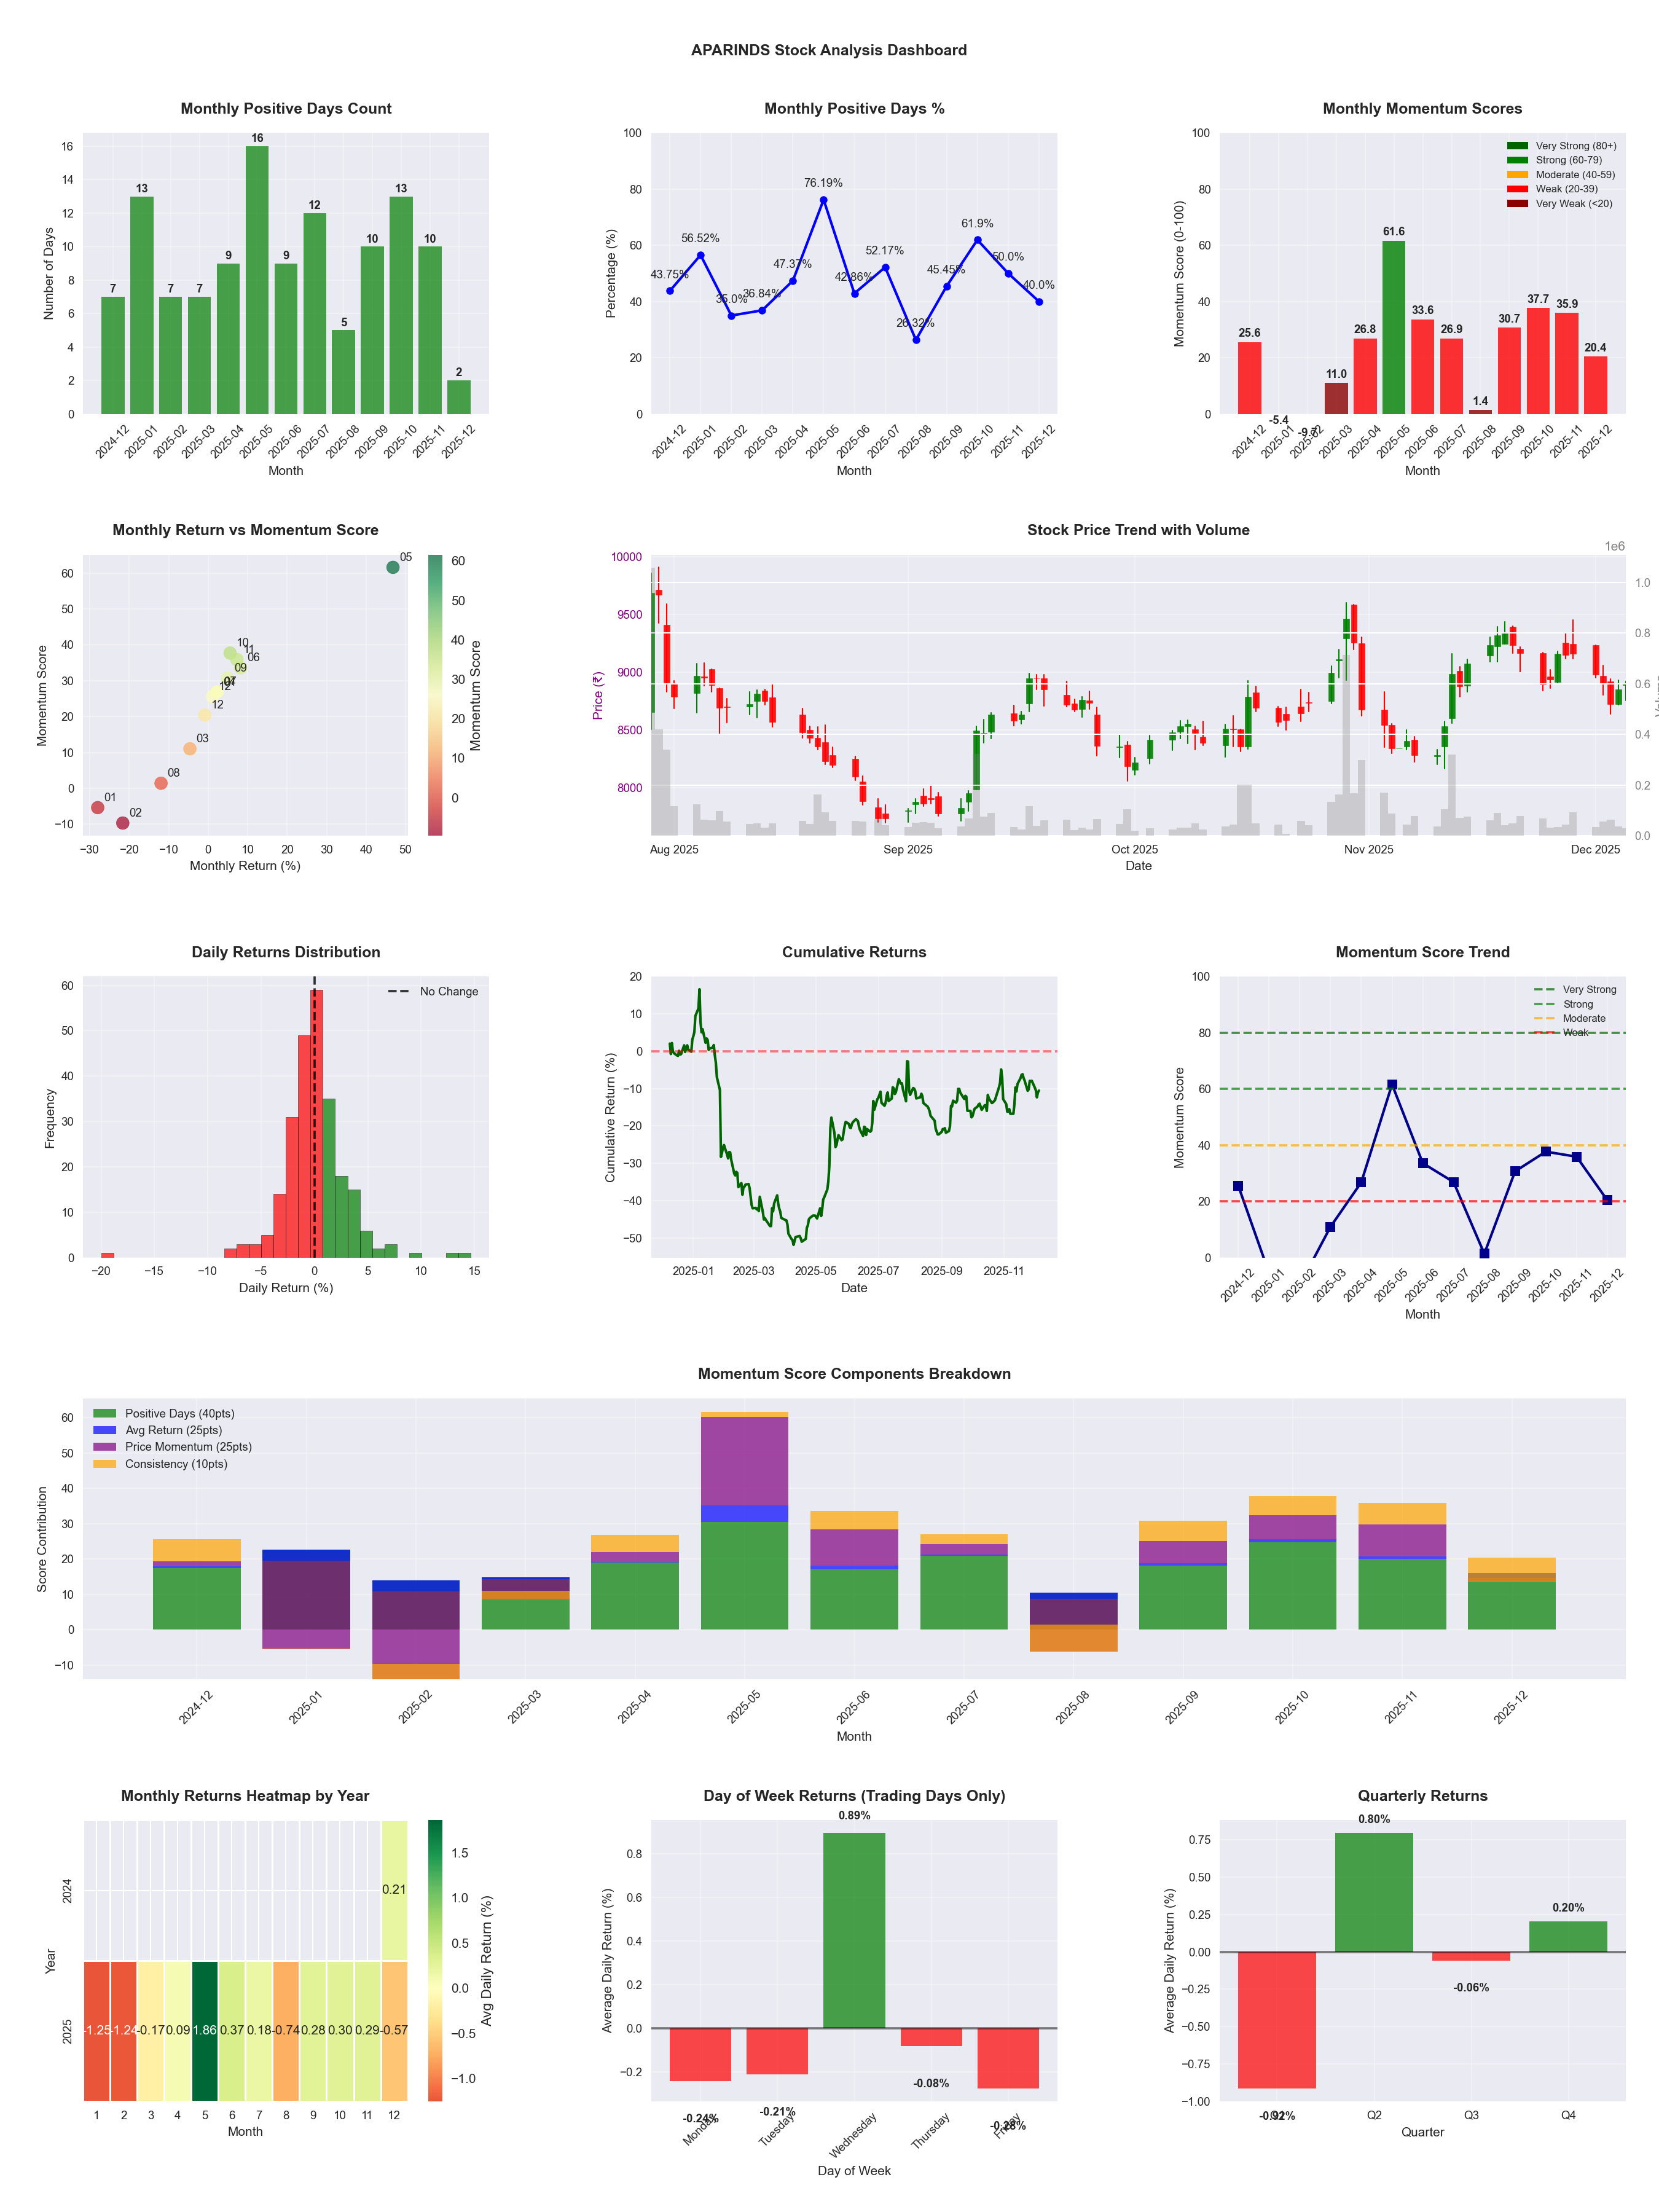
📊 Key Insights & Metrics
Symbol
📈 APARINDS
Date
📅 2026-04-11
Volatility
🟡 2.97%
Risk Profile
⚠️ suitable for aggressive investors
Win Rate
⚠️ 52.9%
Avg Daily Return
📈 +0.38%
Max Drawdown
📉 -28.05%
IBD RS Score
📊 98.2
Leader
Market Rank
#9
Best Month
🏆 2026-04
Worst Month
📉 2025-08
Best Months to Trade
📅 May, Feb, Apr
Best Days to Trade
📅 Tuesday, Thursday
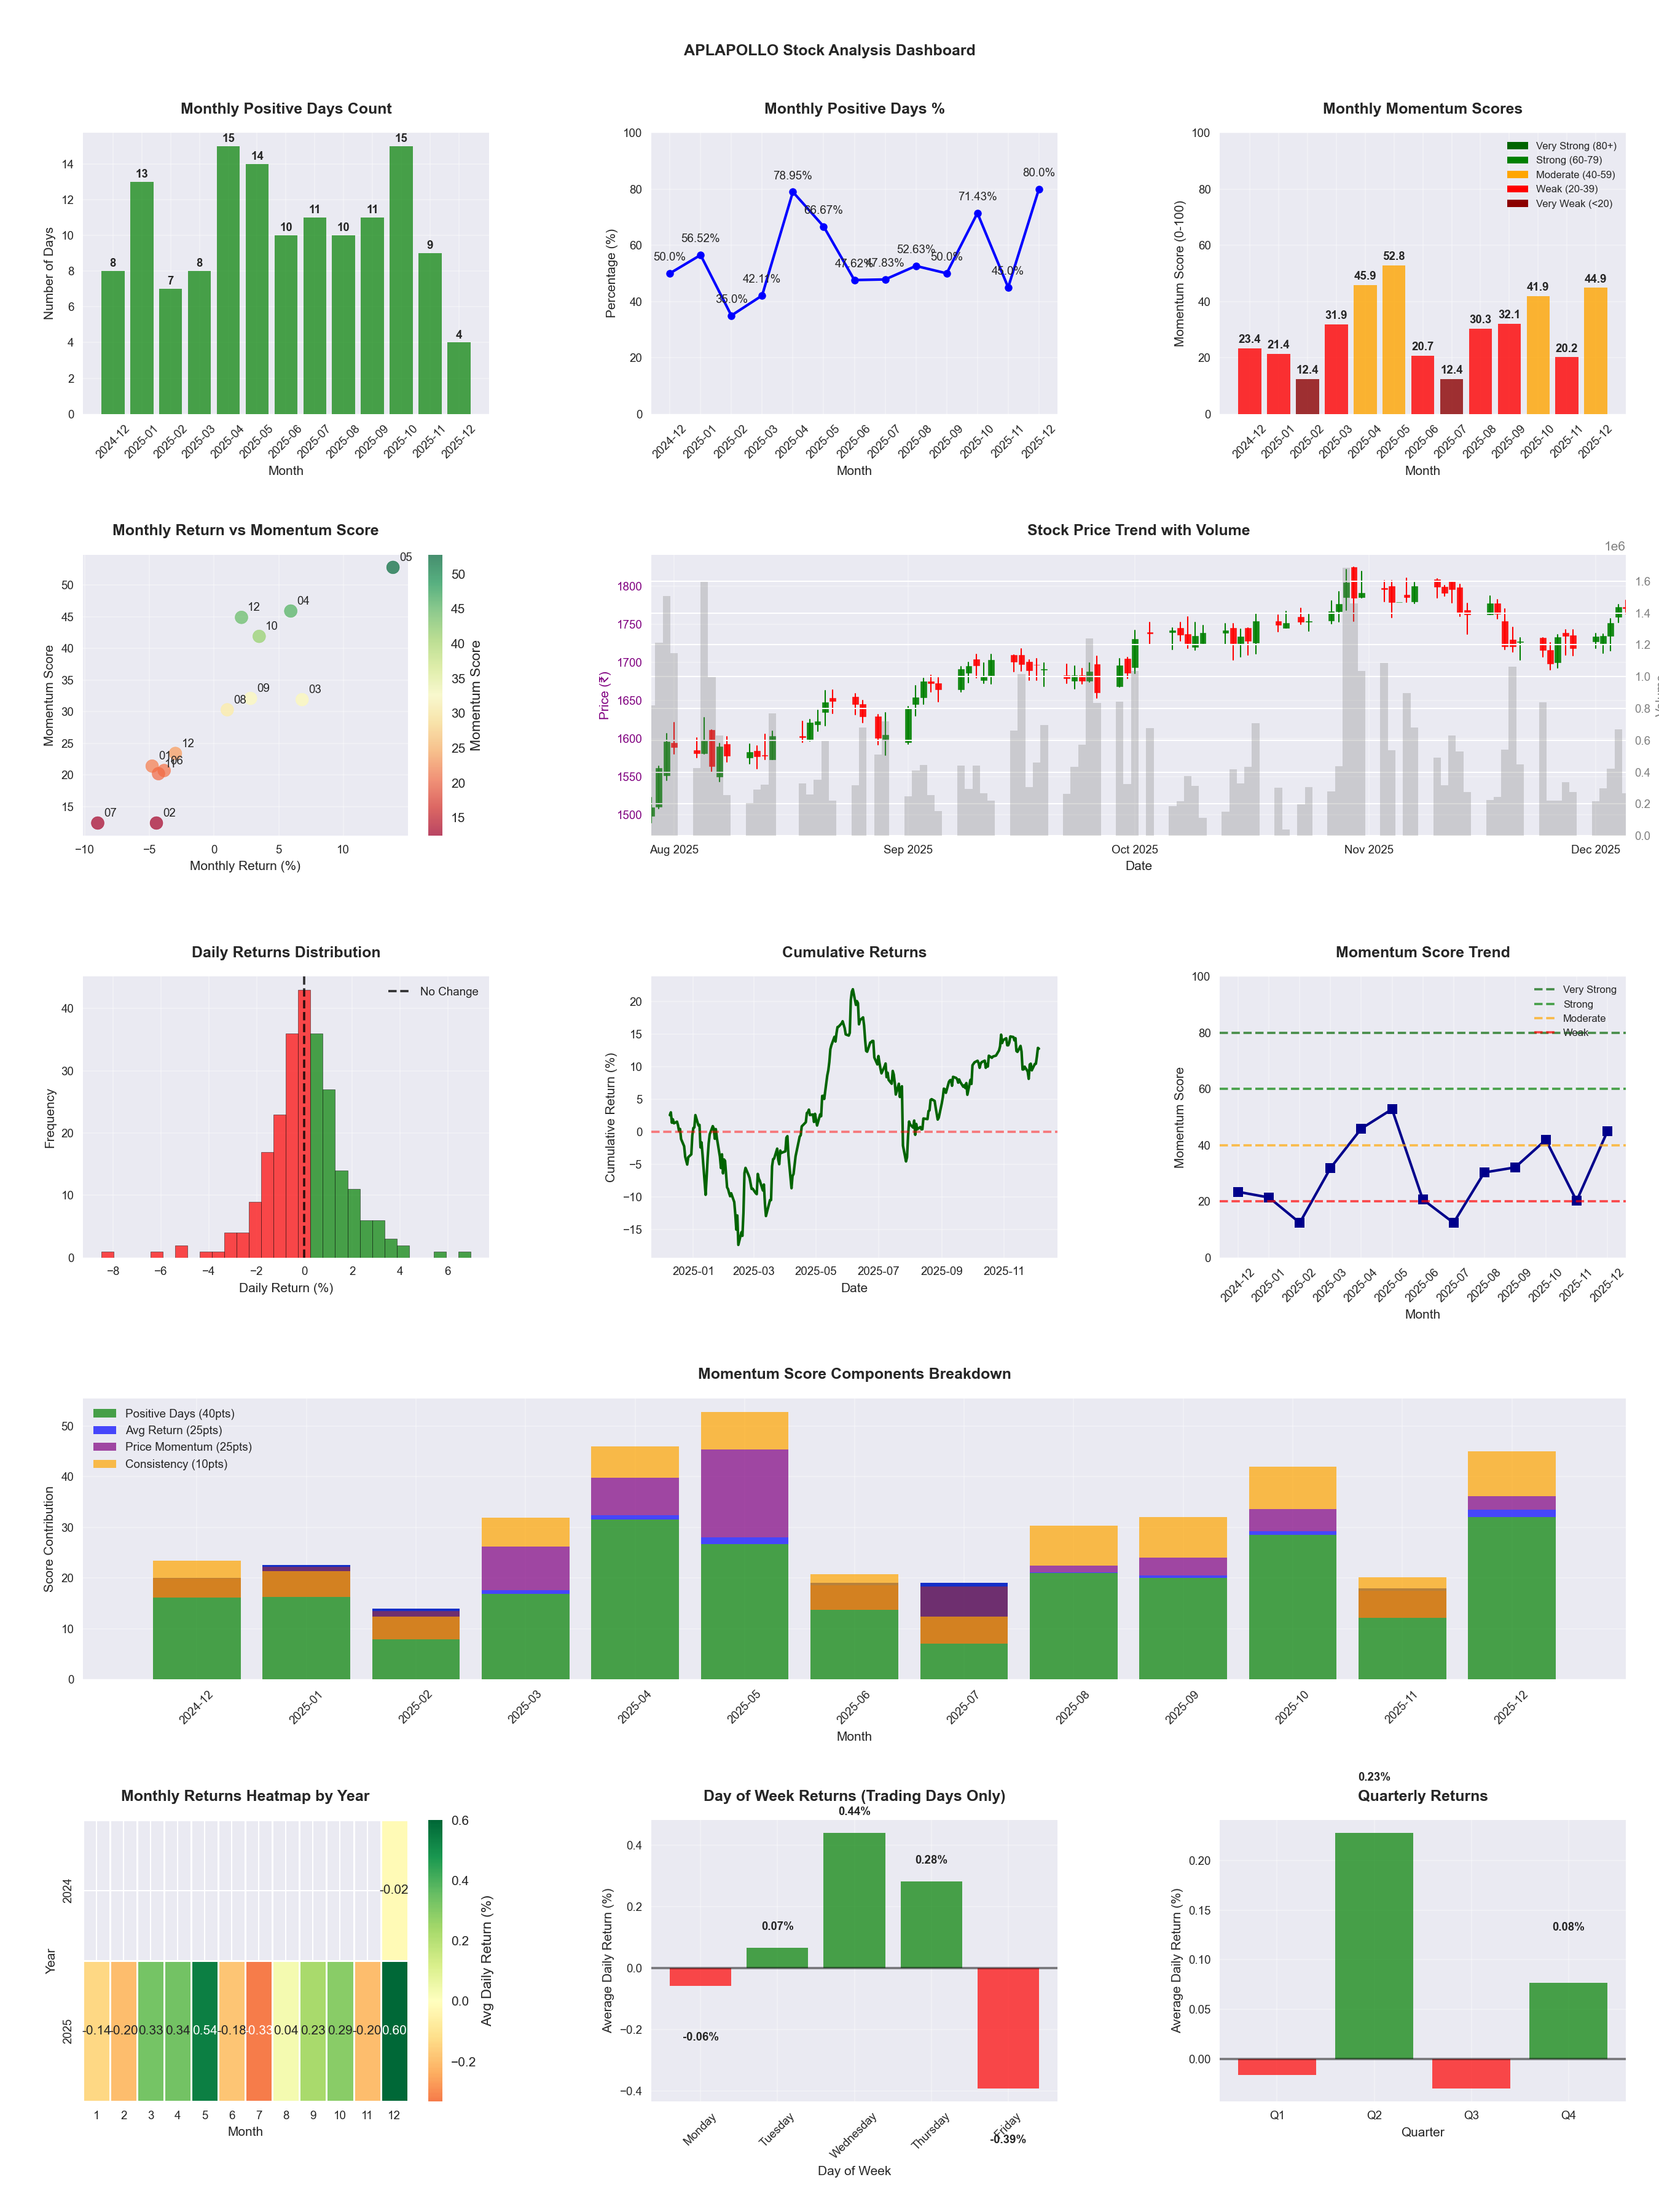
📊 Key Insights & Metrics
Symbol
📈 APLAPOLLO
Date
📅 2026-04-11
Volatility
🟡 1.63%
Win Rate
⚠️ 56.5%
Avg Daily Return
📈 +0.14%
Max Drawdown
📉 -21.66%
IBD RS Score
📊 86.2
Strong
Market Rank
#68
Best Month
🏆 2025-05
Worst Month
📉 2026-03
Best Months to Trade
📅 Apr, May, Dec
Best Days to Trade
📅 Wednesday, Tuesday
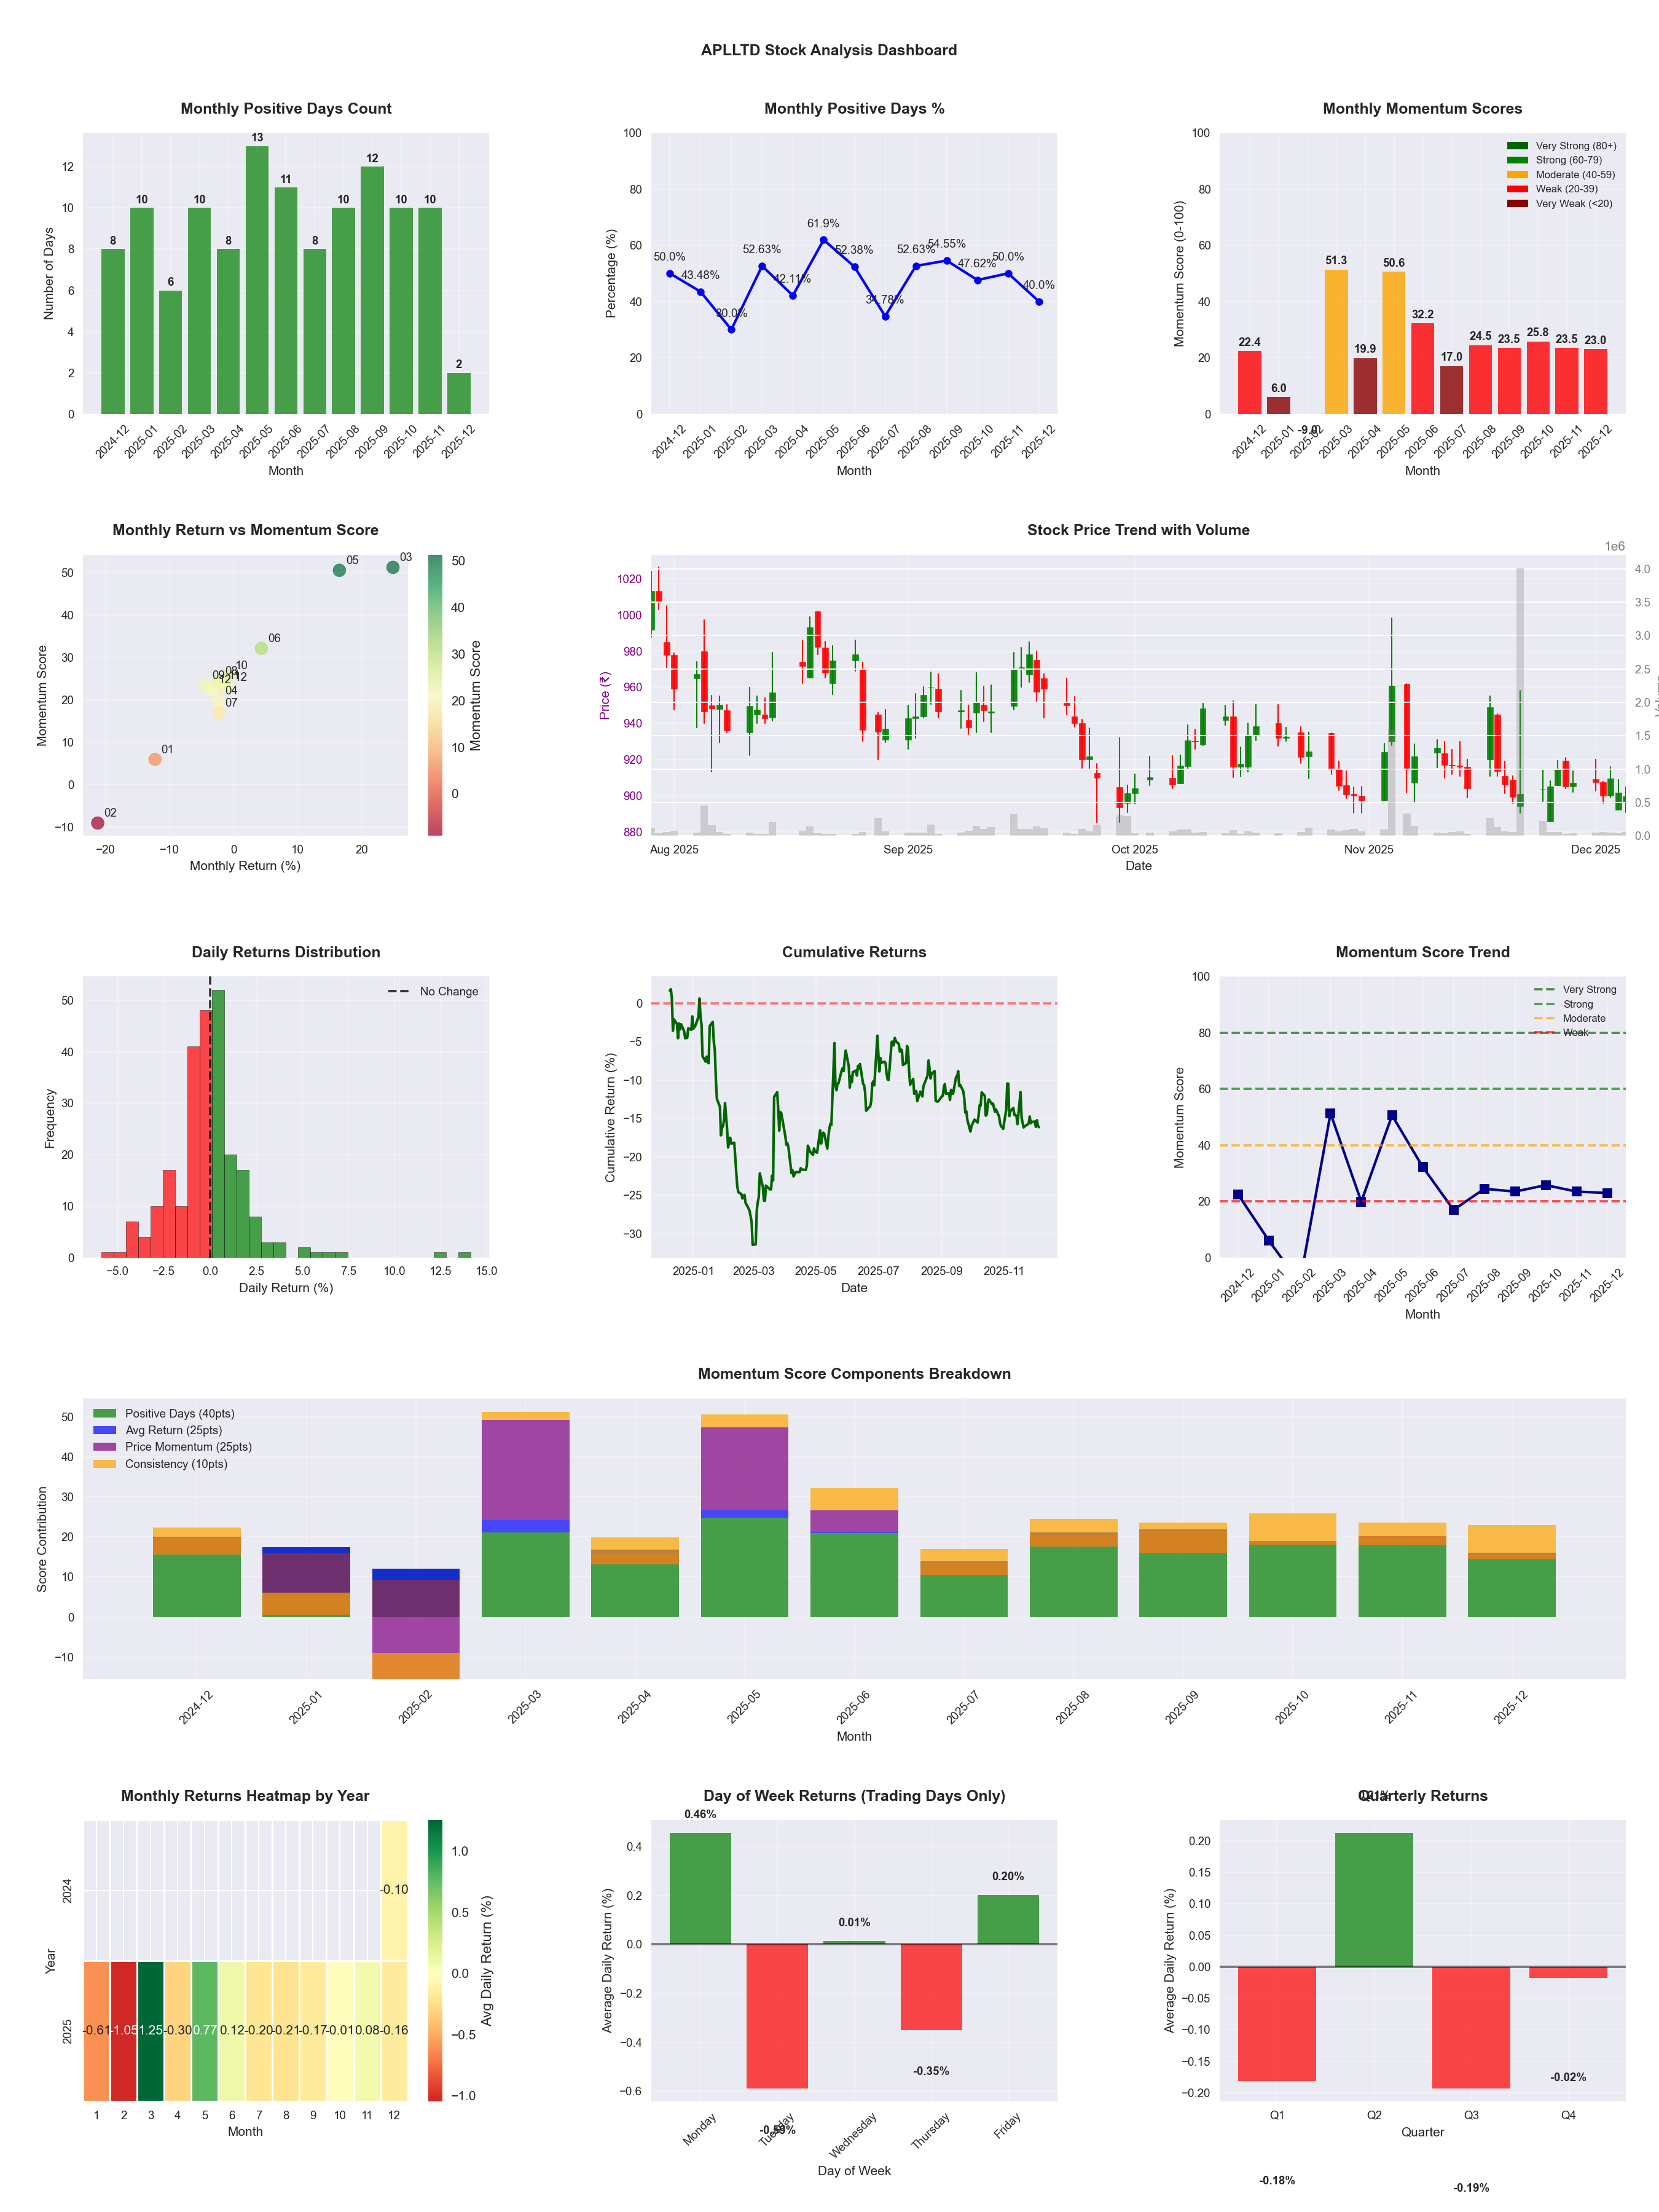
📊 Key Insights & Metrics
Symbol
📈 APLLTD
Date
📅 2026-04-11
Volatility
🟡 1.88%
Win Rate
⚠️ 44.7%
Avg Daily Return
📉 -0.04%
Max Drawdown
📉 -37.09%
IBD RS Score
📊 19.7
Weak
Market Rank
#396
Best Month
🏆 2025-05
Worst Month
📉 2026-01
Best Months to Trade
📅 May, Apr, Jun
Best Days to Trade
📅 Monday, Wednesday
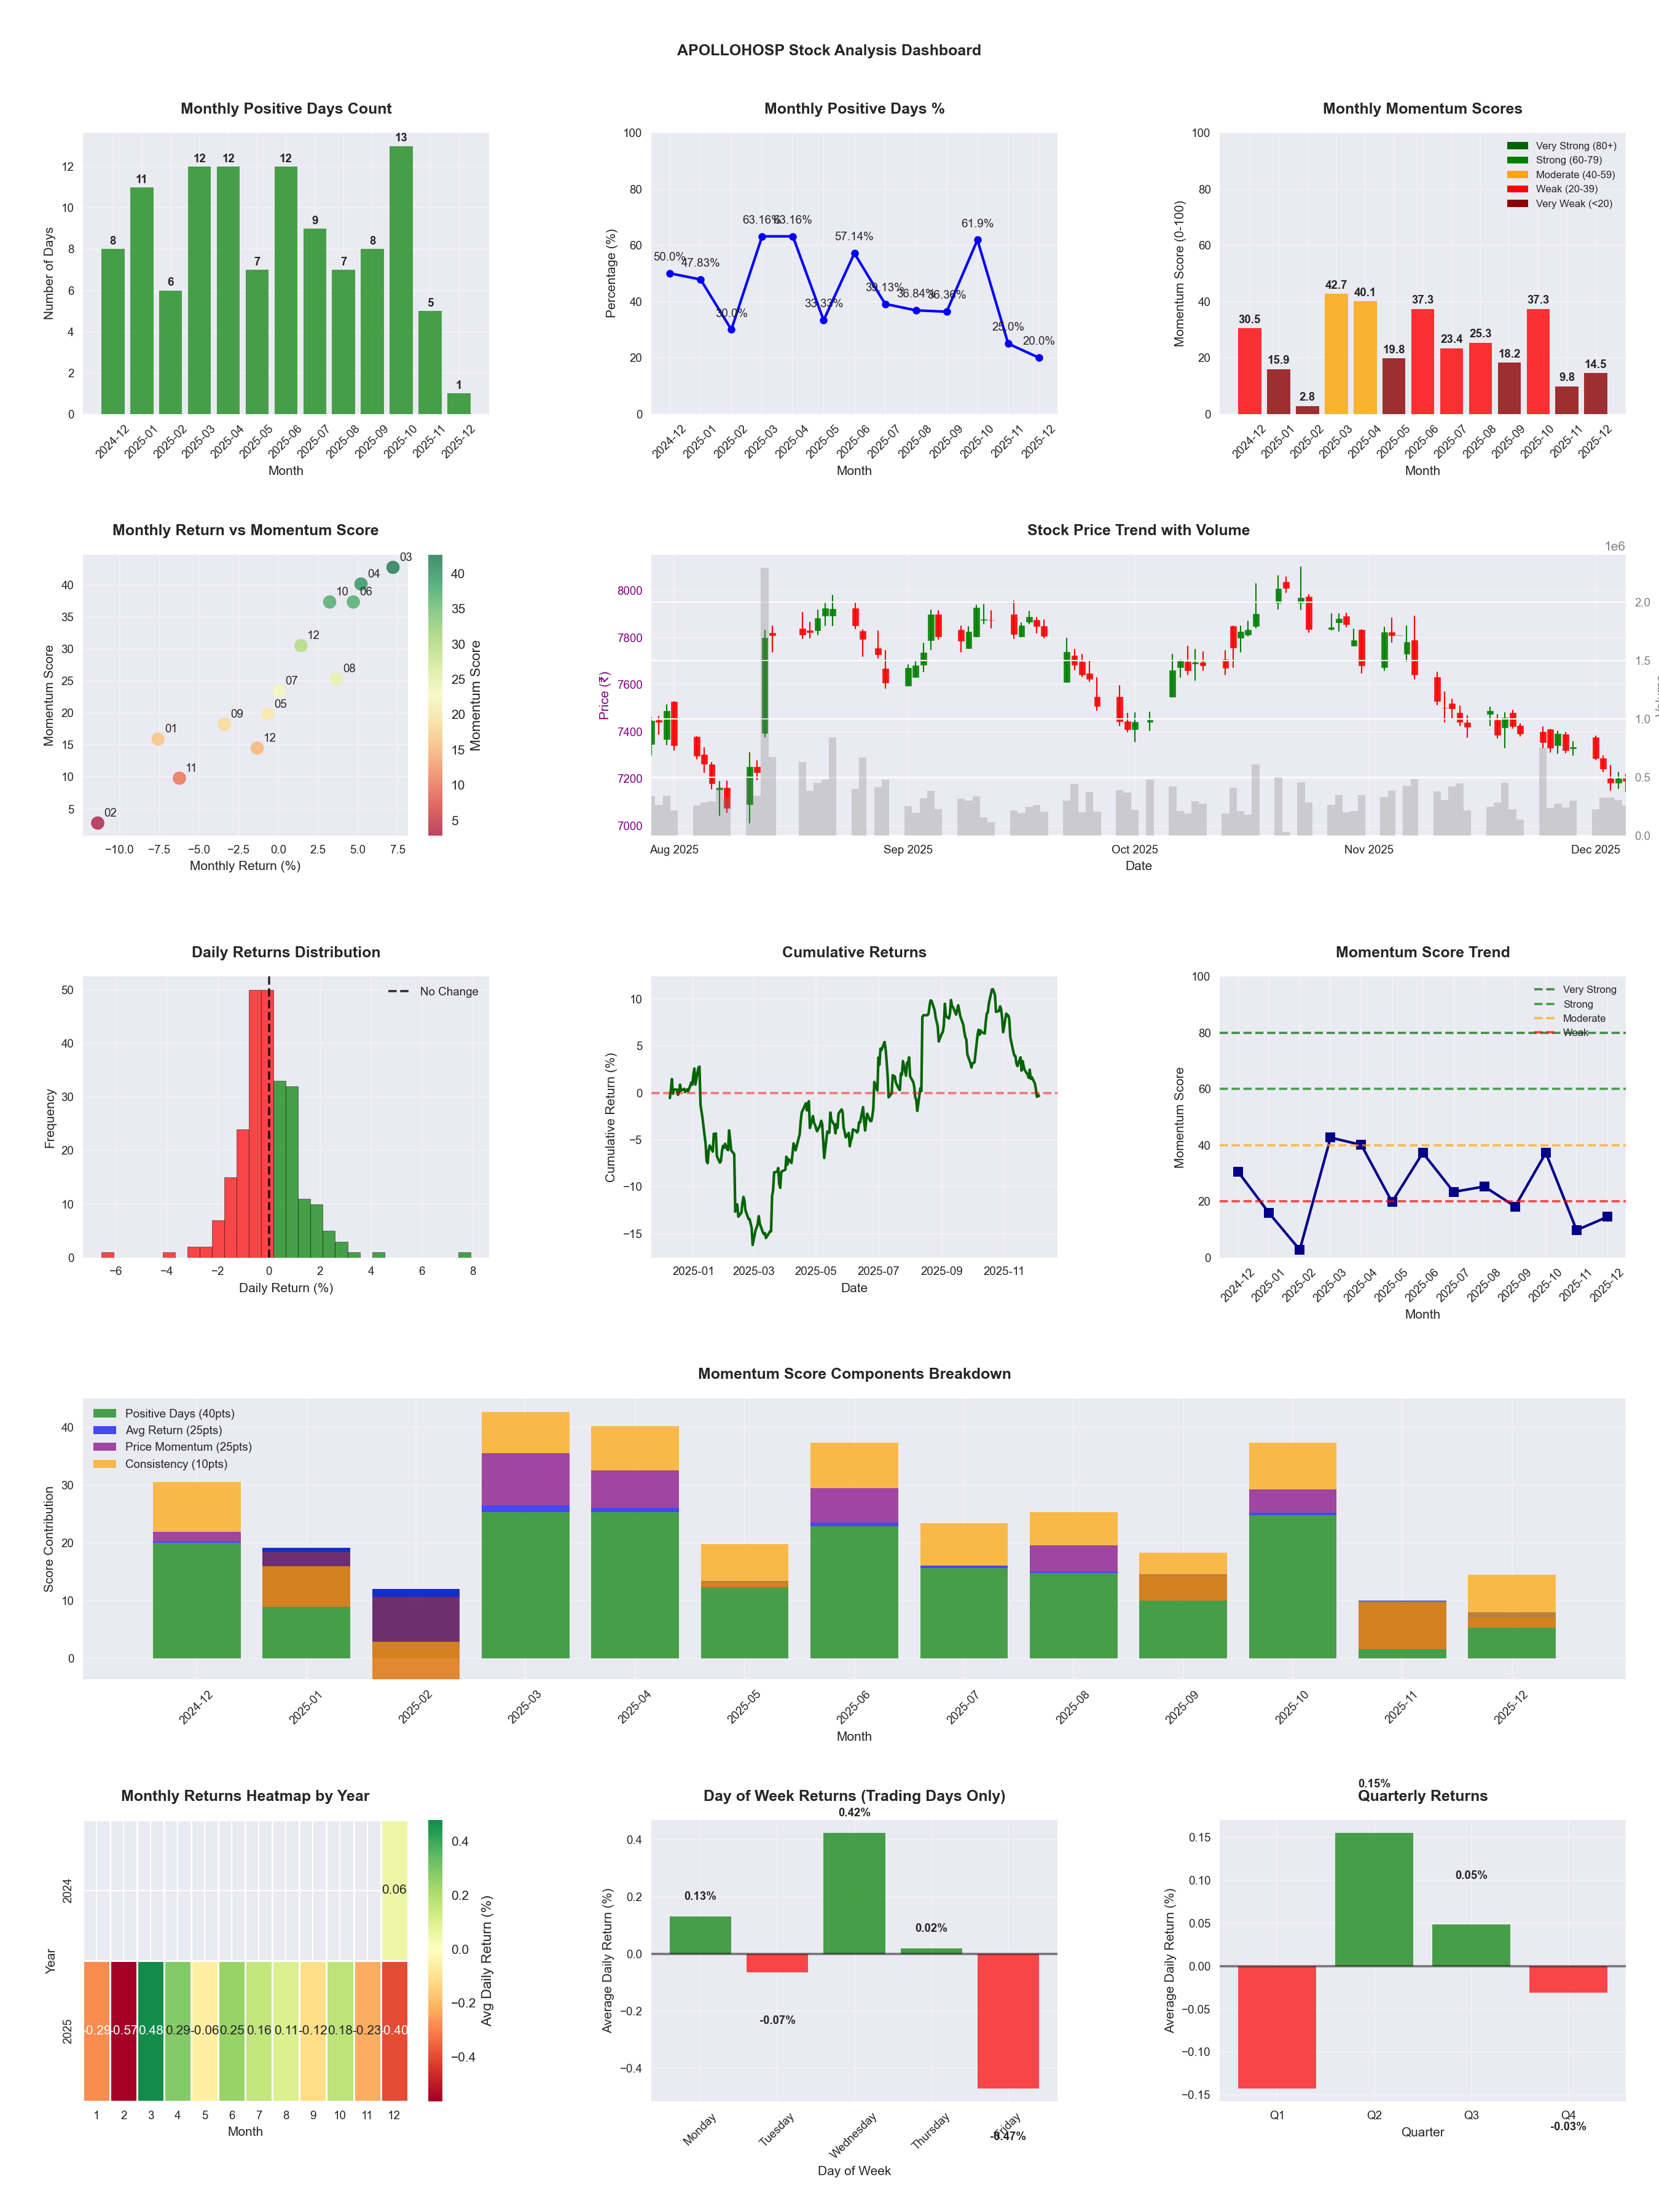
📊 Key Insights & Metrics
Symbol
📈 APOLLOHOSP
Date
📅 2026-04-11
Volatility
🟢 1.27%
Win Rate
⚠️ 45.5%
Avg Daily Return
📈 +0.05%
Max Drawdown
📉 -15.21%
IBD RS Score
📊 68.2
Average
Market Rank
#157
Best Month
🏆 2026-02
Worst Month
📉 2025-11
Best Months to Trade
📅 Feb, Jun, Apr
Best Days to Trade
📅 Wednesday, Tuesday
📊 Key Insights & Metrics
Symbol
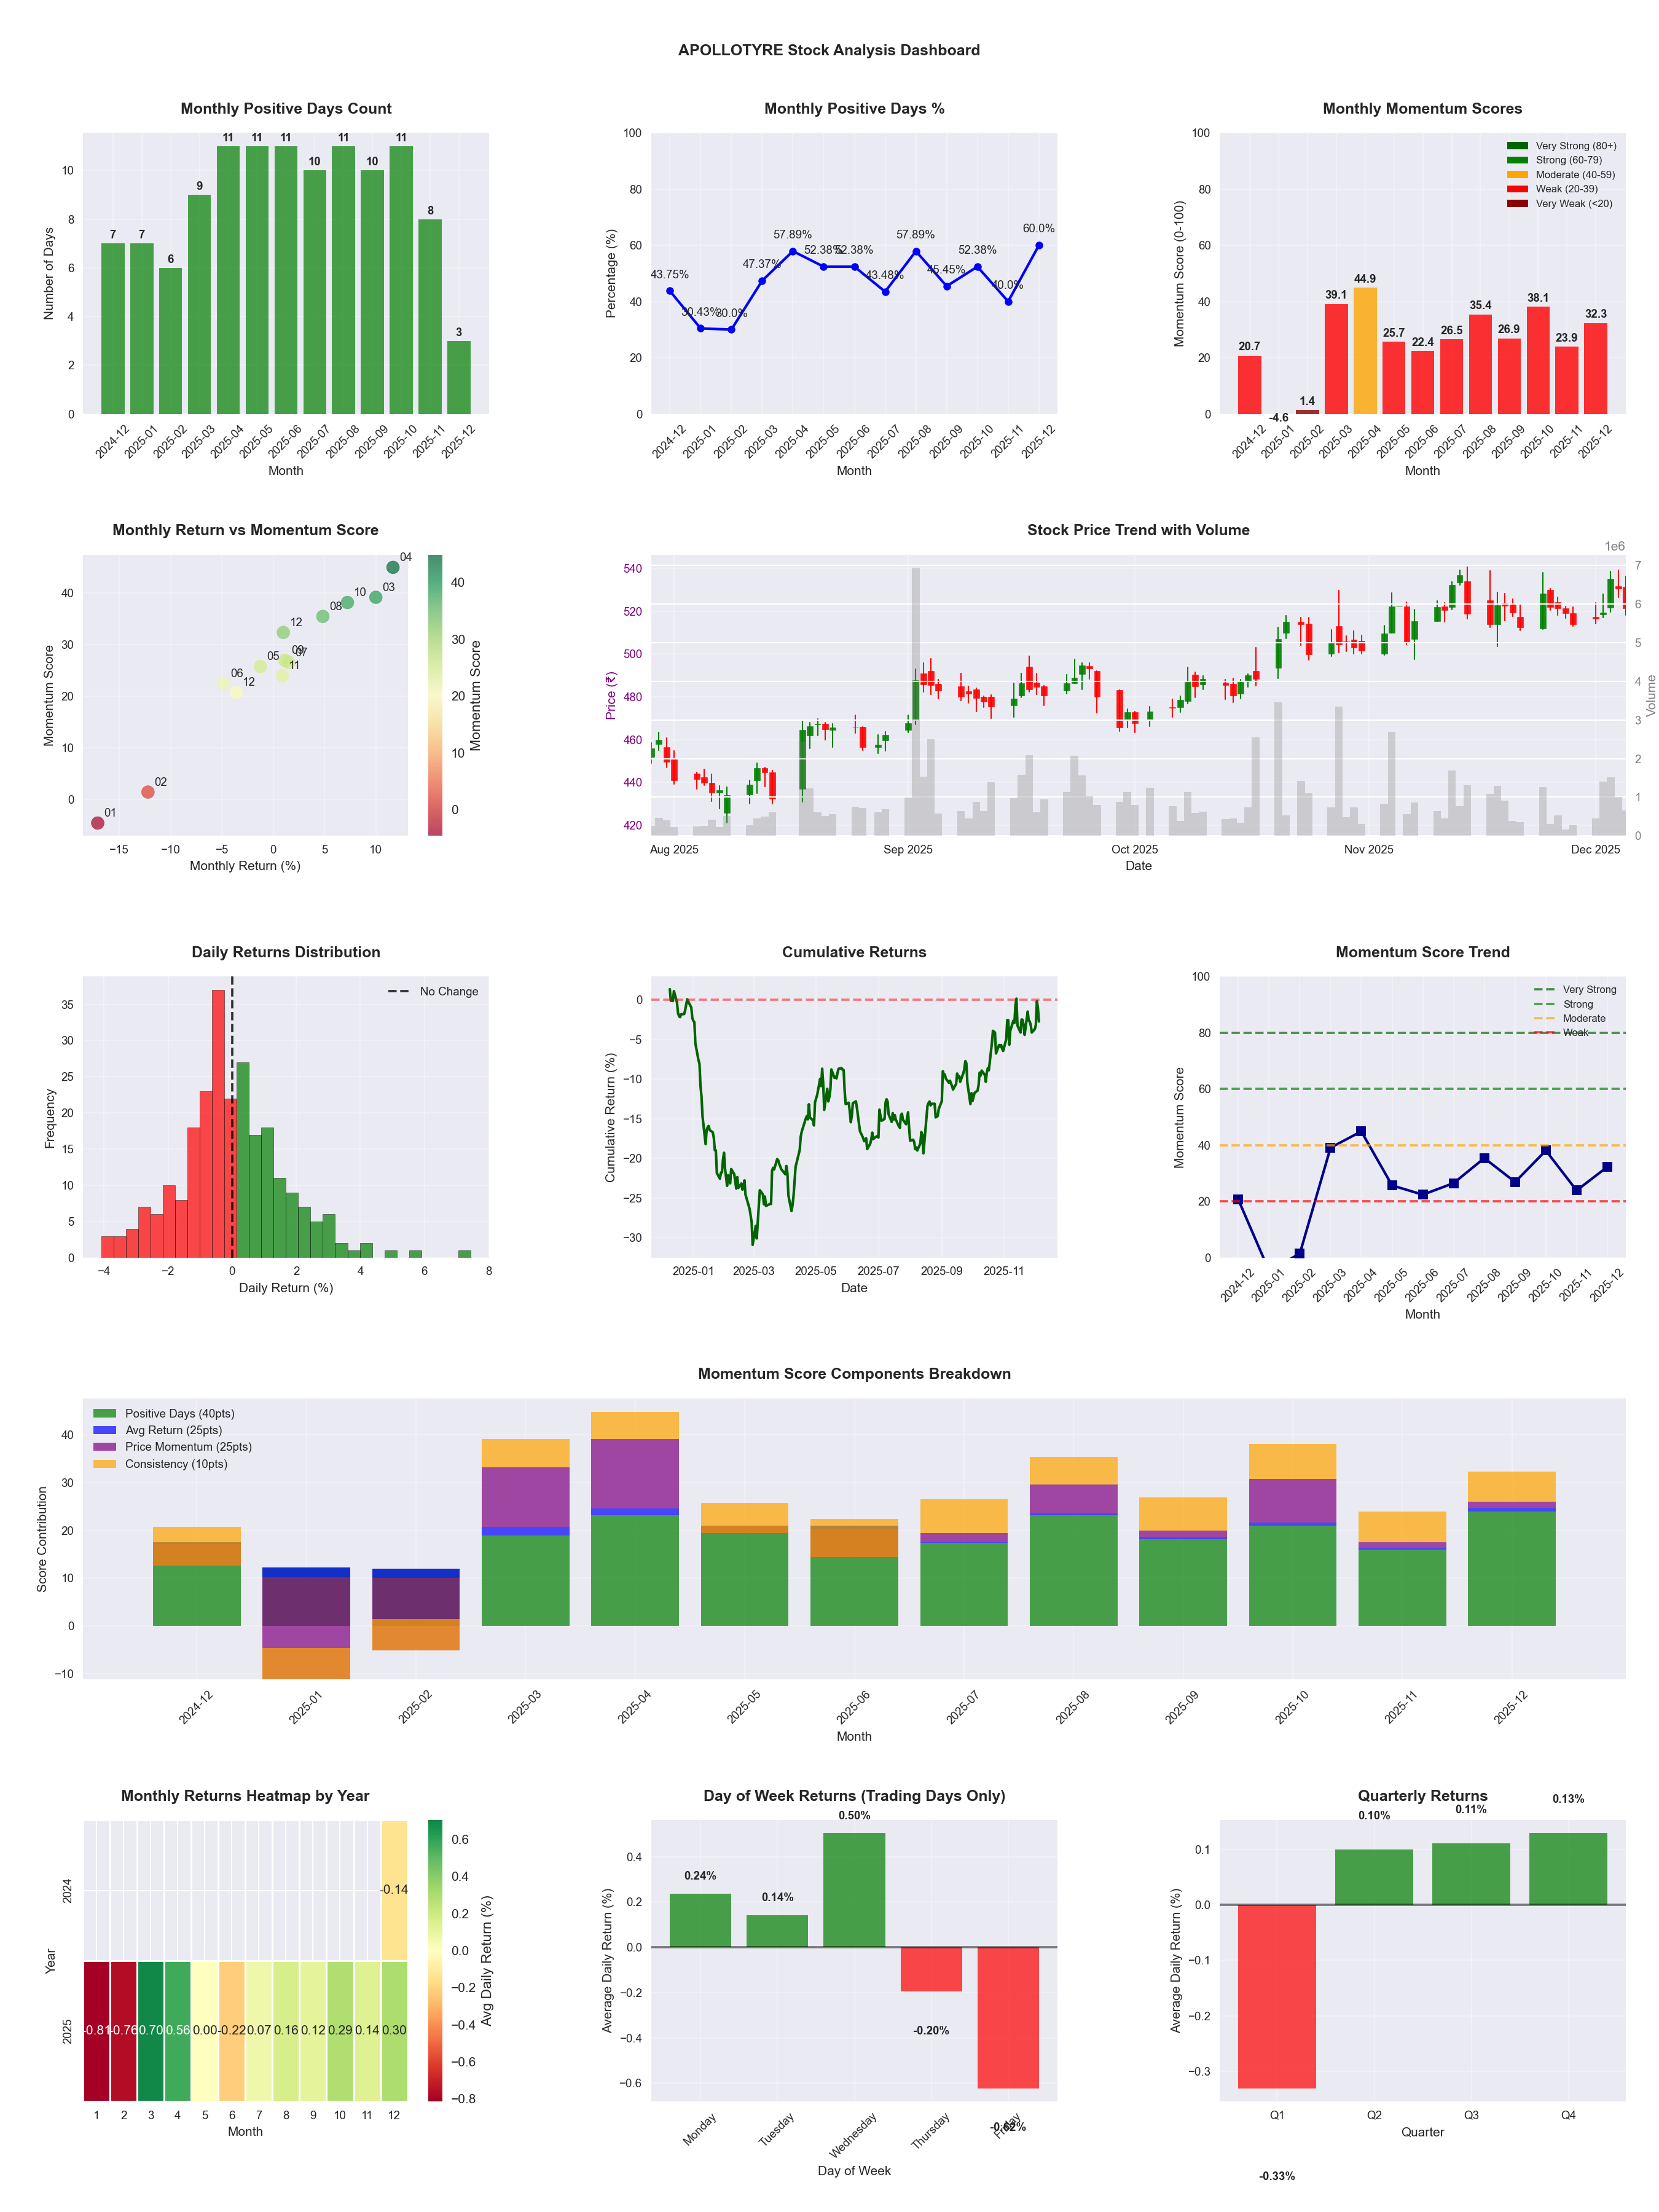
📈 APOLLOTYRE
Date
📅 2026-04-11
Volatility
🟡 1.70%
Win Rate
⚠️ 47.6%
Avg Daily Return
📈 +0.03%
Max Drawdown
📉 -25.07%
IBD RS Score
📊 44.4
Weak
Market Rank
#274
Best Month
🏆 2025-04
Worst Month
📉 2026-03
Best Months to Trade
📅 Apr, Oct, Aug
Best Days to Trade
📅 Tuesday, Wednesday
📊 Key Insights & Metrics
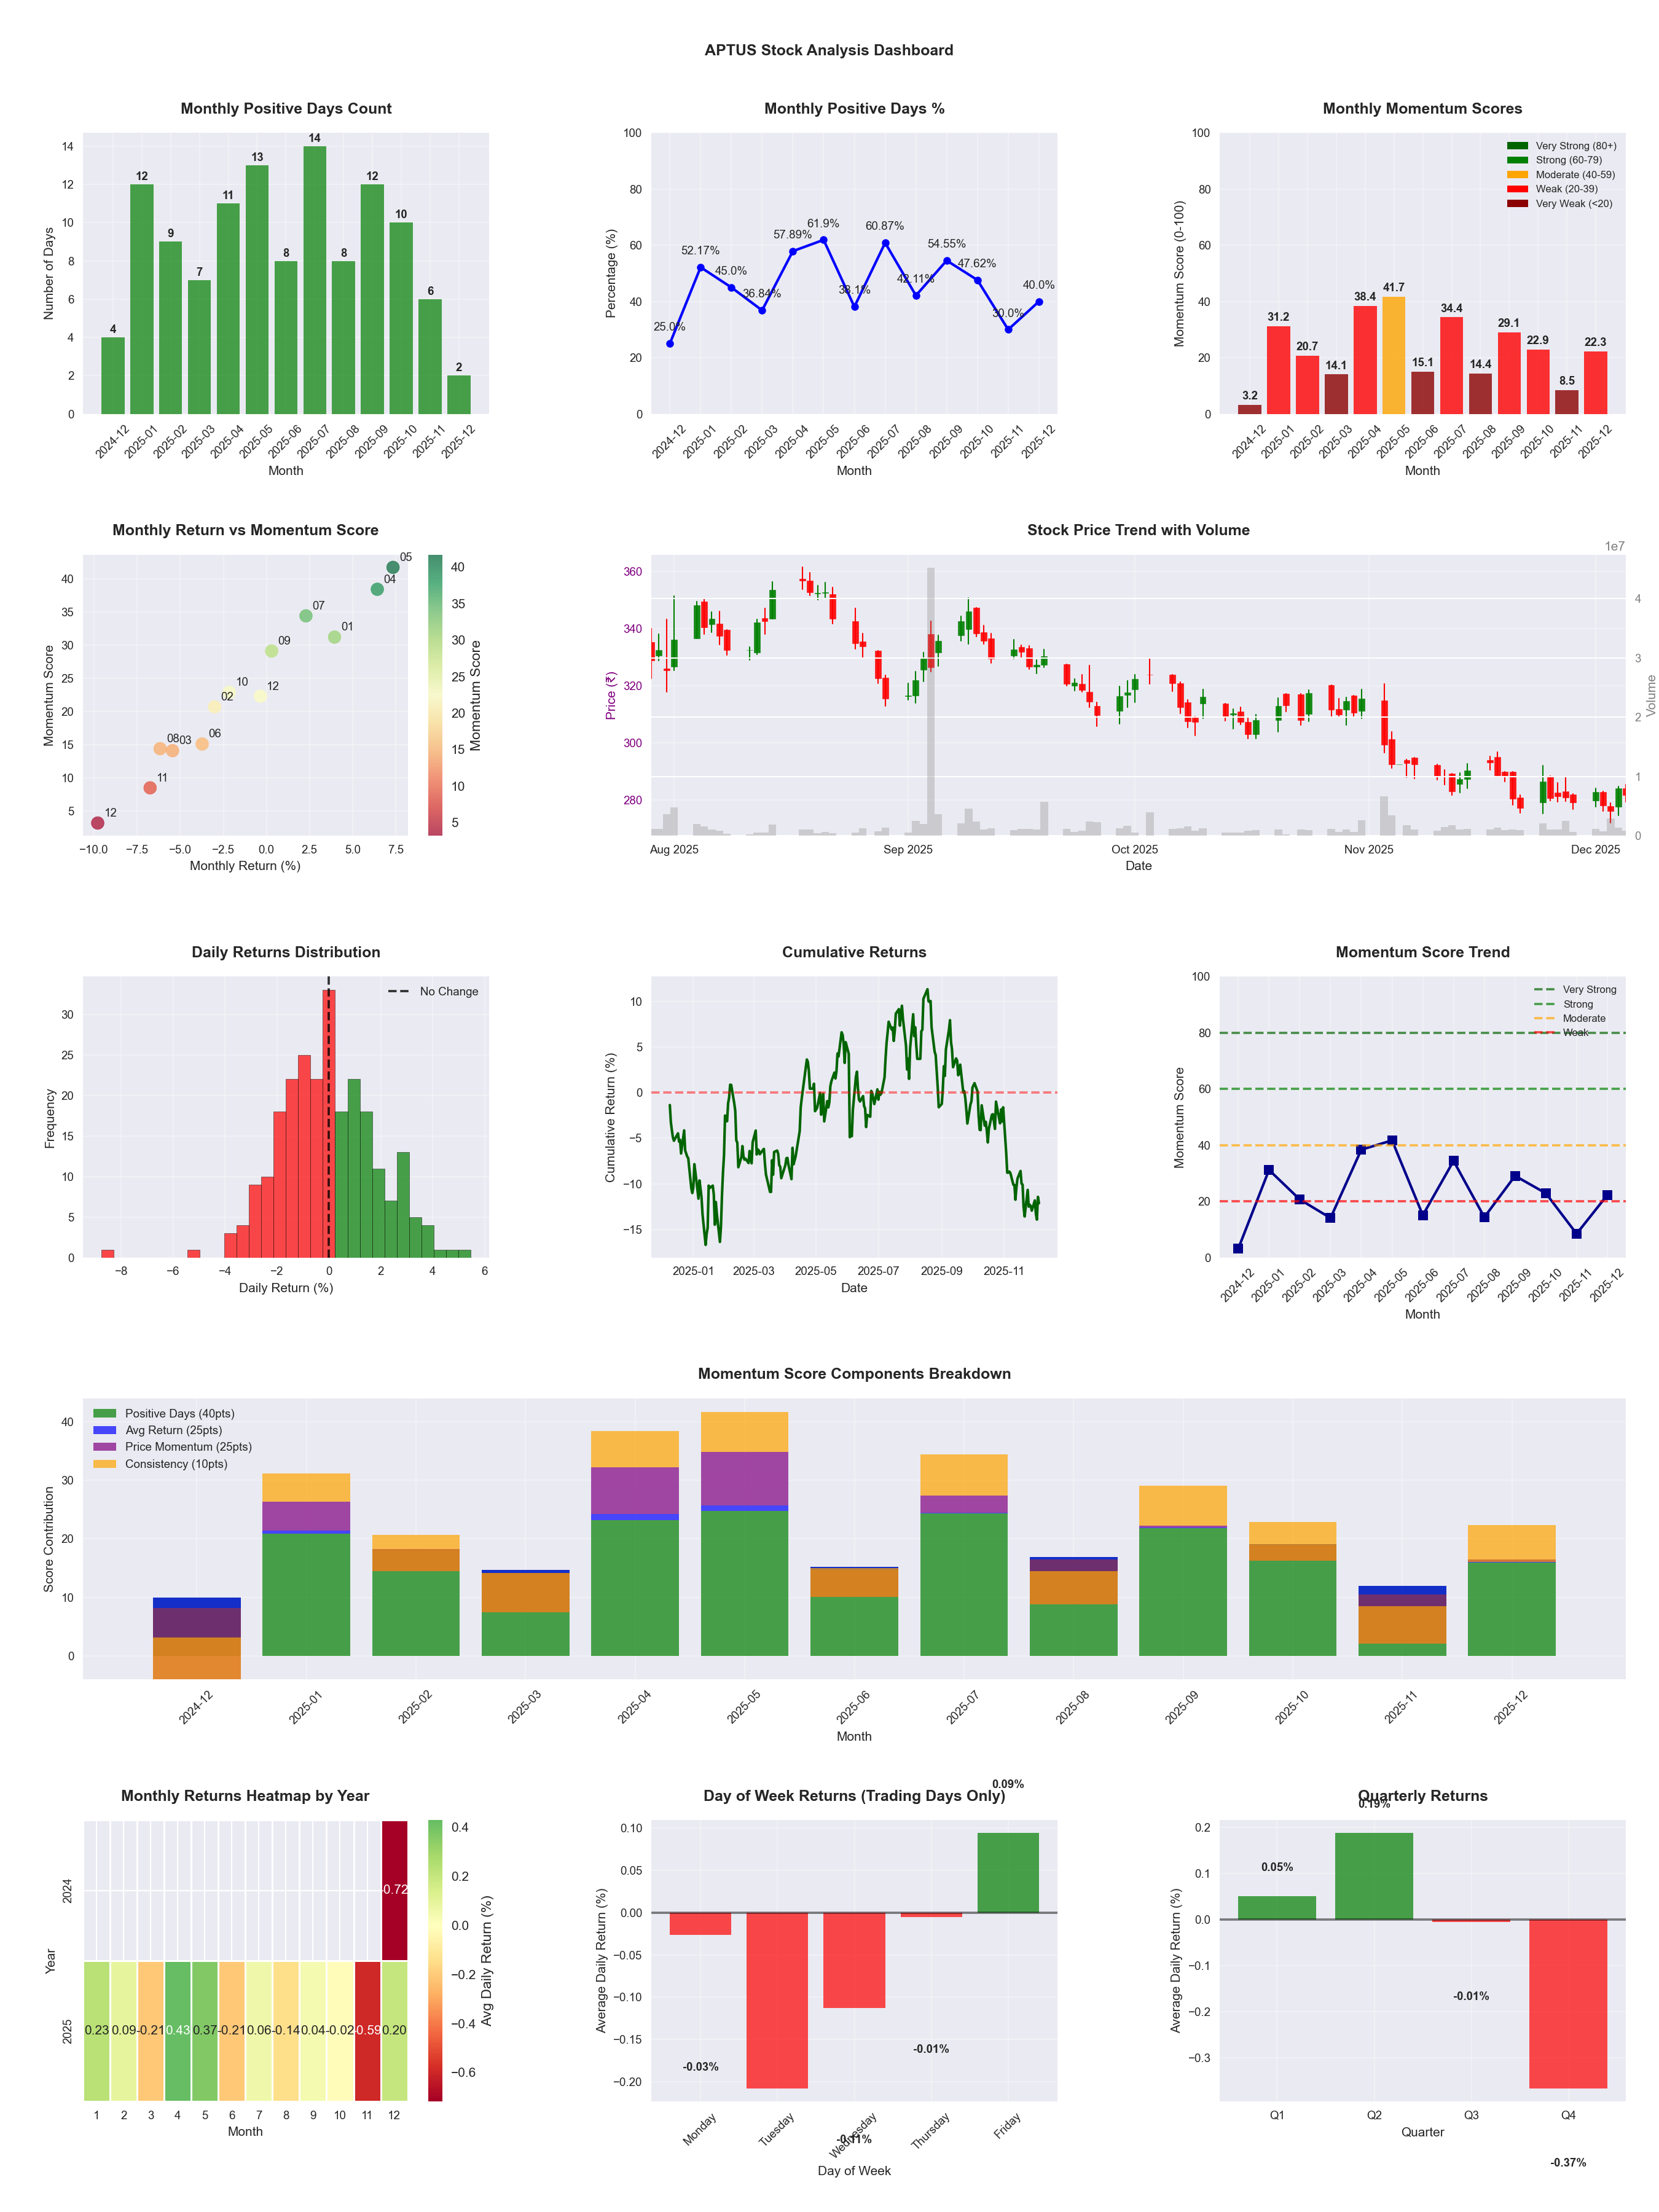
Symbol
📈 APTUS
Date
📅 2026-04-11
Volatility
🟡 1.99%
Win Rate
⚠️ 44.3%
Avg Daily Return
📉 -0.10%
Max Drawdown
📉 -45.49%
IBD RS Score
📊 5.7
Weak
Market Rank
#465
Best Month
🏆 2026-04
Best Months to Trade
📅 Apr, May, Jul
Best Days to Trade
📅 Wednesday, Monday
📊 Key Insights & Metrics
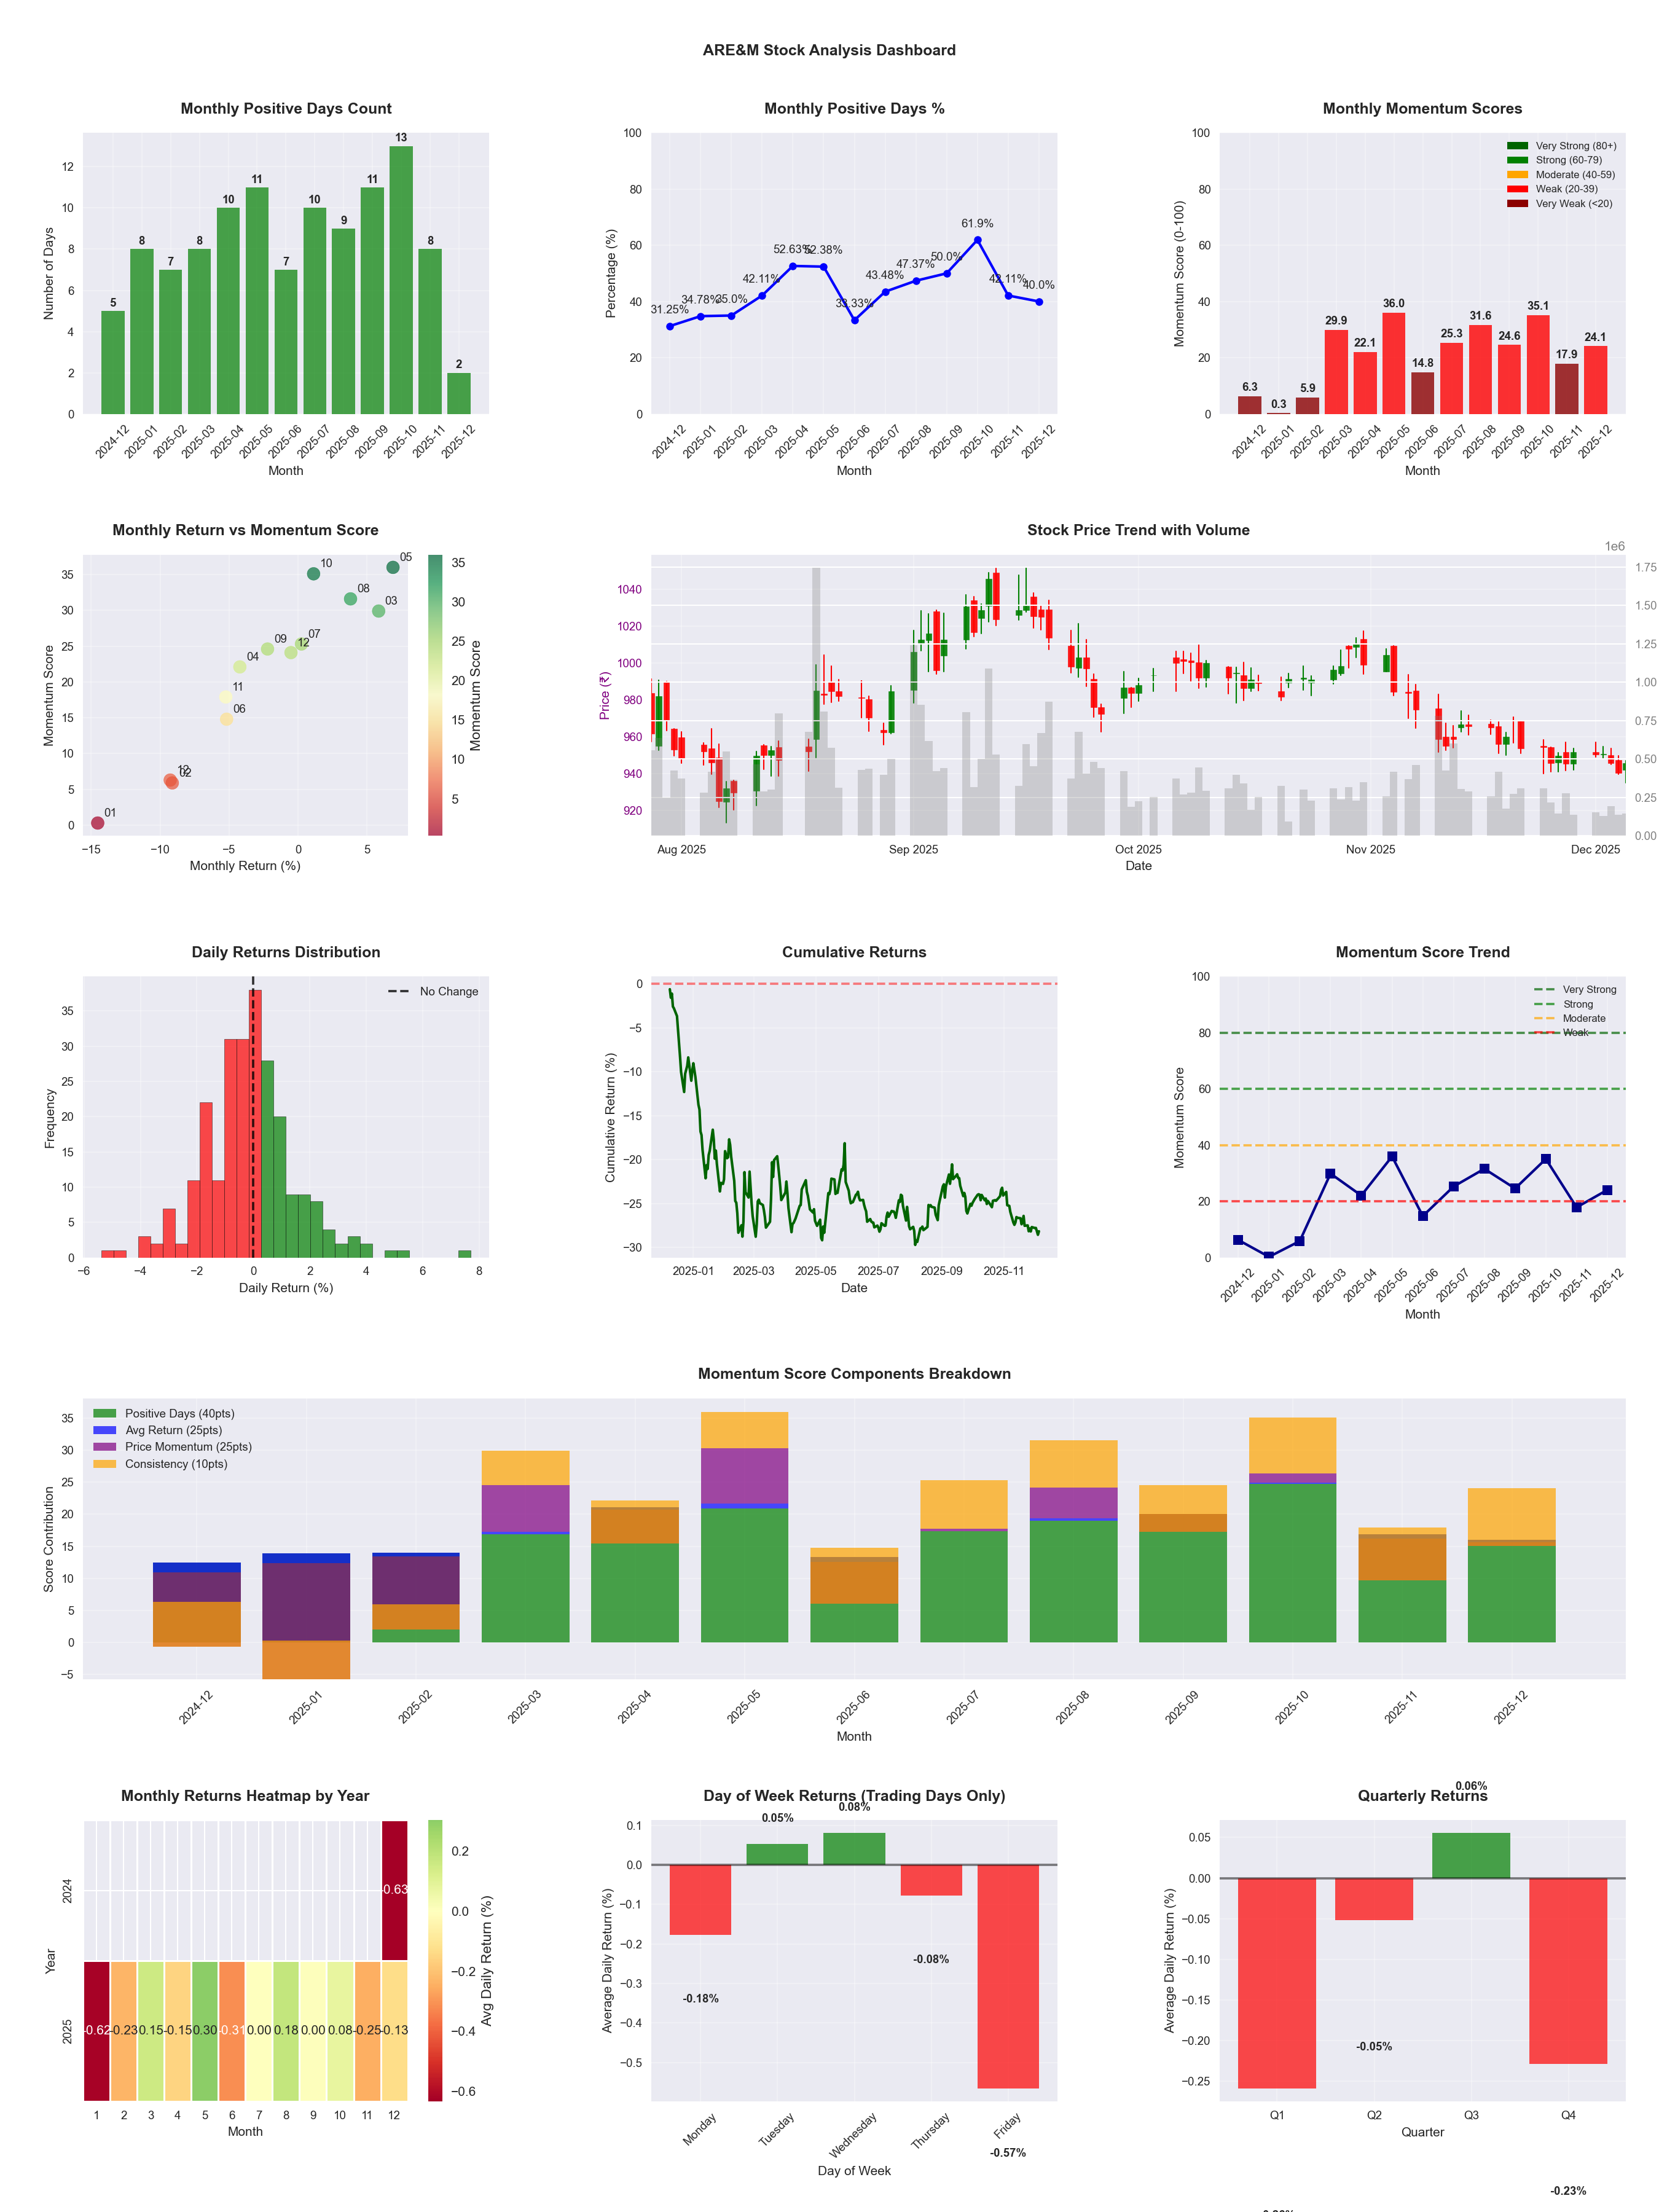
Symbol
📈 ARE
Date
📅 2026-04-11
Volatility
🟢 1.49%
Win Rate
⚠️ 46.1%
Avg Daily Return
📉 -0.10%
Max Drawdown
📉 -37.59%
Best Month
🏆 2026-04
Best Months to Trade
📅 Apr, May, Aug
Best Days to Trade
📅 Wednesday, Tuesday
📊 Key Insights & Metrics
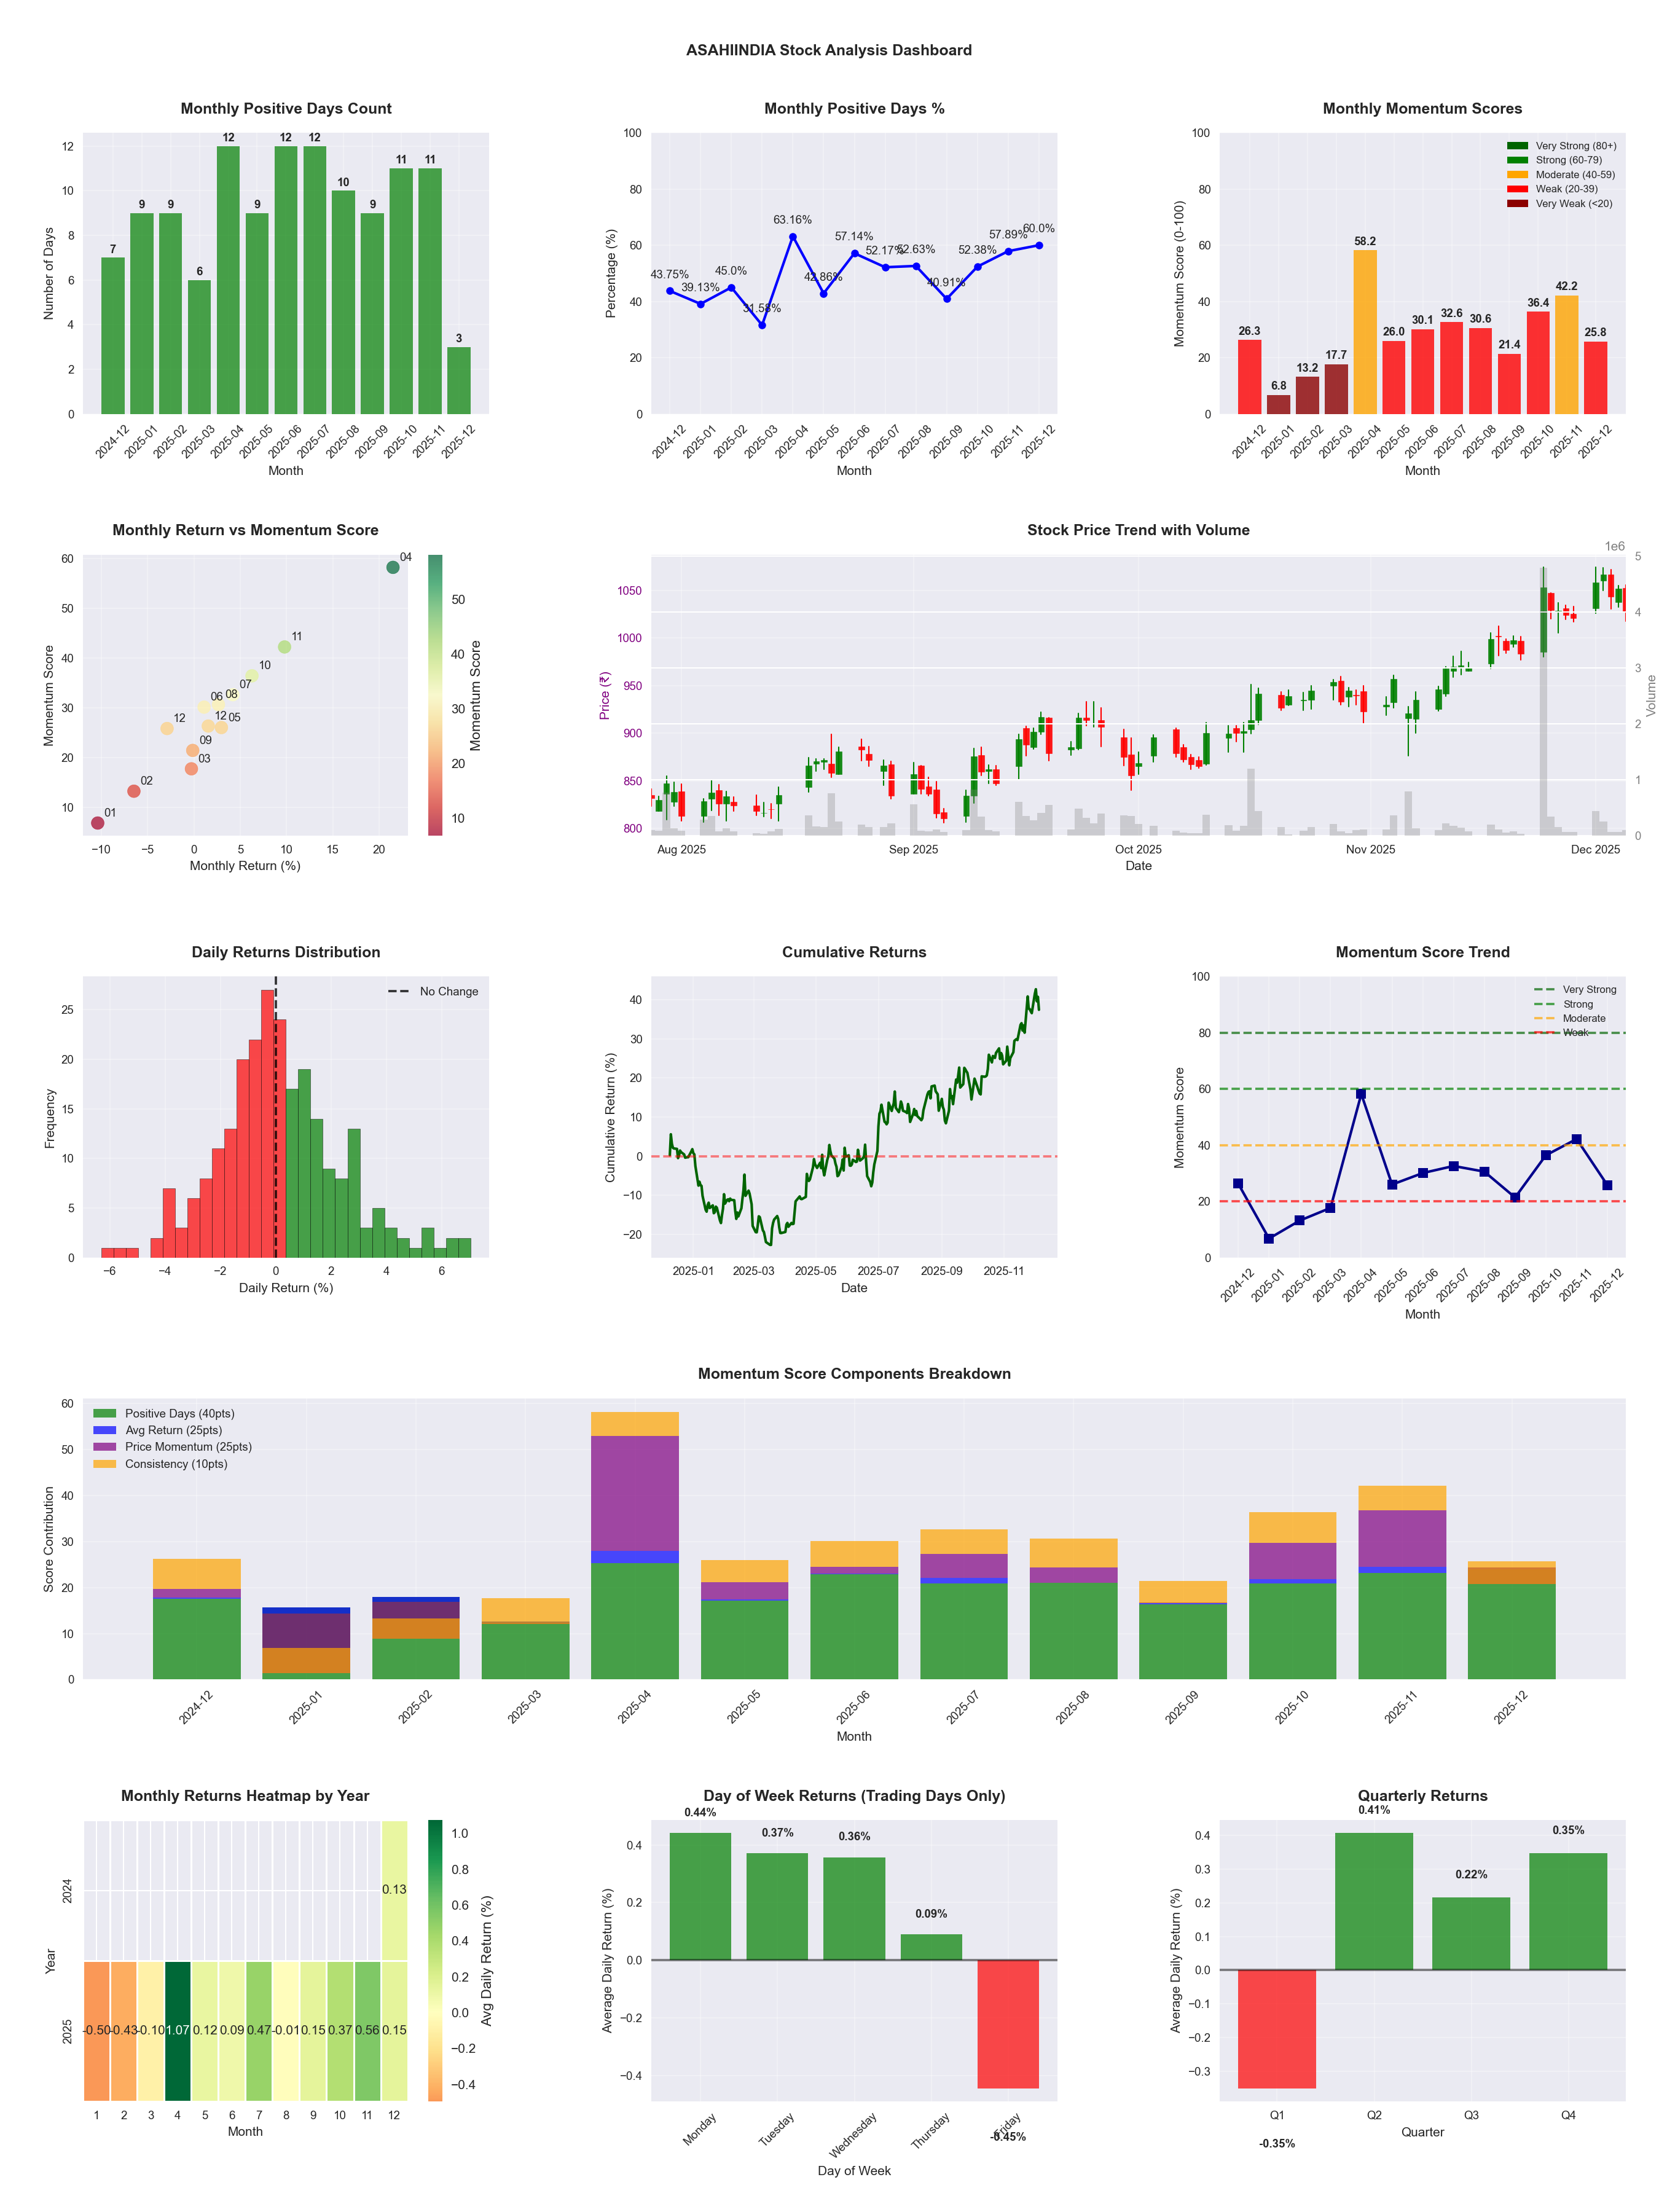
Symbol
📈 ASAHIINDIA
Date
📅 2026-04-11
Volatility
🟡 2.31%
Risk Profile
⚠️ suitable for aggressive investors
Win Rate
⚠️ 47.6%
Avg Daily Return
📈 +0.14%
Max Drawdown
📉 -26.44%
IBD RS Score
📊 67.7
Average
Market Rank
#159
Best Month
🏆 2025-11
Worst Month
📉 2026-03
Best Months to Trade
📅 Apr, Nov, Jul
Best Days to Trade
📅 Tuesday, Wednesday
📊 Key Insights & Metrics
Symbol
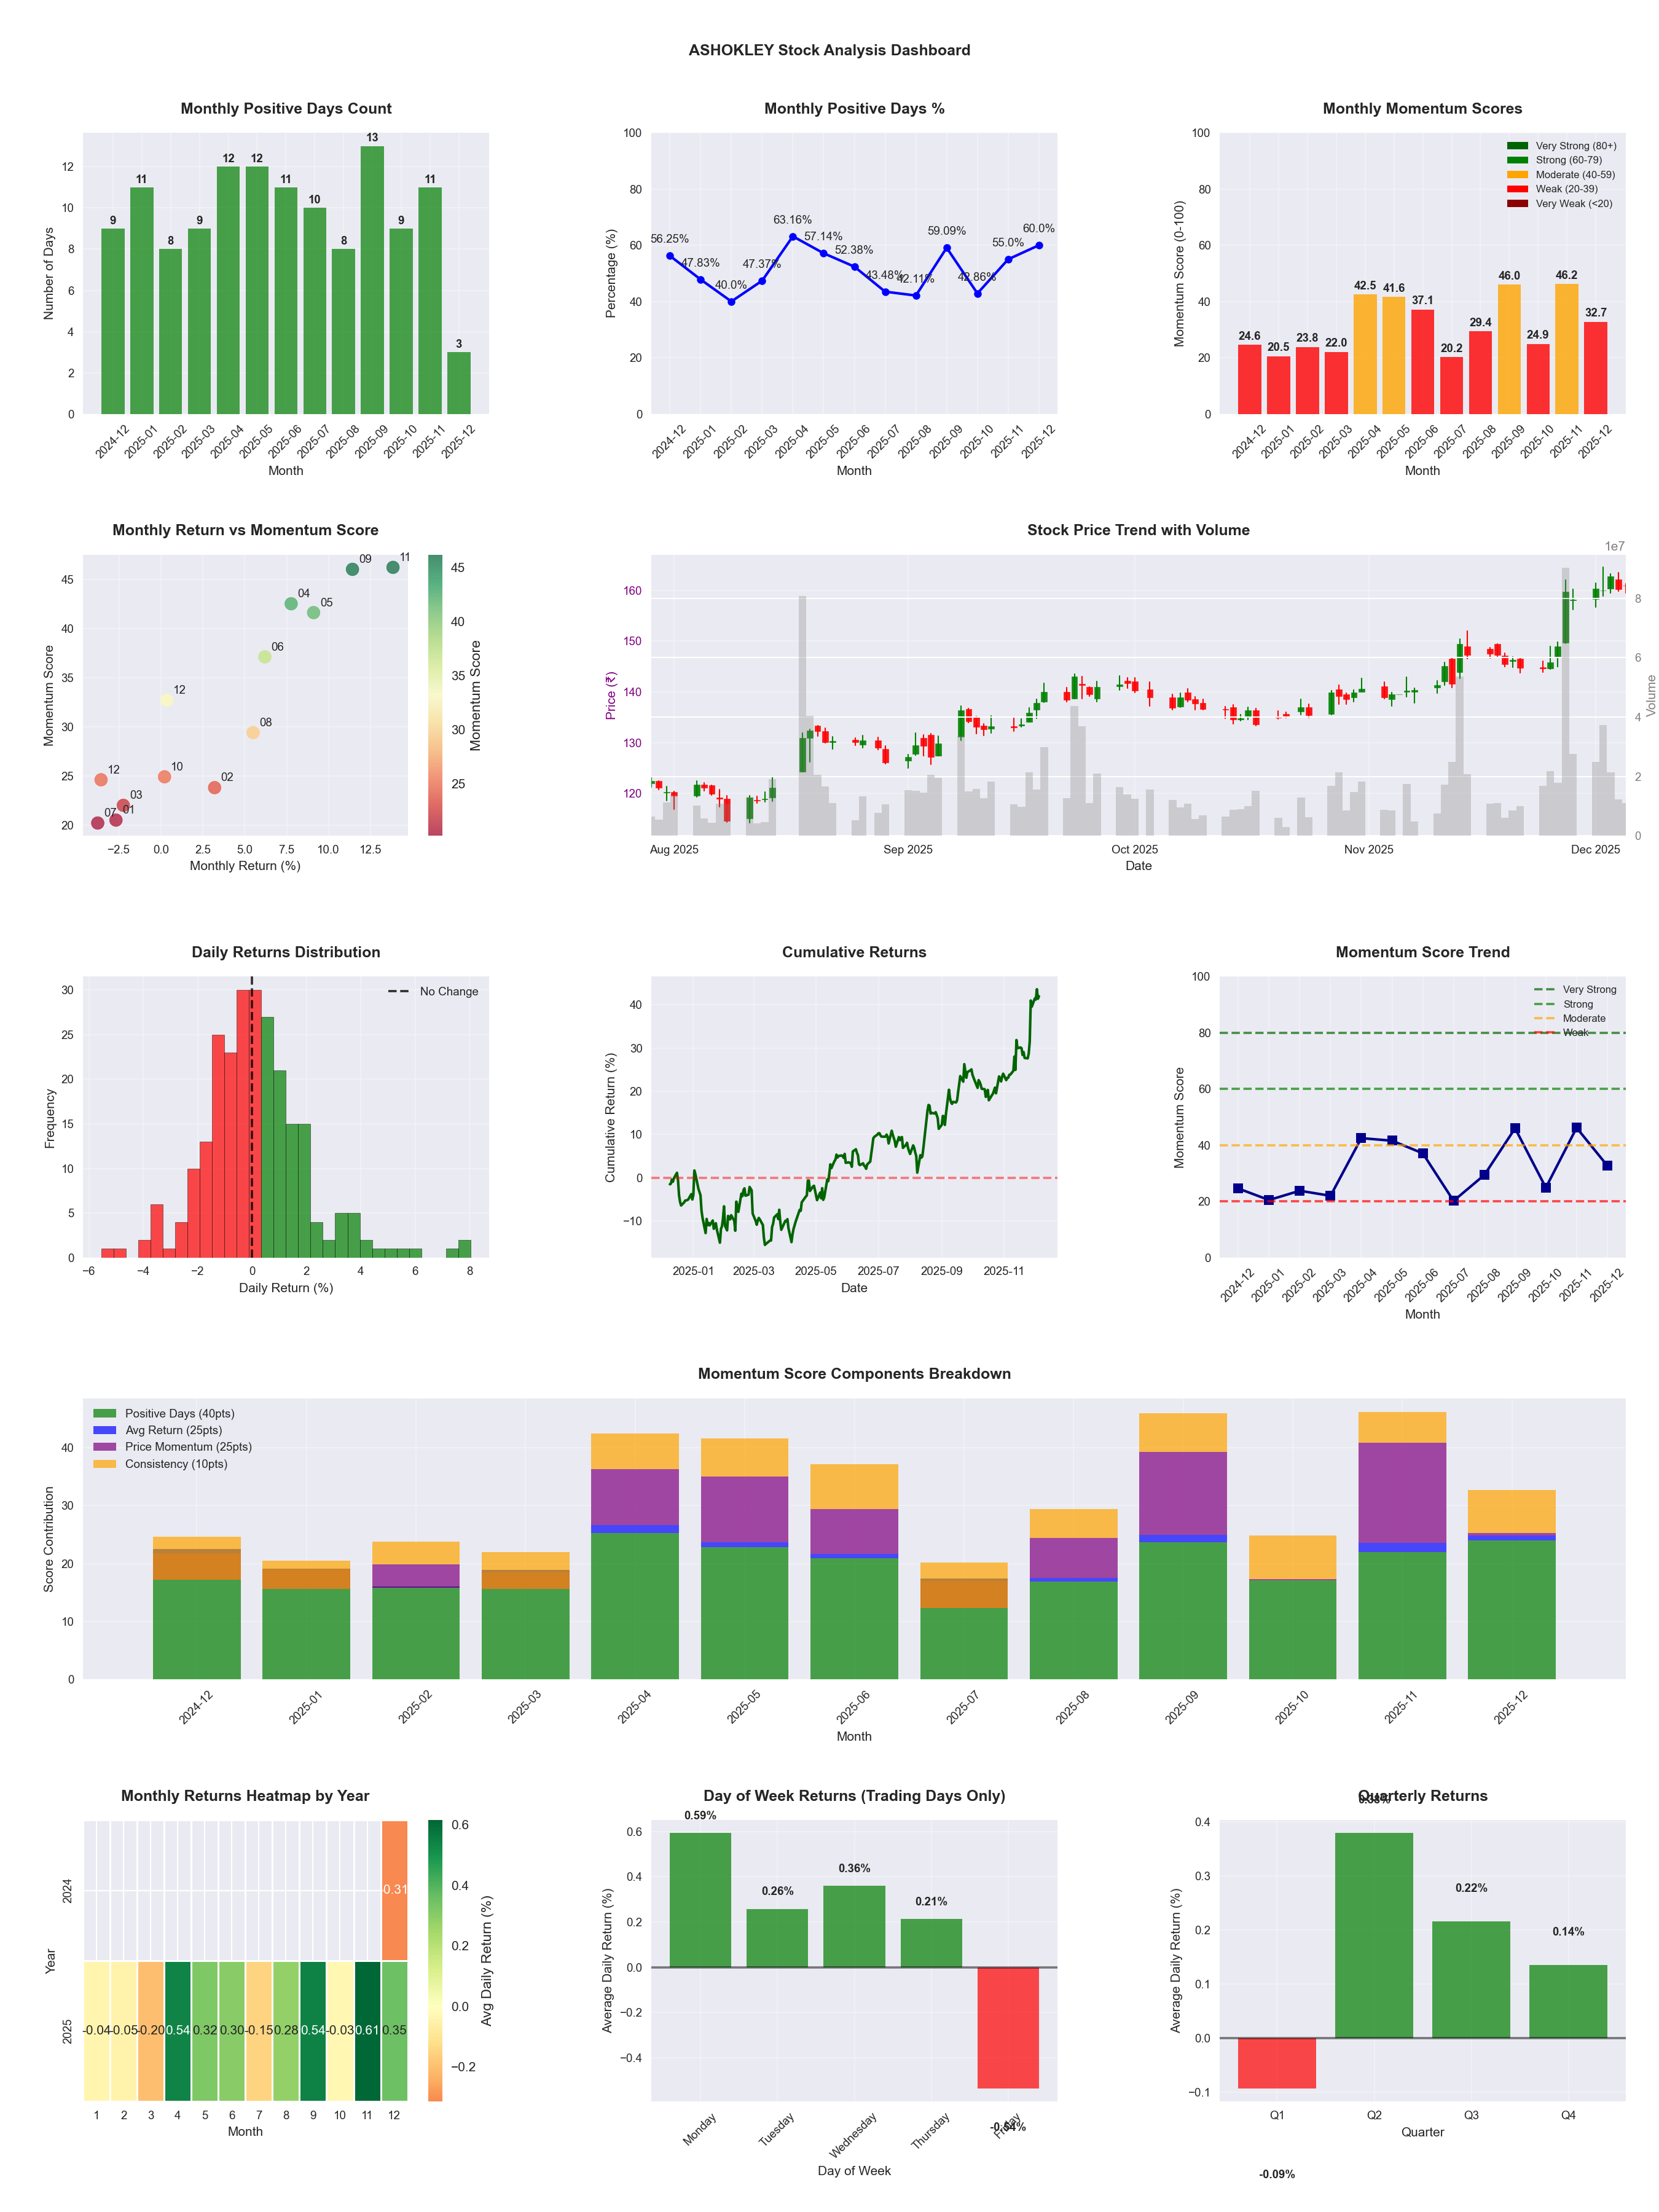
📈 ASHOKLEY
Date
📅 2026-04-11
Volatility
🟡 2.08%
Risk Profile
⚠️ suitable for aggressive investors
Win Rate
⚠️ 54.1%
Avg Daily Return
📈 +0.25%
Max Drawdown
📉 -29.95%
IBD RS Score
📊 92.5
Leader
Market Rank
#37
Best Month
🏆 2026-04
Best Months to Trade
📅 Apr, Nov, Dec
Best Days to Trade
📅 Monday, Tuesday
📊 Key Insights & Metrics
Symbol
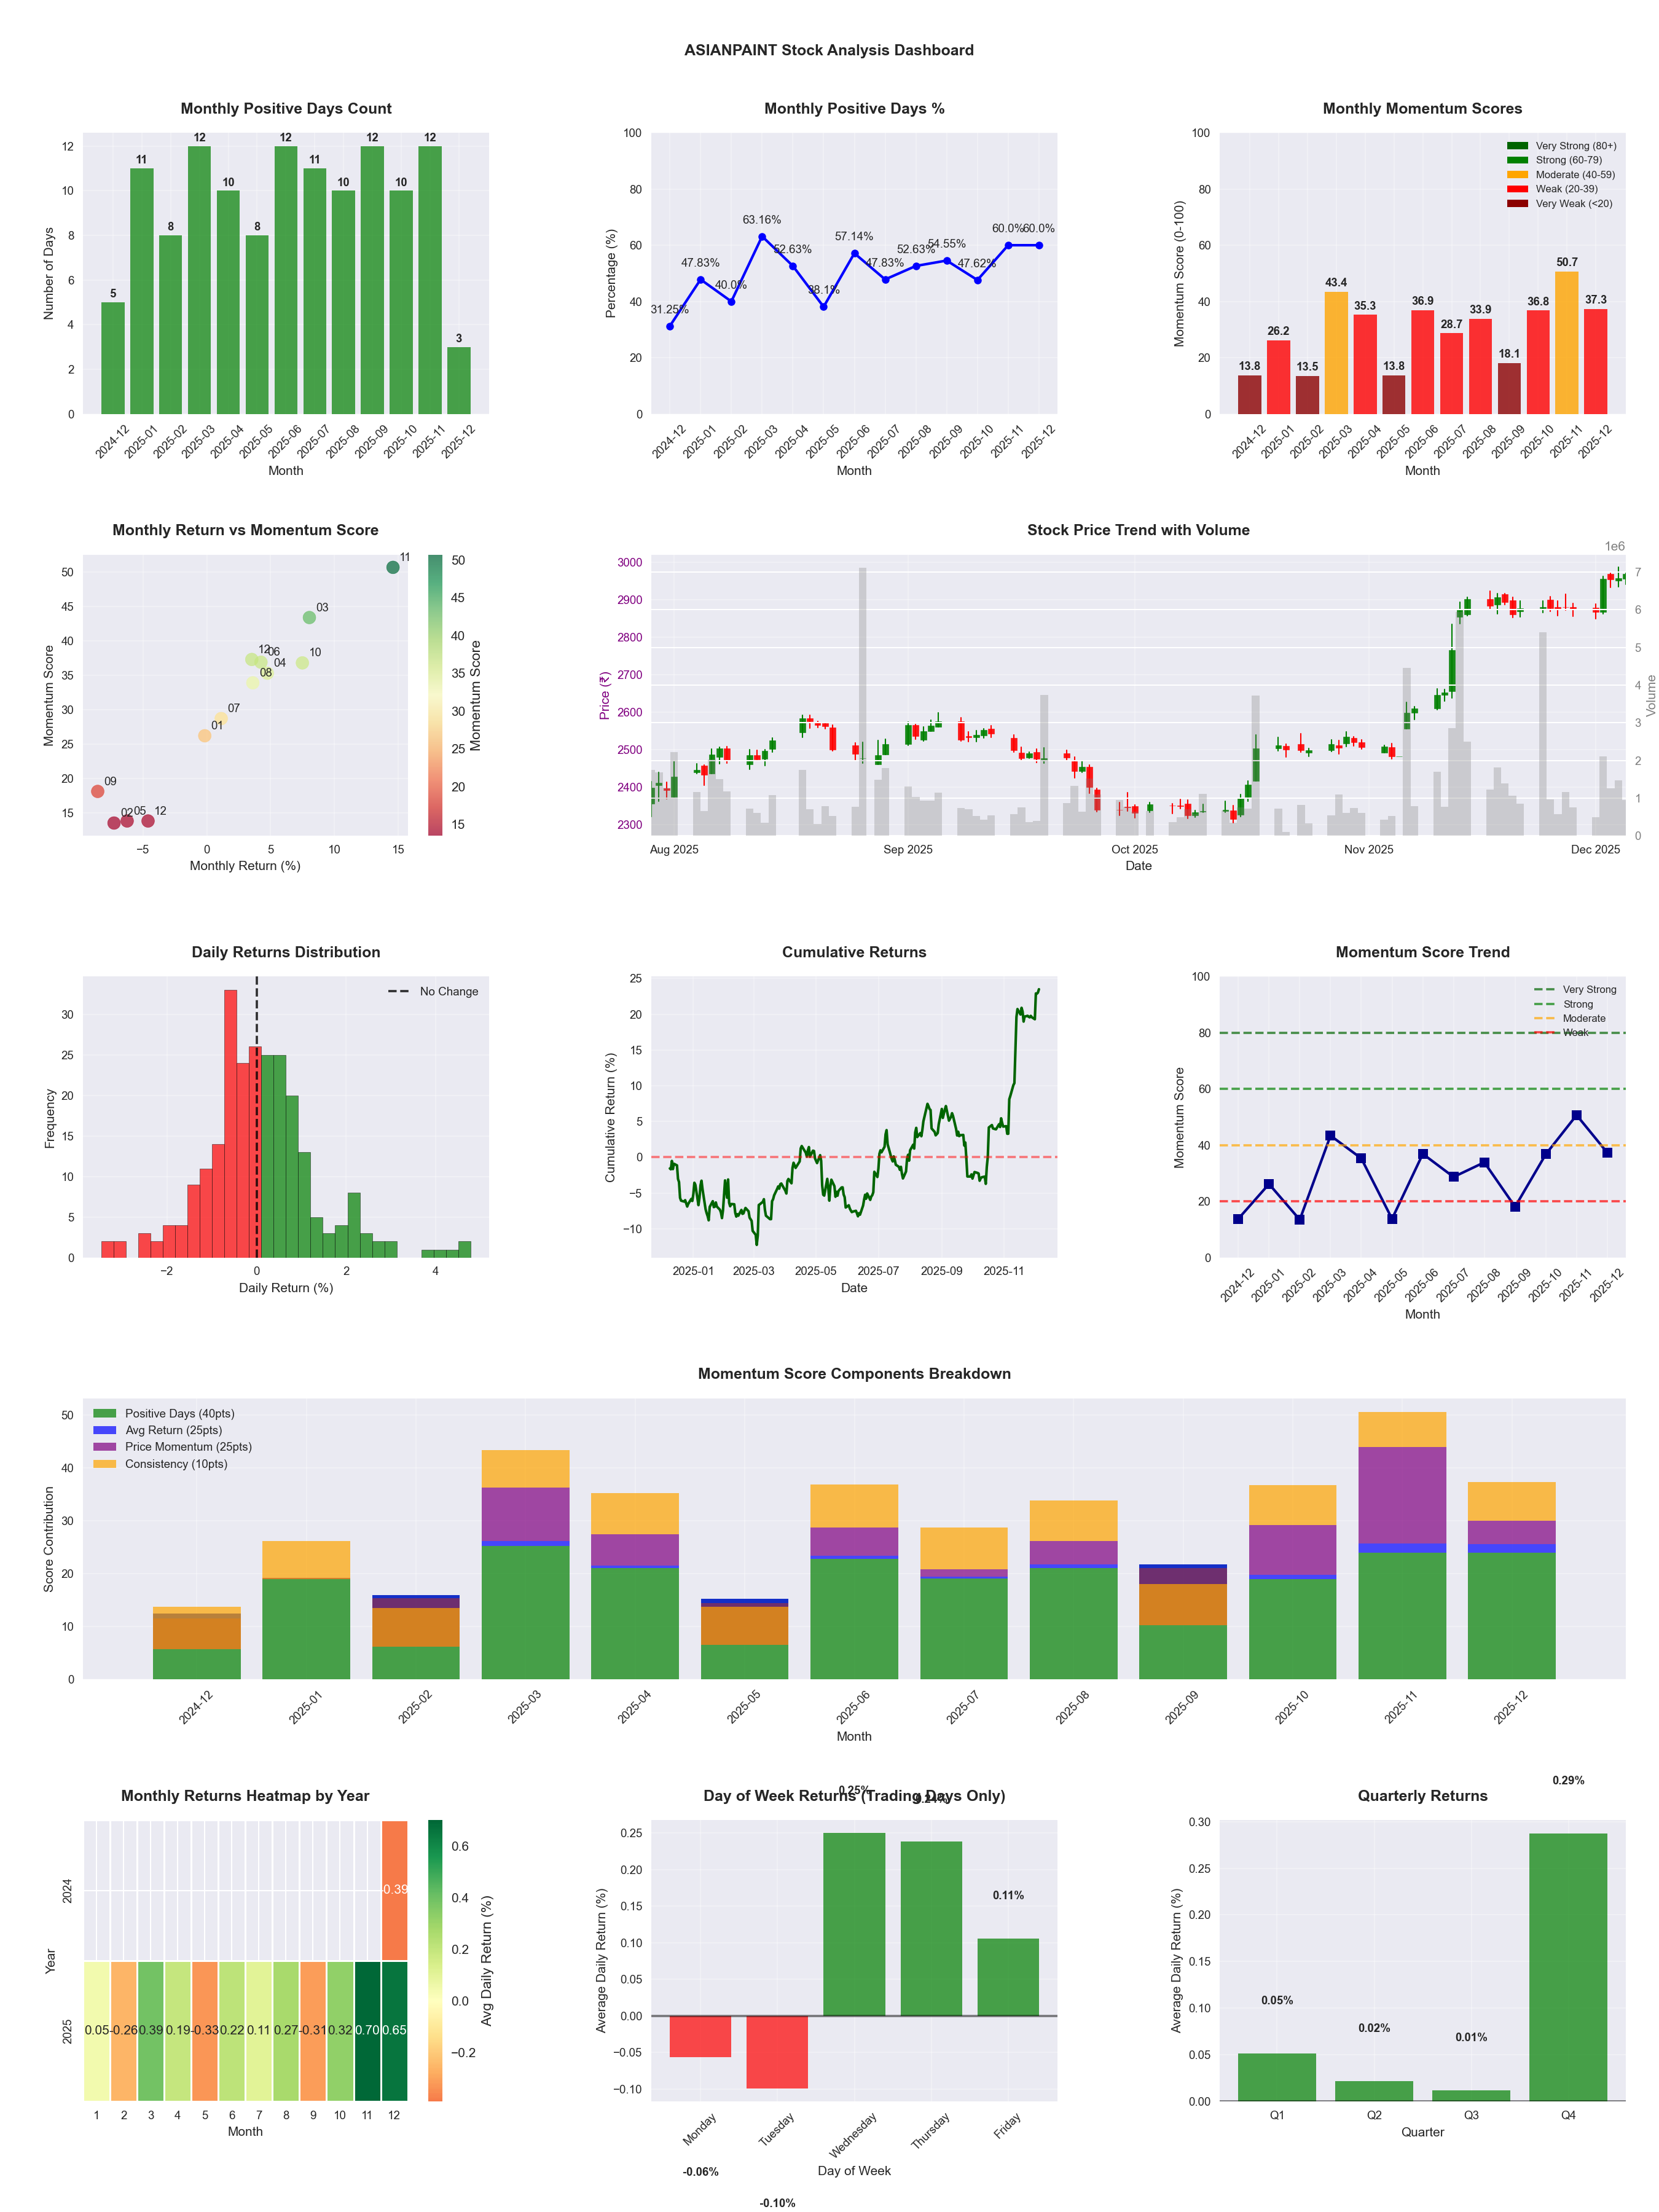
📈 ASIANPAINT
Date
📅 2026-04-11
Volatility
🟢 1.46%
Win Rate
⚠️ 49.2%
Avg Daily Return
📈 +0.01%
Max Drawdown
📉 -28.54%
IBD RS Score
📊 45.2
Weak
Market Rank
#270
Best Month
🏆 2025-11
Worst Month
📉 2026-01
Best Months to Trade
📅 Nov, Apr, Oct
Best Days to Trade
📅 Wednesday, Monday
📊 Key Insights & Metrics
Symbol
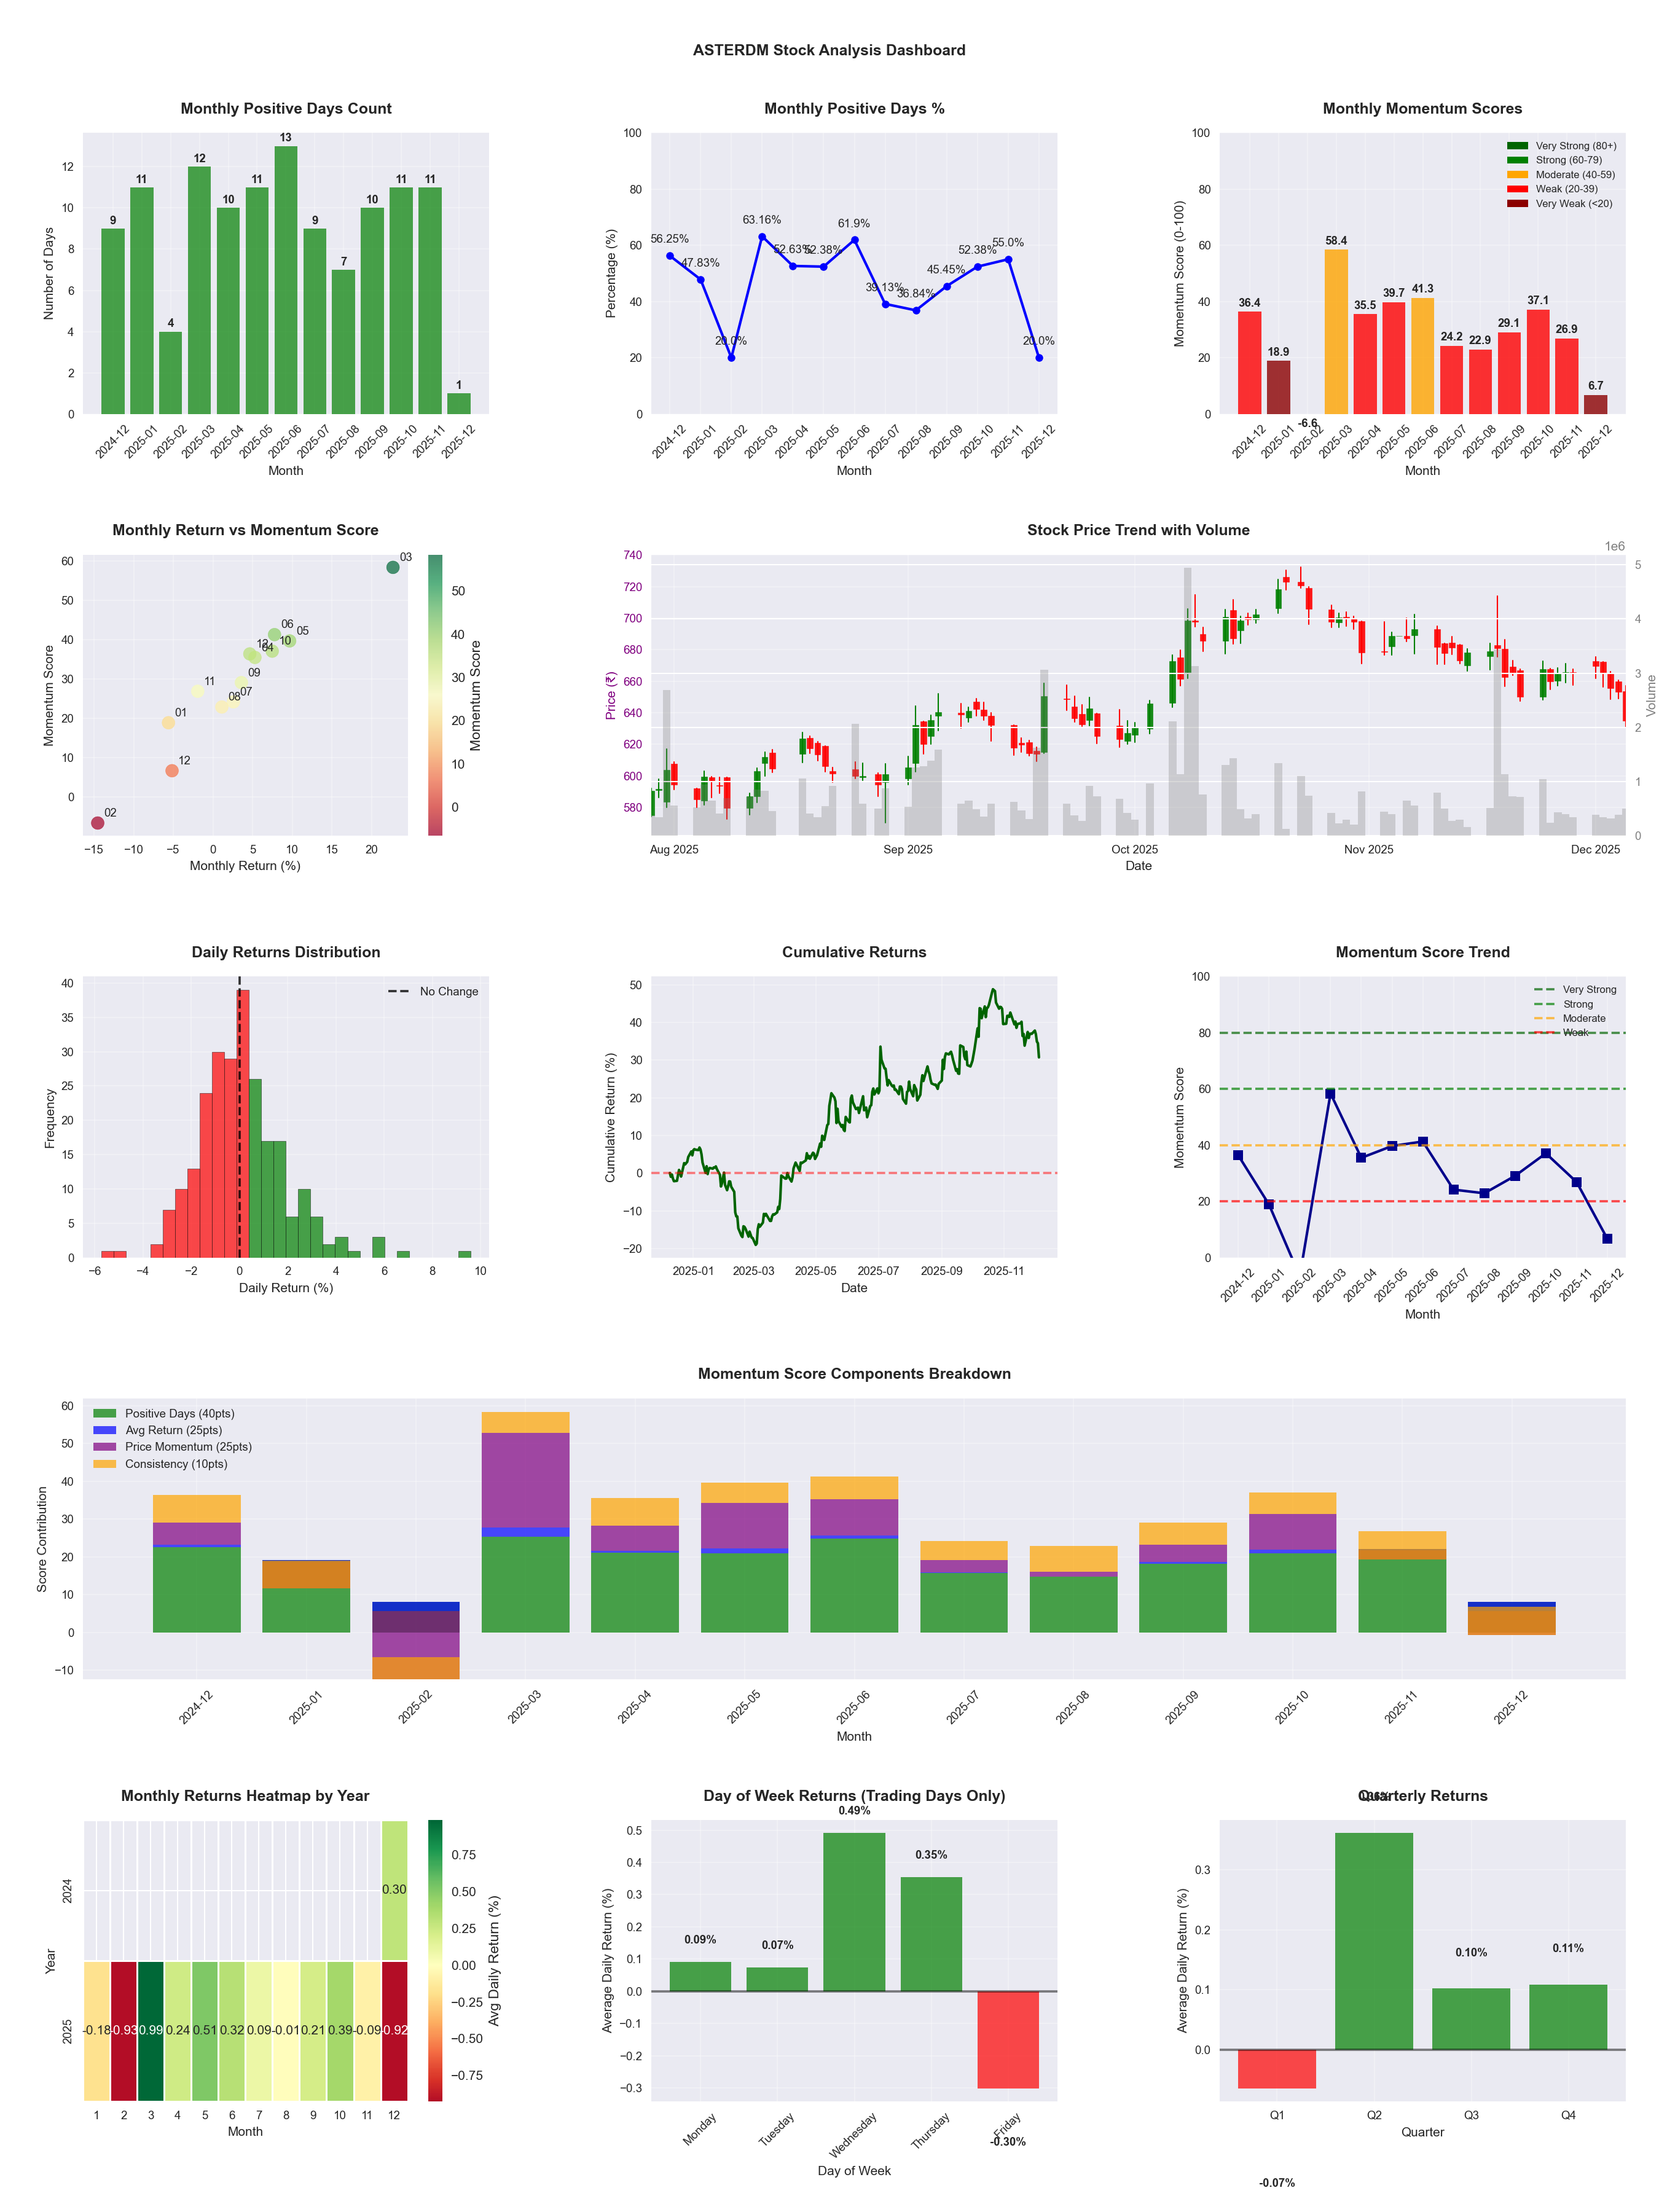
📈 ASTERDM
Date
📅 2026-04-11
Volatility
🟡 1.95%
Win Rate
⚠️ 50.4%
Avg Daily Return
📈 +0.15%
Max Drawdown
📉 -25.59%
IBD RS Score
📊 83.4
Strong
Market Rank
#82
Best Month
🏆 2026-02
Worst Month
📉 2026-01
Best Months to Trade
📅 Feb, May, Oct
Best Days to Trade
📅 Wednesday, Monday
📊 Key Insights & Metrics
Symbol
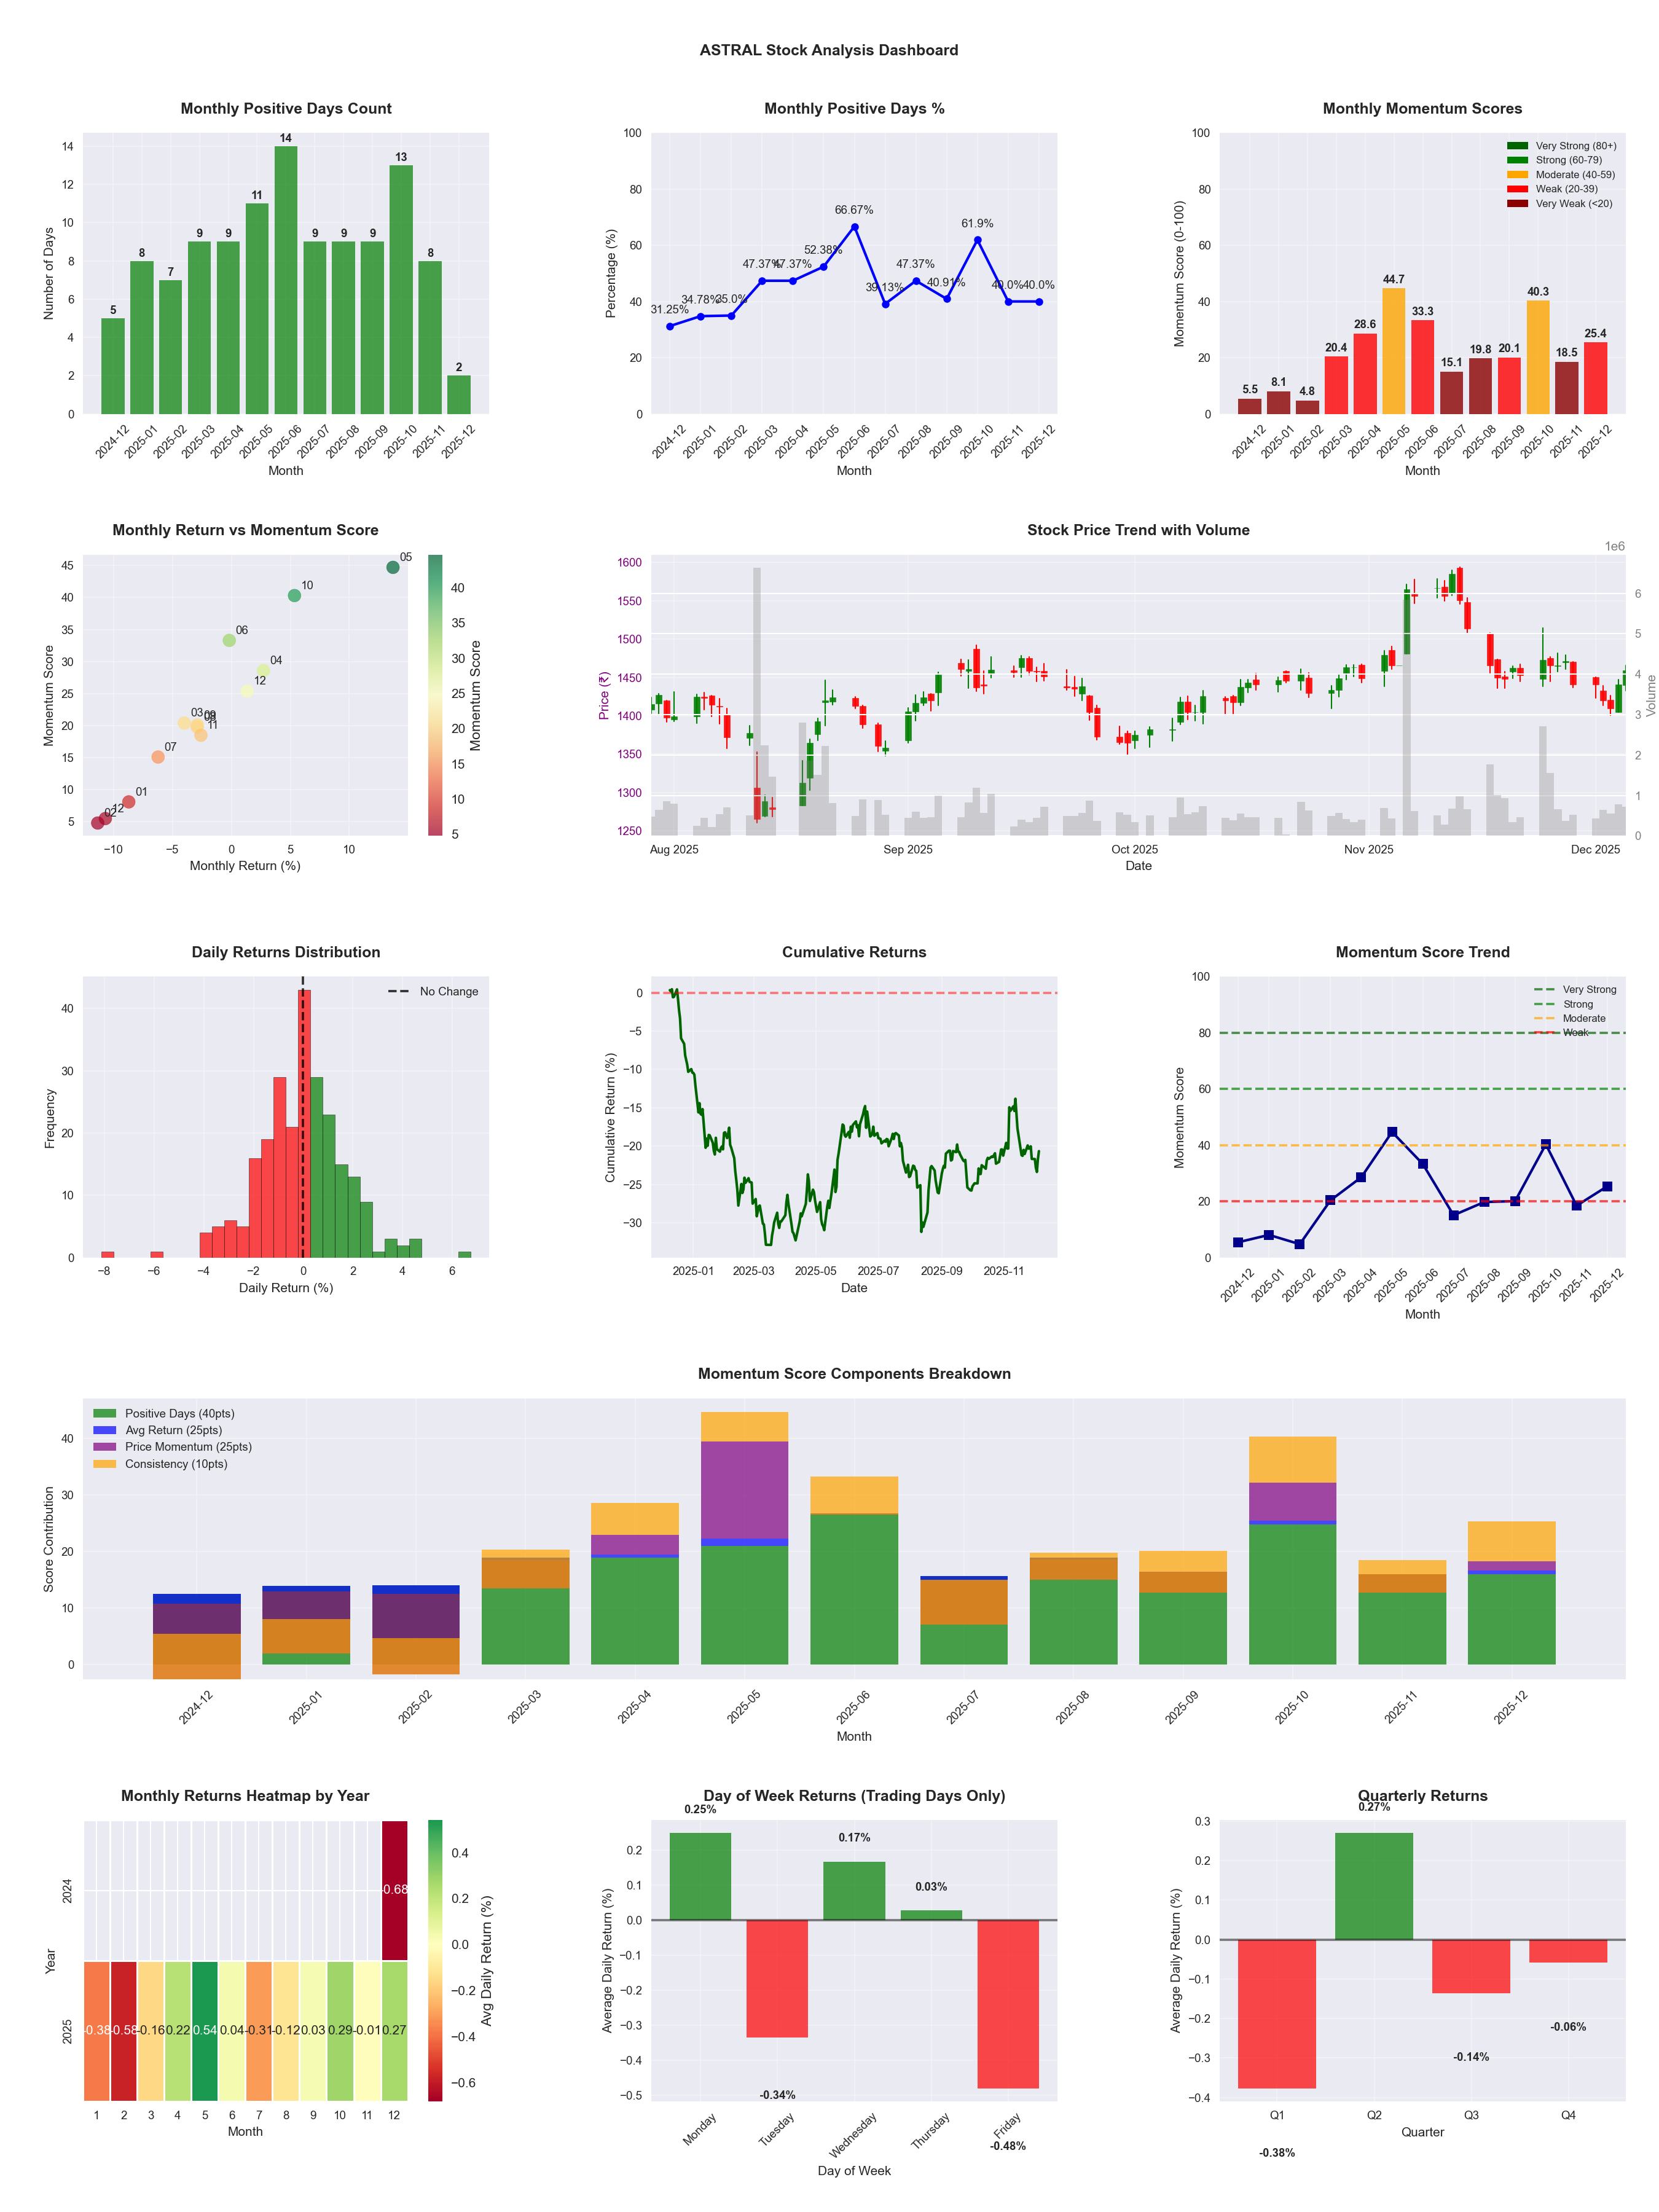
📈 ASTRAL
Date
📅 2026-04-11
Volatility
🟡 1.91%
Win Rate
⚠️ 50.4%
Avg Daily Return
📈 +0.13%
Max Drawdown
📉 -19.25%
IBD RS Score
📊 83.8
Strong
Market Rank
#80
Best Month
🏆 2026-02
Worst Month
📉 2025-07
Best Months to Trade
📅 Feb, Apr, May
Best Days to Trade
📅 Wednesday, Monday
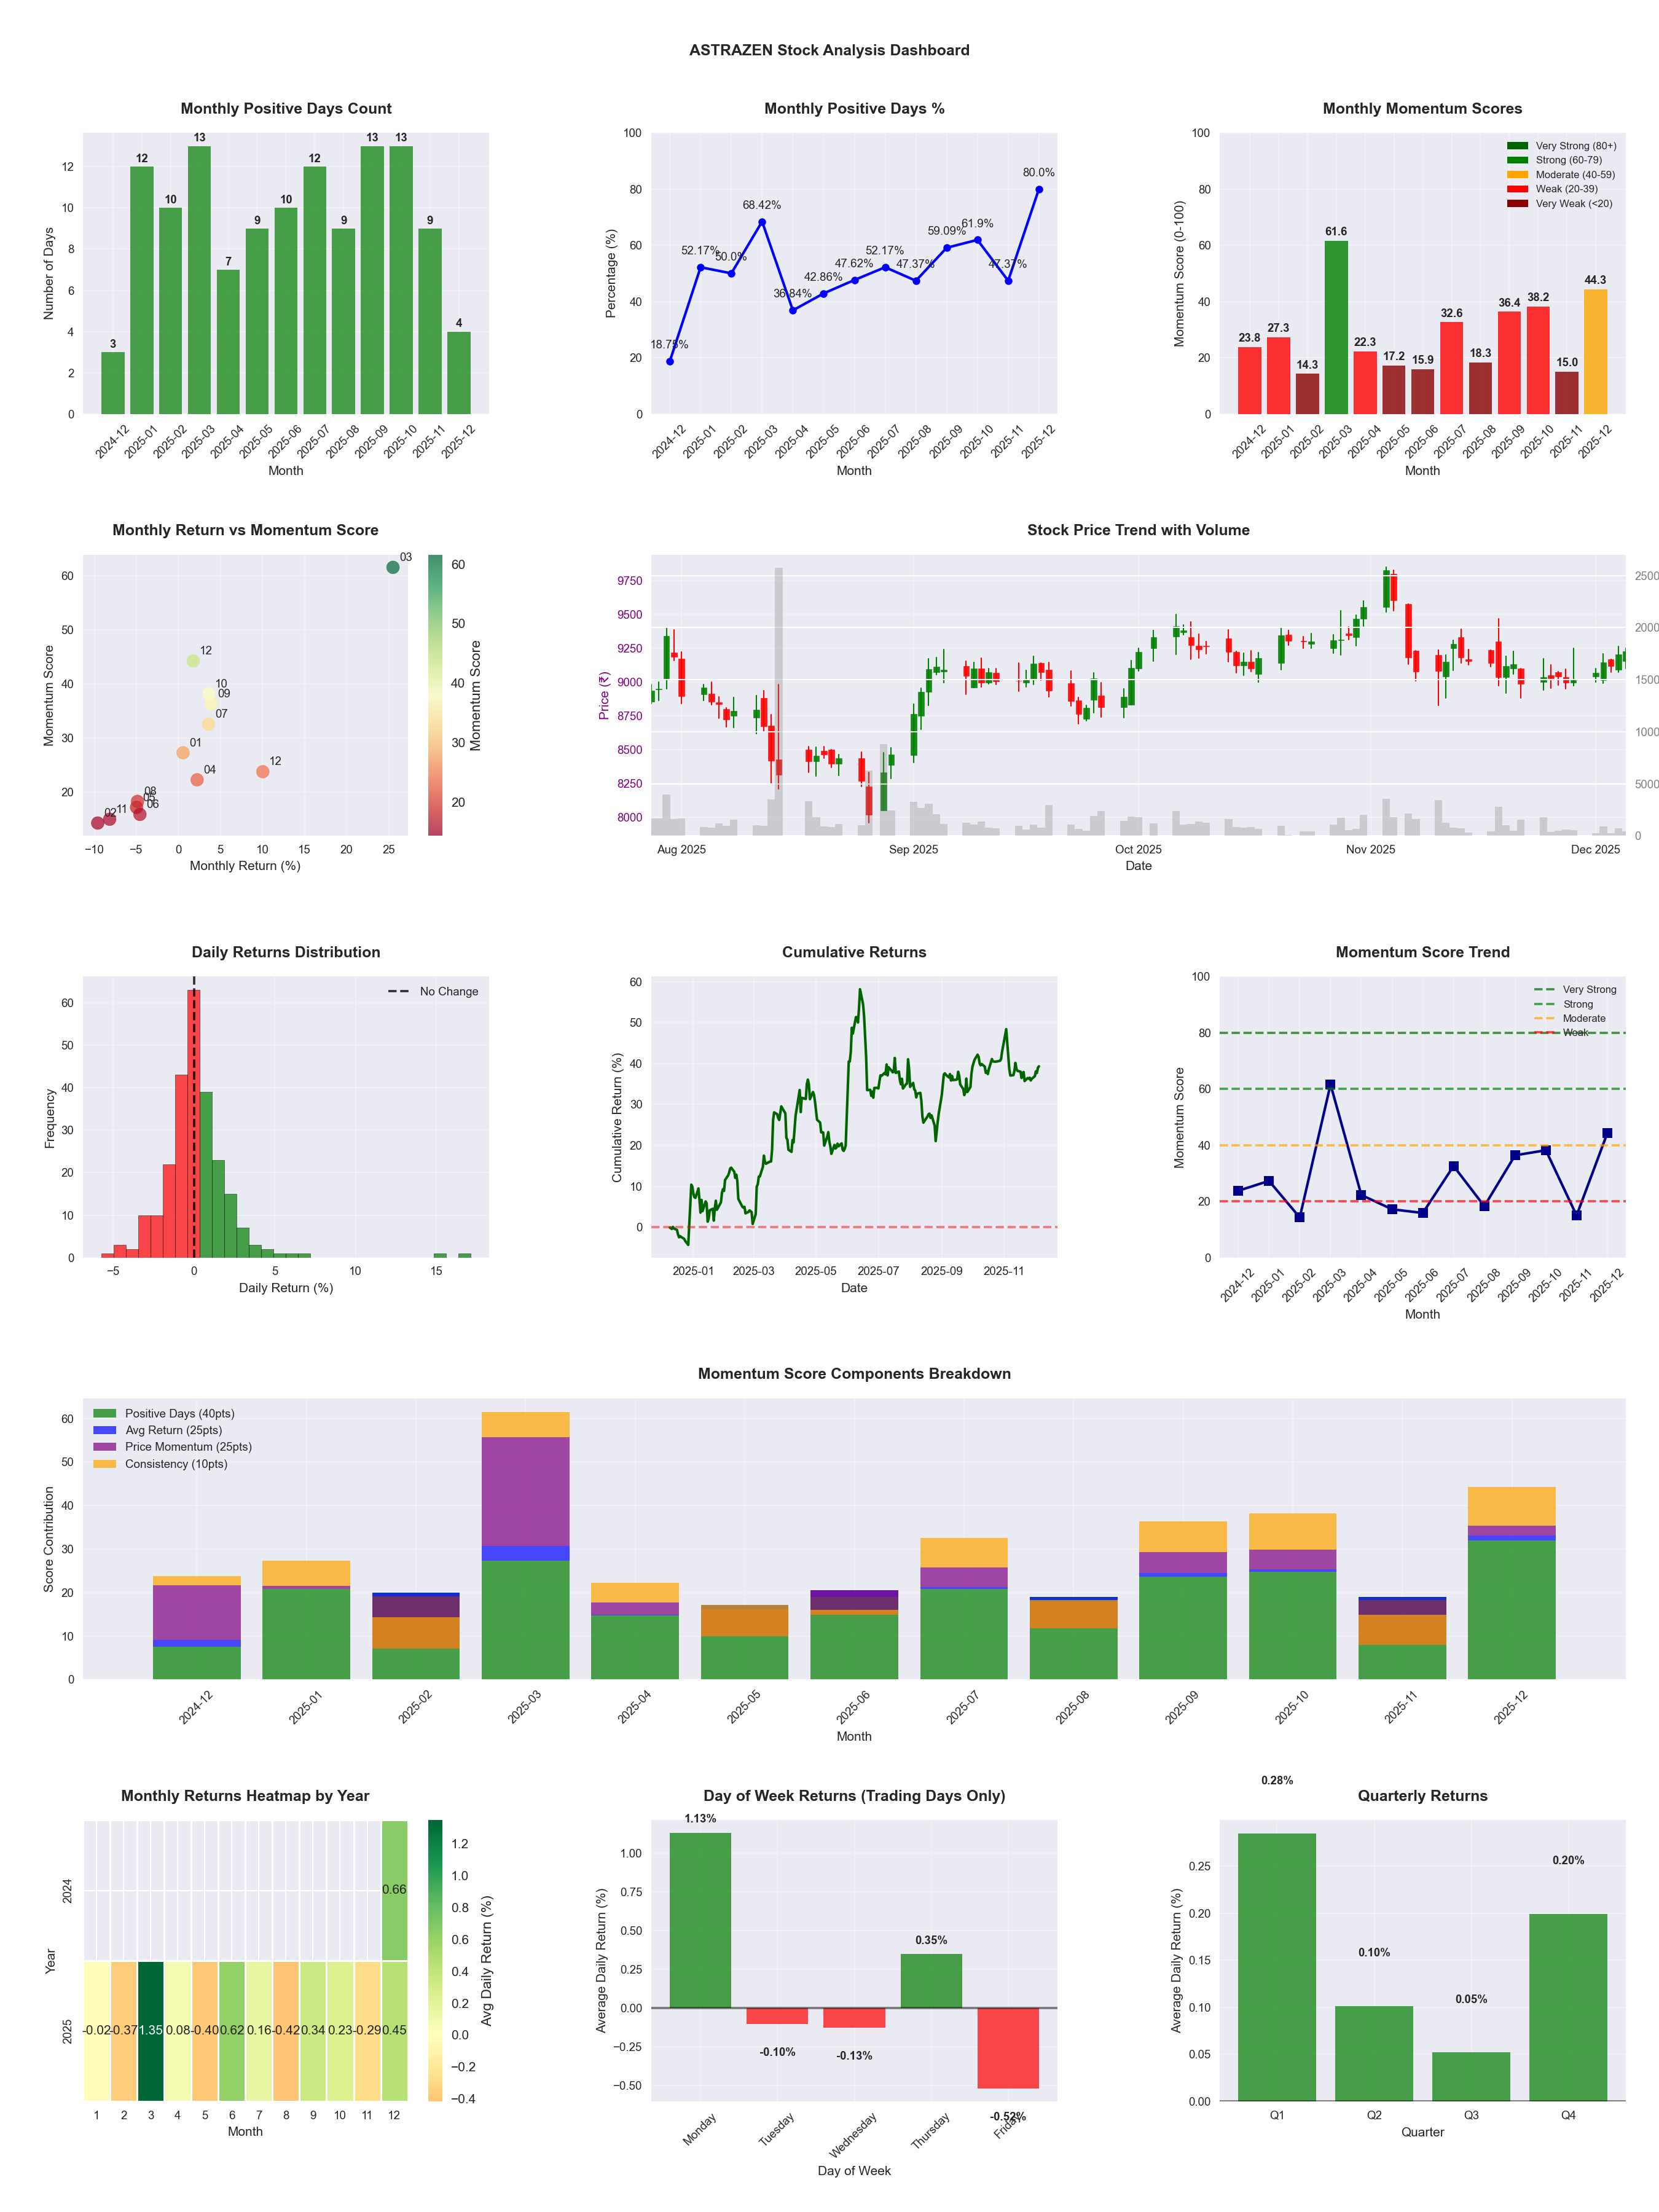
📊 Key Insights & Metrics
Symbol
📈 ASTRAZEN
Date
📅 2026-04-11
Volatility
🟡 1.92%
Win Rate
⚠️ 49.8%
Avg Daily Return
📈 +0.01%
Max Drawdown
📉 -25.86%
IBD RS Score
📊 51.5
Average
Market Rank
#239
Best Month
🏆 2026-04
Worst Month
📉 2026-03
Best Months to Trade
📅 Jun, Apr, Sep
Best Days to Trade
📅 Monday, Wednesday
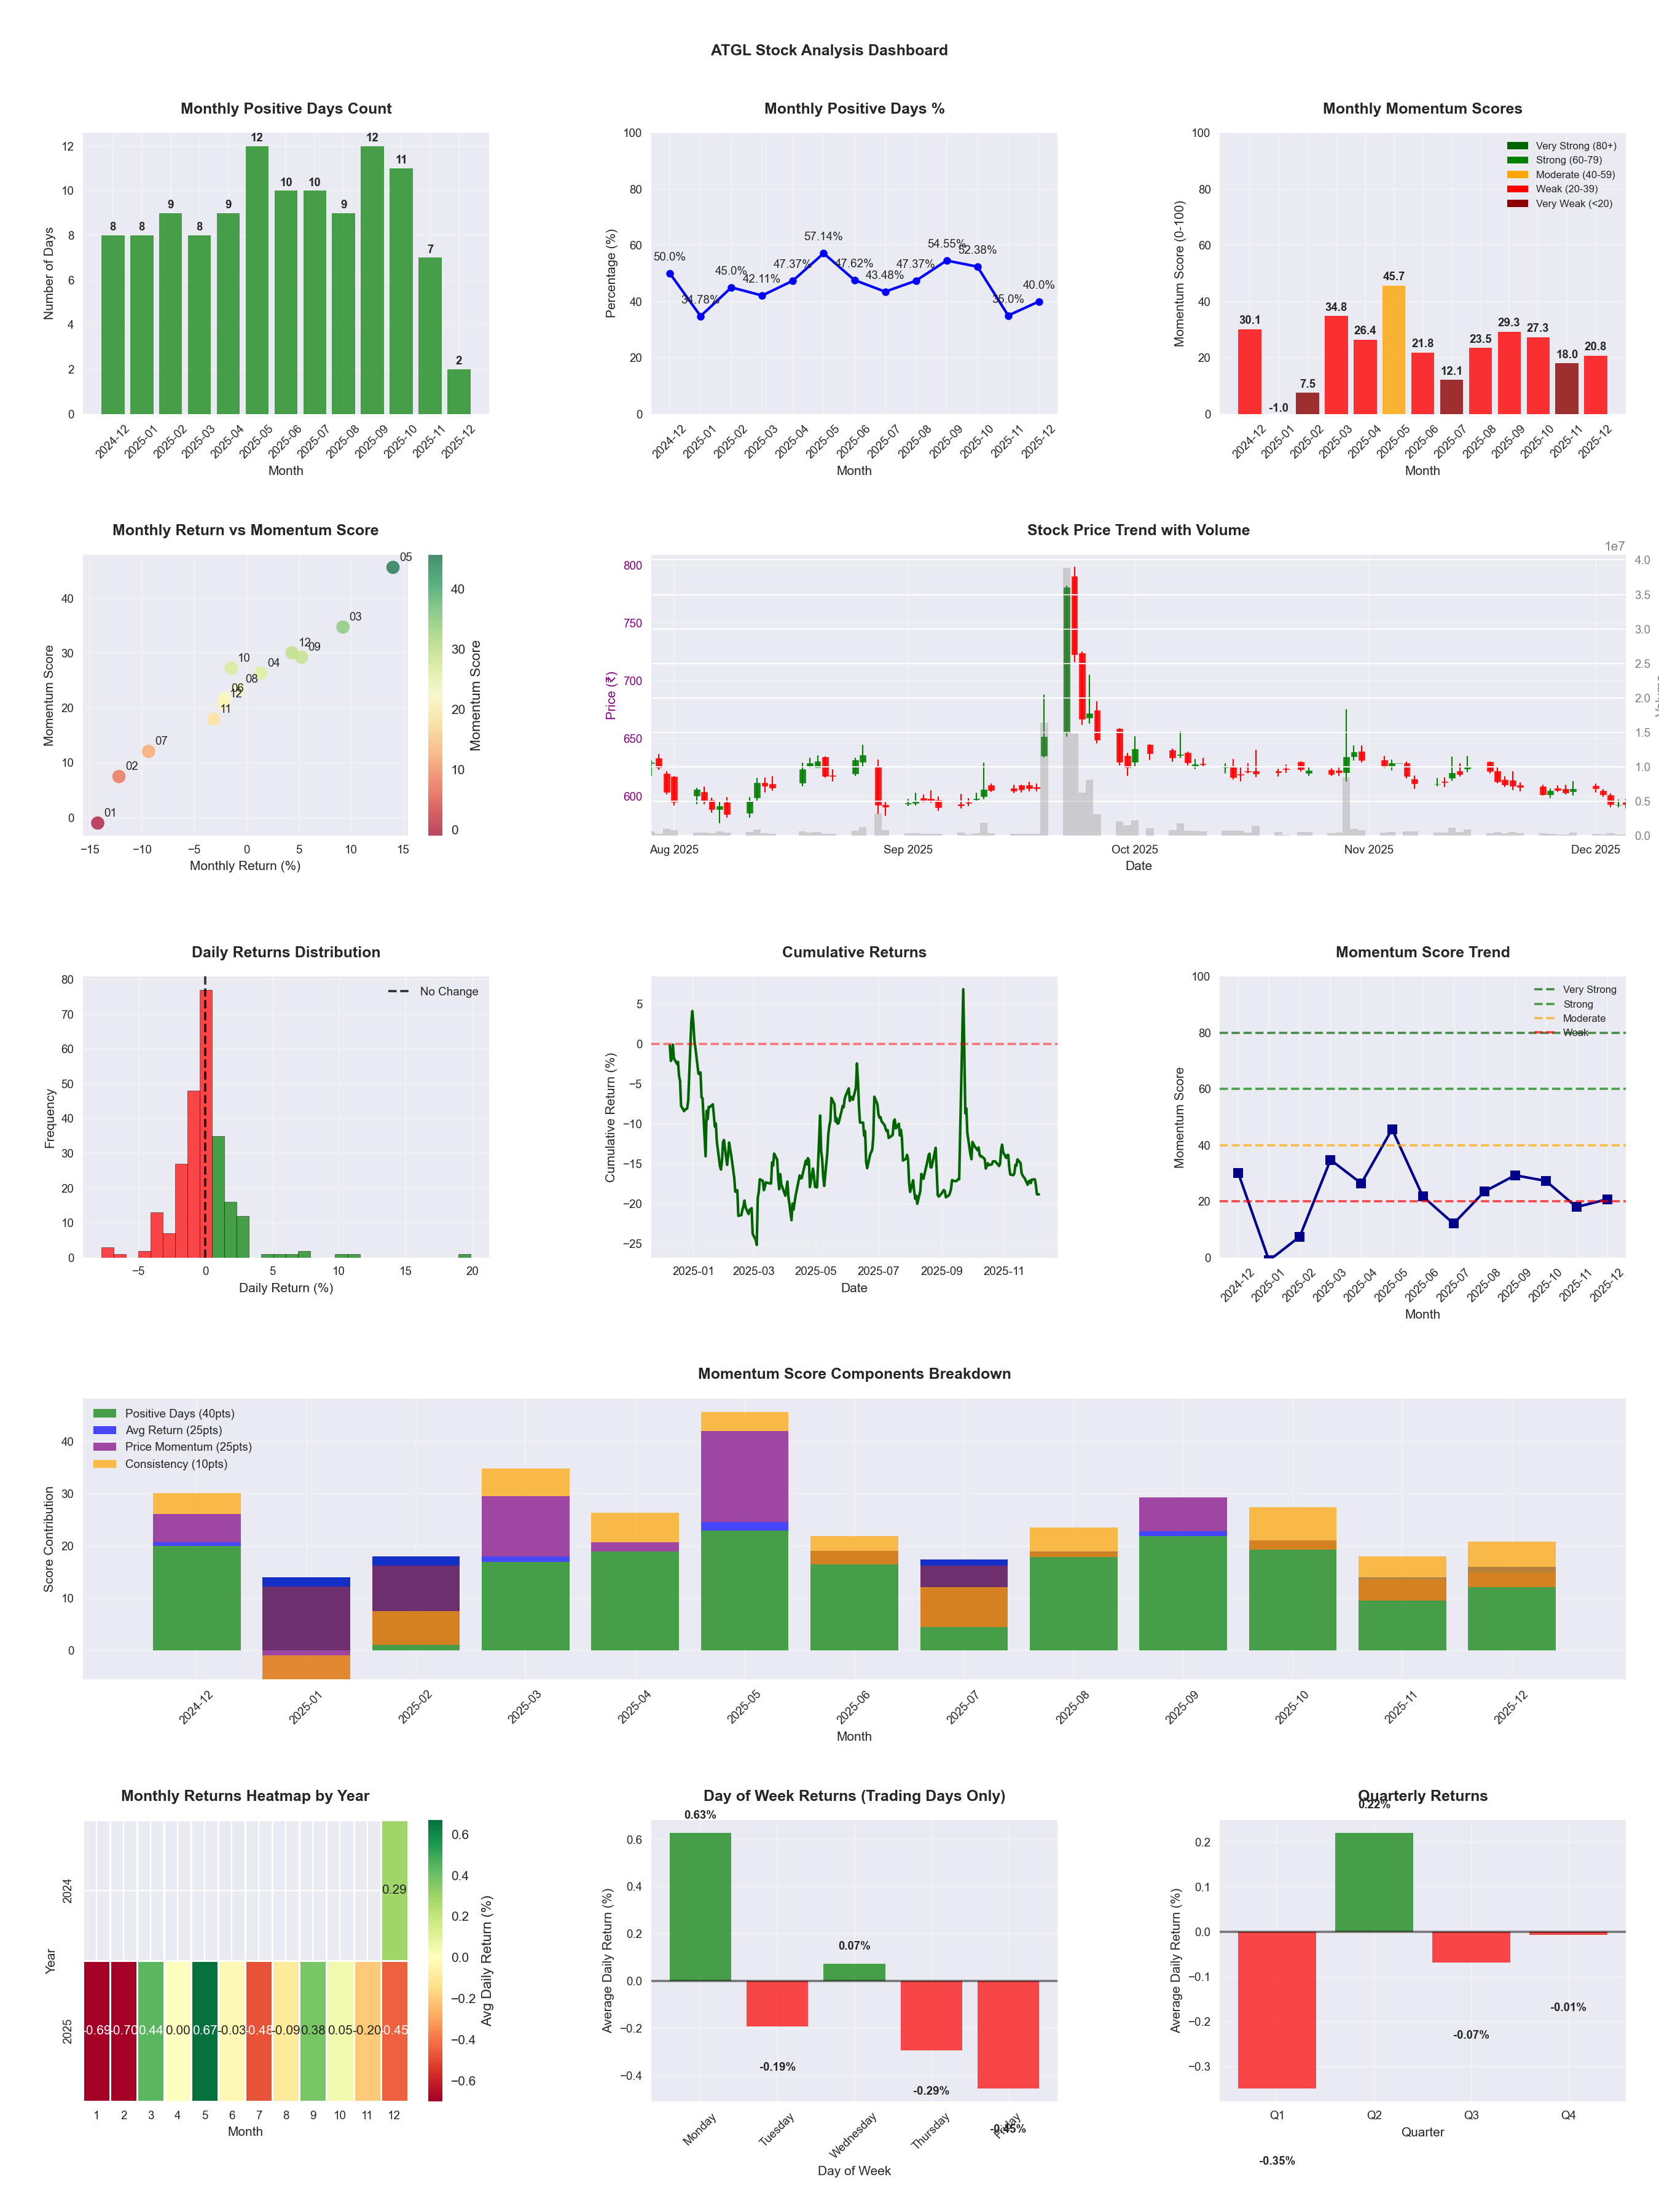
📊 Key Insights & Metrics
Symbol
📈 ATGL
Date
📅 2026-04-11
Volatility
🟡 2.91%
Risk Profile
⚠️ suitable for aggressive investors
Win Rate
⚠️ 43.5%
Avg Daily Return
📈 +0.03%
Max Drawdown
📉 -40.07%
IBD RS Score
📊 58.4
Average
Market Rank
#205
Best Month
🏆 2025-05
Worst Month
📉 2026-01
Best Months to Trade
📅 Apr, May, Sep
Best Days to Trade
📅 Wednesday, Monday
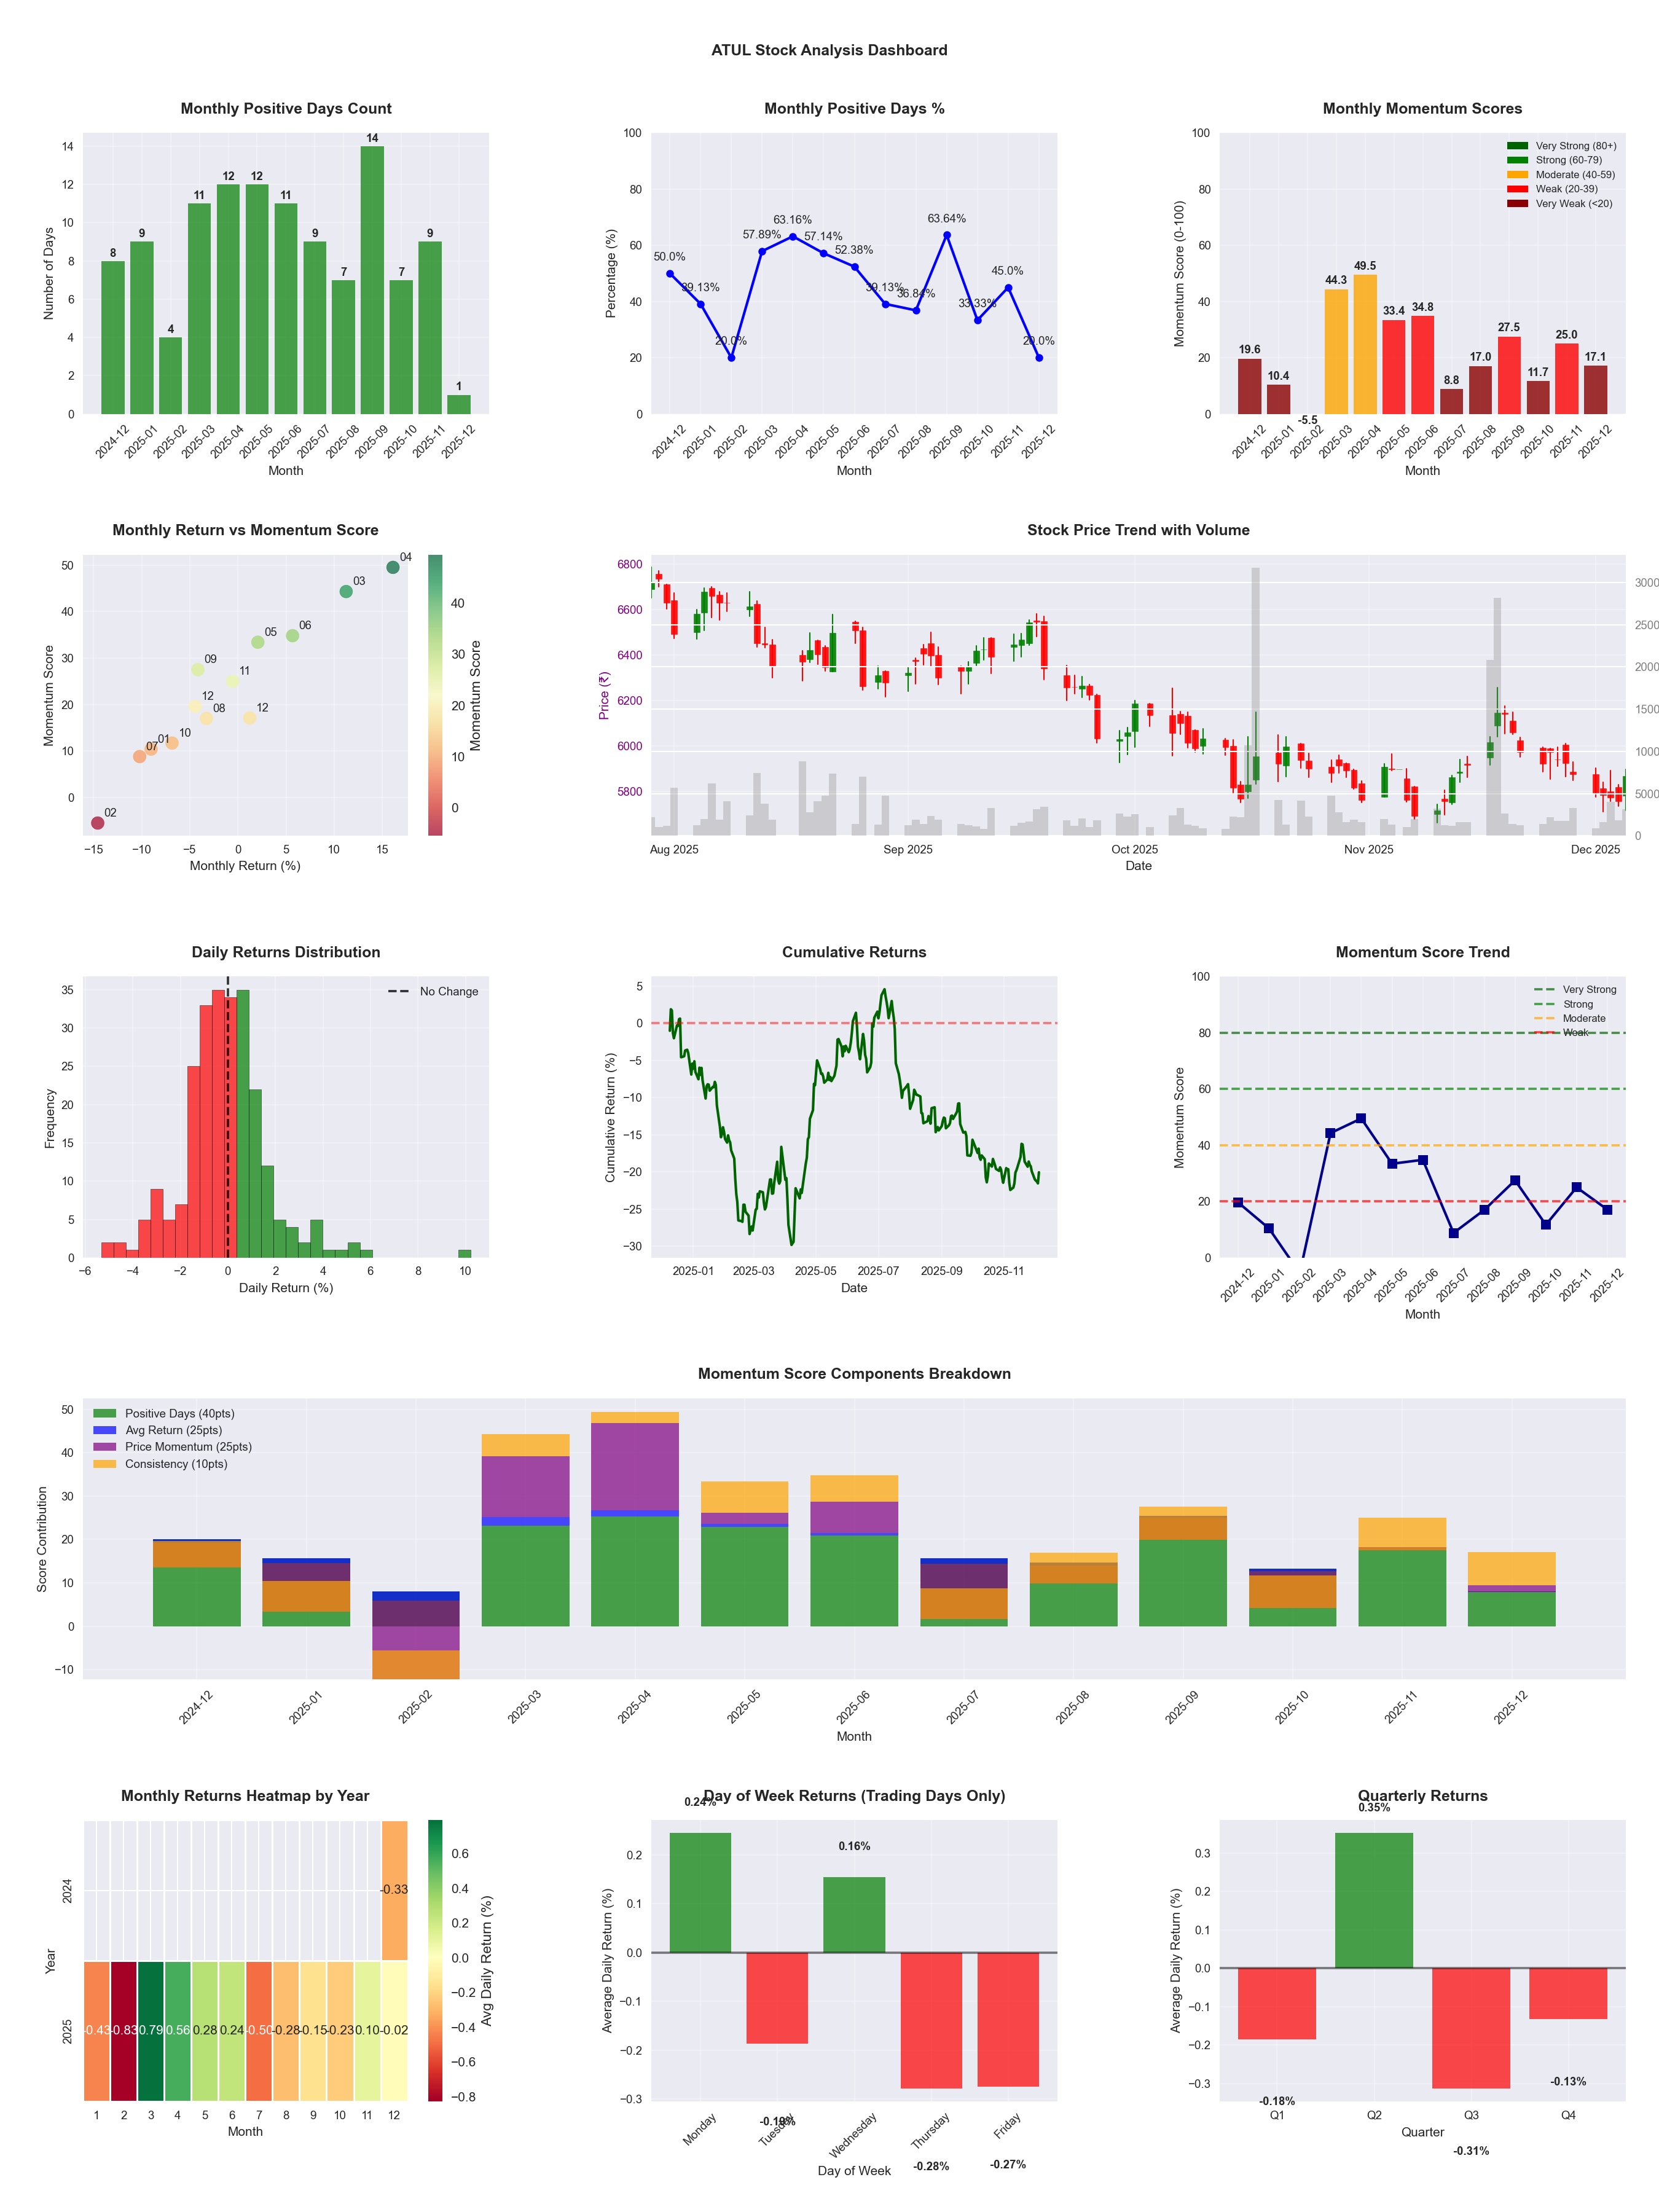
📊 Key Insights & Metrics
Symbol
📈 ATUL
Date
📅 2026-04-11
Volatility
🟡 1.65%
Win Rate
⚠️ 49.2%
Avg Daily Return
📈 +0.06%
Max Drawdown
📉 -26.15%
IBD RS Score
📊 70.2
Strong
Market Rank
#147
Best Month
🏆 2025-04
Worst Month
📉 2025-07
Best Months to Trade
📅 Apr, Feb, May
Best Days to Trade
📅 Wednesday, Friday
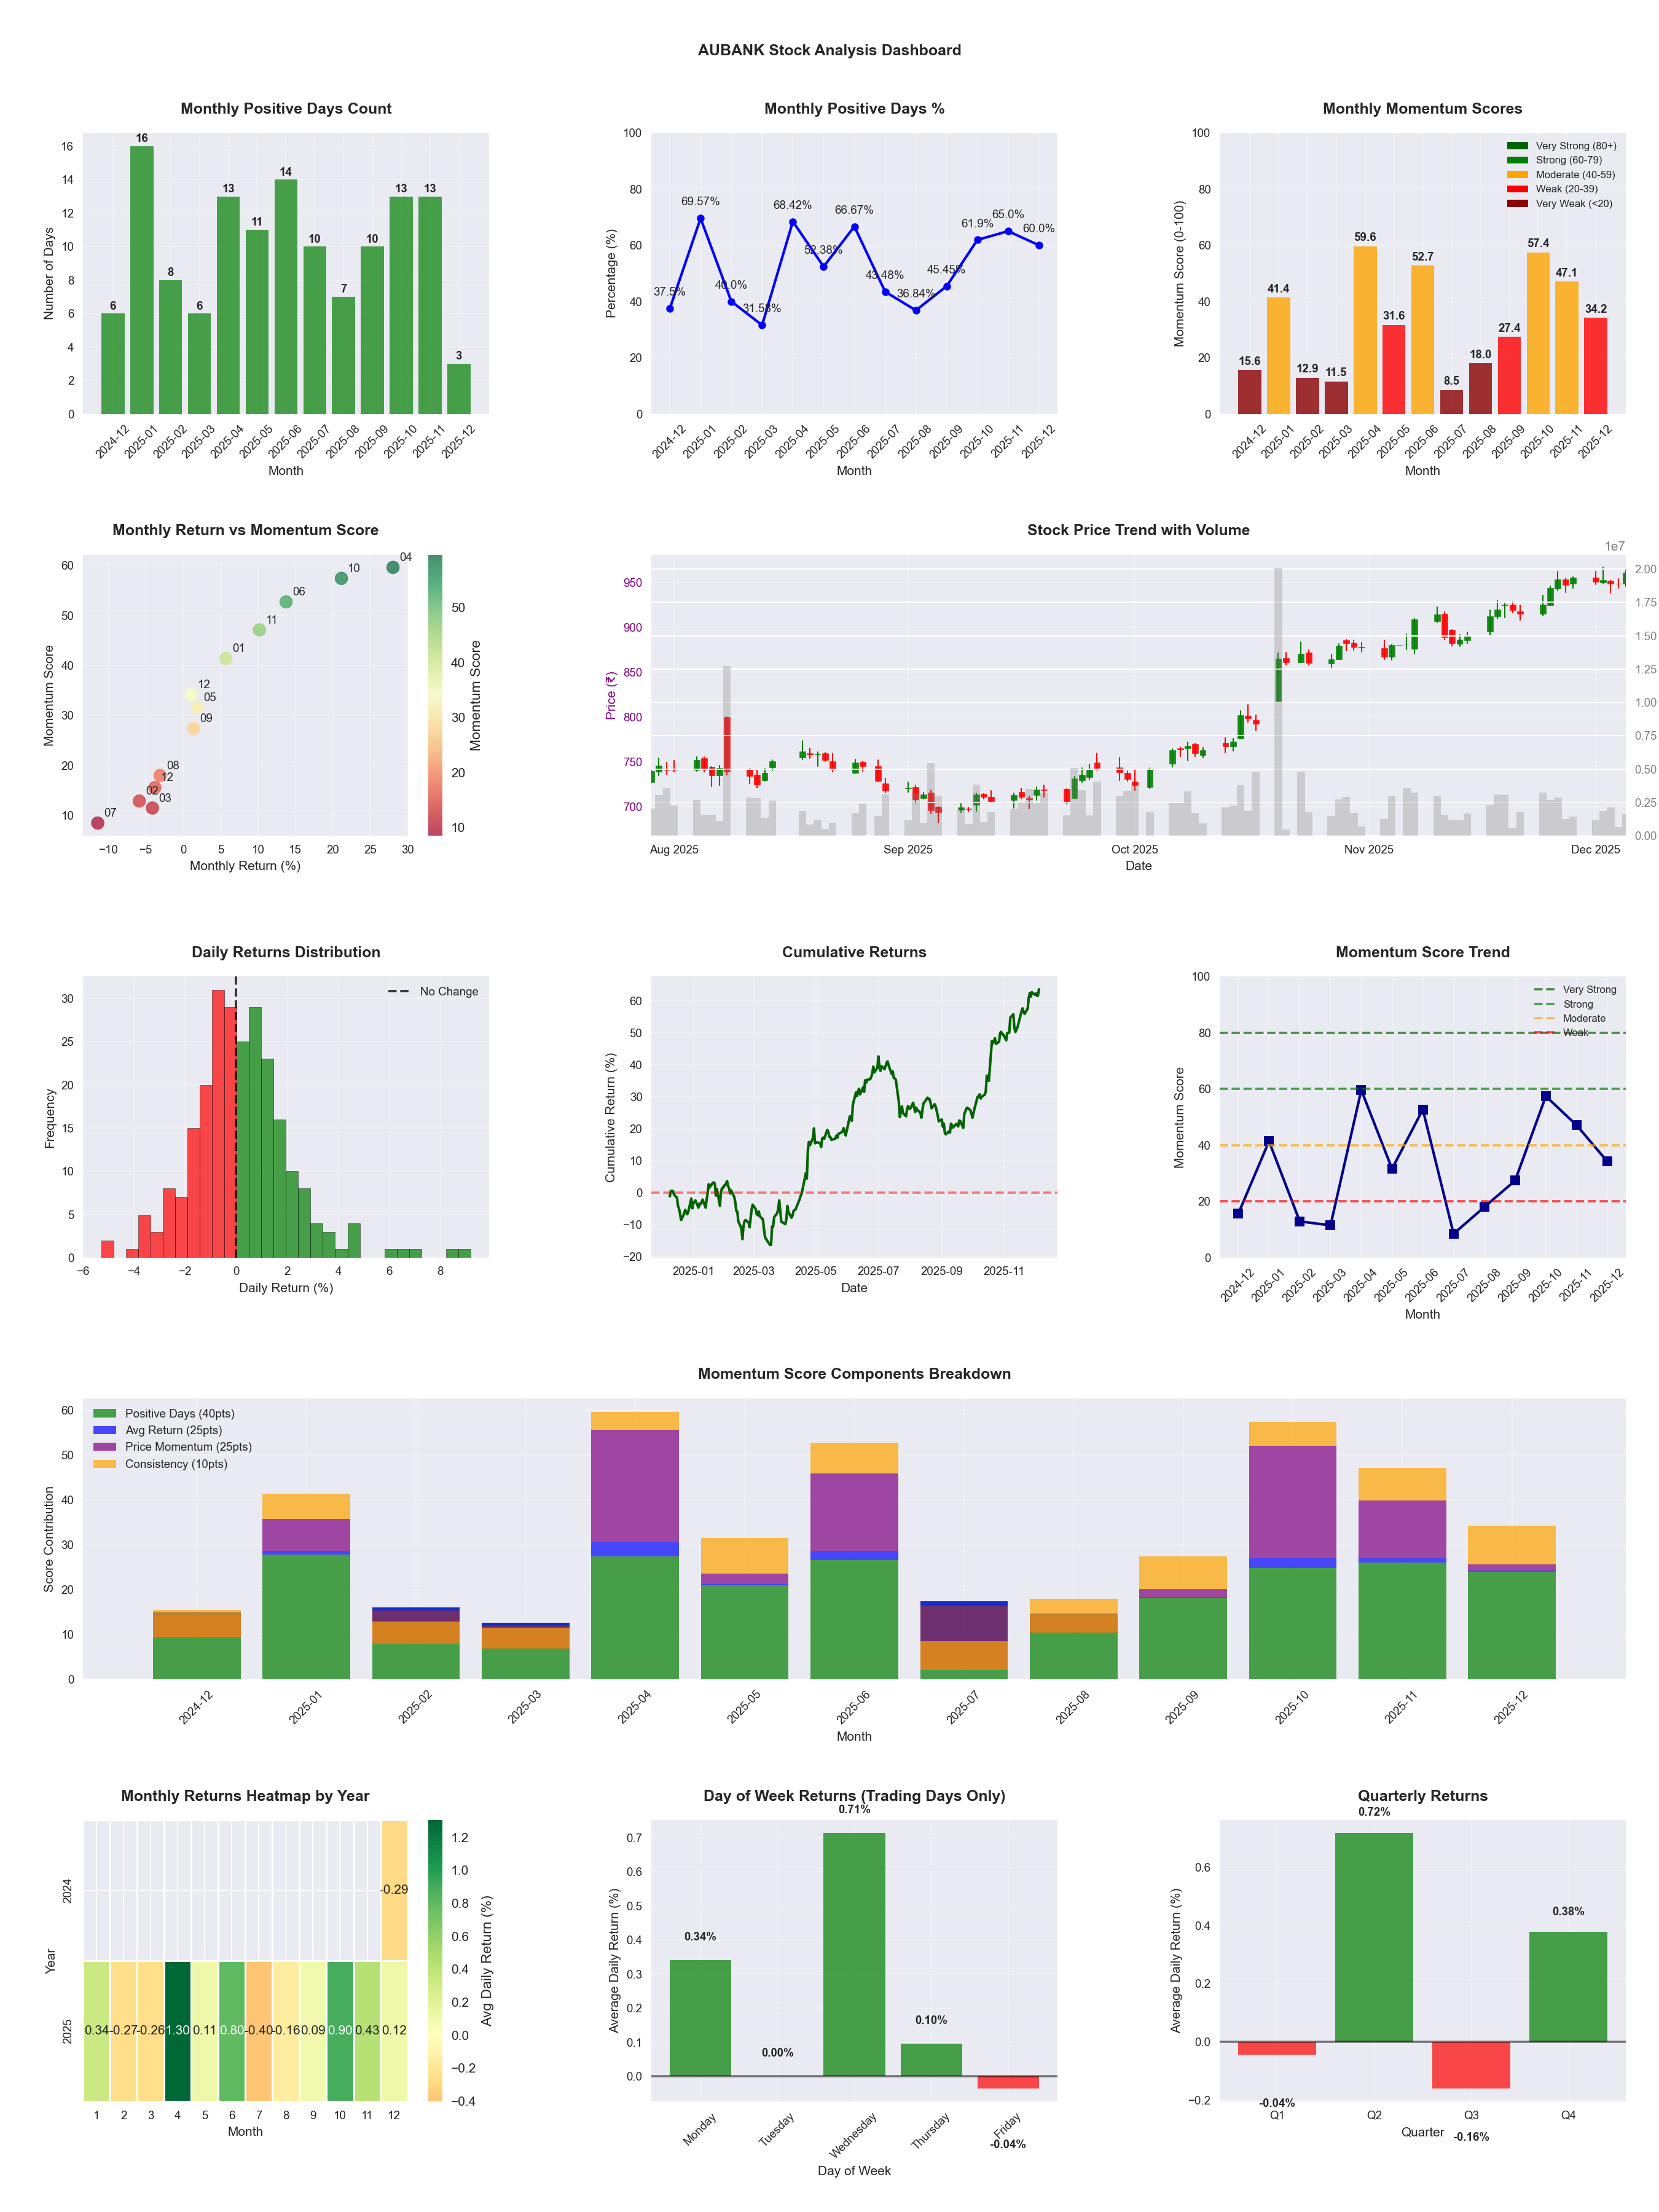
📊 Key Insights & Metrics
Symbol
📈 AUBANK
Date
📅 2026-04-11
Volatility
🟡 1.95%
Win Rate
⚠️ 51.2%
Avg Daily Return
📈 +0.25%
Max Drawdown
📉 -18.16%
IBD RS Score
📊 90.3
Leader
Market Rank
#48
Best Month
🏆 2025-04
Worst Month
📉 2026-03
Best Months to Trade
📅 Apr, Oct, Jun
Best Days to Trade
📅 Wednesday, Monday
📊 Key Insights & Metrics
Symbol
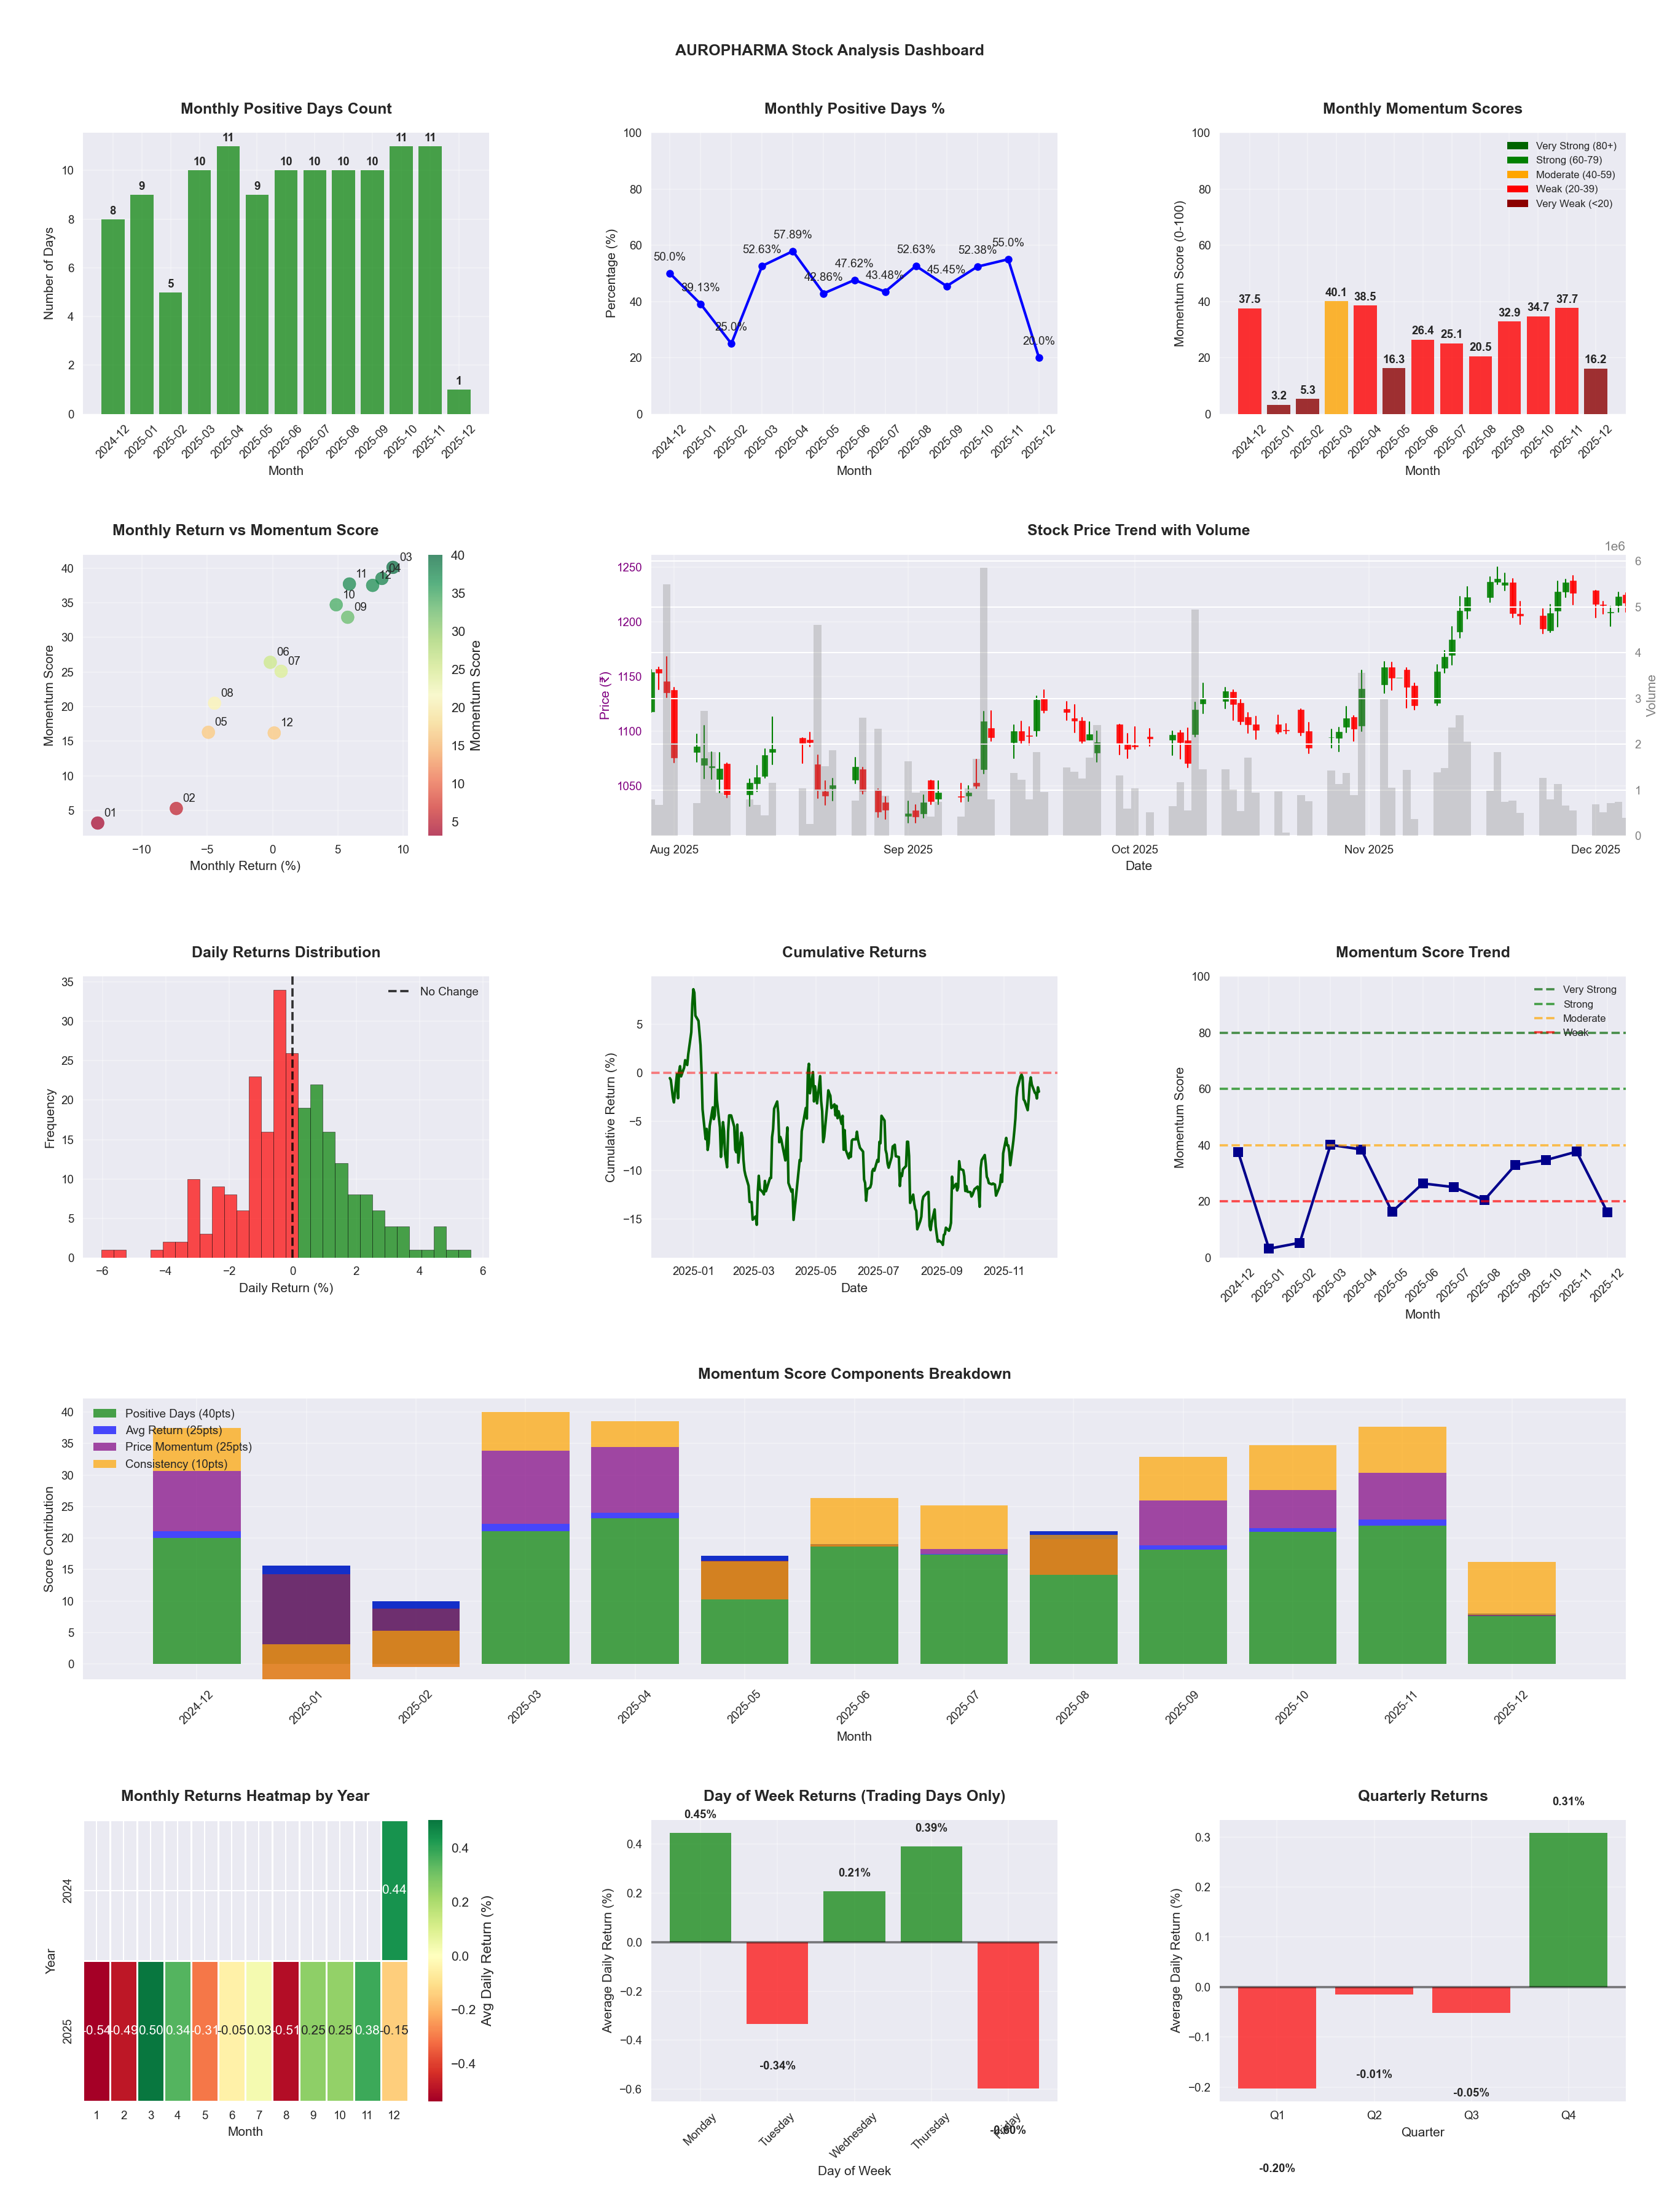
📈 AUROPHARMA
Date
📅 2026-04-11
Volatility
🟡 1.73%
Win Rate
⚠️ 49.0%
Avg Daily Return
📈 +0.11%
Max Drawdown
📉 -18.43%
IBD RS Score
📊 85.6
Strong
Market Rank
#71
Best Month
🏆 2025-04
Worst Month
📉 2025-12
Best Months to Trade
📅 Apr, Nov, Mar
Best Days to Trade
📅 Thursday, Wednesday
📊 Key Insights & Metrics
Symbol
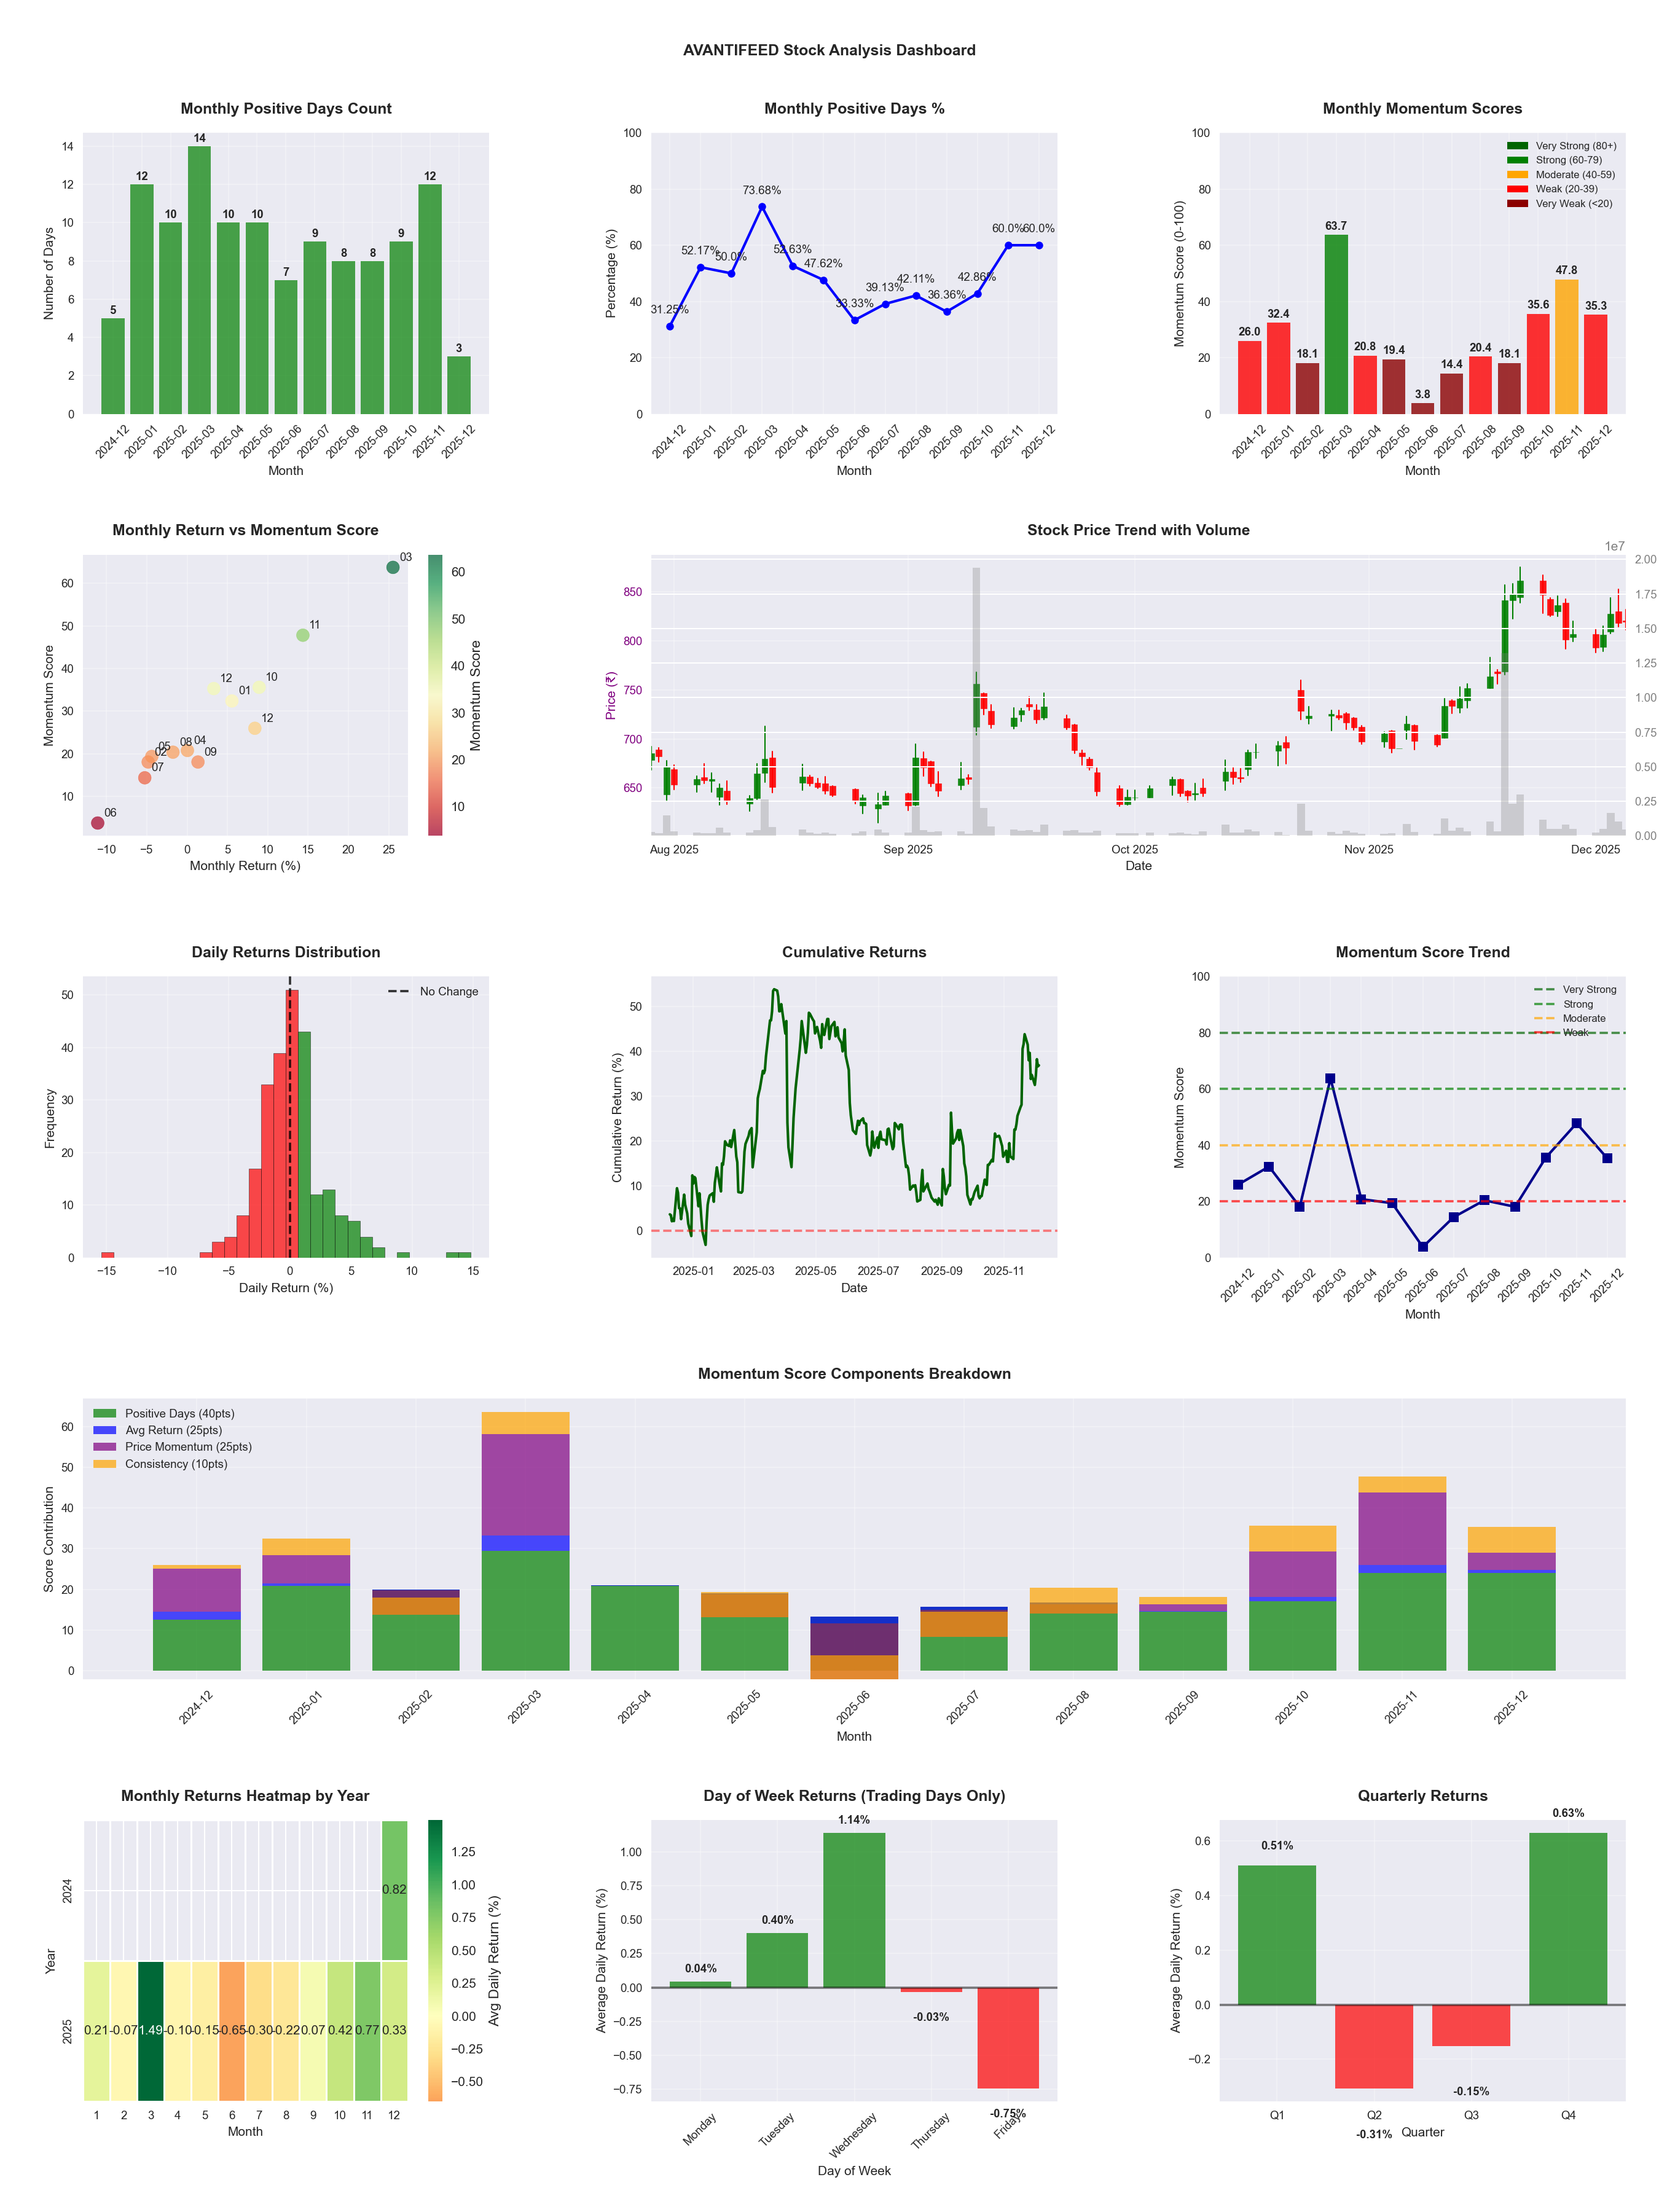
📈 AVANTIFEED
Date
📅 2026-03-21
Volatility
🔴 3.42%
Risk Profile
⚠️ suitable for aggressive investors
Win Rate
⚠️ 48.8%
Avg Daily Return
📈 +0.17%
Max Drawdown
📉 -31.23%
Best Month
🏆 2026-02
Worst Month
📉 2025-06
Best Months to Trade
📅 Feb, Nov, Oct
Best Days to Trade
📅 Wednesday, Tuesday
📊 Key Insights & Metrics
Symbol
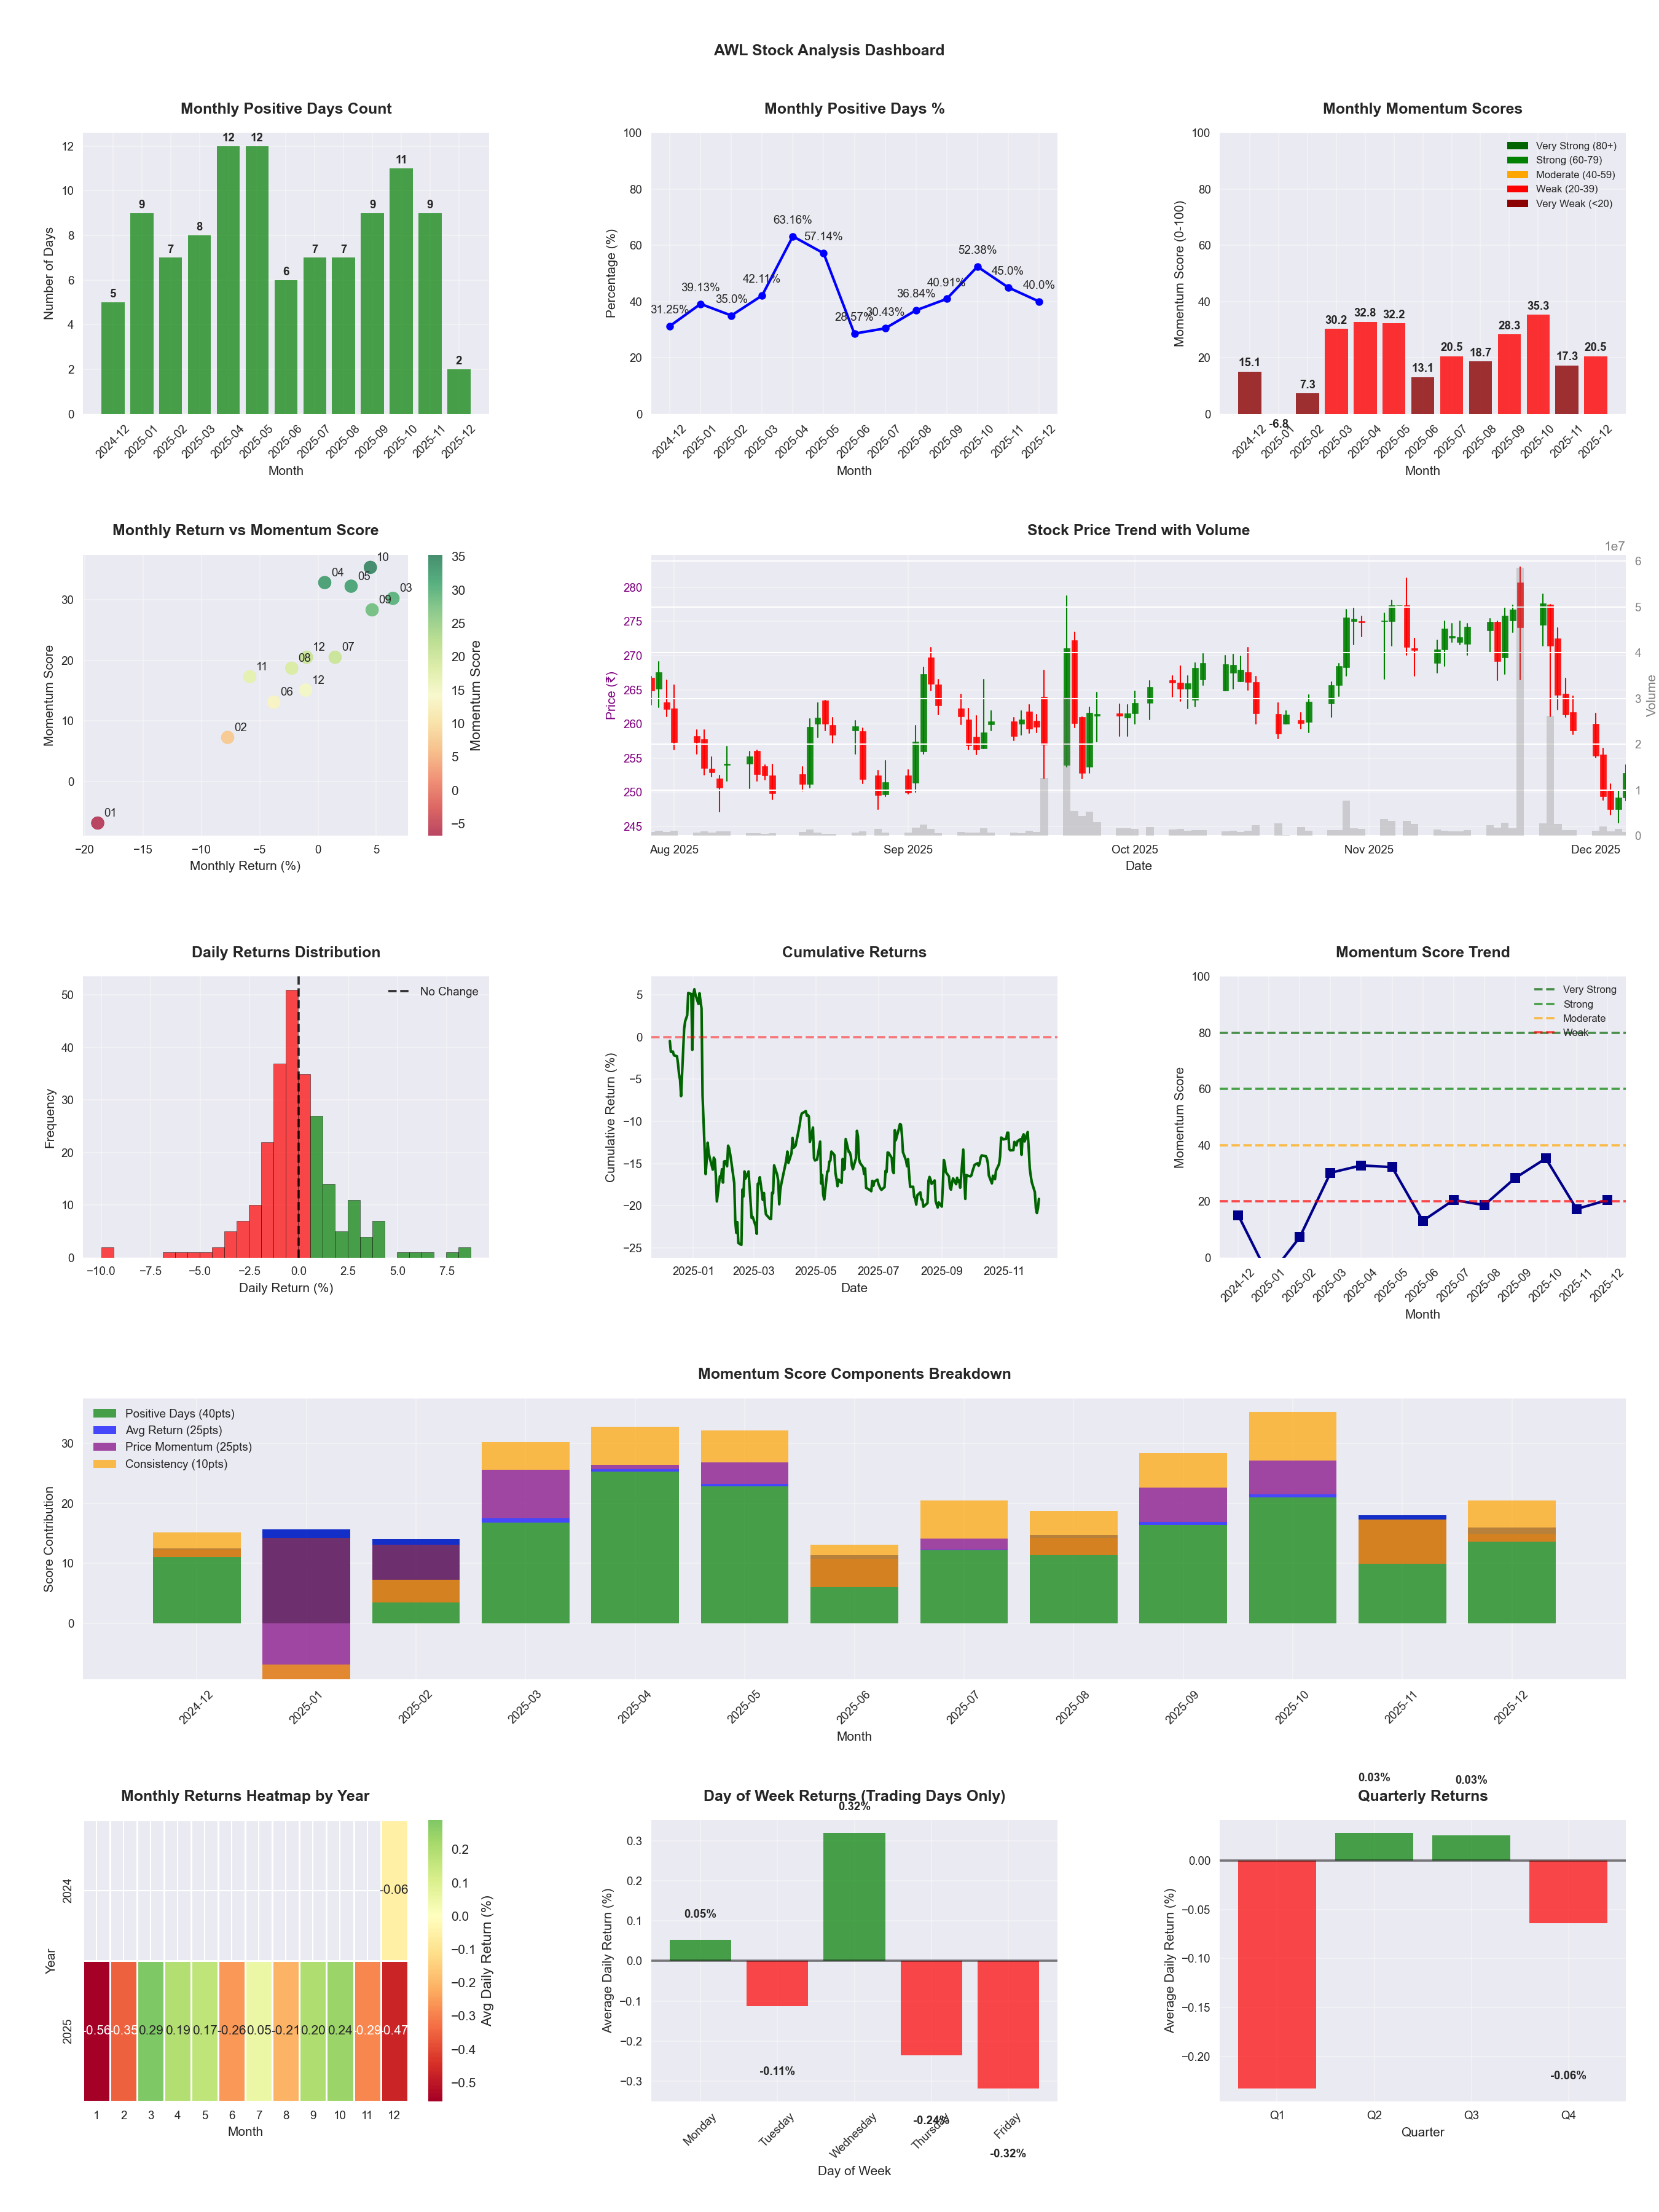
📈 AWL
Date
📅 2026-04-11
Volatility
🟡 1.79%
Win Rate
❌ 38.2%
Avg Daily Return
📉 -0.15%
Max Drawdown
📉 -39.62%
IBD RS Score
📊 5.3
Weak
Market Rank
#467
Best Month
🏆 2025-10
Worst Month
📉 2026-02
Best Months to Trade
📅 Oct, Sep, May
Best Days to Trade
📅 Wednesday, Friday
📊 Key Insights & Metrics
Symbol
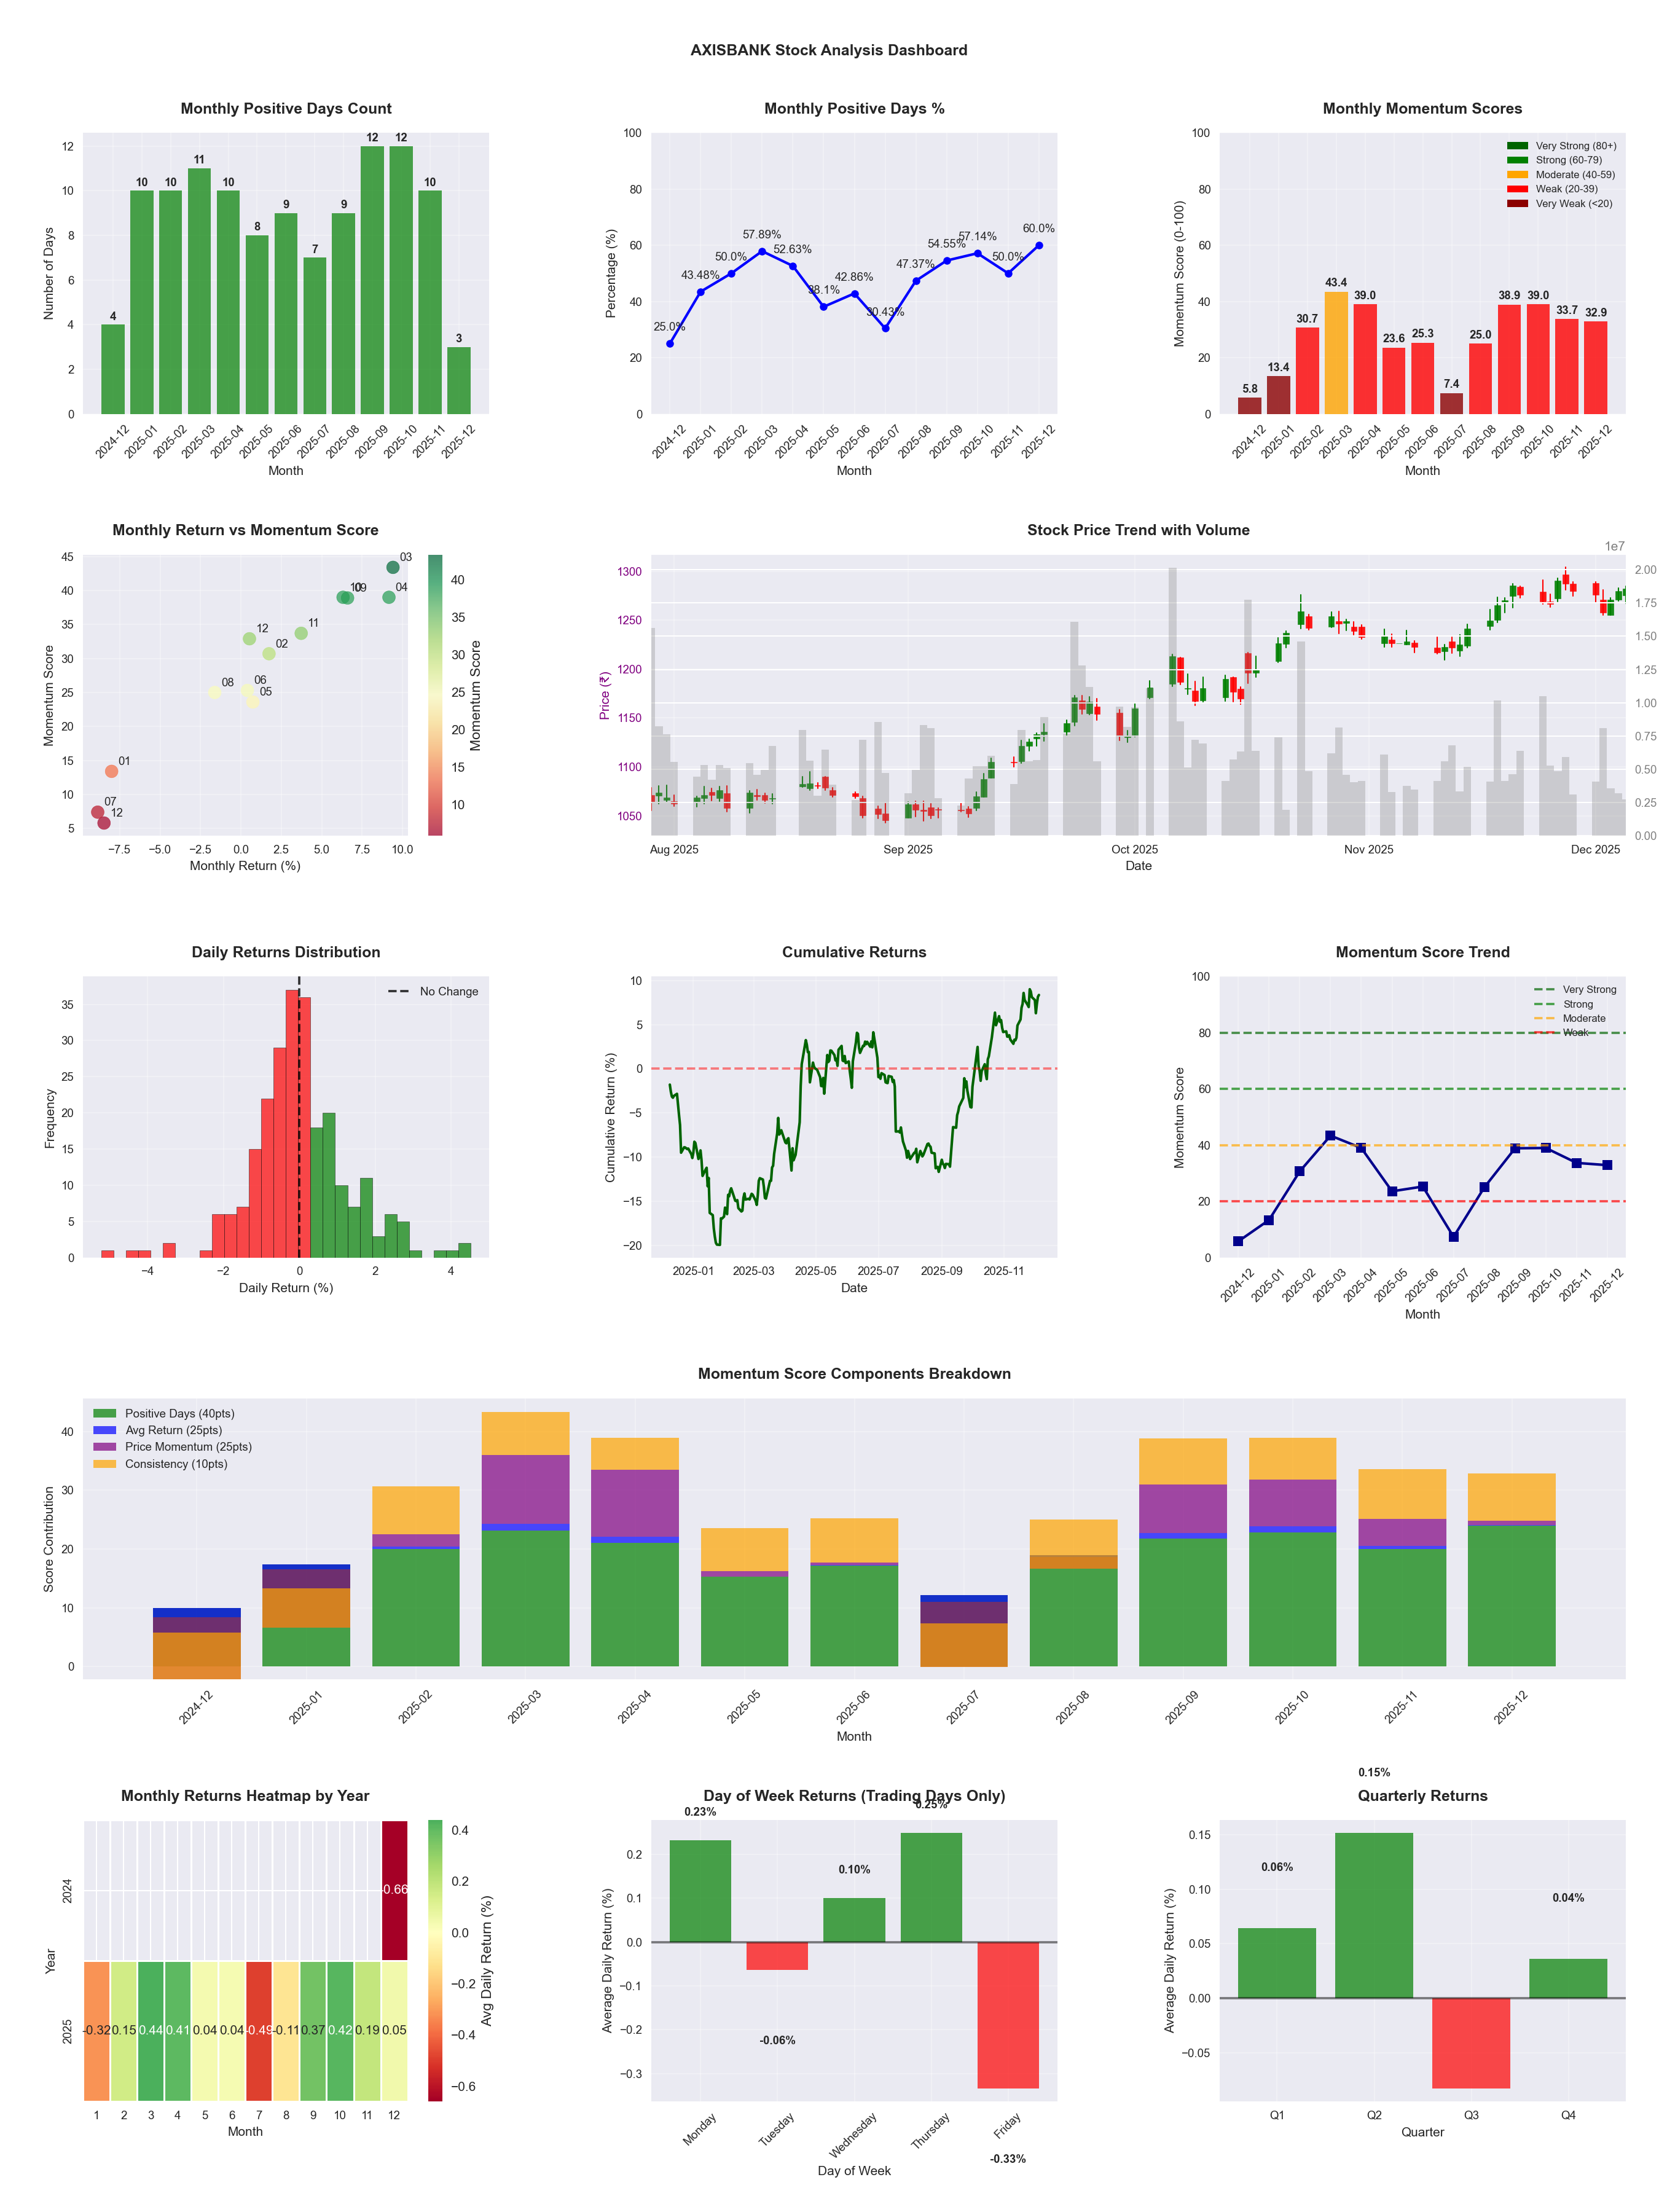
📈 AXISBANK
Date
📅 2026-04-11
Volatility
🟡 1.55%
Win Rate
⚠️ 49.2%
Avg Daily Return
📈 +0.11%
Max Drawdown
📉 -17.23%
IBD RS Score
📊 78.3
Strong
Market Rank
#107
Best Month
🏆 2026-04
Best Months to Trade
📅 Apr, Oct, Jan
Best Days to Trade
📅 Wednesday, Monday
📊 Key Insights & Metrics
Symbol
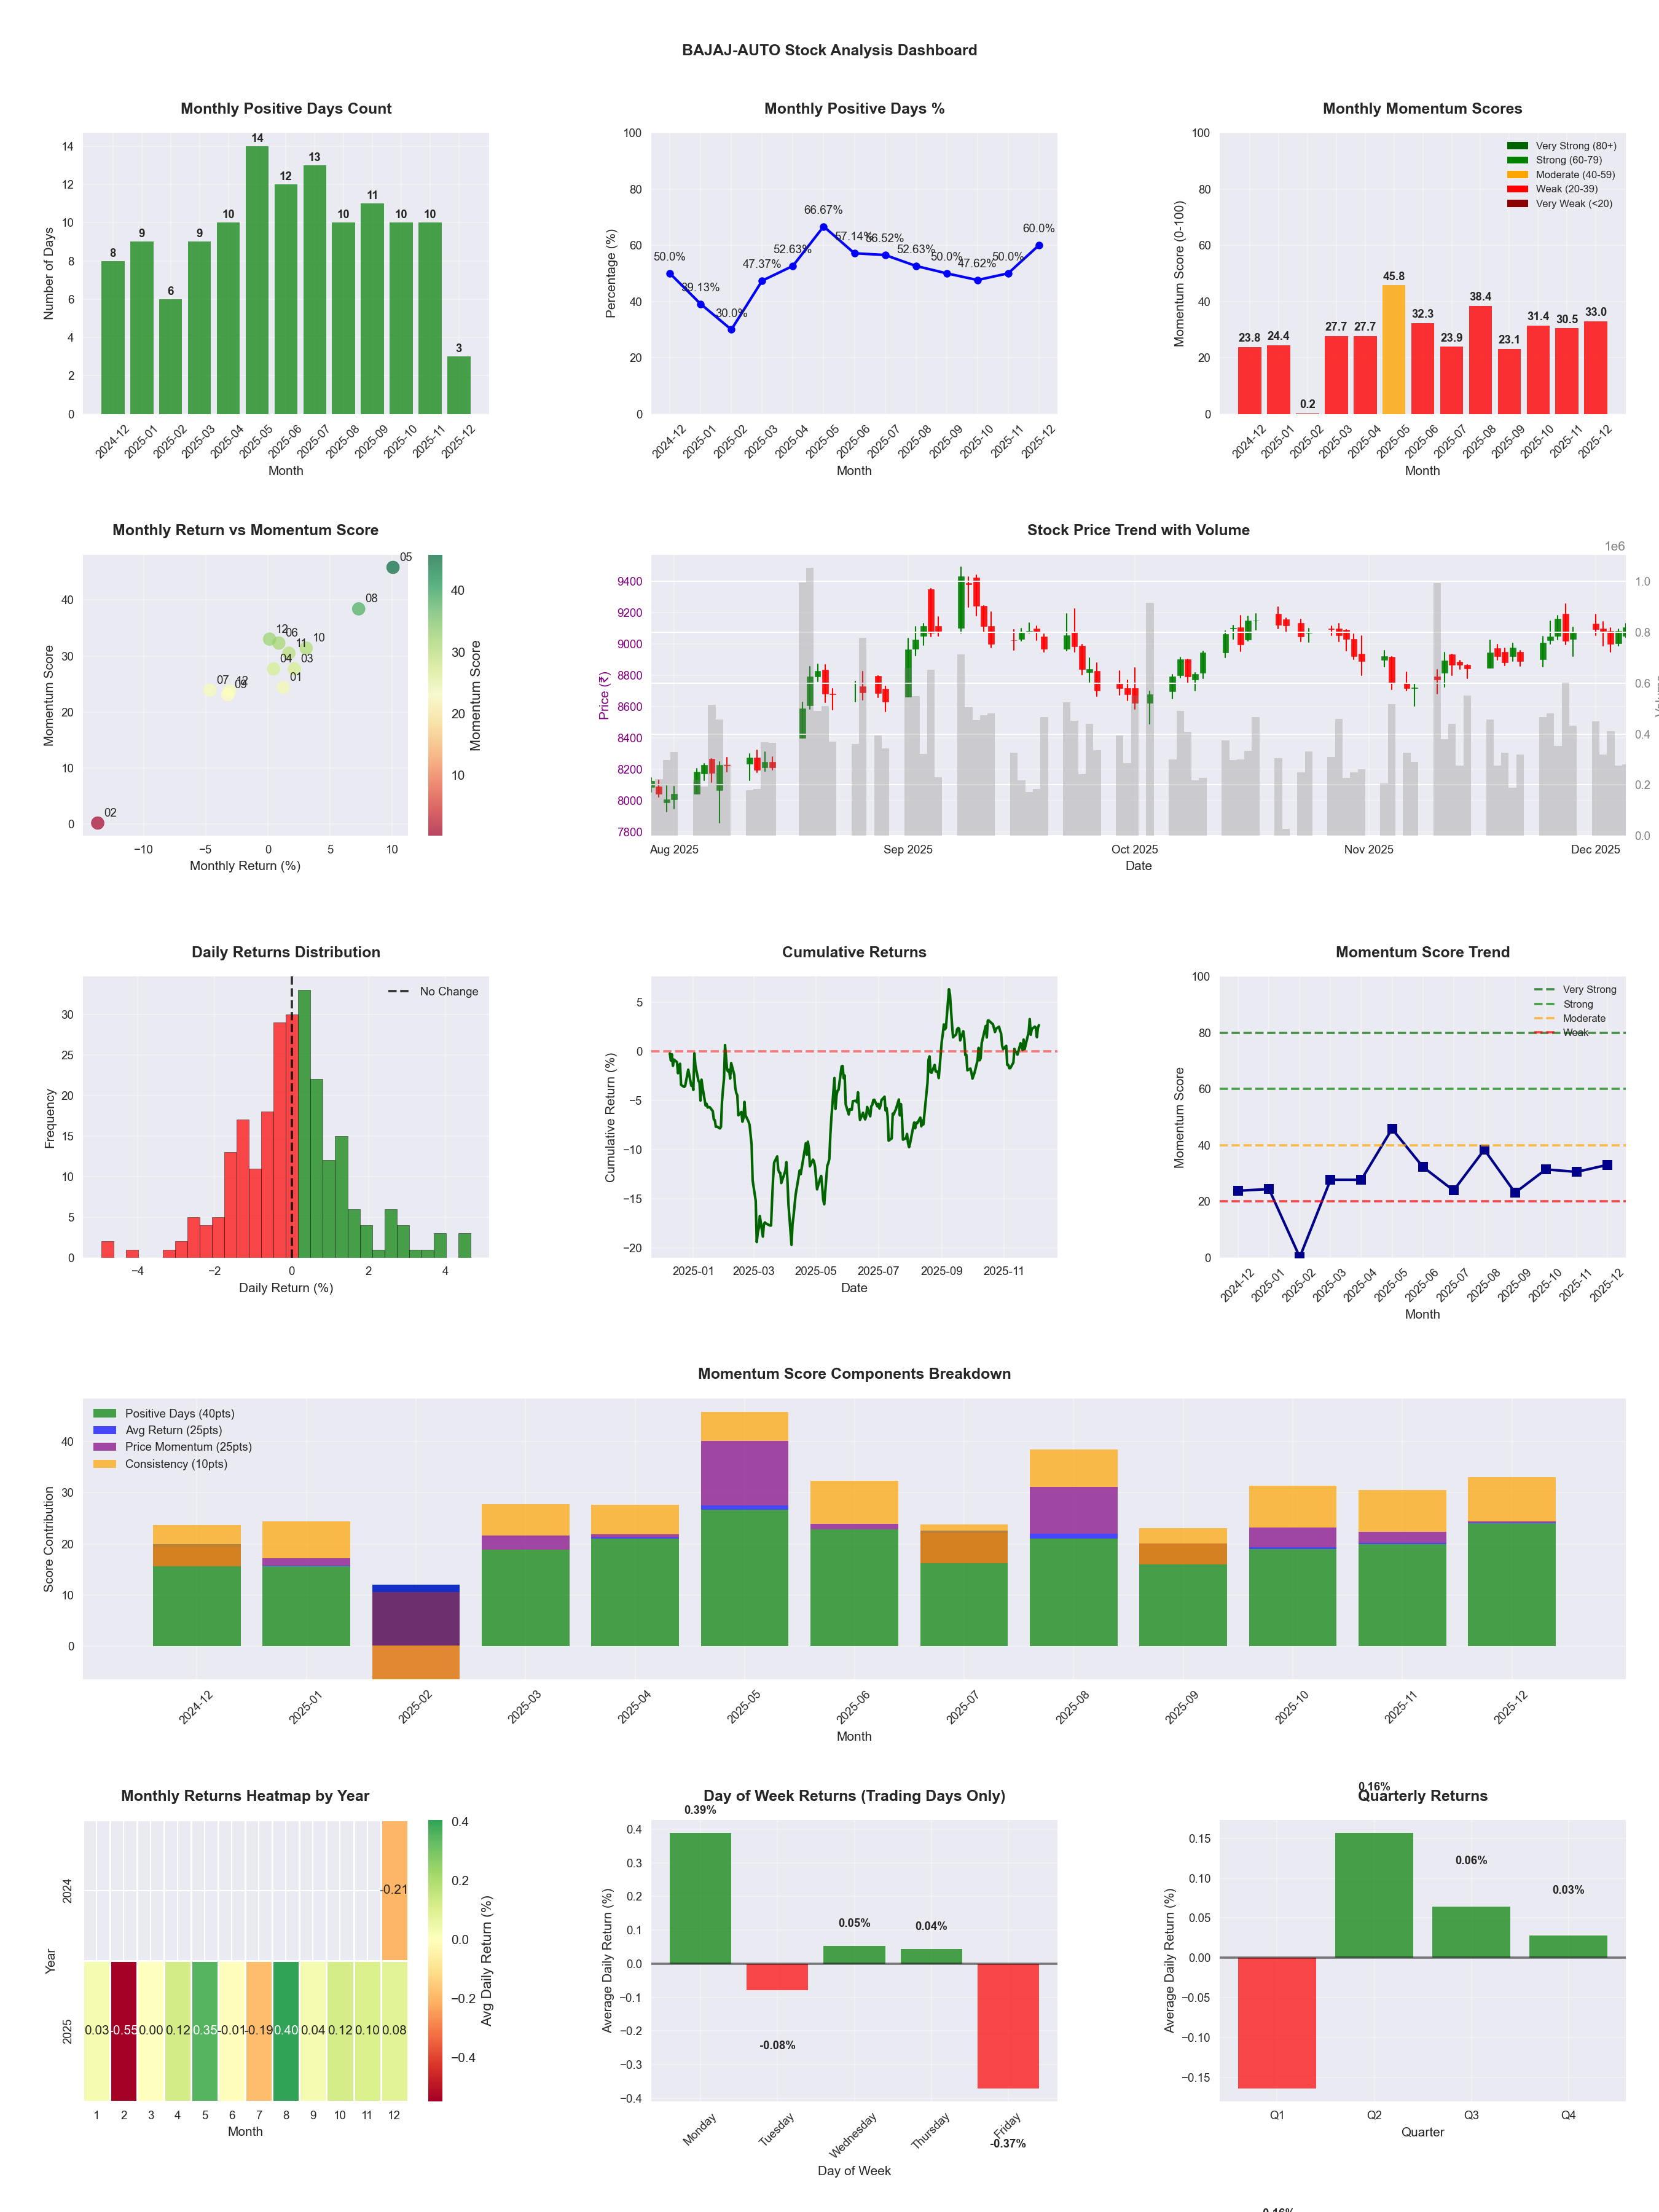
📈 BAJAJ
Date
📅 2026-04-11
Volatility
🟢 1.44%
Win Rate
⚠️ 54.5%
Avg Daily Return
📈 +0.12%
Max Drawdown
📉 -13.37%
Best Month
🏆 2026-04
Worst Month
📉 2026-03
Best Months to Trade
📅 Apr, Aug, May
Best Days to Trade
📅 Monday, Tuesday
📊 Key Insights & Metrics
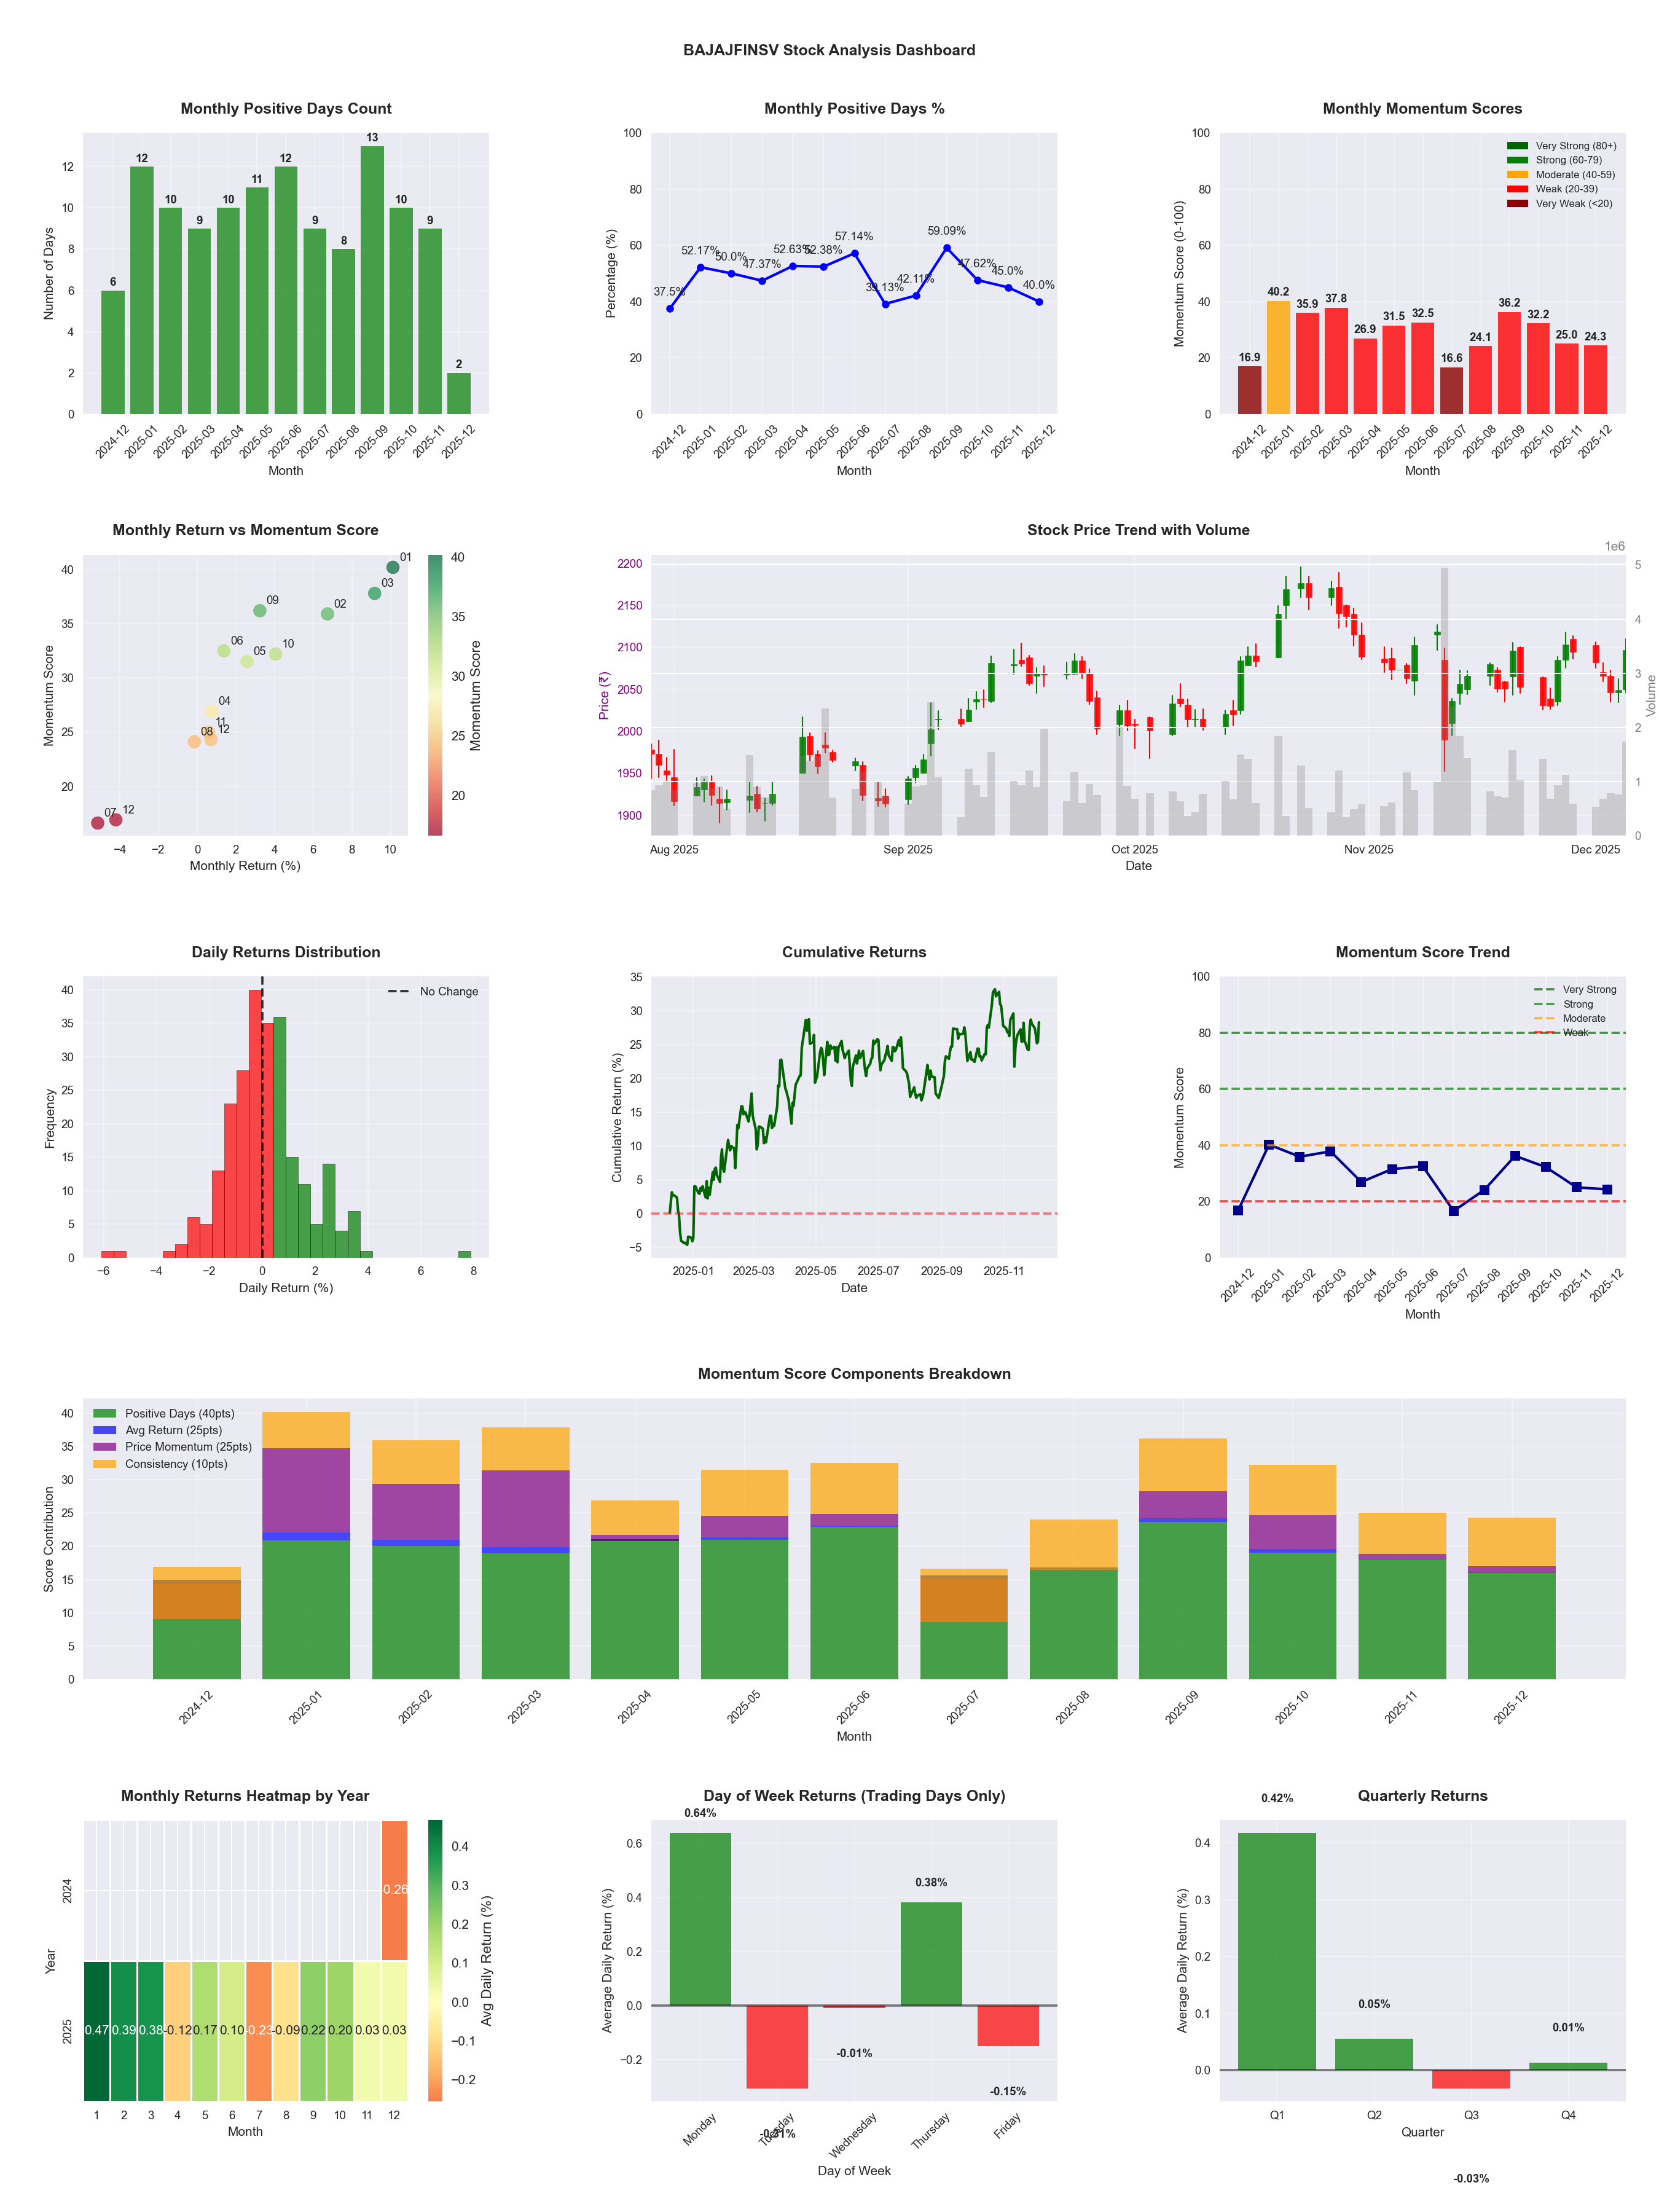
Symbol
📈 BAJAJFINSV
Date
📅 2026-04-11
Volatility
🟢 1.49%
Win Rate
⚠️ 50.0%
Avg Daily Return
📉 -0.02%
Max Drawdown
📉 -25.03%
IBD RS Score
📊 37.7
Weak
Market Rank
#307
Best Month
🏆 2026-04
Best Months to Trade
📅 Apr, Sep, Oct
Best Days to Trade
📅 Monday, Wednesday
📊 Key Insights & Metrics
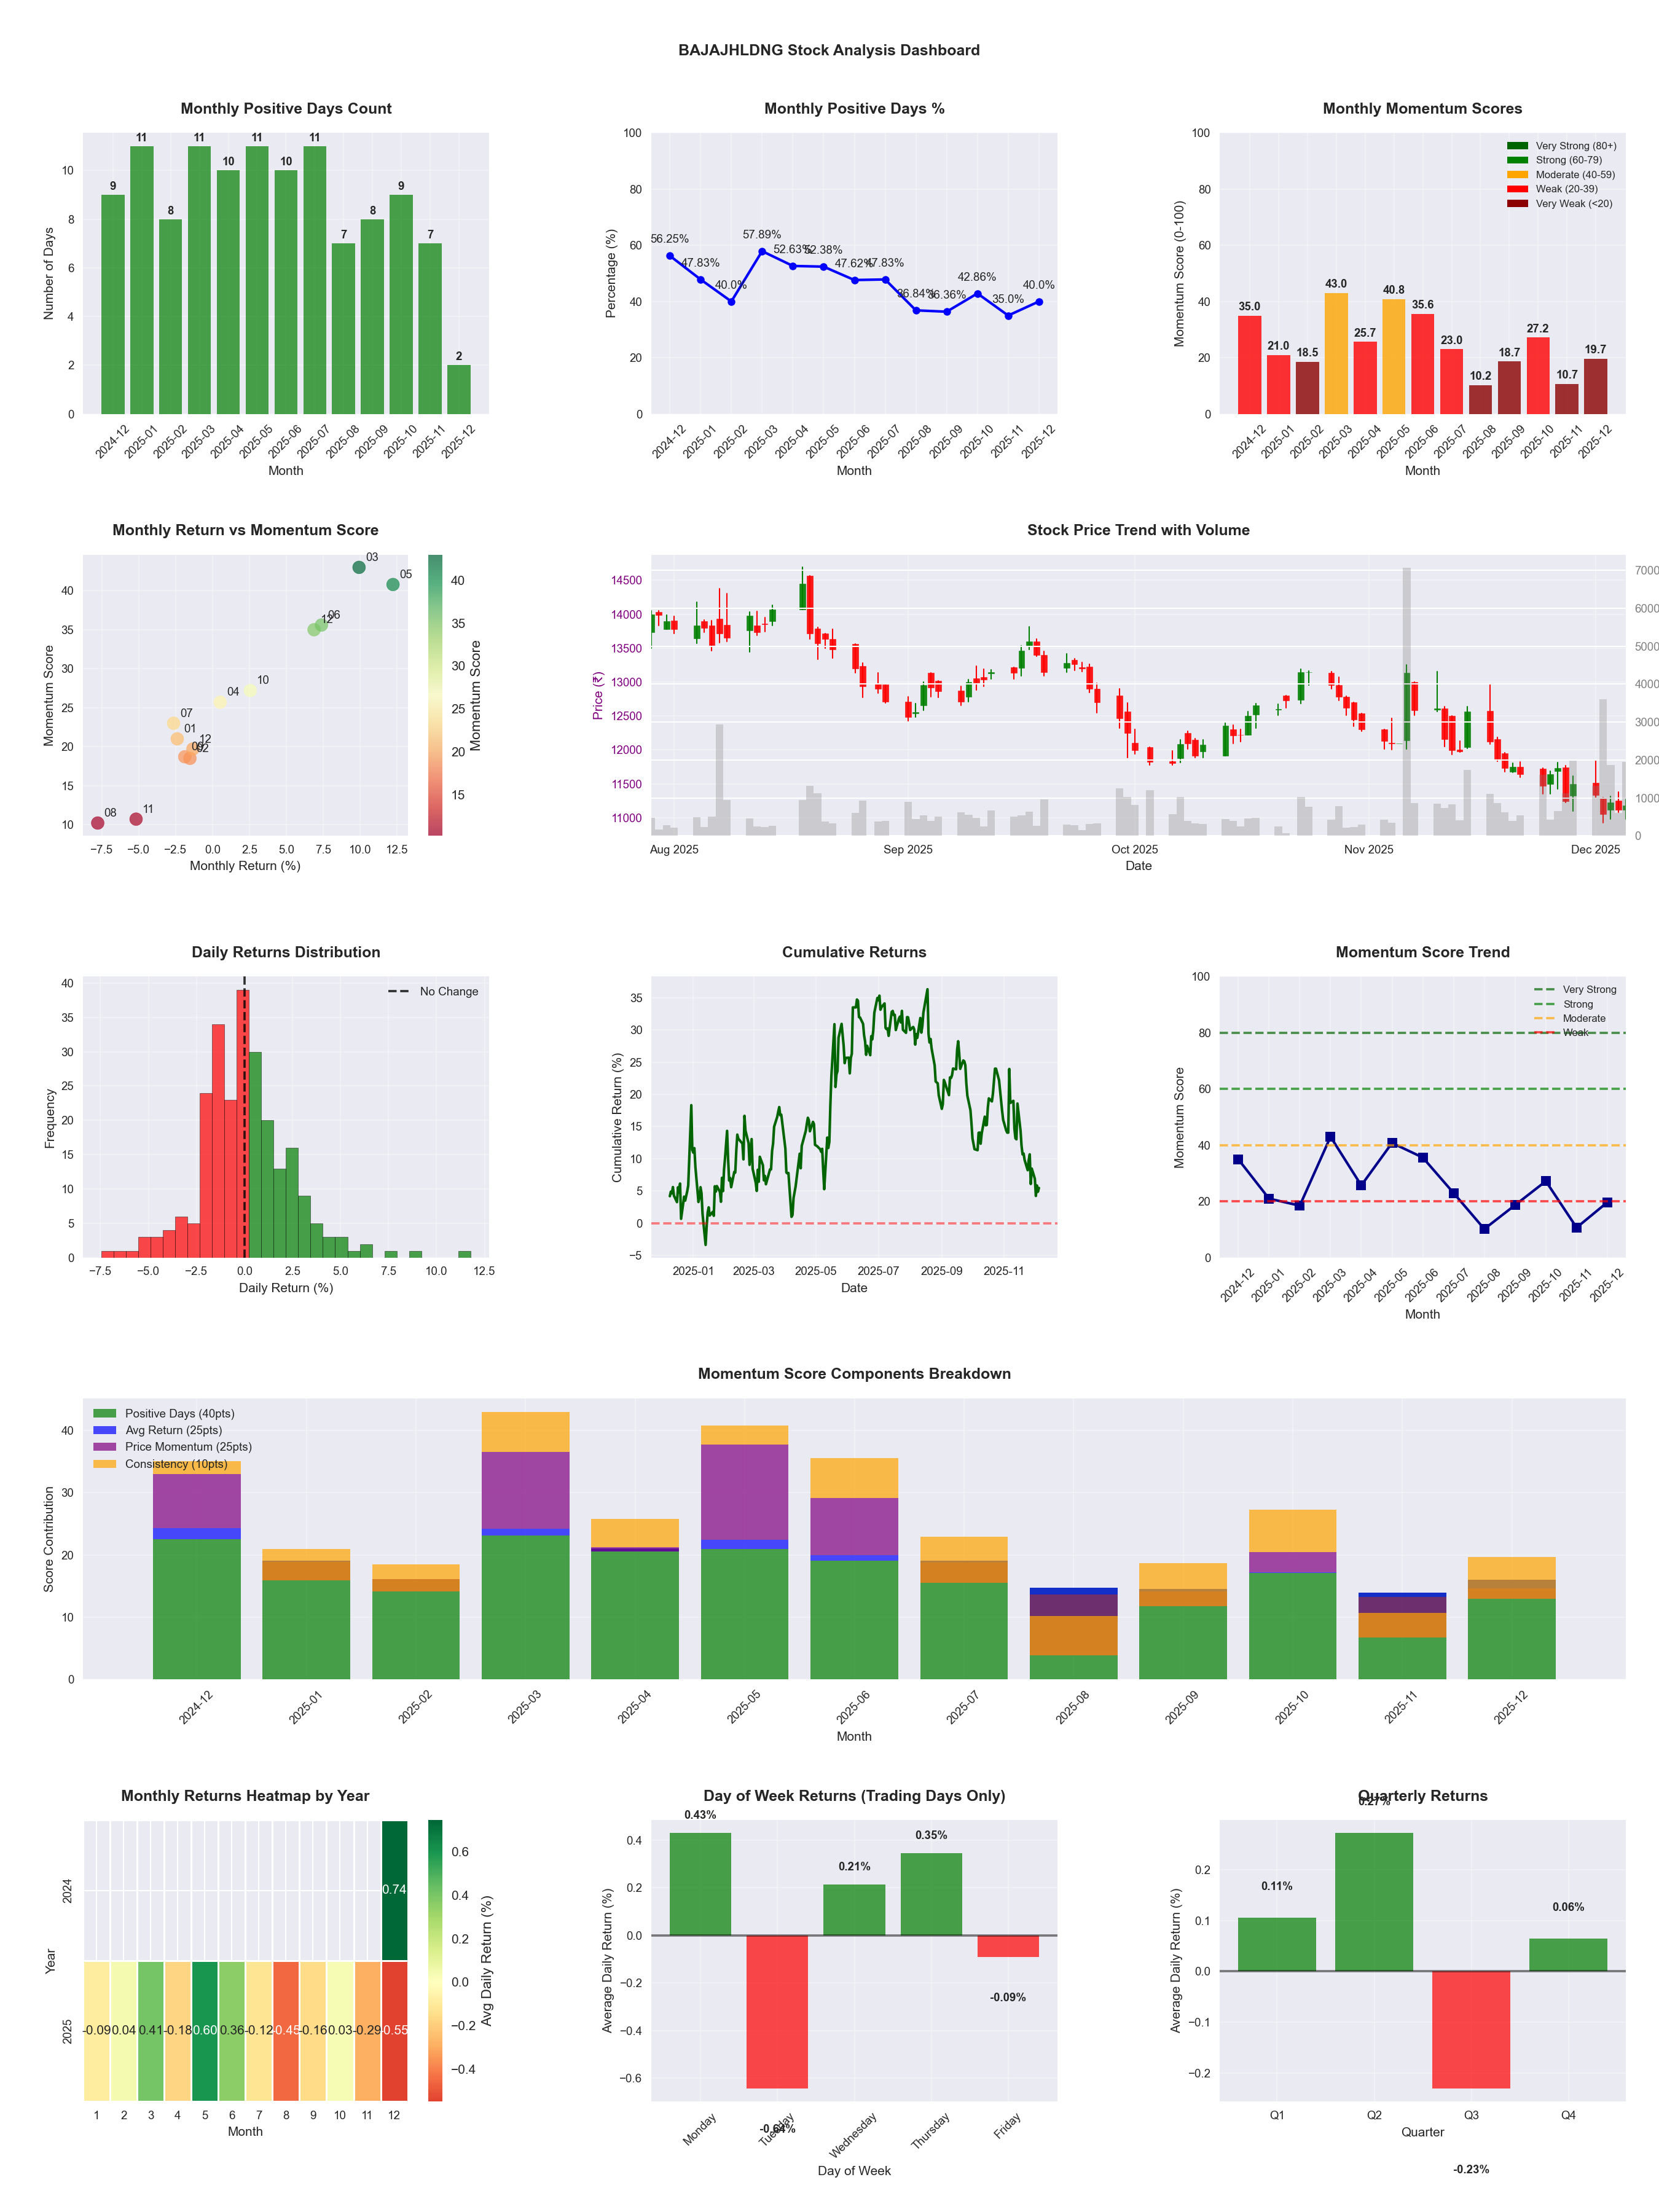
Symbol
📈 BAJAJHLDNG
Date
📅 2026-04-11
Volatility
🟡 2.06%
Risk Profile
⚠️ suitable for aggressive investors
Win Rate
⚠️ 45.5%
Avg Daily Return
📉 -0.03%
Max Drawdown
📉 -39.48%
IBD RS Score
📊 20.5
Weak
Market Rank
#392
Best Month
🏆 2026-04
Best Months to Trade
📅 Apr, May, Jun
Best Days to Trade
📅 Wednesday, Monday
📊 Key Insights & Metrics
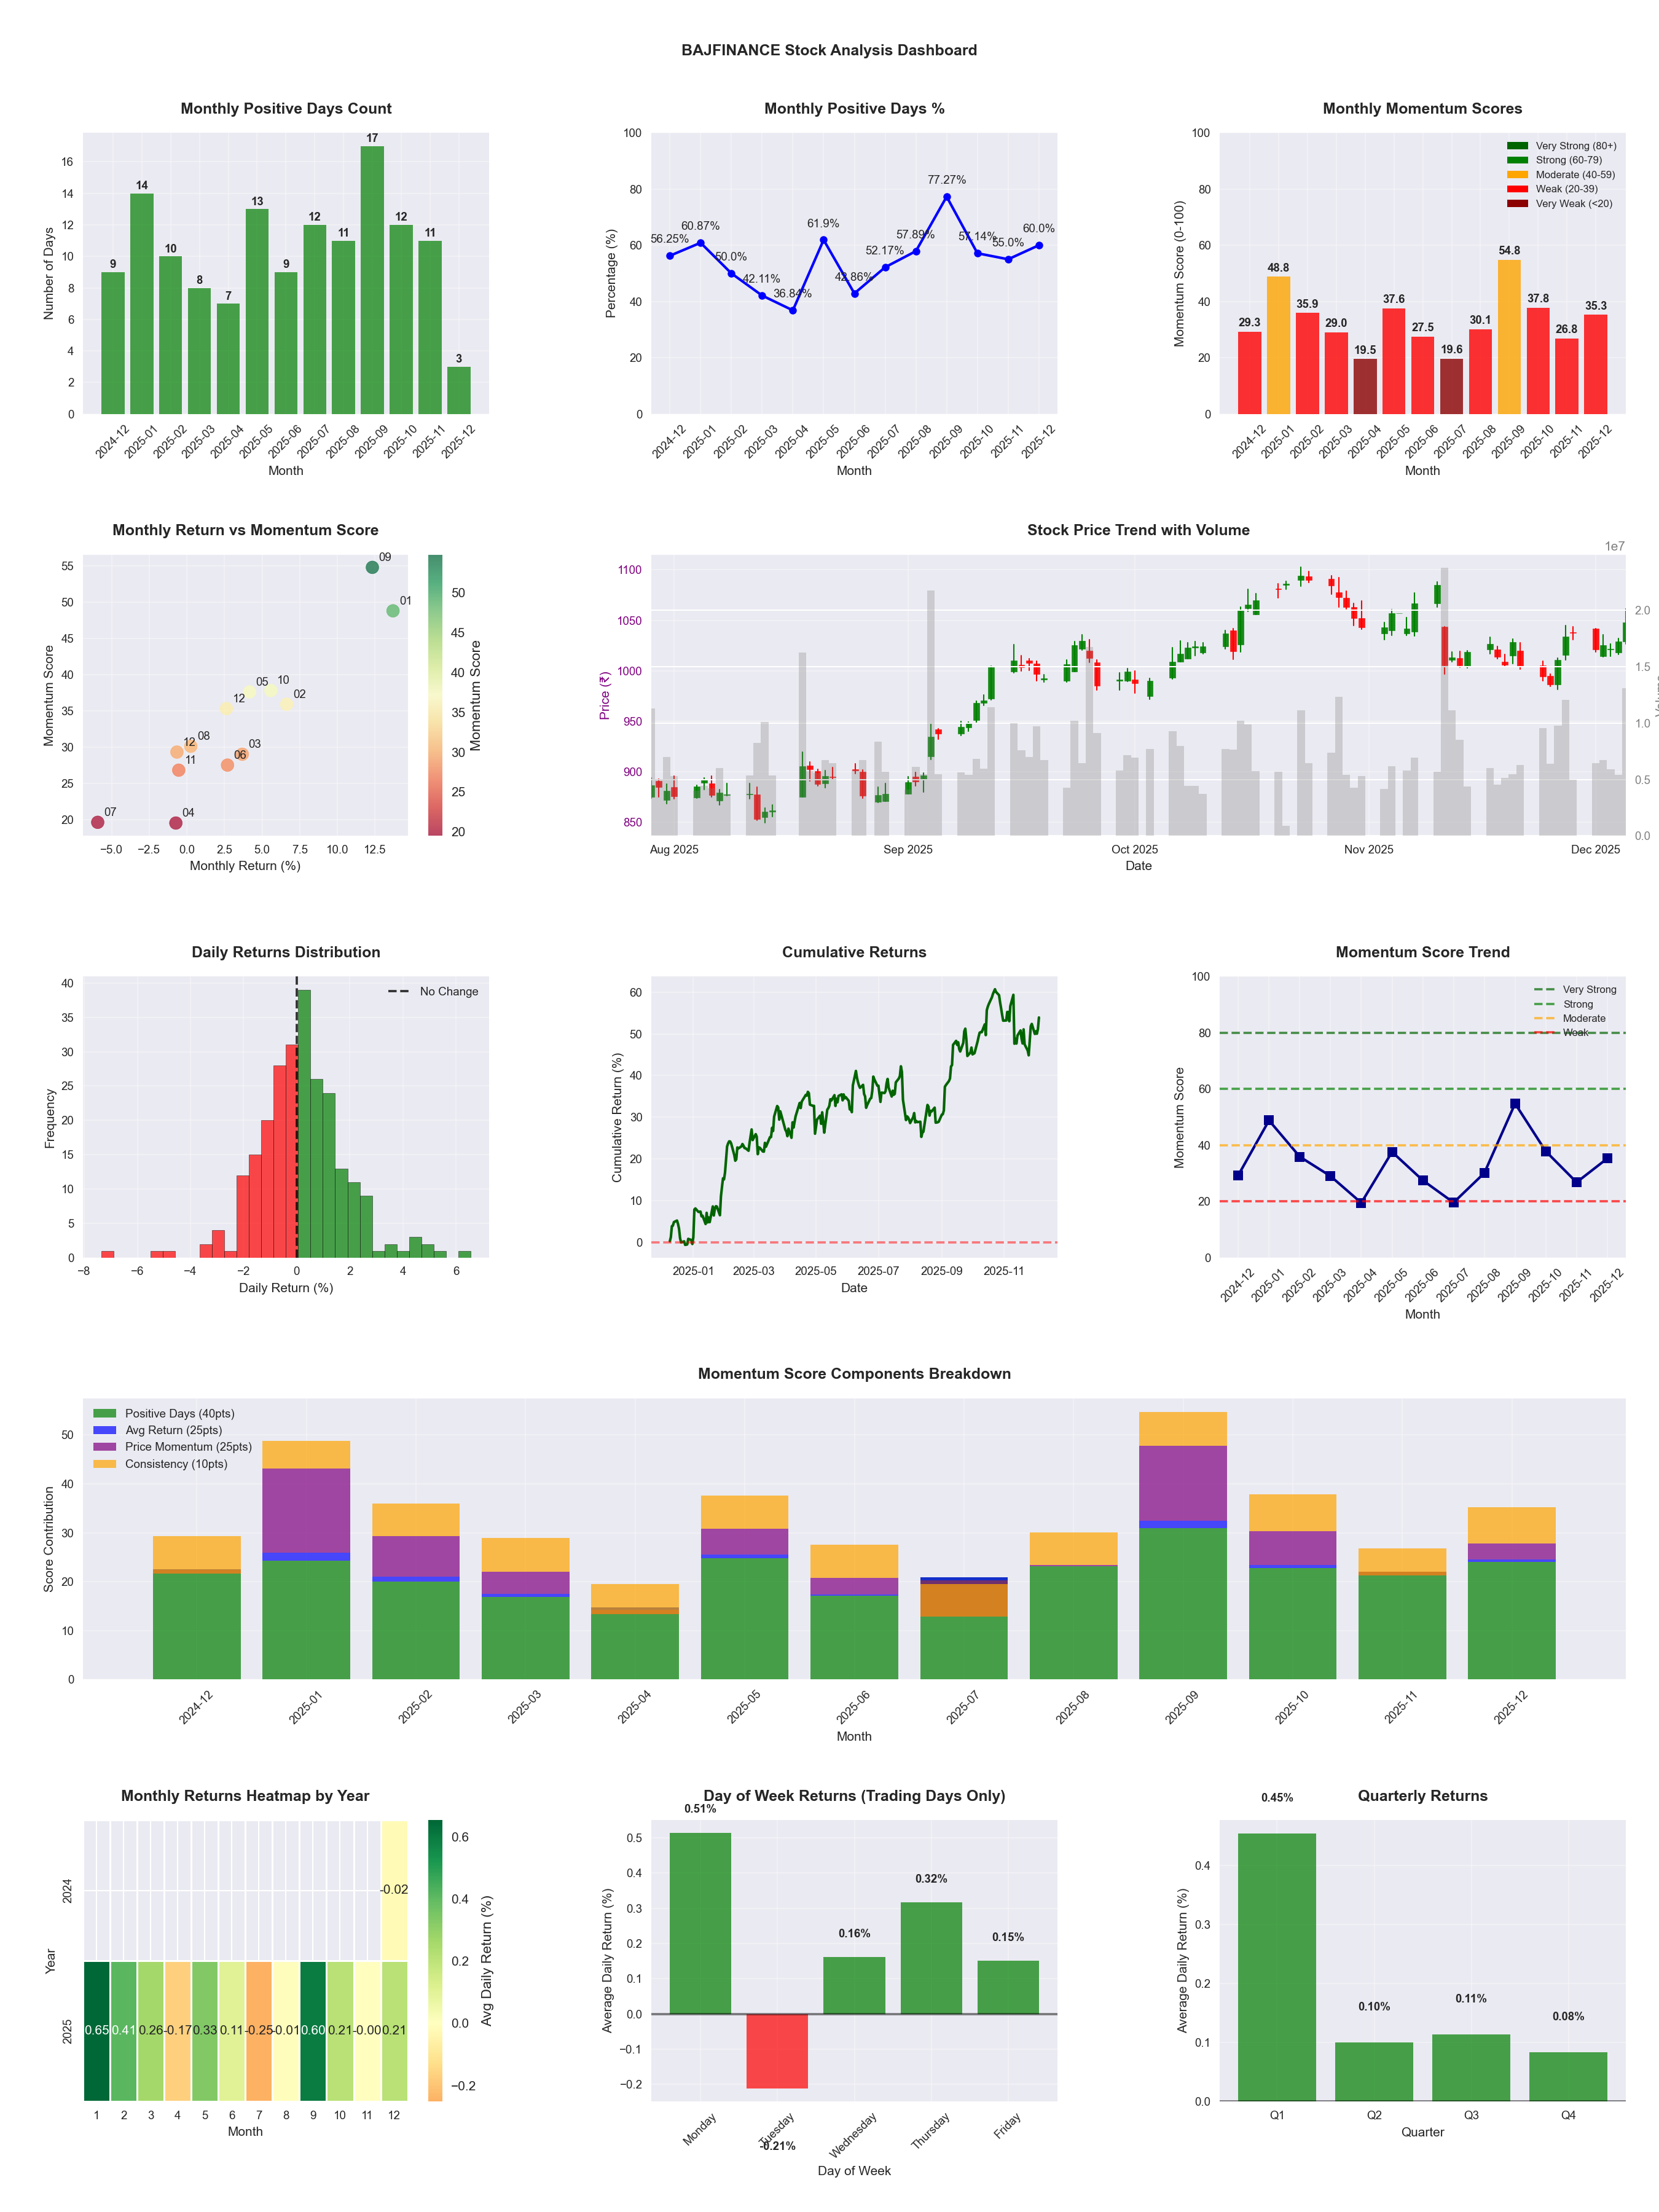
Symbol
📈 BAJFINANCE
Date
📅 2026-04-11
Volatility
🟡 1.85%
Win Rate
⚠️ 52.0%
Avg Daily Return
📈 +0.03%
Max Drawdown
📉 -26.74%
IBD RS Score
📊 56.4
Average
Market Rank
#215
Best Month
🏆 2026-04
Best Months to Trade
📅 Apr, Sep, Feb
Best Days to Trade
📅 Wednesday, Monday
📊 Key Insights & Metrics
Symbol
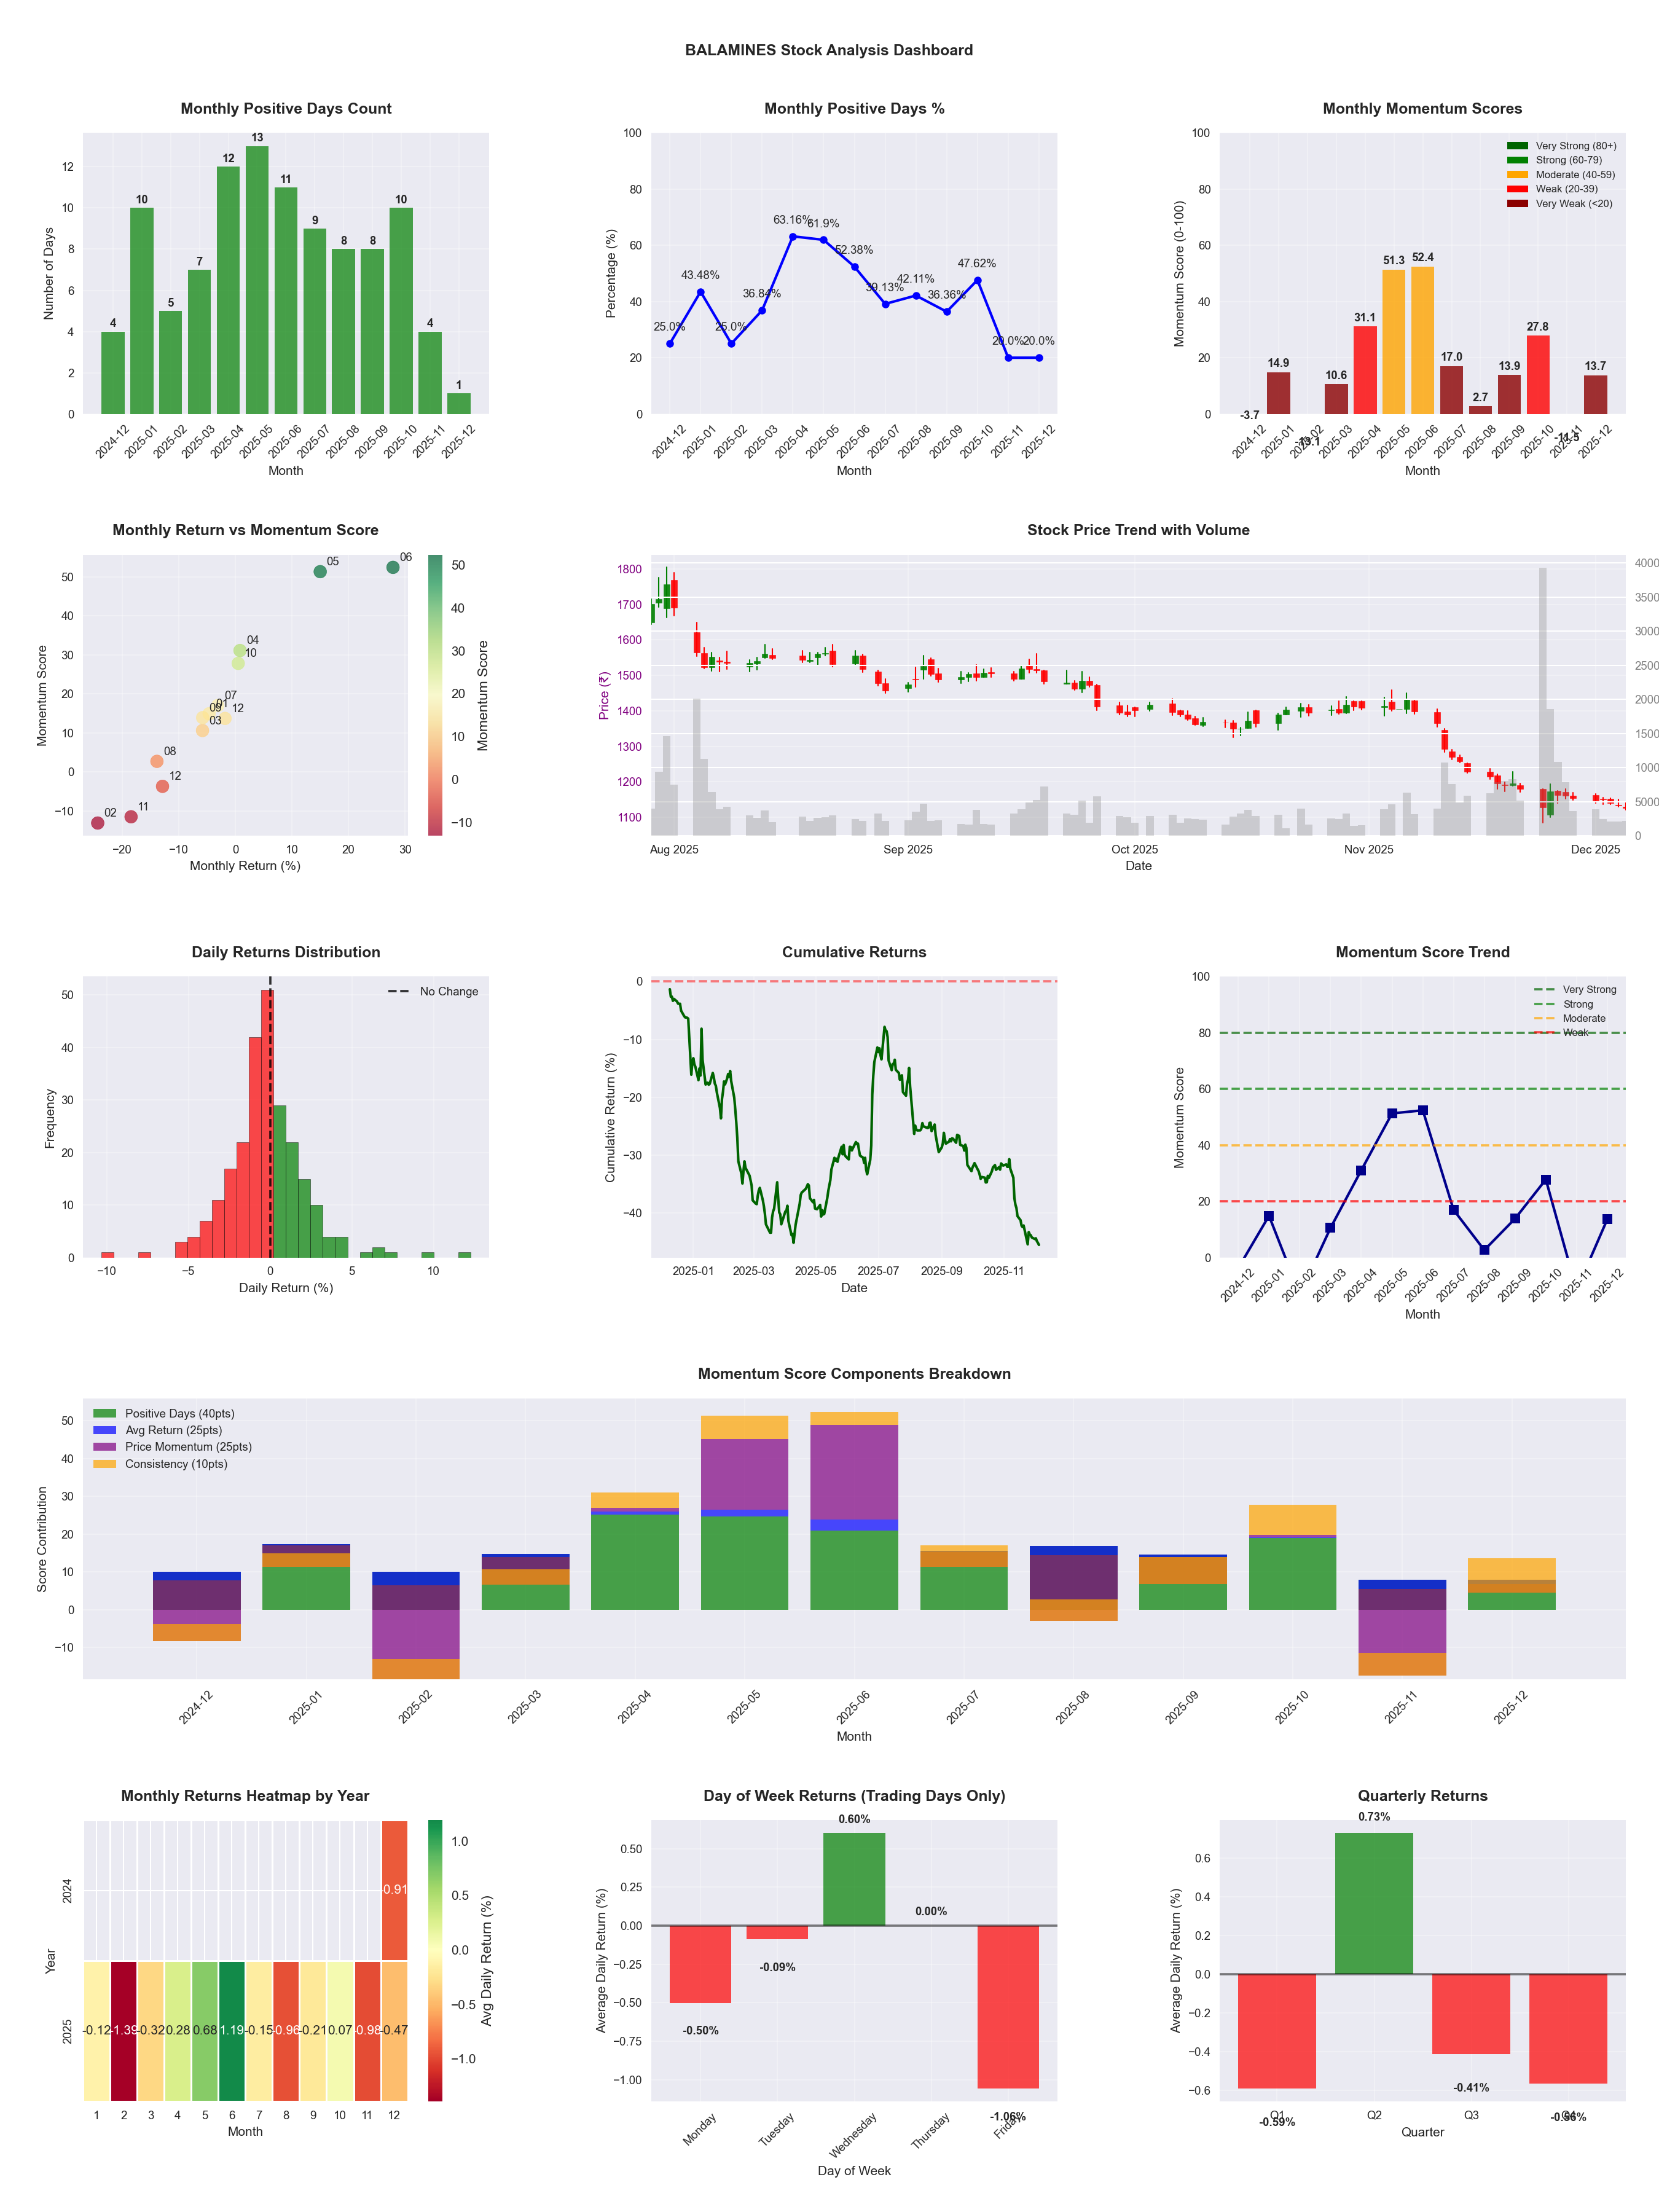
📈 BALAMINES
Date
📅 2026-03-21
Volatility
🟡 2.69%
Risk Profile
⚠️ suitable for aggressive investors
Win Rate
⚠️ 42.1%
Avg Daily Return
📉 -0.03%
Max Drawdown
📉 -47.45%
Best Month
🏆 2025-06
Best Months to Trade
📅 Jun, May, Apr
Best Days to Trade
📅 Wednesday, Tuesday
📊 Key Insights & Metrics
Symbol
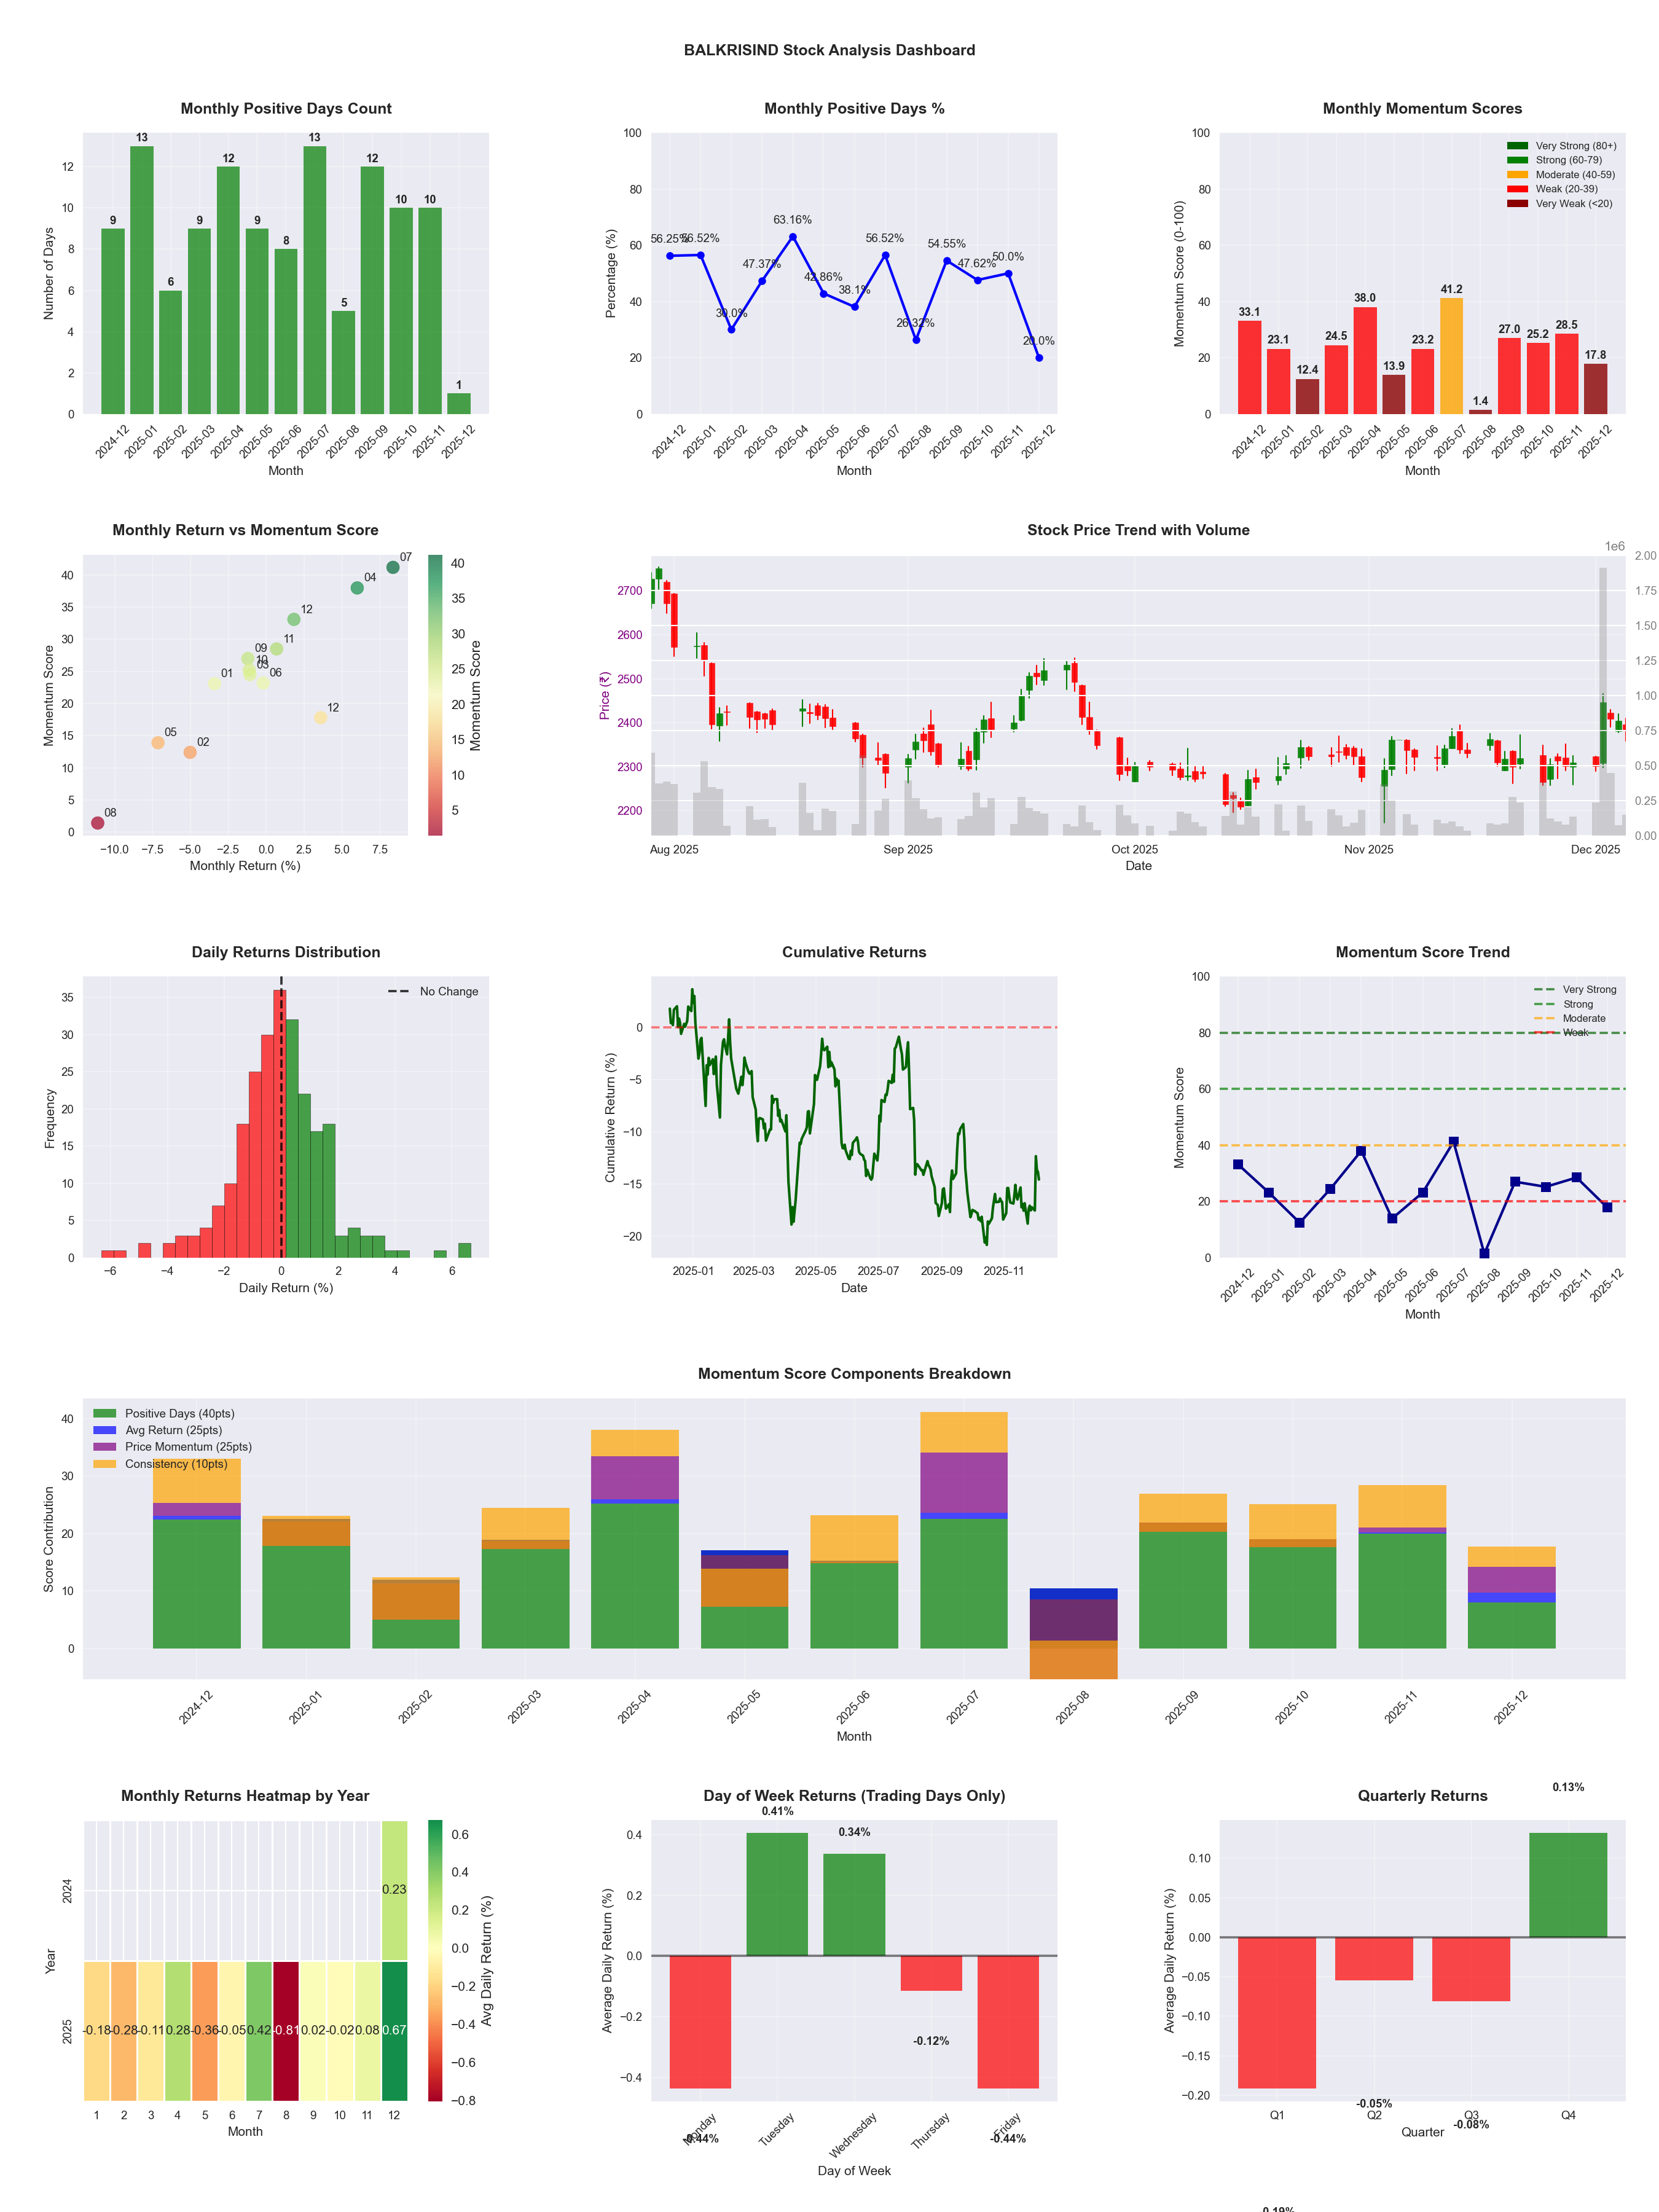
📈 BALKRISIND
Date
📅 2026-04-11
Volatility
🟡 1.87%
Win Rate
⚠️ 44.3%
Avg Daily Return
📈 +0.01%
Max Drawdown
📉 -26.09%
IBD RS Score
📊 49.9
Weak
Market Rank
#247
Best Month
🏆 2025-04
Worst Month
📉 2026-03
Best Months to Trade
📅 Apr, Jul, Feb
Best Days to Trade
📅 Tuesday, Wednesday
📊 Key Insights & Metrics
Symbol
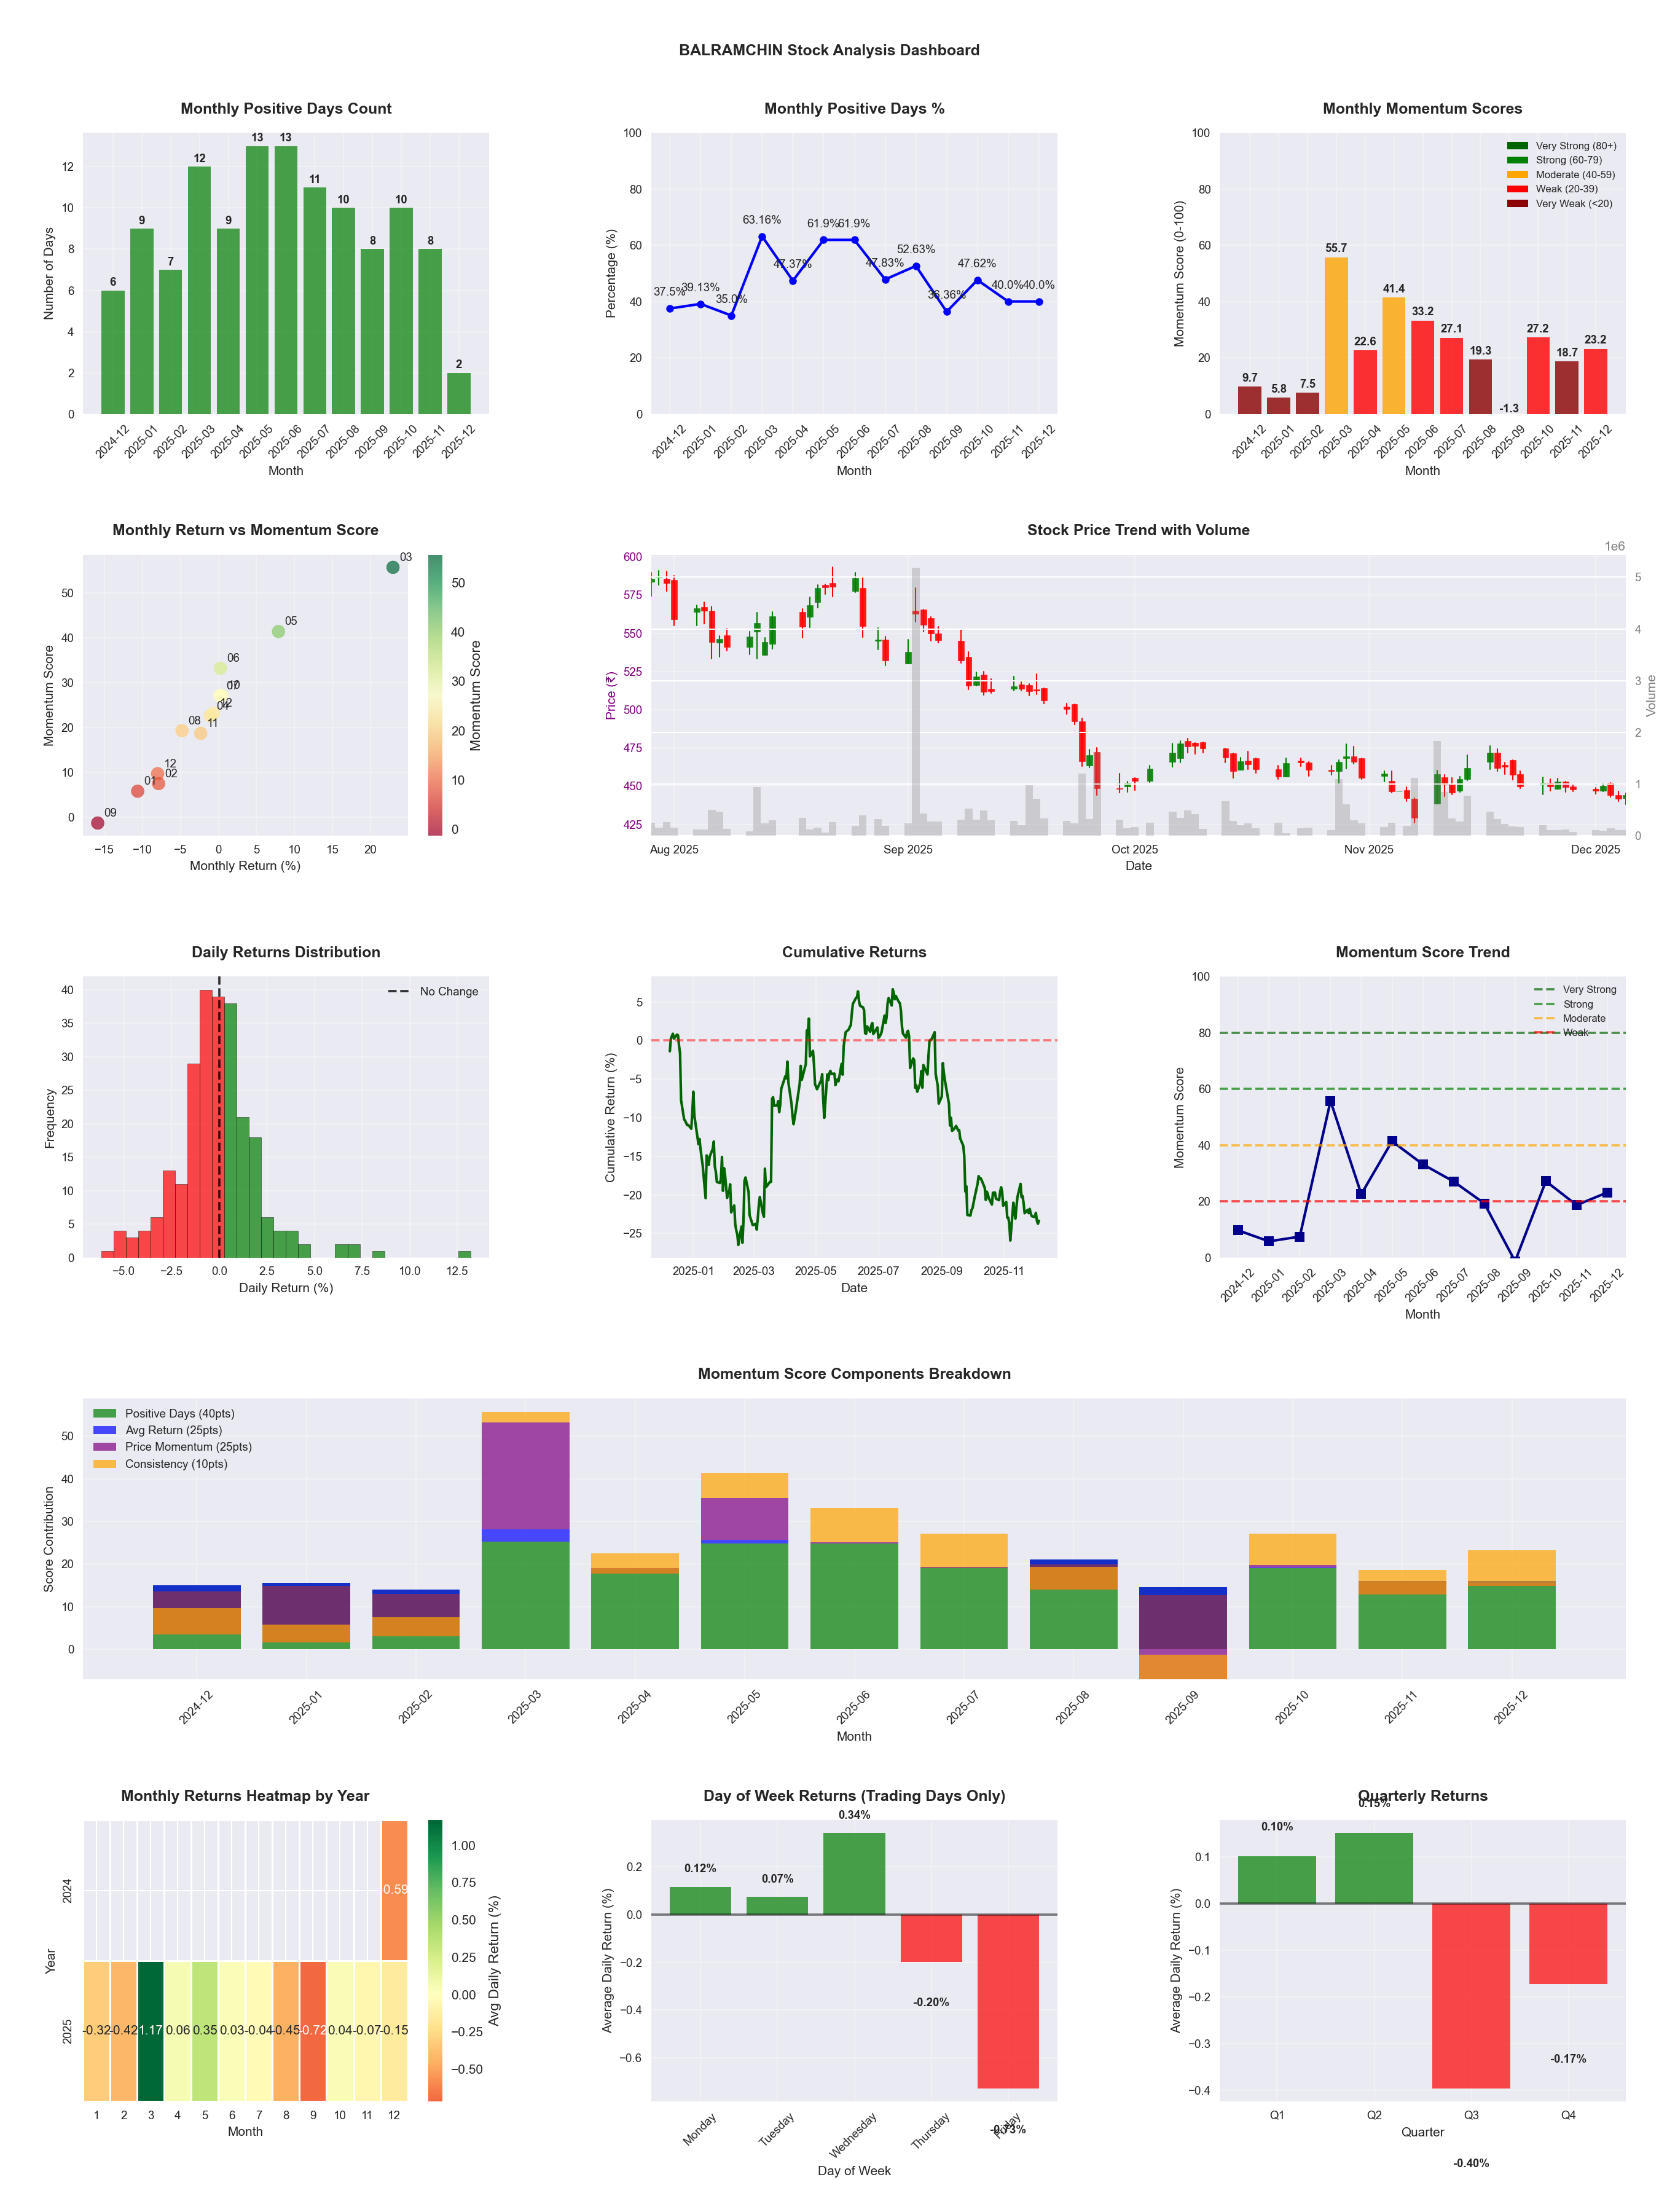
📈 BALRAMCHIN
Date
📅 2026-04-11
Volatility
🟡 1.97%
Win Rate
⚠️ 47.6%
Avg Daily Return
📉 -0.02%
Max Drawdown
📉 -35.64%
IBD RS Score
📊 56.8
Average
Market Rank
#213
Best Month
🏆 2026-02
Best Months to Trade
📅 Feb, May, Mar
Best Days to Trade
📅 Wednesday, Monday
📊 Key Insights & Metrics
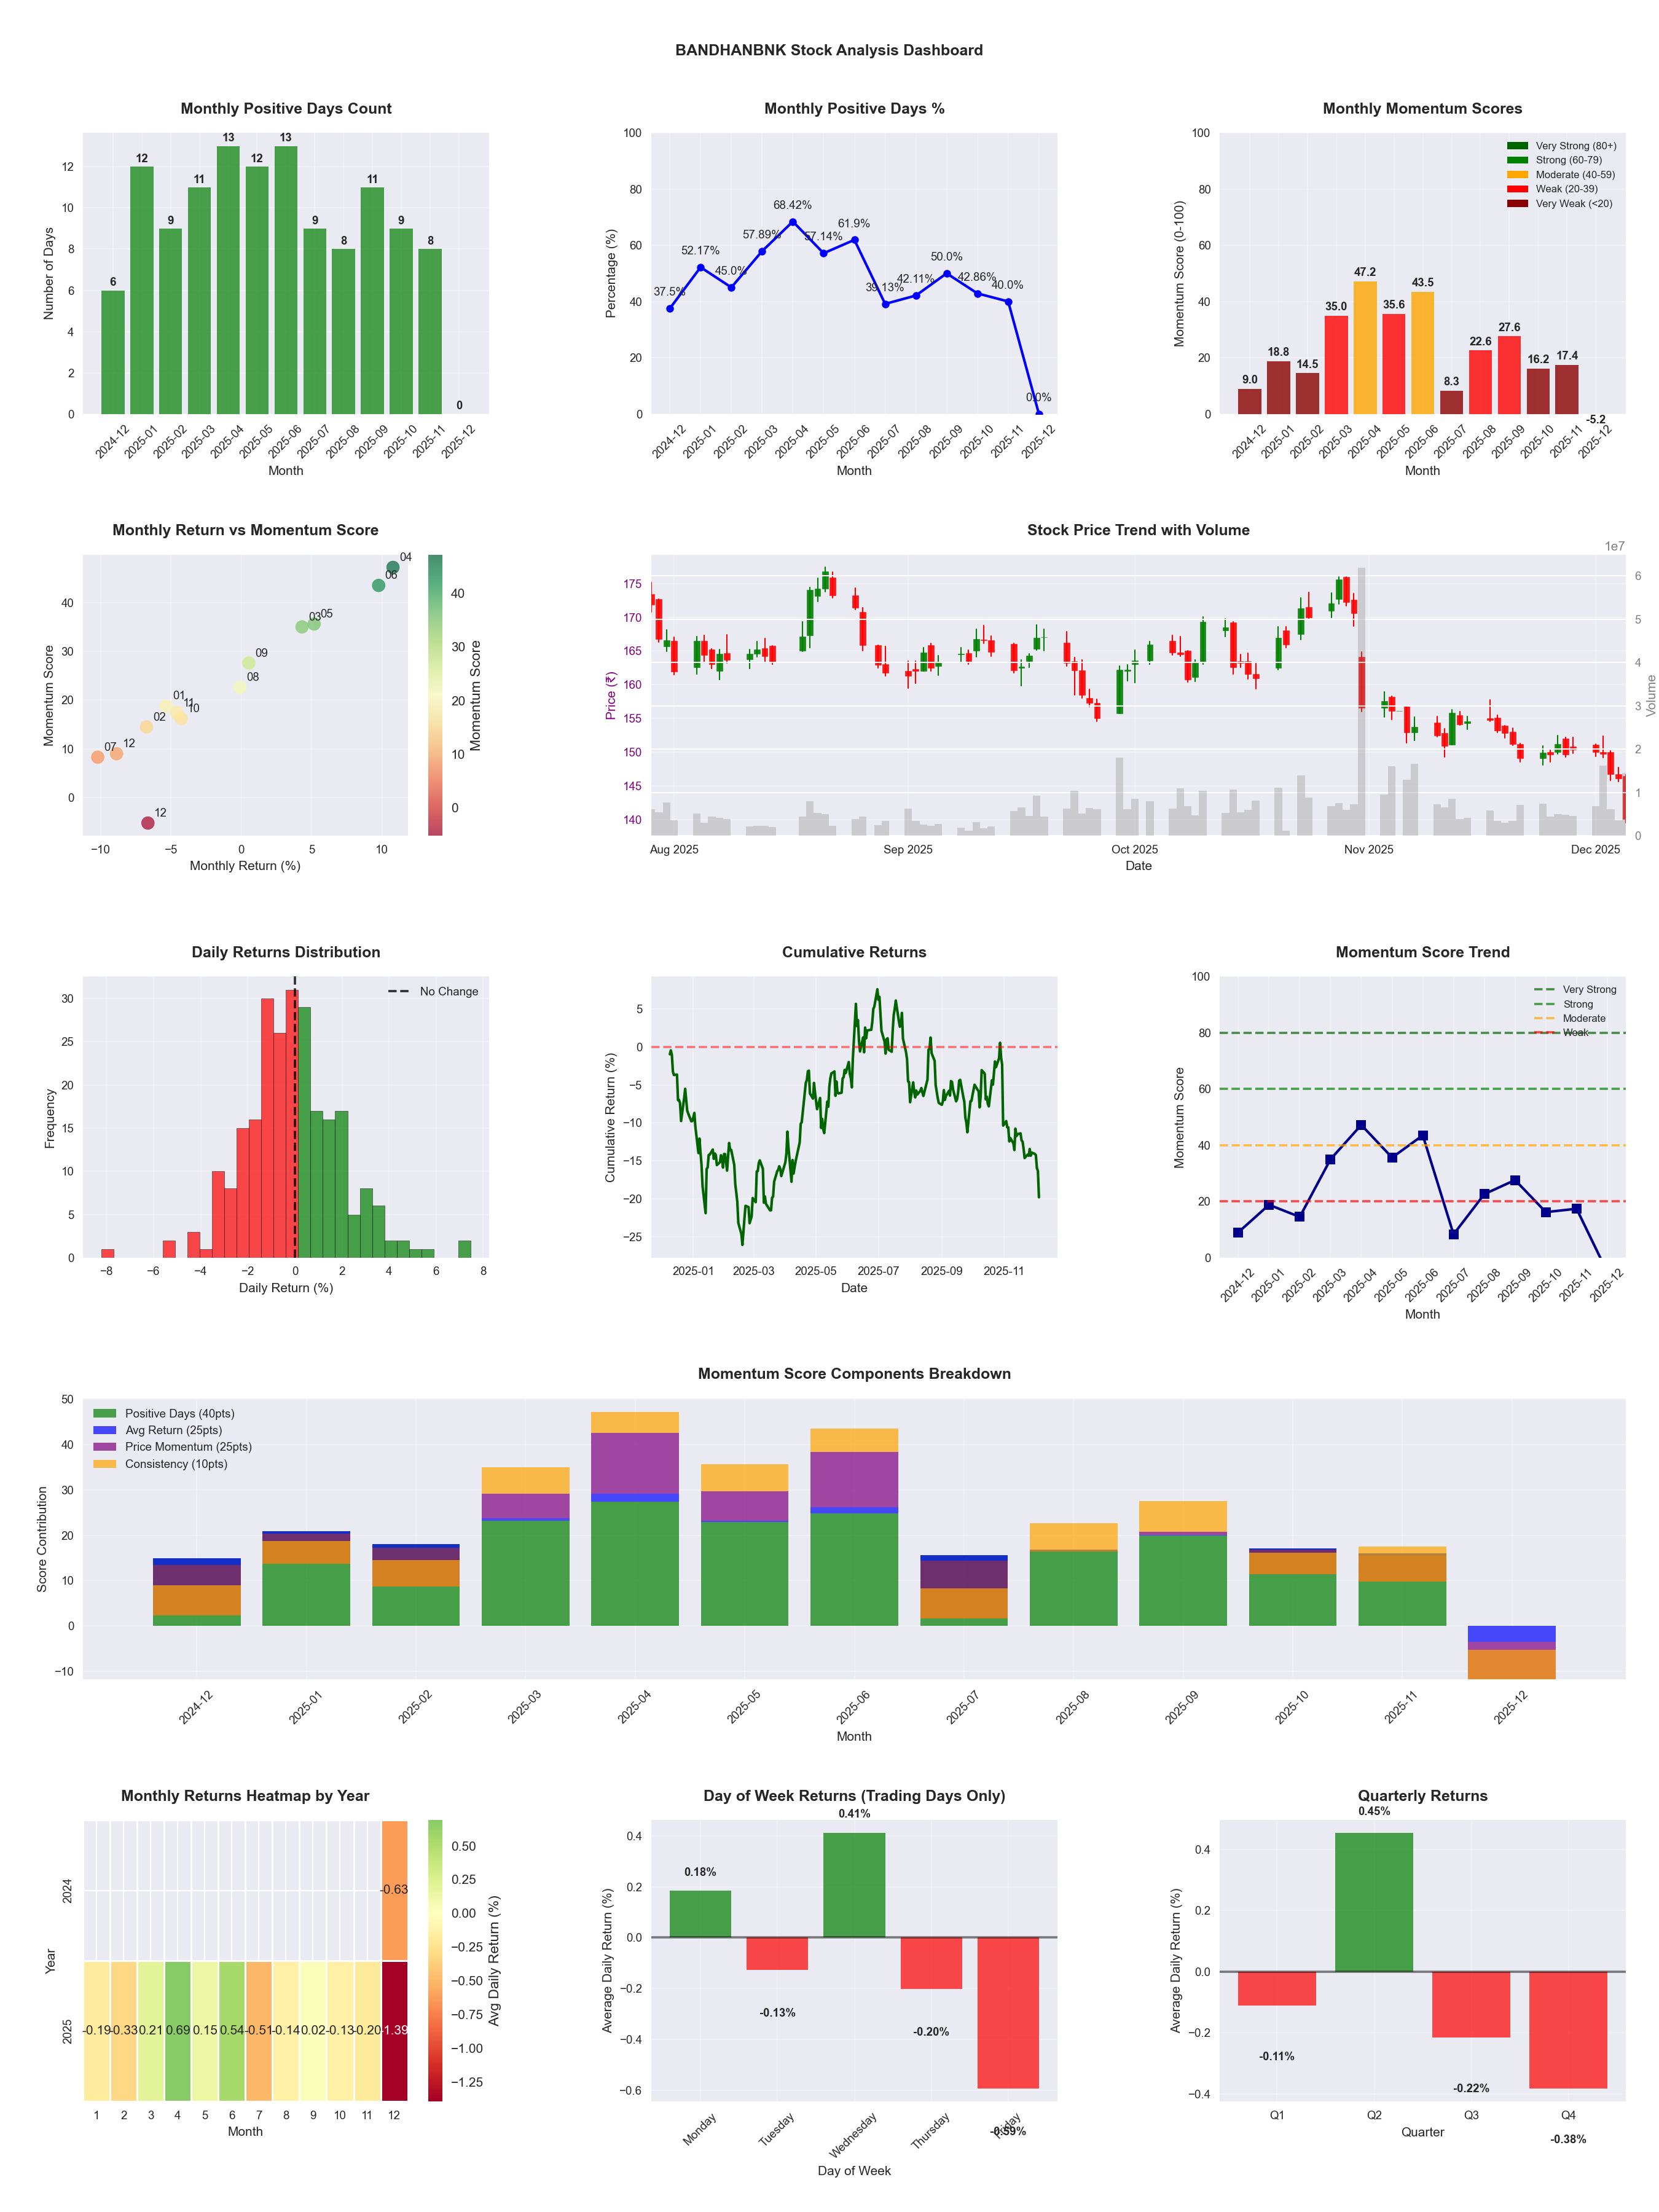
Symbol
📈 BANDHANBNK
Date
📅 2026-04-11
Volatility
🟡 2.27%
Risk Profile
⚠️ suitable for aggressive investors
Win Rate
⚠️ 49.6%
Avg Daily Return
📈 +0.08%
Max Drawdown
📉 -27.91%
IBD RS Score
📊 73.8
Strong
Market Rank
#129
Best Month
🏆 2026-02
Best Months to Trade
📅 Apr, Feb, Jun
Best Days to Trade
📅 Wednesday, Monday
📊 Key Insights & Metrics
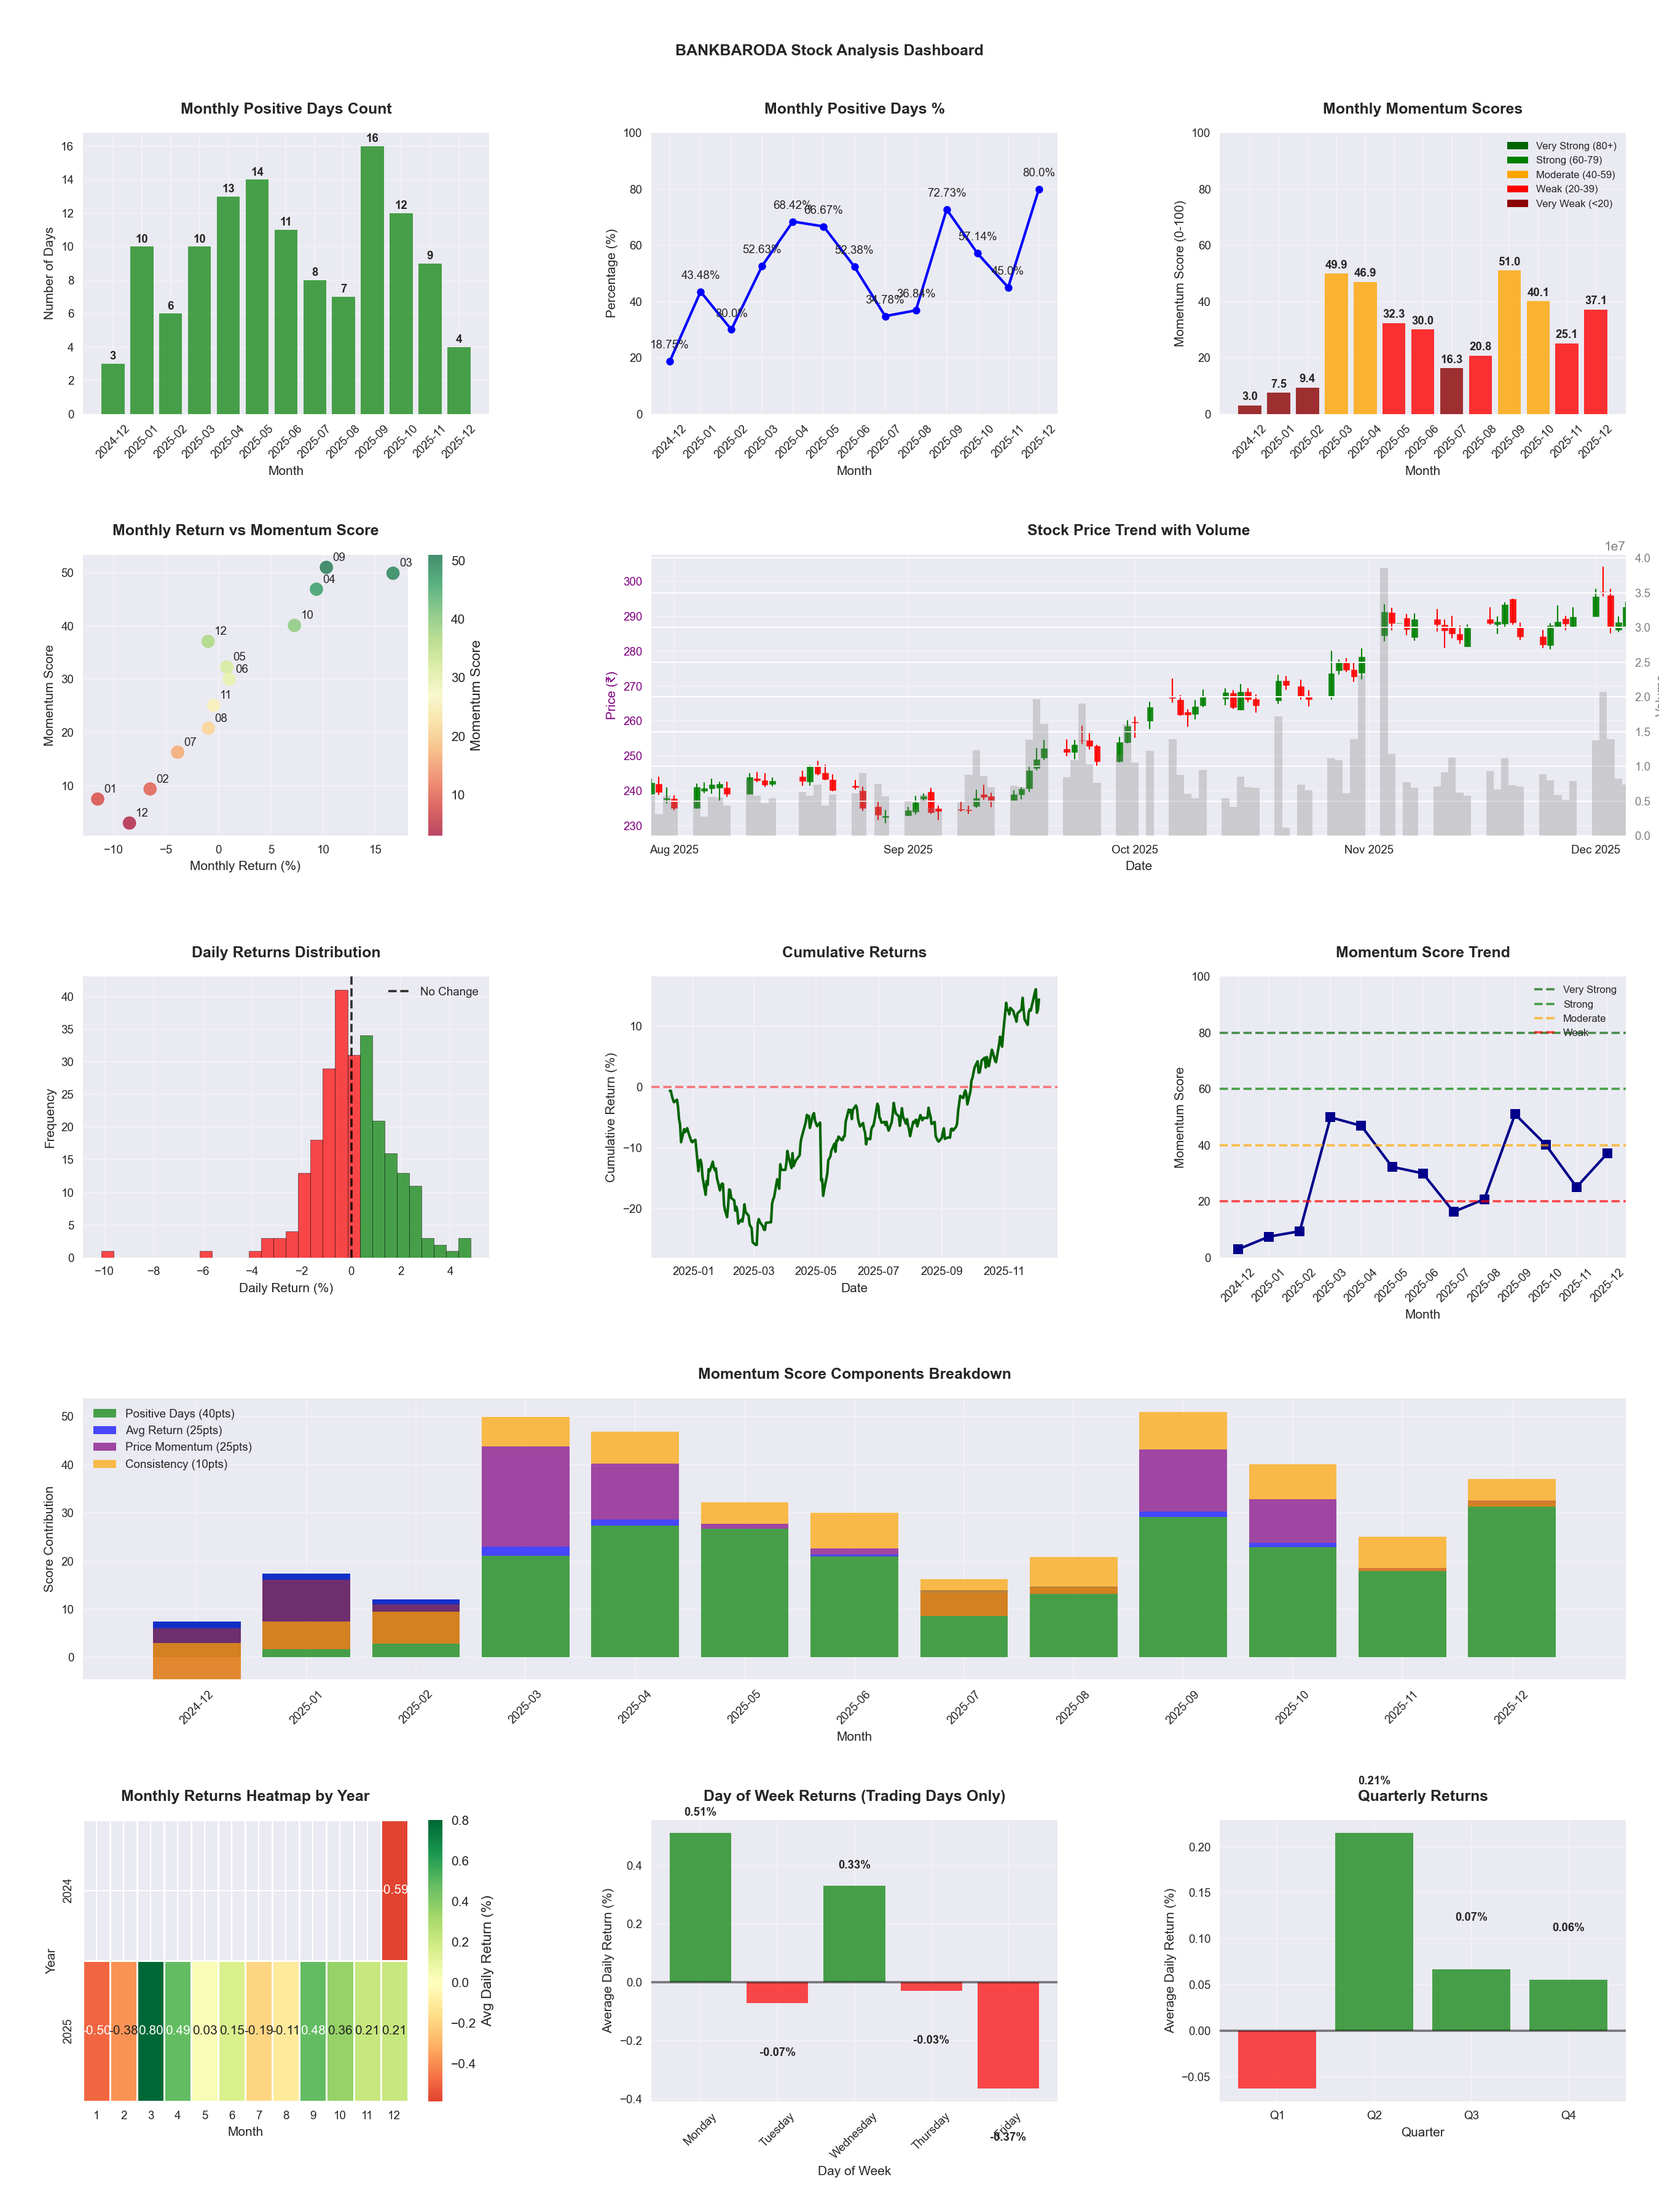
Symbol
📈 BANKBARODA
Date
📅 2026-04-11
Volatility
🟡 1.78%
Win Rate
⚠️ 52.4%
Avg Daily Return
📈 +0.10%
Max Drawdown
📉 -23.69%
IBD RS Score
📊 68.8
Average
Market Rank
#154
Best Month
🏆 2025-09
Best Months to Trade
📅 Apr, Sep, Feb
Best Days to Trade
📅 Monday, Wednesday
📊 Key Insights & Metrics
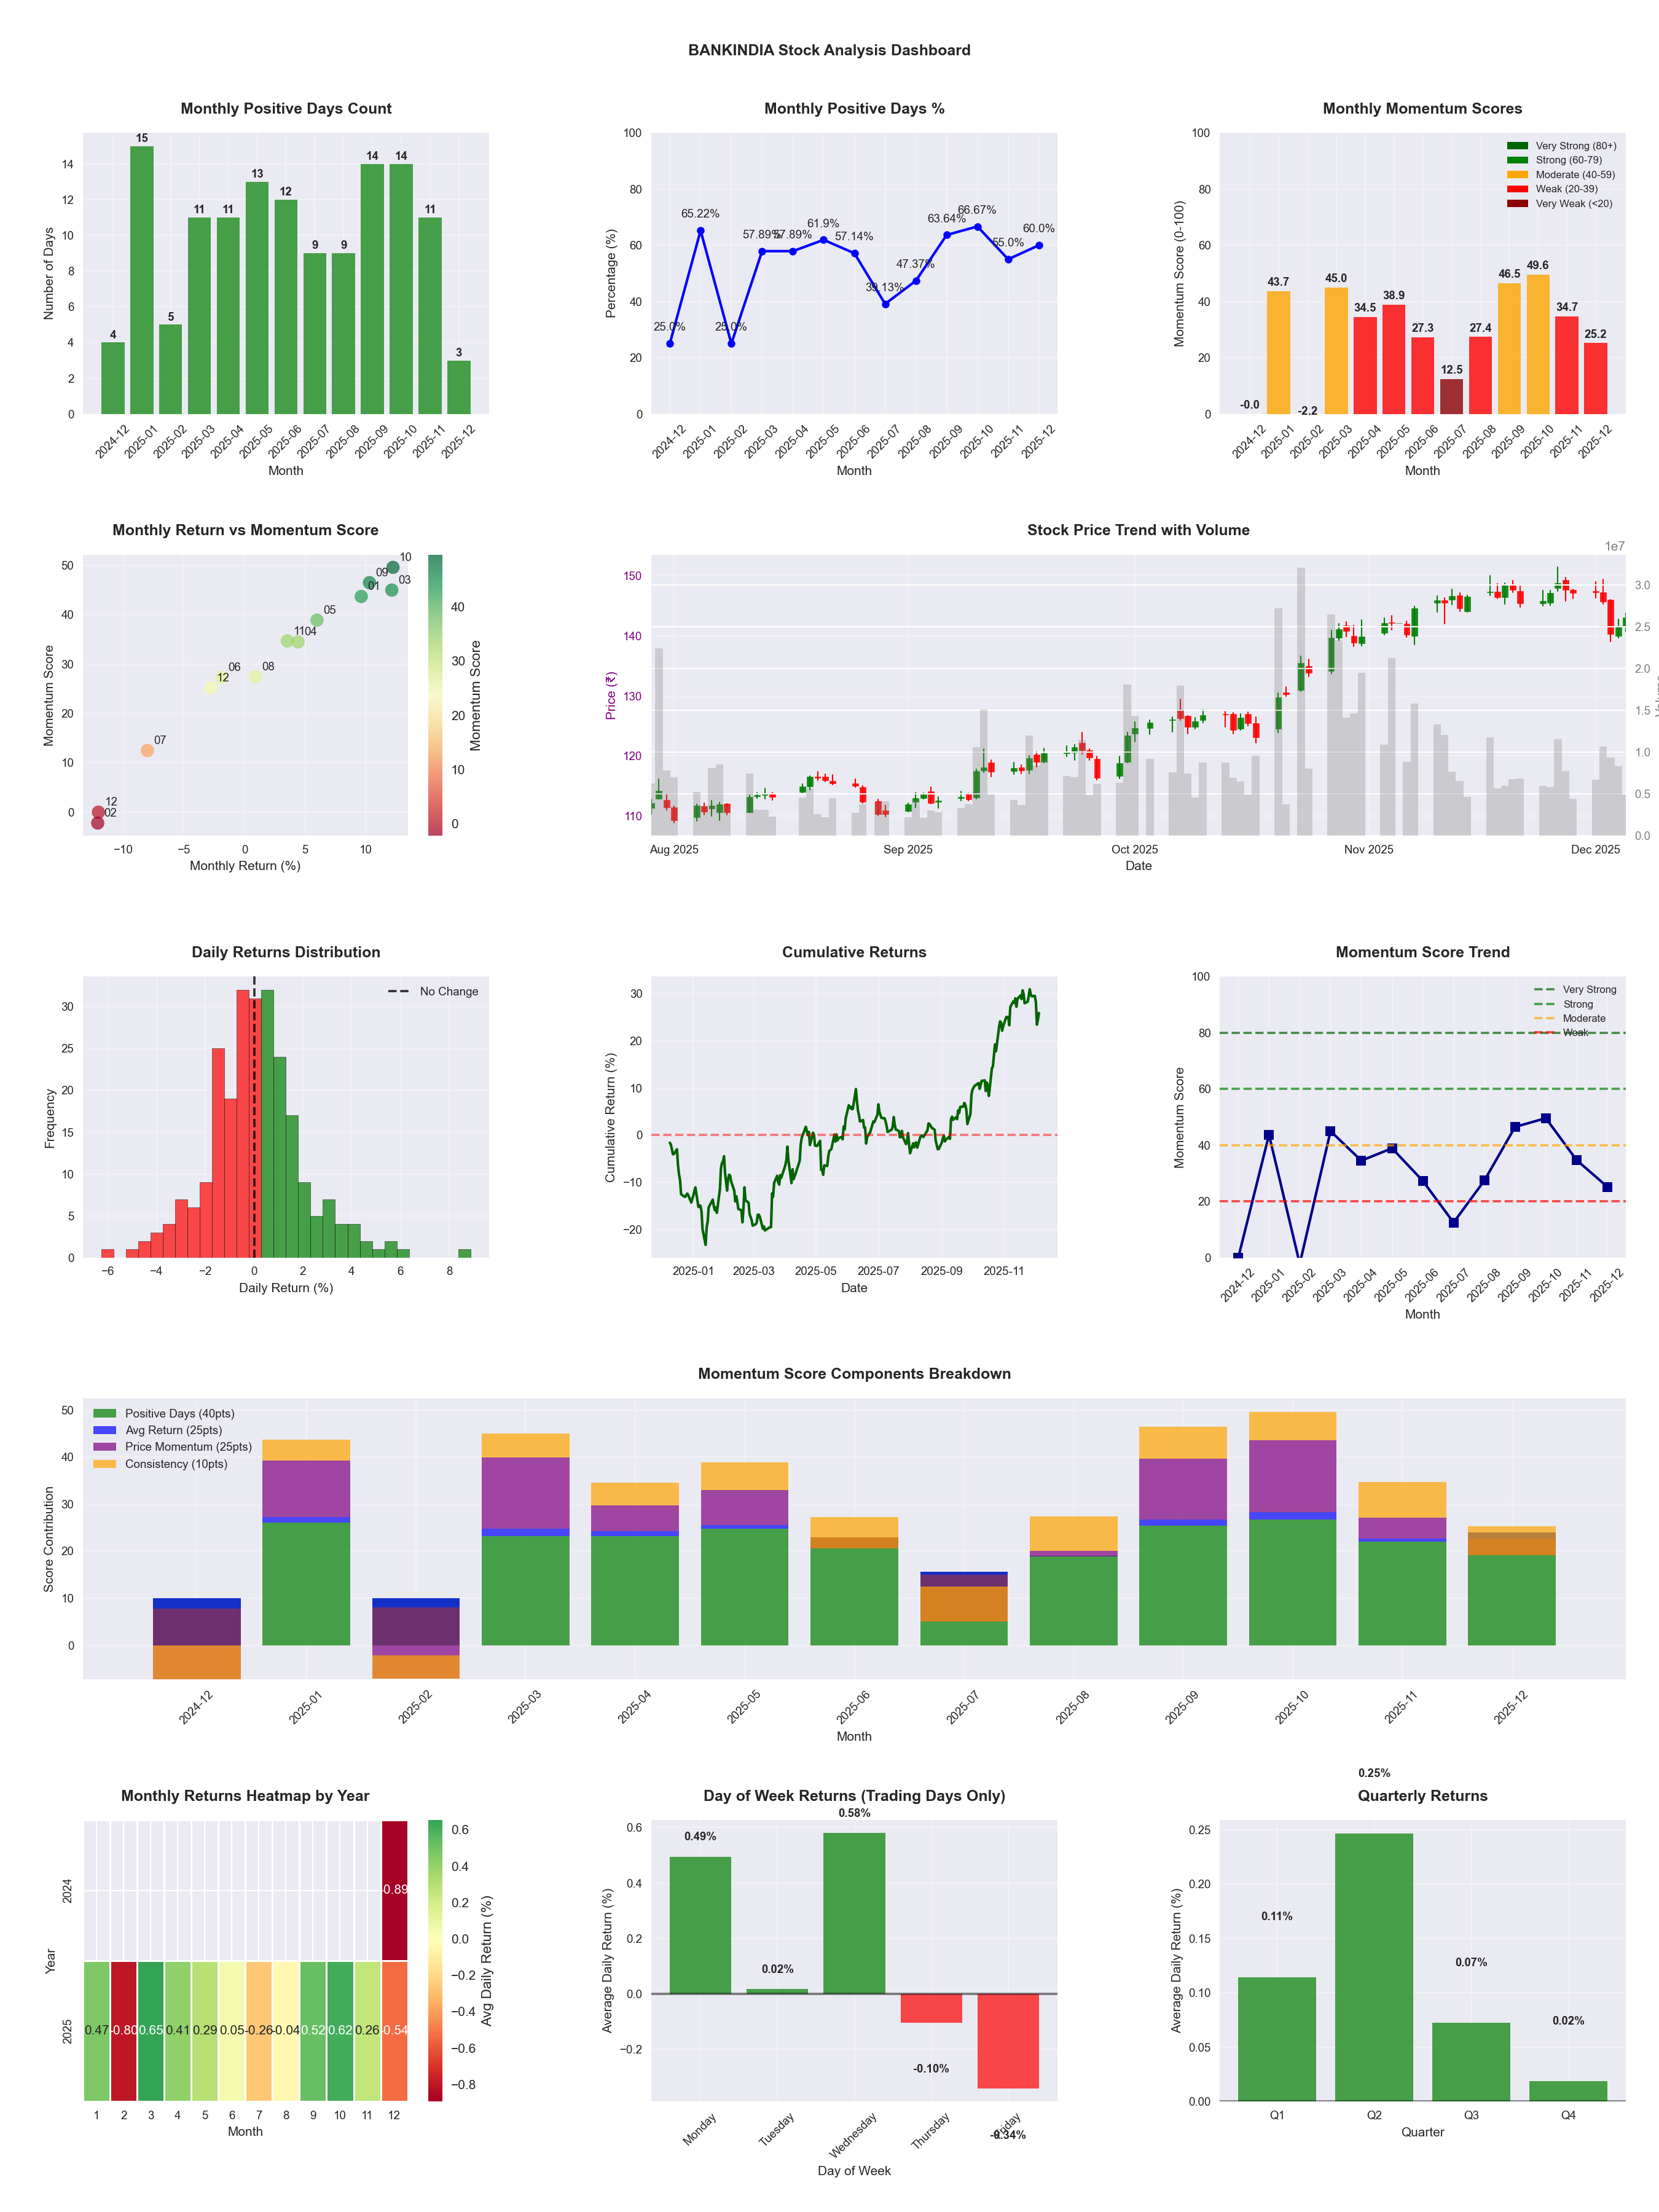
Symbol
📈 BANKINDIA
Date
📅 2026-04-11
Volatility
🟡 2.02%
Risk Profile
⚠️ suitable for aggressive investors
Win Rate
⚠️ 56.5%
Avg Daily Return
📈 +0.16%
Max Drawdown
📉 -22.69%
IBD RS Score
📊 84.4
Strong
Market Rank
#77
Best Month
🏆 2026-02
Best Months to Trade
📅 Apr, Jan, Oct
Best Days to Trade
📅 Wednesday, Monday
📊 Key Insights & Metrics
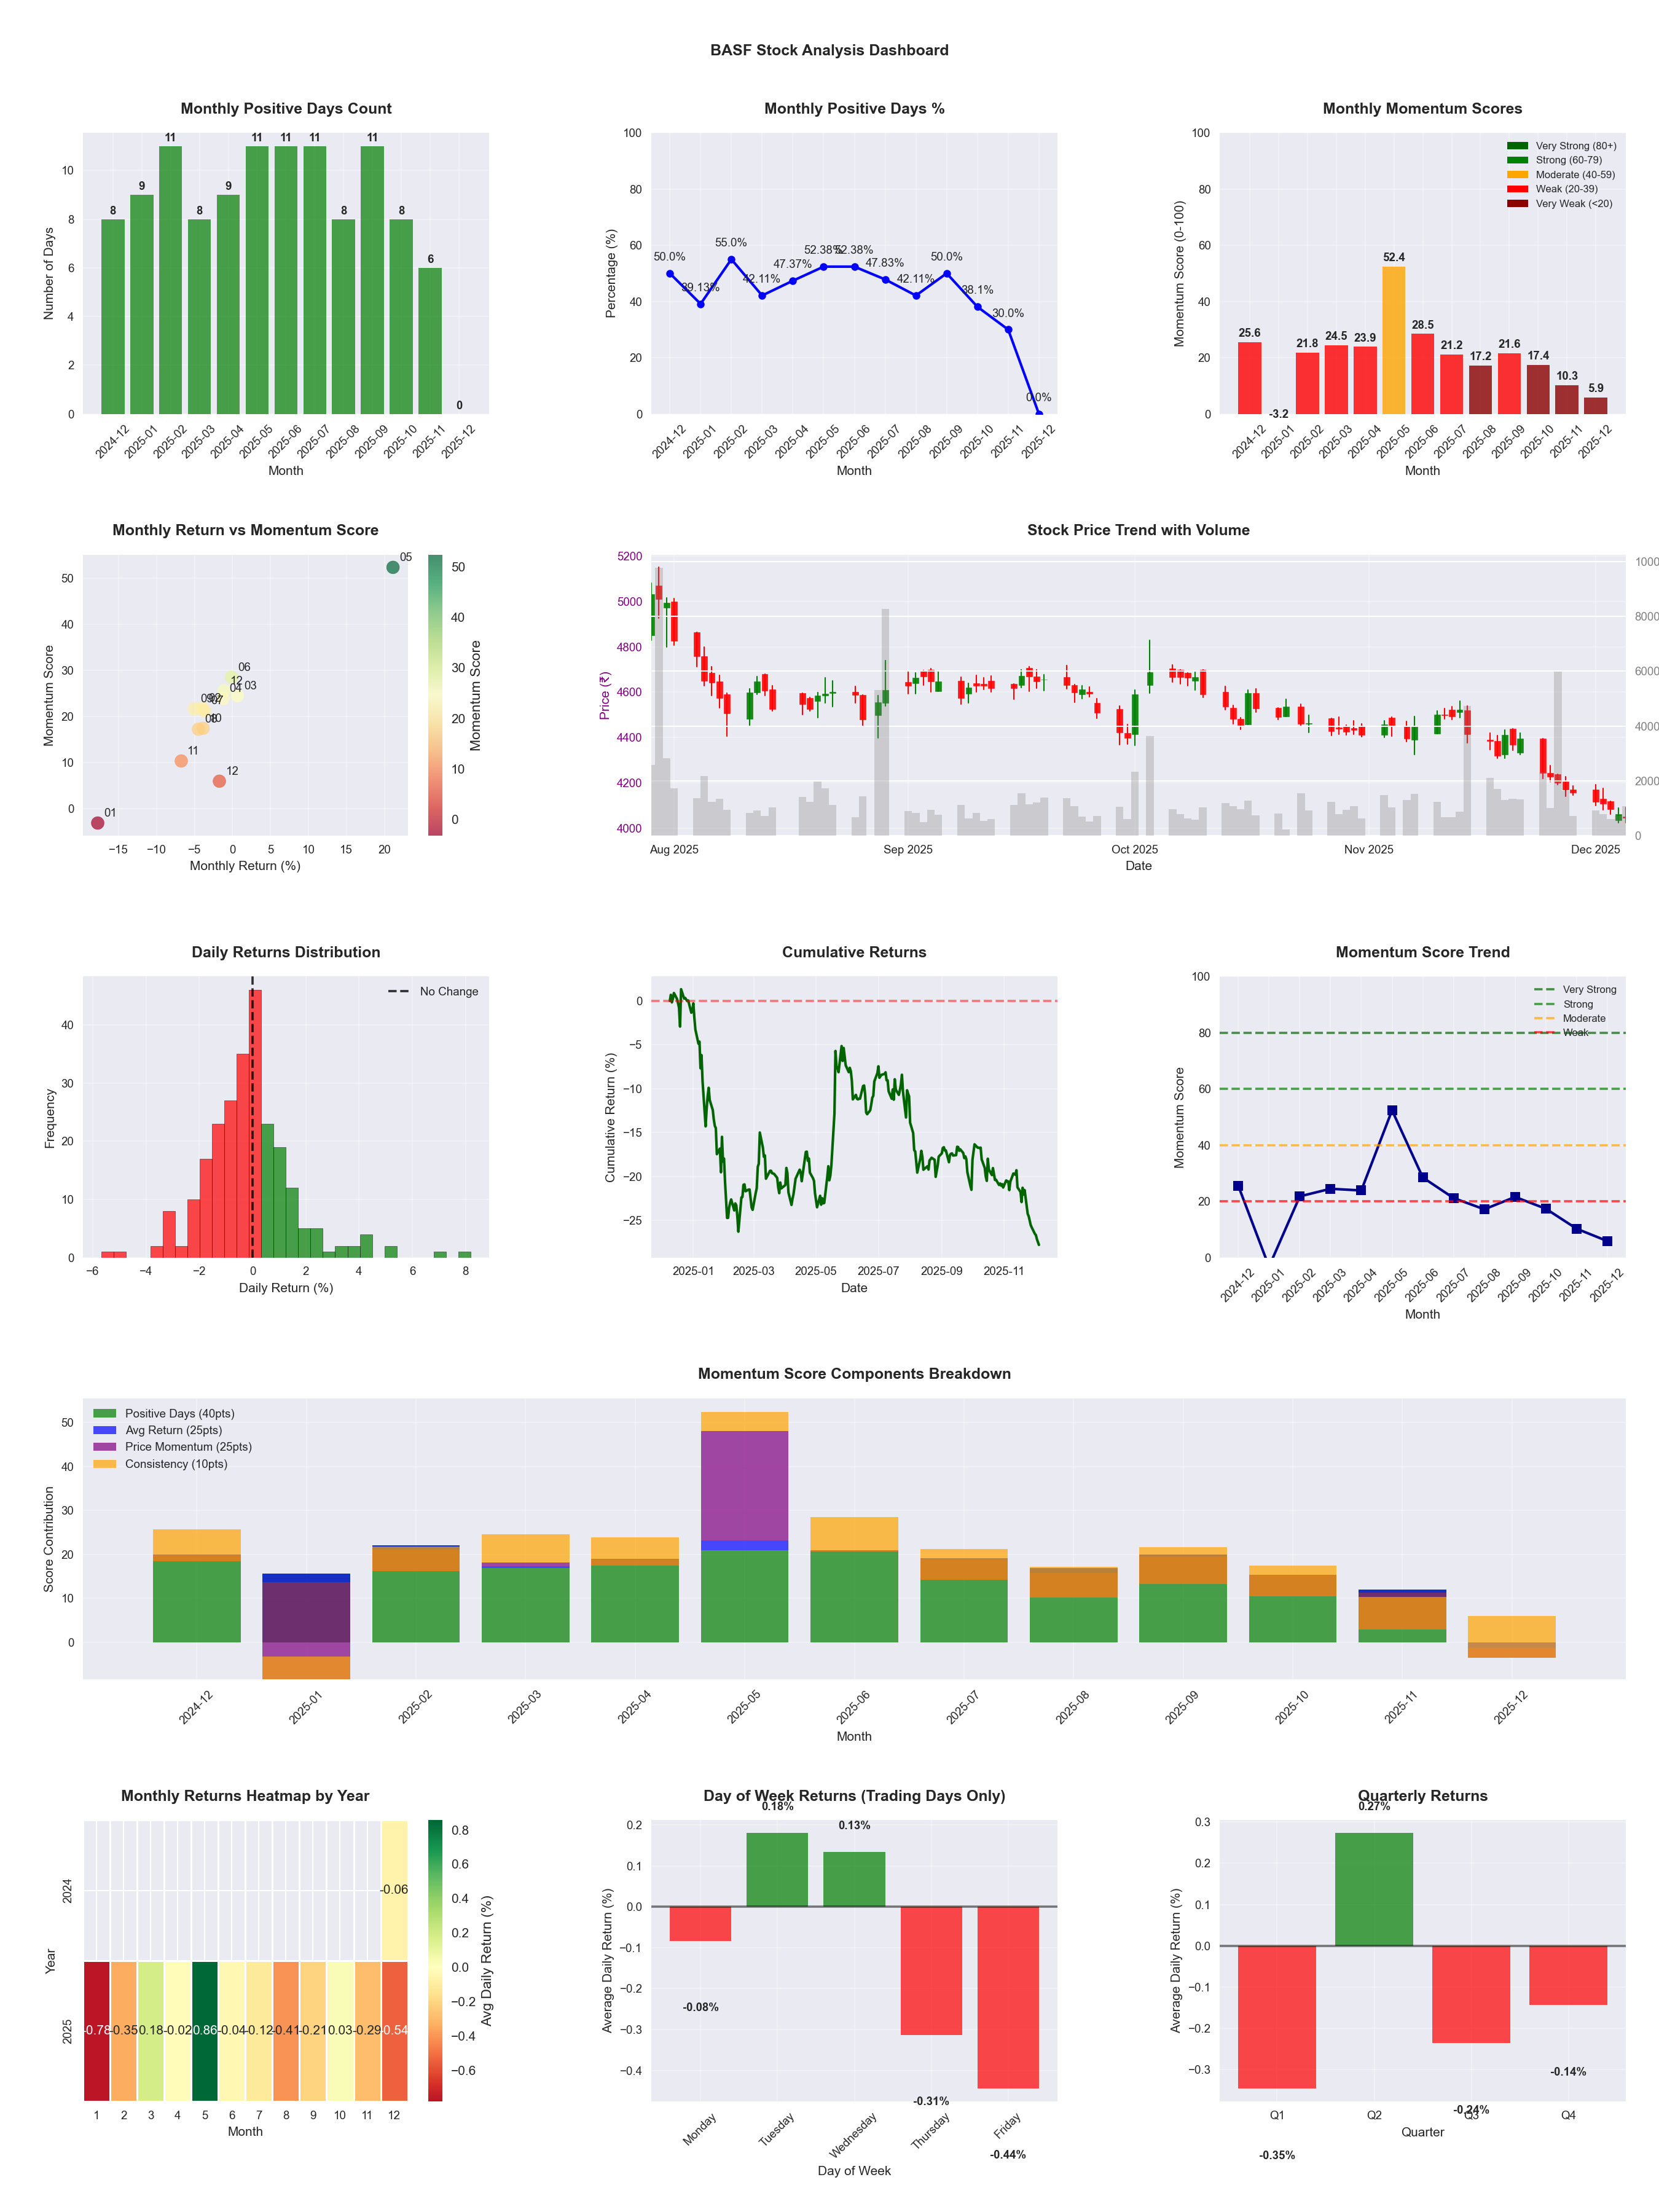
Symbol
📈 BASF
Date
📅 2026-04-11
Volatility
🟡 1.81%
Win Rate
⚠️ 41.1%
Avg Daily Return
📉 -0.07%
Max Drawdown
📉 -40.48%
IBD RS Score
📊 26.0
Weak
Market Rank
#365
Best Month
🏆 2025-05
Worst Month
📉 2026-03
Best Months to Trade
📅 May, Apr, Oct
Best Days to Trade
📅 Tuesday, Monday
📊 Key Insights & Metrics
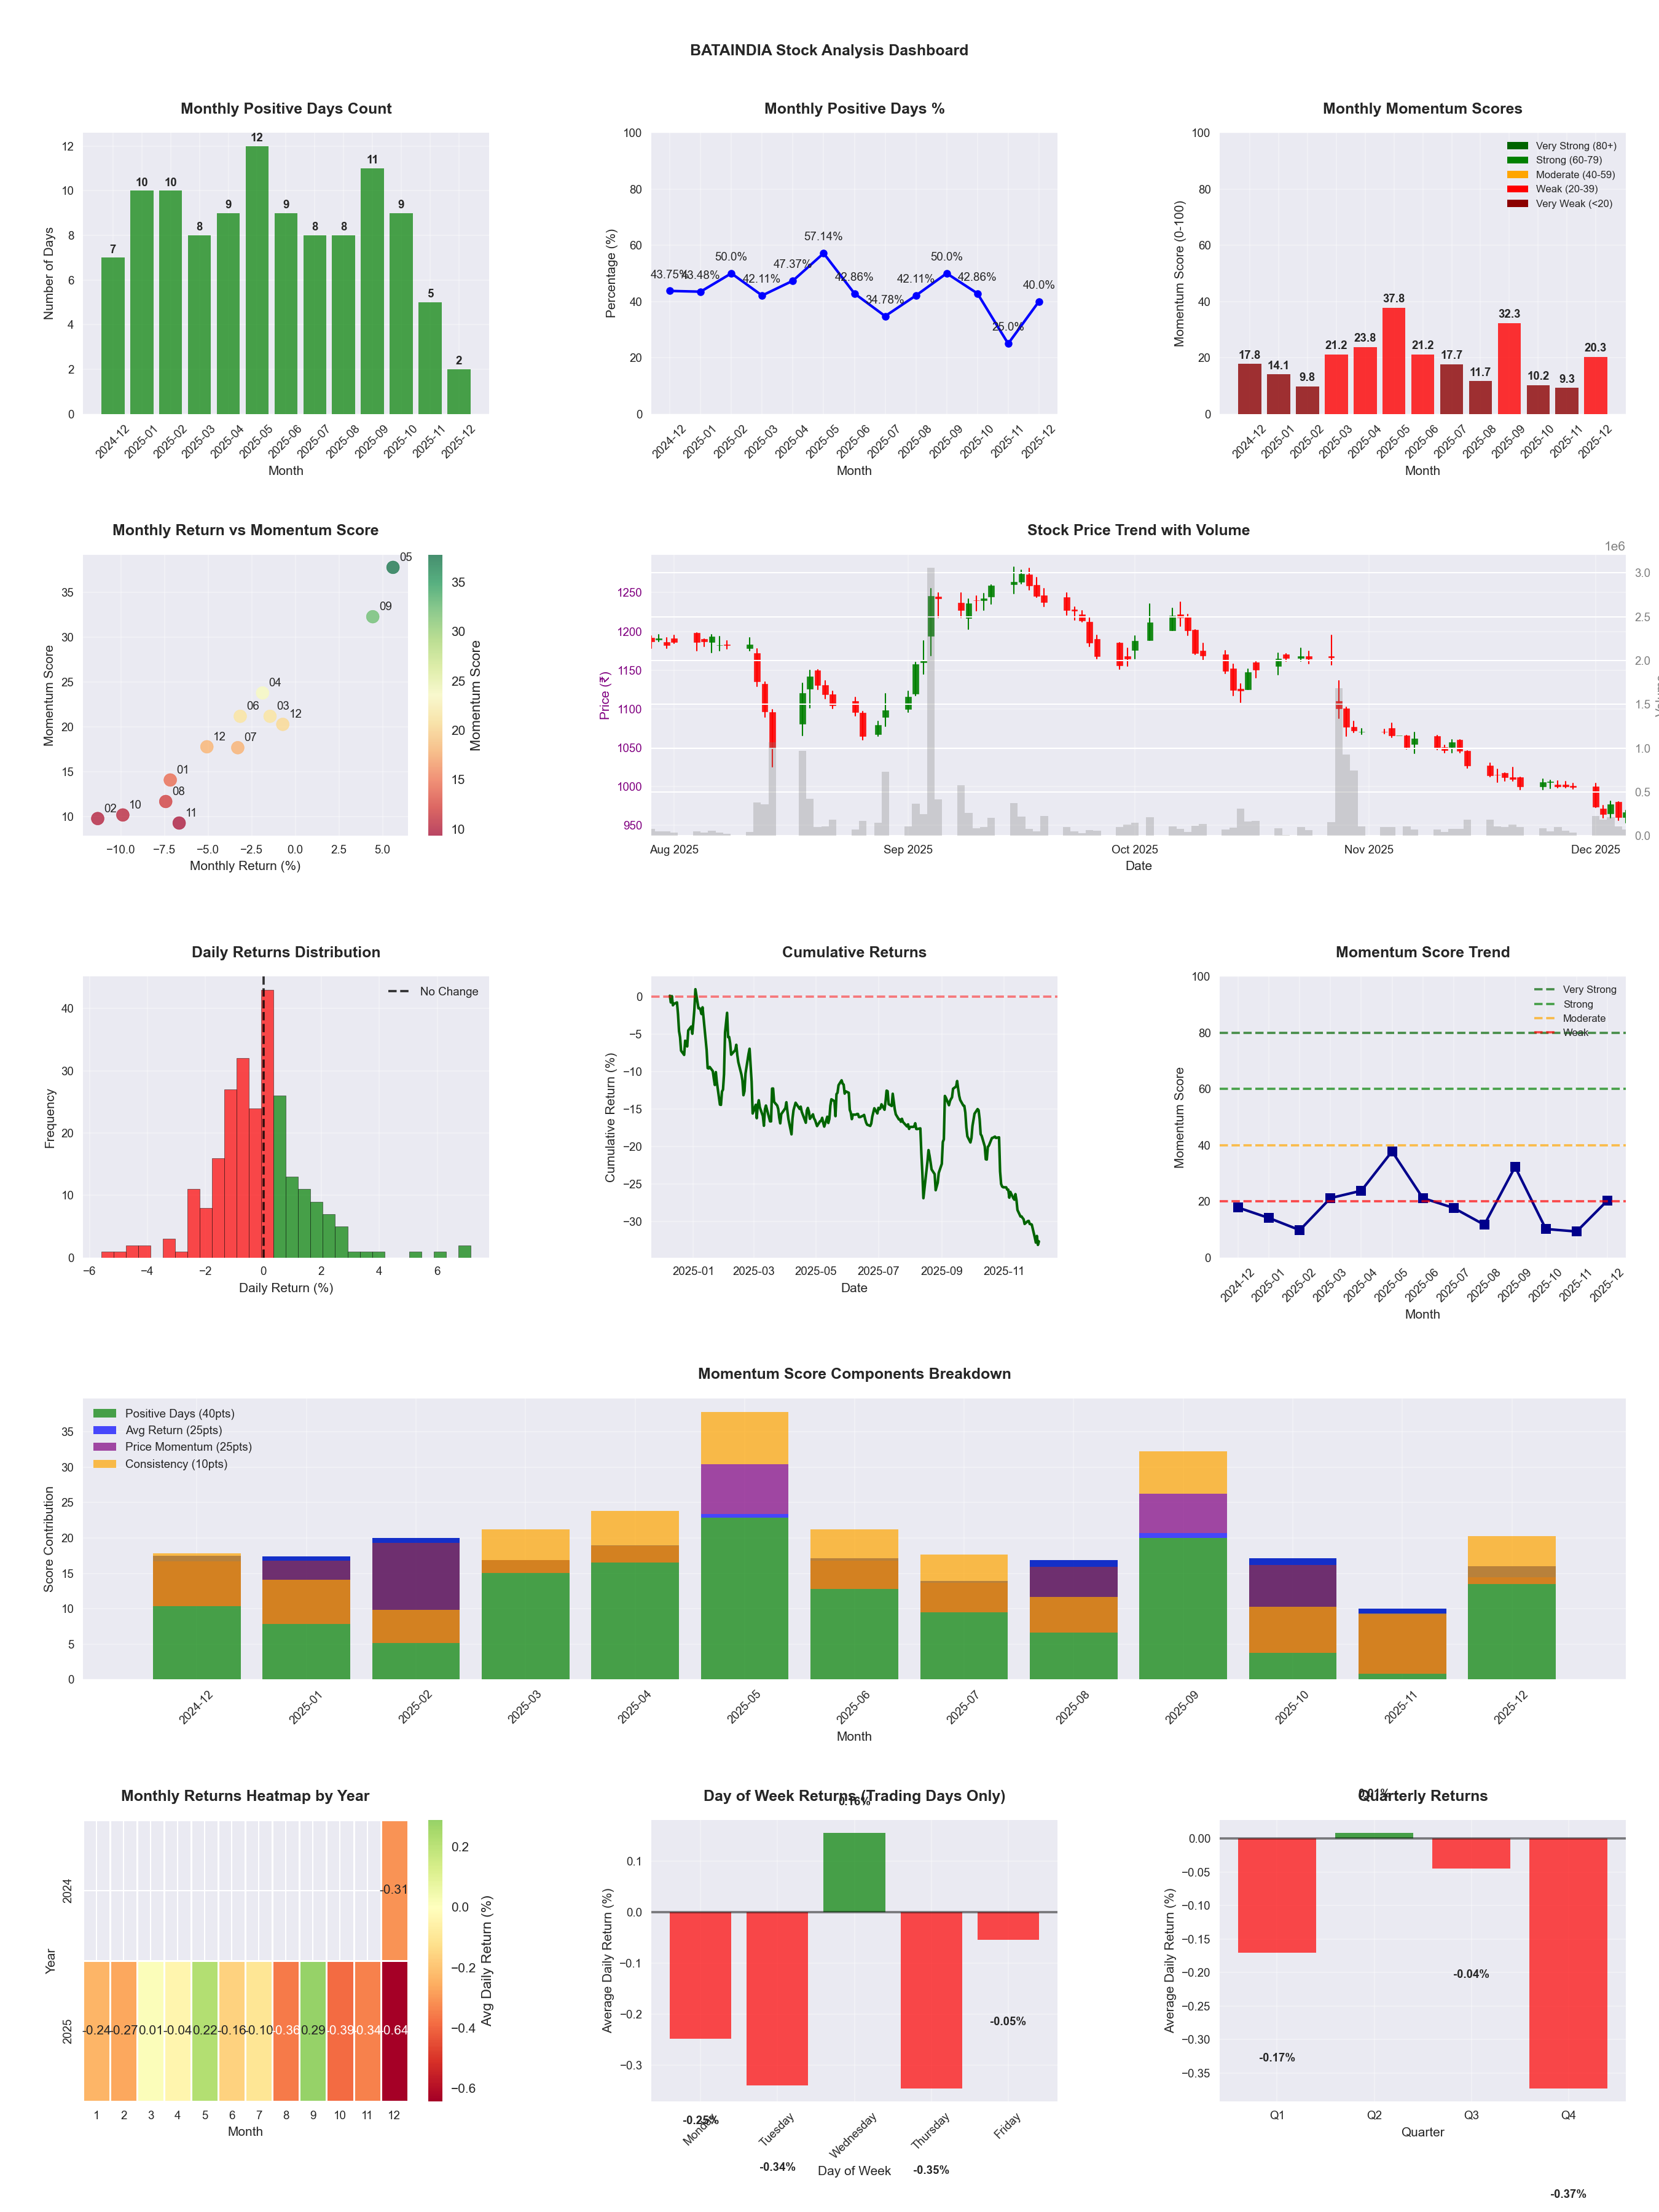
Symbol
📈 BATAINDIA
Date
📅 2026-04-11
Volatility
🟡 1.69%
Win Rate
⚠️ 40.6%
Avg Daily Return
📉 -0.21%
Max Drawdown
📉 -52.37%
IBD RS Score
📊 2.4
Weak
Market Rank
#481
Best Month
🏆 2026-04
Best Months to Trade
📅 Apr, Sep, May
Best Days to Trade
📅 Wednesday, Tuesday
📊 Key Insights & Metrics
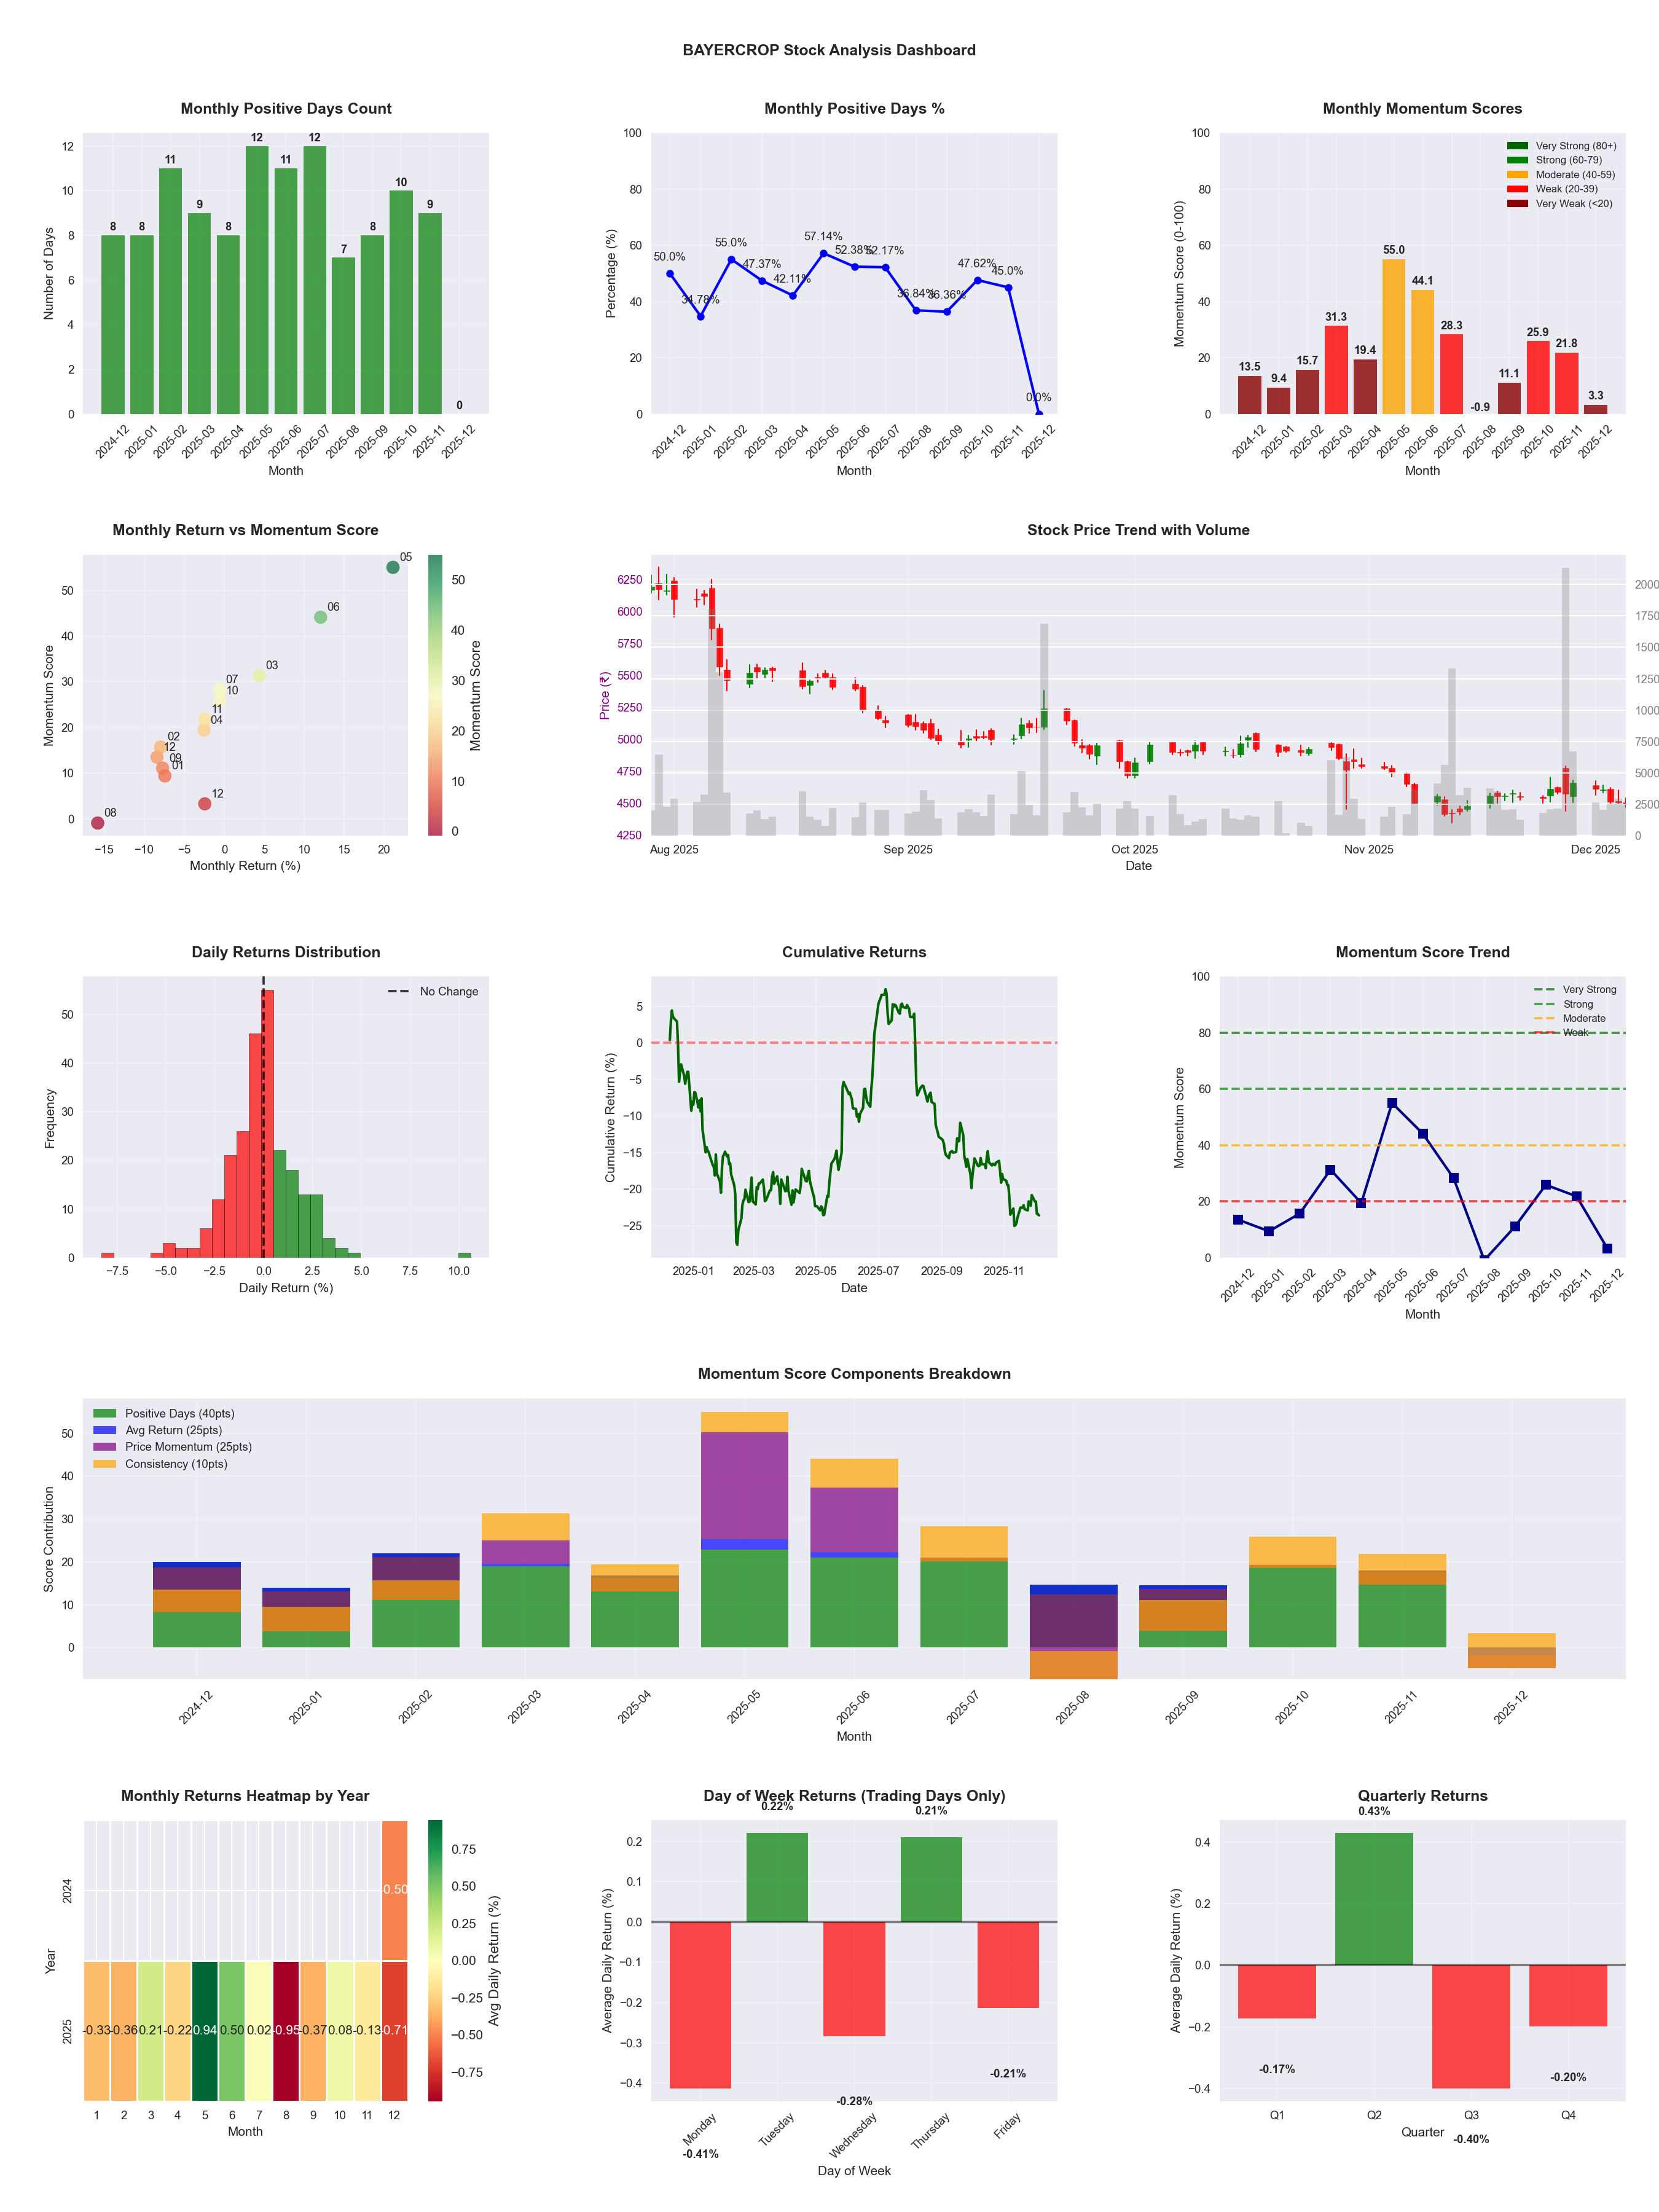
Symbol
📈 BAYERCROP
Date
📅 2026-04-11
Volatility
🟡 1.61%
Win Rate
⚠️ 45.5%
Avg Daily Return
📈 +0.02%
Max Drawdown
📉 -32.09%
IBD RS Score
📊 59.0
Average
Market Rank
#202
Best Month
🏆 2025-05
Best Months to Trade
📅 May, Jun, Feb
Best Days to Trade
📅 Tuesday, Wednesday
📊 Key Insights & Metrics
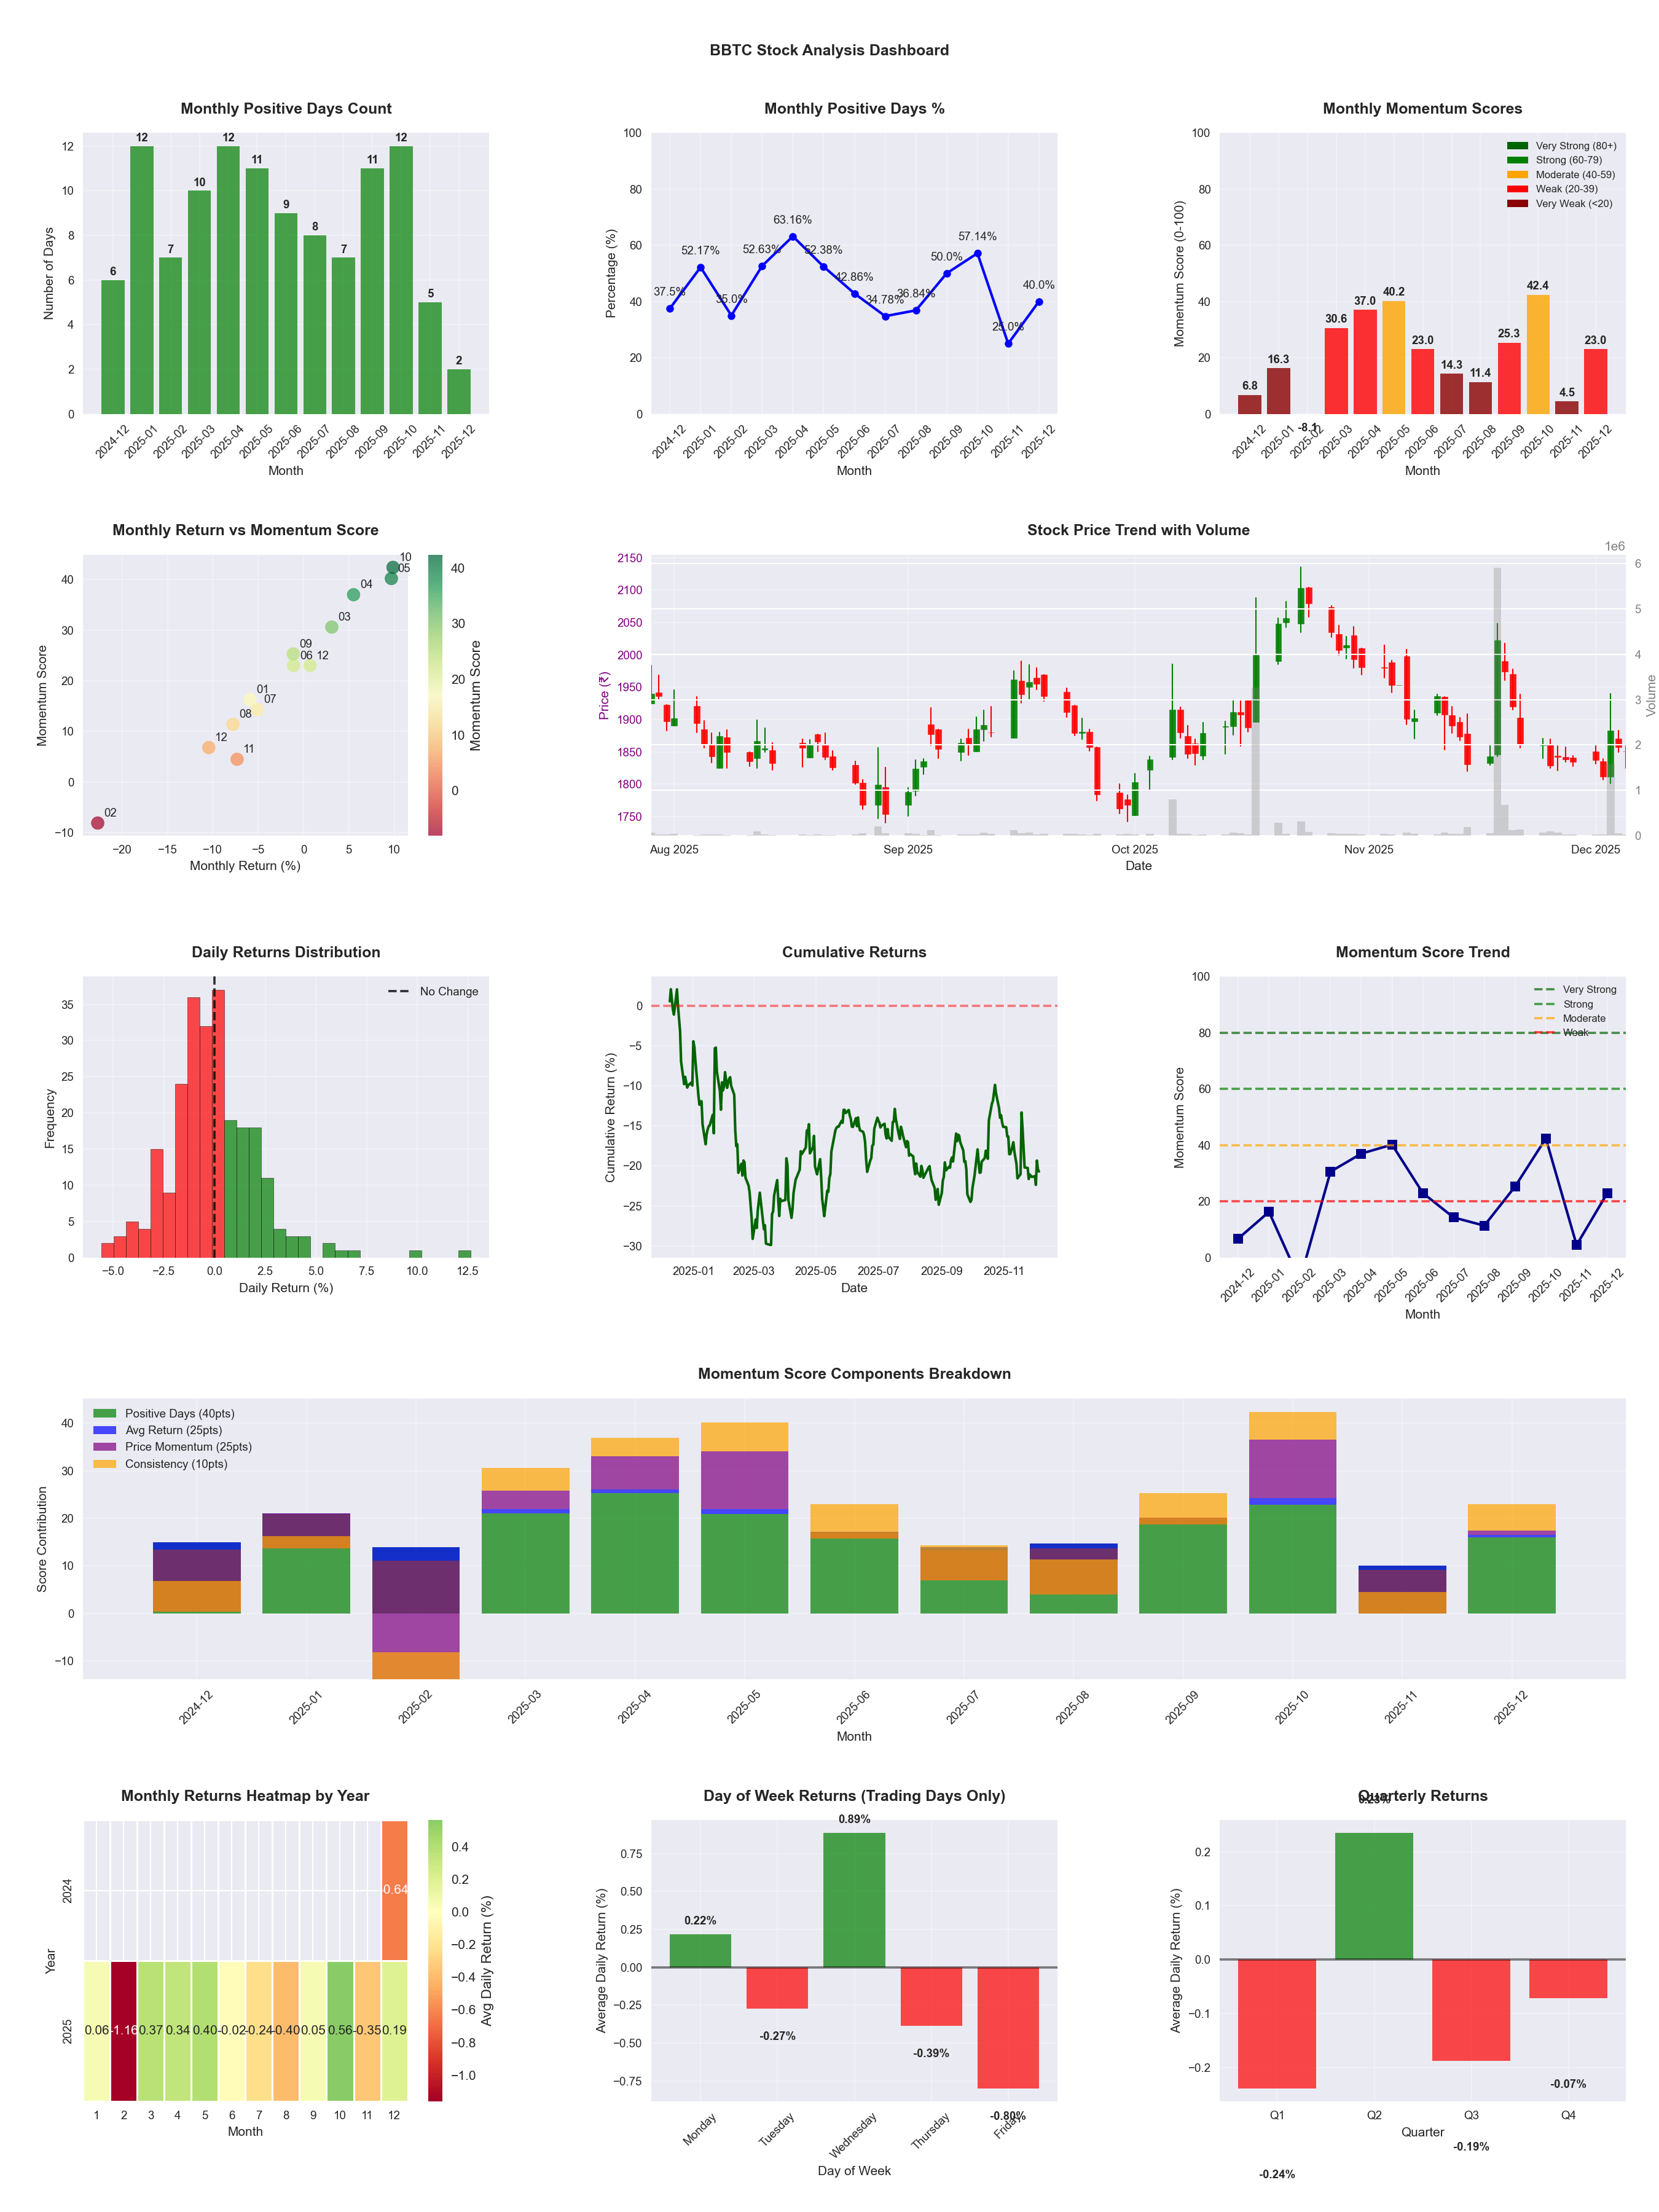
Symbol
📈 BBTC
Date
📅 2026-04-11
Volatility
🟡 1.97%
Win Rate
⚠️ 45.5%
Avg Daily Return
📉 -0.06%
Max Drawdown
📉 -36.54%
IBD RS Score
📊 13.2
Weak
Market Rank
#428
Best Month
🏆 2026-04
Best Months to Trade
📅 Apr, Oct, May
Best Days to Trade
📅 Wednesday, Tuesday
📊 Key Insights & Metrics
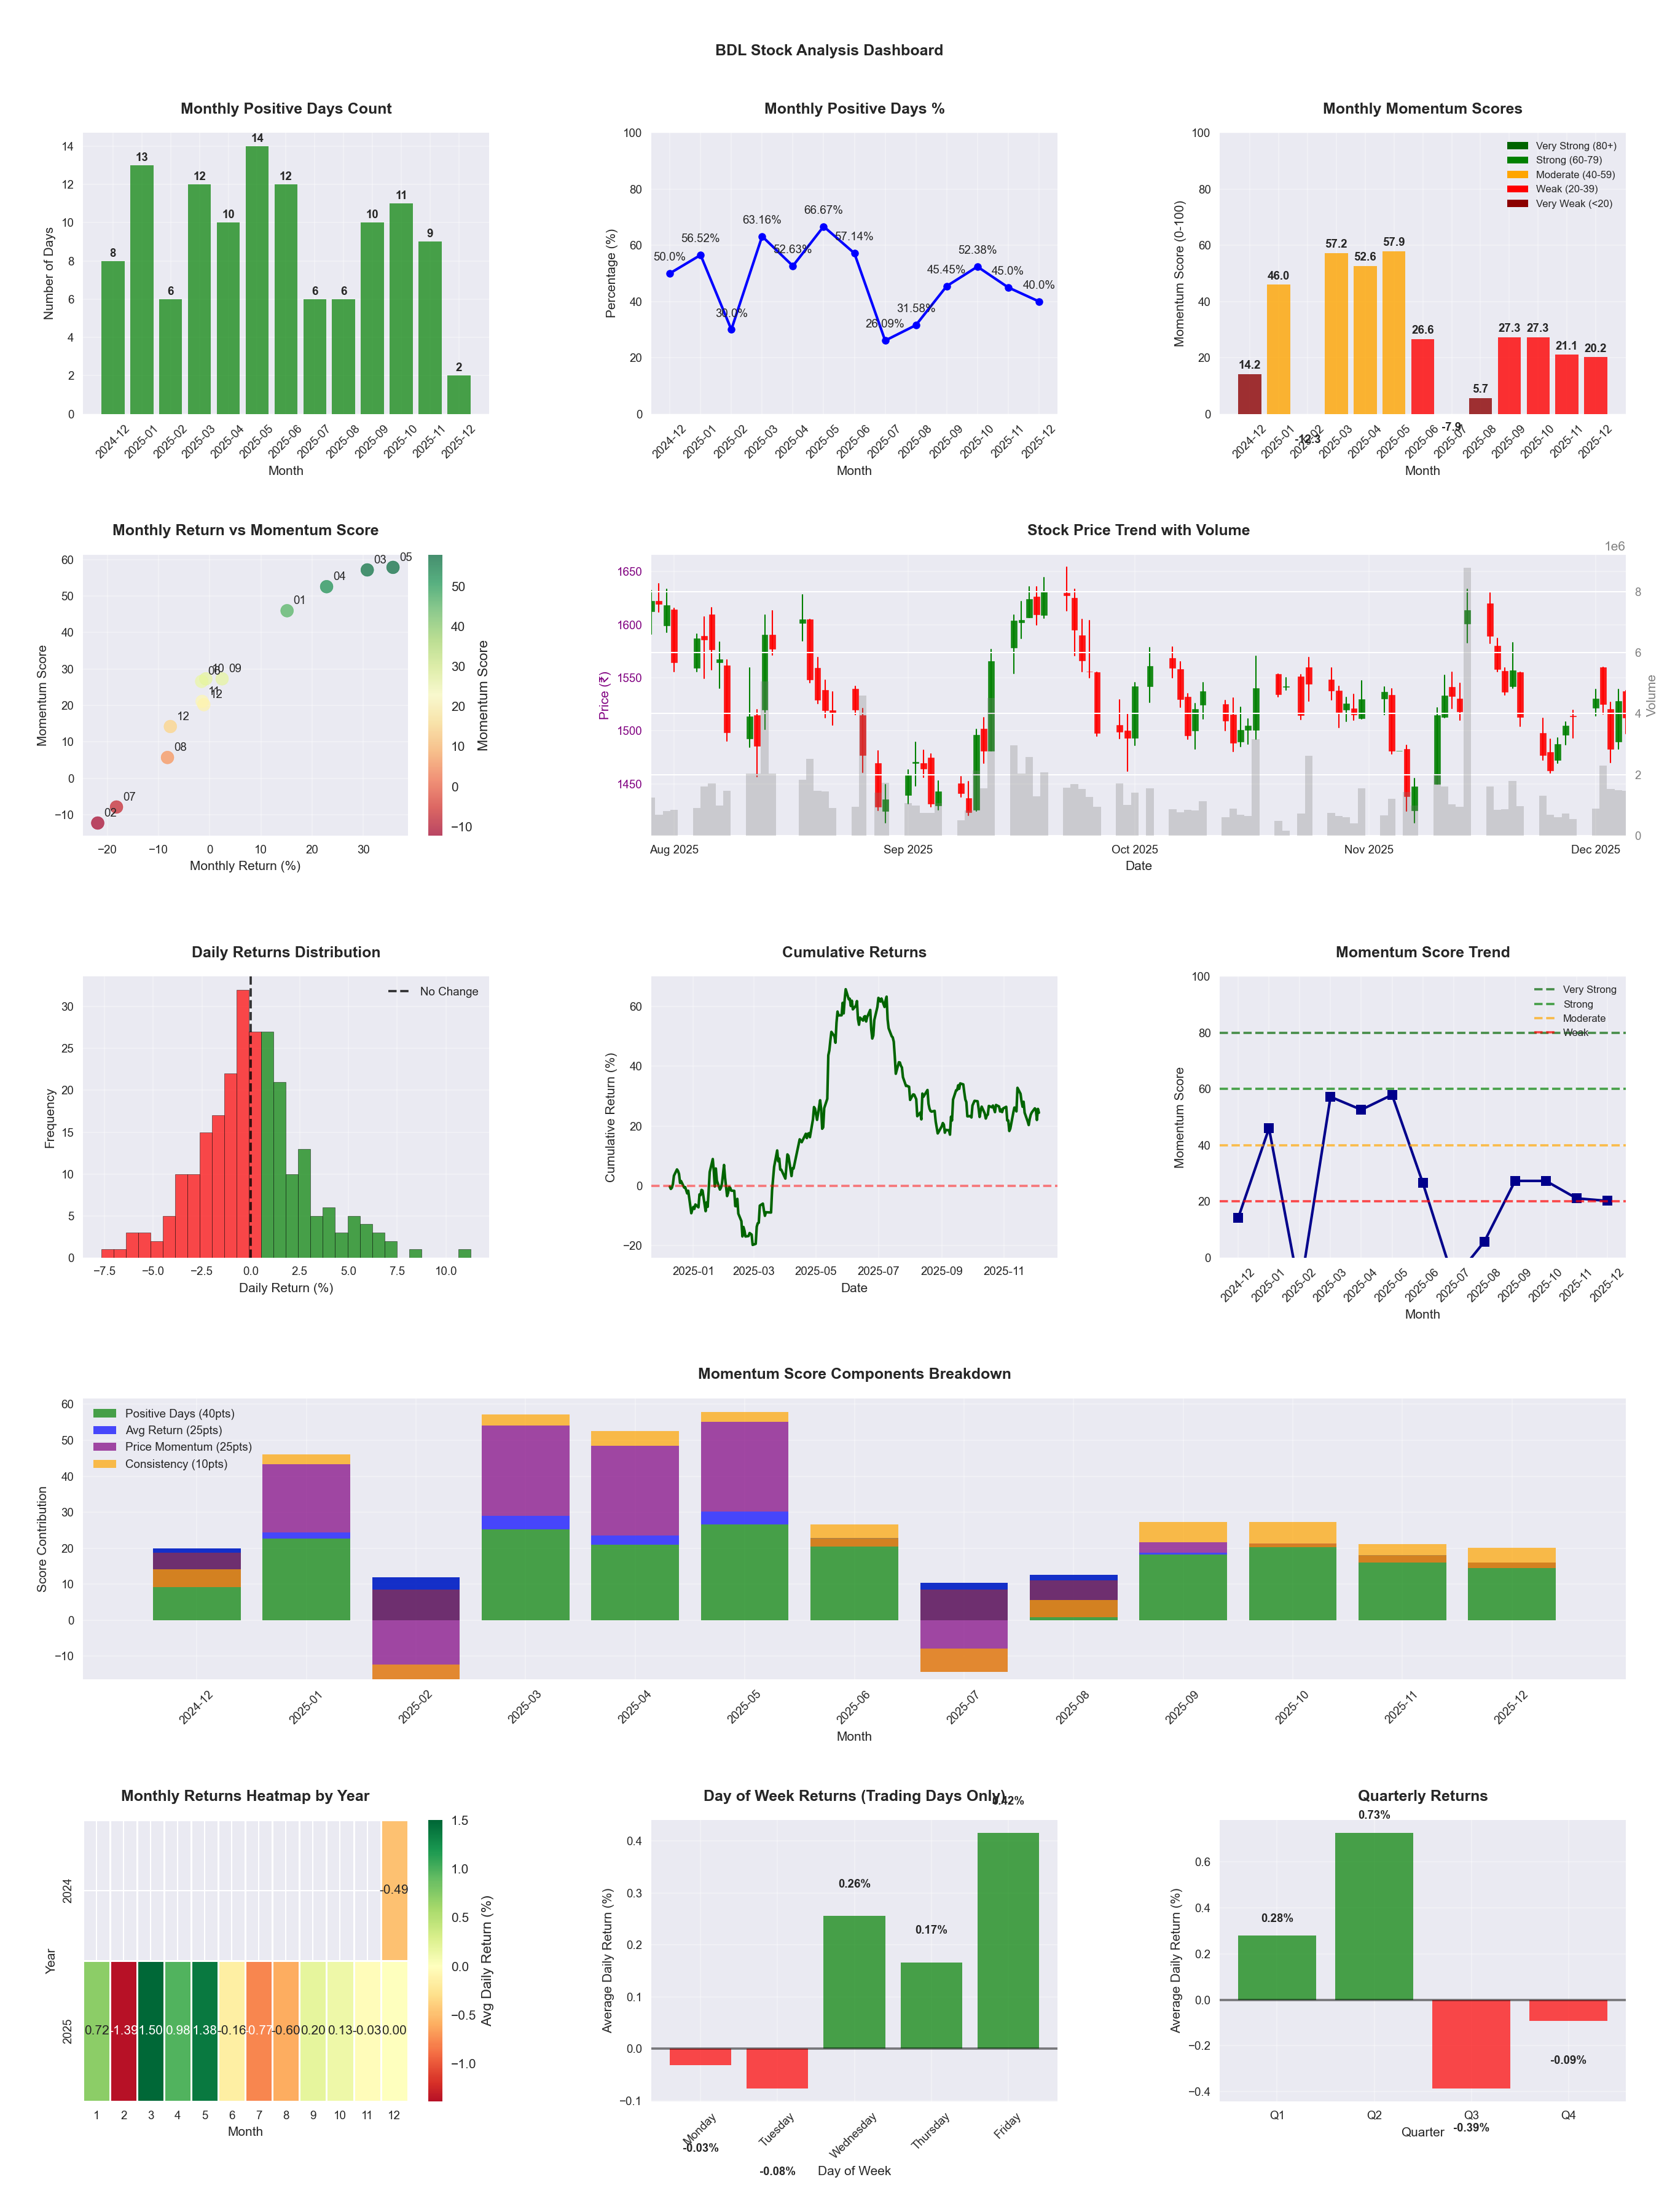
Symbol
📈 BDL
Date
📅 2026-04-11
Volatility
🟡 2.66%
Risk Profile
⚠️ suitable for aggressive investors
Win Rate
⚠️ 47.1%
Avg Daily Return
📈 +0.04%
Max Drawdown
📉 -45.38%
IBD RS Score
📊 32.0
Weak
Market Rank
#335
Best Month
🏆 2026-04
Best Months to Trade
📅 Apr, May, Jan
Best Days to Trade
📅 Wednesday, Friday
📊 Key Insights & Metrics
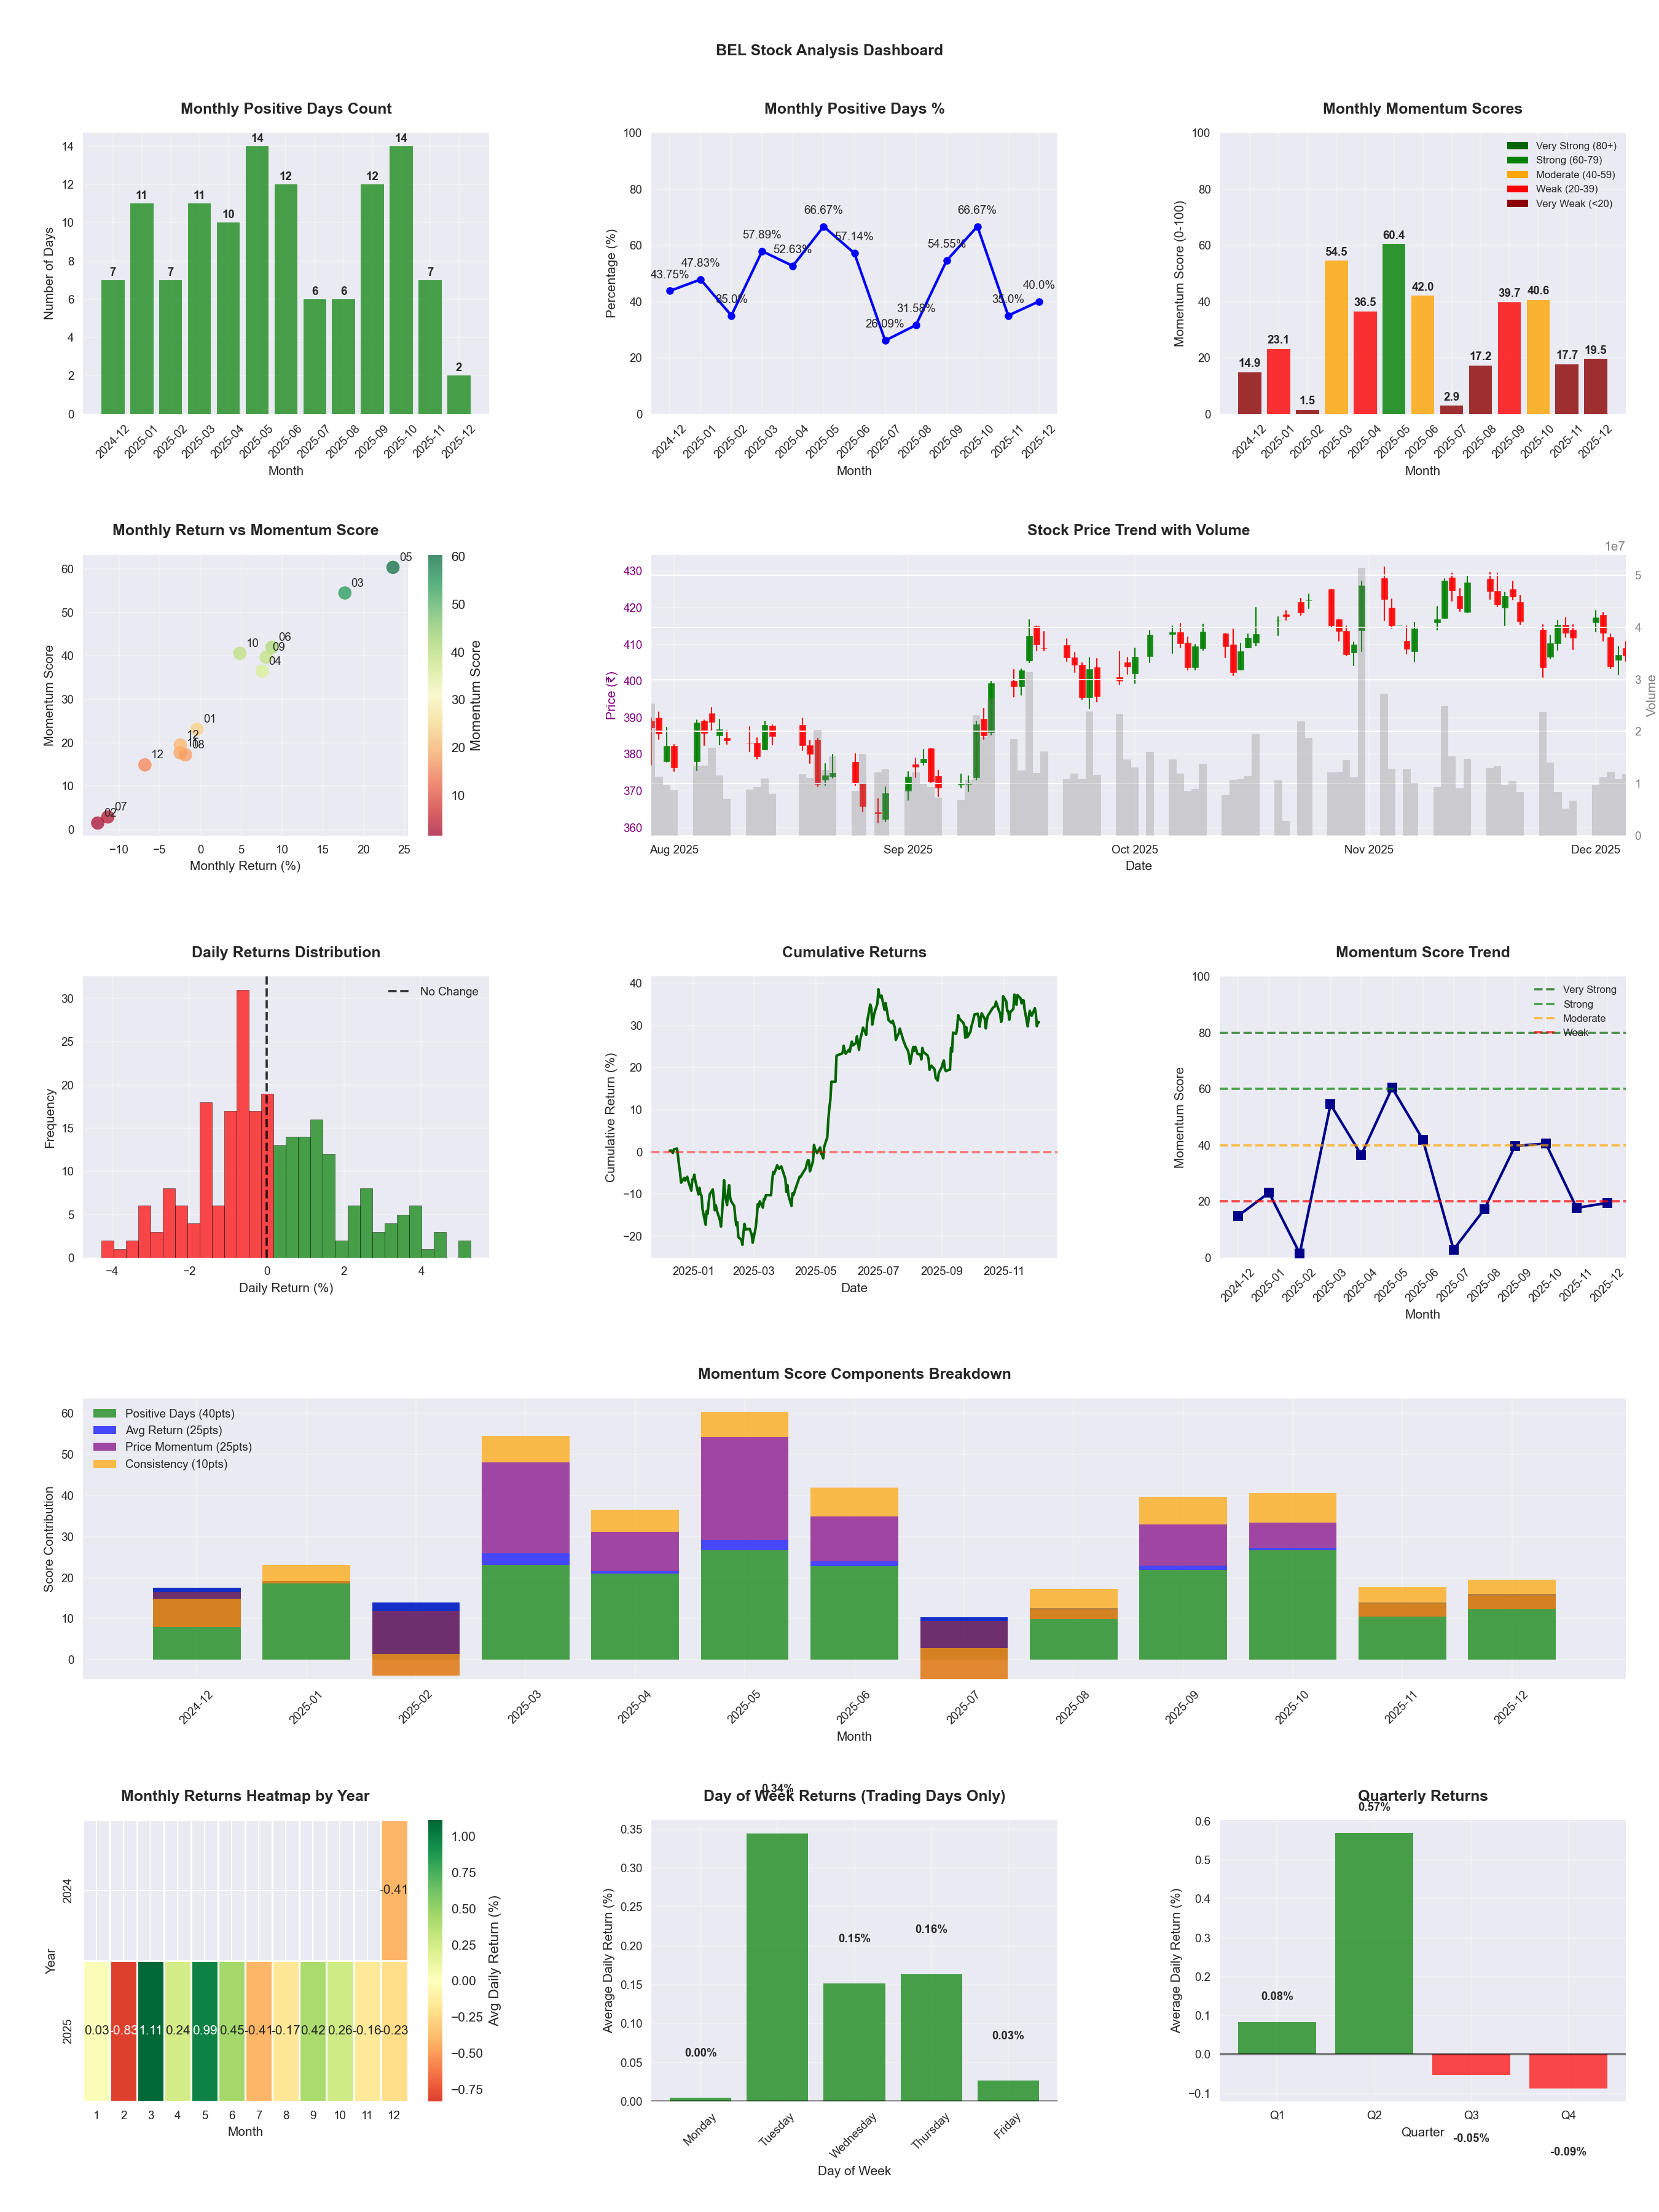
Symbol
📈 BEL
Date
📅 2026-04-11
Volatility
🟡 1.69%
Win Rate
⚠️ 50.4%
Avg Daily Return
📈 +0.20%
Max Drawdown
📉 -15.63%
IBD RS Score
📊 85.0
Strong
Market Rank
#74
Best Month
🏆 2025-05
Worst Month
📉 2025-07
Best Months to Trade
📅 Apr, May, Jan
Best Days to Trade
📅 Wednesday, Tuesday
📊 Key Insights & Metrics
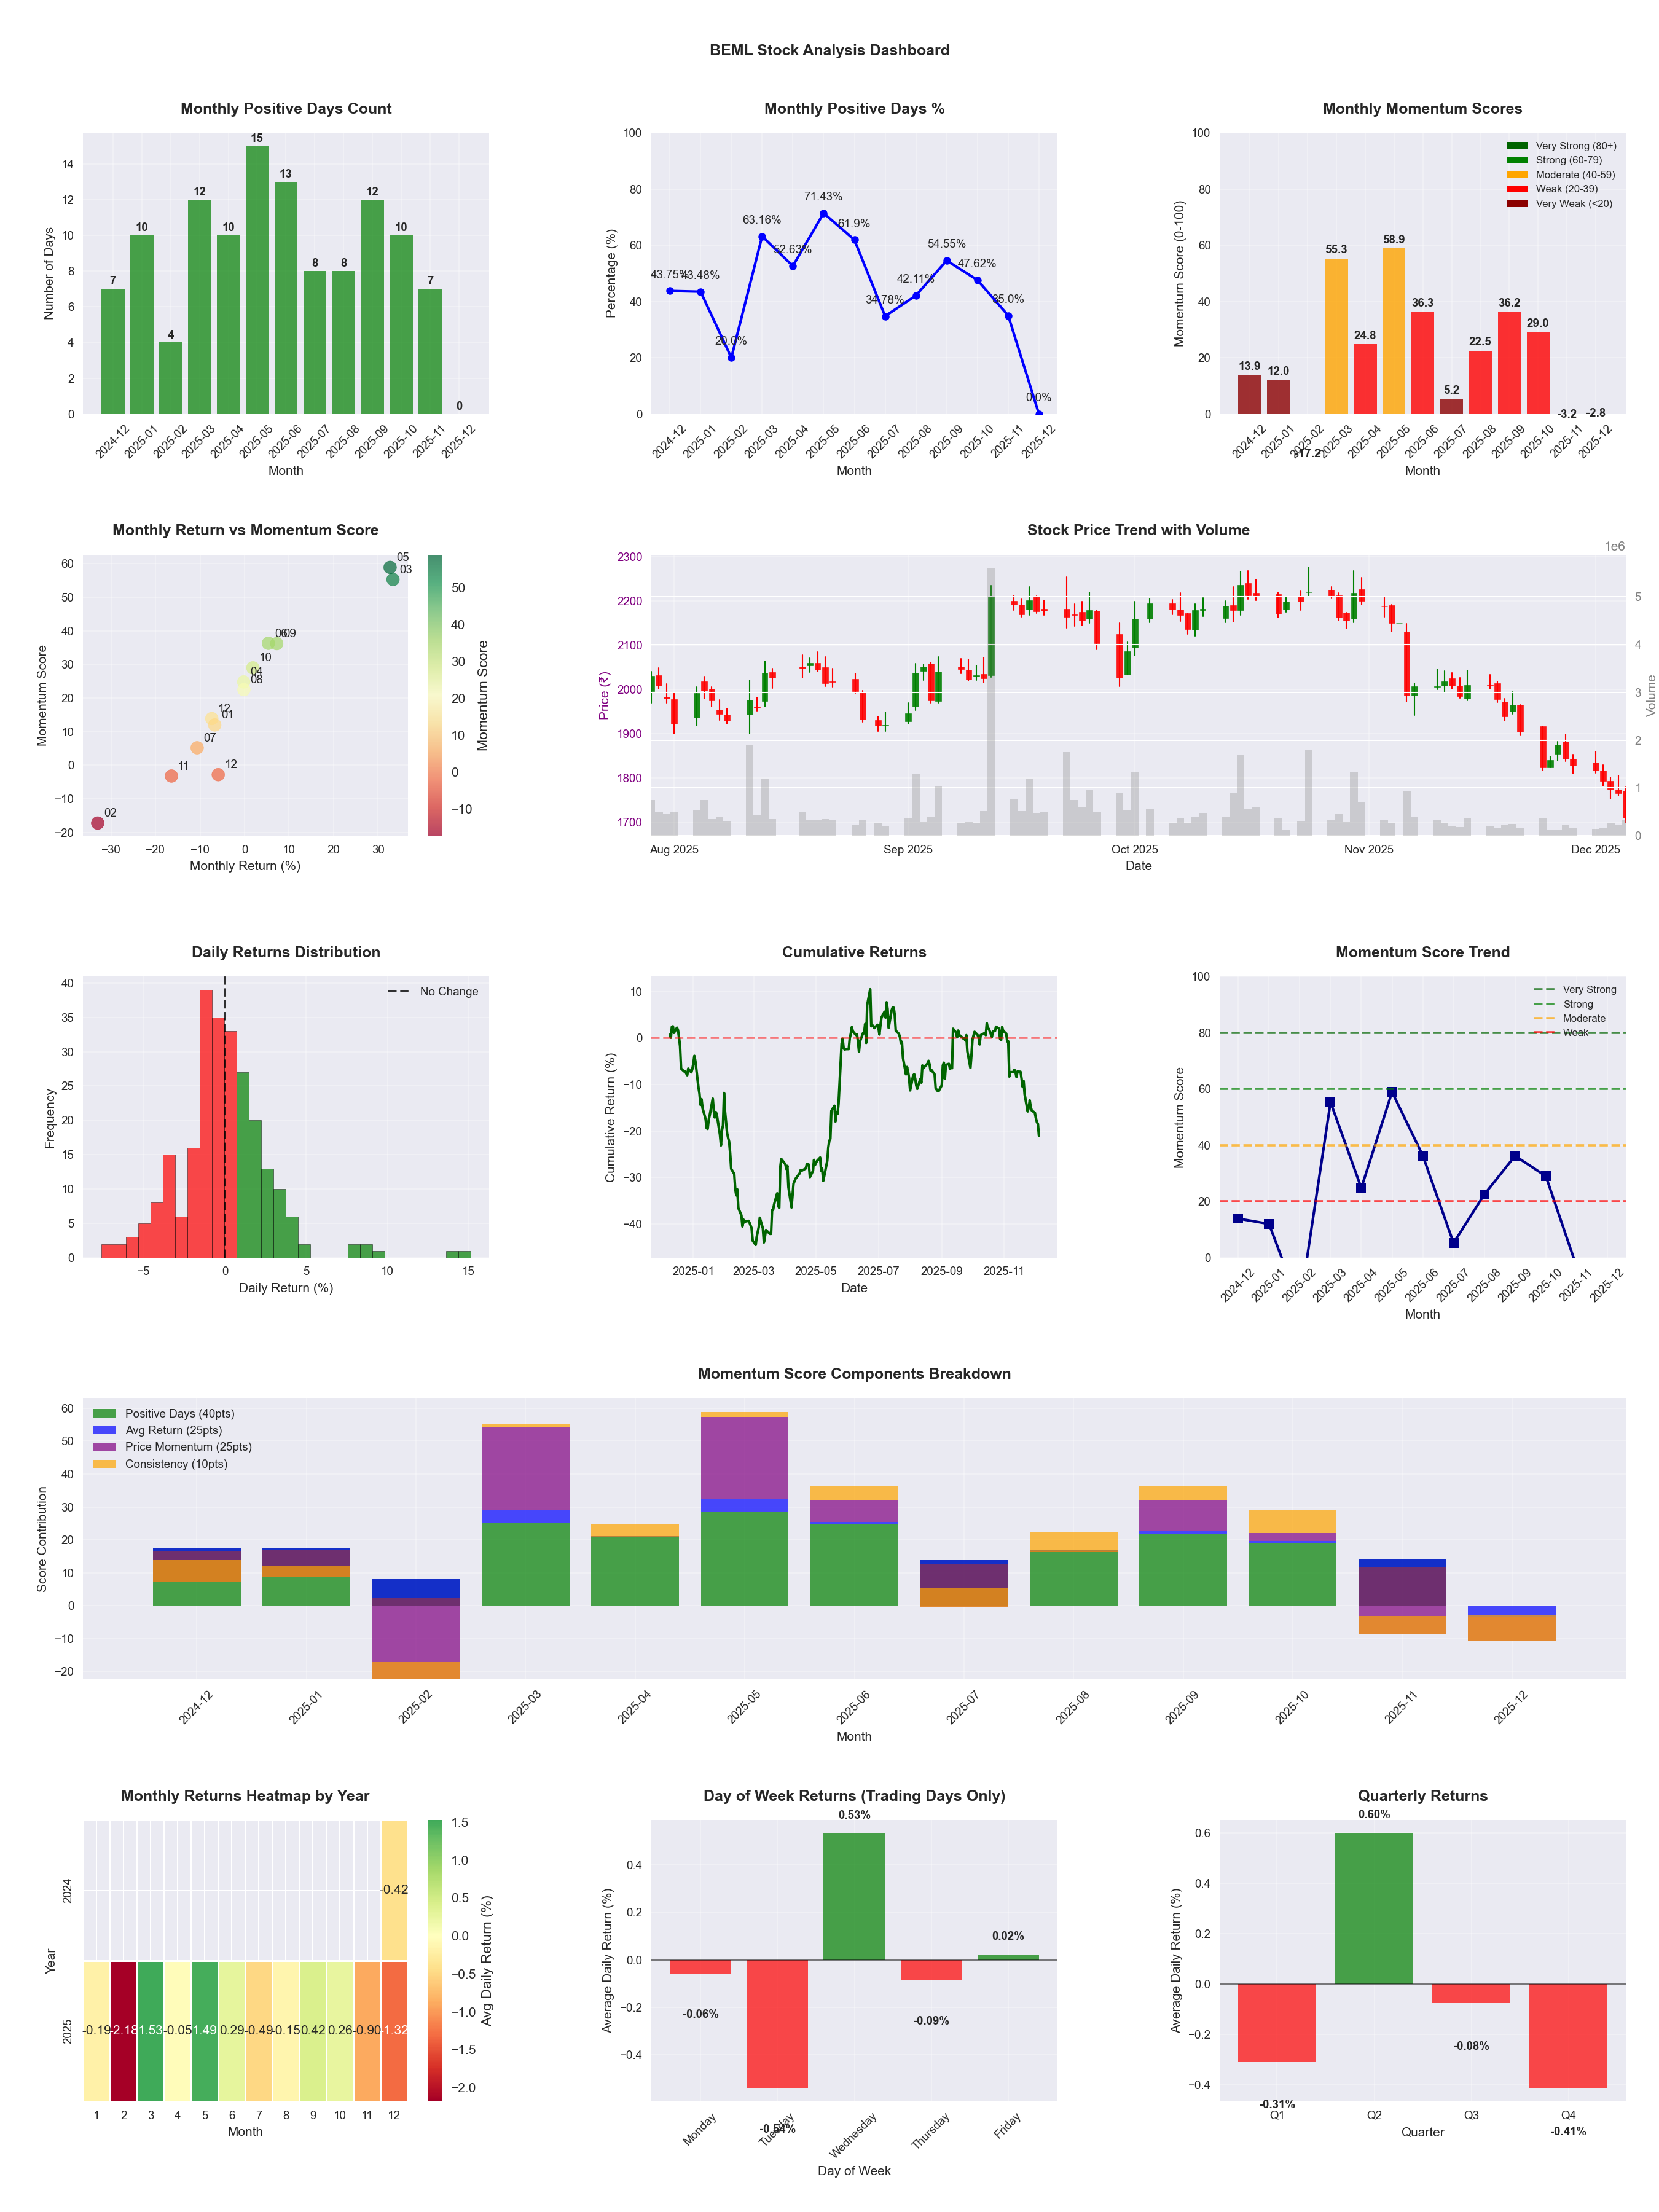
Symbol
📈 BEML
Date
📅 2026-04-11
Volatility
🟡 2.73%
Risk Profile
⚠️ suitable for aggressive investors
Win Rate
⚠️ 49.2%
Avg Daily Return
📈 +0.07%
Max Drawdown
📉 -42.71%
IBD RS Score
📊 28.4
Weak
Market Rank
#353
Best Month
🏆 2026-04
Best Months to Trade
📅 May, Apr, Sep
Best Days to Trade
📅 Wednesday, Monday
📊 Key Insights & Metrics
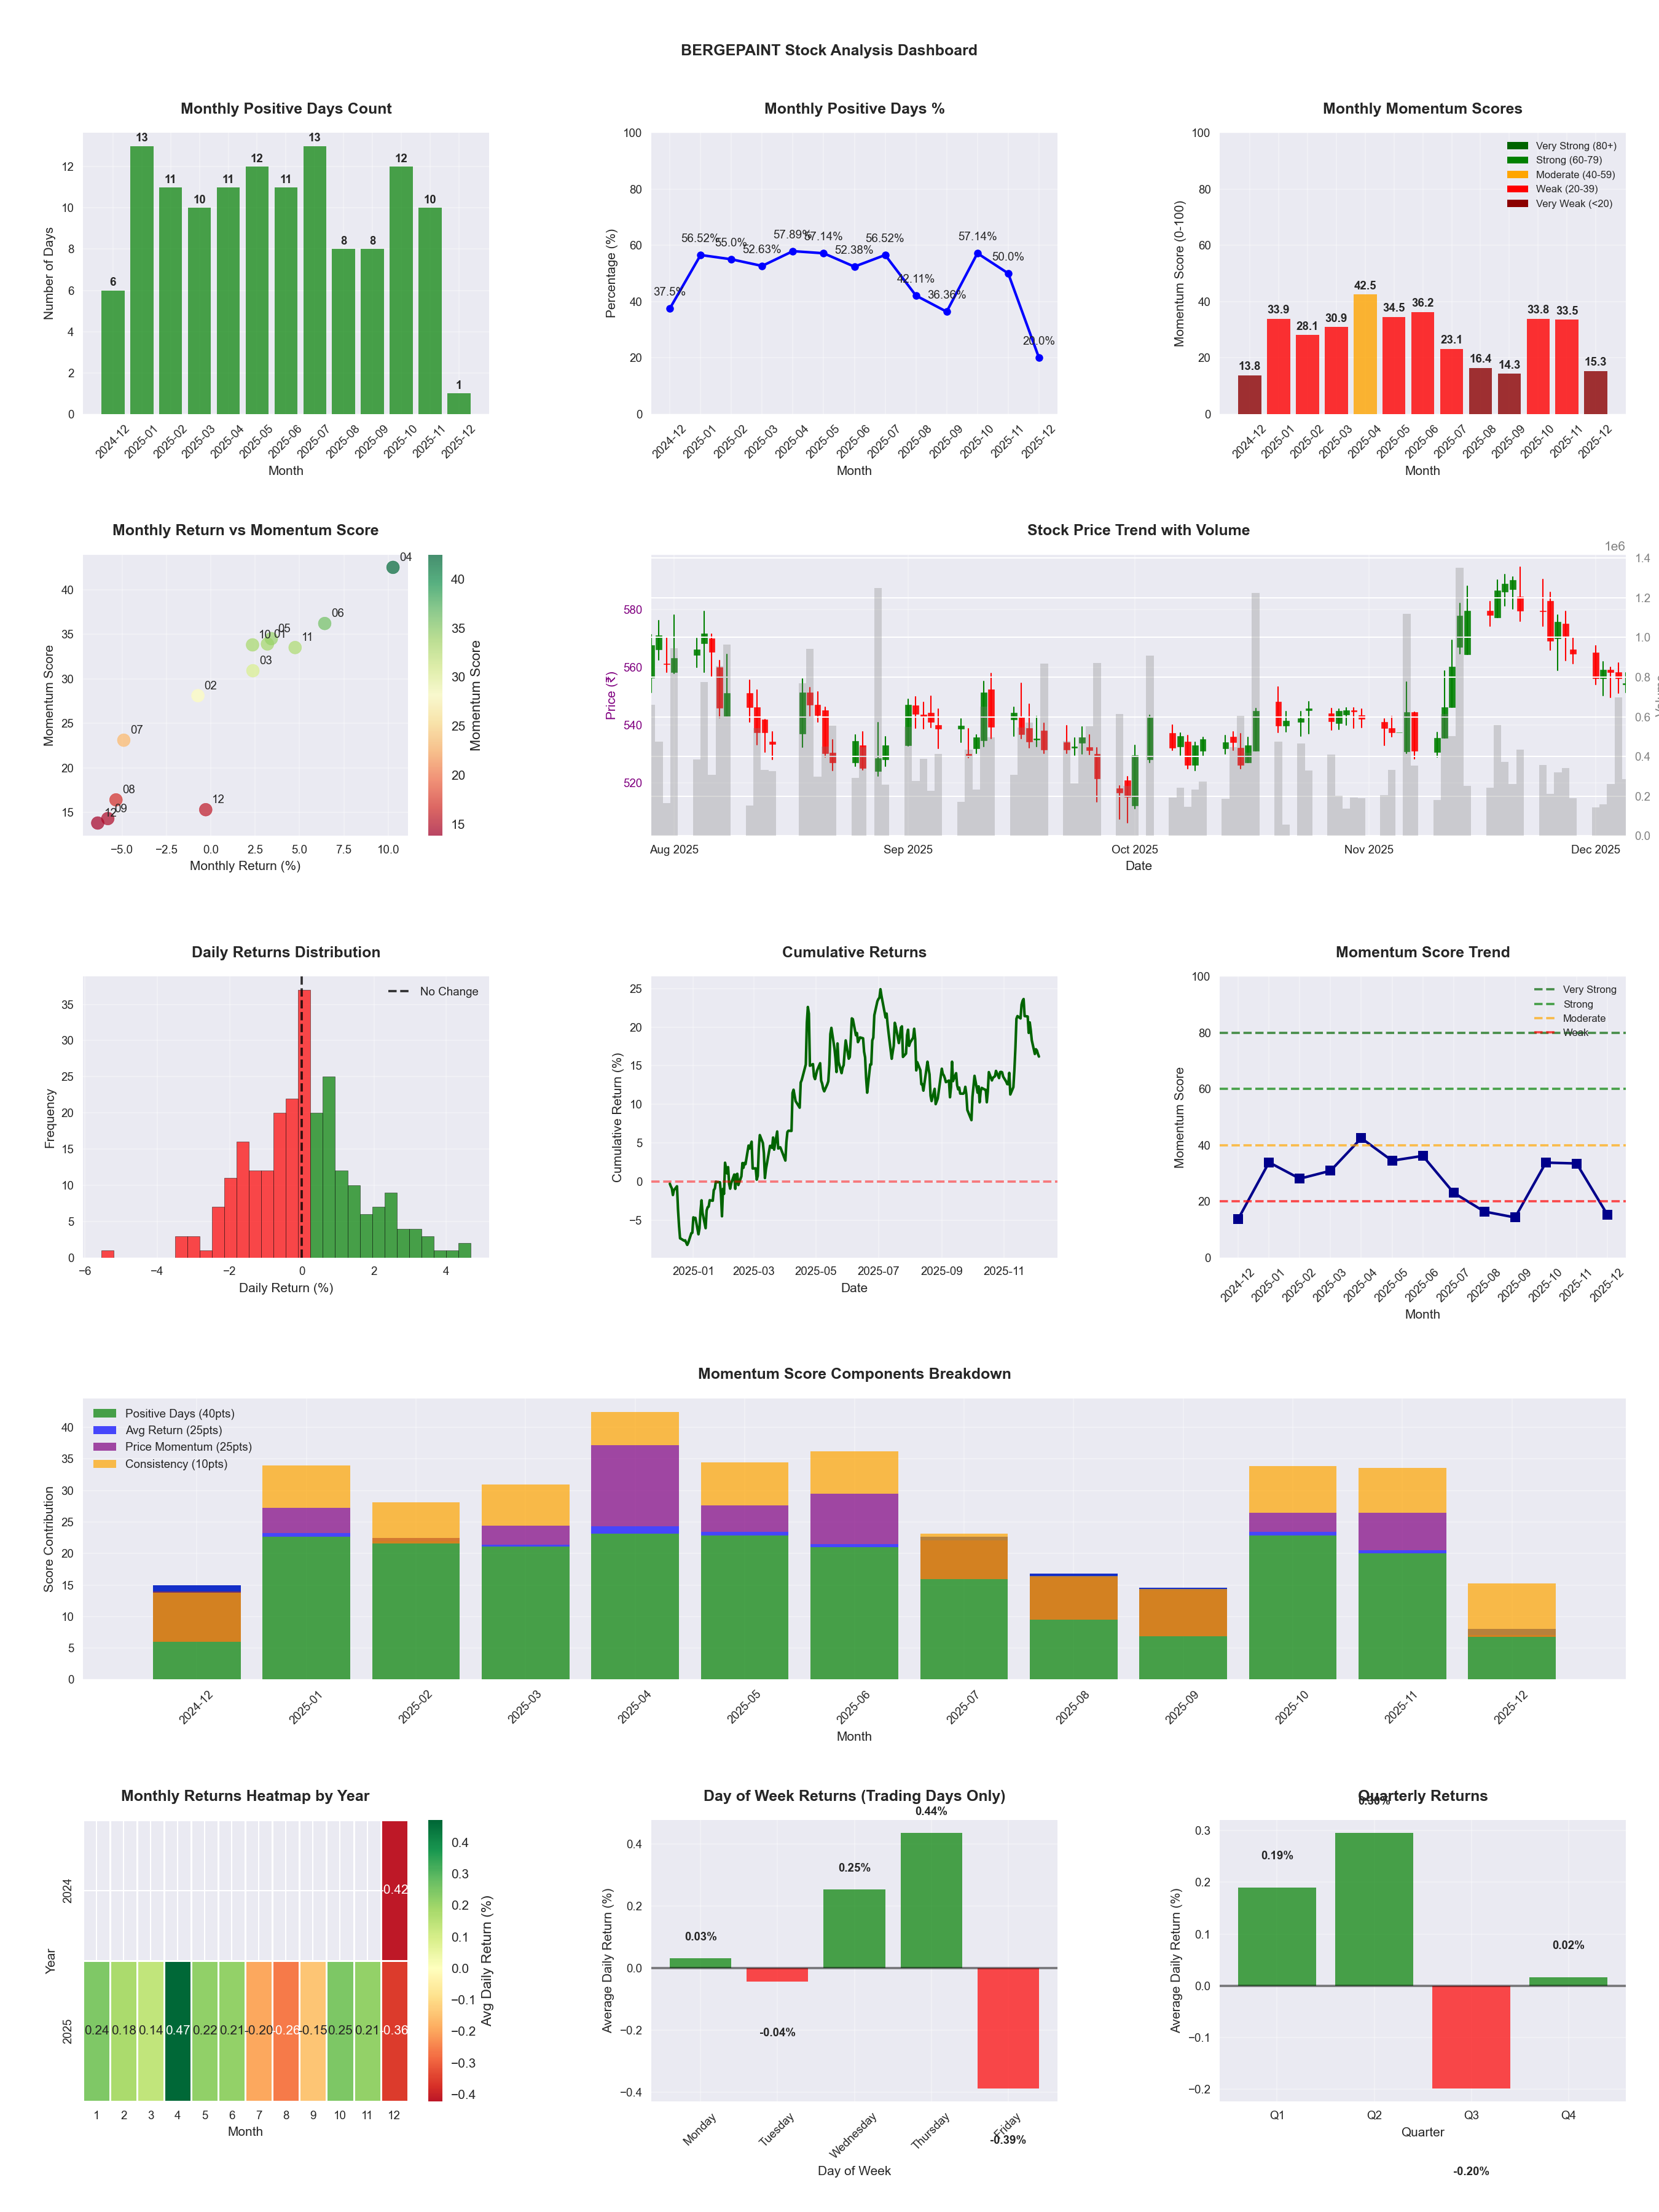
Symbol
📈 BERGEPAINT
Date
📅 2026-04-11
Volatility
🟡 1.55%
Win Rate
⚠️ 46.8%
Avg Daily Return
📉 -0.05%
Max Drawdown
📉 -32.15%
IBD RS Score
📊 27.0
Weak
Market Rank
#360
Best Month
🏆 2026-04
Best Months to Trade
📅 Apr, Oct, Nov
Best Days to Trade
📅 Wednesday, Tuesday
📊 Key Insights & Metrics
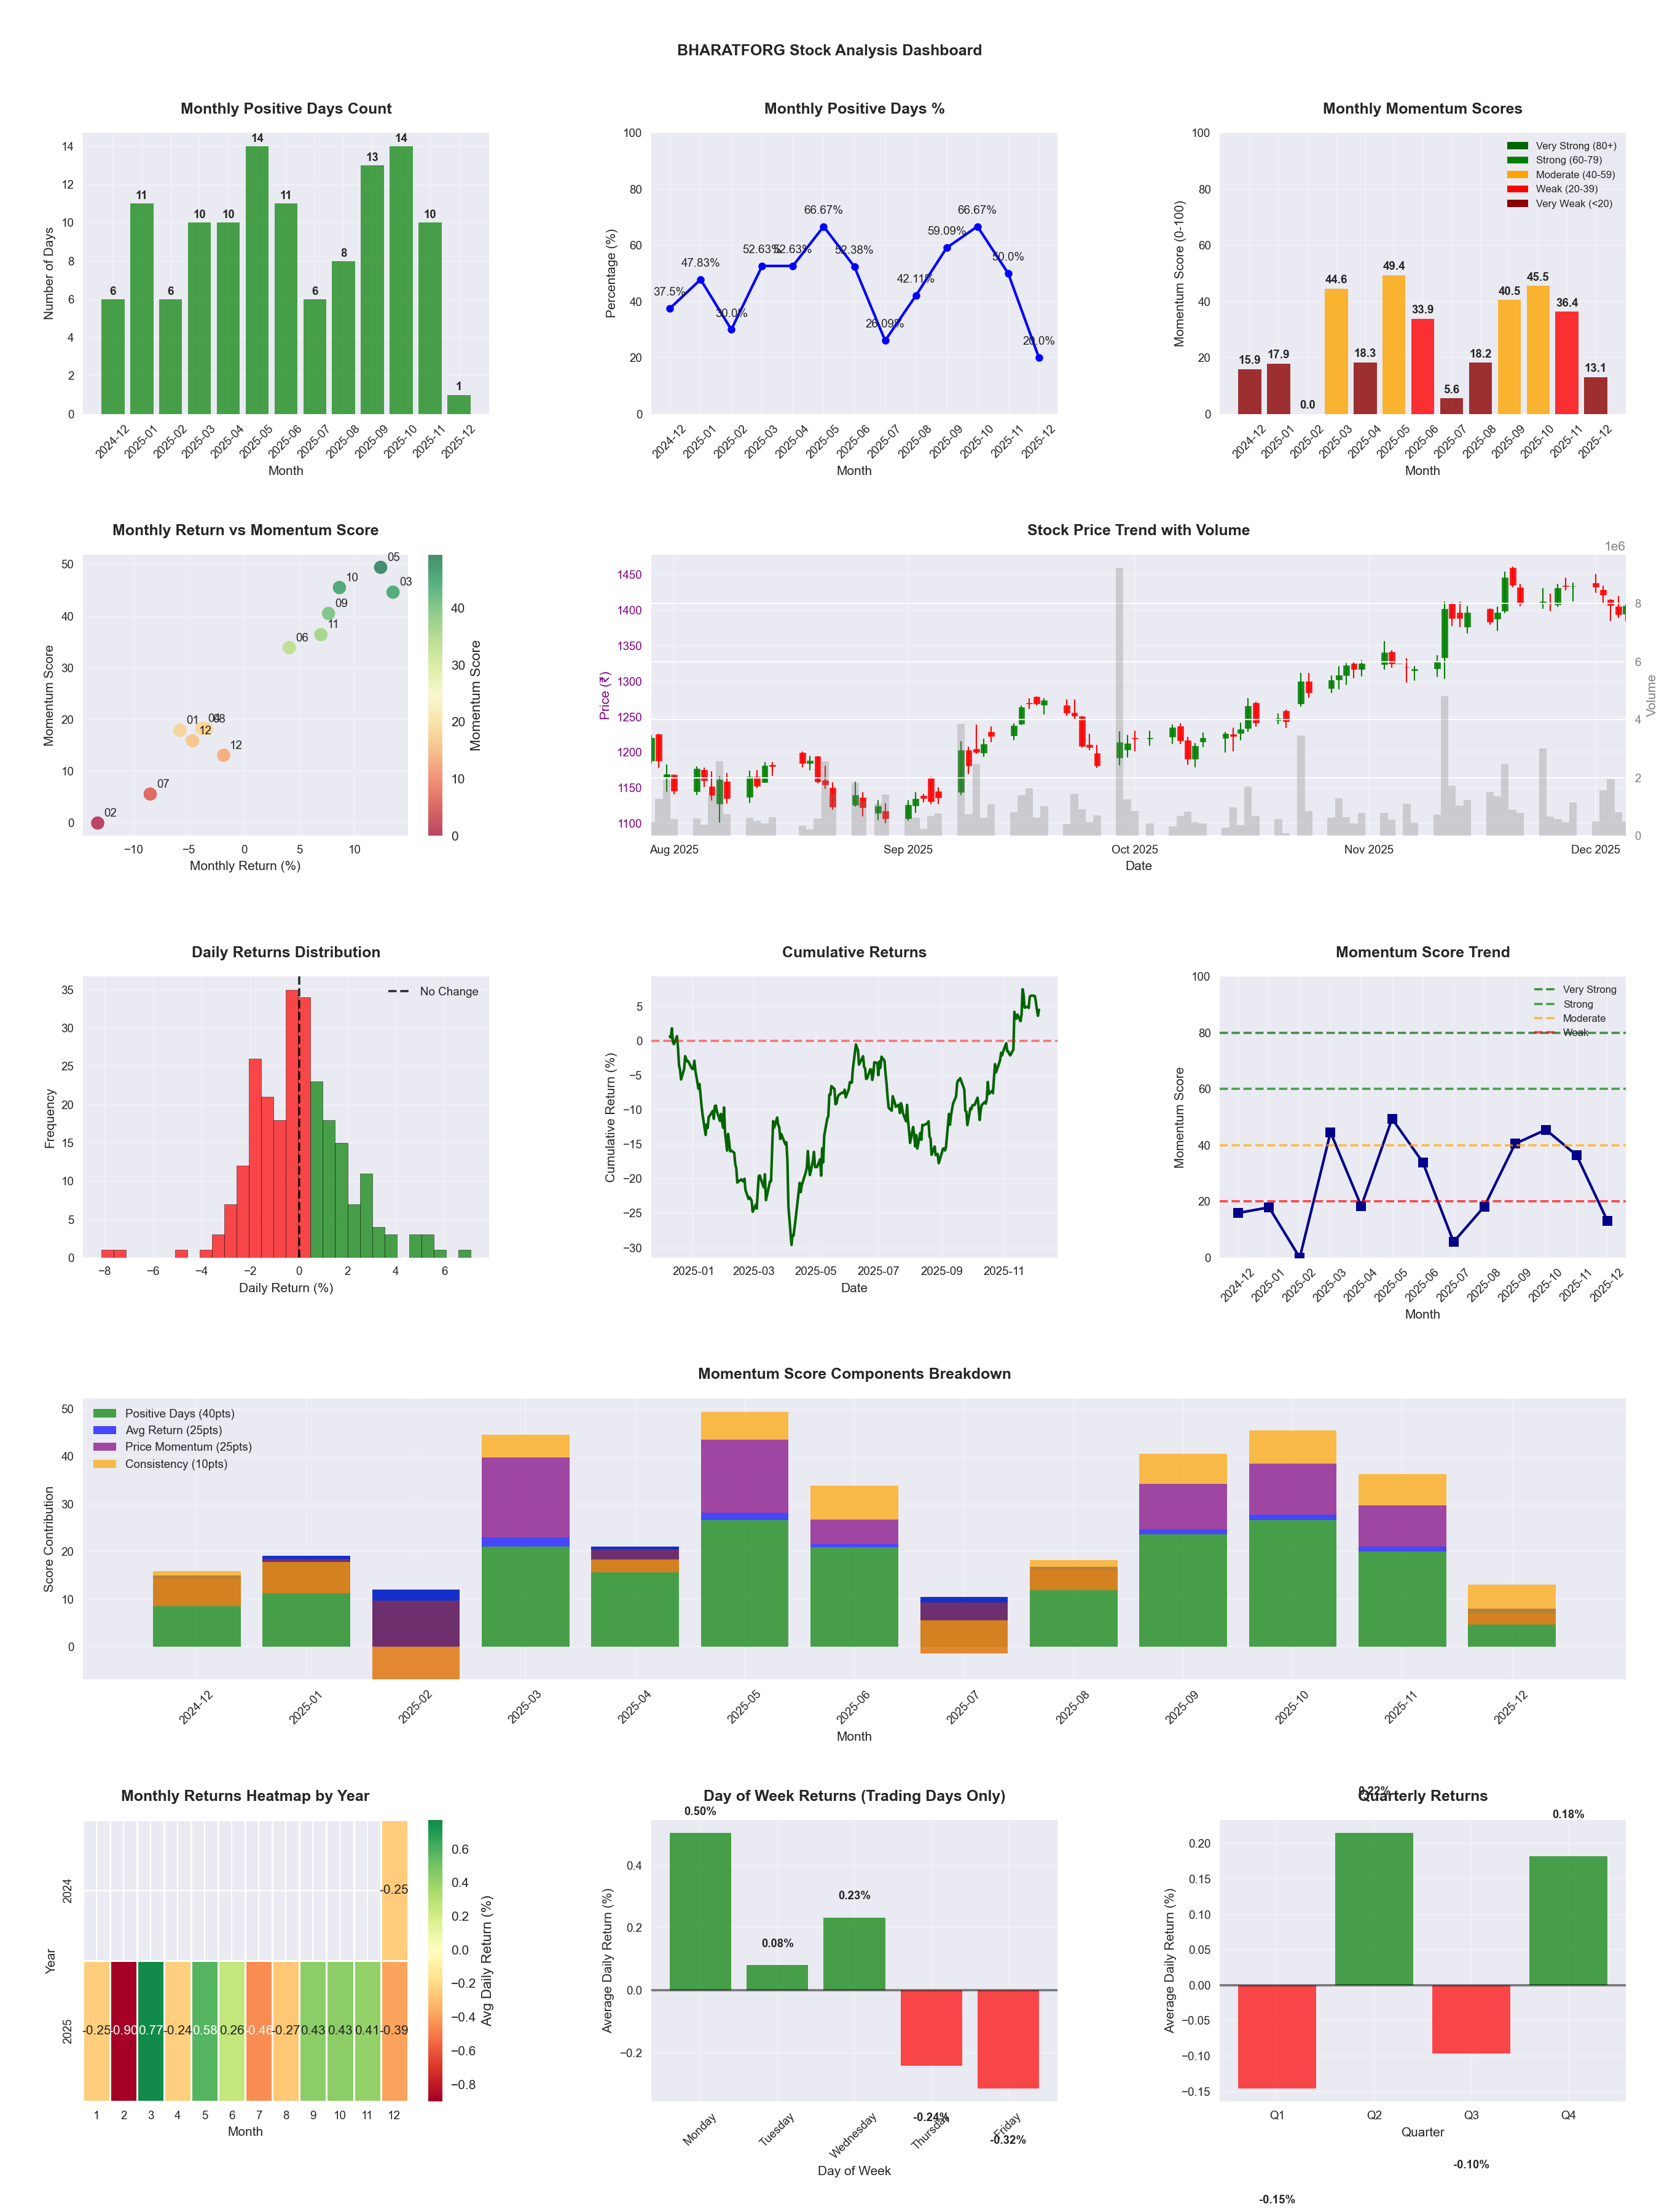
Symbol
📈 BHARATFORG
Date
📅 2026-04-11
Volatility
🟡 1.94%
Win Rate
⚠️ 53.5%
Avg Daily Return
📈 +0.26%
Max Drawdown
📉 -17.31%
IBD RS Score
📊 97.8
Leader
Market Rank
#11
Best Month
🏆 2026-02
Worst Month
📉 2026-03
Best Months to Trade
📅 Feb, Apr, May
Best Days to Trade
📅 Monday, Wednesday
📊 Key Insights & Metrics
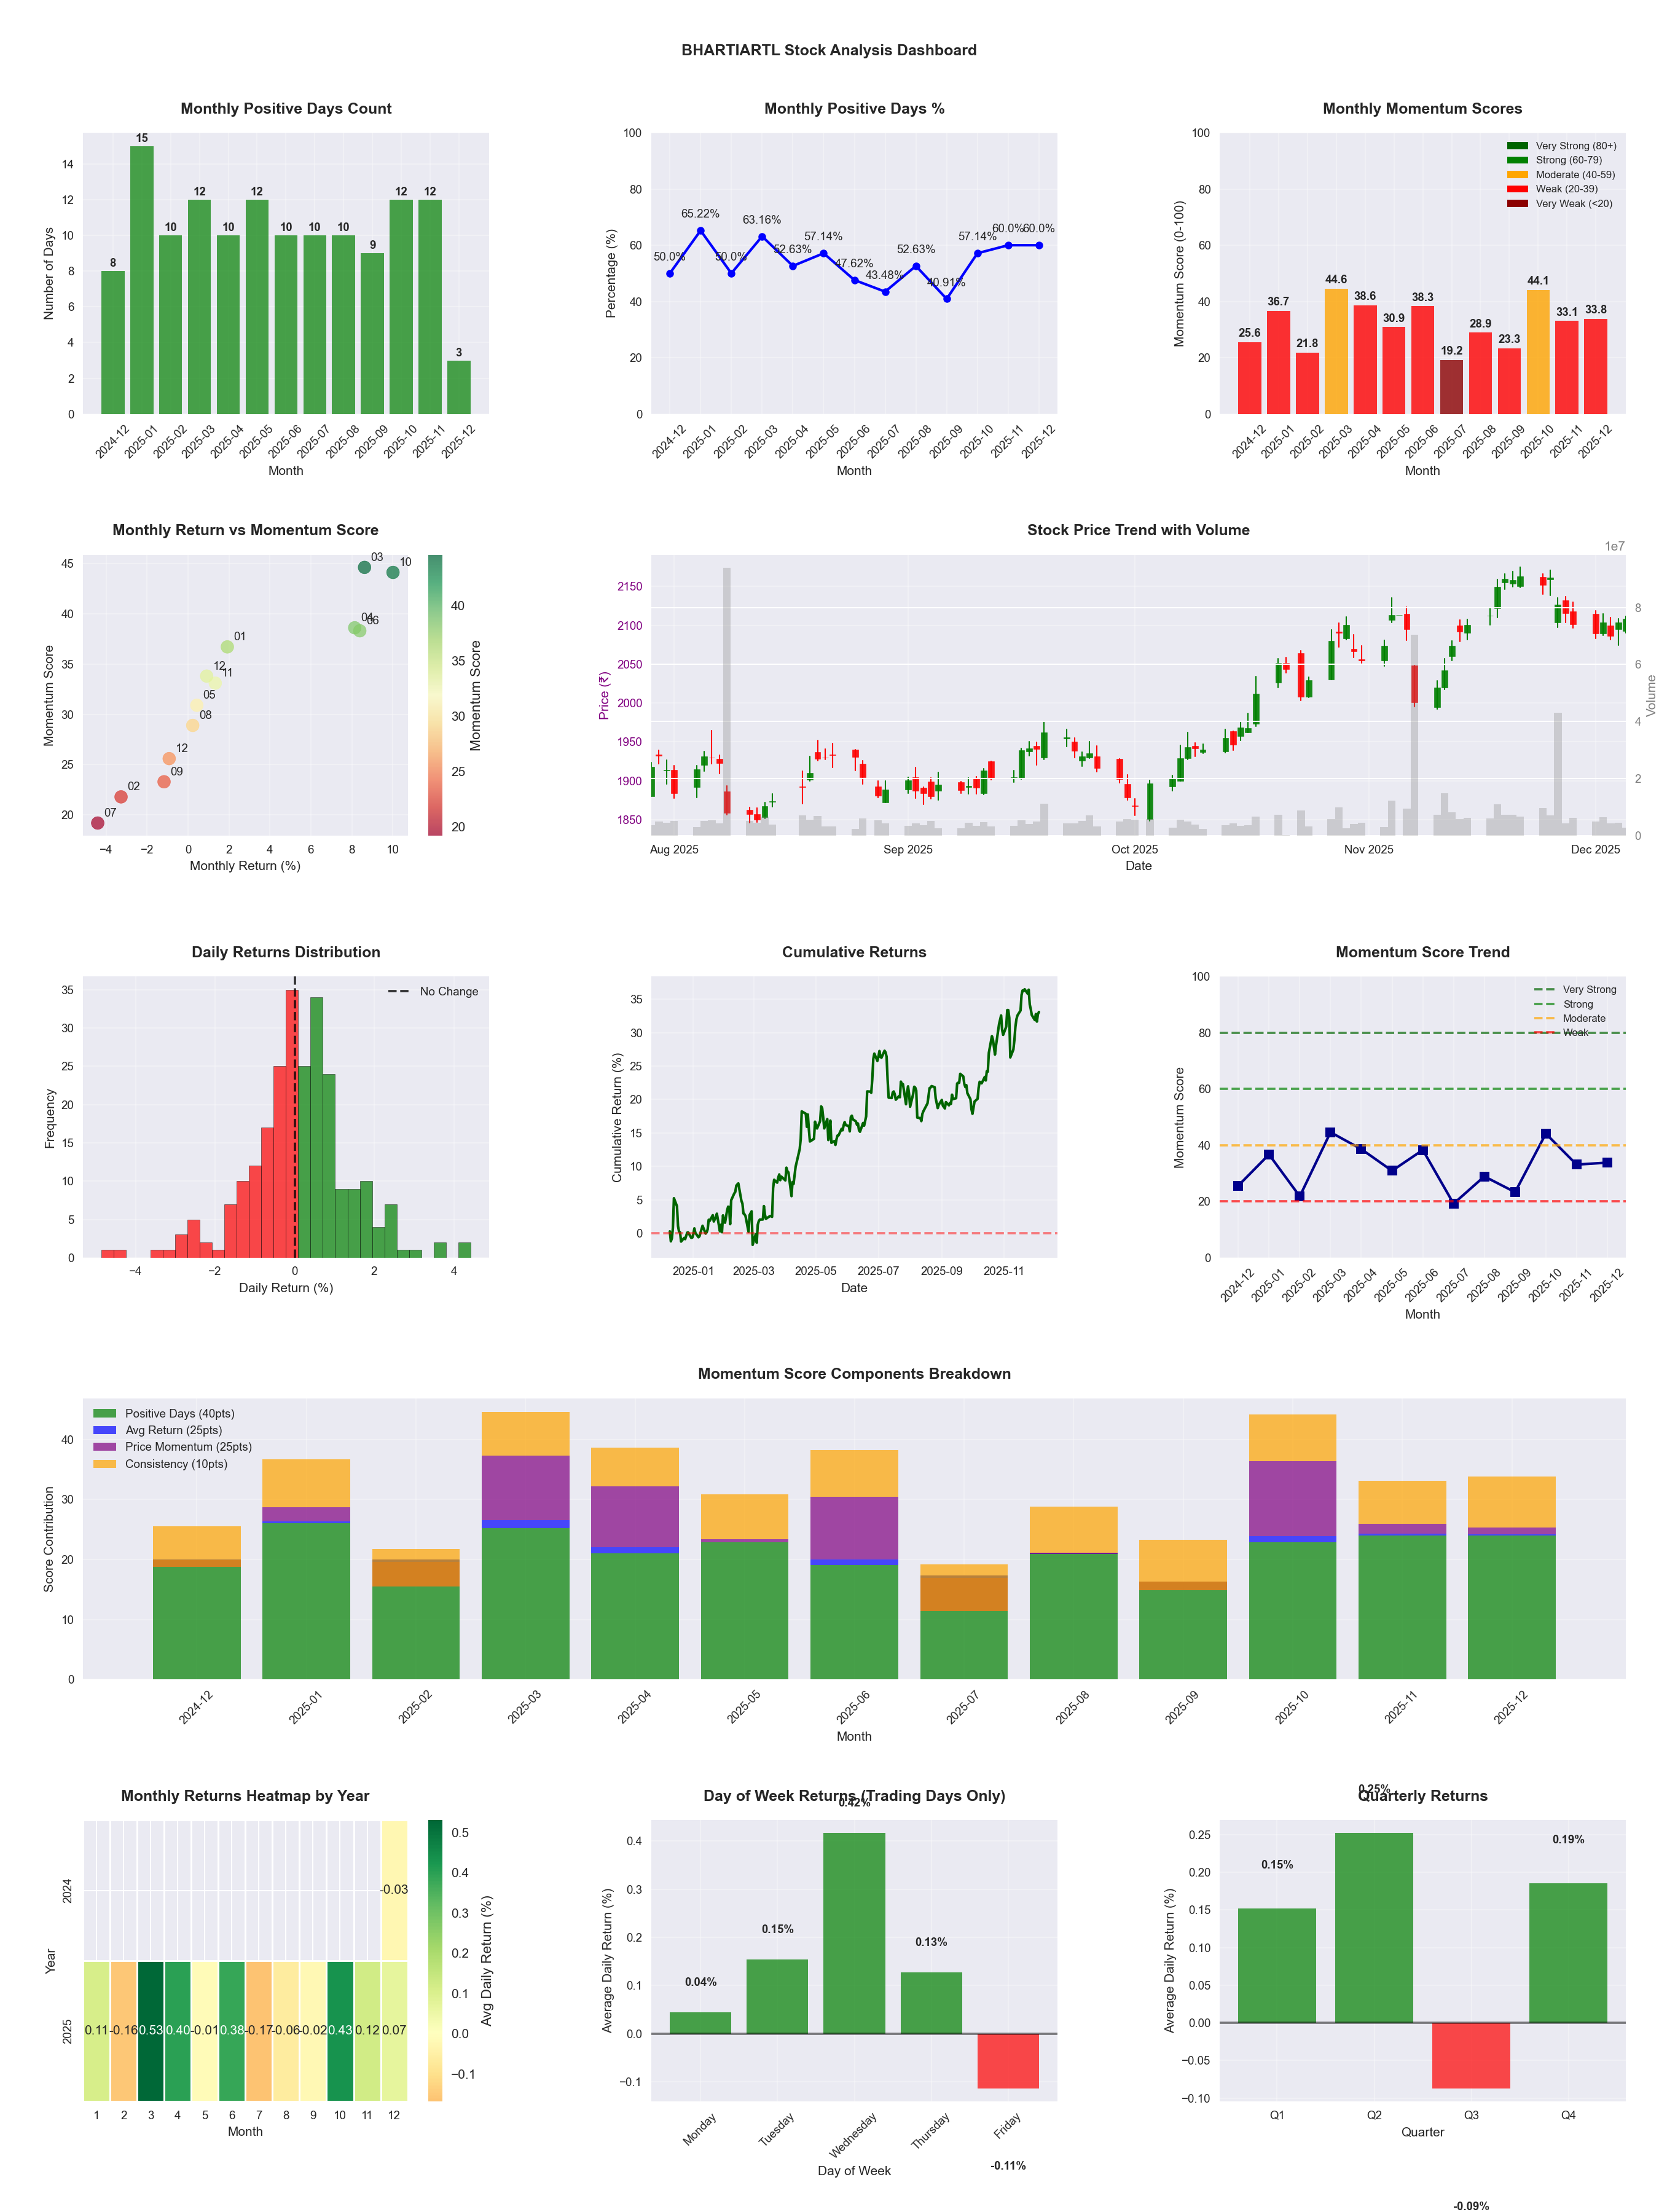
Symbol
📈 BHARTIARTL
Date
📅 2026-04-11
Volatility
🟢 1.20%
Win Rate
⚠️ 50.4%
Avg Daily Return
📈 +0.04%
Max Drawdown
📉 -17.61%
IBD RS Score
📊 52.7
Average
Market Rank
#233
Best Month
🏆 2026-04
Worst Month
📉 2026-01
Best Months to Trade
📅 Apr, Oct, Jun
Best Days to Trade
📅 Wednesday, Tuesday
📊 Key Insights & Metrics
Symbol
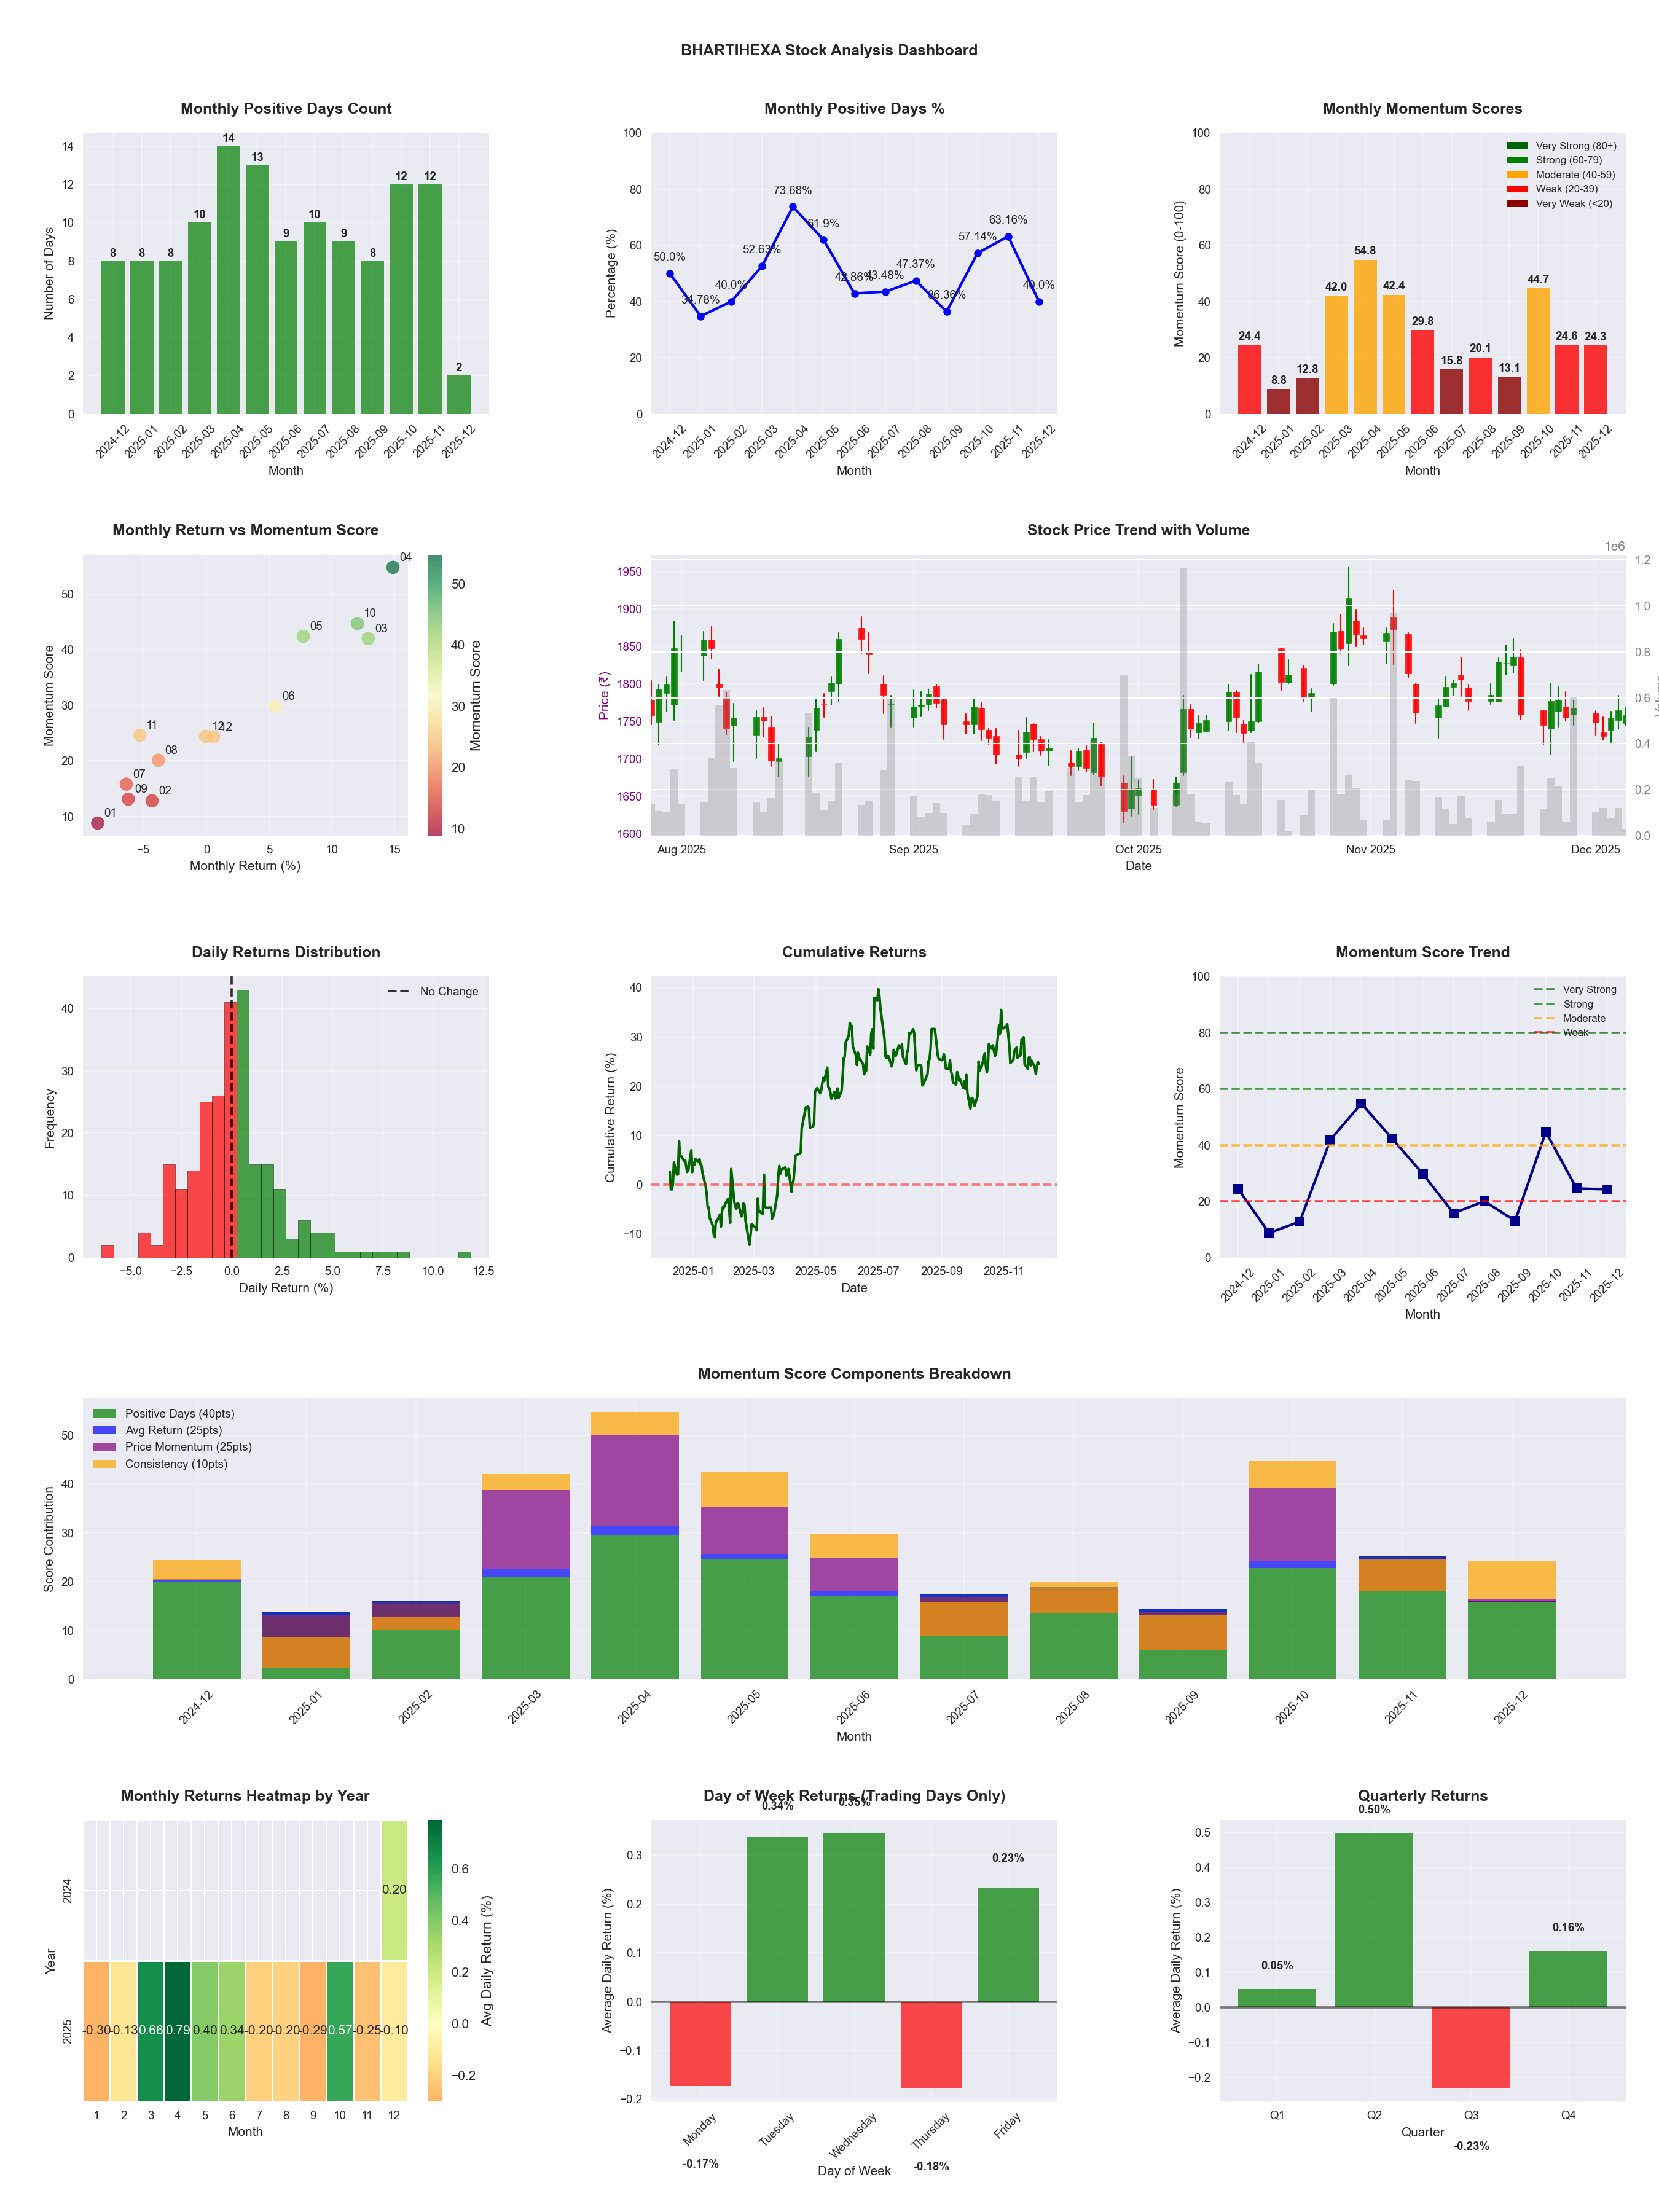
📈 BHARTIHEXA
Date
📅 2026-04-11
Volatility
🟡 1.88%
Win Rate
⚠️ 50.0%
Avg Daily Return
📈 +0.02%
Max Drawdown
📉 -25.74%
IBD RS Score
📊 34.1
Weak
Market Rank
#325
Best Month
🏆 2025-04
Best Months to Trade
📅 Apr, Oct, May
Best Days to Trade
📅 Tuesday, Wednesday
📊 Key Insights & Metrics
Symbol
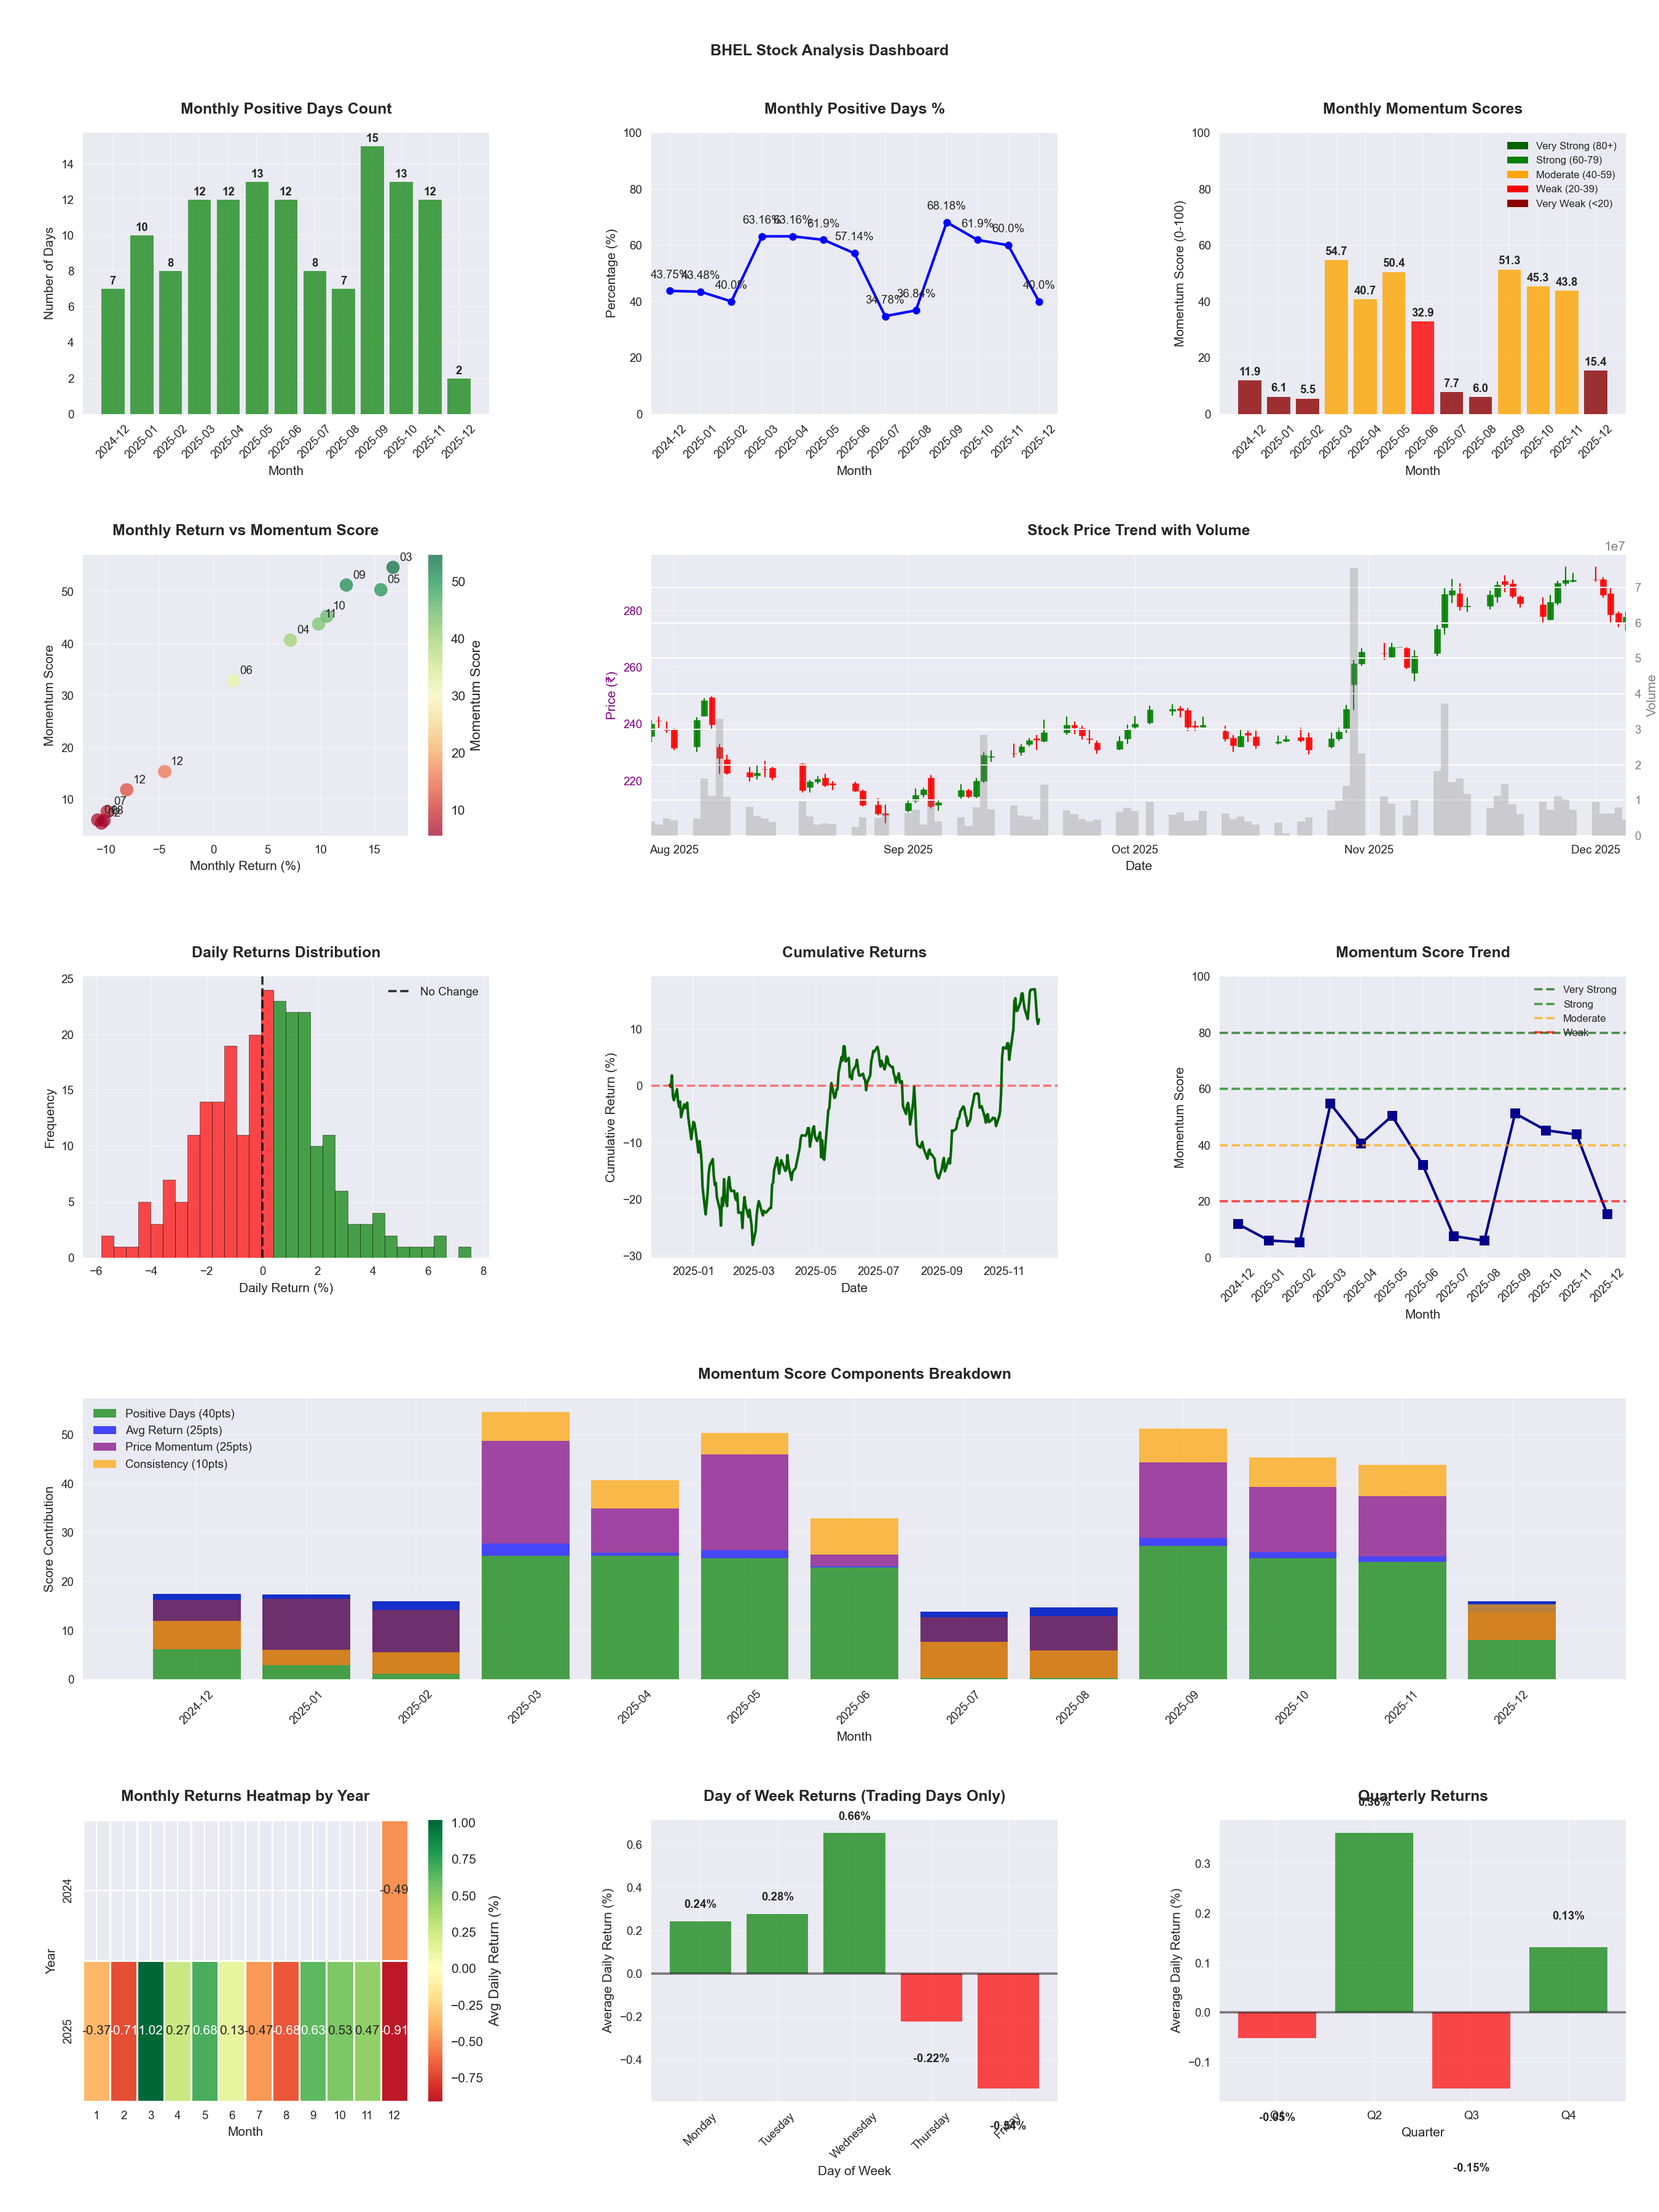
📈 BHEL
Date
📅 2026-04-11
Volatility
🟡 2.17%
Risk Profile
⚠️ suitable for aggressive investors
Win Rate
⚠️ 54.9%
Avg Daily Return
📈 +0.14%
Max Drawdown
📉 -21.82%
IBD RS Score
📊 80.7
Strong
Market Rank
#95
Best Month
🏆 2026-04
Worst Month
📉 2025-08
Best Months to Trade
📅 Apr, May, Sep
Best Days to Trade
📅 Tuesday, Wednesday
📊 Key Insights & Metrics
Symbol
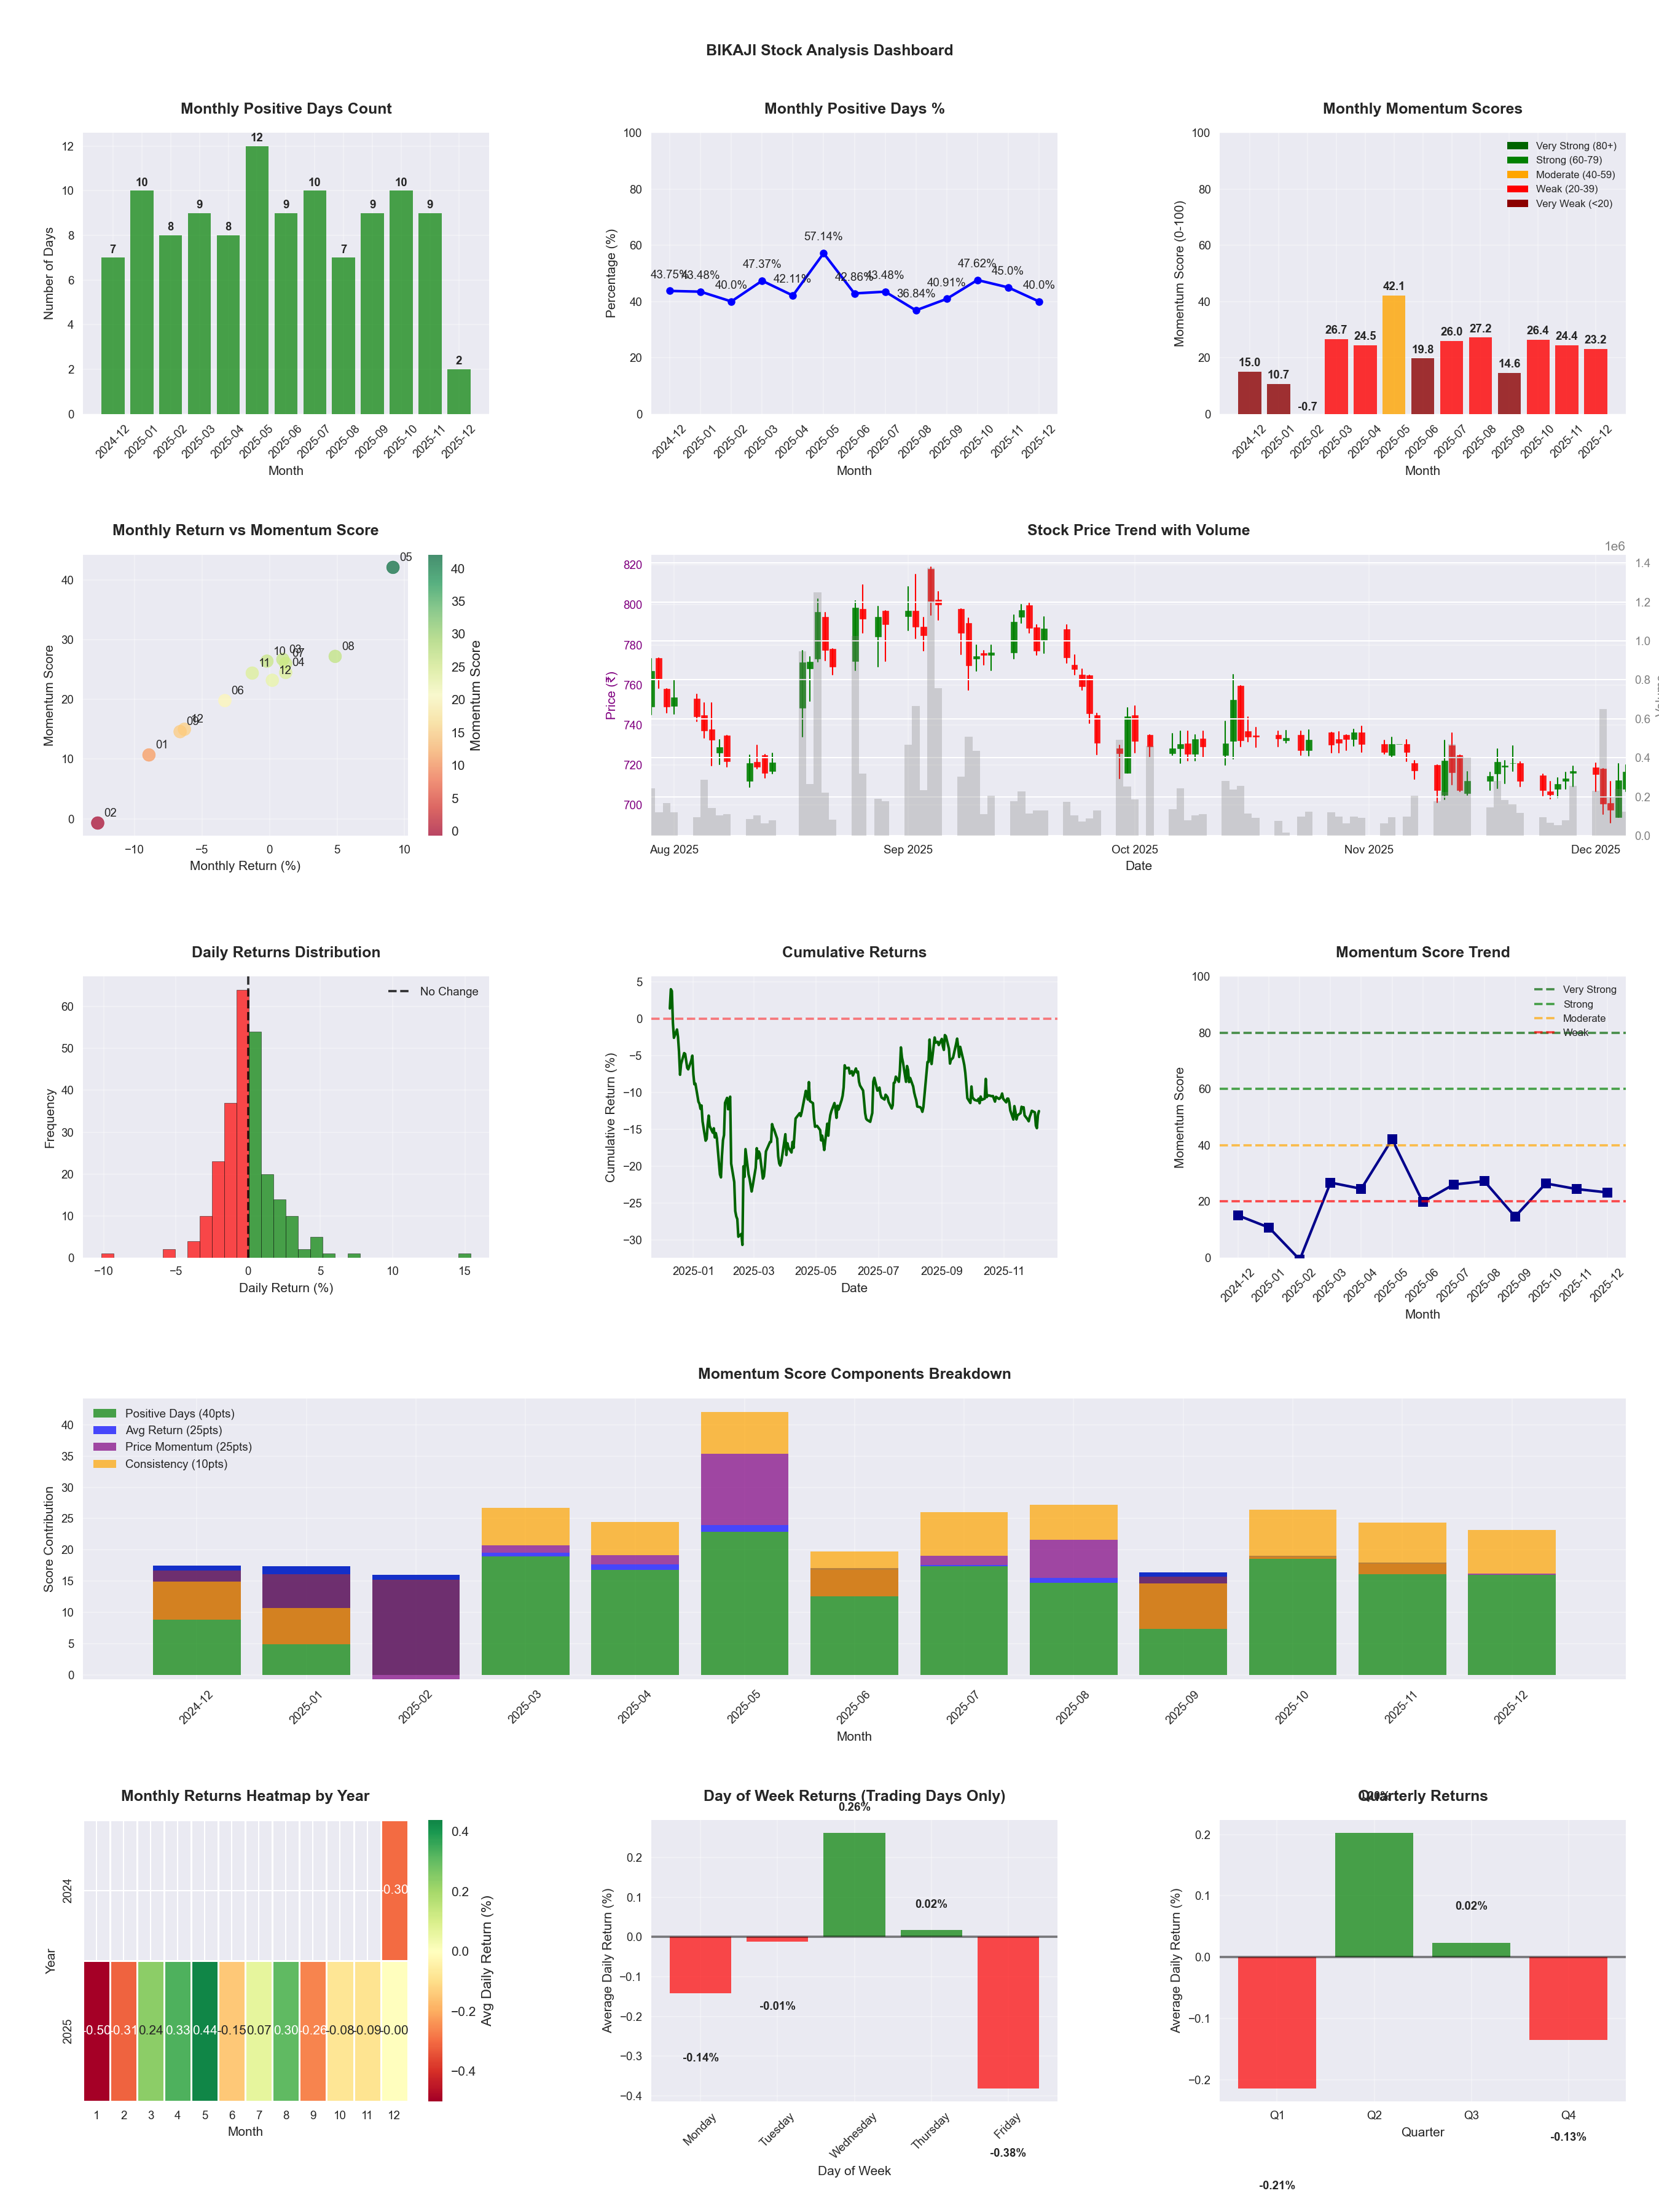
📈 BIKAJI
Date
📅 2026-04-11
Volatility
🟢 1.49%
Win Rate
⚠️ 43.9%
Avg Daily Return
📉 -0.03%
Max Drawdown
📉 -24.70%
IBD RS Score
📊 36.5
Weak
Market Rank
#313
Best Month
🏆 2025-05
Worst Month
📉 2026-01
Best Months to Trade
📅 May, Aug, Dec
Best Days to Trade
📅 Monday, Thursday
📊 Key Insights & Metrics
Symbol
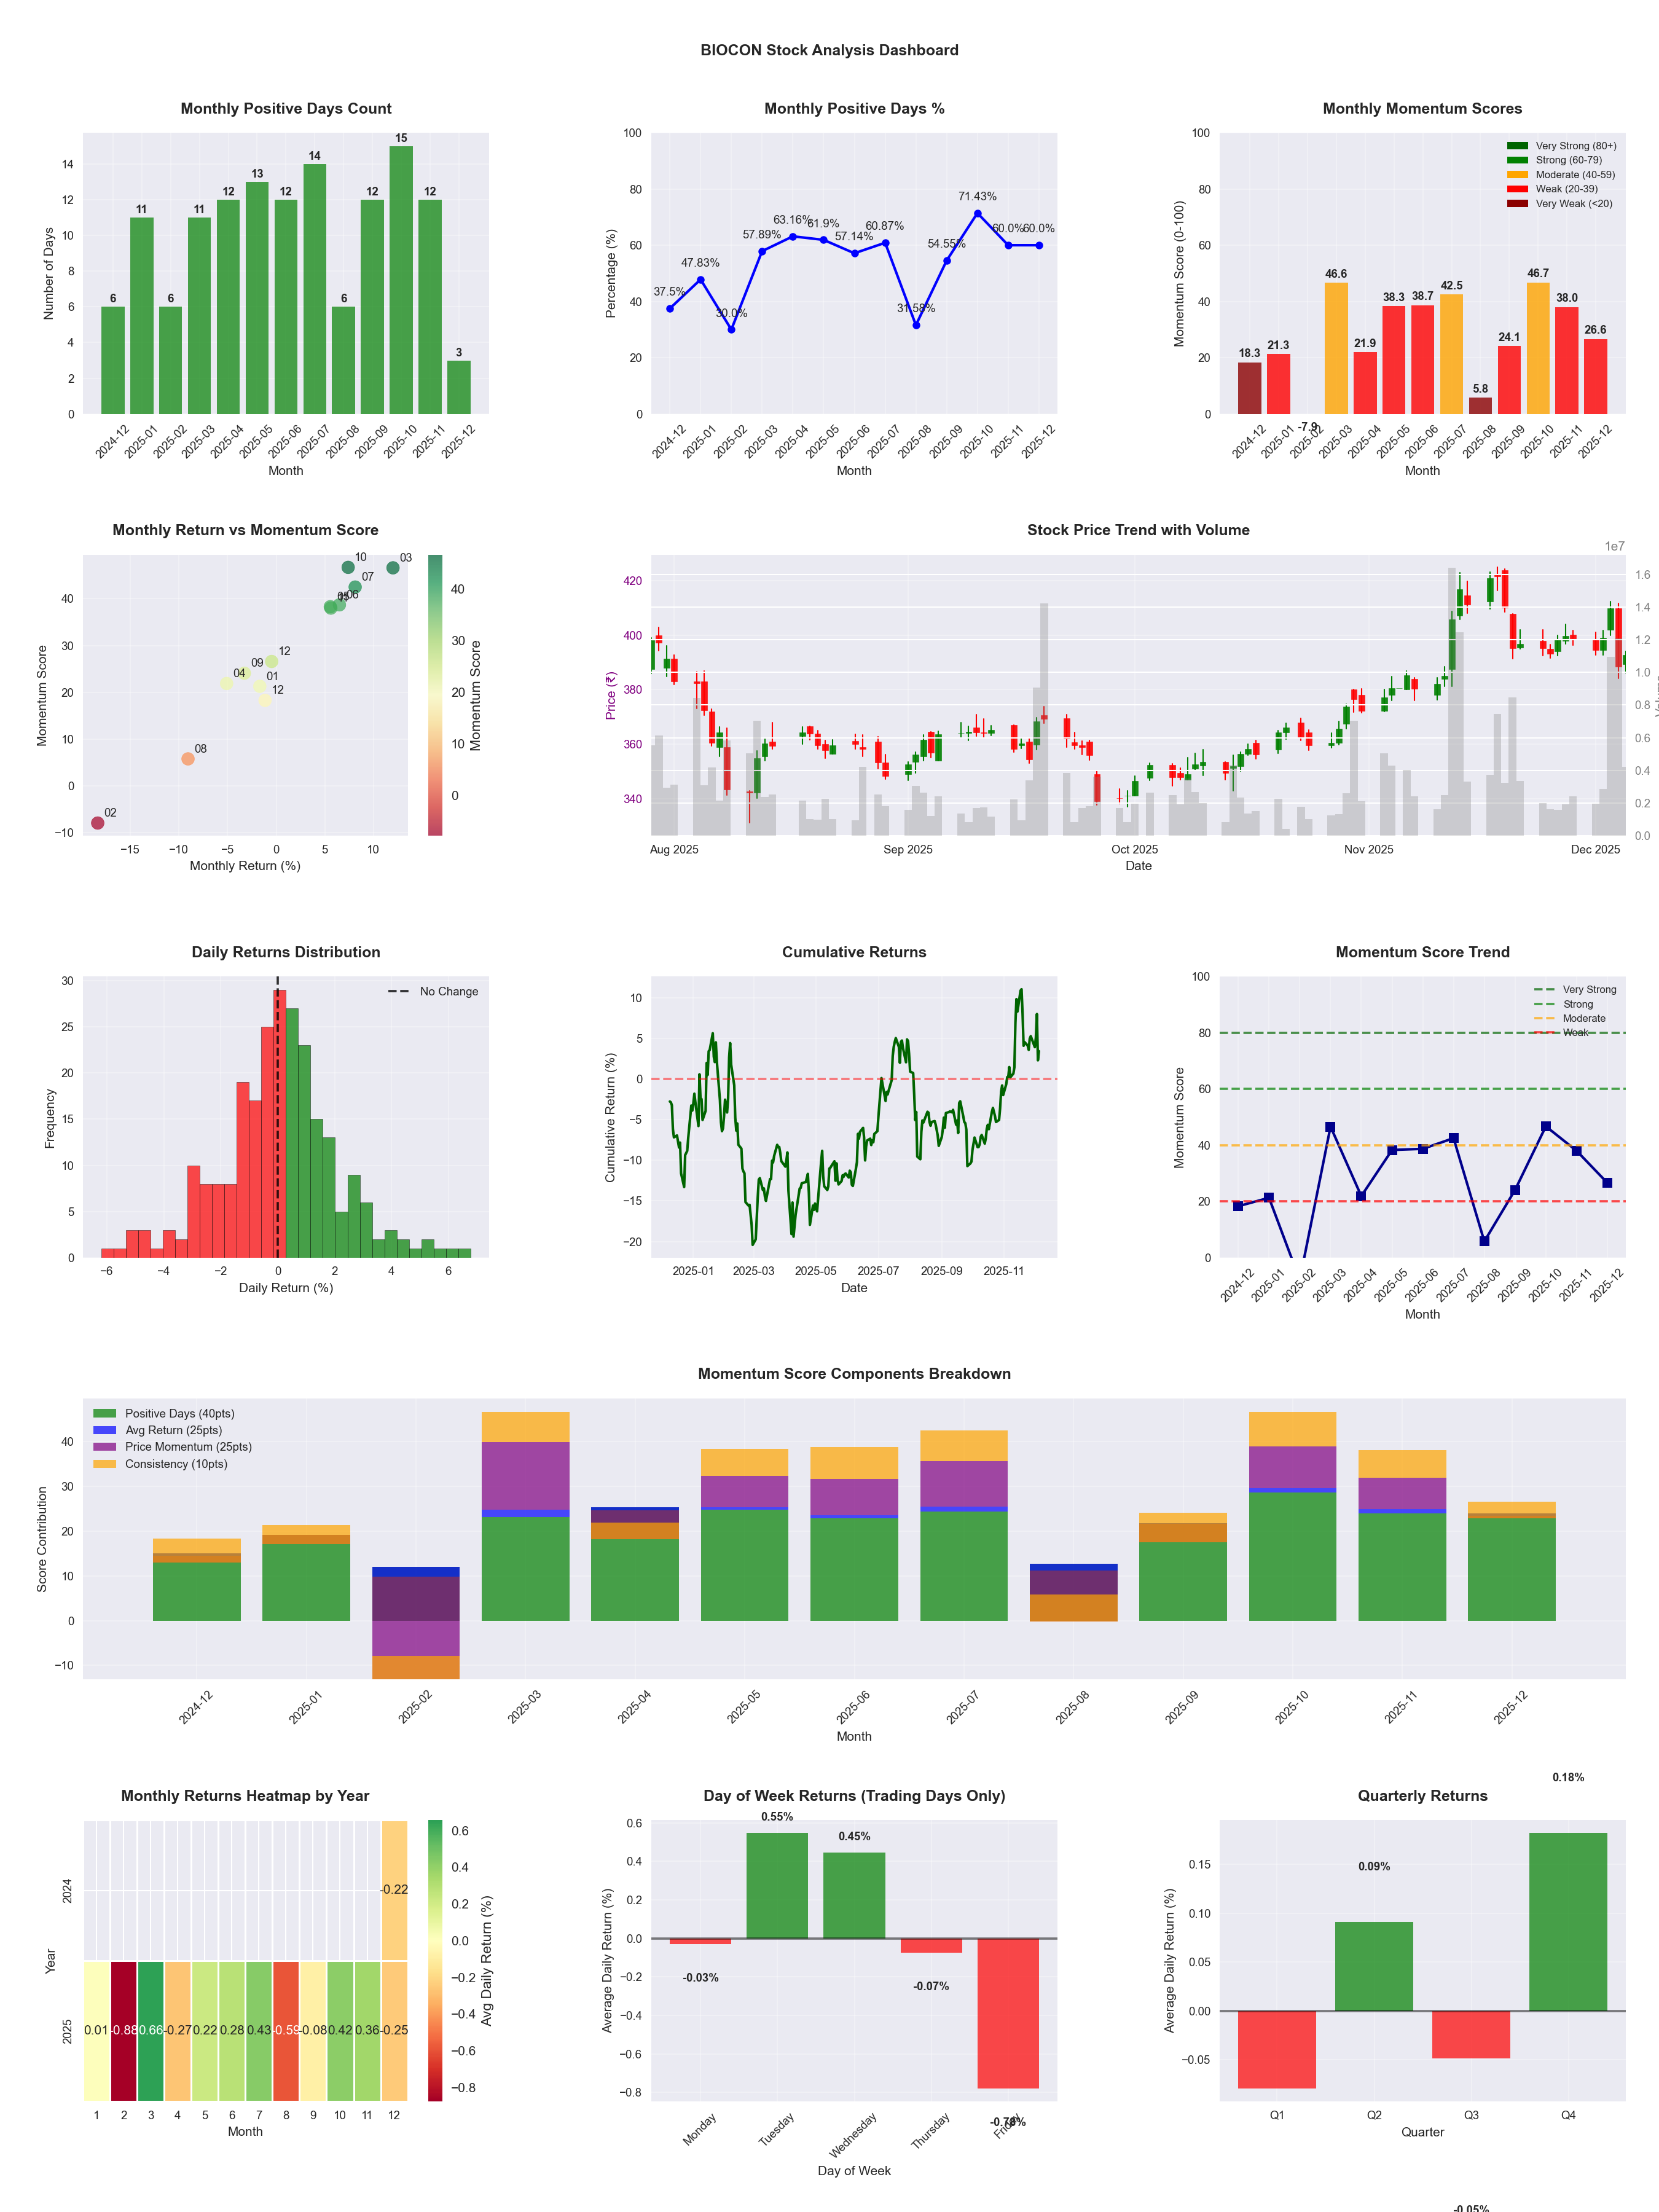
📈 BIOCON
Date
📅 2026-04-11
Volatility
🟡 1.71%
Win Rate
⚠️ 54.9%
Avg Daily Return
📈 +0.05%
Max Drawdown
📉 -19.34%
IBD RS Score
📊 53.3
Average
Market Rank
#230
Best Month
🏆 2025-10
Worst Month
📉 2025-08
Best Months to Trade
📅 Jul, Oct, Nov
Best Days to Trade
📅 Wednesday, Tuesday
📊 Key Insights & Metrics
Symbol
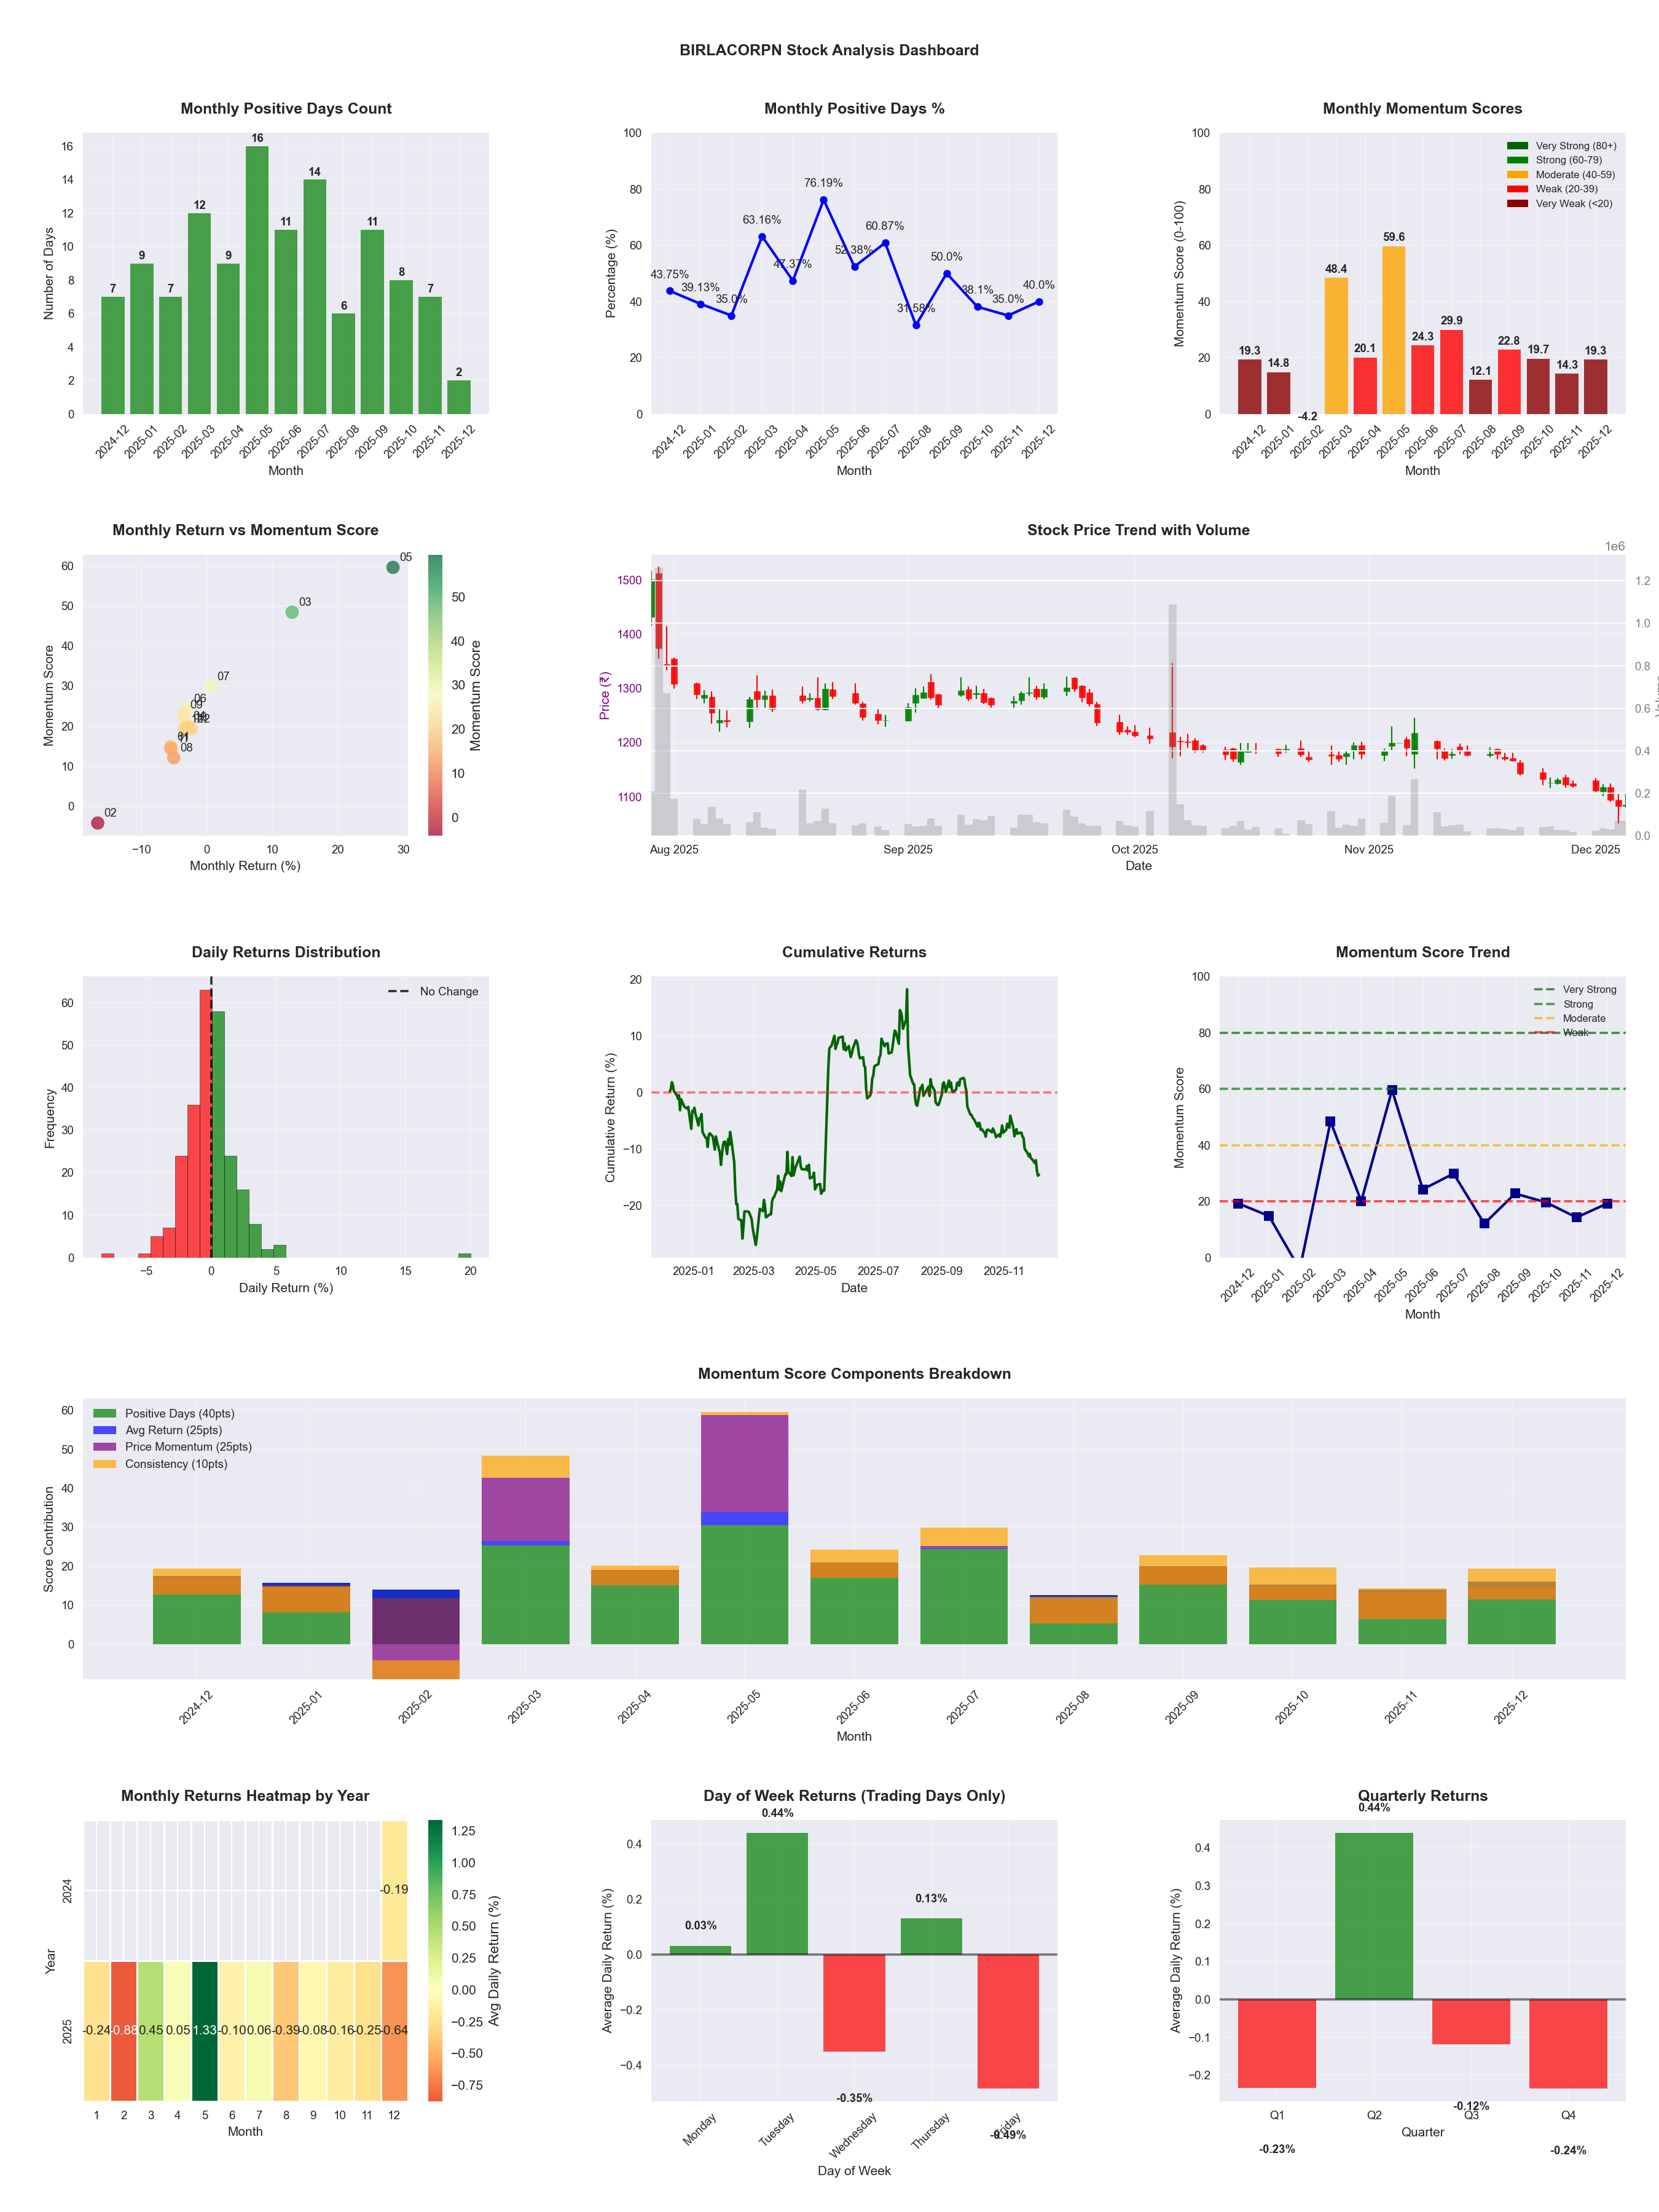
📈 BIRLACORPN
Date
📅 2026-03-21
Volatility
🟡 2.30%
Risk Profile
⚠️ suitable for aggressive investors
Win Rate
⚠️ 47.1%
Avg Daily Return
📉 -0.07%
Max Drawdown
📉 -47.88%
Best Month
🏆 2025-05
Worst Month
📉 2026-03
Best Months to Trade
📅 May, Jul, Apr
Best Days to Trade
📅 Tuesday, Monday
📊 Key Insights & Metrics
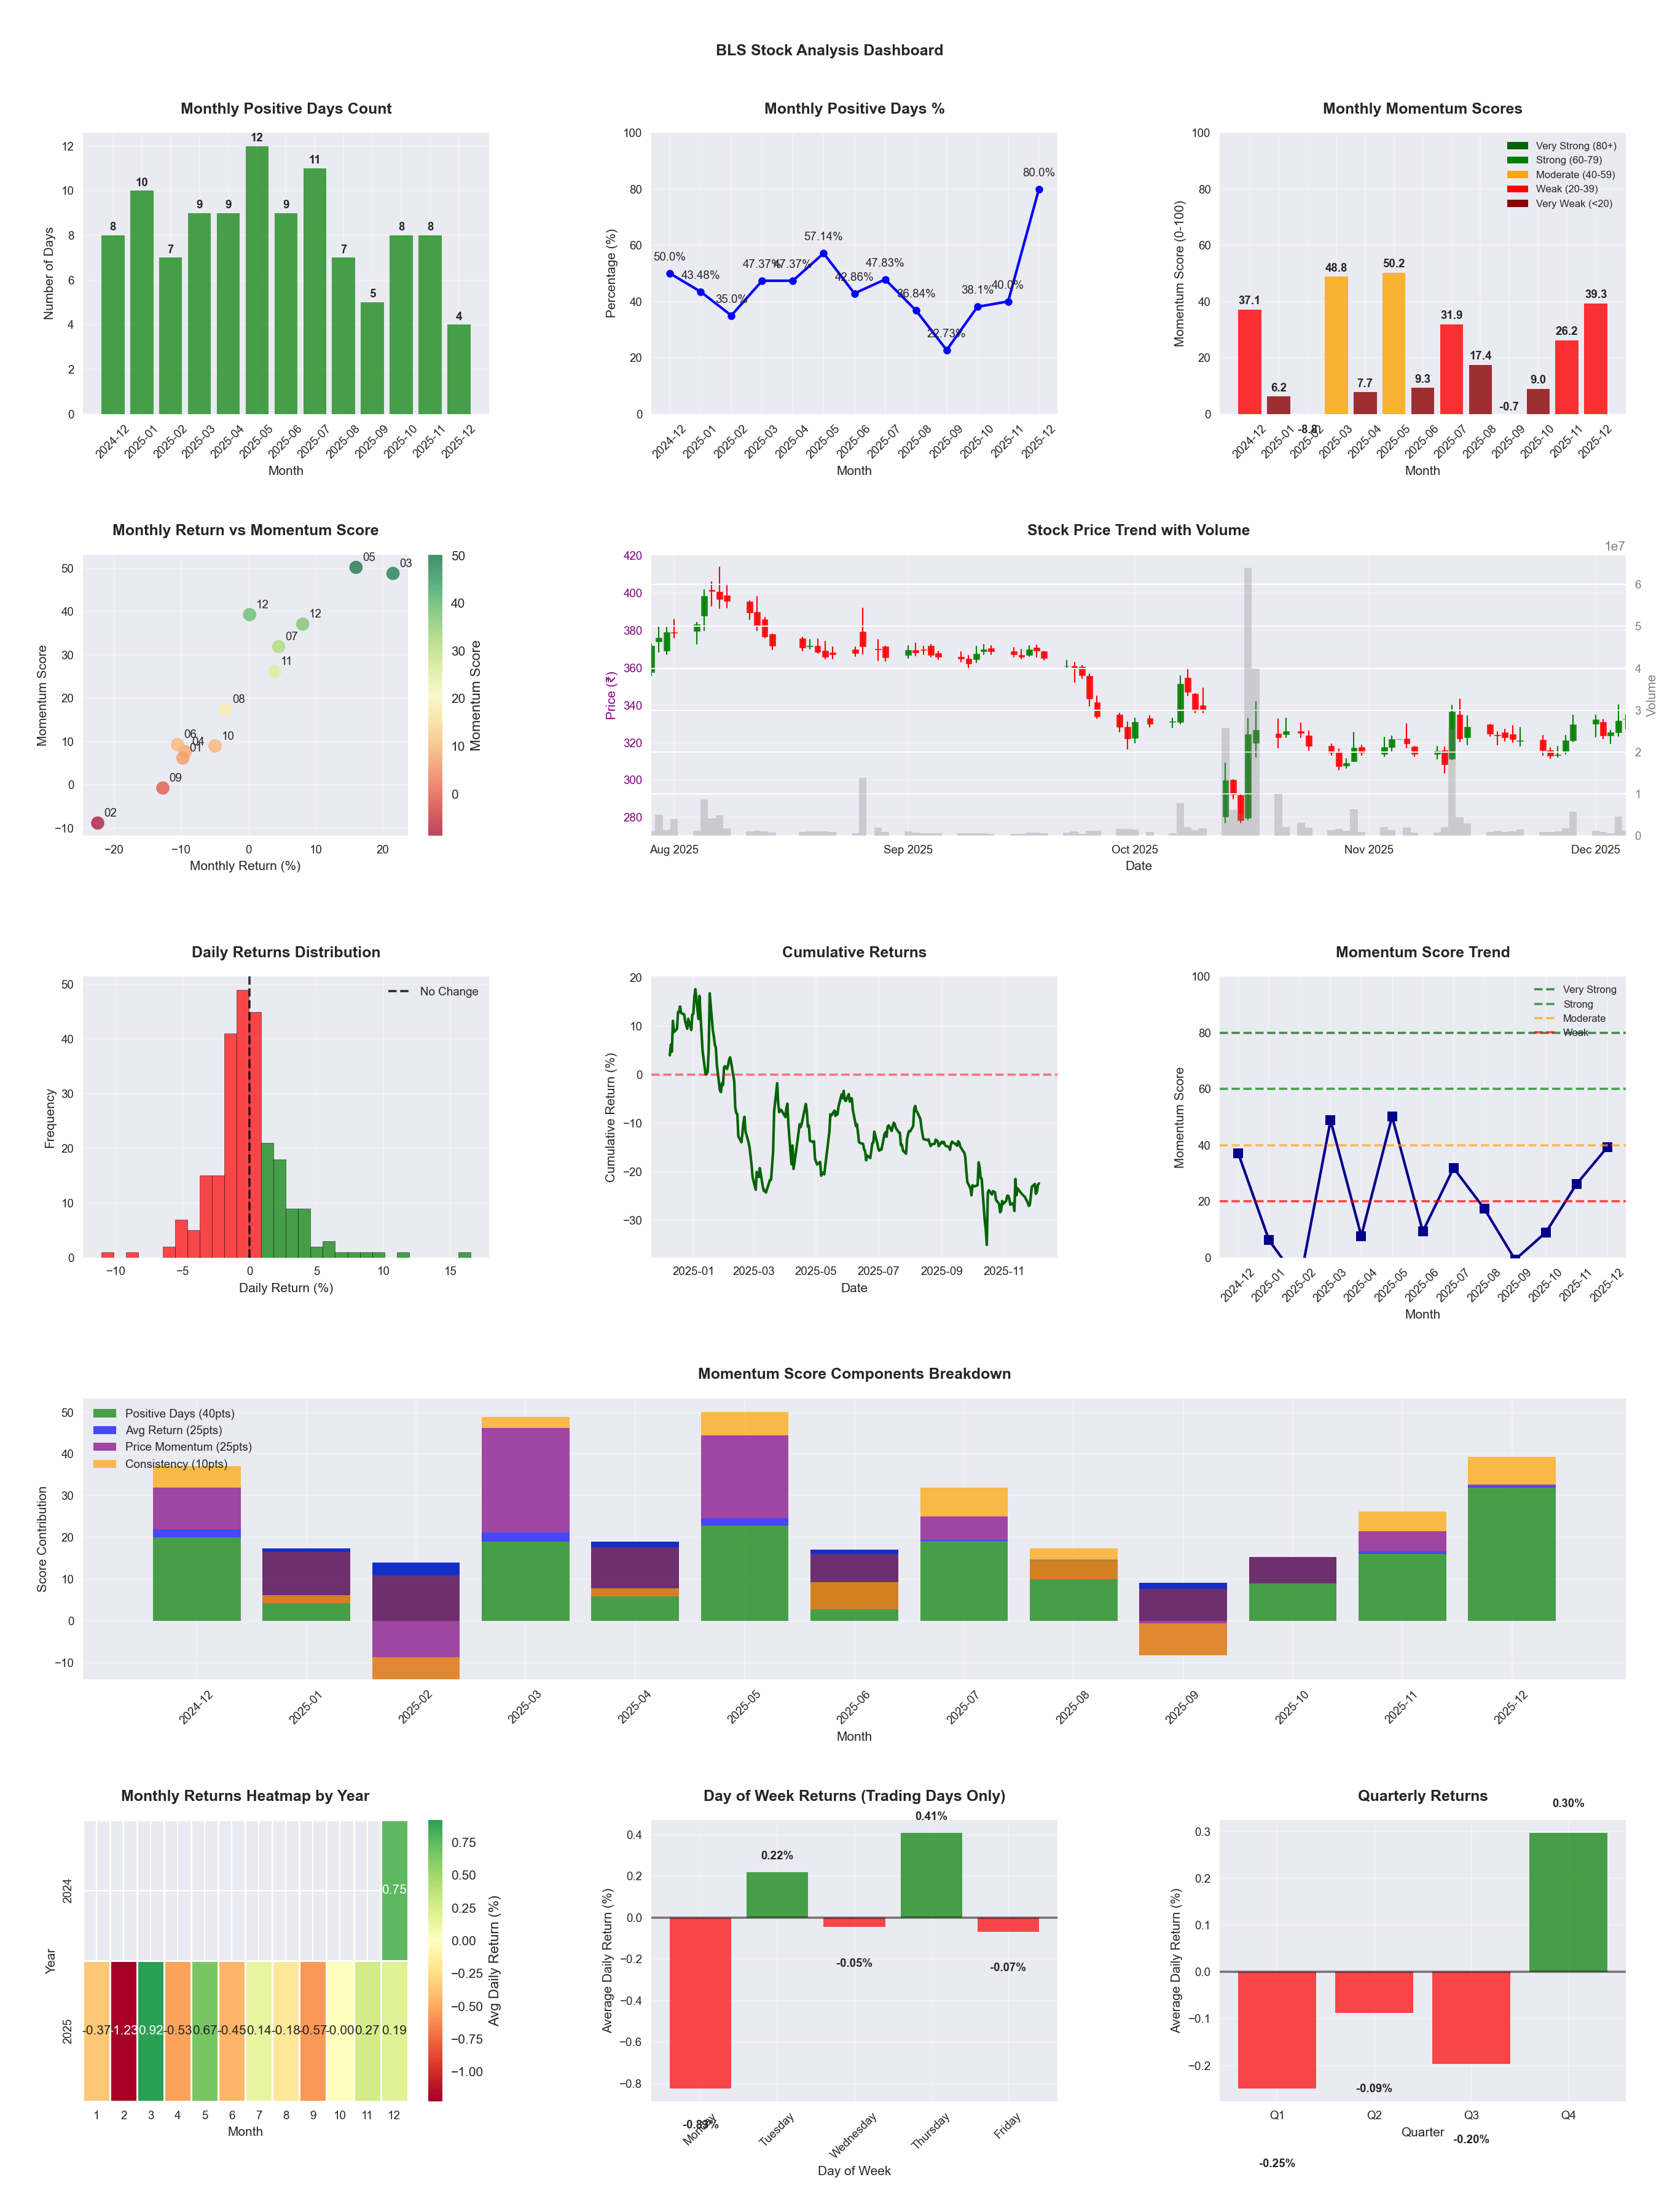
Symbol
📈 BLS
Date
📅 2026-04-11
Volatility
🟡 2.98%
Risk Profile
⚠️ suitable for aggressive investors
Win Rate
⚠️ 41.1%
Avg Daily Return
📉 -0.04%
Max Drawdown
📉 -46.12%
IBD RS Score
📊 33.1
Weak
Market Rank
#330
Best Month
🏆 2026-04
Best Months to Trade
📅 Apr, May, Feb
Best Days to Trade
📅 Wednesday, Tuesday
📊 Key Insights & Metrics
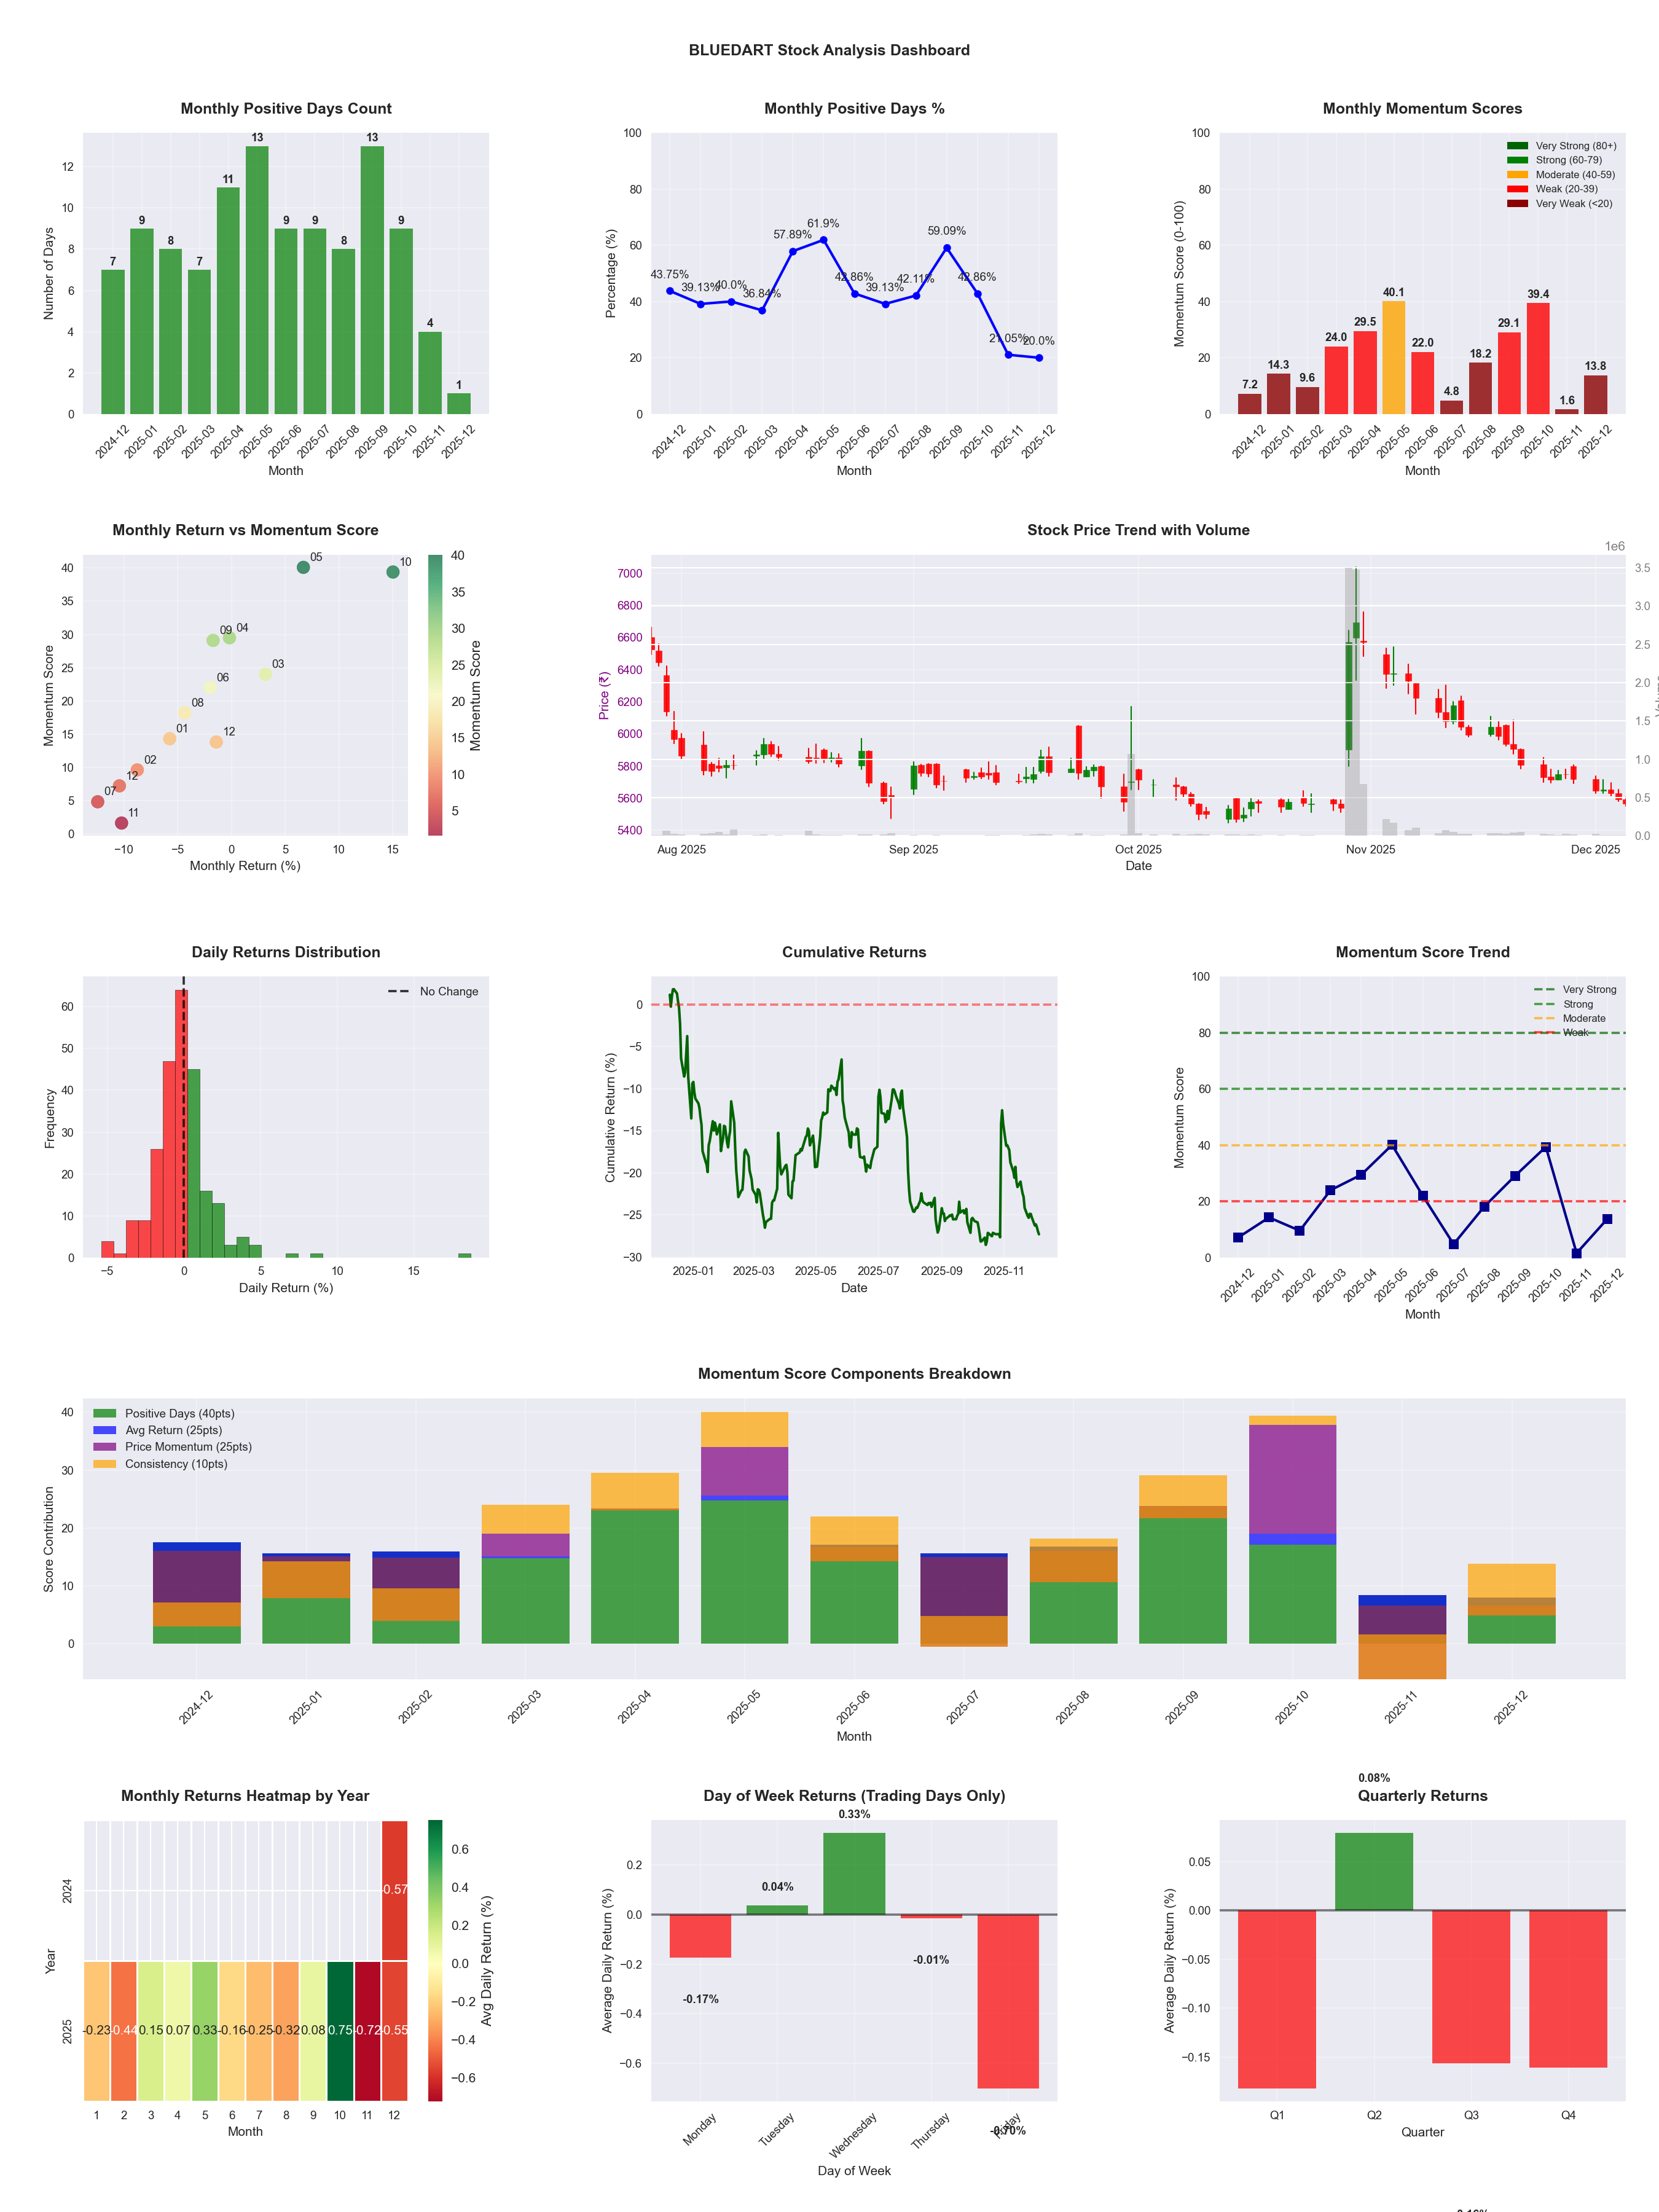
Symbol
📈 BLUEDART
Date
📅 2026-04-11
Volatility
🟡 1.92%
Win Rate
⚠️ 45.5%
Avg Daily Return
📉 -0.06%
Max Drawdown
📉 -33.66%
IBD RS Score
📊 34.3
Weak
Market Rank
#324
Best Month
🏆 2026-04
Worst Month
📉 2026-03
Best Months to Trade
📅 Oct, Apr, May
Best Days to Trade
📅 Wednesday, Tuesday
📊 Key Insights & Metrics
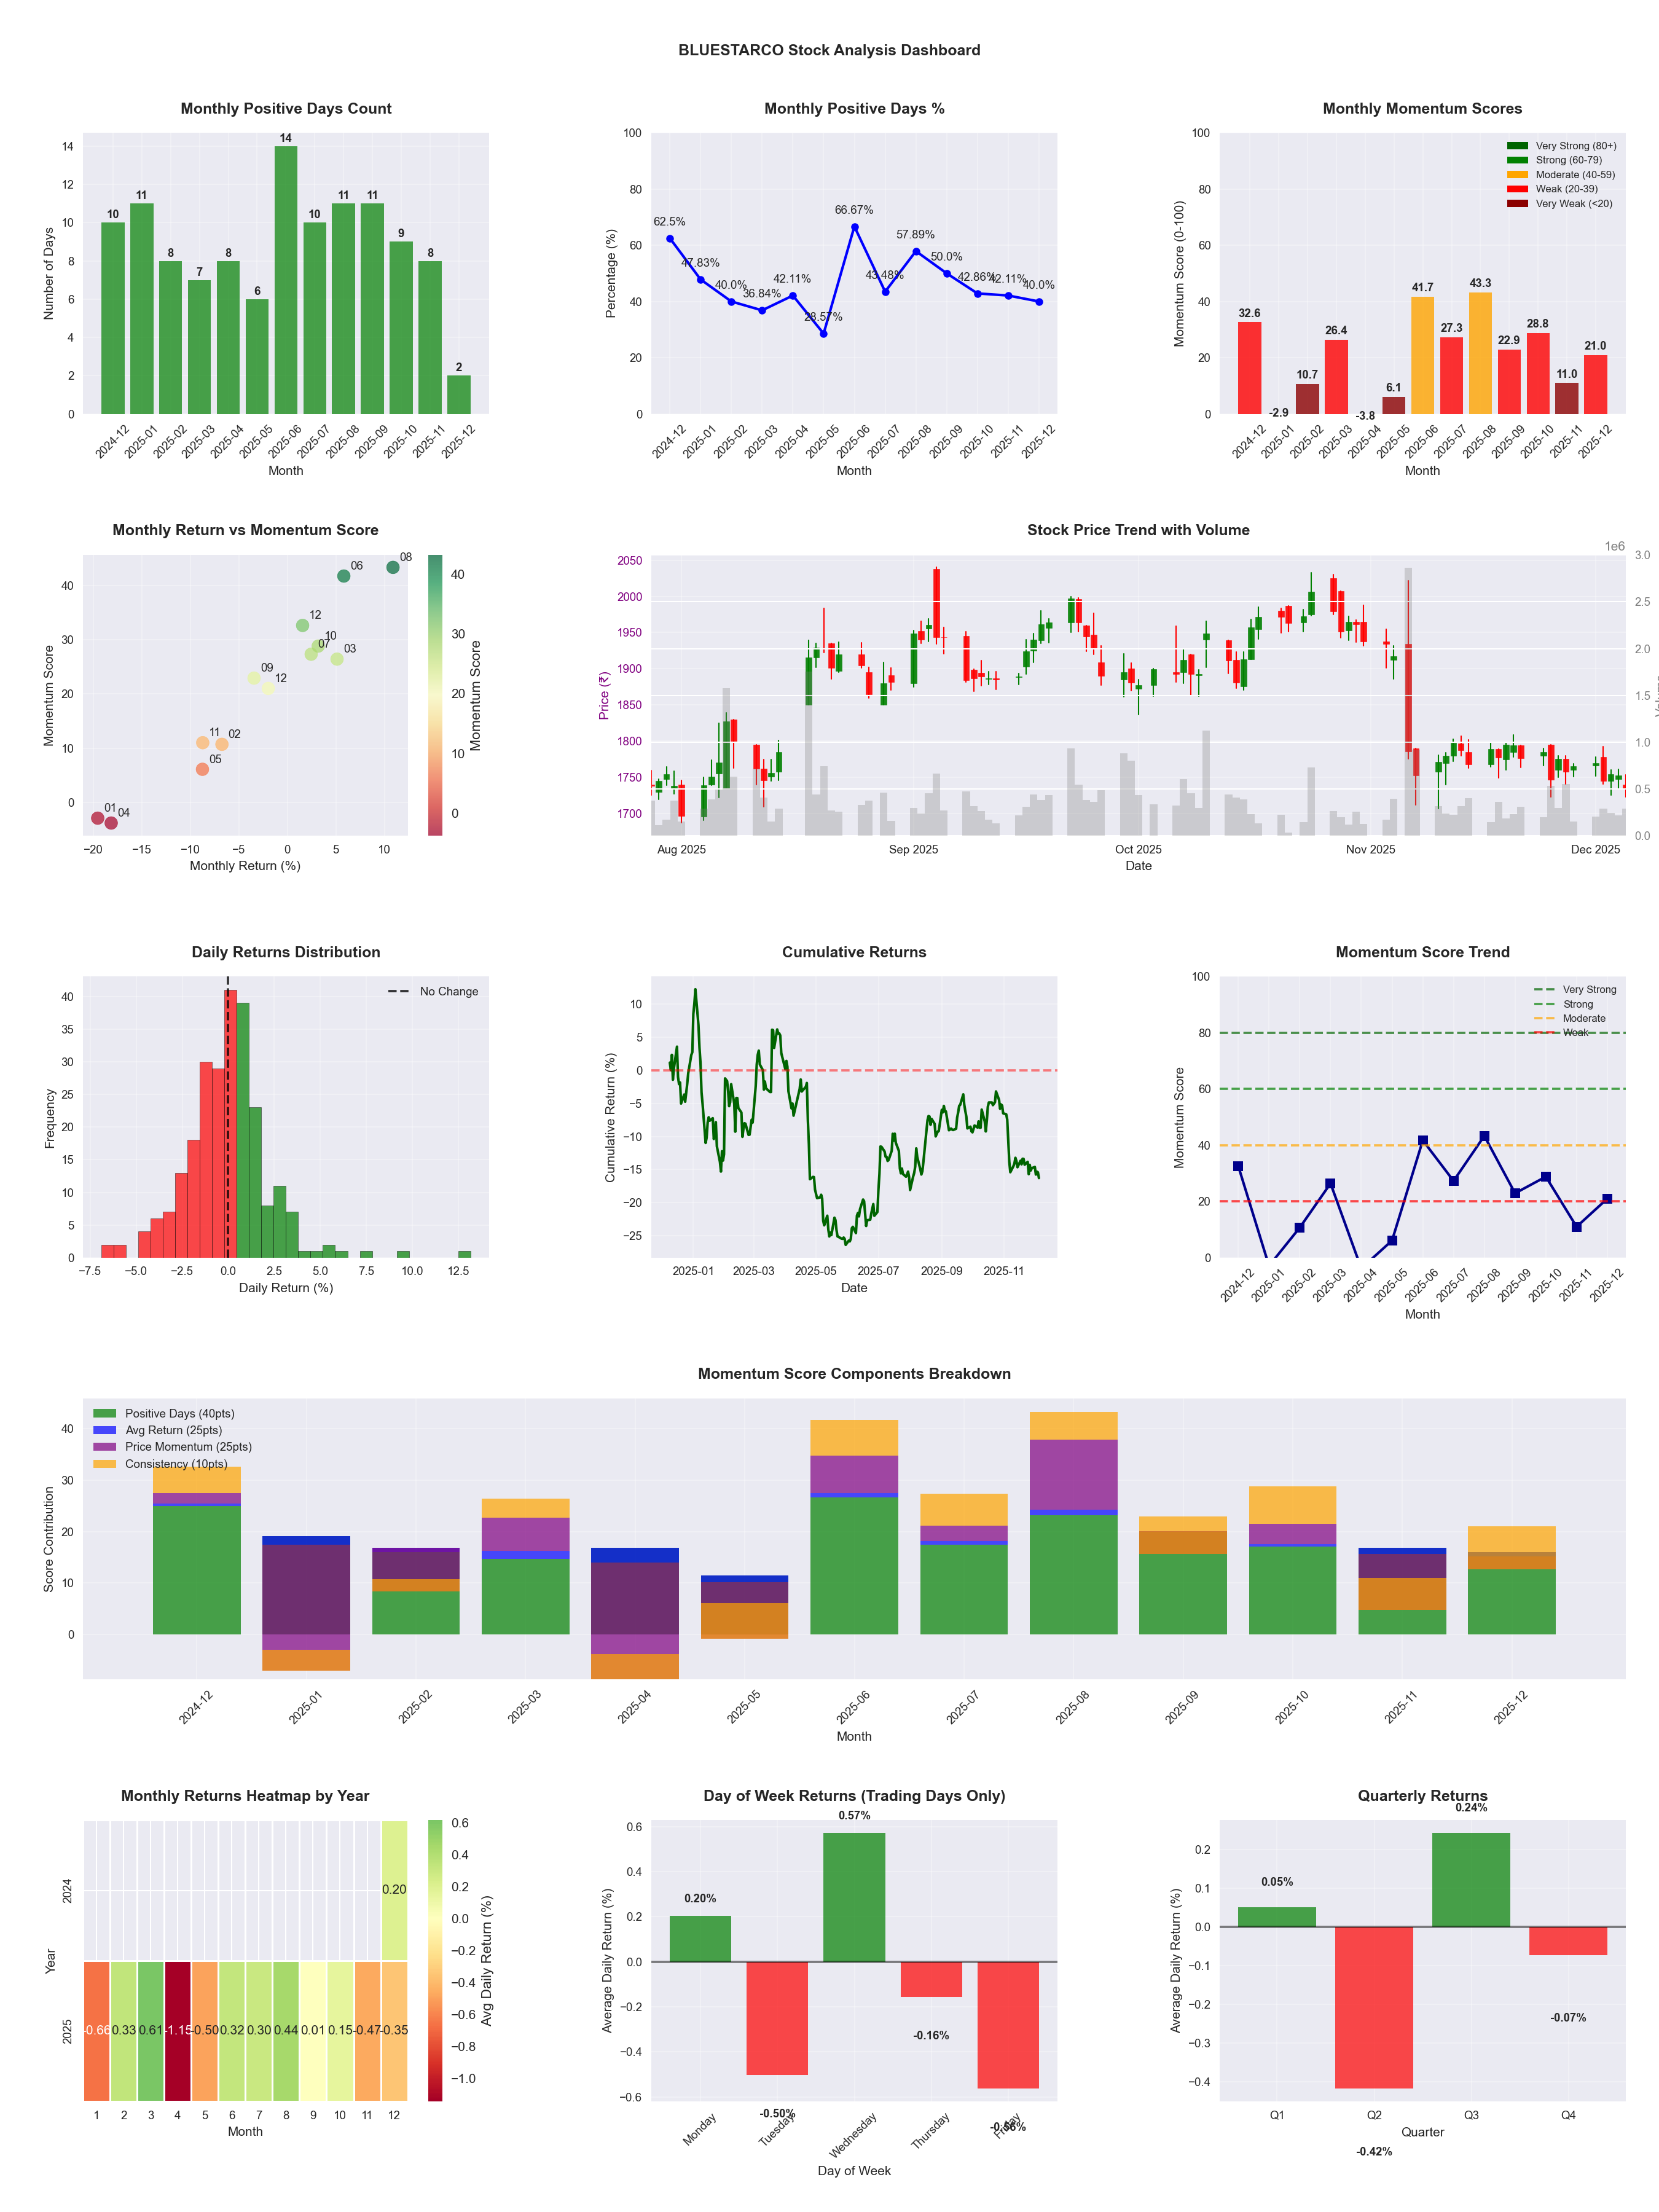
Symbol
📈 BLUESTARCO
Date
📅 2026-04-11
Volatility
🟡 1.98%
Win Rate
⚠️ 48.0%
Avg Daily Return
📉 -0.04%
Max Drawdown
📉 -25.37%
IBD RS Score
📊 38.5
Weak
Market Rank
#303
Best Month
🏆 2025-08
Best Months to Trade
📅 Aug, Feb, Jun
Best Days to Trade
📅 Wednesday, Monday
📊 Key Insights & Metrics
Symbol
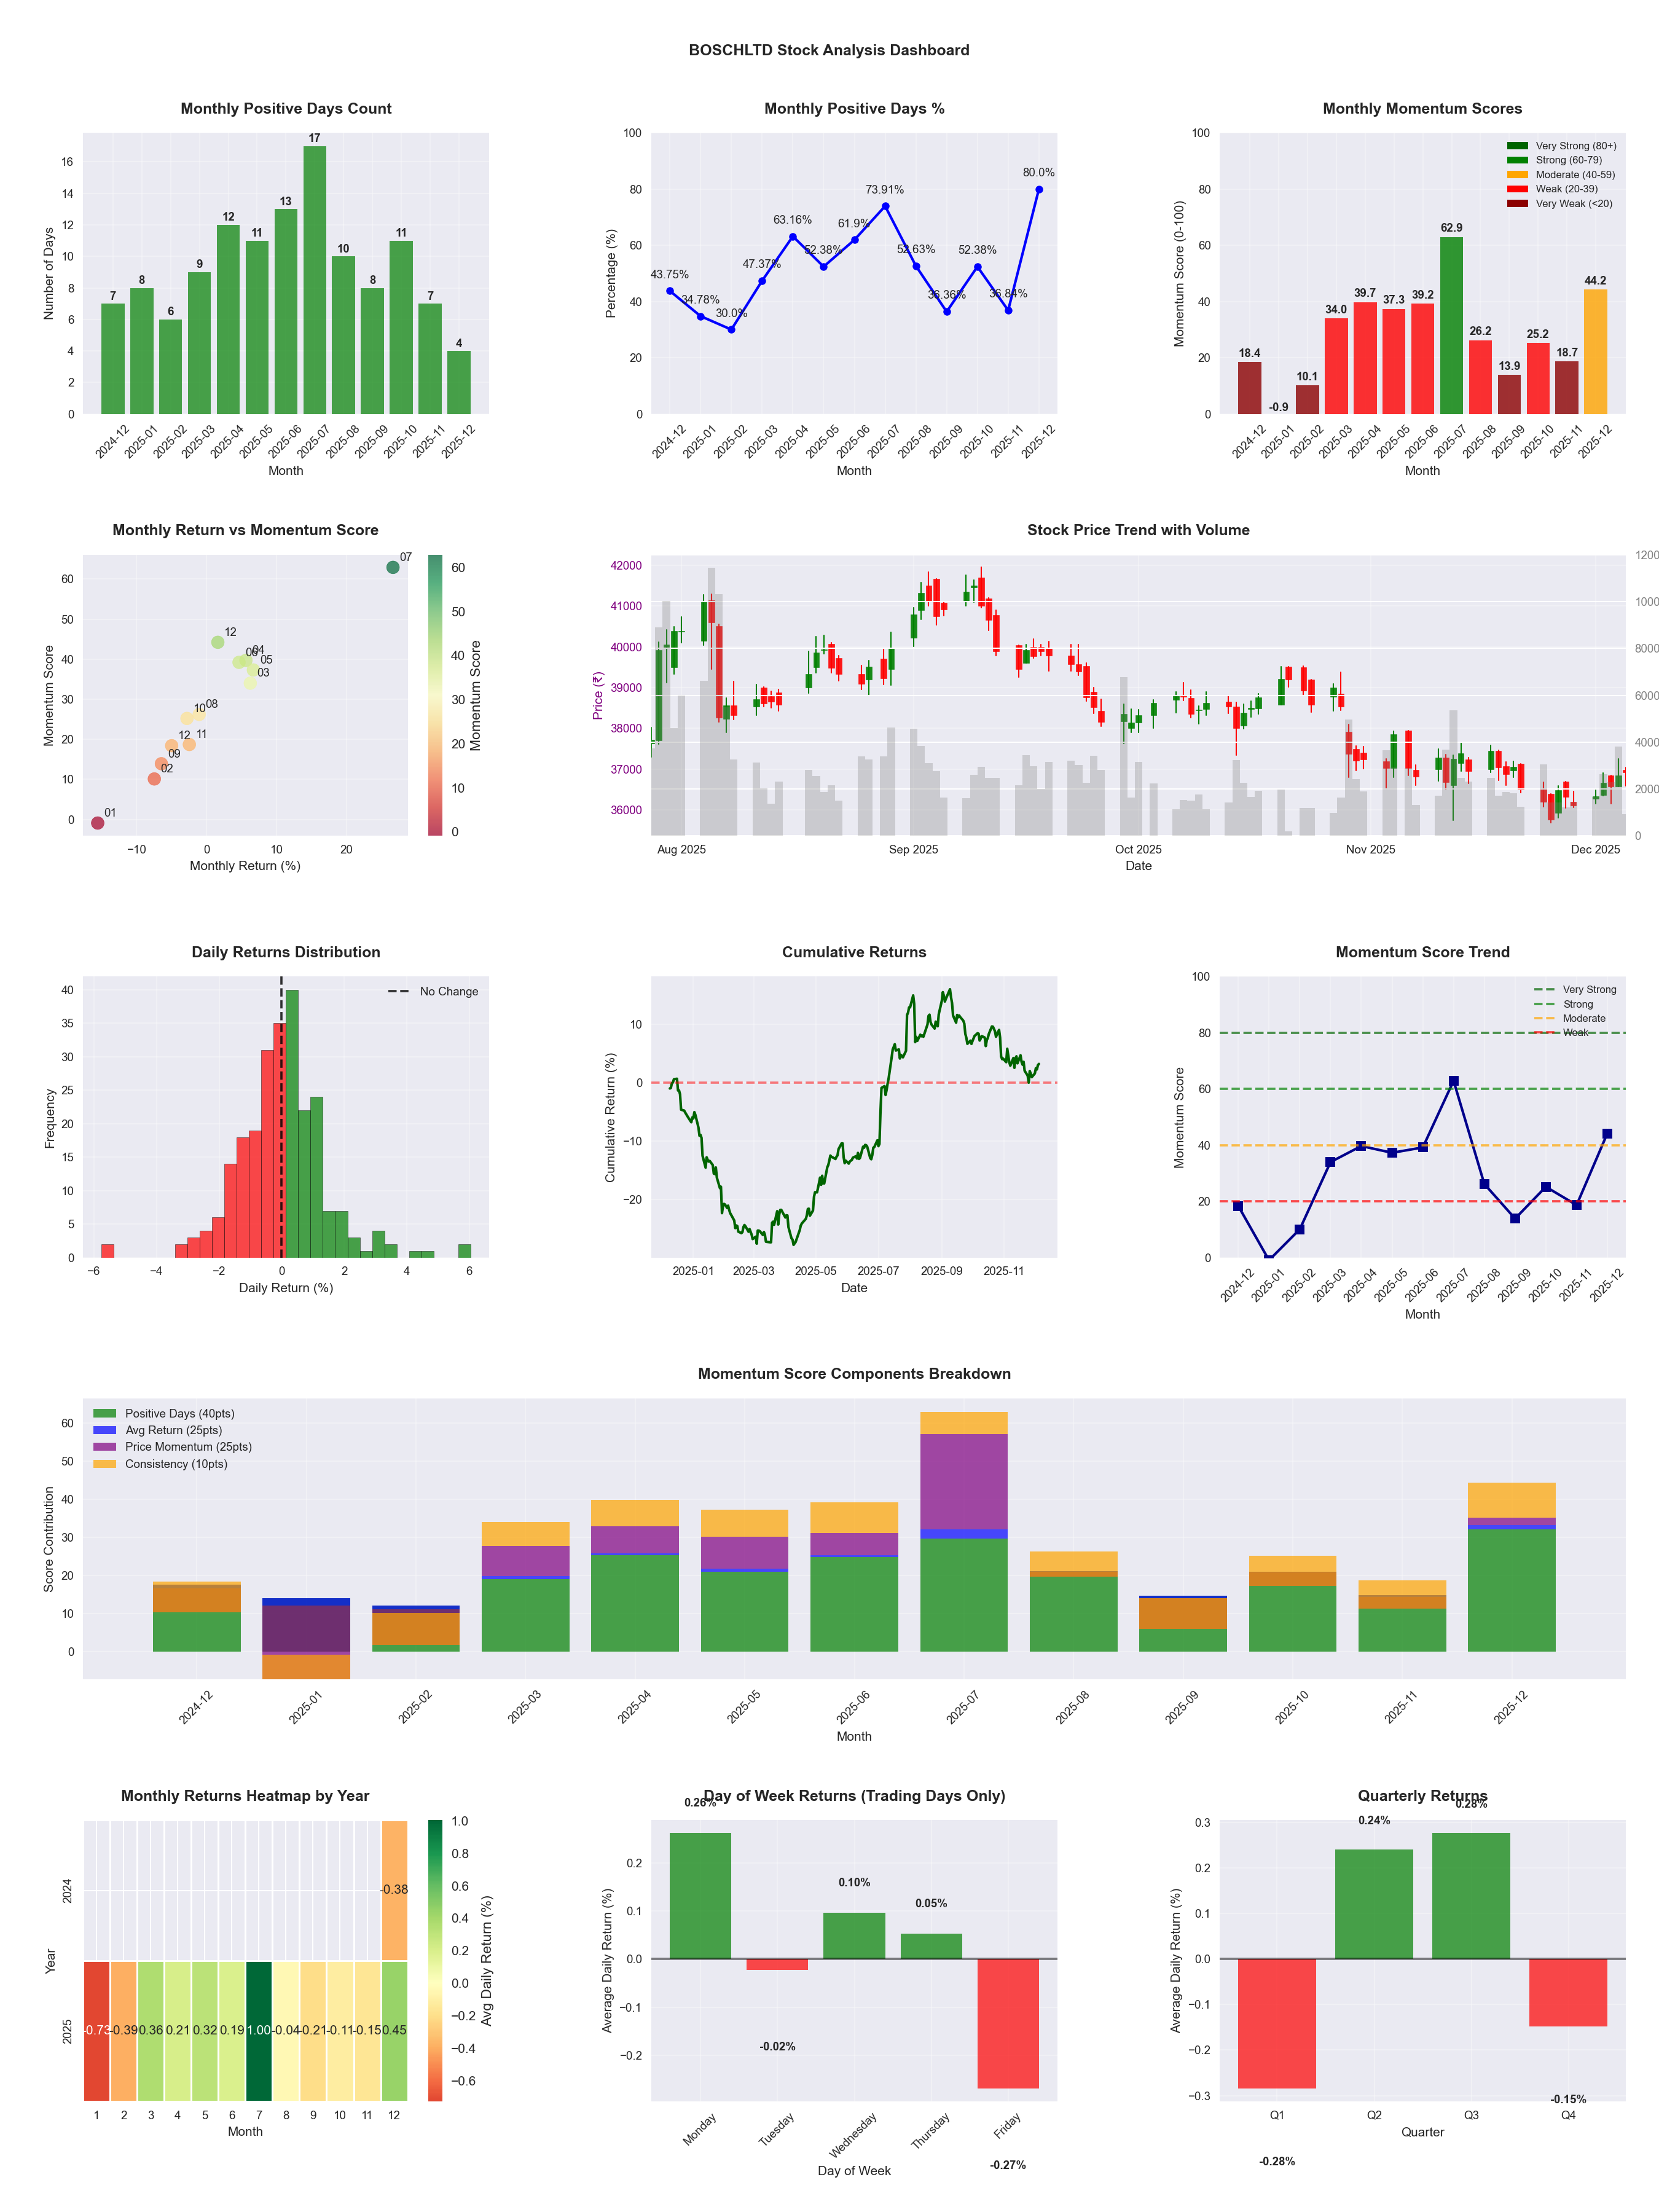
📈 BOSCHLTD
Date
📅 2026-04-11
Volatility
🟡 1.80%
Win Rate
⚠️ 52.0%
Avg Daily Return
📈 +0.16%
Max Drawdown
📉 -30.73%
IBD RS Score
📊 73.2
Strong
Market Rank
#132
Best Month
🏆 2026-04
Best Months to Trade
📅 Apr, Jul, May
Best Days to Trade
📅 Wednesday, Tuesday
📊 Key Insights & Metrics
Symbol
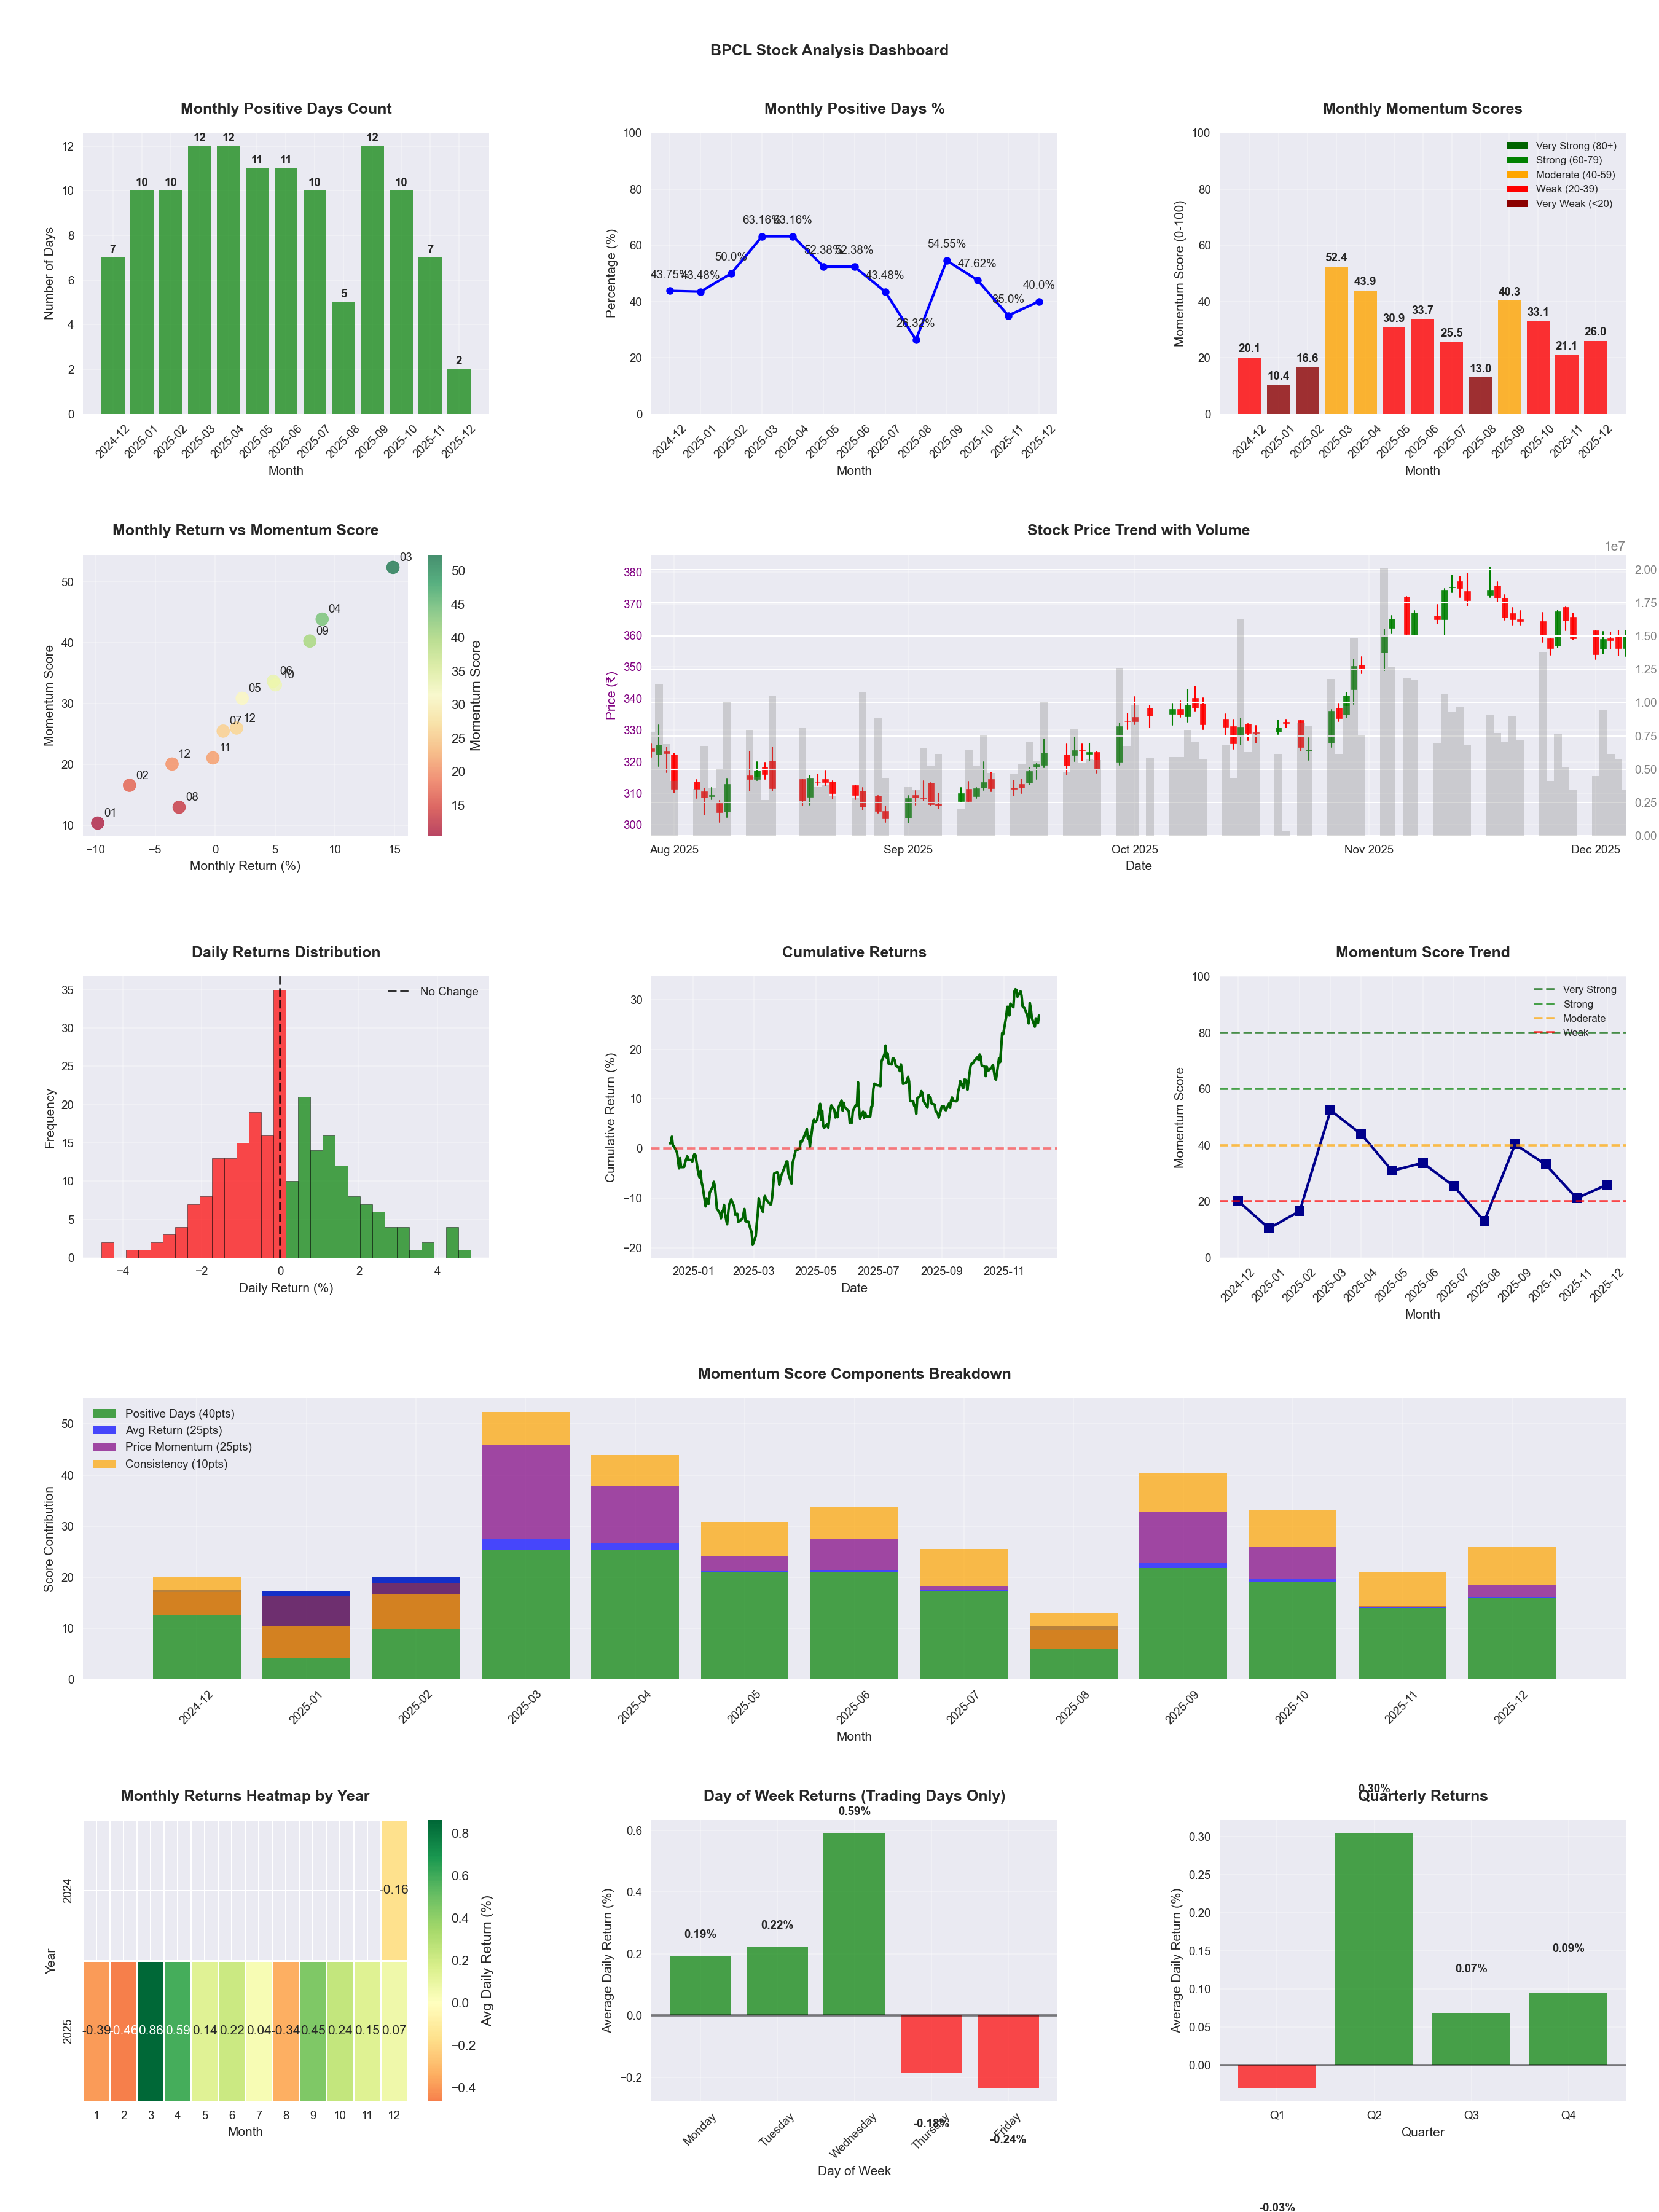
📈 BPCL
Date
📅 2026-04-11
Volatility
🟡 1.76%
Win Rate
⚠️ 47.1%
Avg Daily Return
📈 +0.05%
Max Drawdown
📉 -30.13%
IBD RS Score
📊 45.8
Weak
Market Rank
#267
Best Month
🏆 2025-12
Best Months to Trade
📅 Apr, Sep, Feb
Best Days to Trade
📅 Wednesday, Monday
📊 Key Insights & Metrics
Symbol
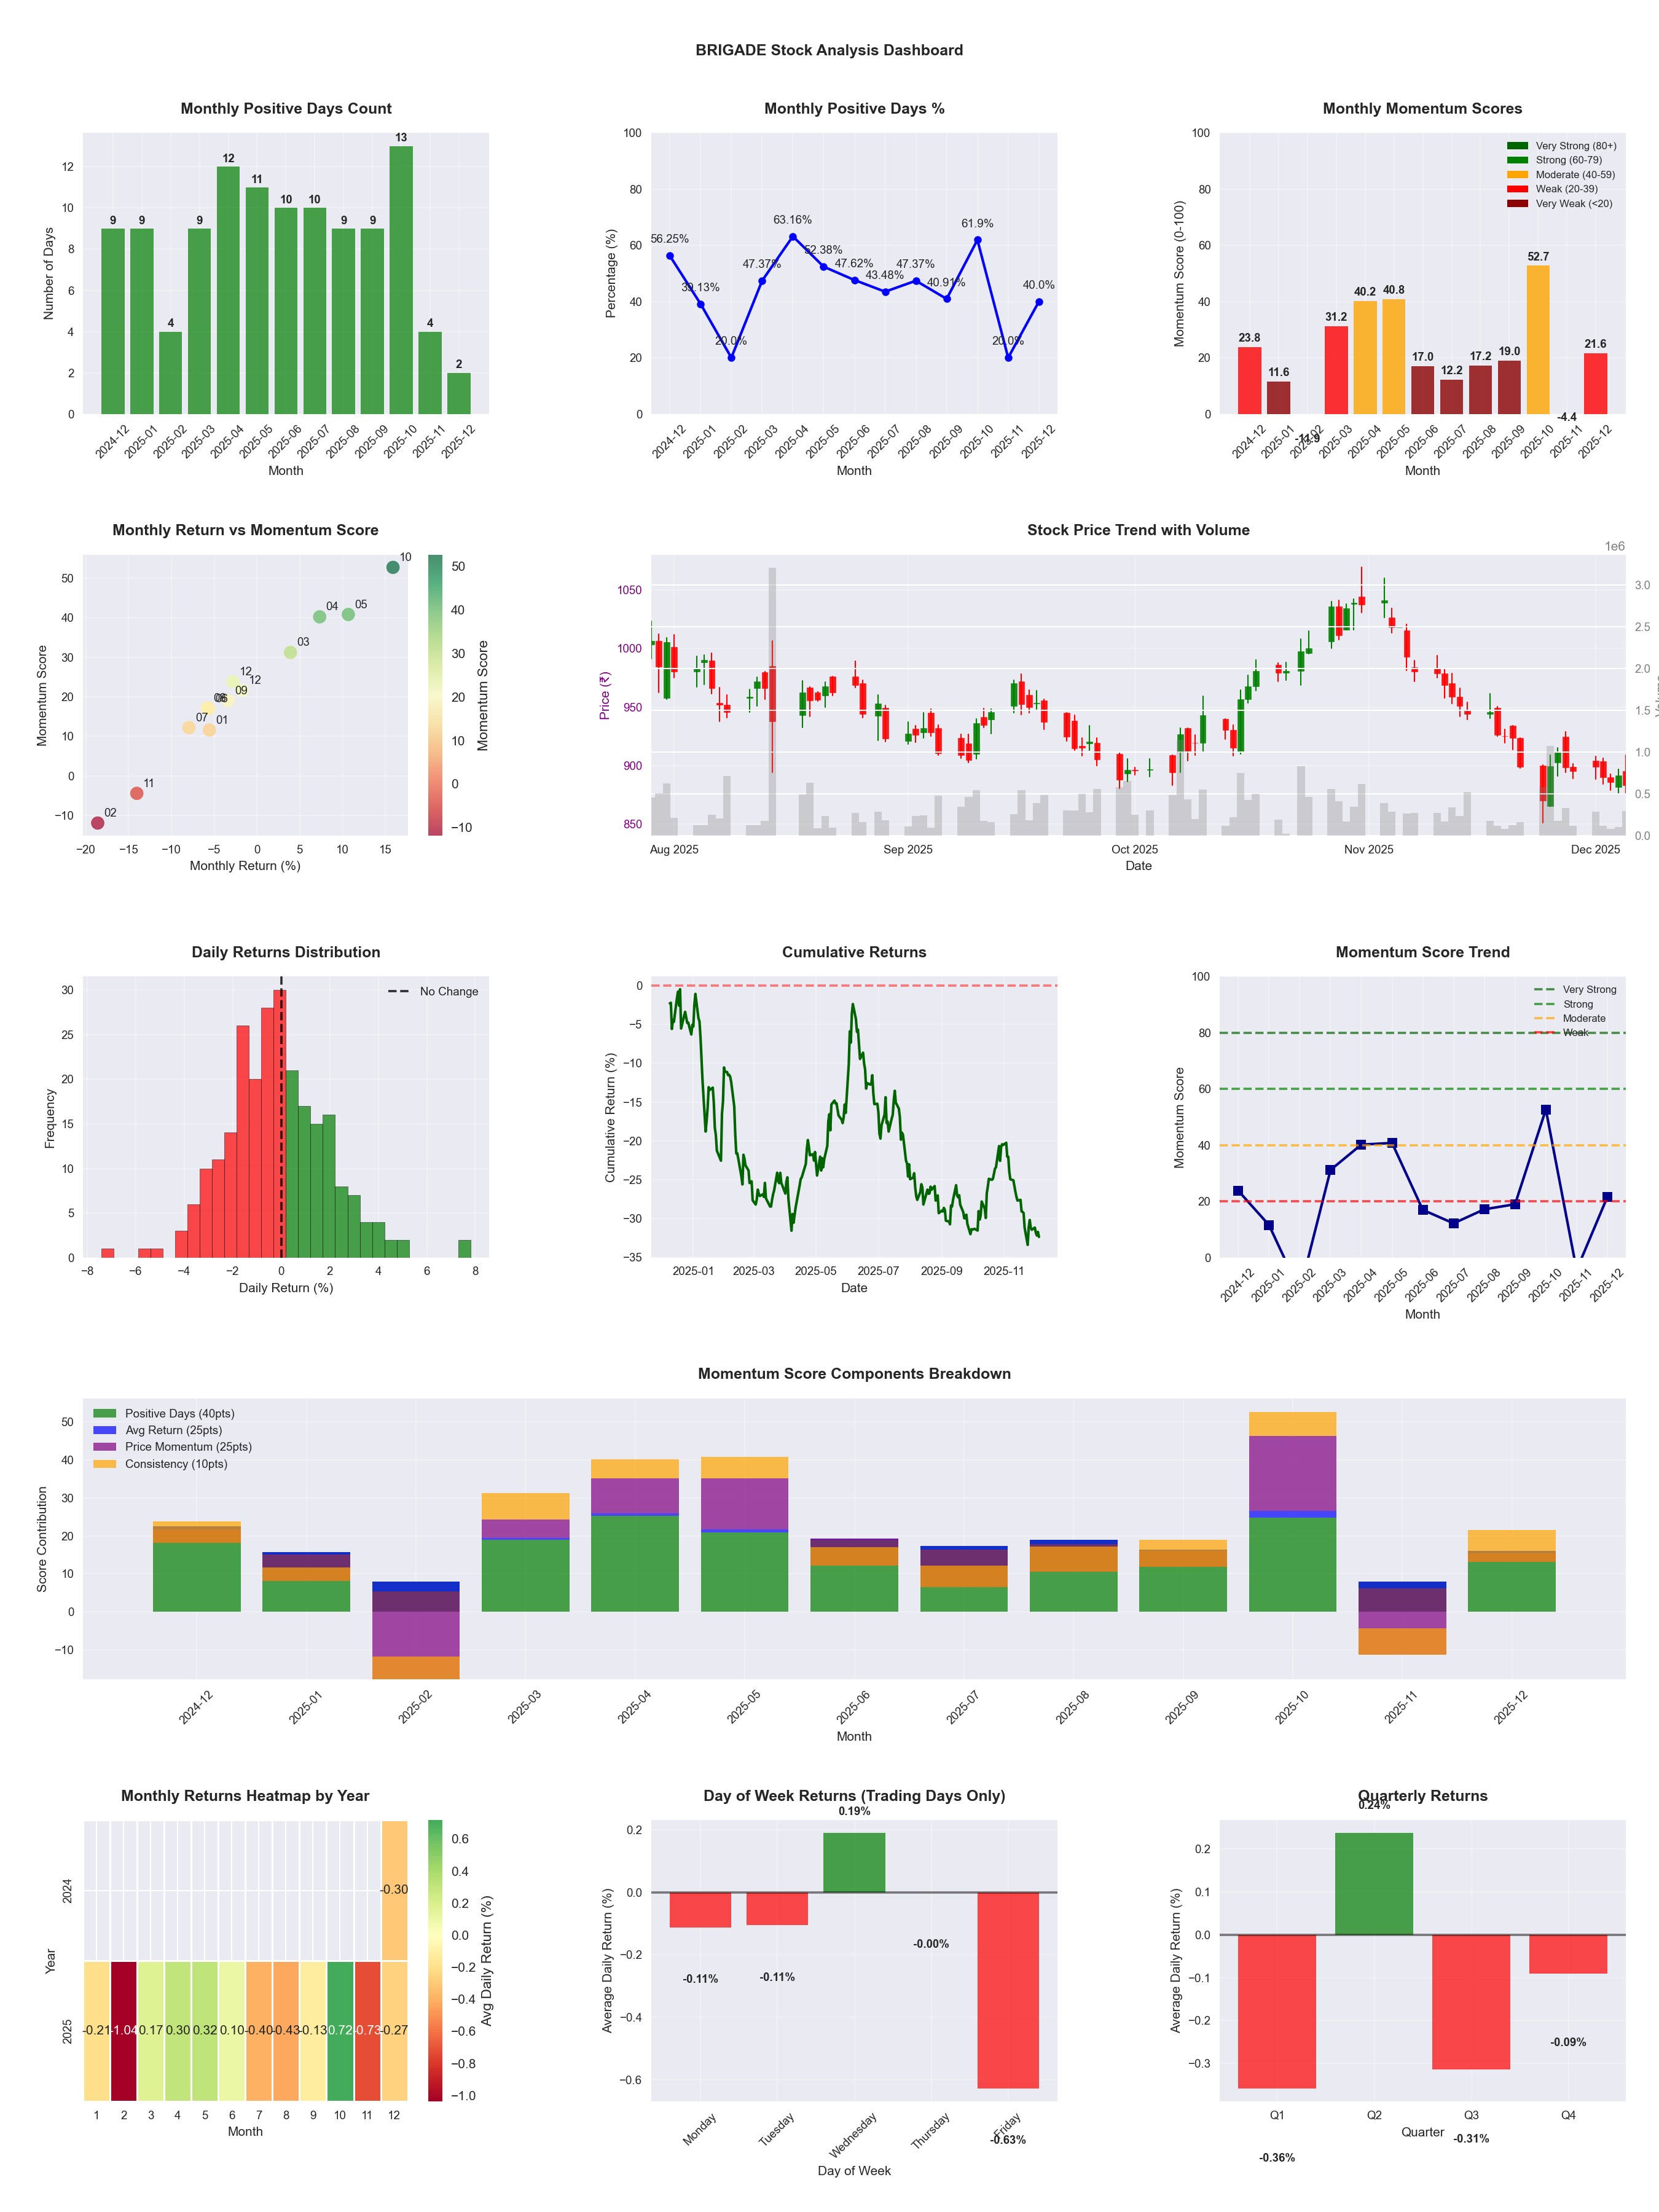
📈 BRIGADE
Date
📅 2026-04-11
Volatility
🟡 2.04%
Risk Profile
⚠️ suitable for aggressive investors
Win Rate
⚠️ 44.7%
Avg Daily Return
📉 -0.08%
Max Drawdown
📉 -50.21%
IBD RS Score
📊 11.0
Weak
Market Rank
#439
Best Month
🏆 2026-04
Best Months to Trade
📅 Apr, Oct, May
Best Days to Trade
📅 Wednesday, Monday
📊 Key Insights & Metrics
Symbol
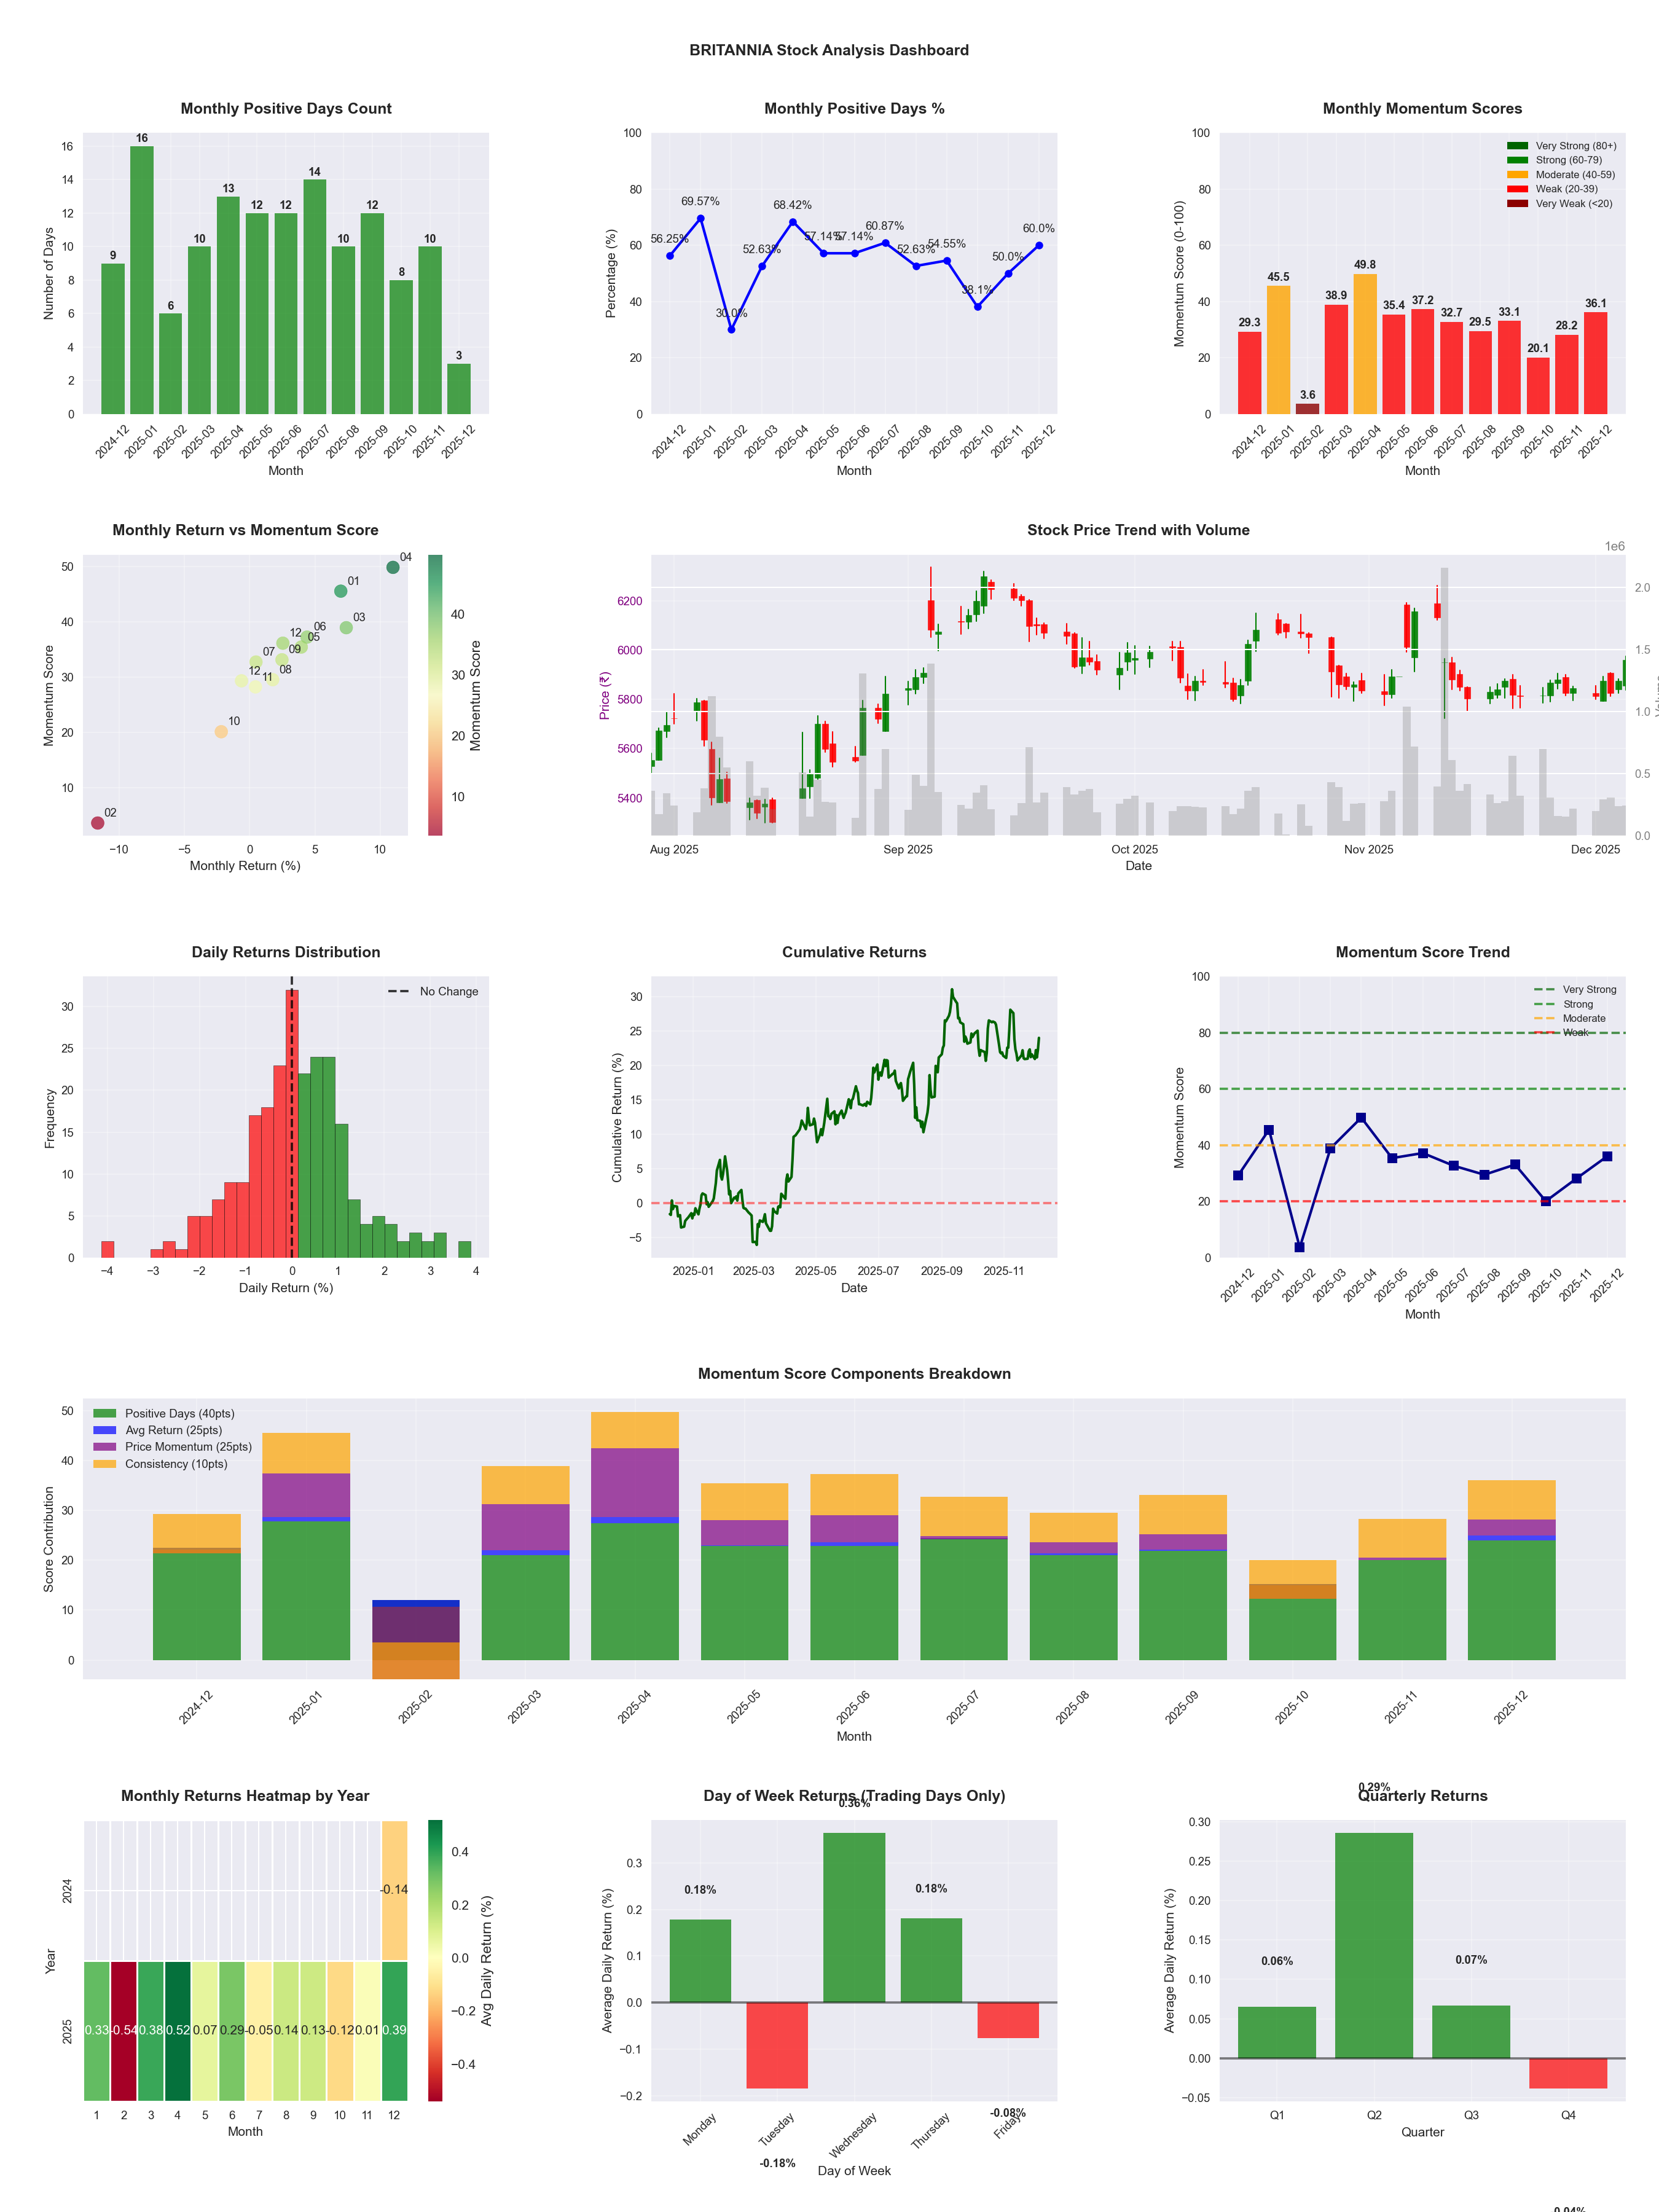
📈 BRITANNIA
Date
📅 2026-04-11
Volatility
🟢 1.24%
Win Rate
⚠️ 52.4%
Avg Daily Return
📈 +0.03%
Max Drawdown
📉 -13.93%
IBD RS Score
📊 55.2
Average
Market Rank
#221
Best Month
🏆 2026-04
Worst Month
📉 2026-03
Best Months to Trade
📅 Jun, Apr, Dec
Best Days to Trade
📅 Monday, Wednesday
📊 Key Insights & Metrics
Symbol
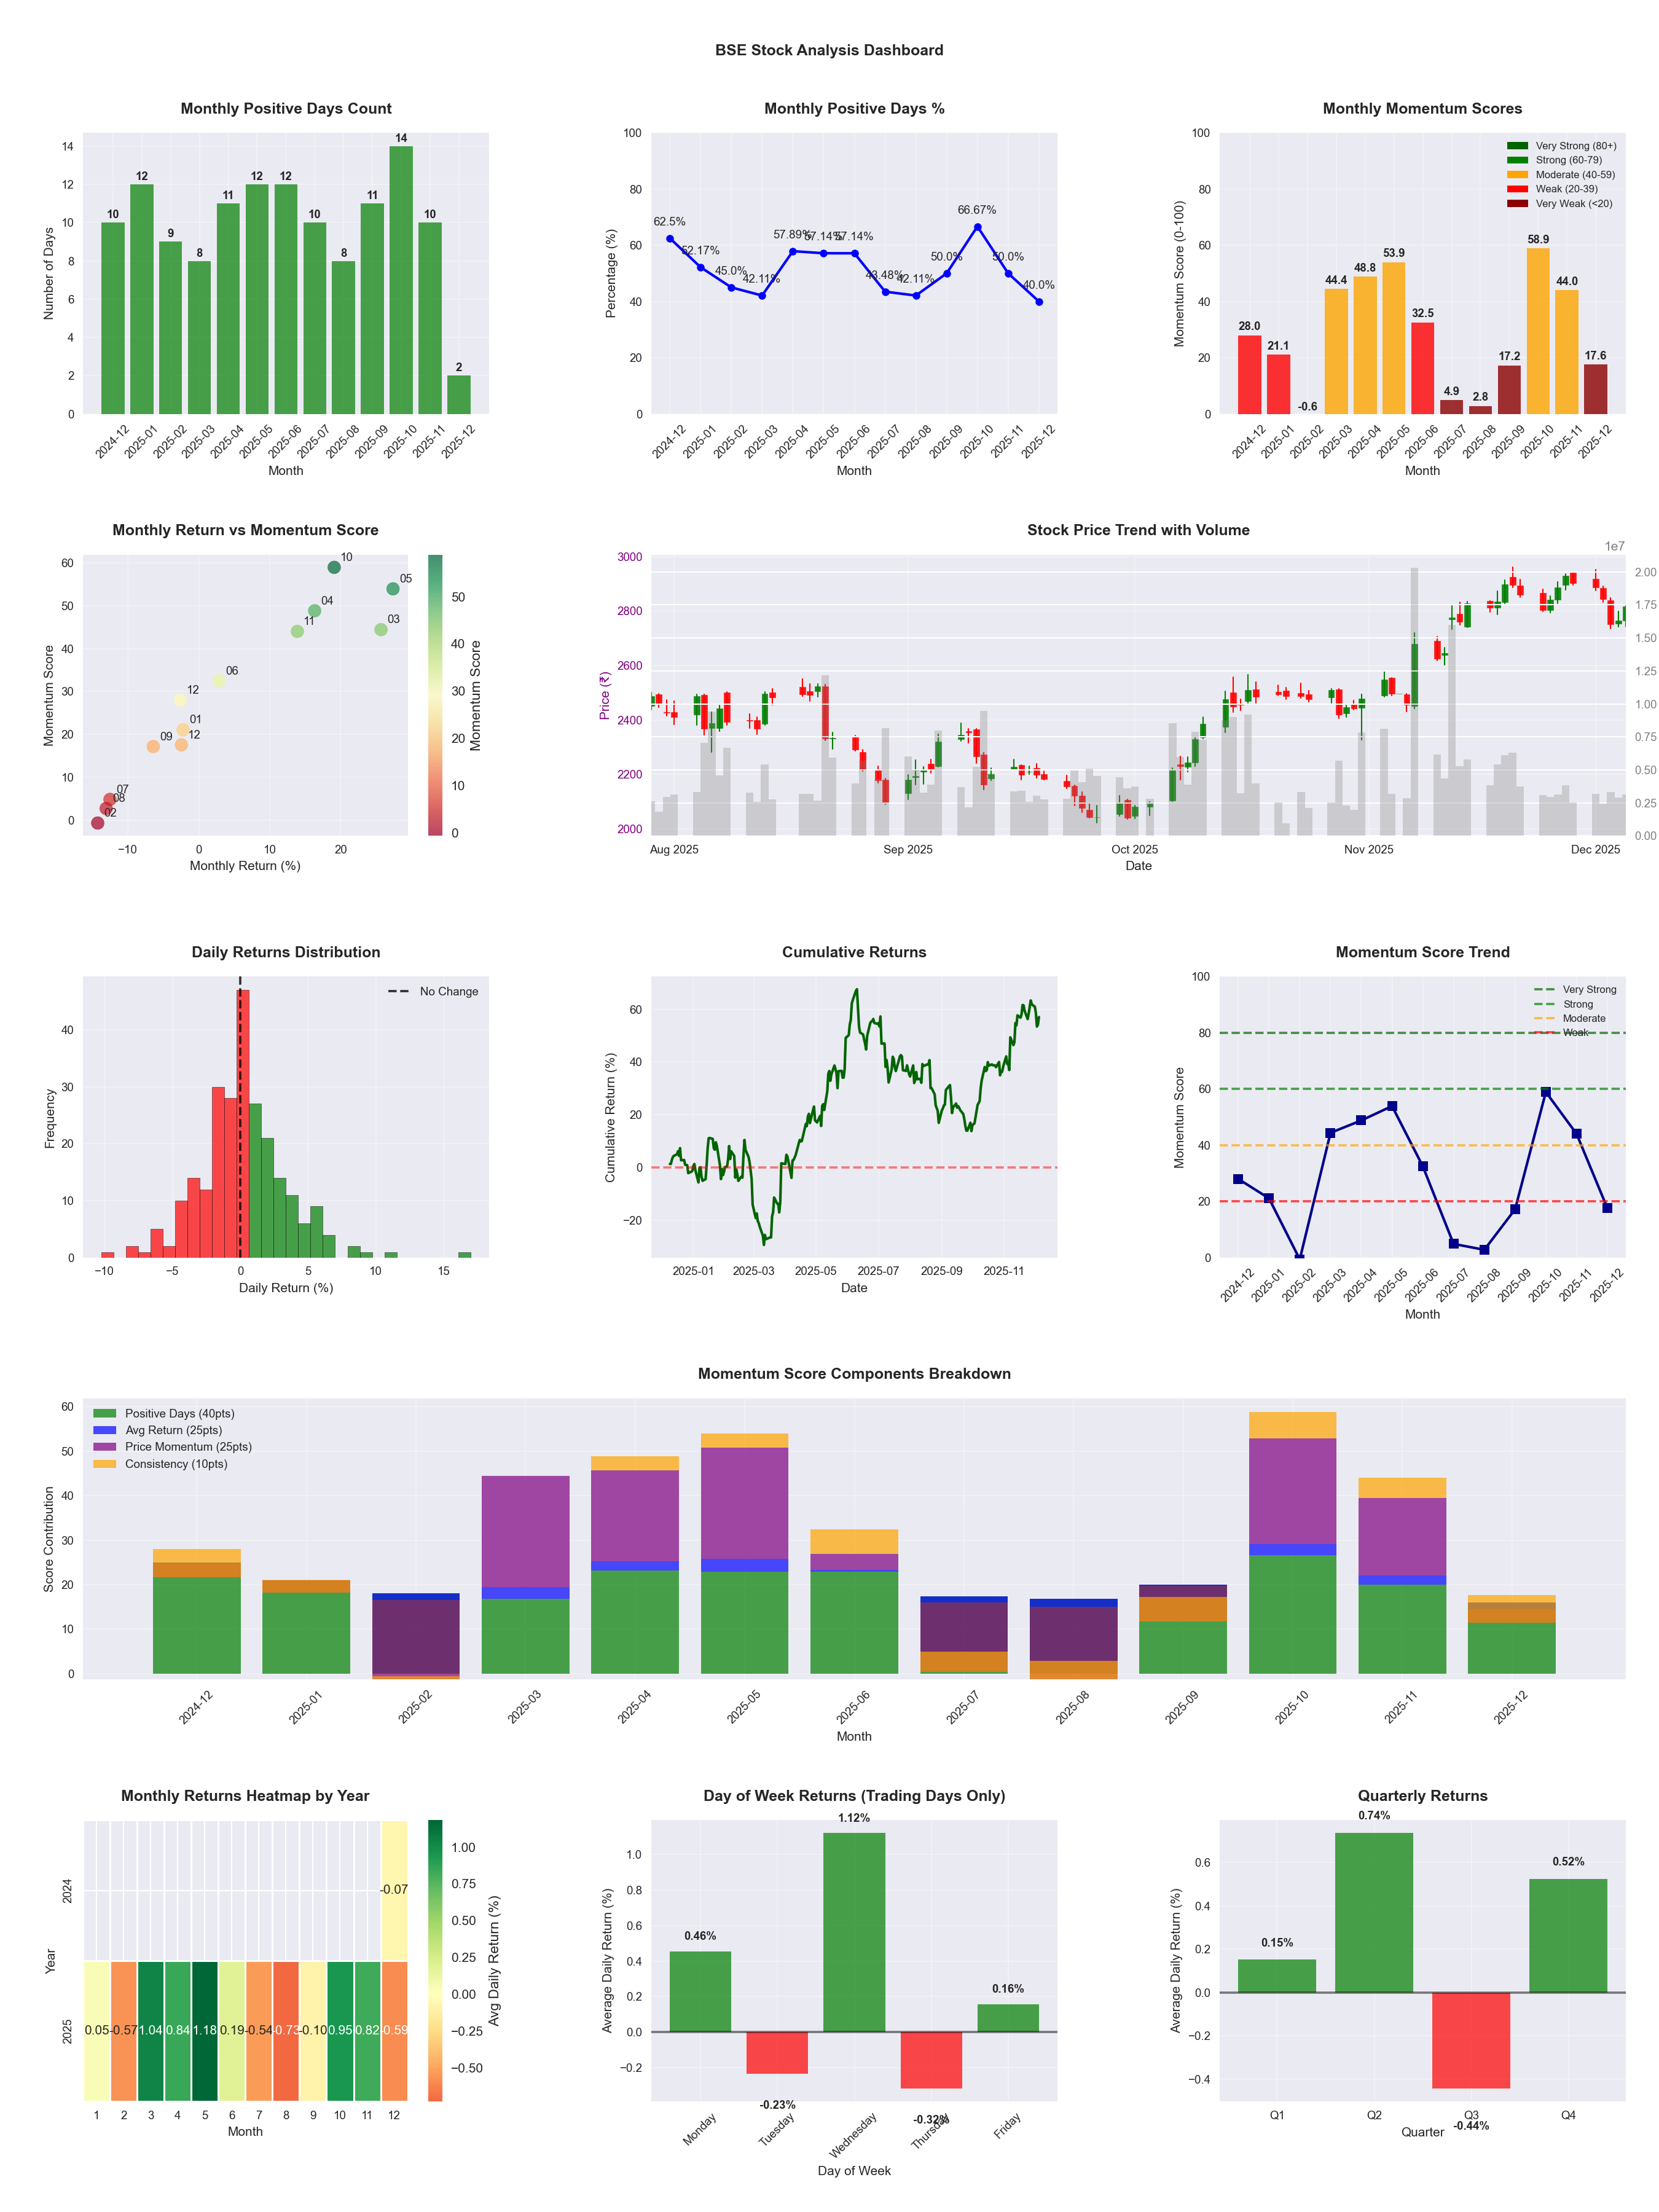
📈 BSE
Date
📅 2026-04-11
Volatility
🟡 2.74%
Risk Profile
⚠️ suitable for aggressive investors
Win Rate
⚠️ 52.0%
Avg Daily Return
📈 +0.26%
Max Drawdown
📉 -32.12%
IBD RS Score
📊 96.6
Leader
Market Rank
#17
Best Month
🏆 2025-10
Worst Month
📉 2025-08
Best Months to Trade
📅 Apr, May, Oct
Best Days to Trade
📅 Monday, Wednesday
📊 Key Insights & Metrics
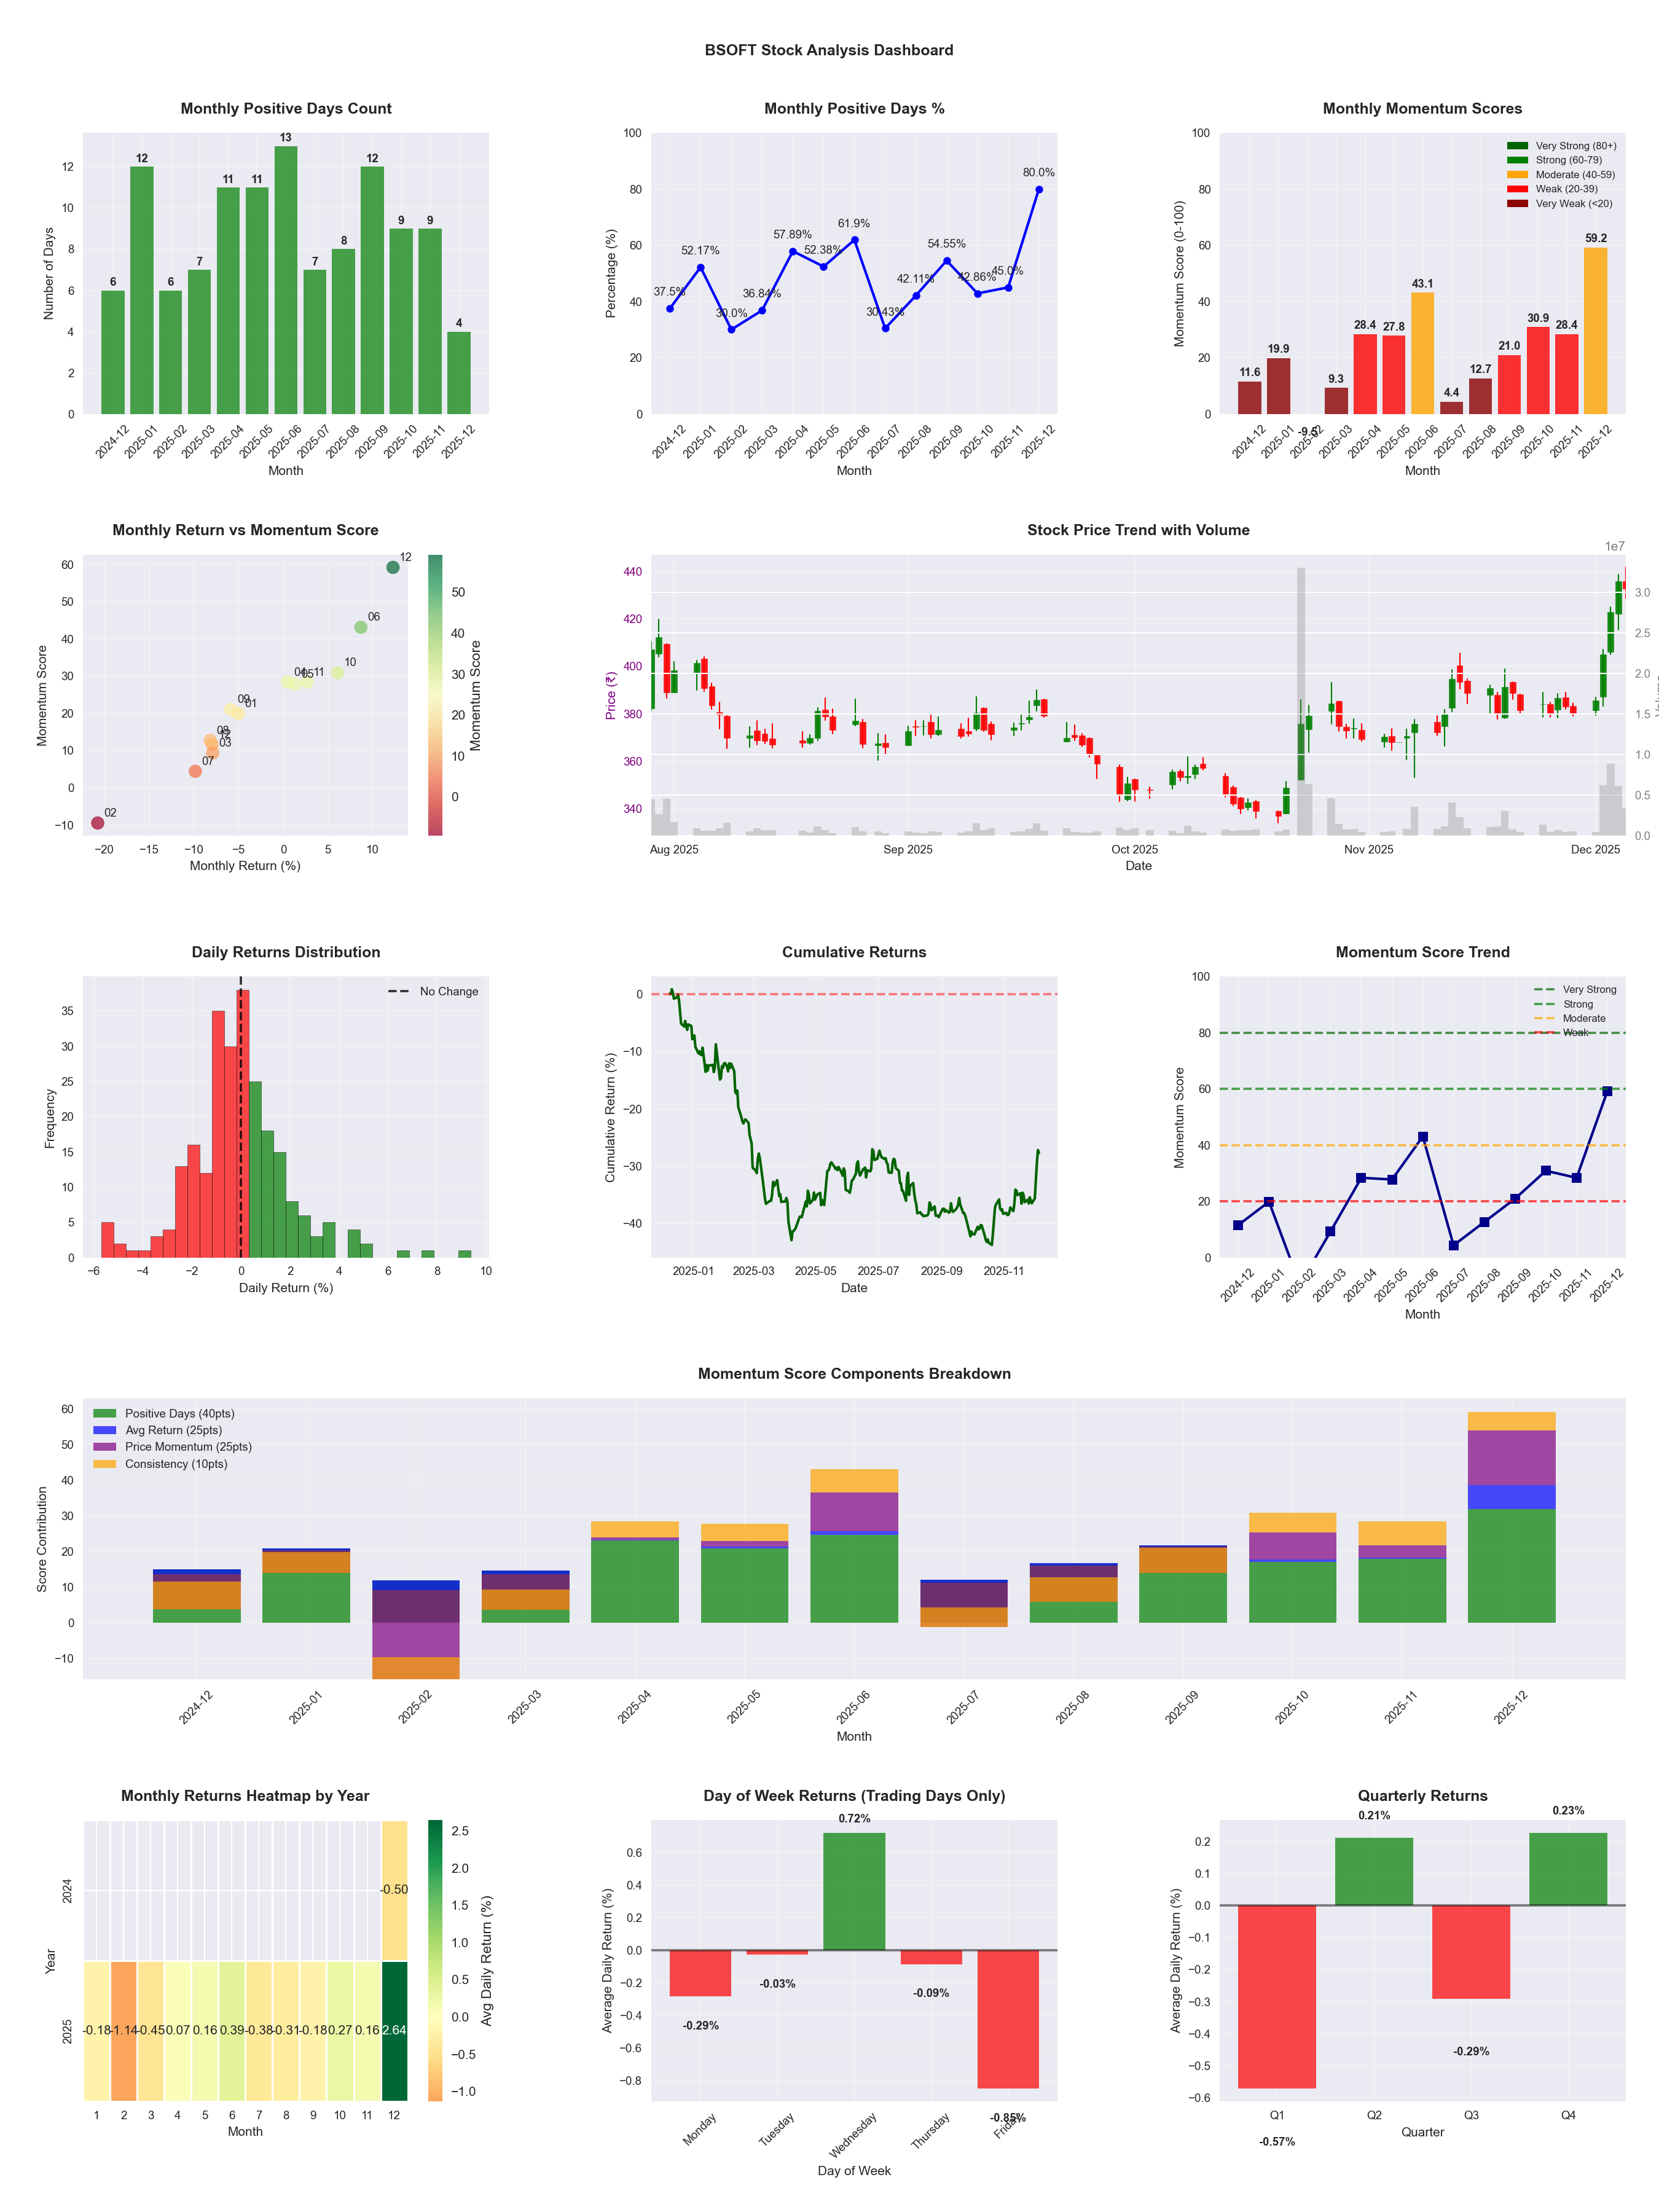
Symbol
📈 BSOFT
Date
📅 2026-04-11
Volatility
🟡 2.32%
Risk Profile
⚠️ suitable for aggressive investors
Win Rate
⚠️ 47.6%
Avg Daily Return
📈 +0.04%
Max Drawdown
📉 -28.56%
IBD RS Score
📊 46.0
Weak
Market Rank
#266
Best Month
🏆 2025-12
Best Months to Trade
📅 Apr, Dec, Jun
Best Days to Trade
📅 Wednesday, Tuesday
📊 Key Insights & Metrics
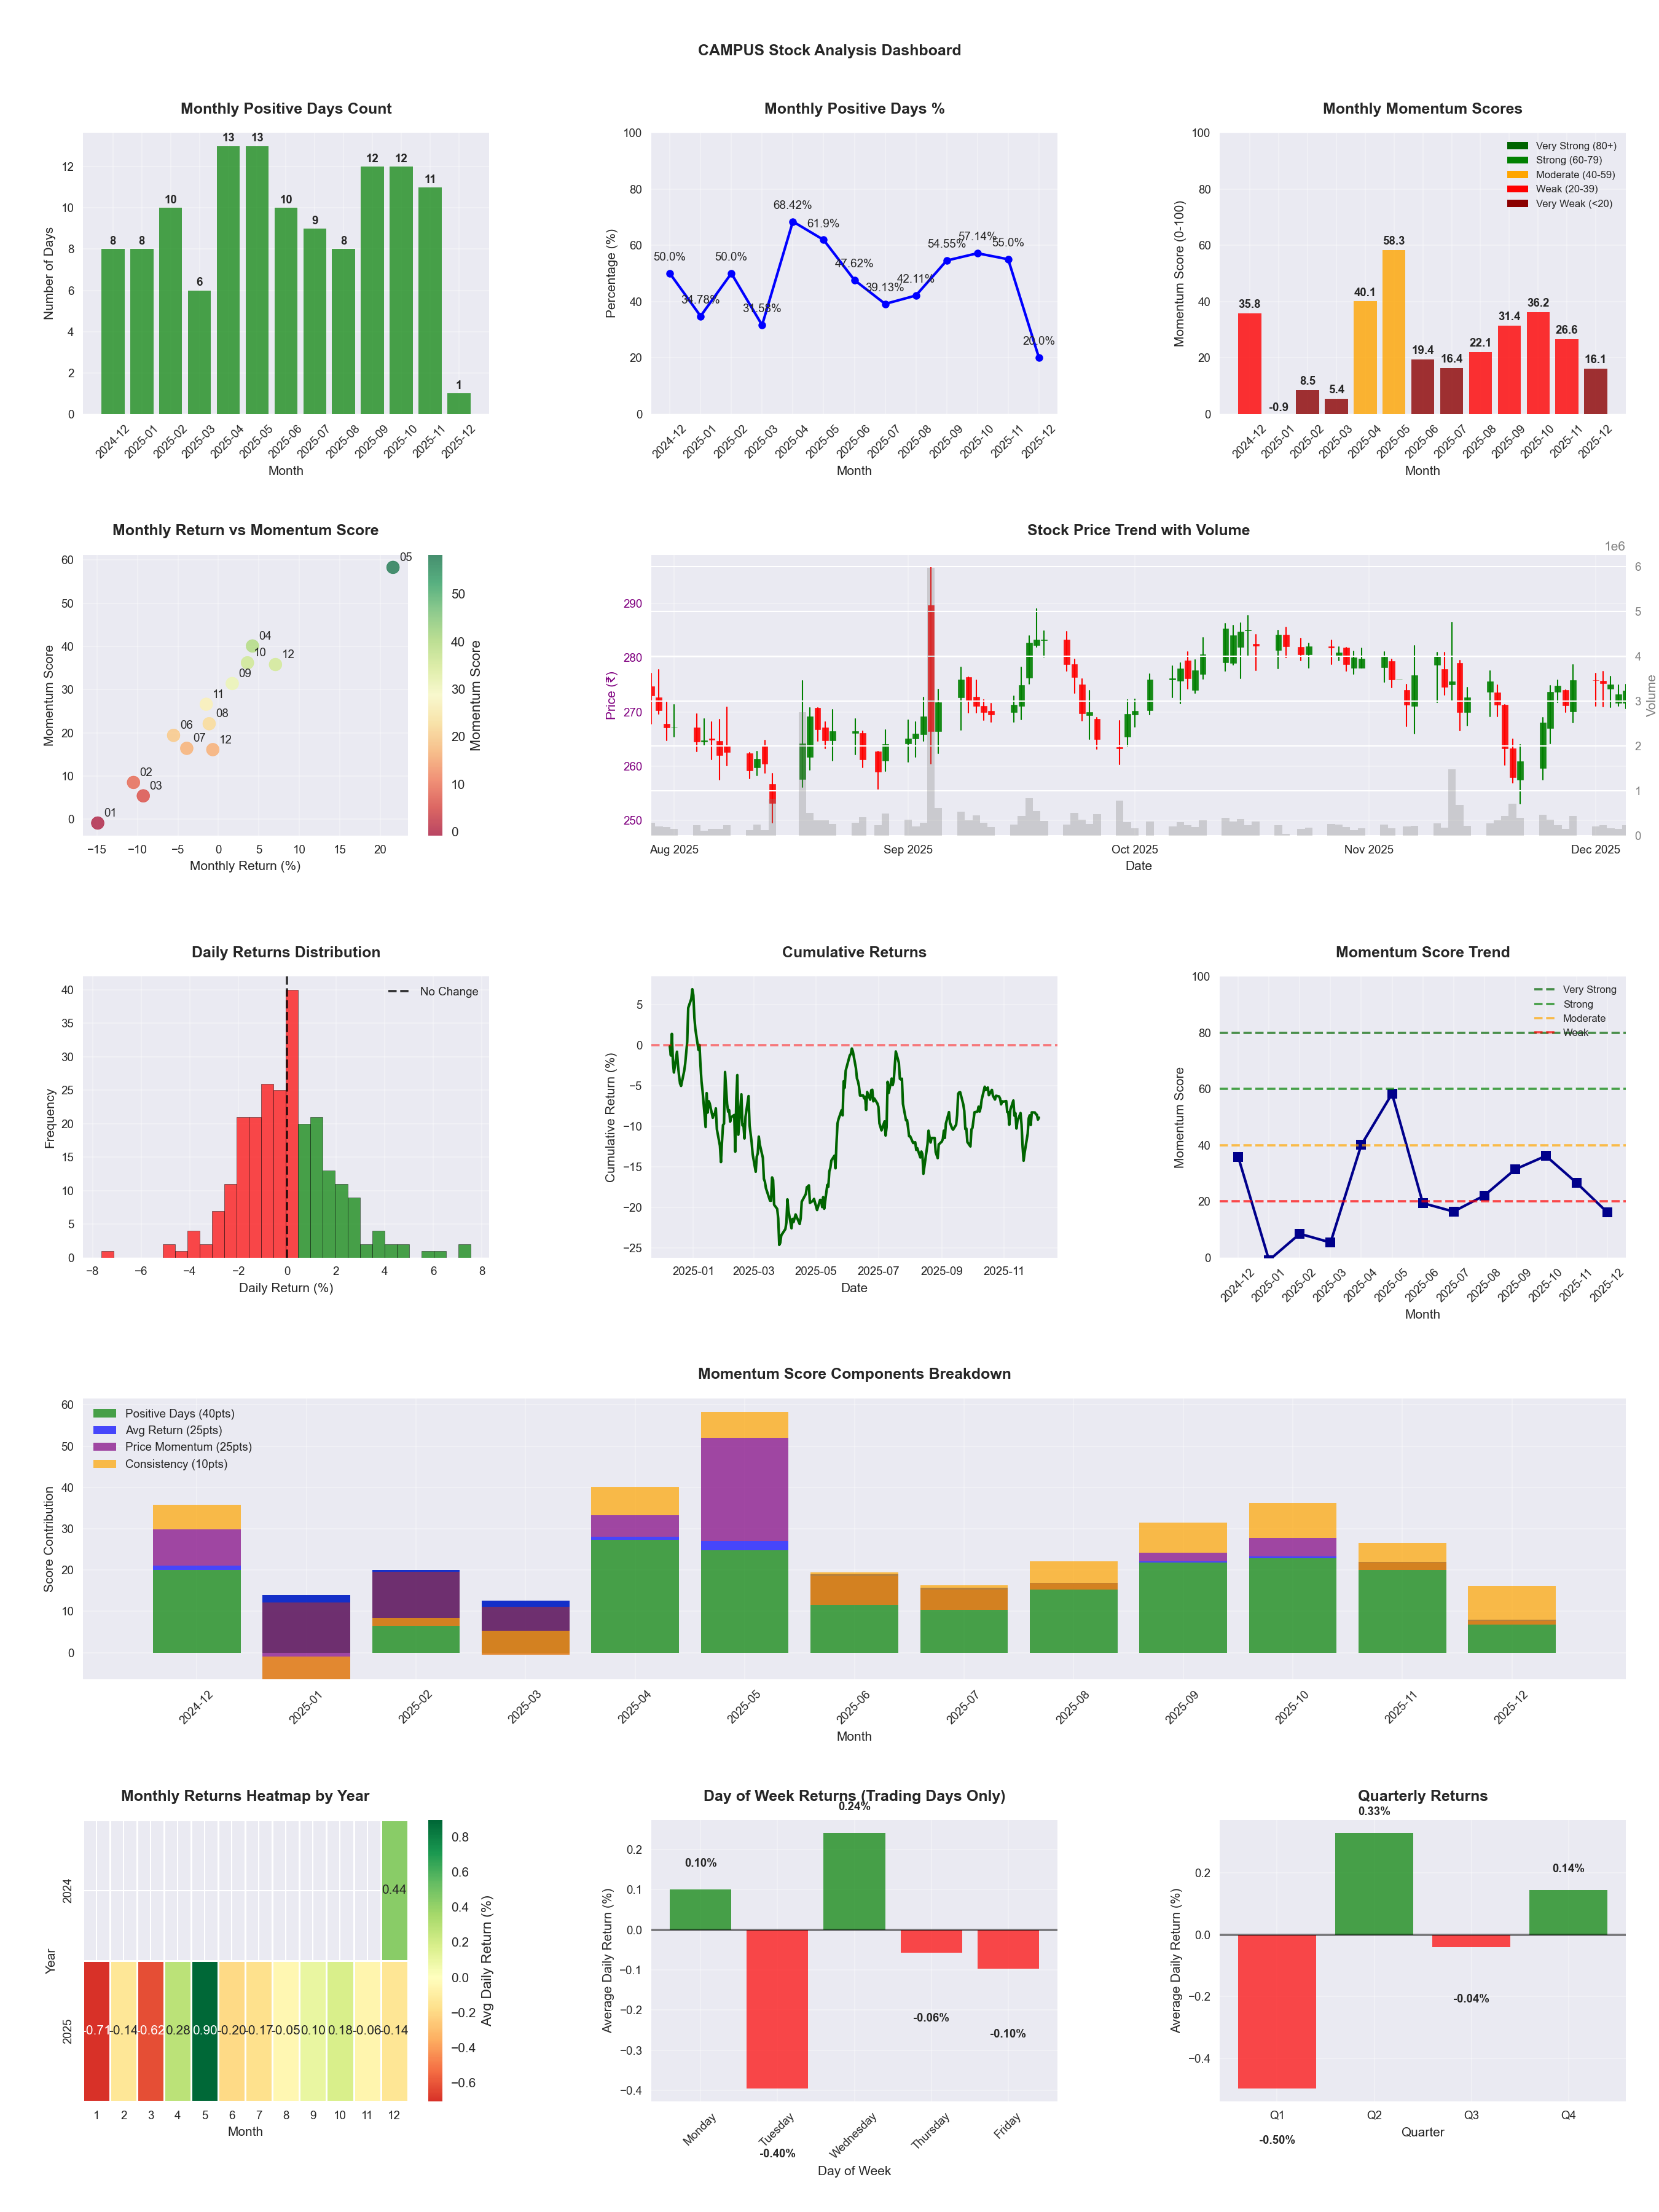
Symbol
📈 CAMPUS
Date
📅 2026-04-11
Volatility
🟡 1.68%
Win Rate
⚠️ 48.0%
Avg Daily Return
📈 +0.01%
Max Drawdown
📉 -26.95%
IBD RS Score
📊 40.2
Weak
Market Rank
#295
Best Month
🏆 2025-05
Best Months to Trade
📅 May, Apr, Oct
Best Days to Trade
📅 Wednesday, Monday
📊 Key Insights & Metrics
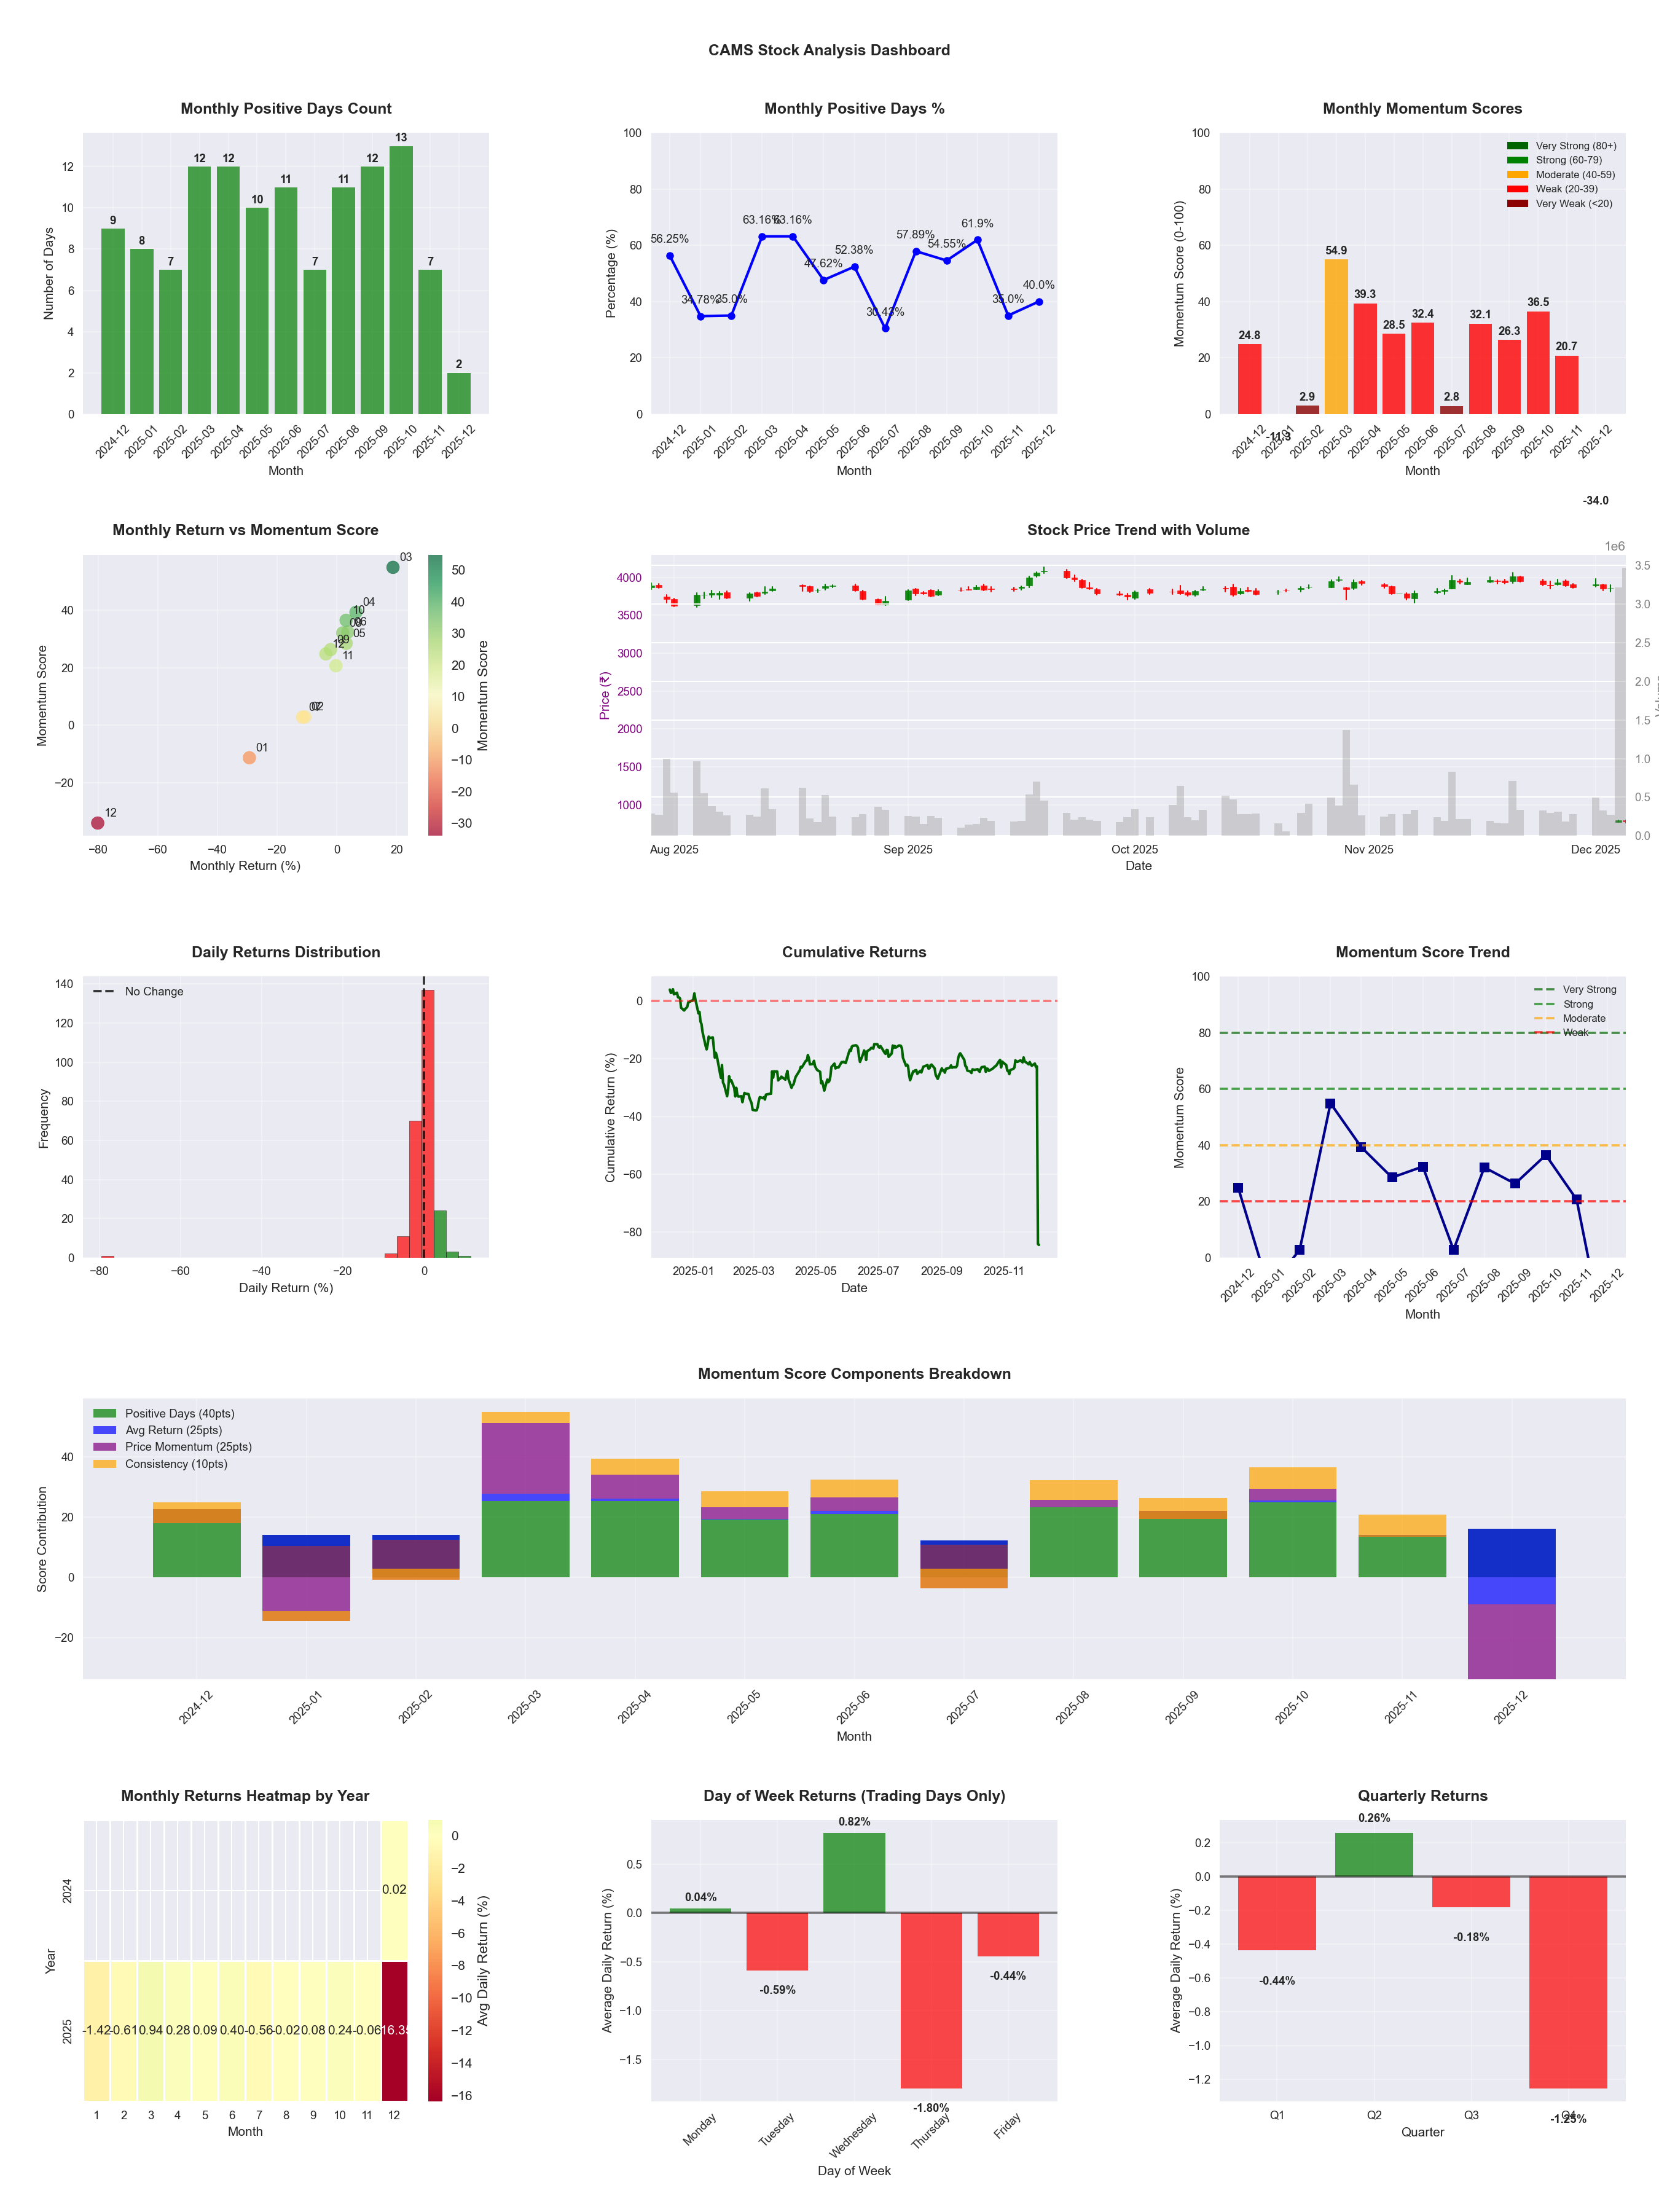
Symbol
📈 CAMS
Date
📅 2026-04-11
Volatility
🟡 1.86%
Win Rate
⚠️ 47.1%
Avg Daily Return
📈 +0.01%
Max Drawdown
📉 -26.32%
IBD RS Score
📊 48.7
Weak
Market Rank
#253
Best Month
🏆 2026-04
Worst Month
📉 2025-07
Best Months to Trade
📅 Apr, Jun, Oct
Best Days to Trade
📅 Wednesday, Monday
📊 Key Insights & Metrics
Symbol
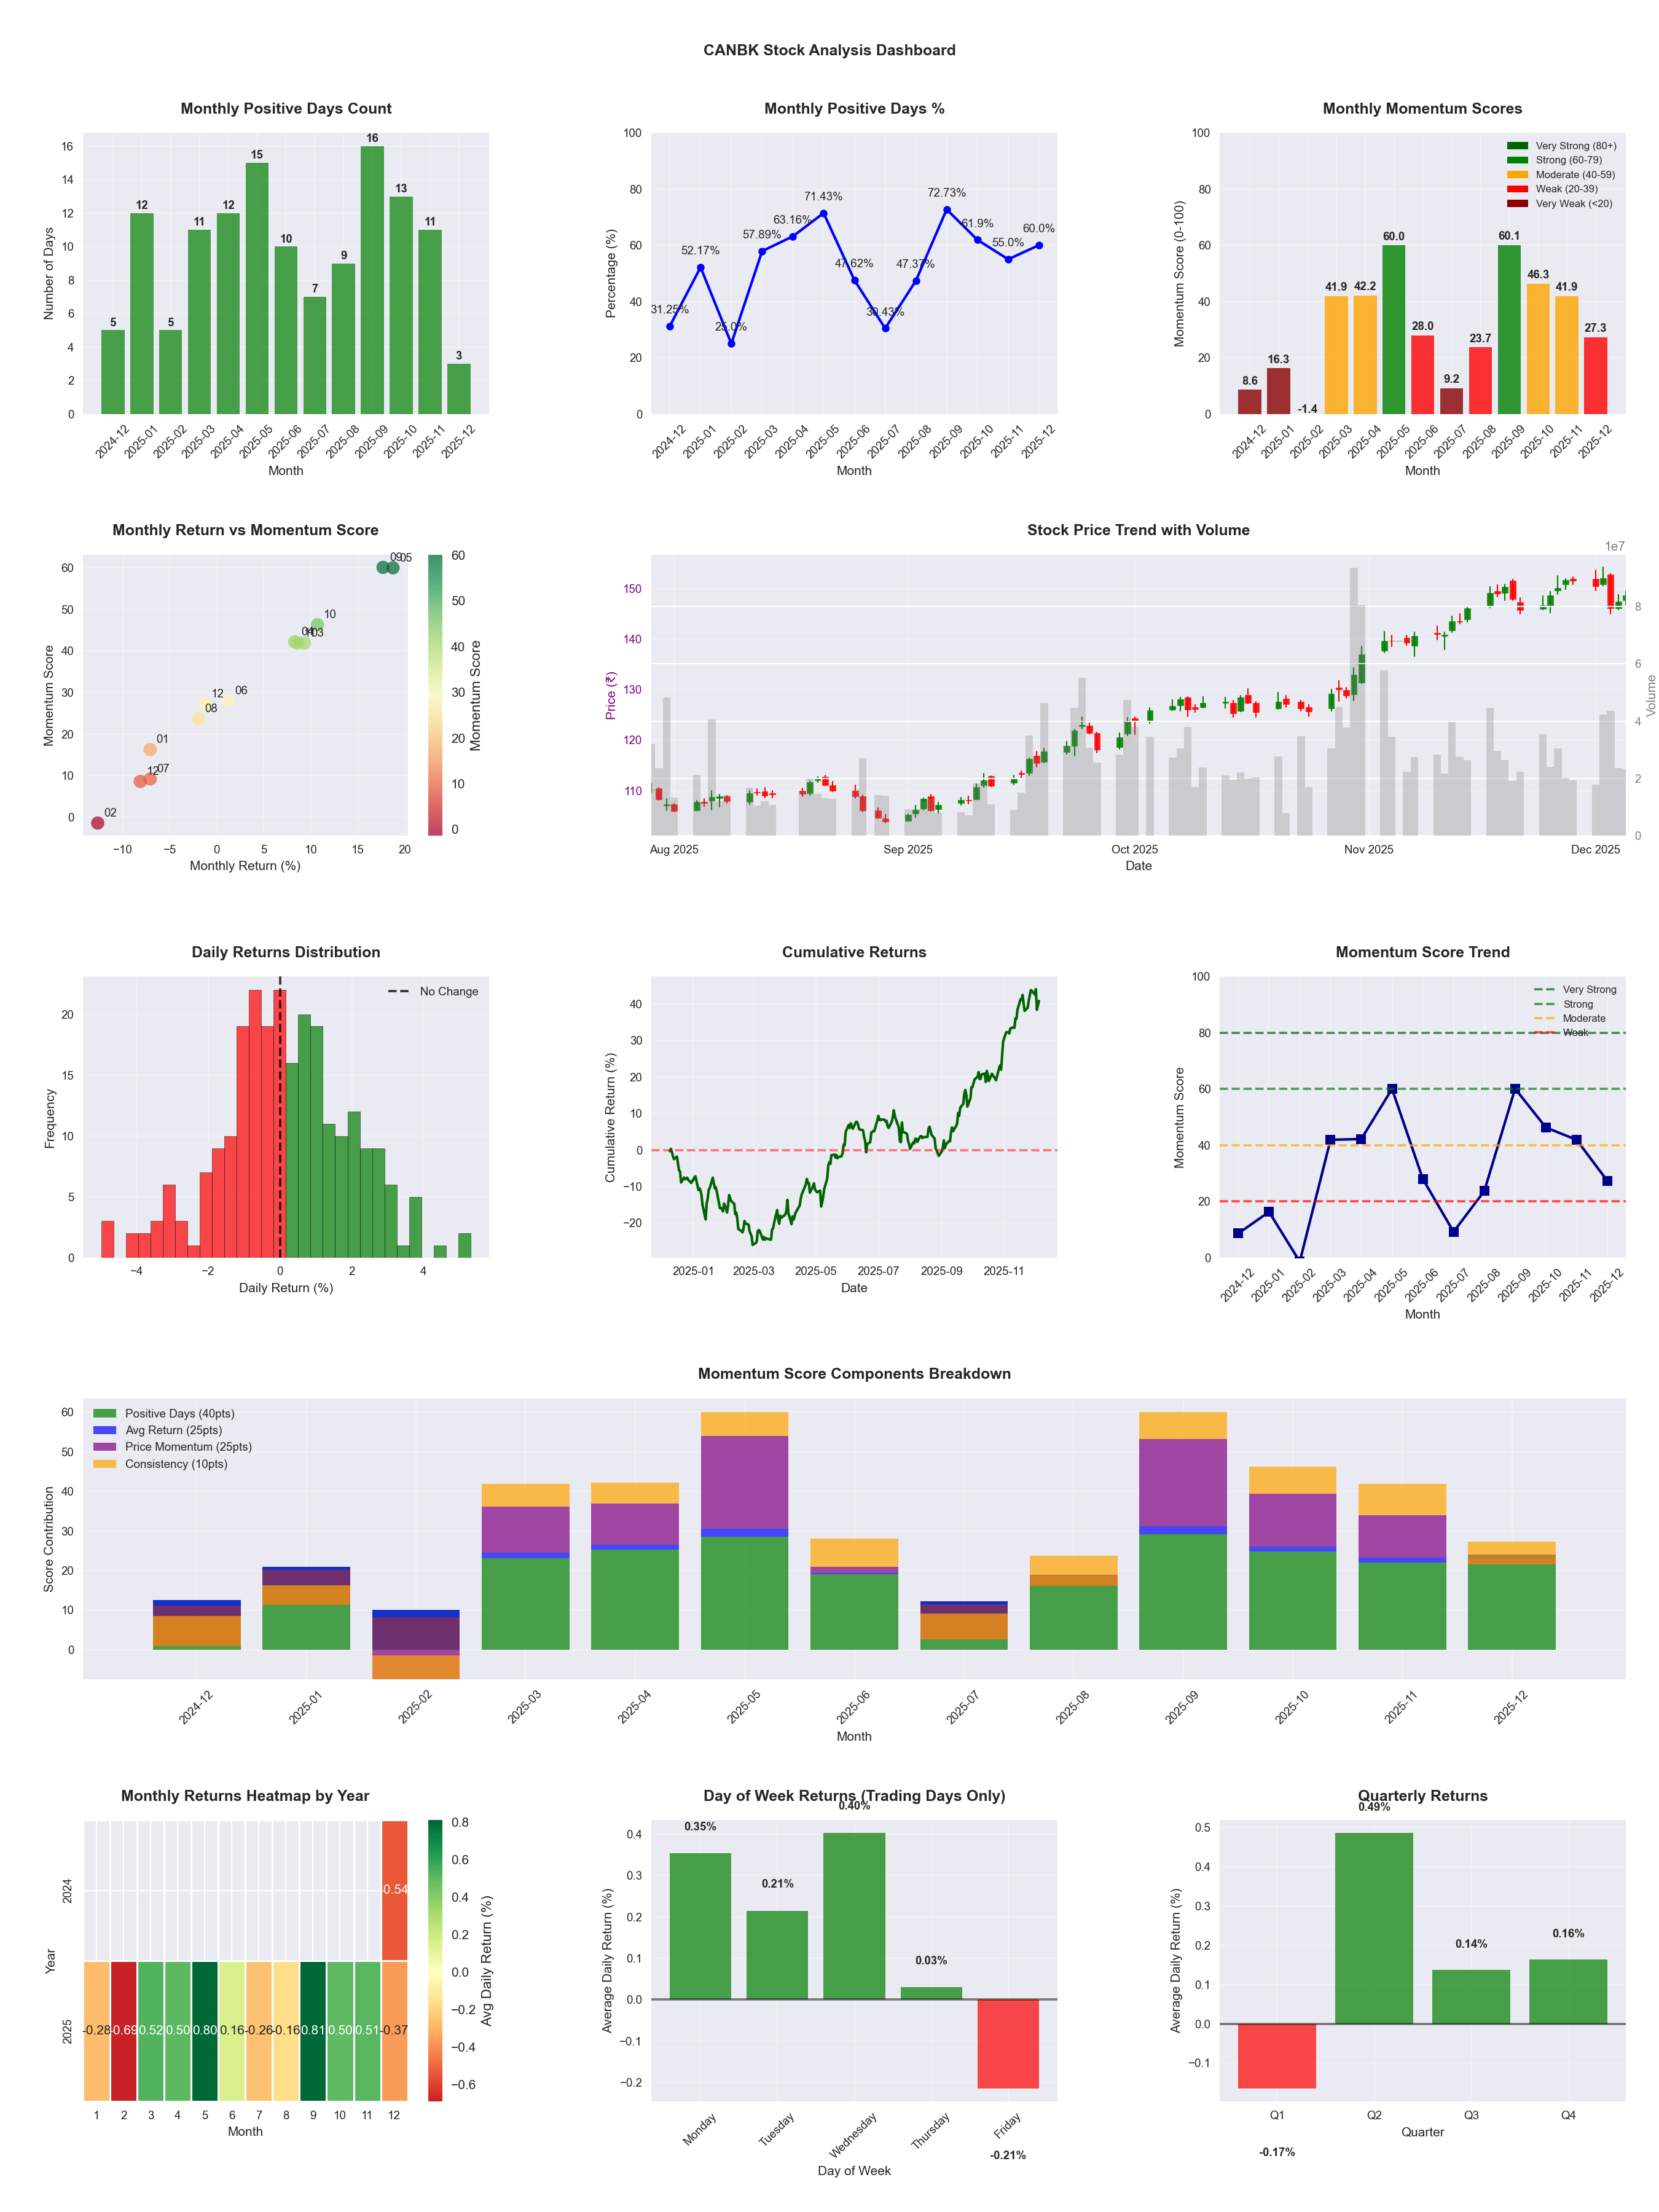
📈 CANBK
Date
📅 2026-04-11
Volatility
🟡 1.83%
Win Rate
⚠️ 53.2%
Avg Daily Return
📈 +0.21%
Max Drawdown
📉 -22.32%
IBD RS Score
📊 81.9
Strong
Market Rank
#89
Best Month
🏆 2025-09
Best Months to Trade
📅 Apr, Sep, May
Best Days to Trade
📅 Wednesday, Monday
📊 Key Insights & Metrics
Symbol
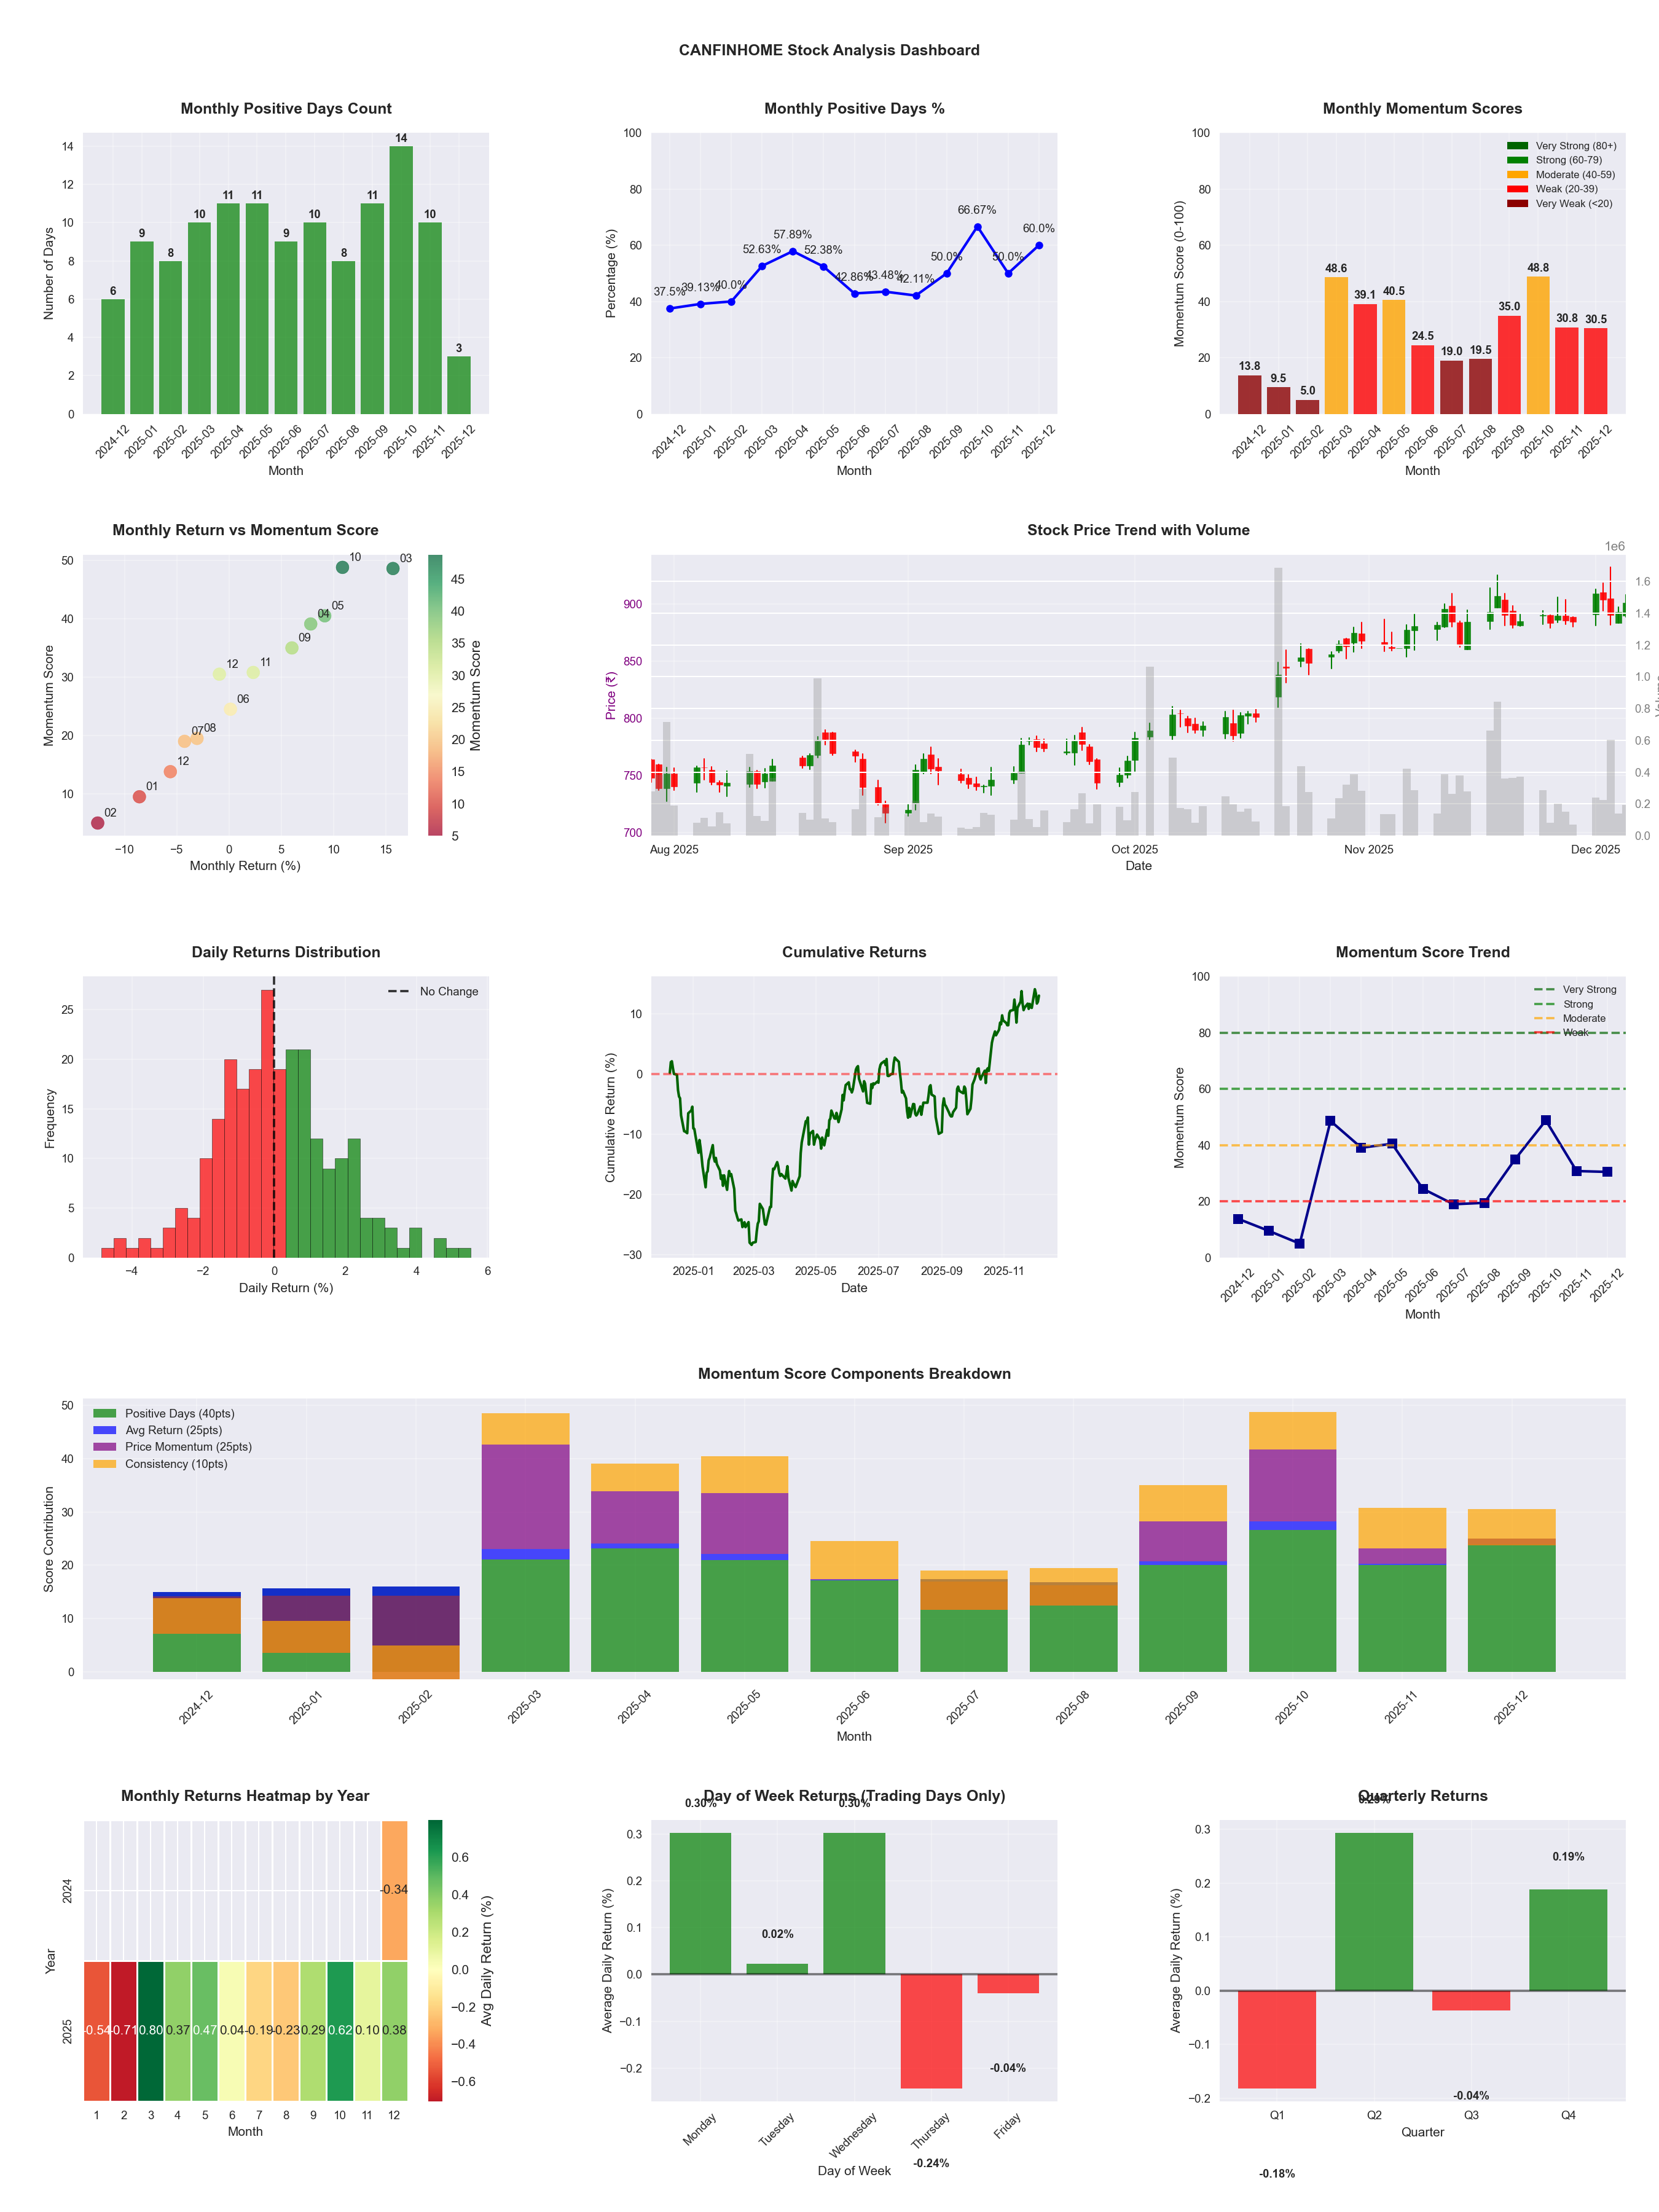
📈 CANFINHOME
Date
📅 2026-04-11
Volatility
🟡 1.69%
Win Rate
⚠️ 52.4%
Avg Daily Return
📈 +0.12%
Max Drawdown
📉 -16.64%
IBD RS Score
📊 71.0
Strong
Market Rank
#143
Best Month
🏆 2025-10
Worst Month
📉 2026-02
Best Months to Trade
📅 Apr, Oct, May
Best Days to Trade
📅 Monday, Wednesday
📊 Key Insights & Metrics
Symbol
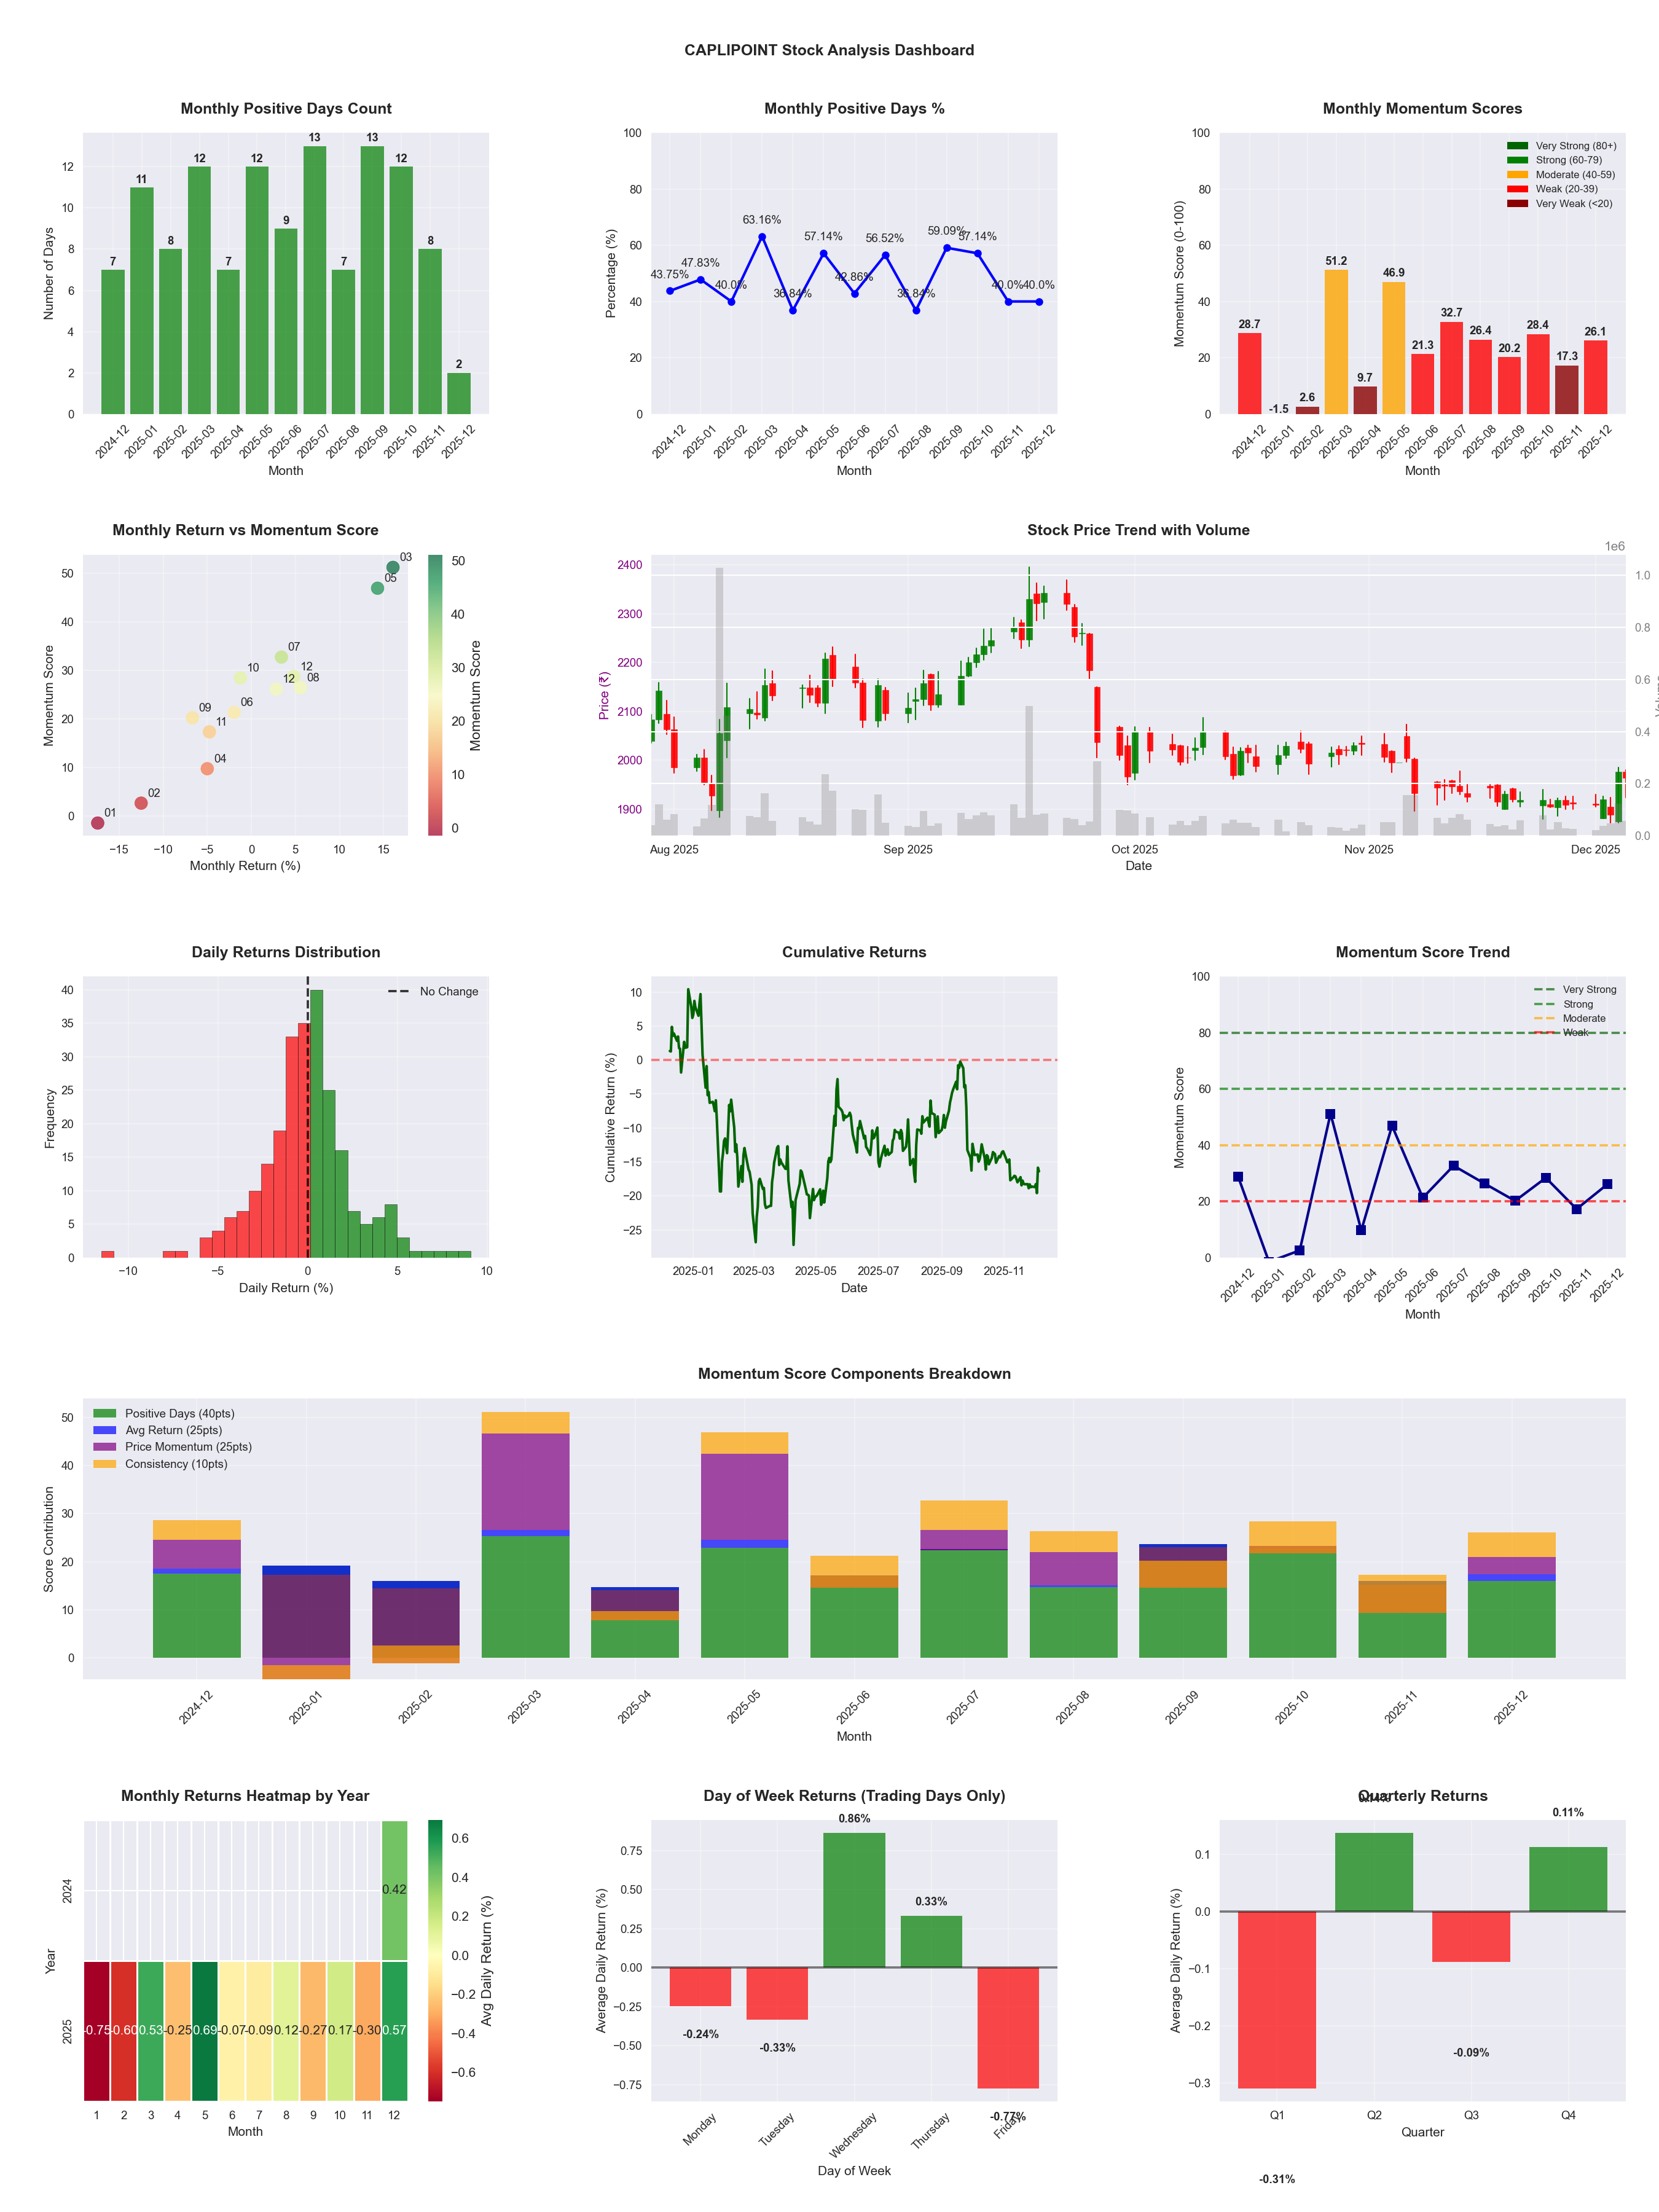
📈 CAPLIPOINT
Date
📅 2026-04-11
Volatility
🟡 2.02%
Risk Profile
⚠️ suitable for aggressive investors
Win Rate
⚠️ 47.6%
Avg Daily Return
📉 -0.02%
Max Drawdown
📉 -35.77%
IBD RS Score
📊 34.9
Weak
Market Rank
#321
Best Month
🏆 2026-04
Worst Month
📉 2026-03
Best Months to Trade
📅 Apr, May, Oct
Best Days to Trade
📅 Wednesday, Monday
📊 Key Insights & Metrics
Symbol
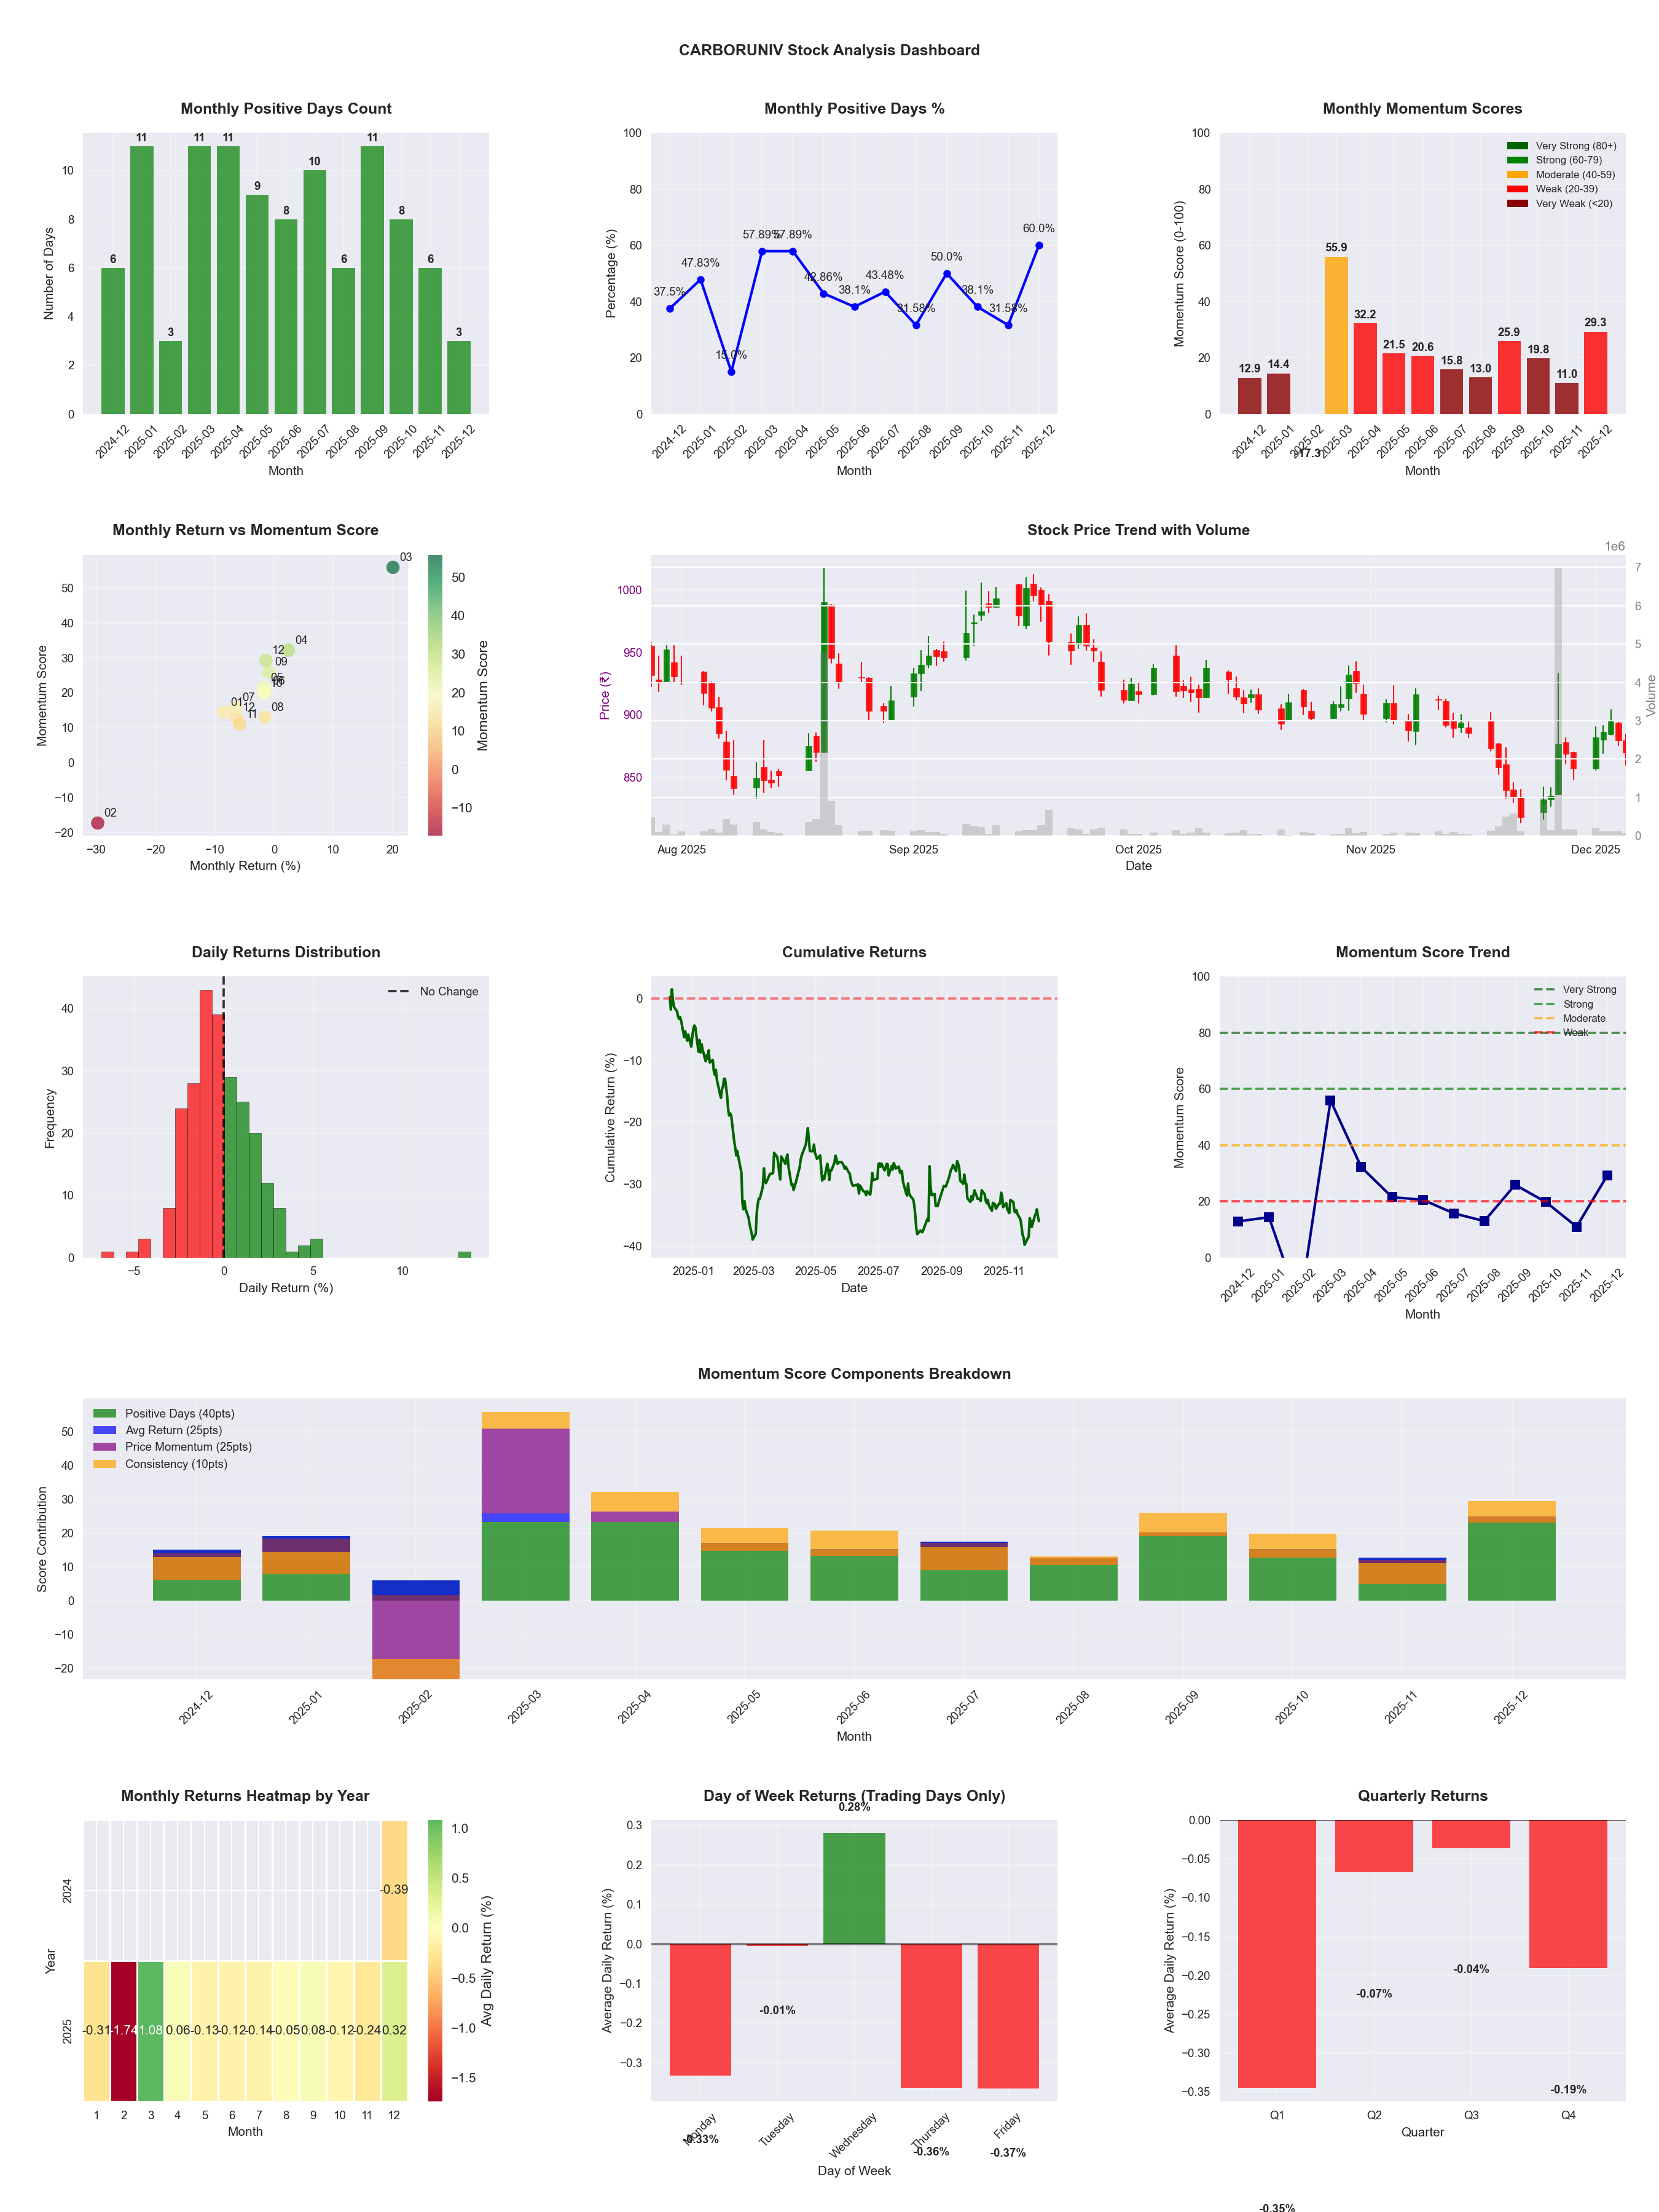
📈 CARBORUNIV
Date
📅 2026-04-11
Volatility
🟡 2.03%
Risk Profile
⚠️ suitable for aggressive investors
Win Rate
⚠️ 42.9%
Avg Daily Return
📉 -0.00%
Max Drawdown
📉 -30.18%
IBD RS Score
📊 62.3
Average
Market Rank
#186
Best Month
🏆 2026-04
Worst Month
📉 2025-11
Best Months to Trade
📅 Apr, Feb, Sep
Best Days to Trade
📅 Wednesday, Tuesday
📊 Key Insights & Metrics
Symbol
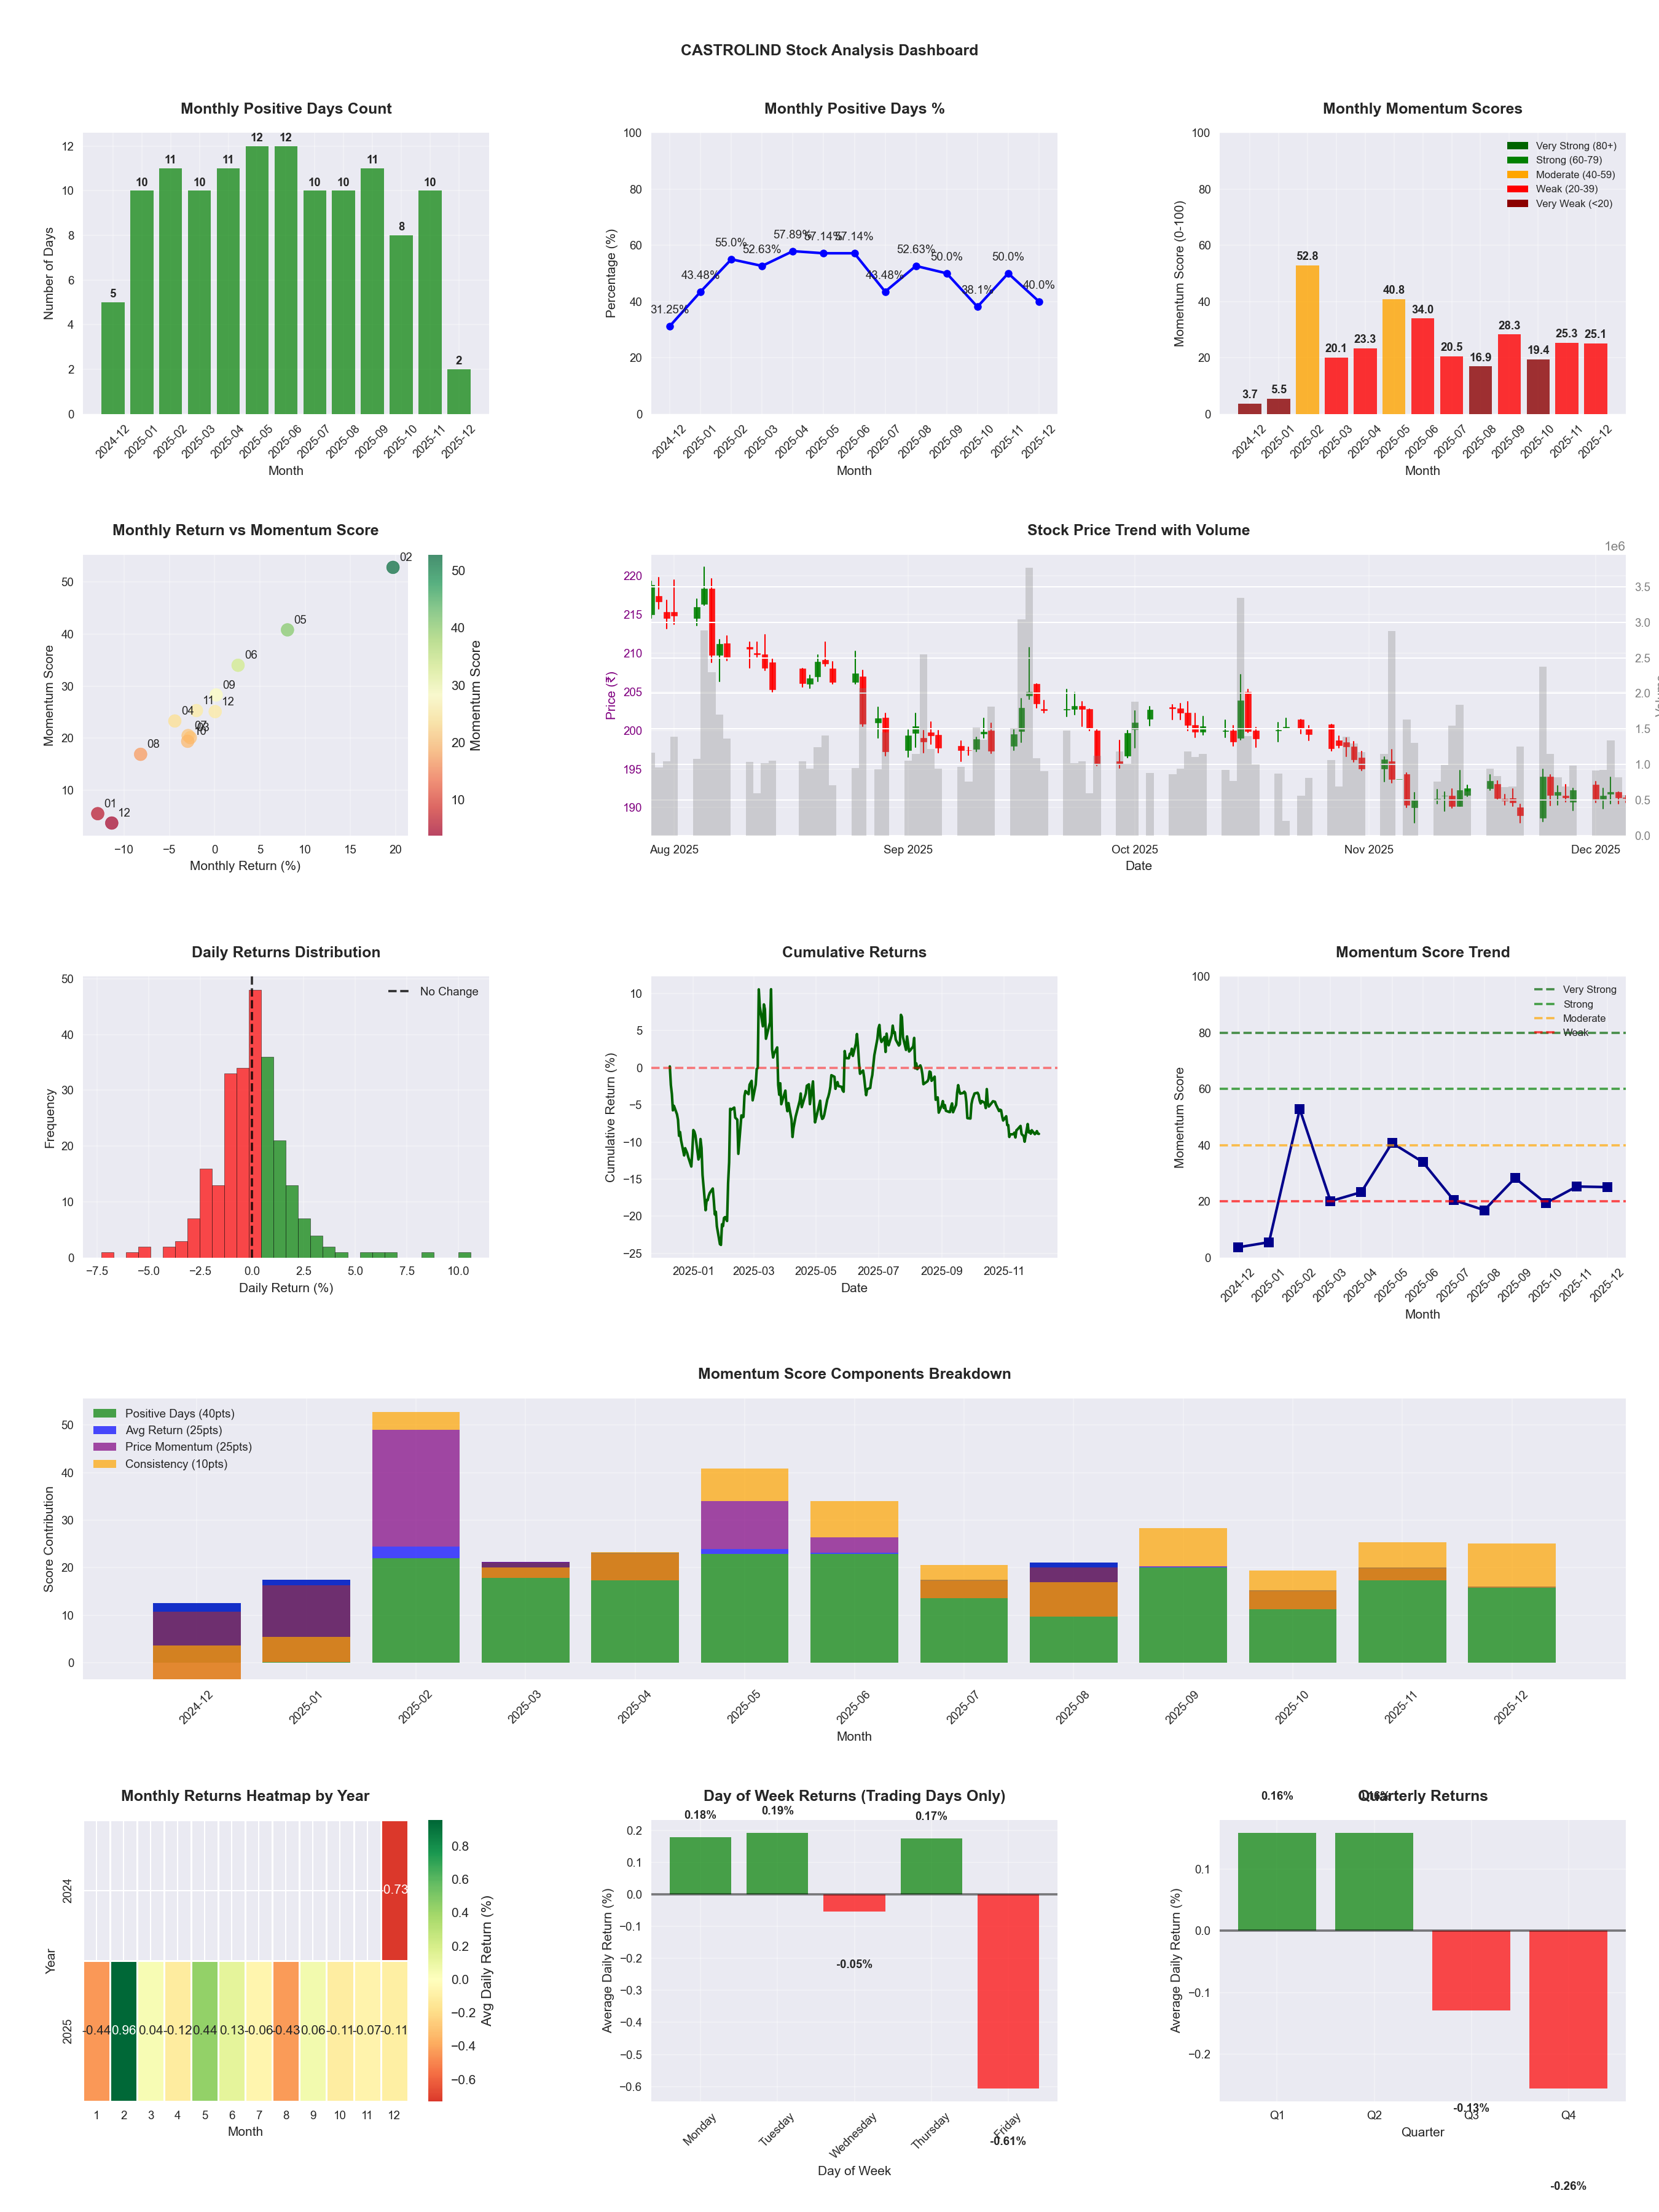
📈 CASTROLIND
Date
📅 2026-04-11
Volatility
🟢 1.20%
Win Rate
⚠️ 48.4%
Avg Daily Return
📉 -0.02%
Max Drawdown
📉 -20.62%
IBD RS Score
📊 45.6
Weak
Market Rank
#268
Best Month
🏆 2025-05
Worst Month
📉 2025-08
Best Months to Trade
📅 May, Apr, Jun
Best Days to Trade
📅 Monday, Wednesday
📊 Key Insights & Metrics
Symbol
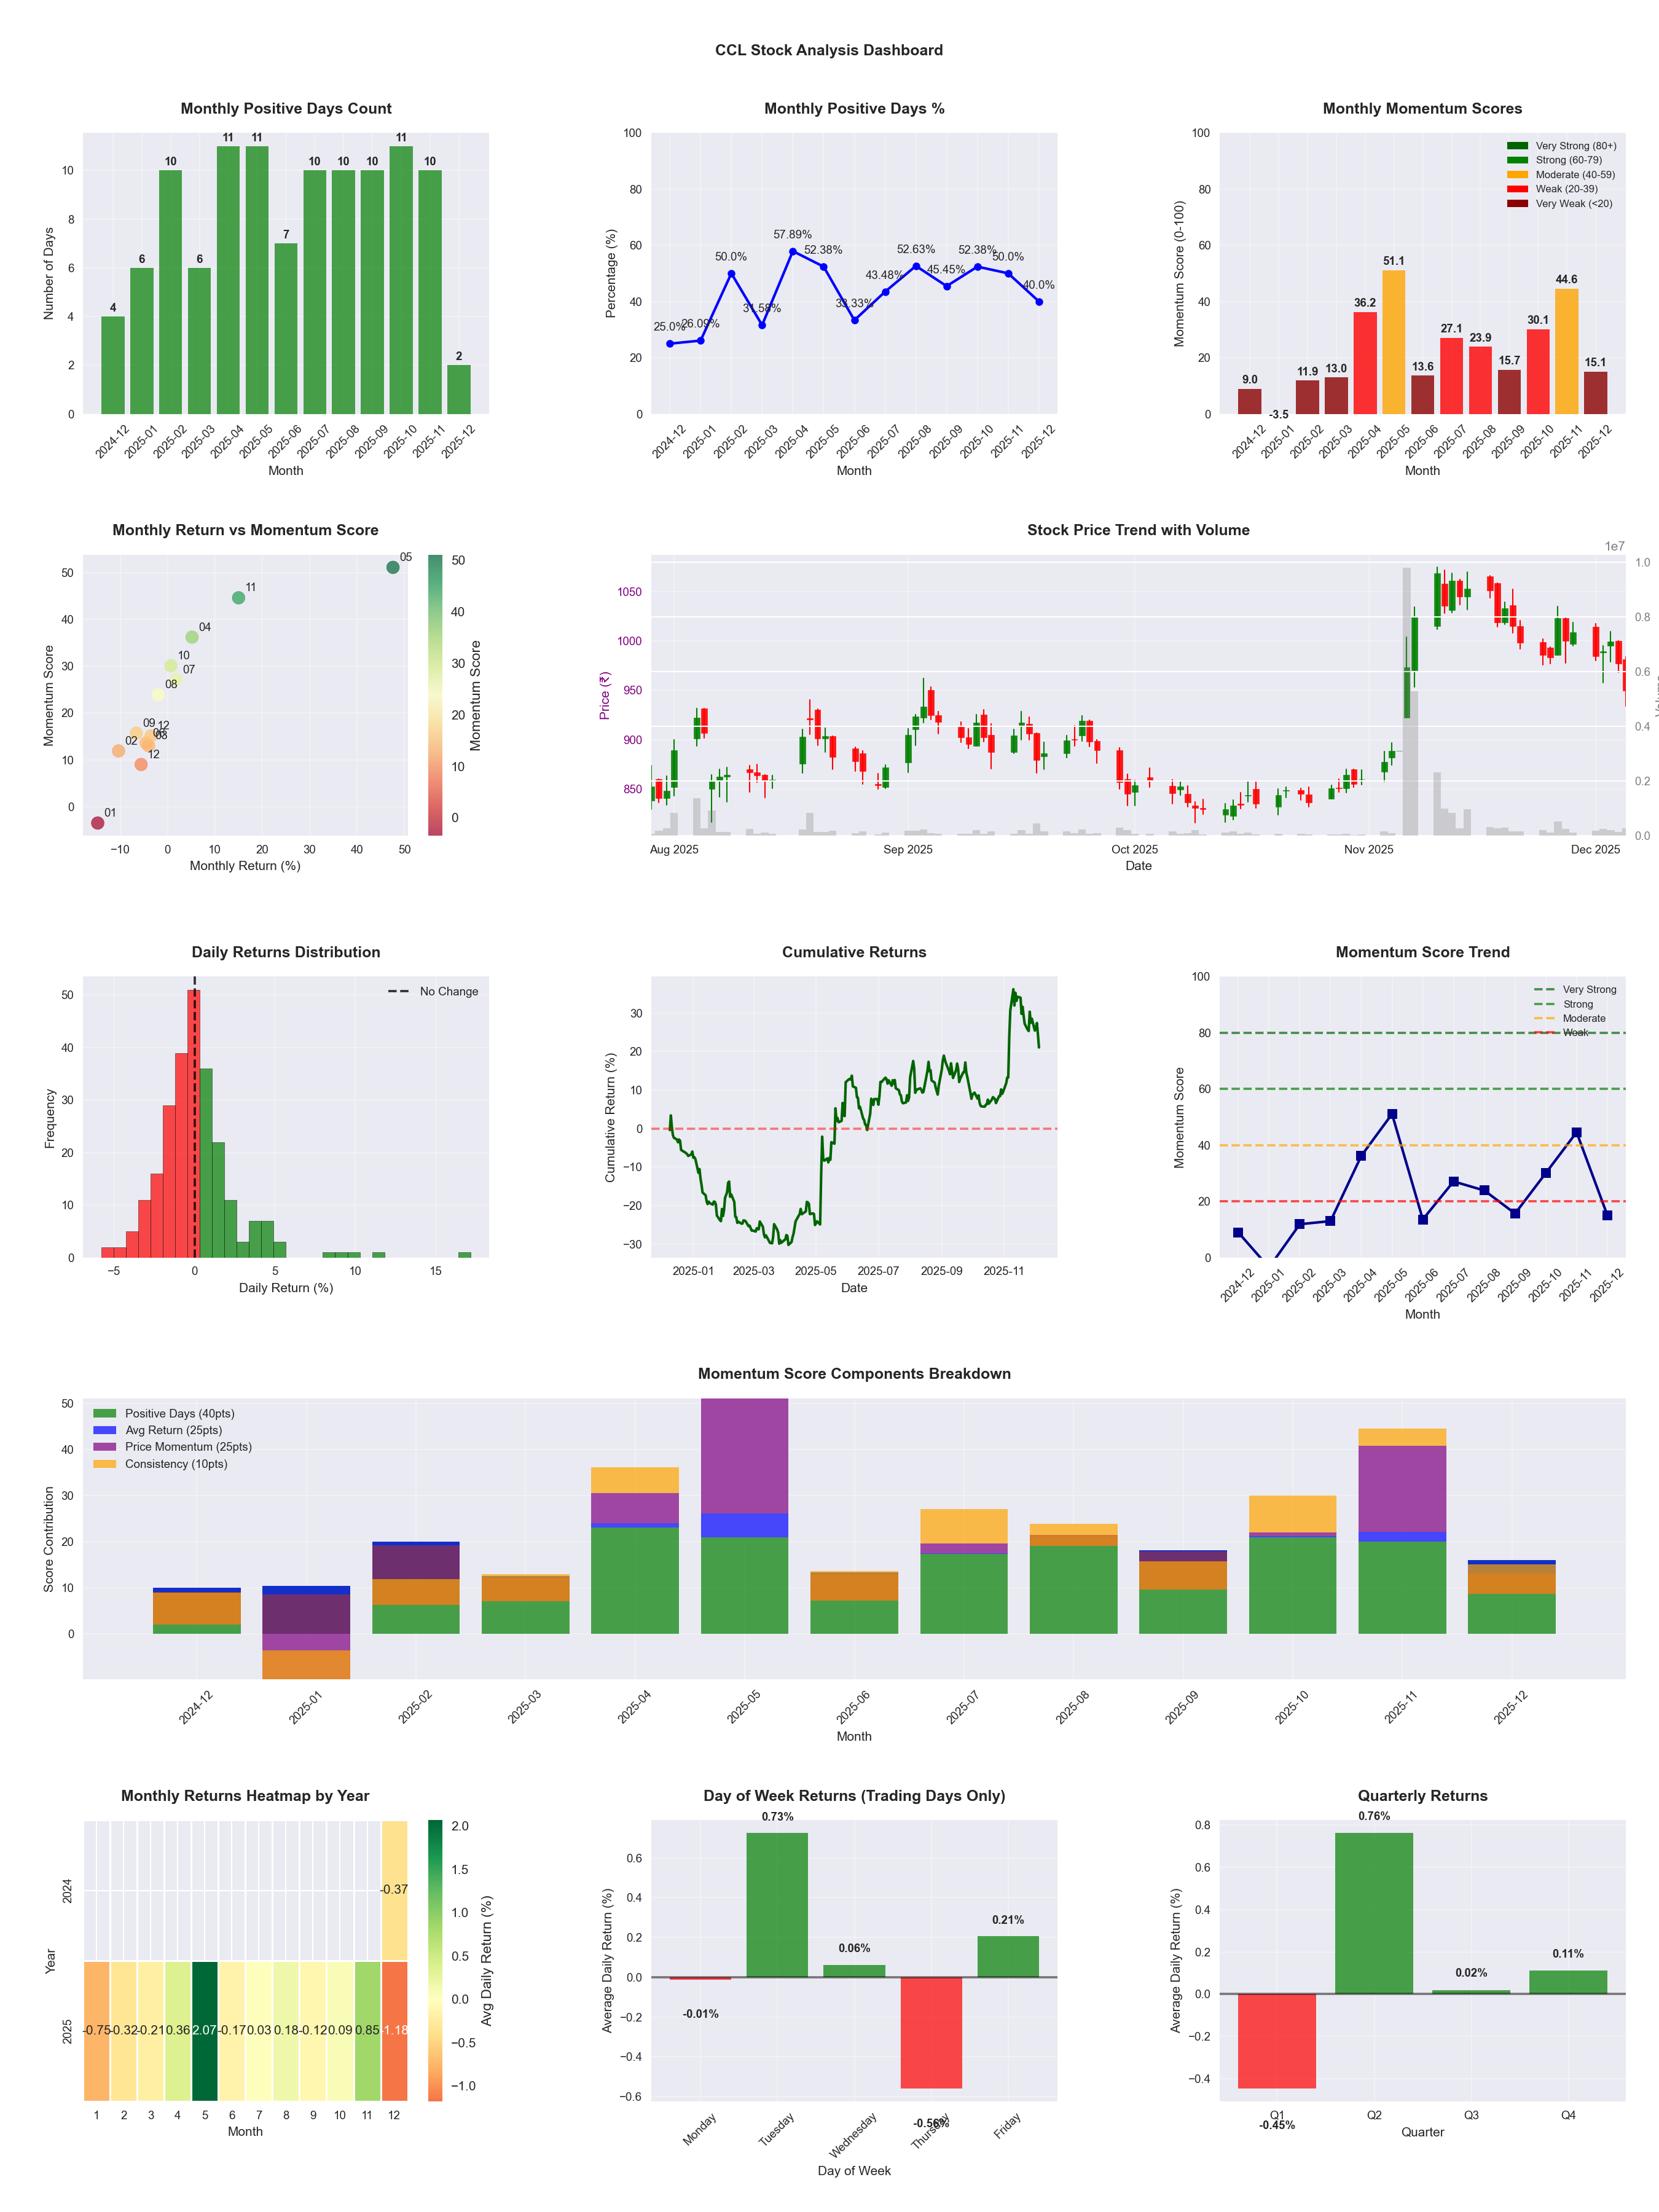
📈 CCL
Date
📅 2026-04-11
Volatility
🟡 2.57%
Risk Profile
⚠️ suitable for aggressive investors
Win Rate
⚠️ 46.3%
Avg Daily Return
📈 +0.27%
Max Drawdown
📉 -14.80%
IBD RS Score
📊 95.3
Leader
Market Rank
#23
Best Month
🏆 2025-05
Worst Month
📉 2025-12
Best Months to Trade
📅 May, Nov, Feb
Best Days to Trade
📅 Tuesday, Monday
📊 Key Insights & Metrics
Symbol
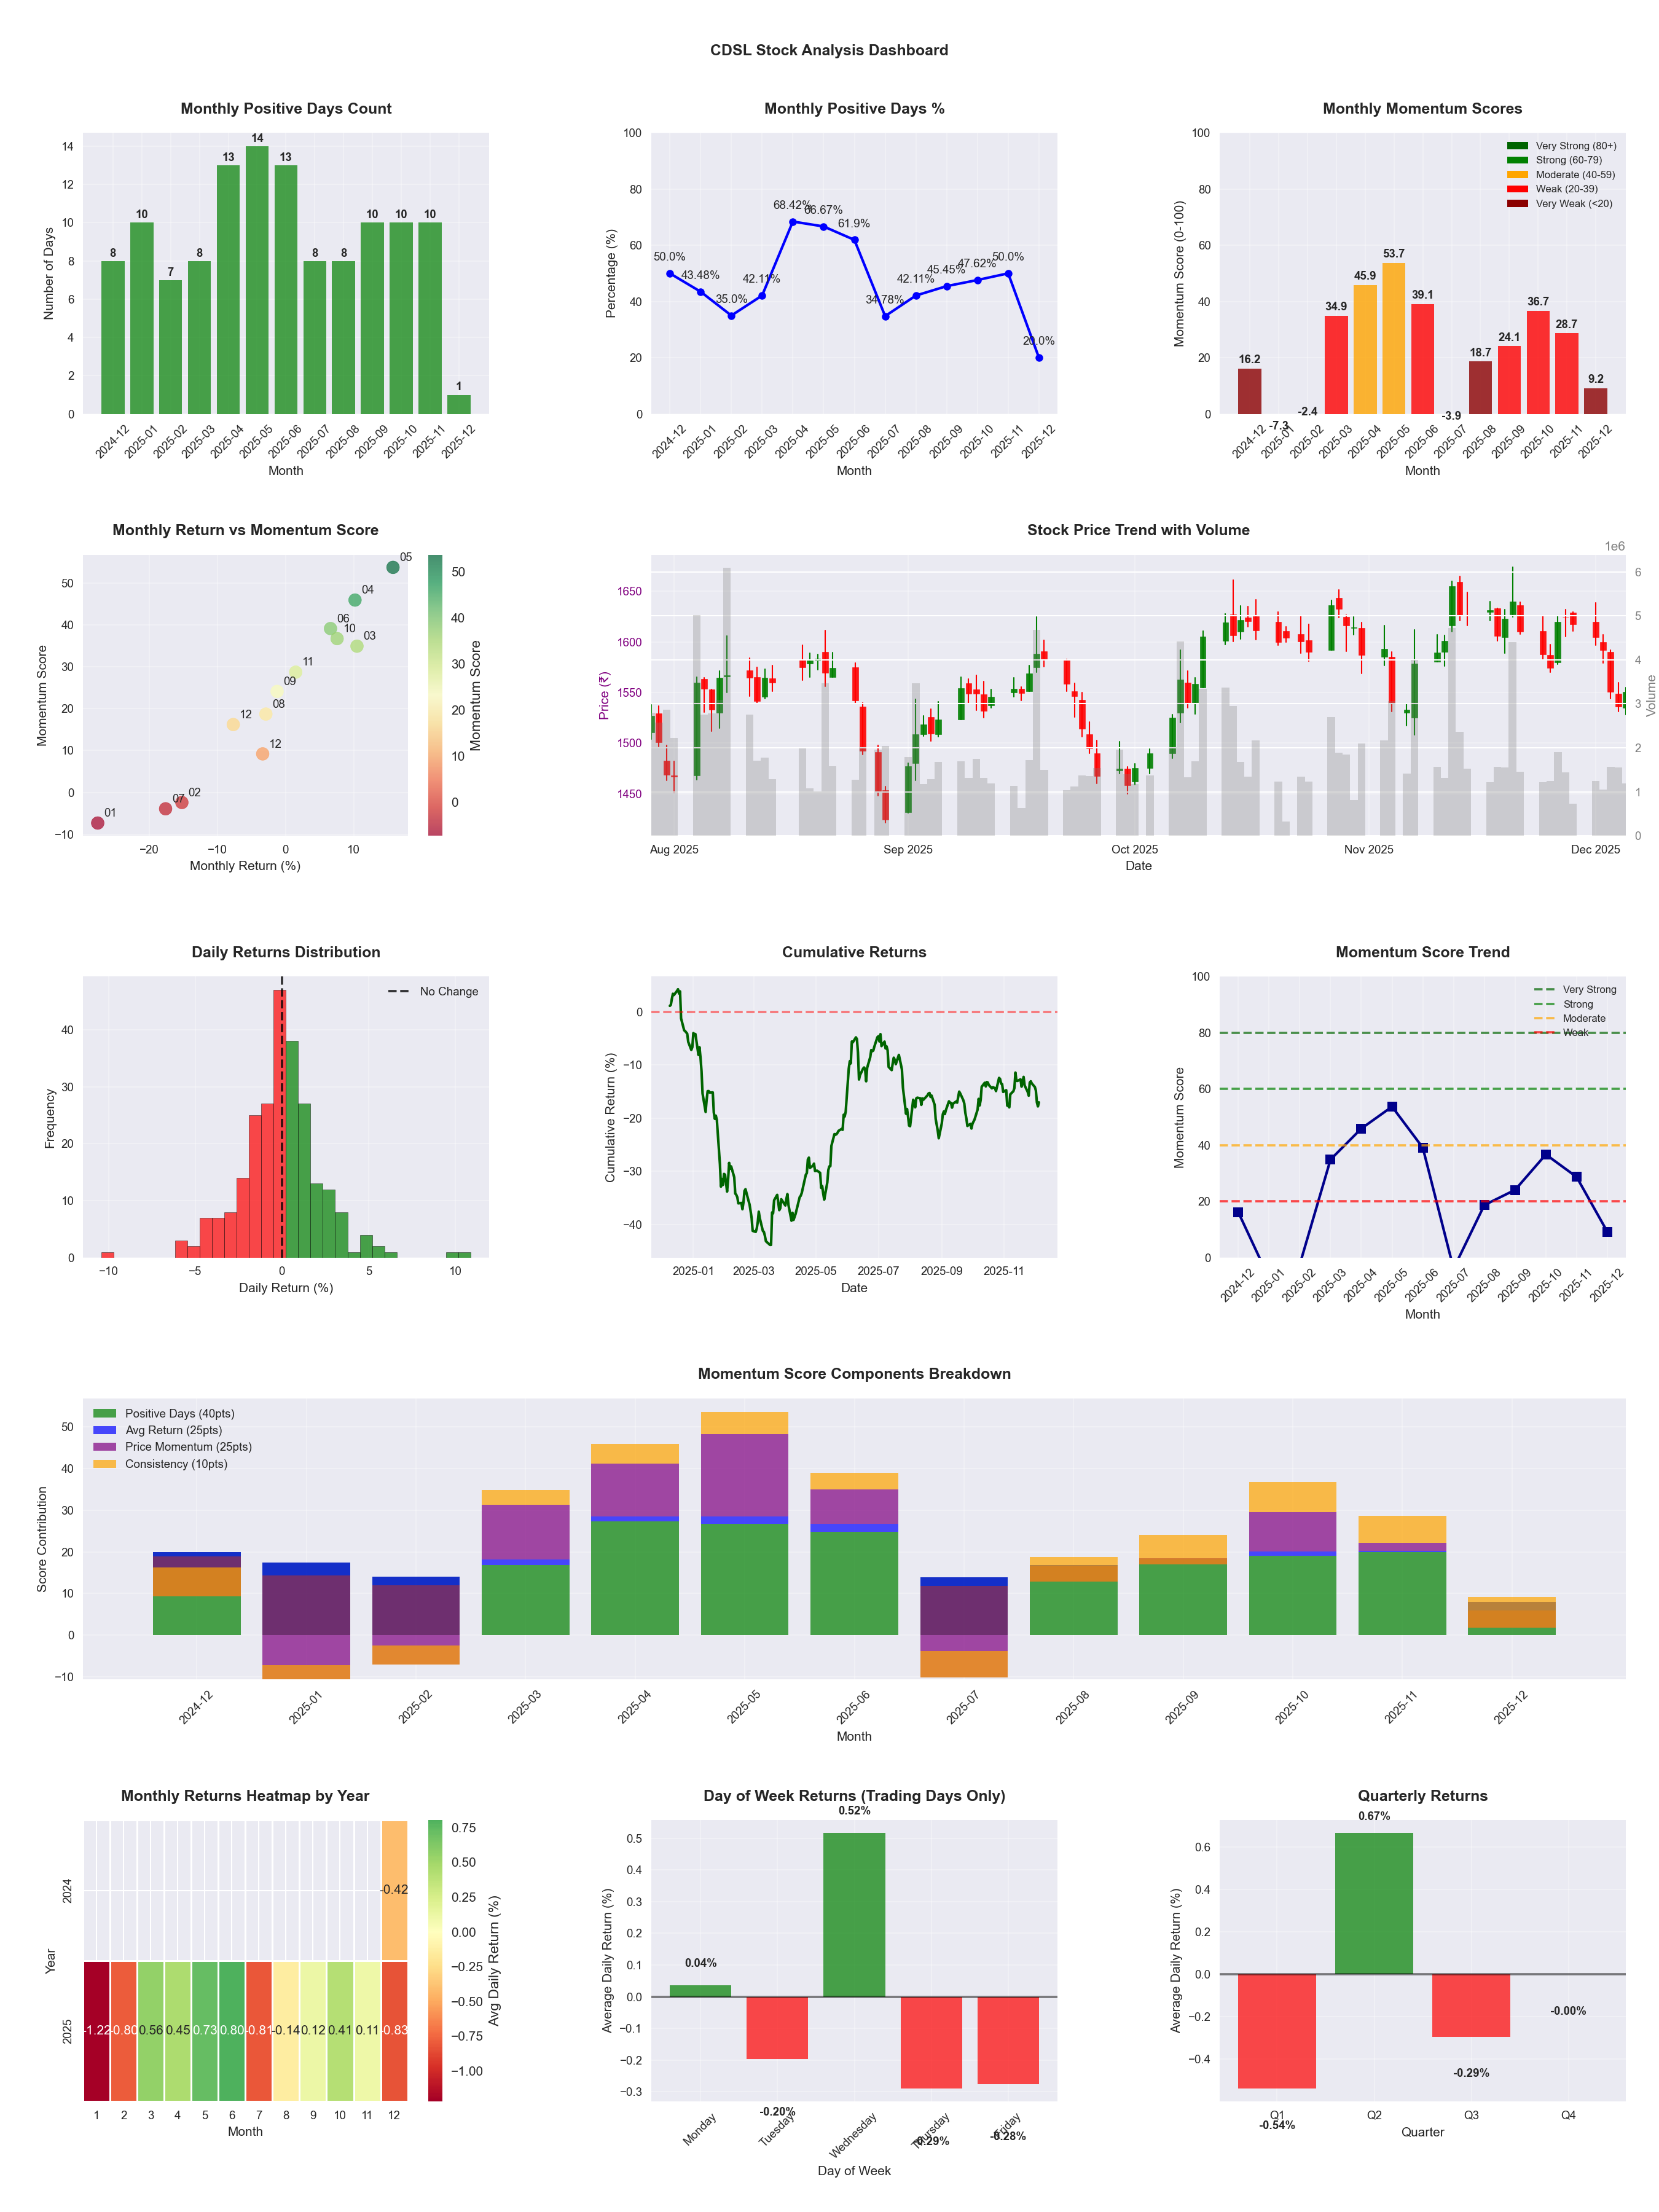
📈 CDSL
Date
📅 2026-04-11
Volatility
🟡 2.22%
Risk Profile
⚠️ suitable for aggressive investors
Win Rate
⚠️ 48.4%
Avg Daily Return
📈 +0.07%
Max Drawdown
📉 -37.47%
IBD RS Score
📊 37.1
Weak
Market Rank
#310
Best Month
🏆 2025-05
Best Months to Trade
📅 Apr, Jun, May
Best Days to Trade
📅 Monday, Wednesday
📊 Key Insights & Metrics
Symbol
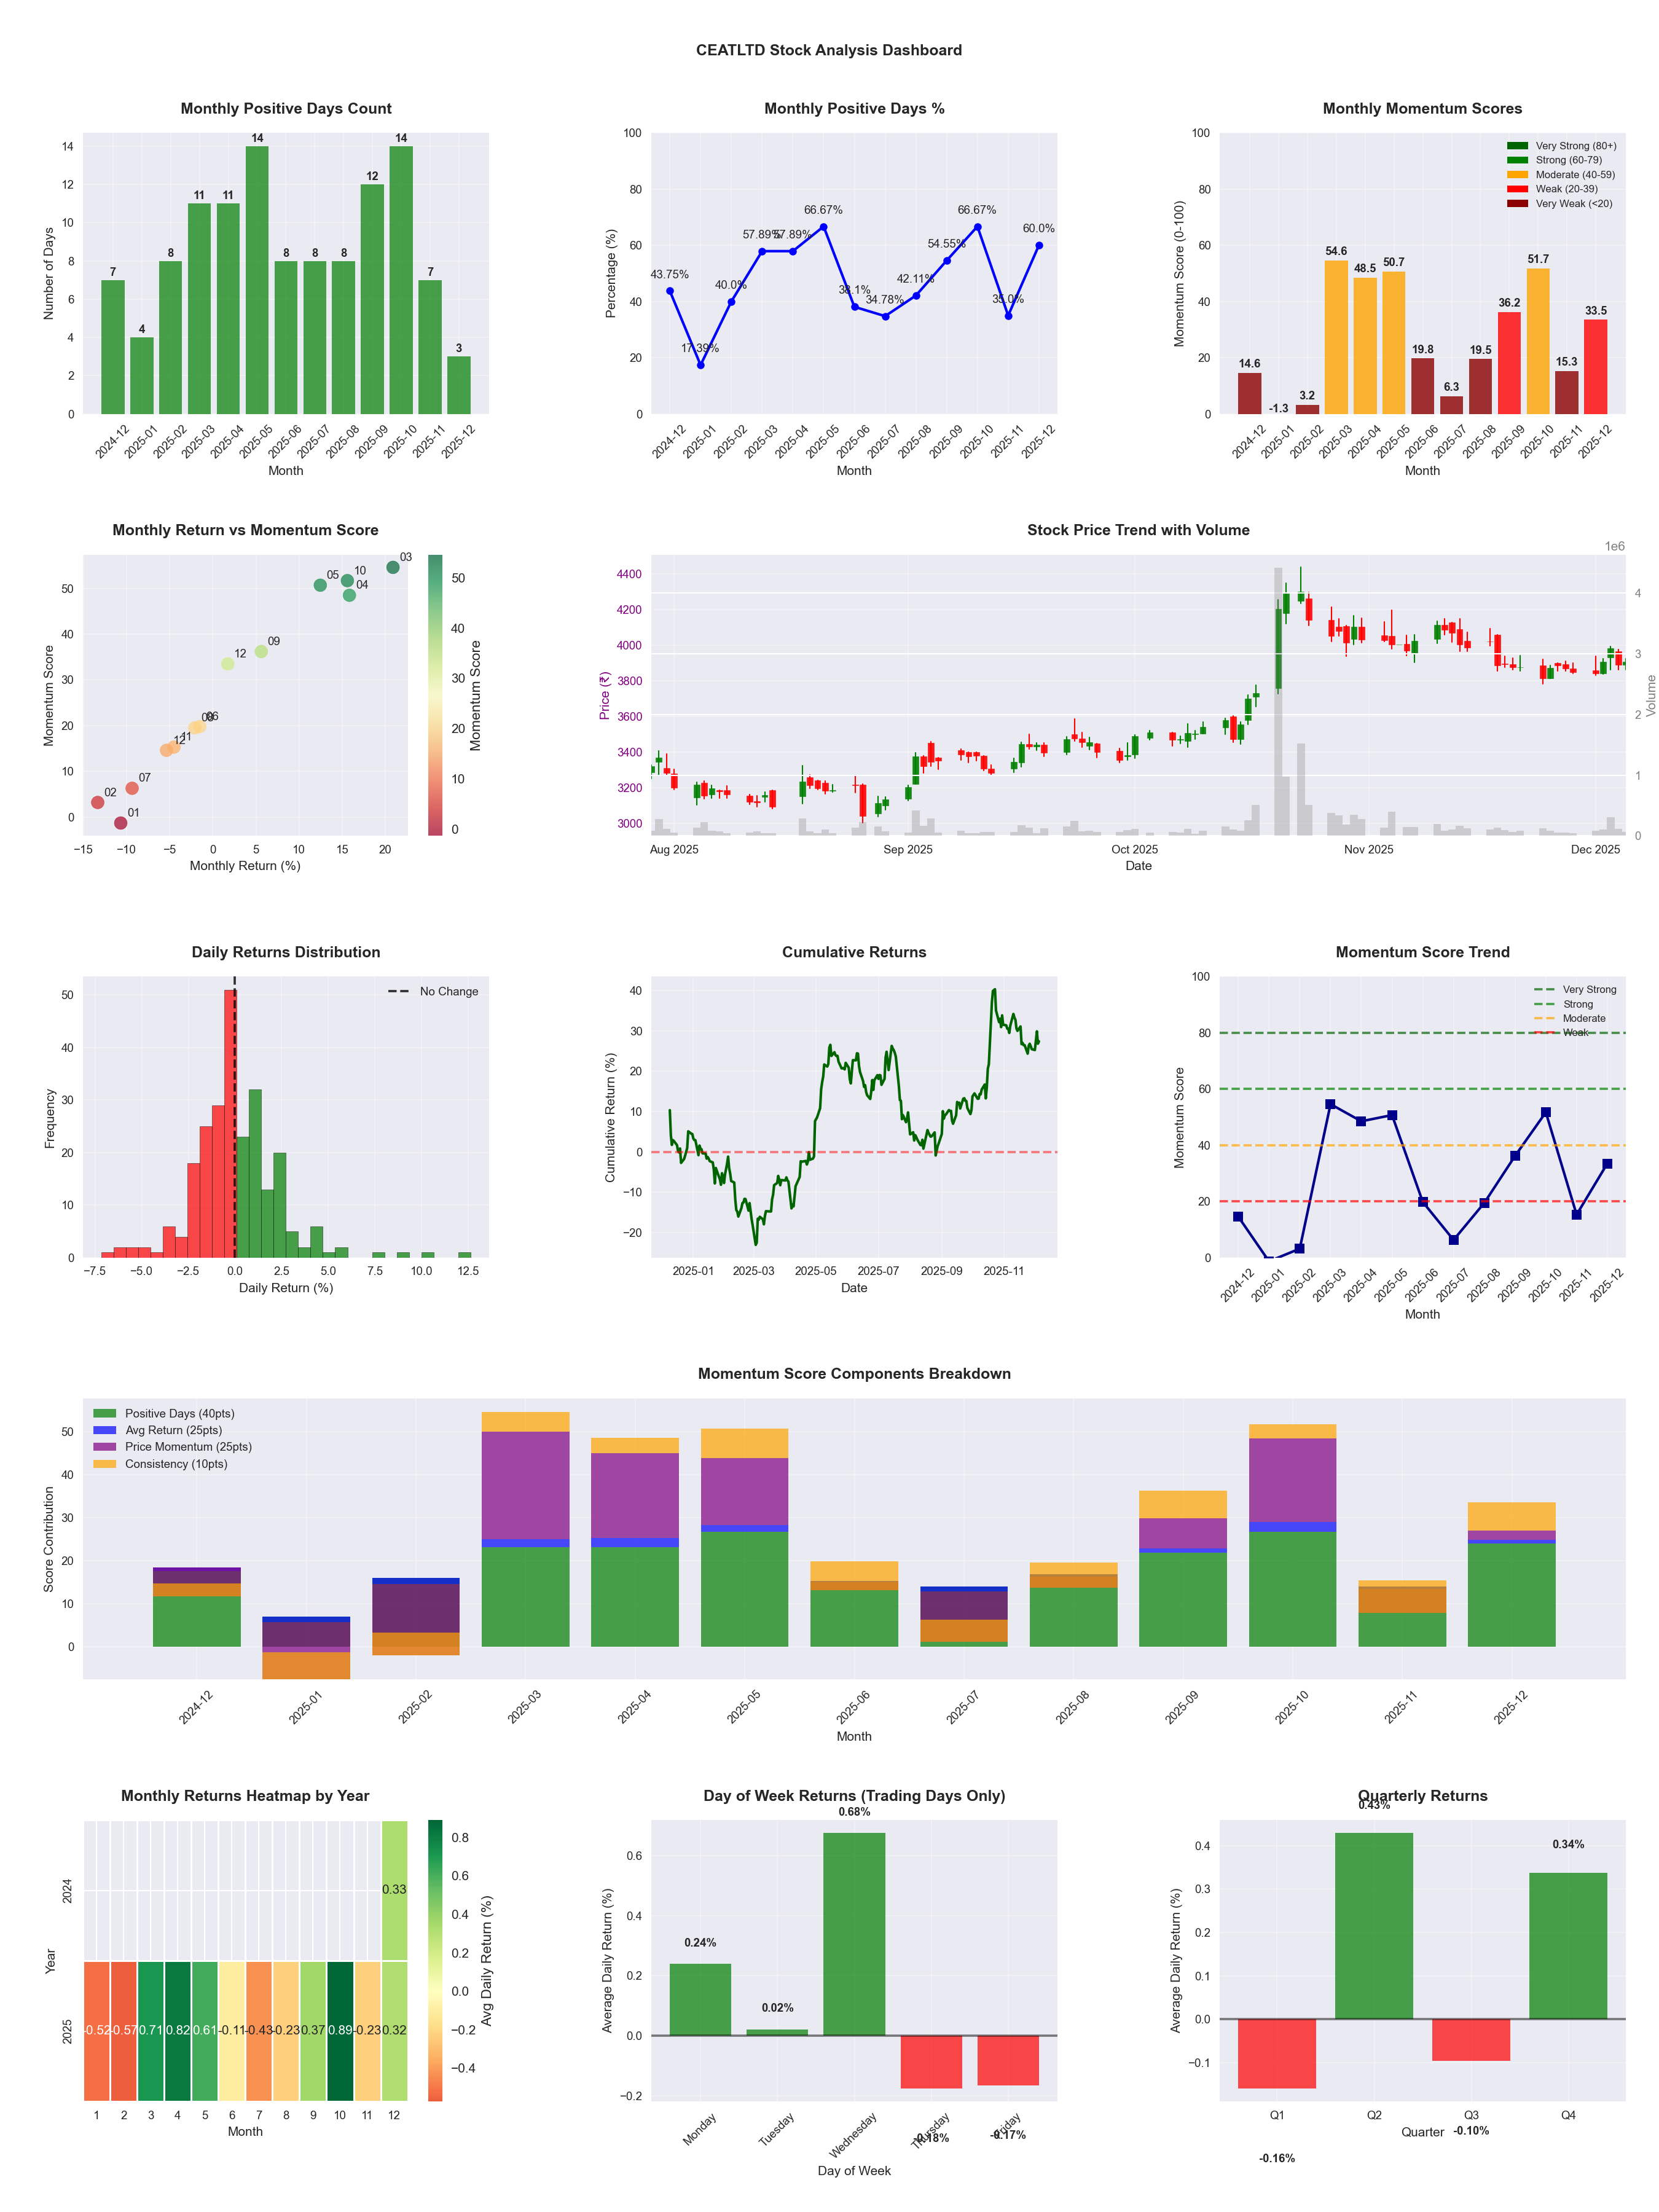
📈 CEATLTD
Date
📅 2026-04-11
Volatility
🟡 2.40%
Risk Profile
⚠️ suitable for aggressive investors
Win Rate
⚠️ 48.0%
Avg Daily Return
📈 +0.13%
Max Drawdown
📉 -24.64%
IBD RS Score
📊 67.5
Average
Market Rank
#160
Best Month
🏆 2025-04
Worst Month
📉 2025-07
Best Months to Trade
📅 Apr, Oct, May
Best Days to Trade
📅 Wednesday, Tuesday
📊 Key Insights & Metrics
Symbol
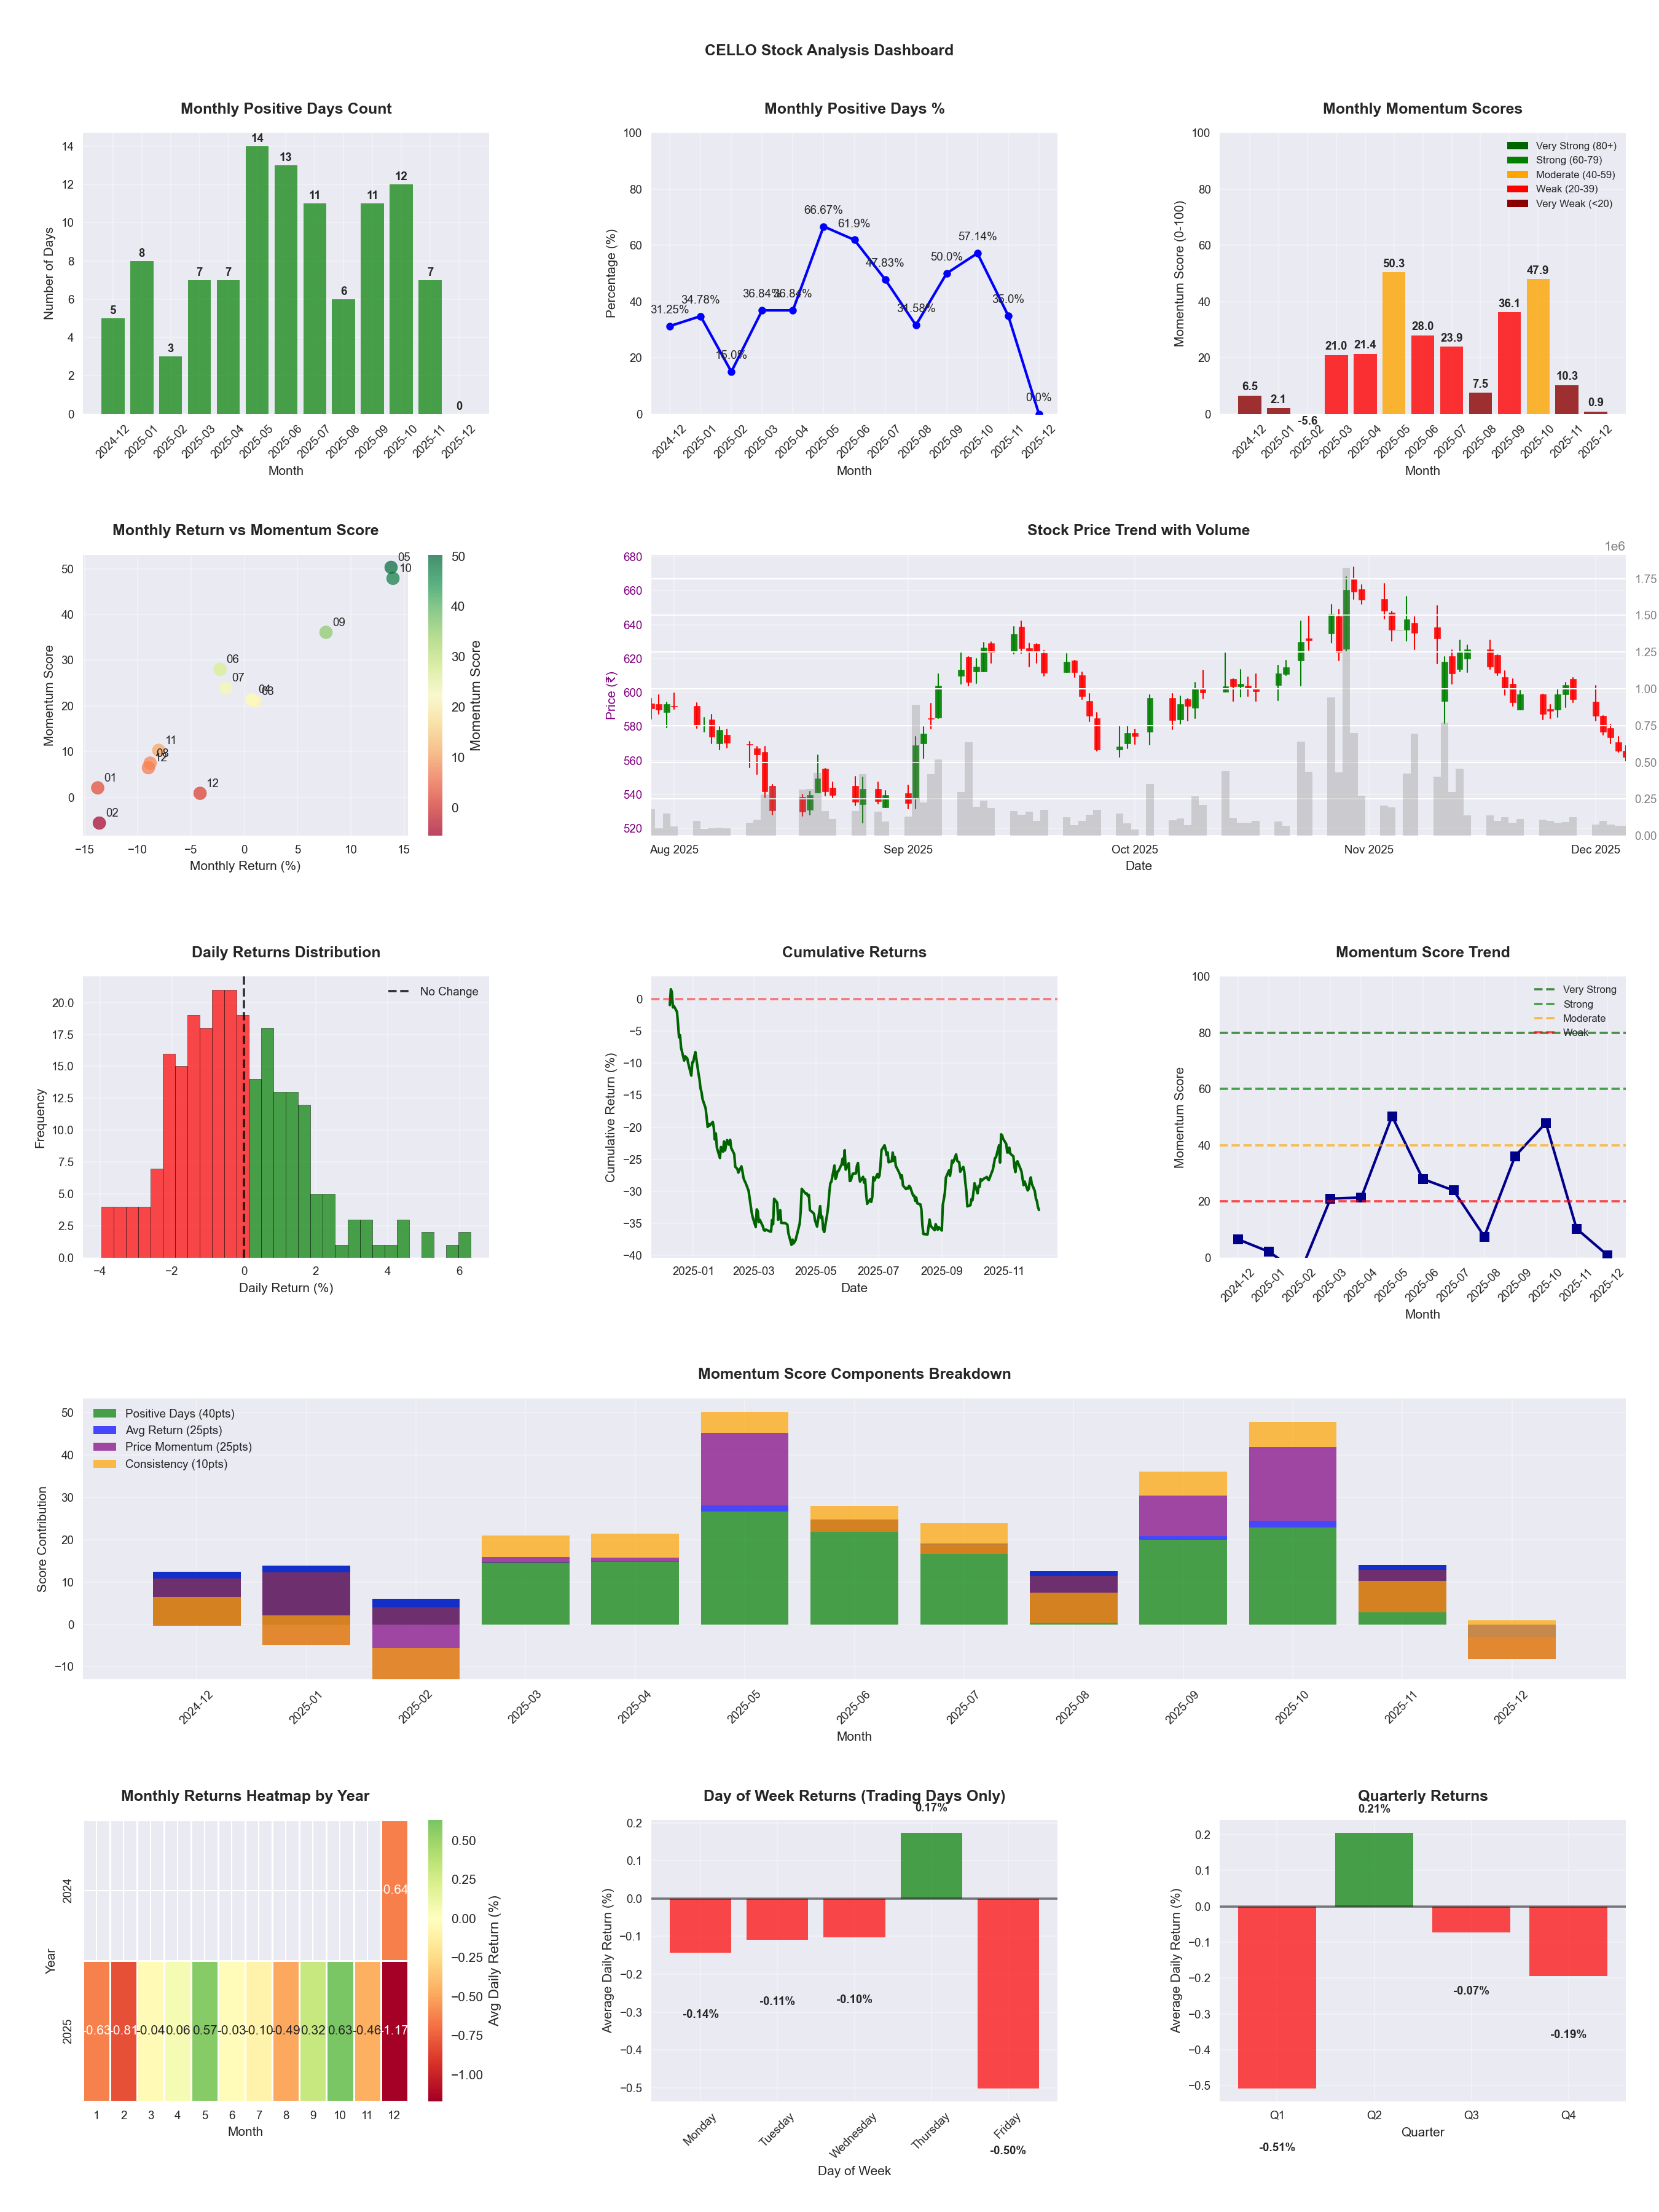
📈 CELLO
Date
📅 2026-03-21
Volatility
🟡 1.91%
Win Rate
⚠️ 45.5%
Avg Daily Return
📉 -0.11%
Max Drawdown
📉 -41.33%
Best Month
🏆 2025-05
Best Months to Trade
📅 Oct, May, Sep
Best Days to Trade
📅 Thursday, Wednesday
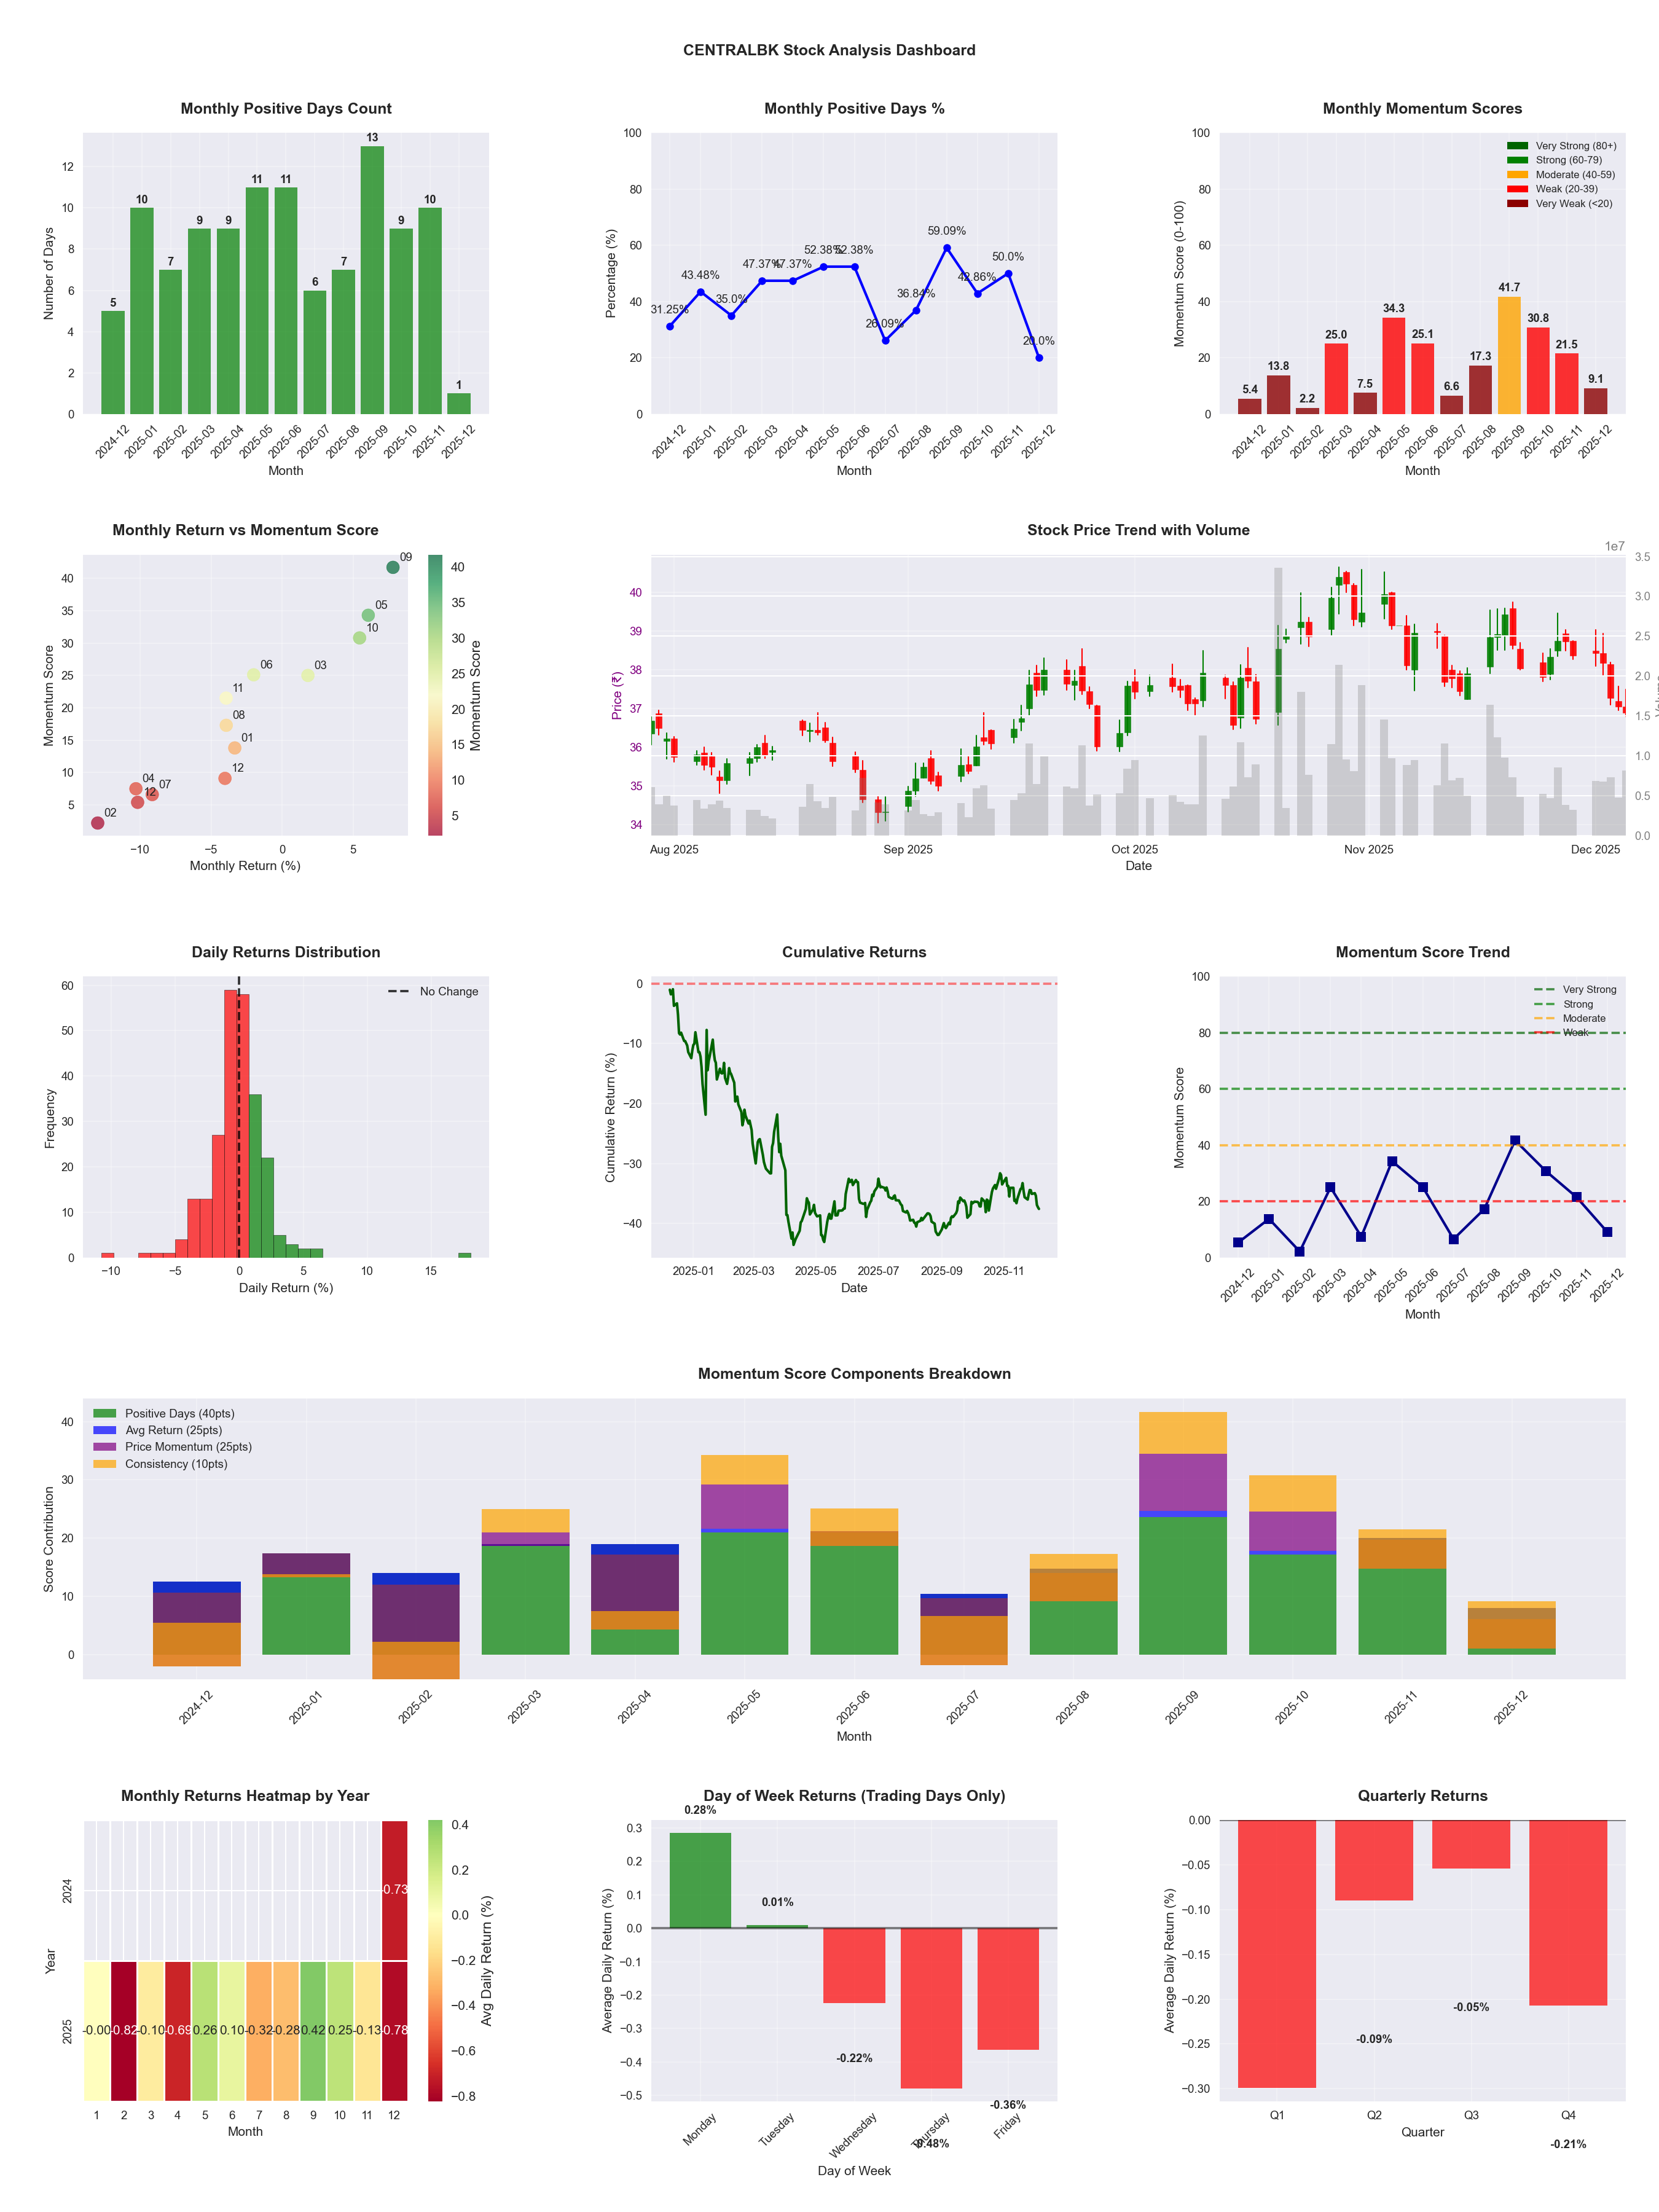
📊 Key Insights & Metrics
Symbol
📈 CENTRALBK
Date
📅 2026-04-11
Volatility
🟡 1.78%
Win Rate
⚠️ 47.1%
Avg Daily Return
📈 +0.04%
Max Drawdown
📉 -22.28%
IBD RS Score
📊 57.0
Average
Market Rank
#212
Best Month
🏆 2026-04
Best Months to Trade
📅 Apr, Sep, Feb
Best Days to Trade
📅 Wednesday, Monday
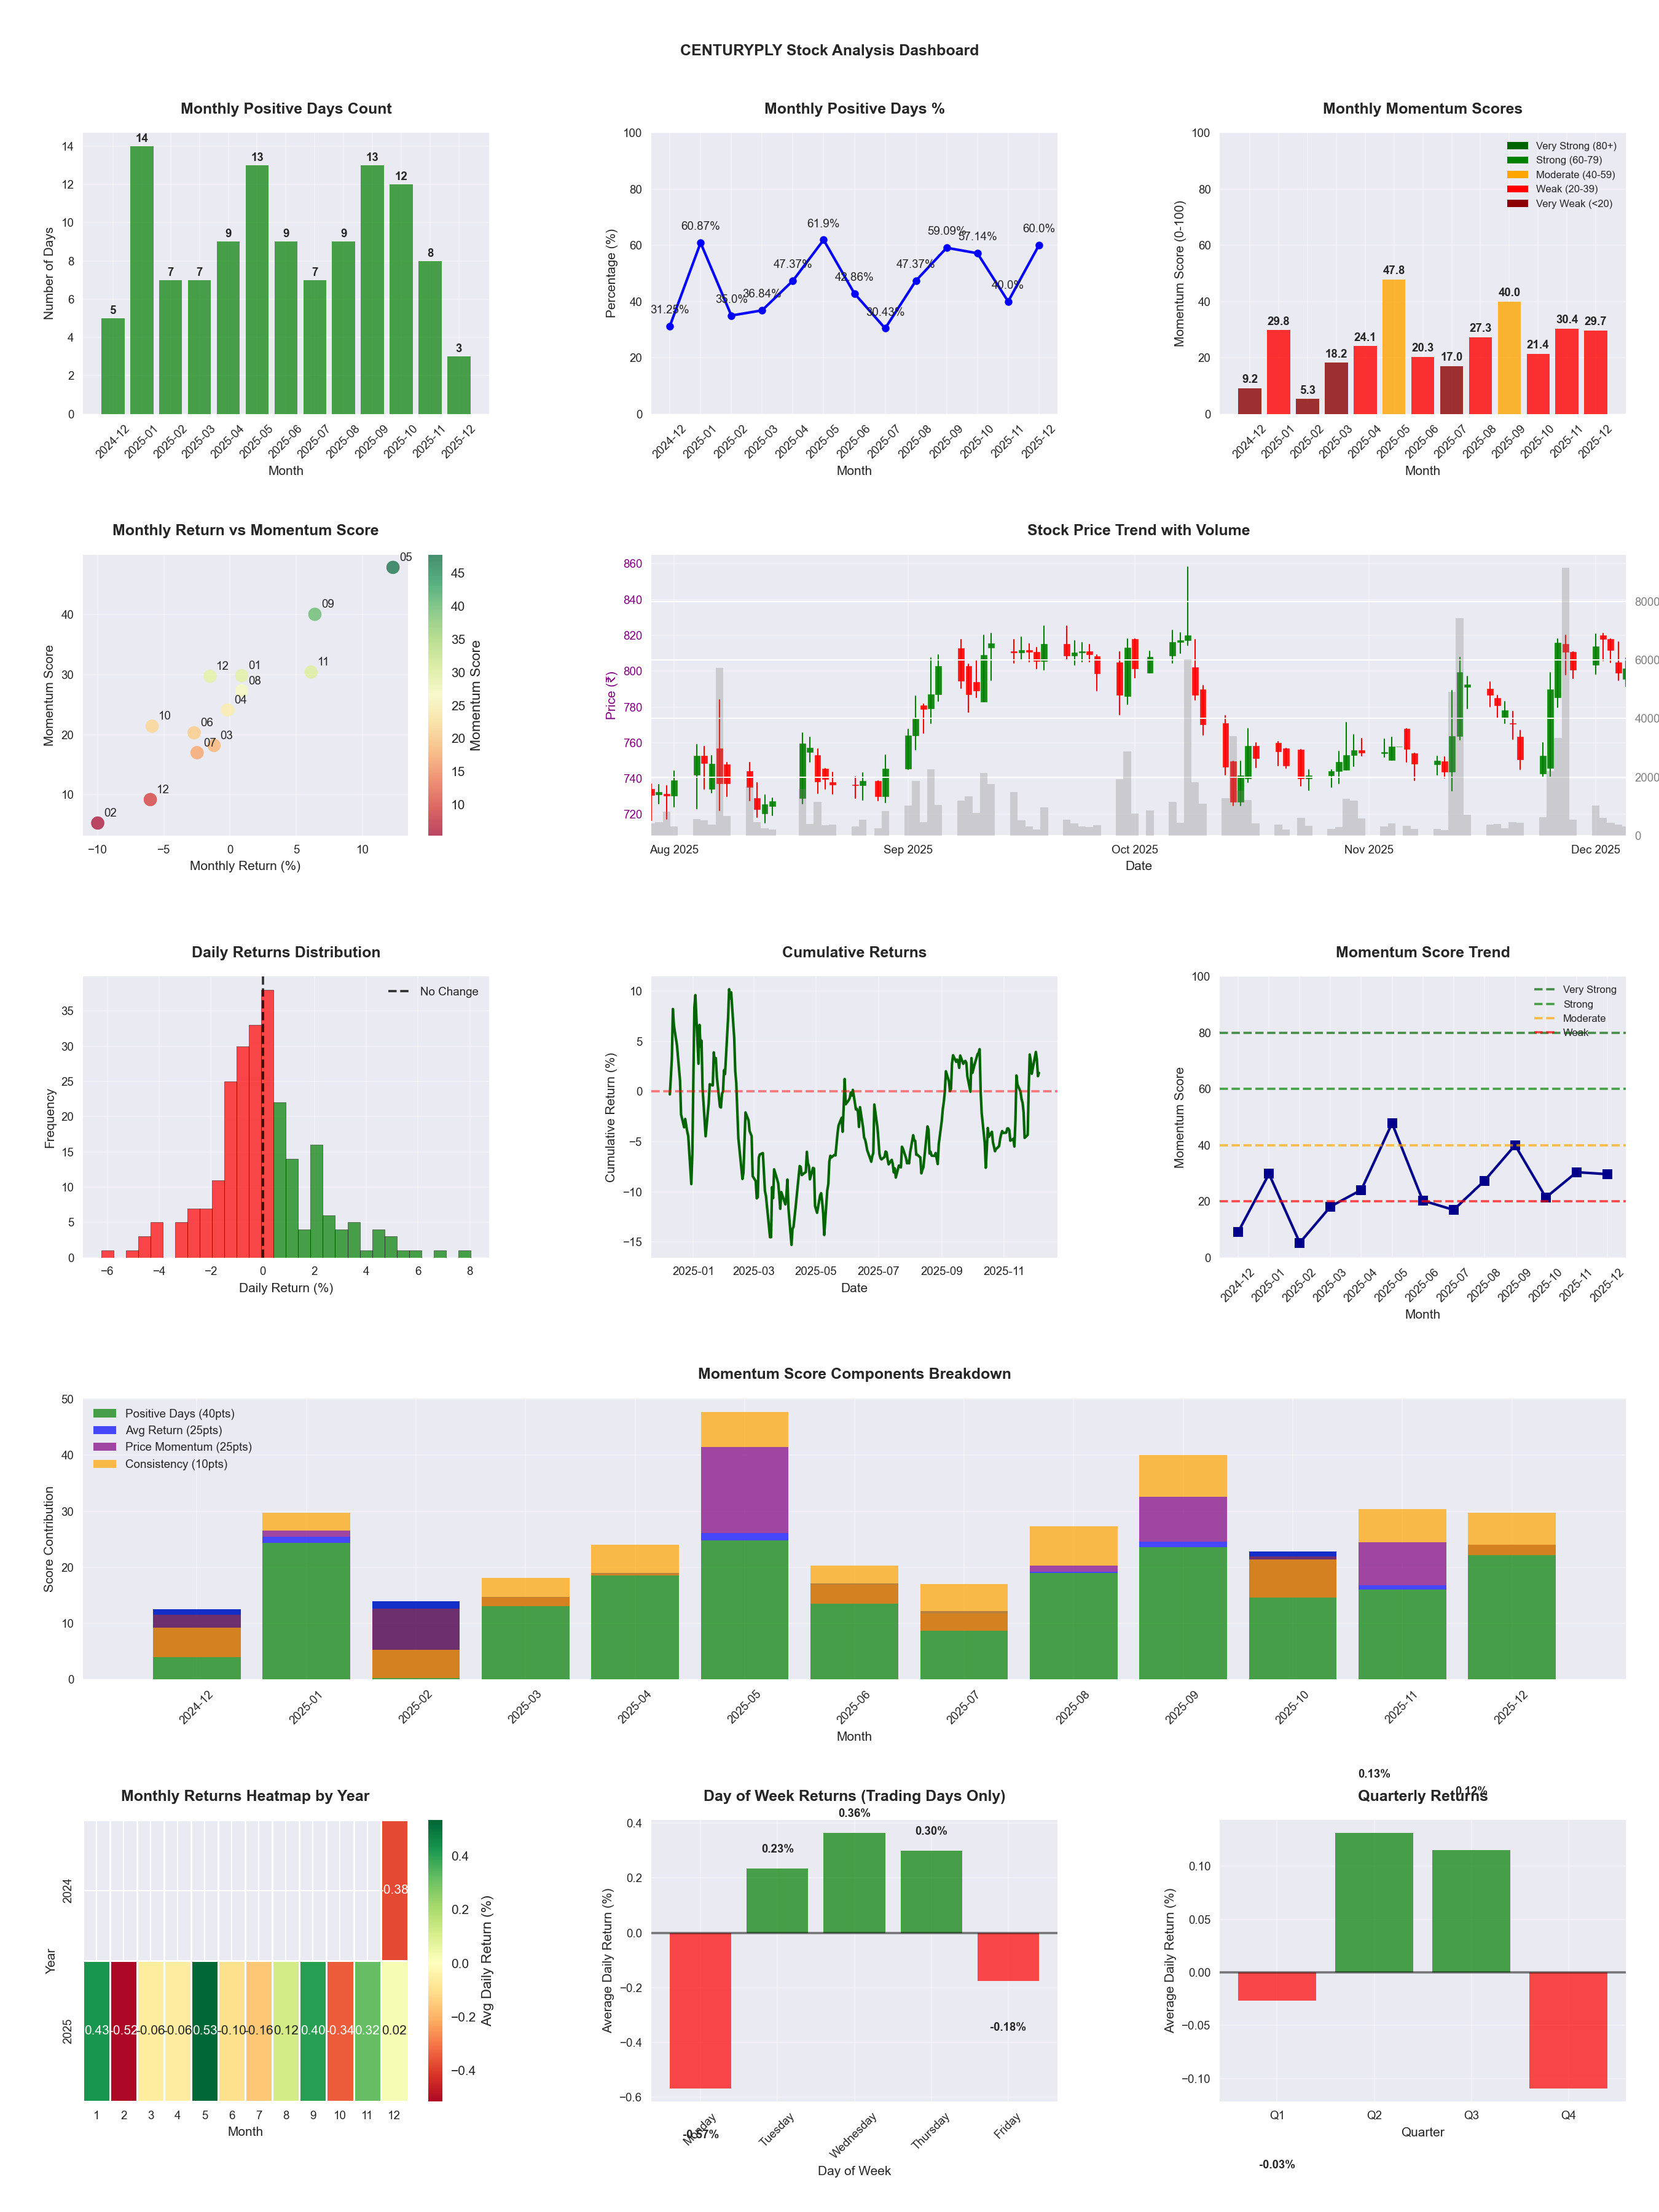
📊 Key Insights & Metrics
Symbol
📈 CENTURYPLY
Date
📅 2026-04-11
Volatility
🟡 1.72%
Win Rate
⚠️ 47.4%
Avg Daily Return
📈 +0.04%
Max Drawdown
📉 -23.49%
IBD RS Score
📊 57.2
Average
Market Rank
#211
Best Month
🏆 2025-05
Worst Month
📉 2026-02
Best Months to Trade
📅 May, Sep, Nov
Best Days to Trade
📅 Wednesday, Tuesday
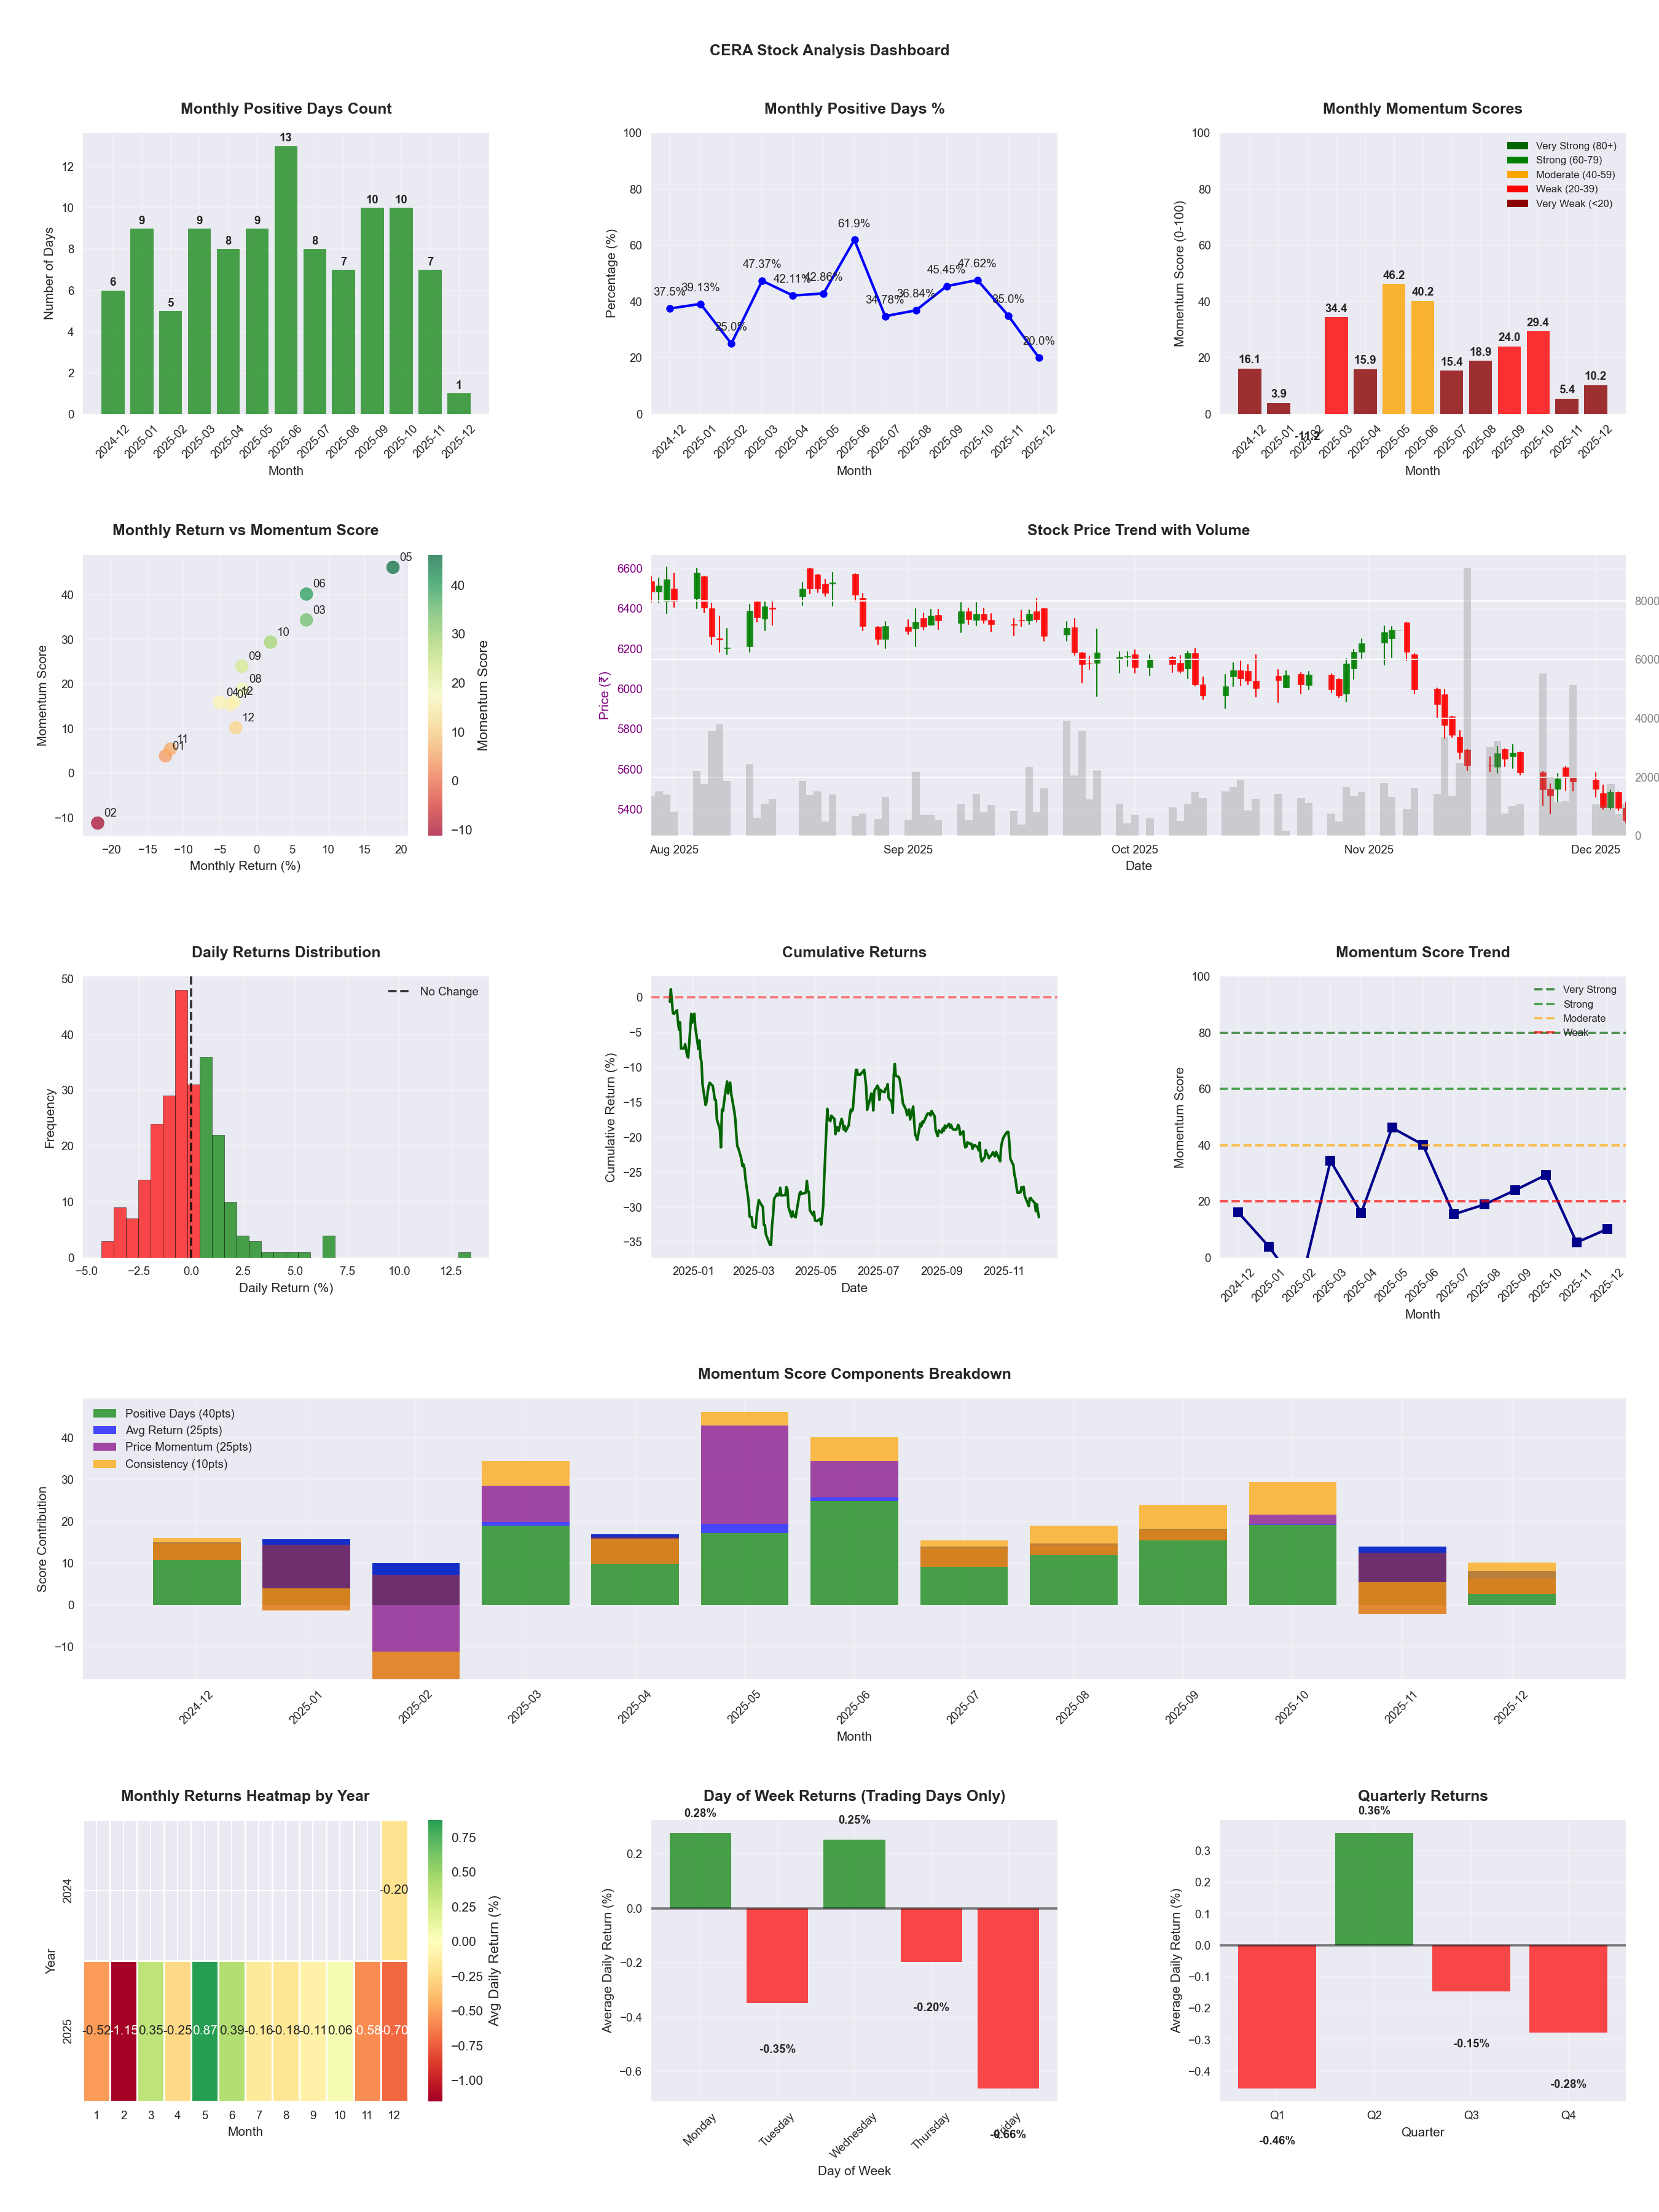
📊 Key Insights & Metrics
Symbol
📈 CERA
Date
📅 2026-04-11
Volatility
🟡 1.90%
Win Rate
⚠️ 44.5%
Avg Daily Return
📉 +0.00%
Max Drawdown
📉 -35.85%
IBD RS Score
📊 41.6
Weak
Market Rank
#288
Best Month
🏆 2026-04
Worst Month
📉 2025-11
Best Months to Trade
📅 May, Apr, Jun
Best Days to Trade
📅 Wednesday, Monday
📊 Key Insights & Metrics
Symbol
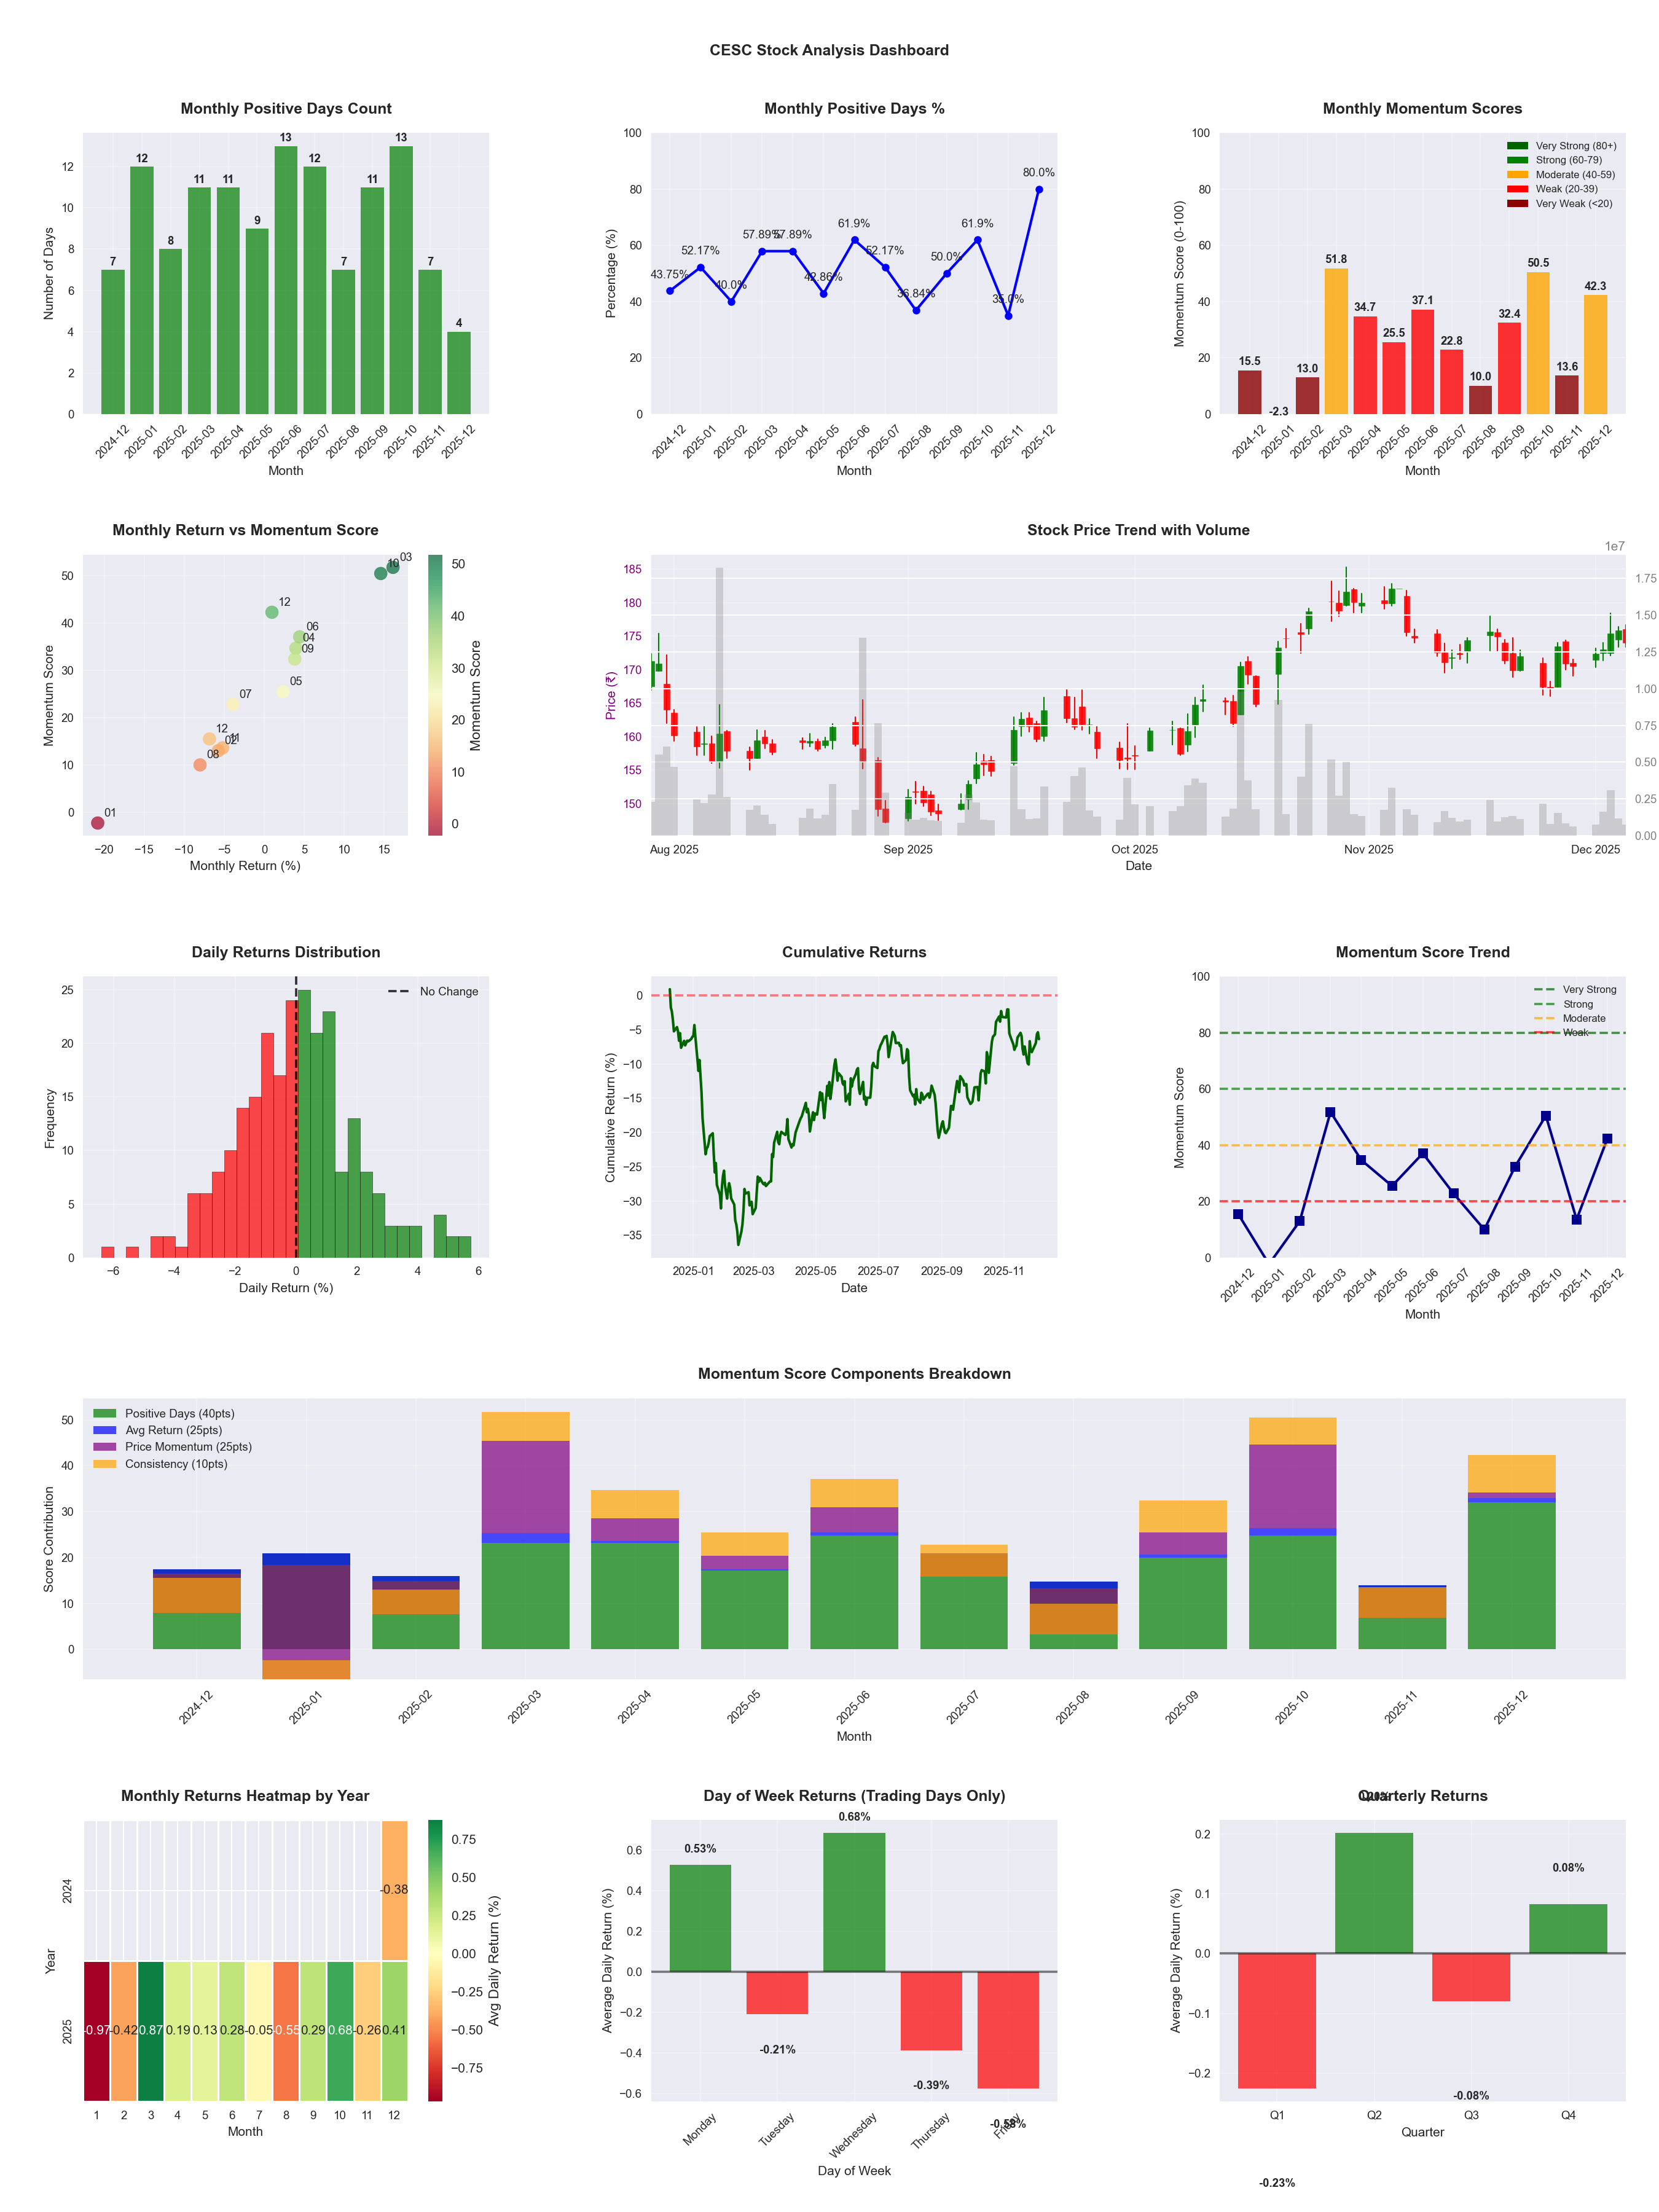
📈 CESC
Date
📅 2026-04-11
Volatility
🟡 1.81%
Win Rate
⚠️ 49.2%
Avg Daily Return
📈 +0.04%
Max Drawdown
📉 -22.86%
IBD RS Score
📊 53.5
Average
Market Rank
#229
Best Month
🏆 2025-10
Worst Month
📉 2026-01
Best Months to Trade
📅 Oct, Apr, Sep
Best Days to Trade
📅 Wednesday, Monday
📊 Key Insights & Metrics
Symbol
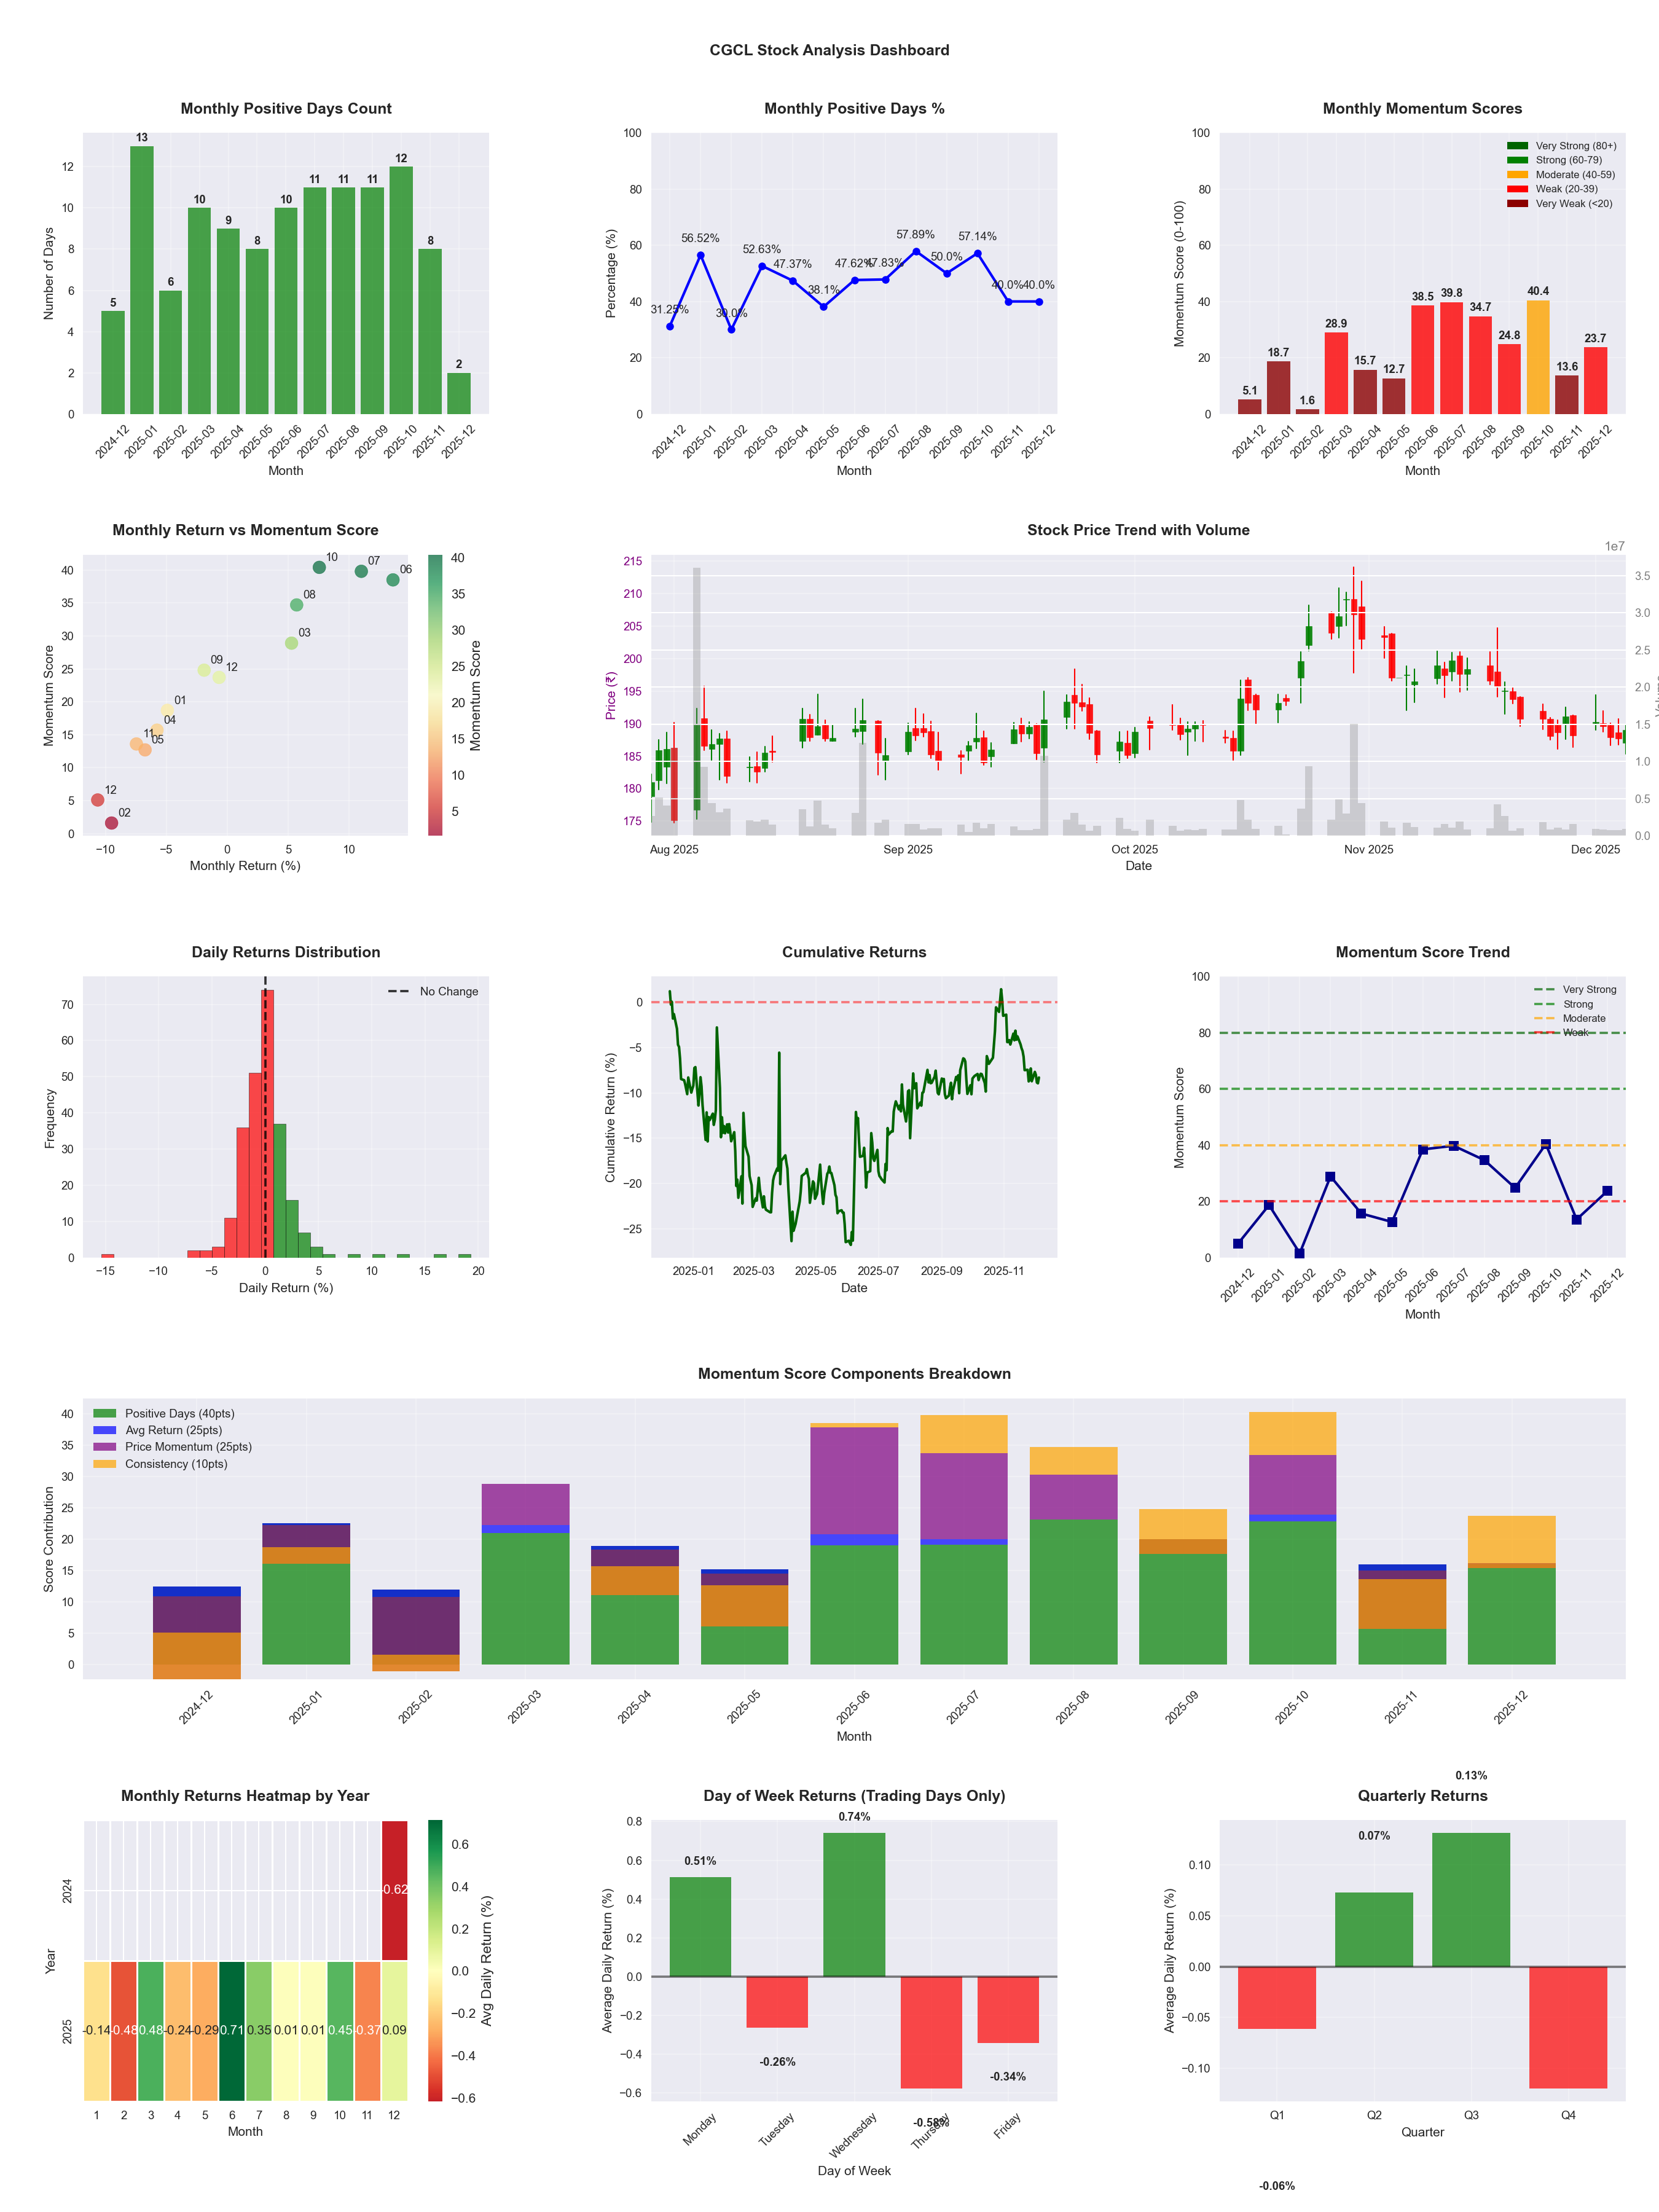
📈 CGCL
Date
📅 2026-04-11
Volatility
🟡 2.36%
Risk Profile
⚠️ suitable for aggressive investors
Win Rate
⚠️ 48.0%
Avg Daily Return
📈 +0.09%
Max Drawdown
📉 -27.31%
IBD RS Score
📊 67.1
Average
Market Rank
#162
Best Month
🏆 2025-10
Worst Month
📉 2025-05
Best Months to Trade
📅 Apr, Jun, Oct
Best Days to Trade
📅 Monday, Wednesday
📊 Key Insights & Metrics
Symbol
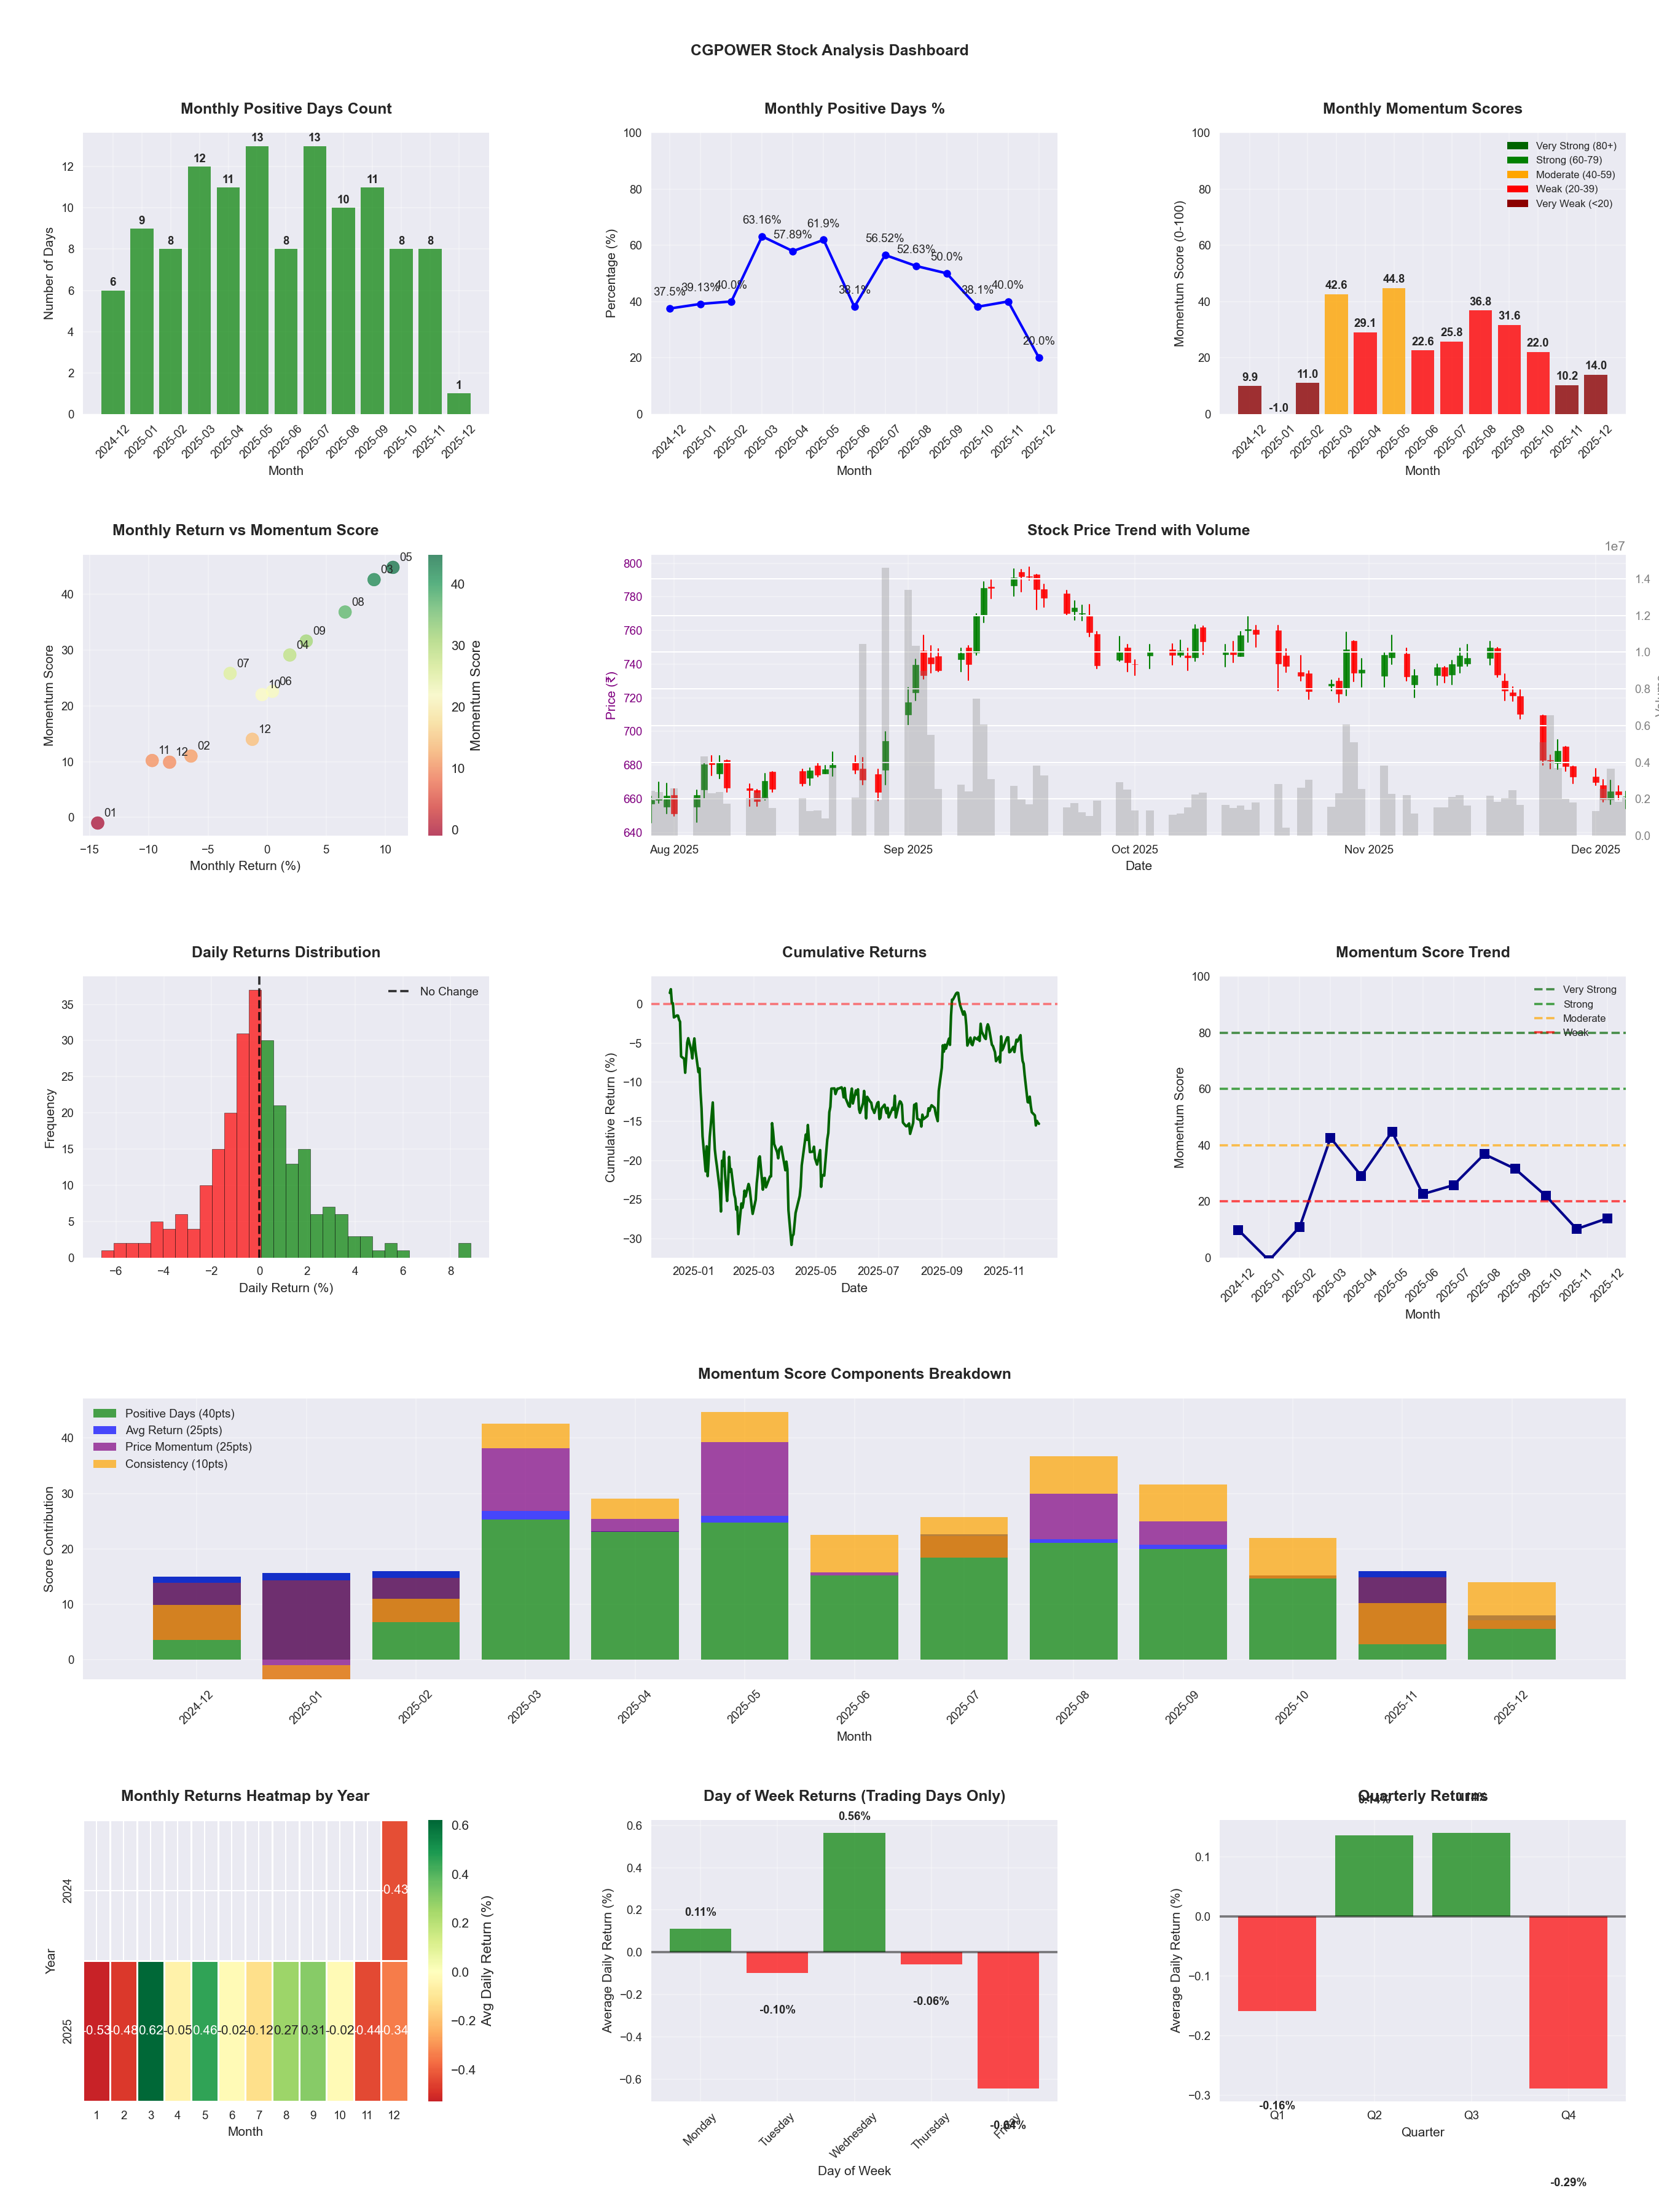
📈 CGPOWER
Date
📅 2026-04-11
Volatility
🟡 1.97%
Win Rate
⚠️ 46.8%
Avg Daily Return
📈 +0.12%
Max Drawdown
📉 -33.02%
IBD RS Score
📊 82.6
Strong
Market Rank
#86
Best Month
🏆 2026-02
Worst Month
📉 2026-01
Best Months to Trade
📅 Apr, Feb, May
Best Days to Trade
📅 Wednesday, Monday
📊 Key Insights & Metrics
Symbol
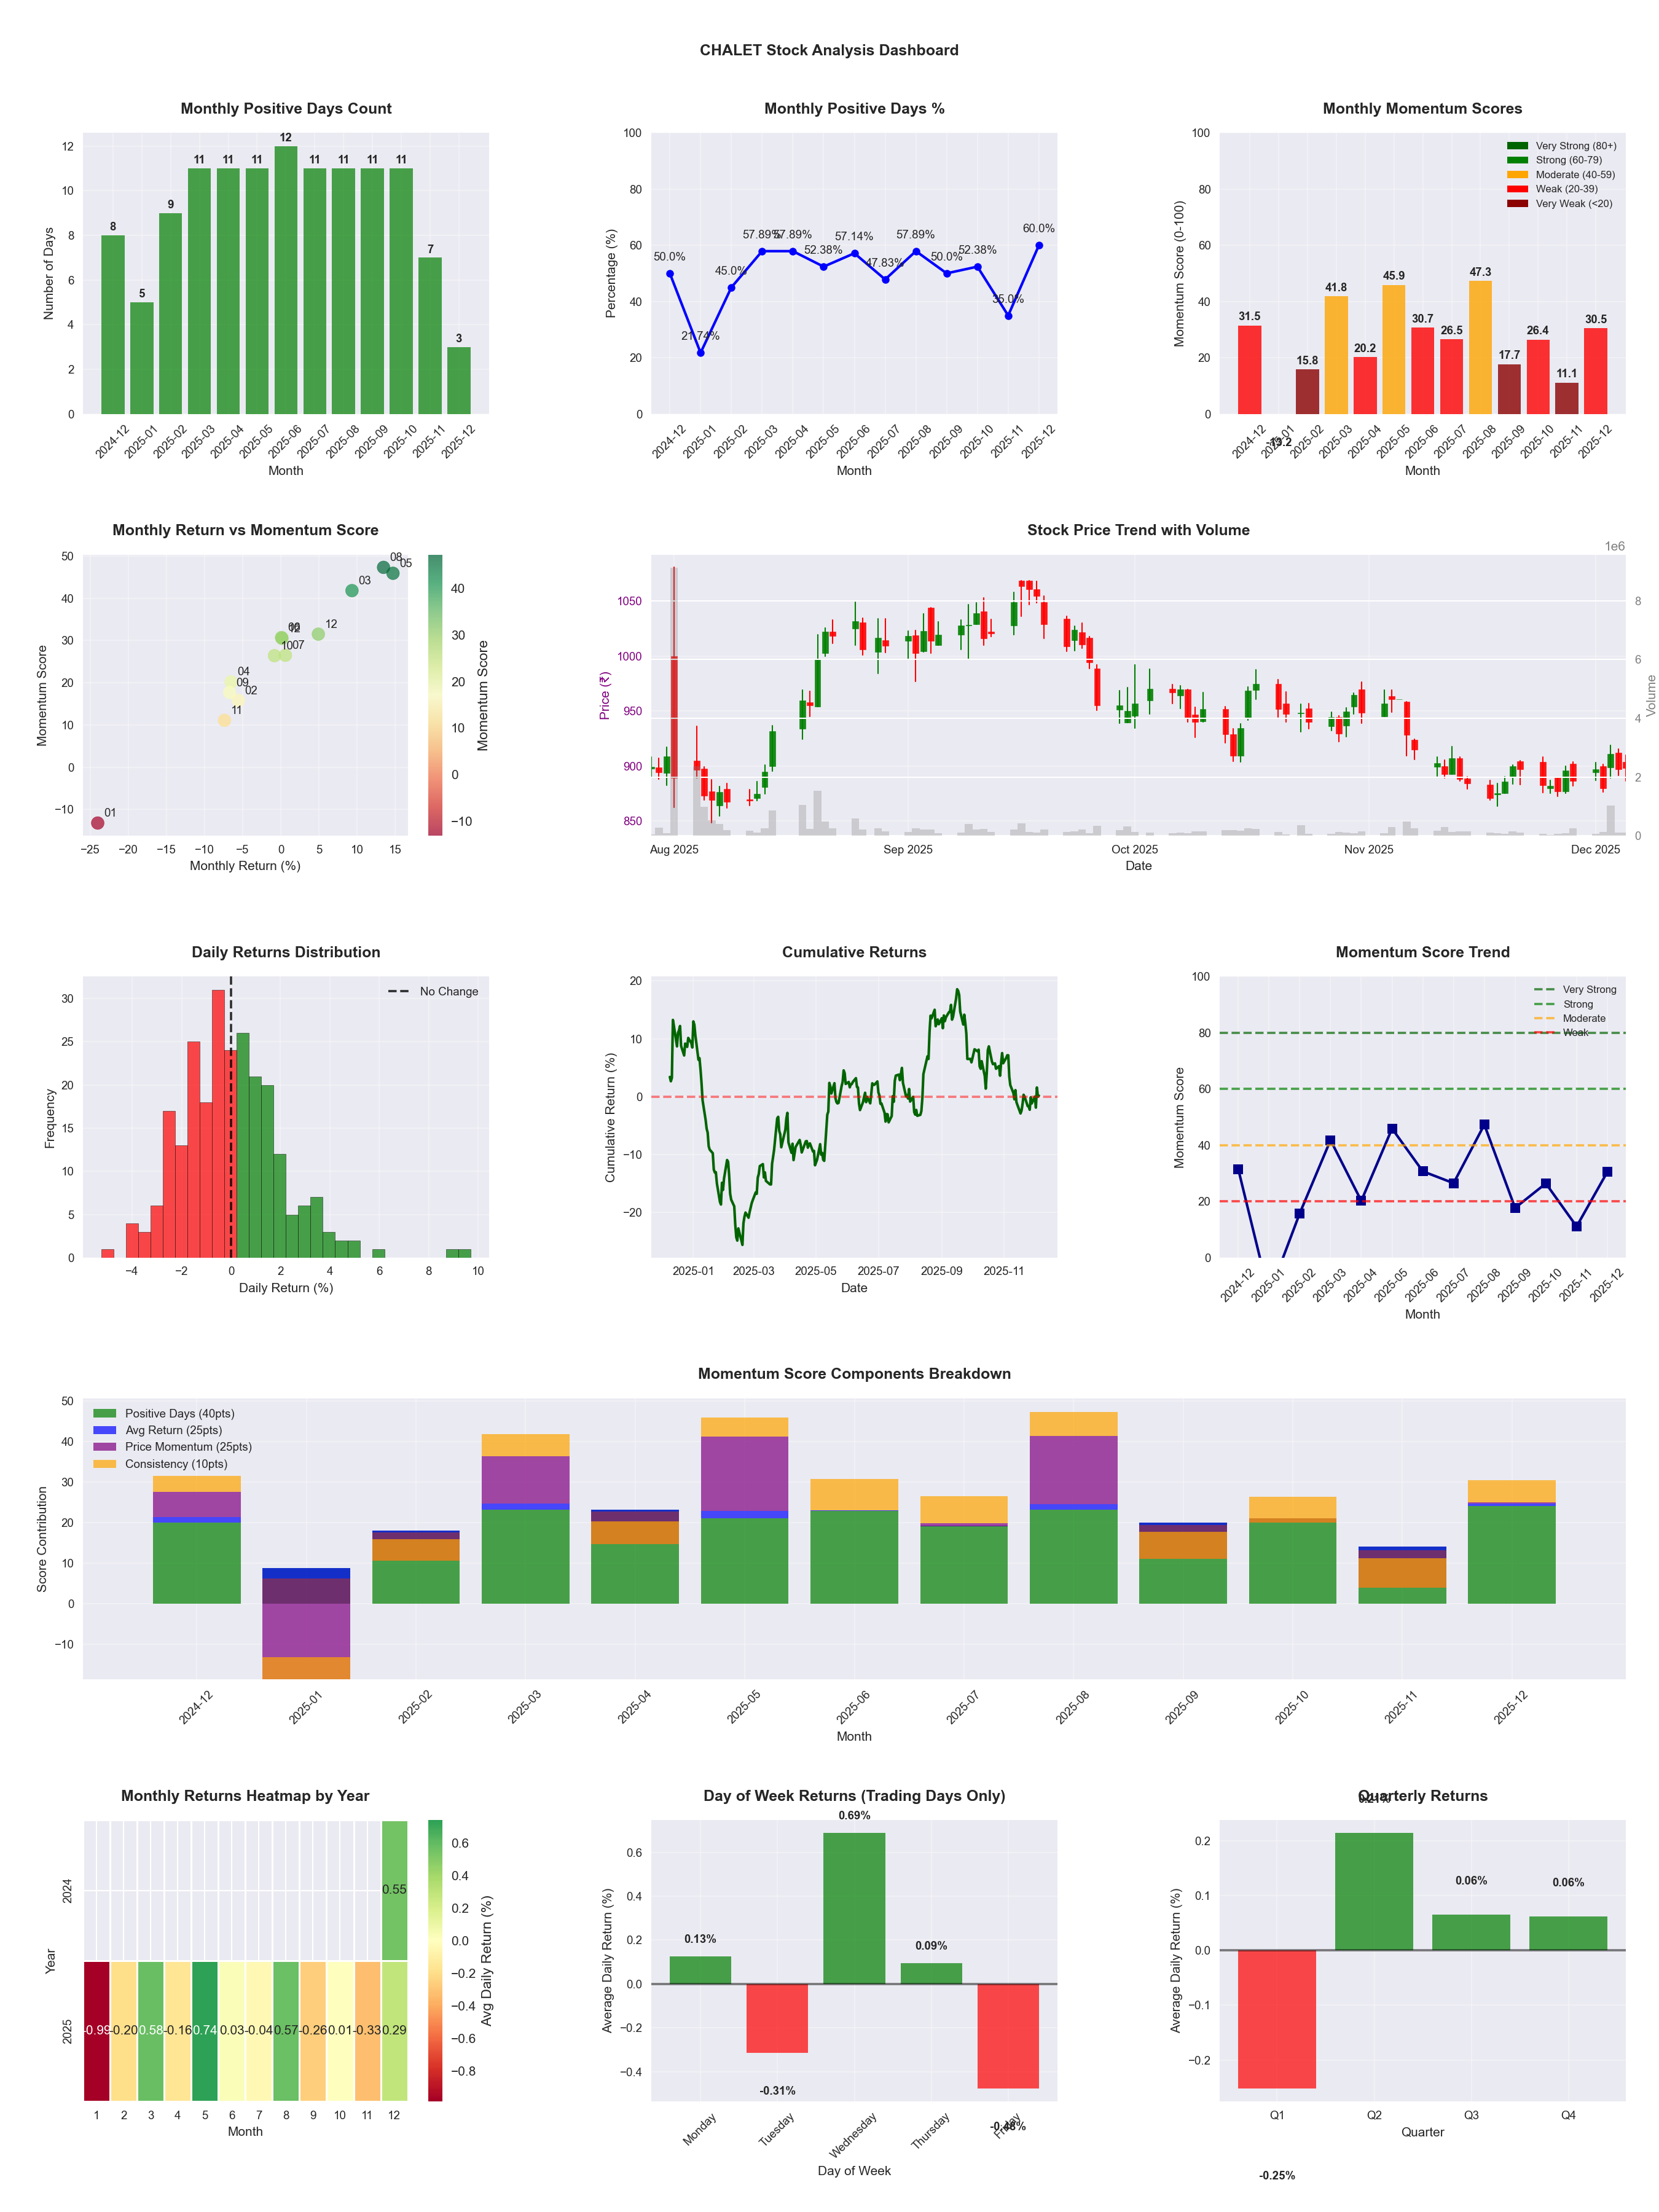
📈 CHALET
Date
📅 2026-04-11
Volatility
🟡 1.86%
Win Rate
⚠️ 47.6%
Avg Daily Return
📉 -0.01%
Max Drawdown
📉 -33.96%
IBD RS Score
📊 33.3
Weak
Market Rank
#329
Best Month
🏆 2026-04
Worst Month
📉 2026-03
Best Months to Trade
📅 May, Aug, Apr
Best Days to Trade
📅 Wednesday, Thursday
📊 Key Insights & Metrics
Symbol
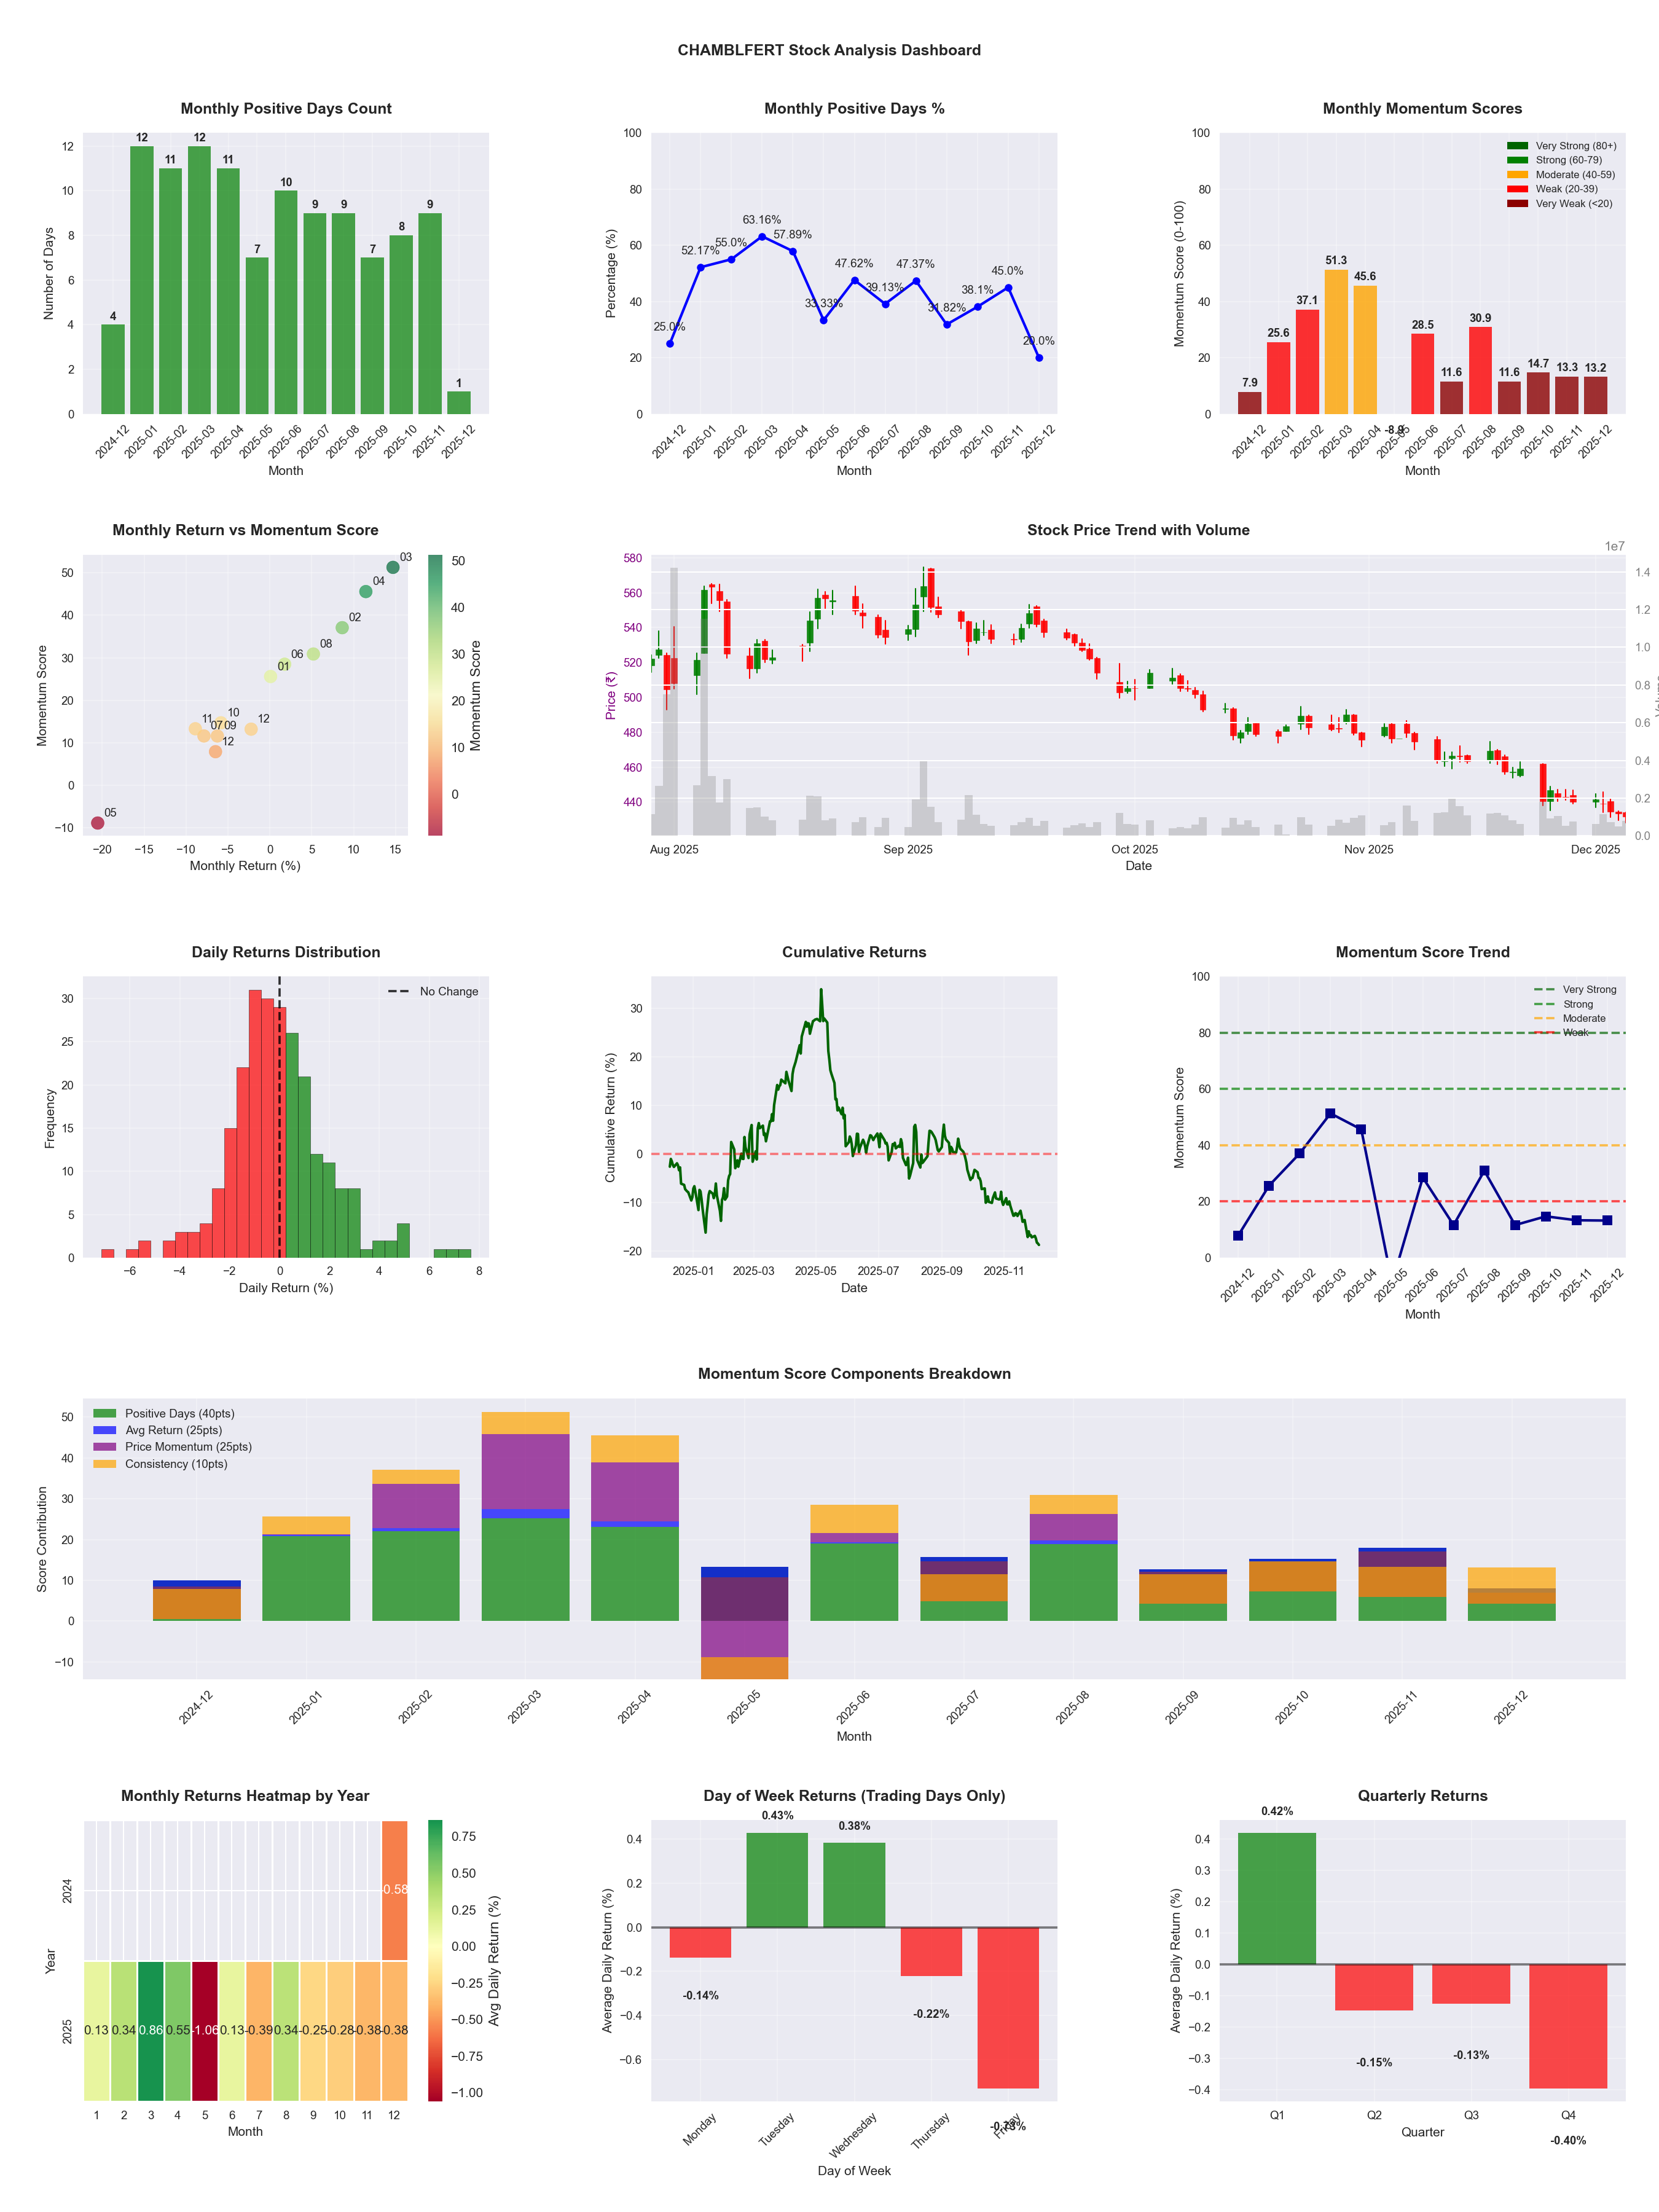
📈 CHAMBLFERT
Date
📅 2026-04-11
Volatility
🟡 1.85%
Win Rate
⚠️ 45.9%
Avg Daily Return
📉 -0.12%
Max Drawdown
📉 -42.11%
IBD RS Score
📊 37.5
Weak
Market Rank
#308
Best Month
🏆 2025-12
Best Months to Trade
📅 Apr, Dec, Aug
Best Days to Trade
📅 Tuesday, Wednesday
📊 Key Insights & Metrics
Symbol
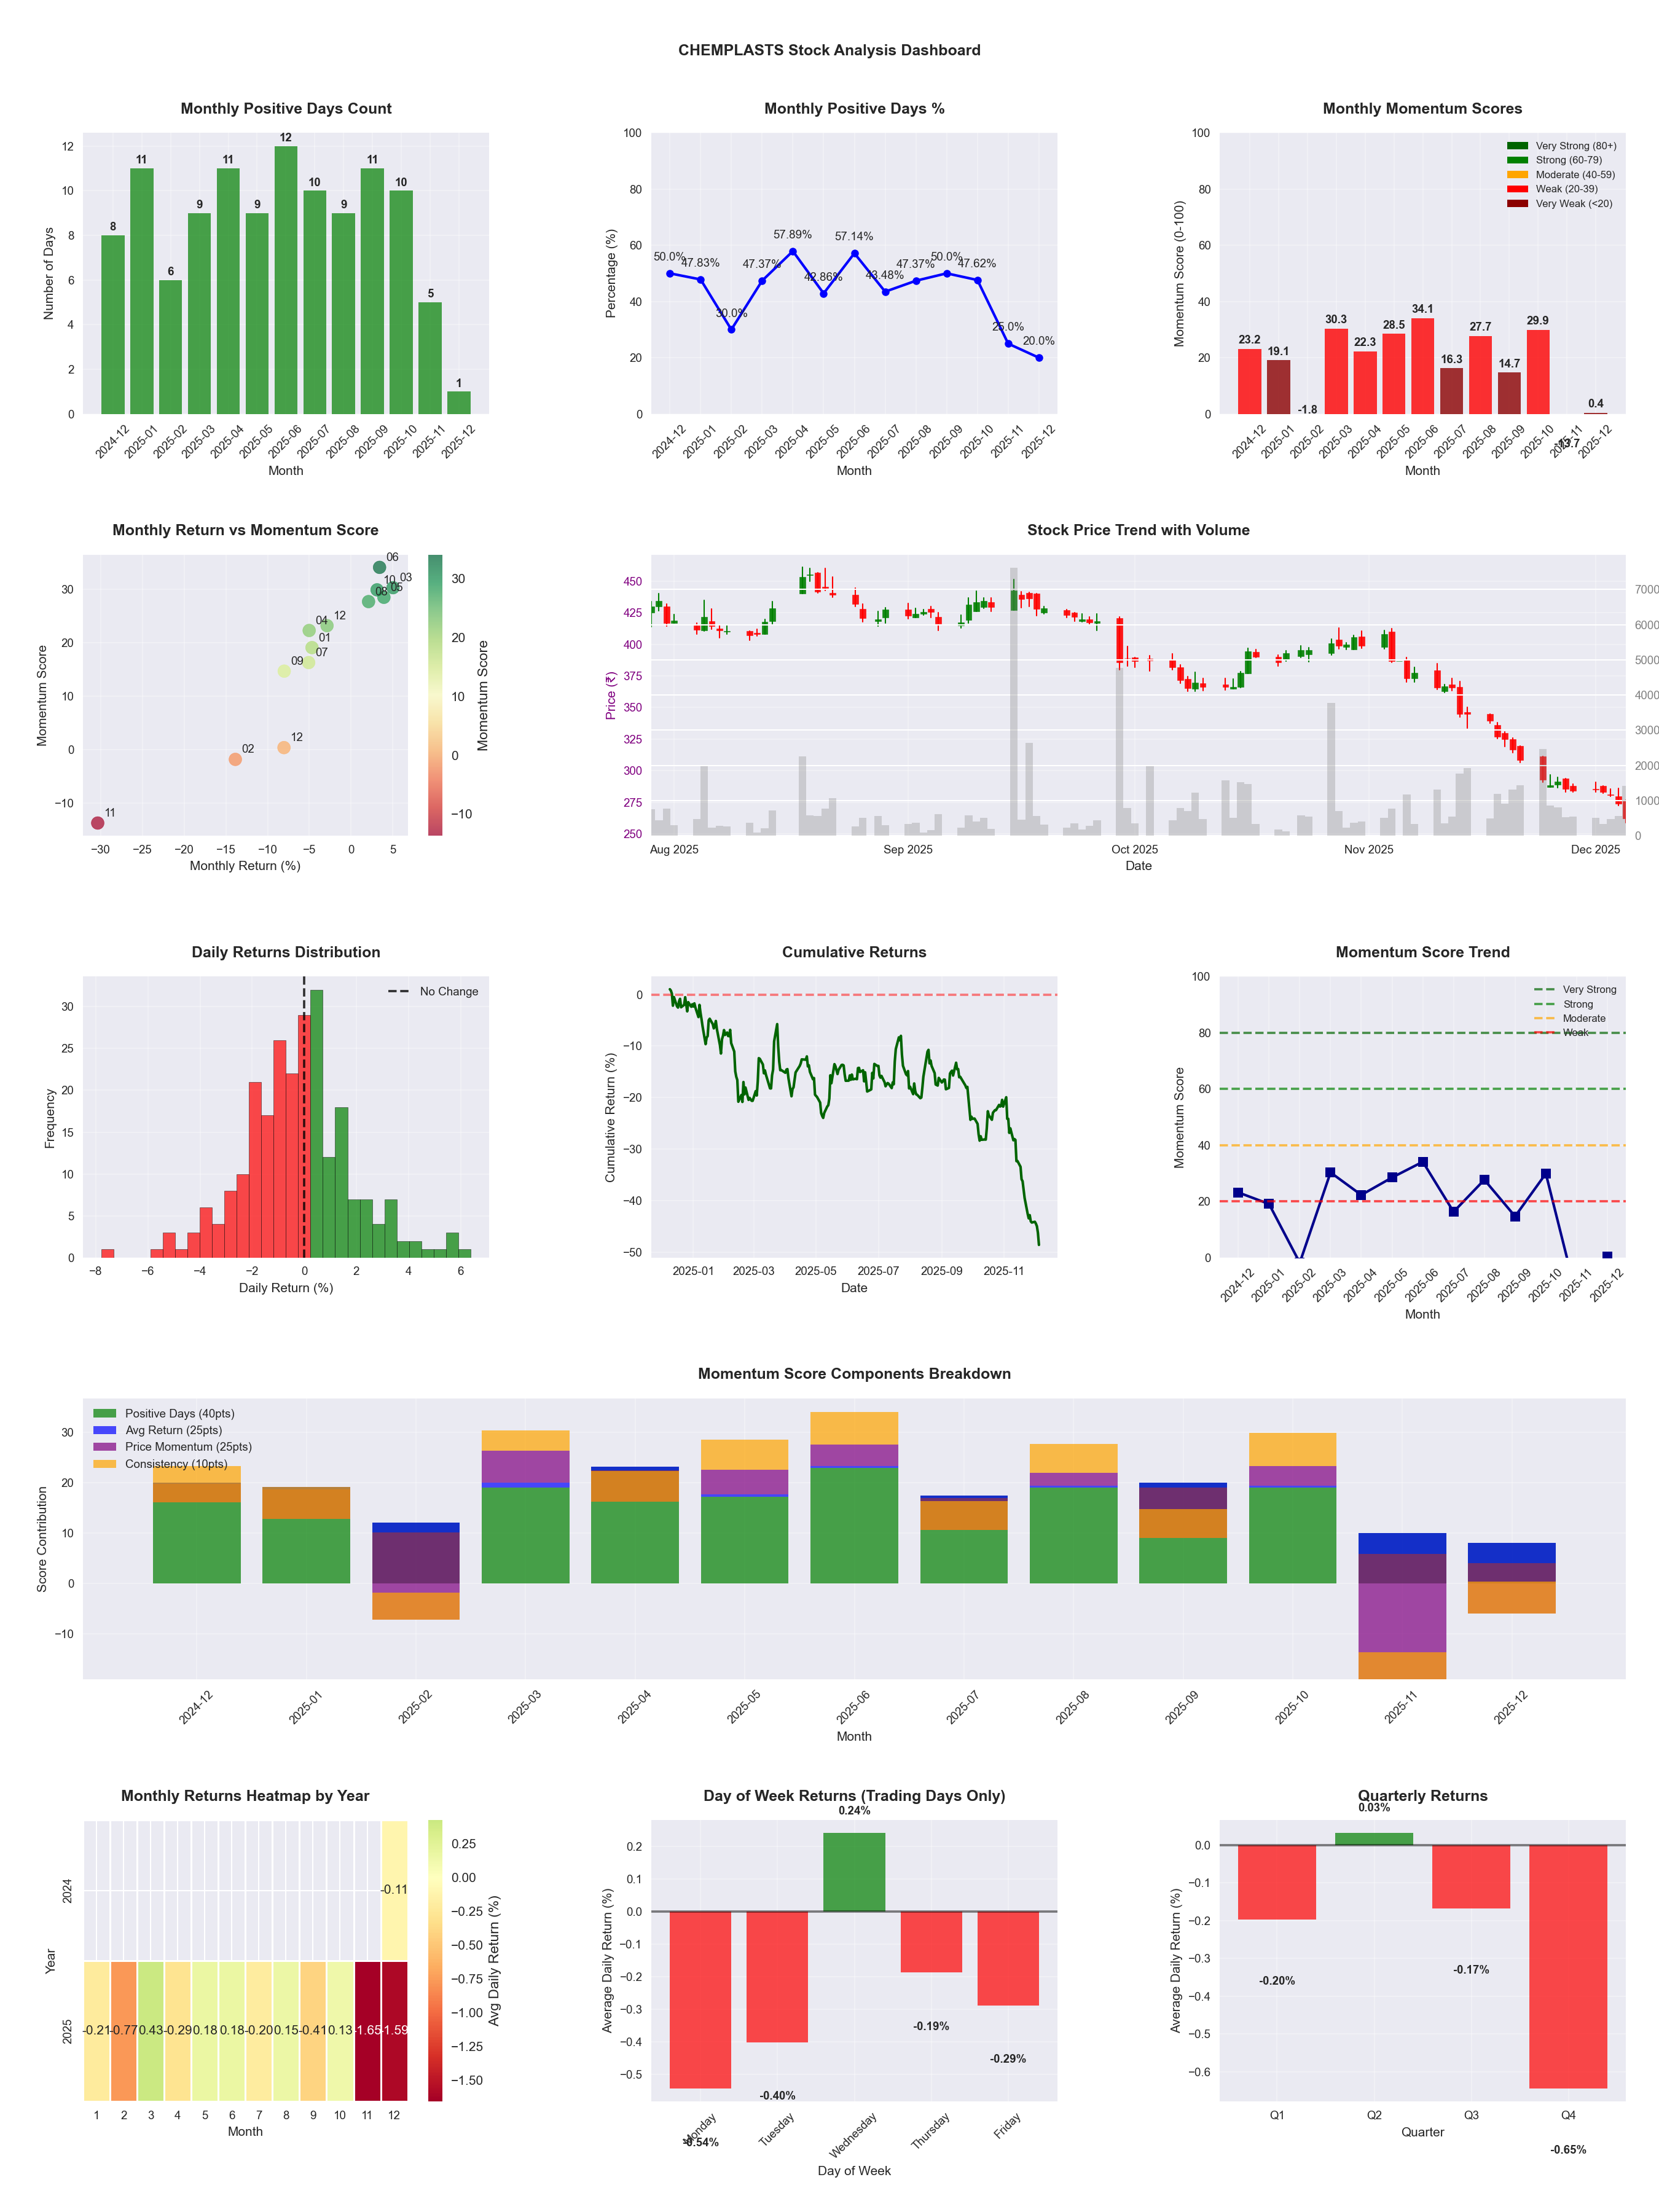
📈 CHEMPLASTS
Date
📅 2026-03-21
Volatility
🟡 2.77%
Risk Profile
⚠️ suitable for aggressive investors
Win Rate
⚠️ 42.5%
Avg Daily Return
📉 -0.17%
Max Drawdown
📉 -54.25%
Best Month
🏆 2026-03
Best Months to Trade
📅 Mar, May, Jun
Best Days to Trade
📅 Tuesday, Wednesday
📊 Key Insights & Metrics
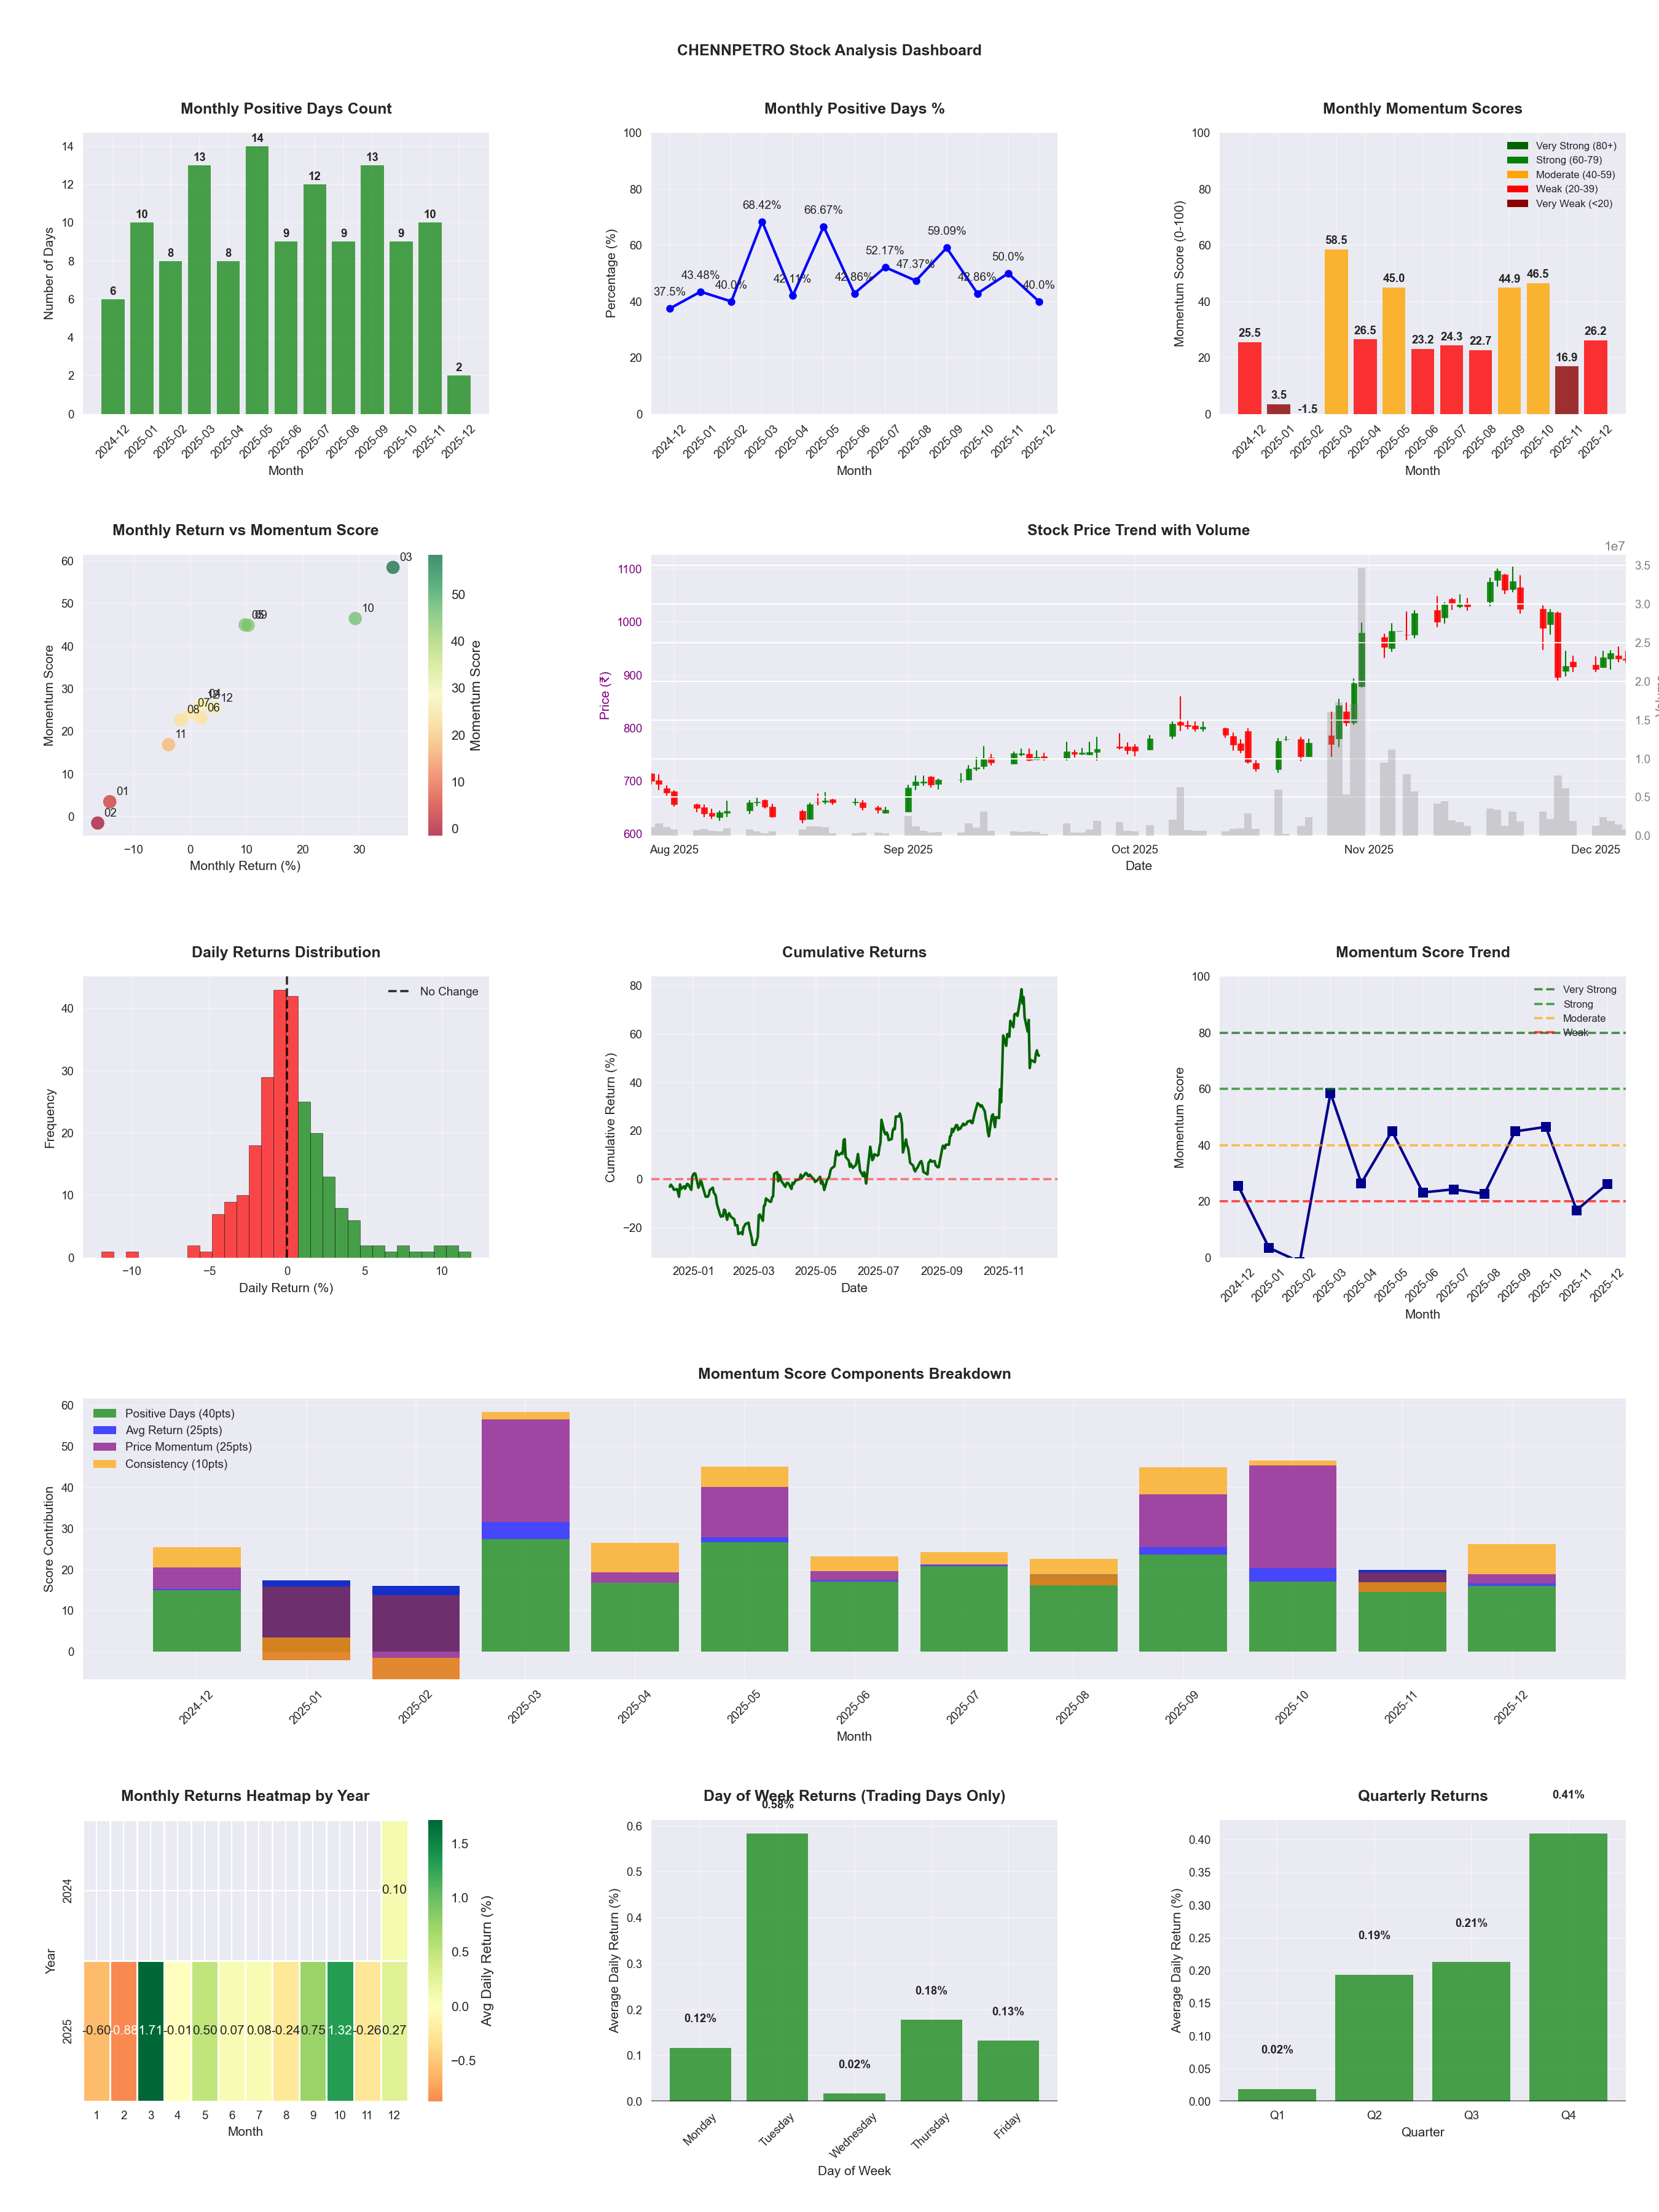
Symbol
📈 CHENNPETRO
Date
📅 2026-04-11
Volatility
🟡 2.99%
Risk Profile
⚠️ suitable for aggressive investors
Win Rate
⚠️ 48.4%
Avg Daily Return
📈 +0.24%
Max Drawdown
📉 -28.62%
IBD RS Score
📊 96.1
Leader
Market Rank
#19
Best Month
🏆 2025-10
Worst Month
📉 2025-12
Best Months to Trade
📅 Oct, Sep, Feb
Best Days to Trade
📅 Monday, Wednesday
📊 Key Insights & Metrics
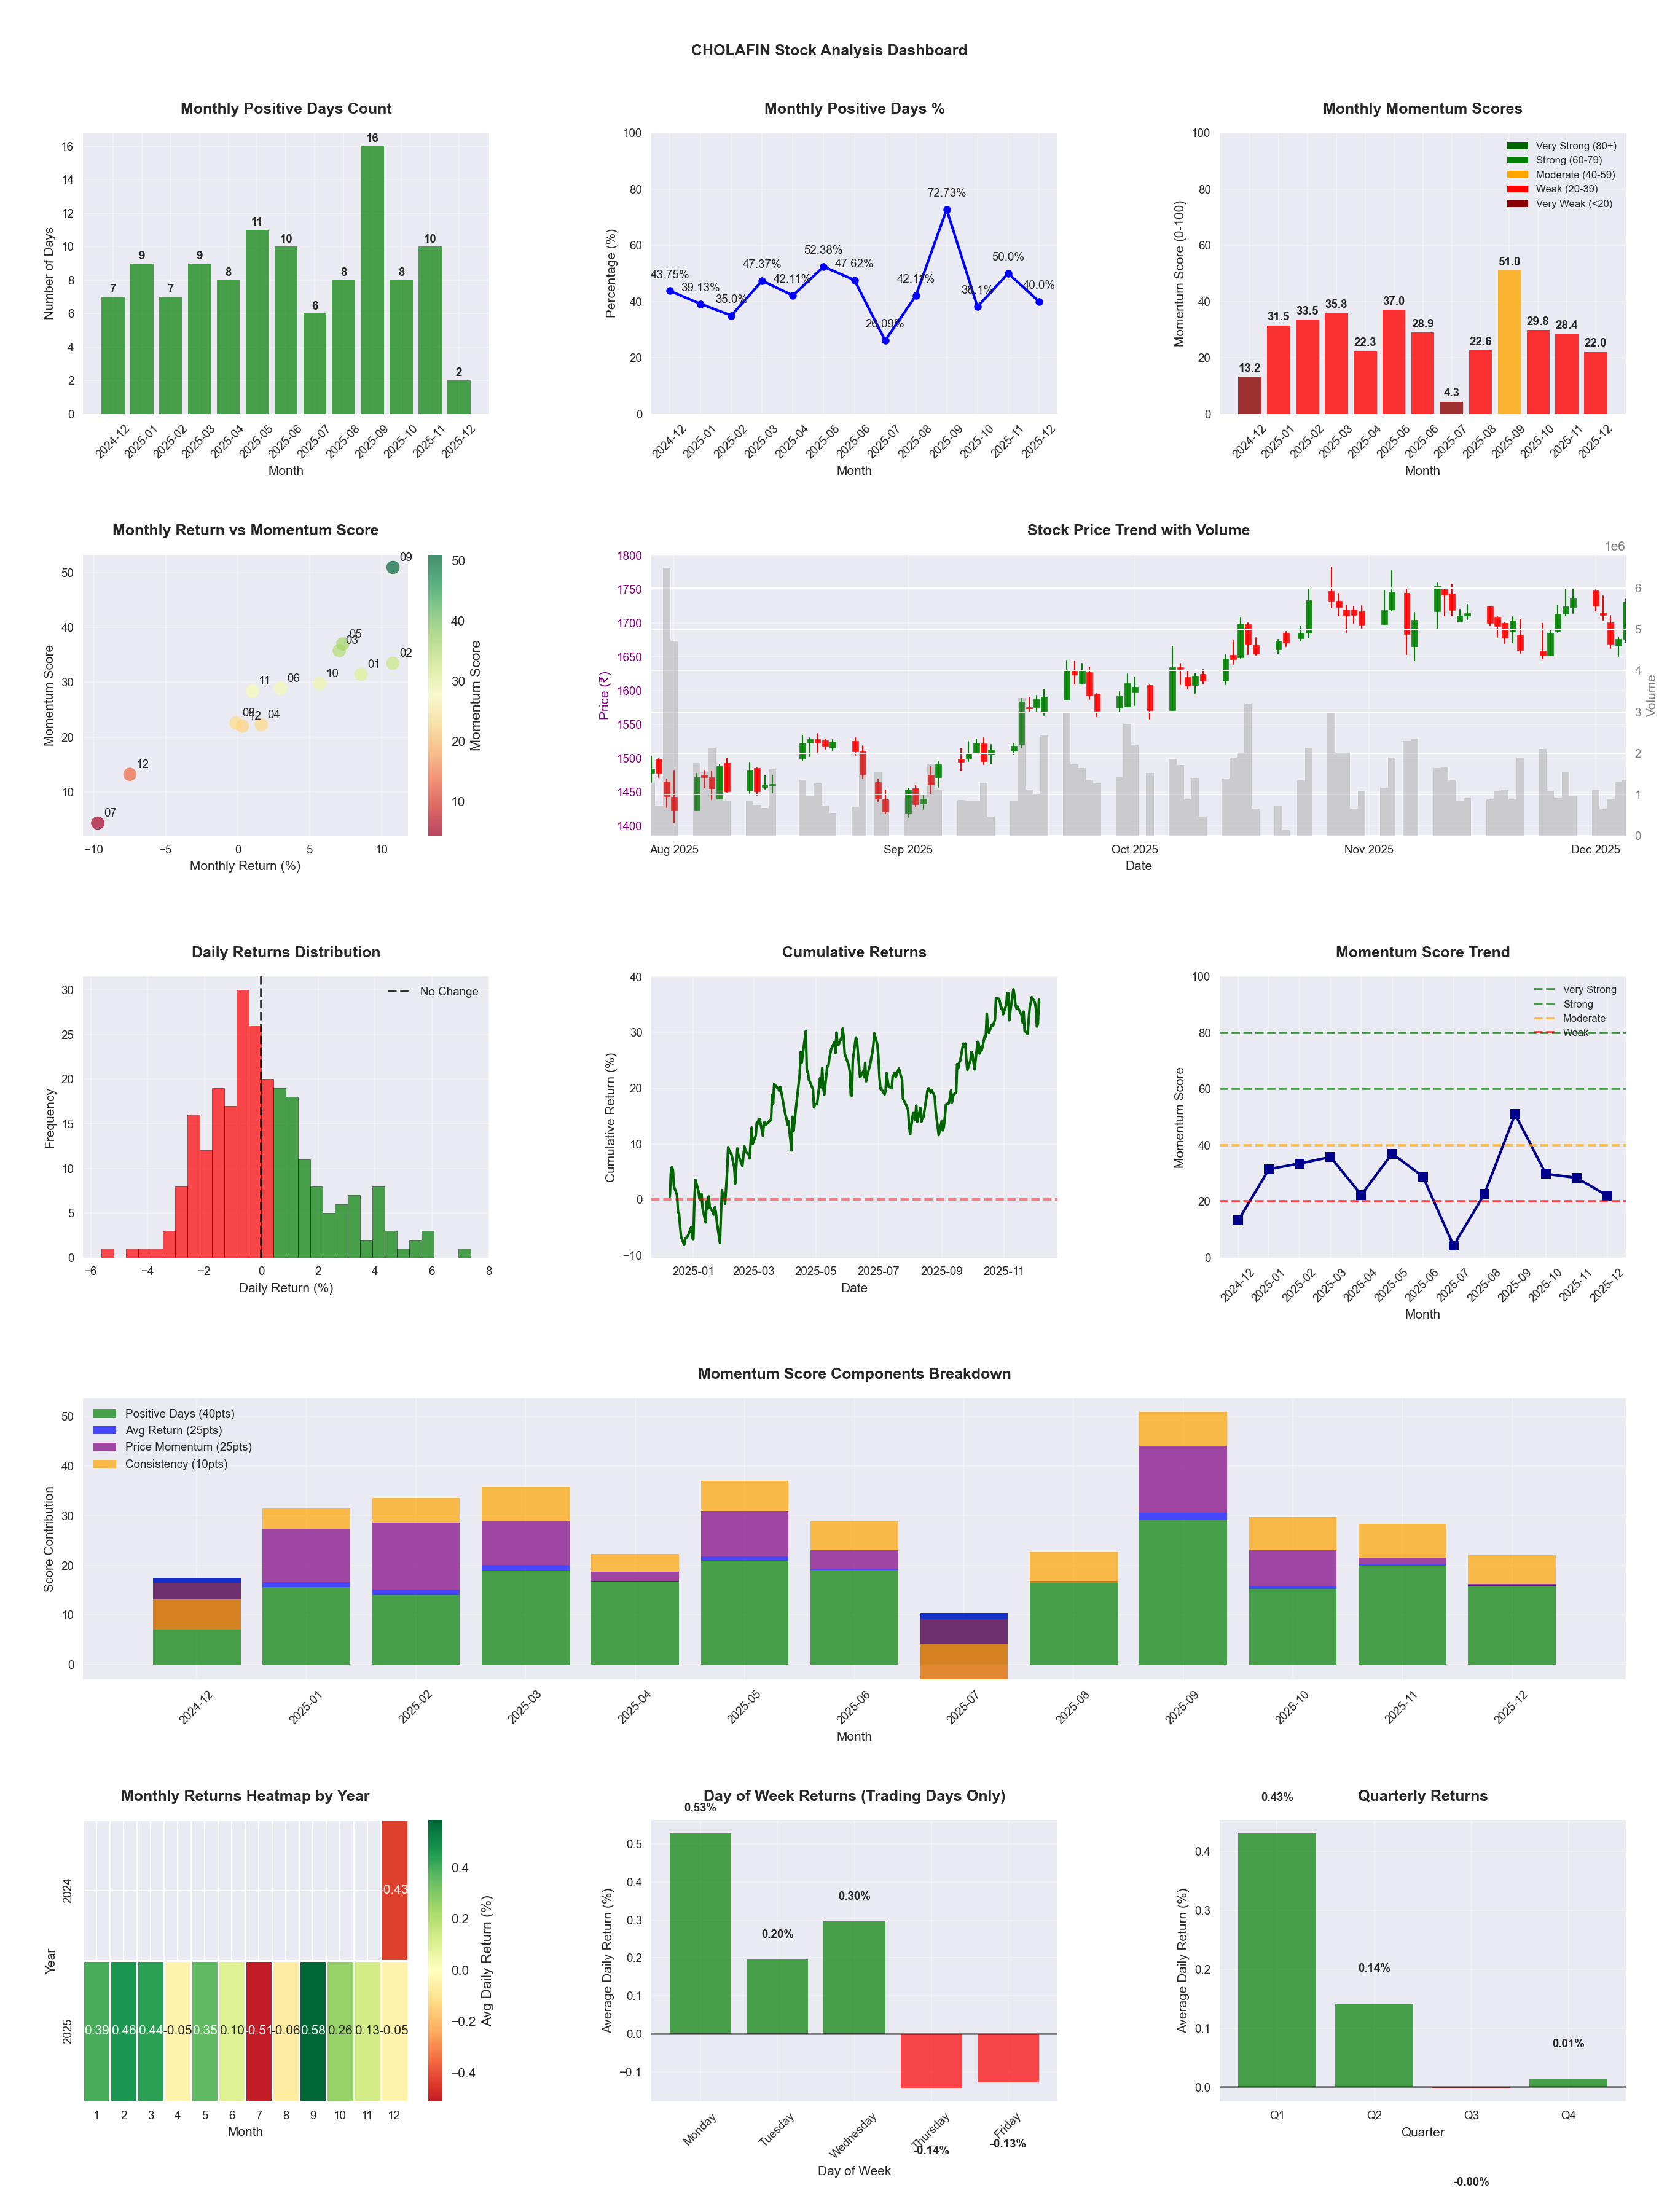
Symbol
📈 CHOLAFIN
Date
📅 2026-04-11
Volatility
🟡 2.05%
Risk Profile
⚠️ suitable for aggressive investors
Win Rate
⚠️ 46.3%
Avg Daily Return
📈 +0.05%
Max Drawdown
📉 -24.91%
IBD RS Score
📊 55.8
Average
Market Rank
#218
Best Month
🏆 2026-04
Best Months to Trade
📅 Apr, Sep, May
Best Days to Trade
📅 Monday, Tuesday
📊 Key Insights & Metrics
Symbol
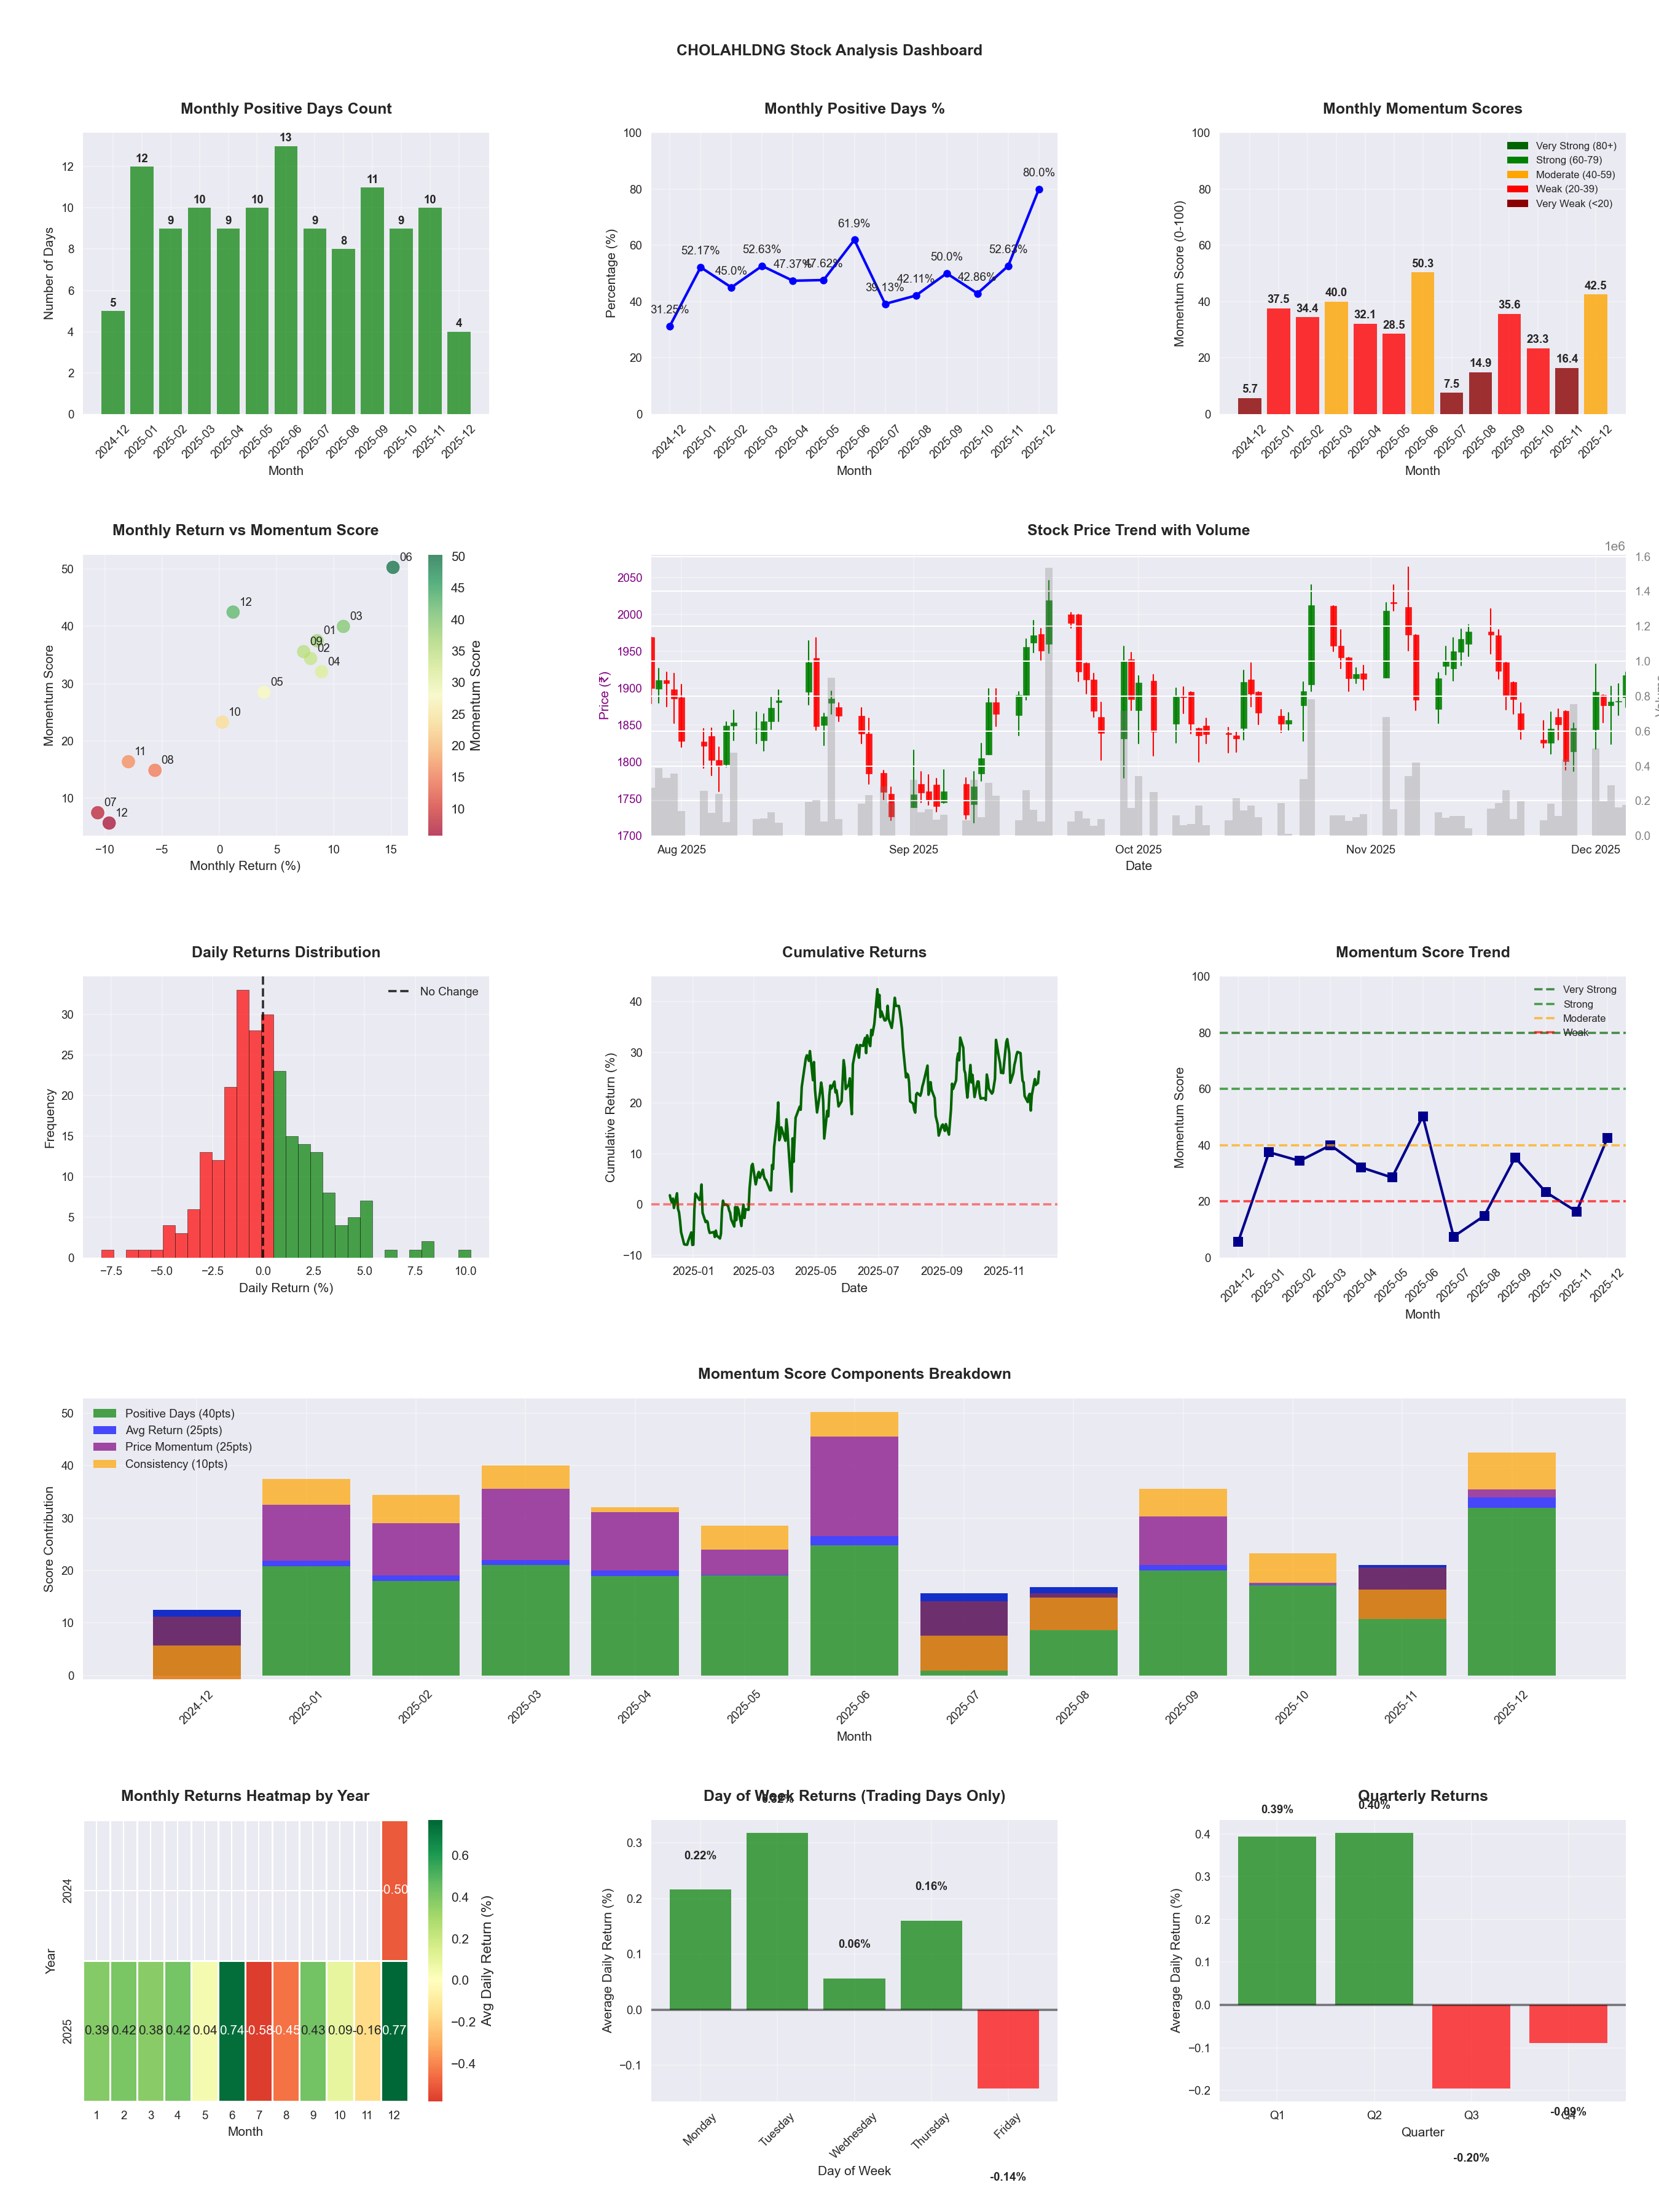
📈 CHOLAHLDNG
Date
📅 2026-04-11
Volatility
🟡 2.48%
Risk Profile
⚠️ suitable for aggressive investors
Win Rate
⚠️ 45.5%
Avg Daily Return
📉 -0.01%
Max Drawdown
📉 -37.59%
IBD RS Score
📊 25.8
Weak
Market Rank
#366
Best Month
🏆 2026-04
Best Months to Trade
📅 Apr, Jun, Sep
Best Days to Trade
📅 Wednesday, Monday
📊 Key Insights & Metrics
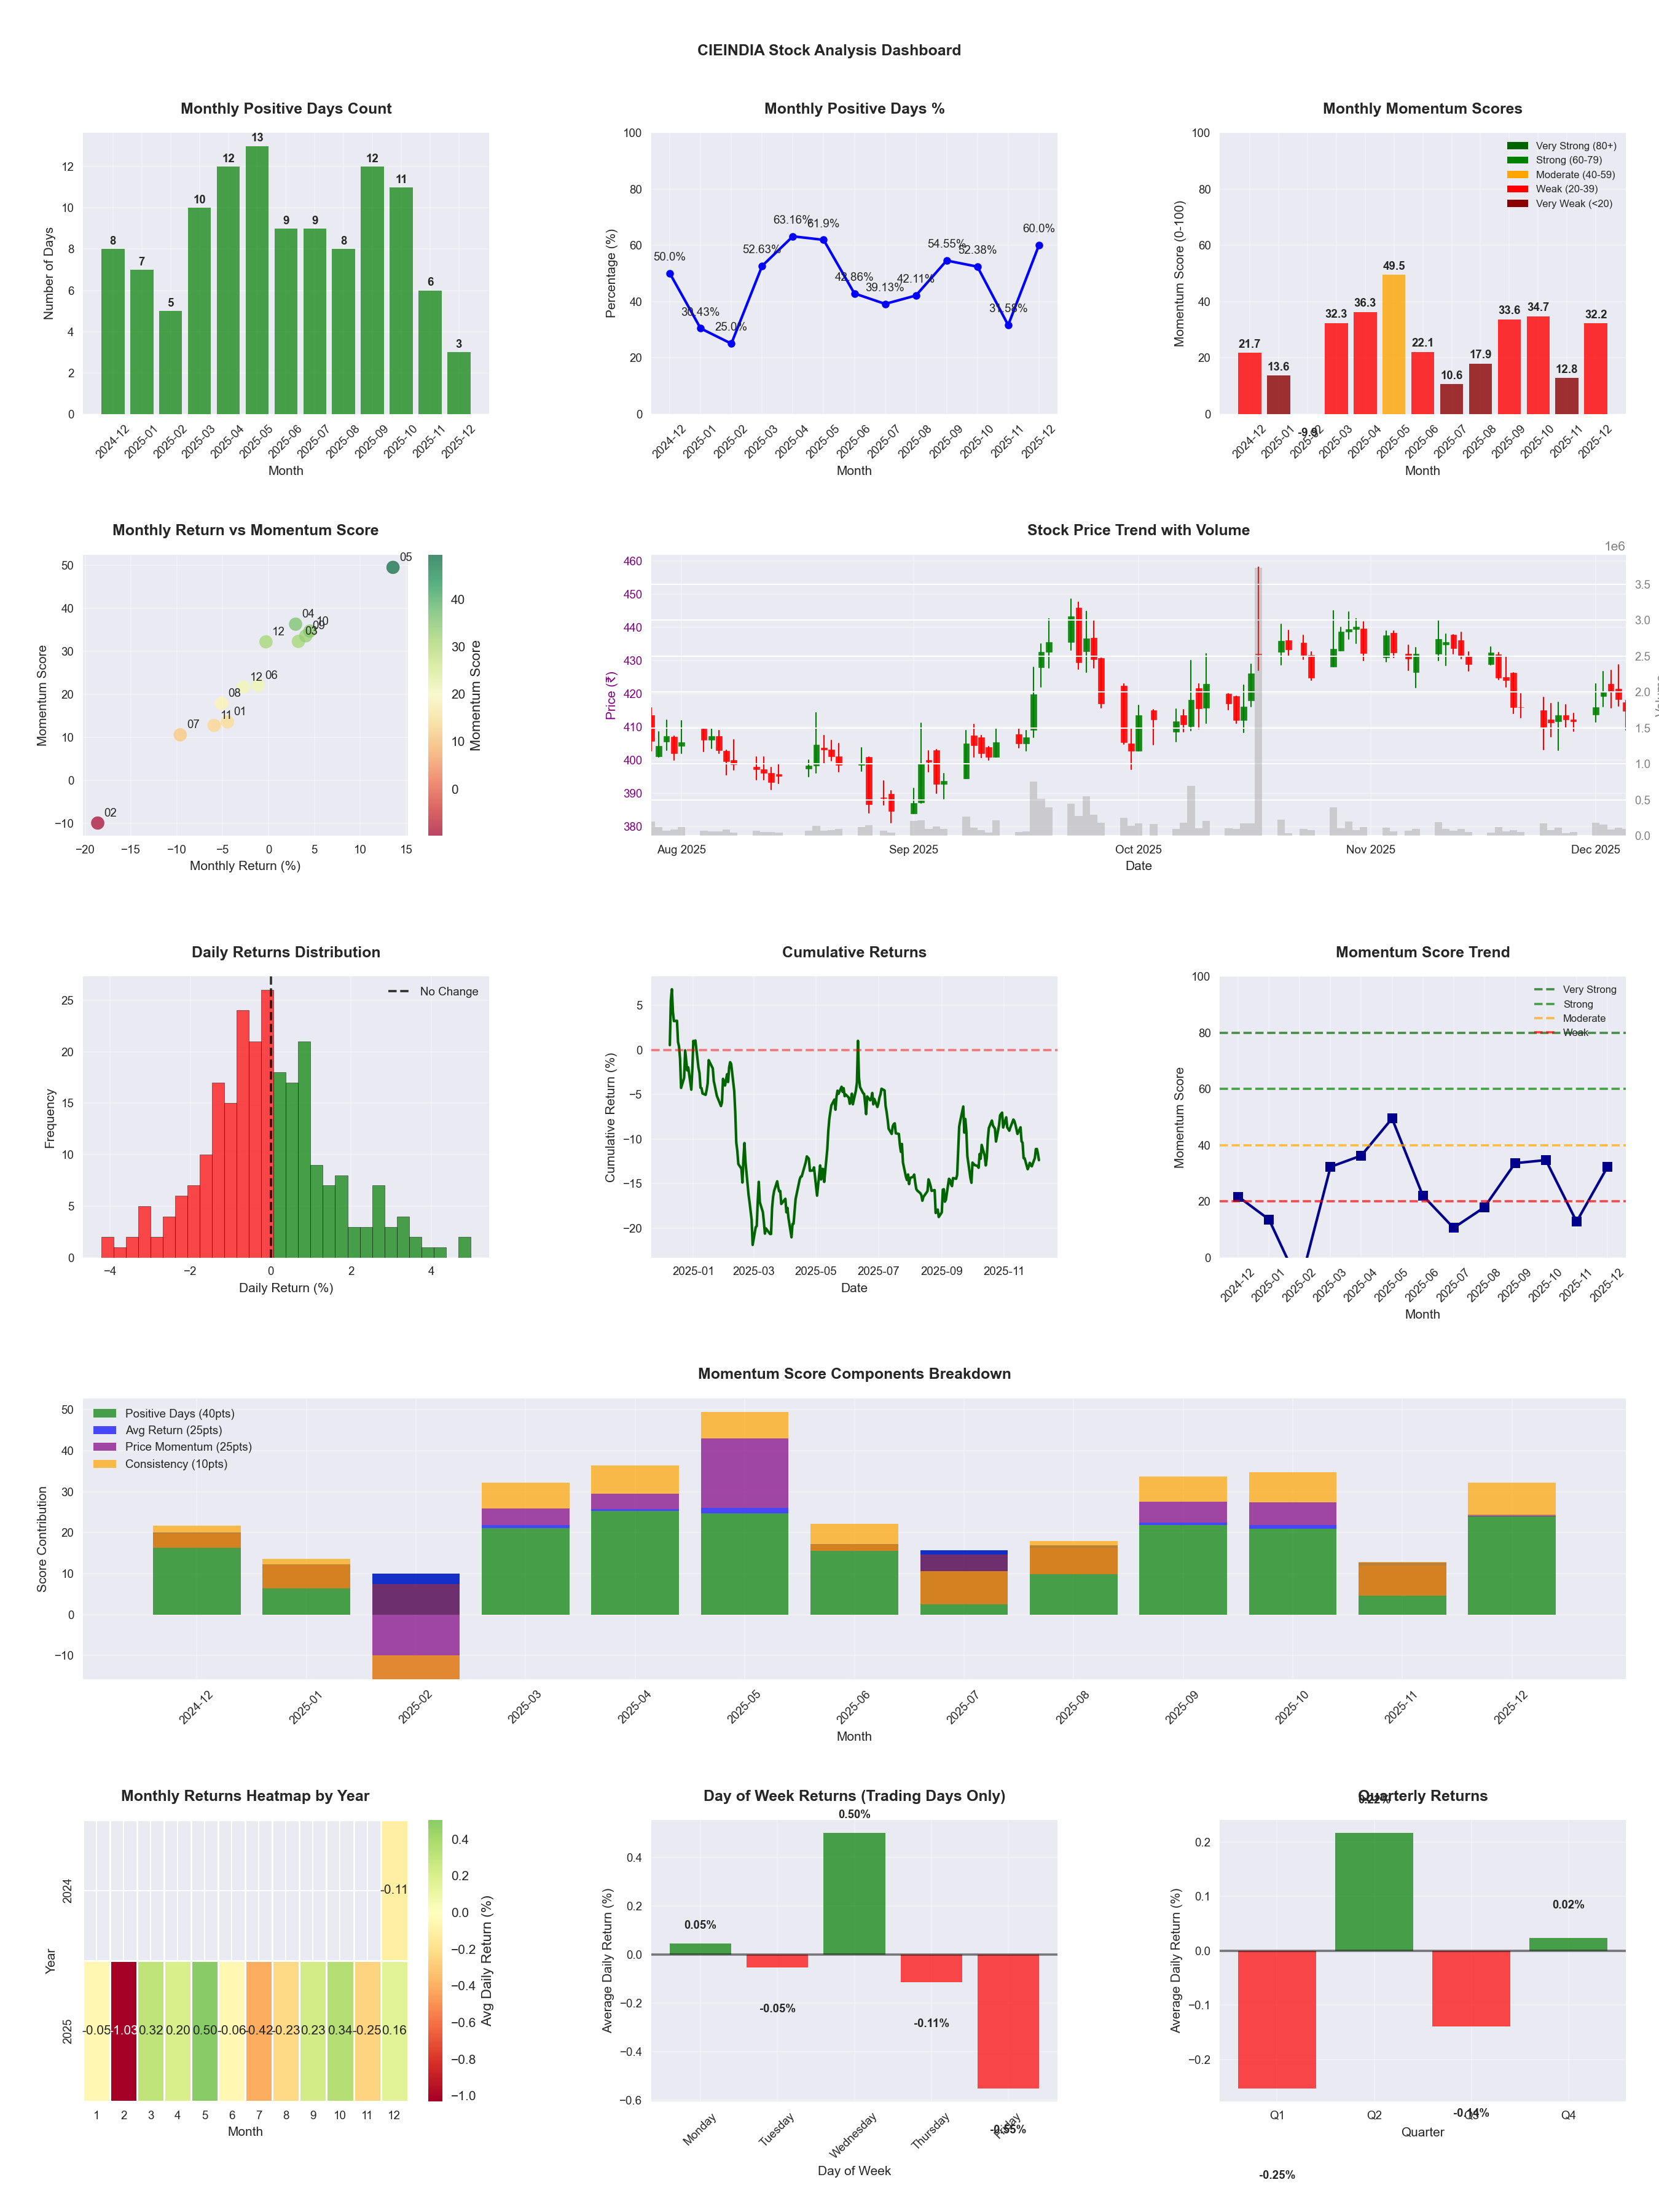
Symbol
📈 CIEINDIA
Date
📅 2026-03-21
Volatility
🟡 1.73%
Win Rate
⚠️ 49.2%
Avg Daily Return
📈 +0.07%
Max Drawdown
📉 -19.57%
Best Month
🏆 2026-02
Worst Month
📉 2025-07
Best Months to Trade
📅 Feb, May, Oct
Best Days to Trade
📅 Wednesday, Monday
📊 Key Insights & Metrics
Symbol
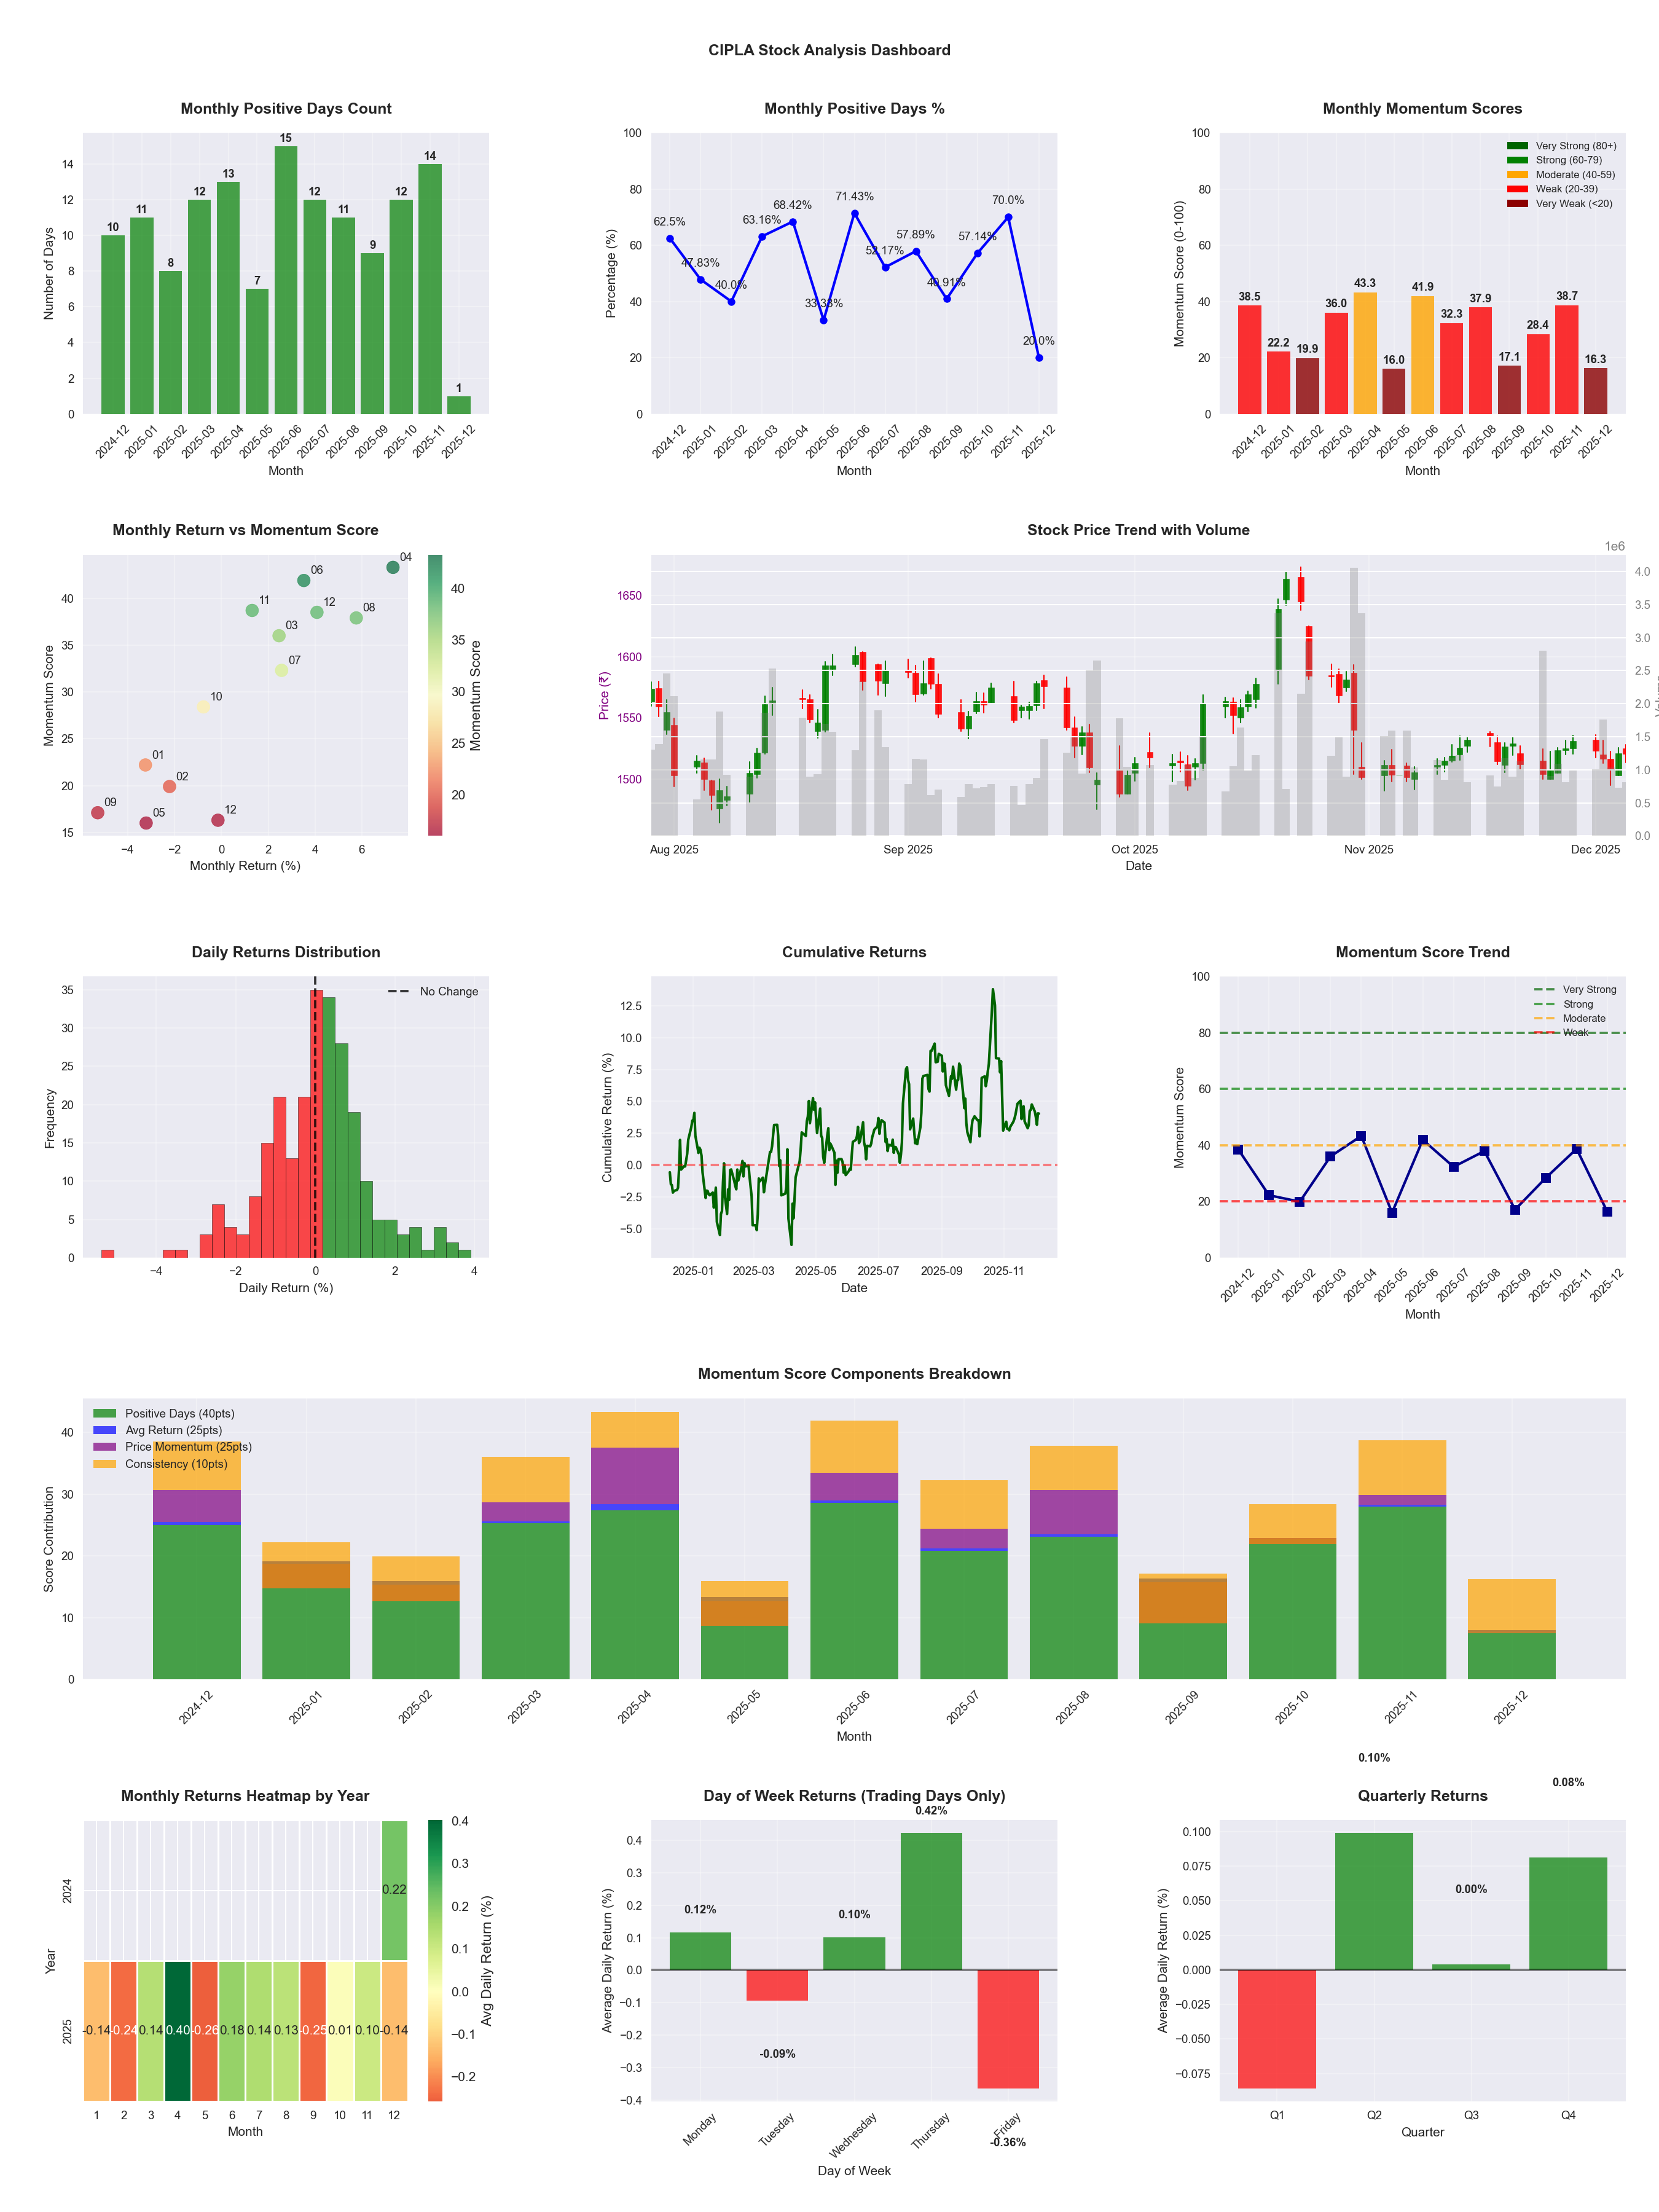
📈 CIPLA
Date
📅 2026-04-11
Volatility
🟢 1.18%
Win Rate
⚠️ 51.2%
Avg Daily Return
📉 -0.06%
Max Drawdown
📉 -28.32%
IBD RS Score
📊 18.3
Weak
Market Rank
#403
Best Month
🏆 2025-04
Worst Month
📉 2026-01
Best Months to Trade
📅 Apr, Jun, Jul
Best Days to Trade
📅 Monday, Wednesday
📊 Key Insights & Metrics
Symbol
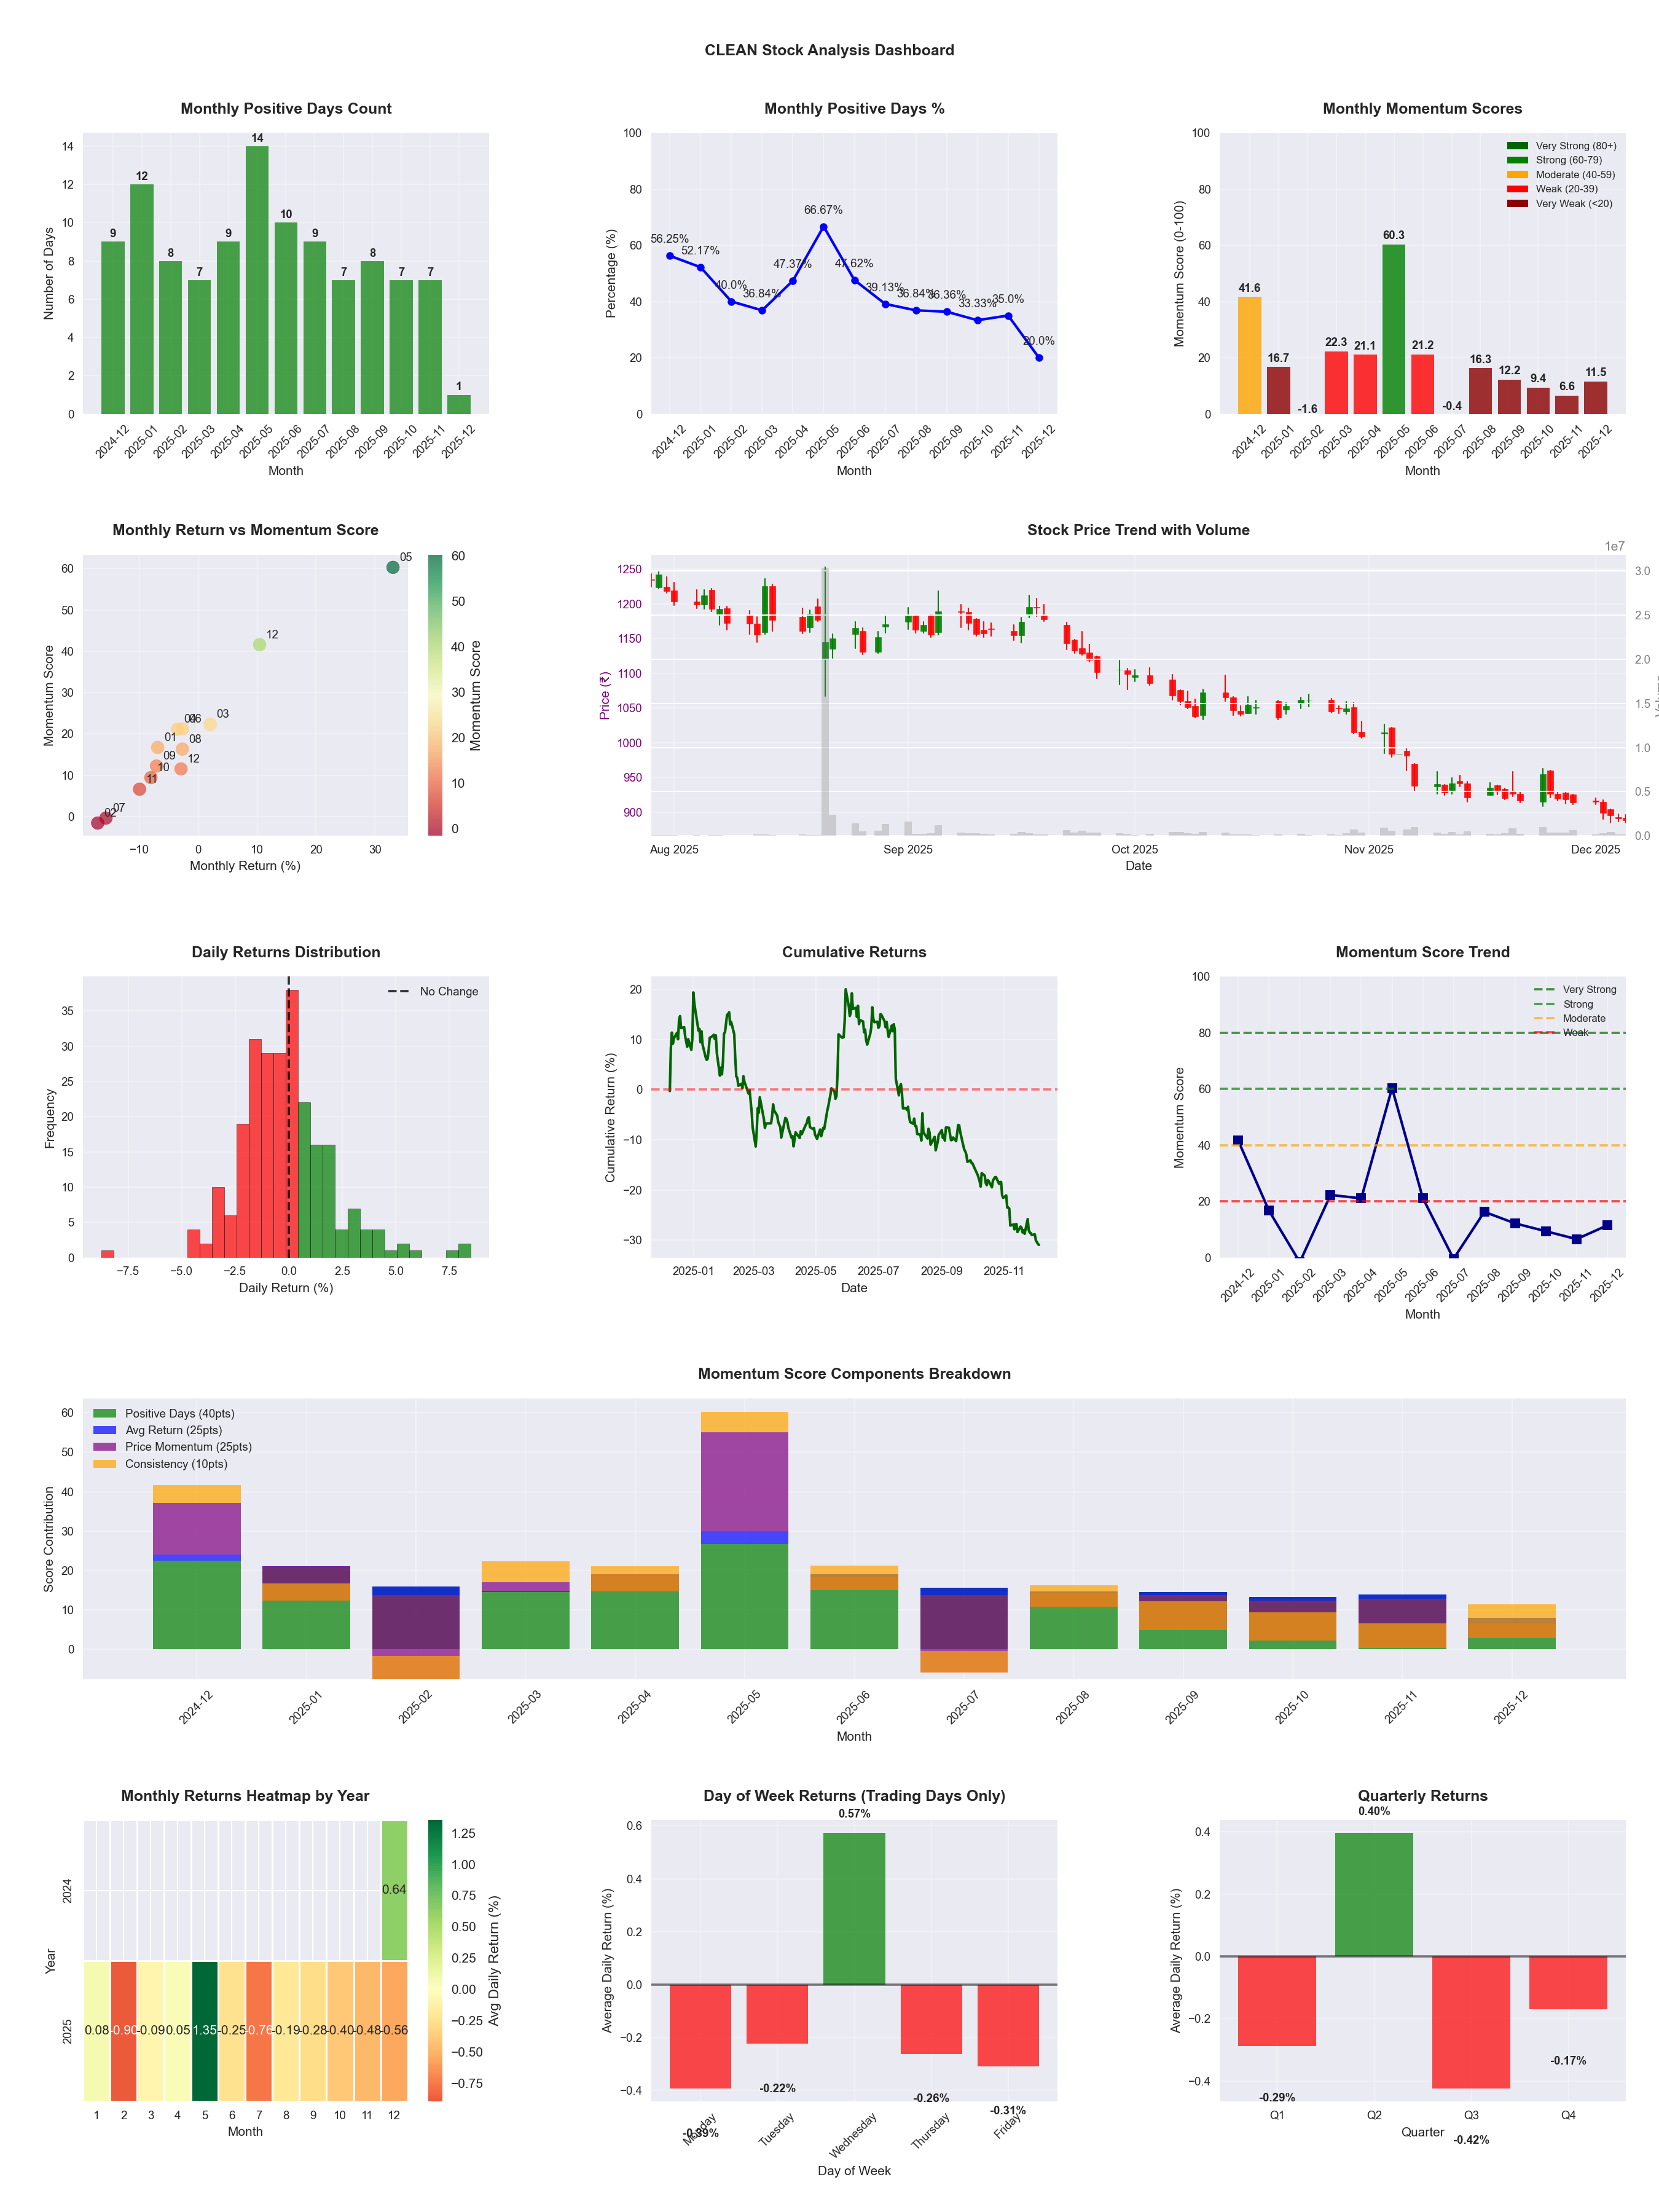
📈 CLEAN
Date
📅 2026-04-11
Volatility
🟡 2.01%
Risk Profile
⚠️ suitable for aggressive investors
Win Rate
⚠️ 43.5%
Avg Daily Return
📉 -0.18%
Max Drawdown
📉 -57.38%
IBD RS Score
📊 3.9
Weak
Market Rank
#474
Best Month
🏆 2025-05
Best Months to Trade
📅 May, Apr, Jan
Best Days to Trade
📅 Wednesday, Thursday
📊 Key Insights & Metrics
Symbol
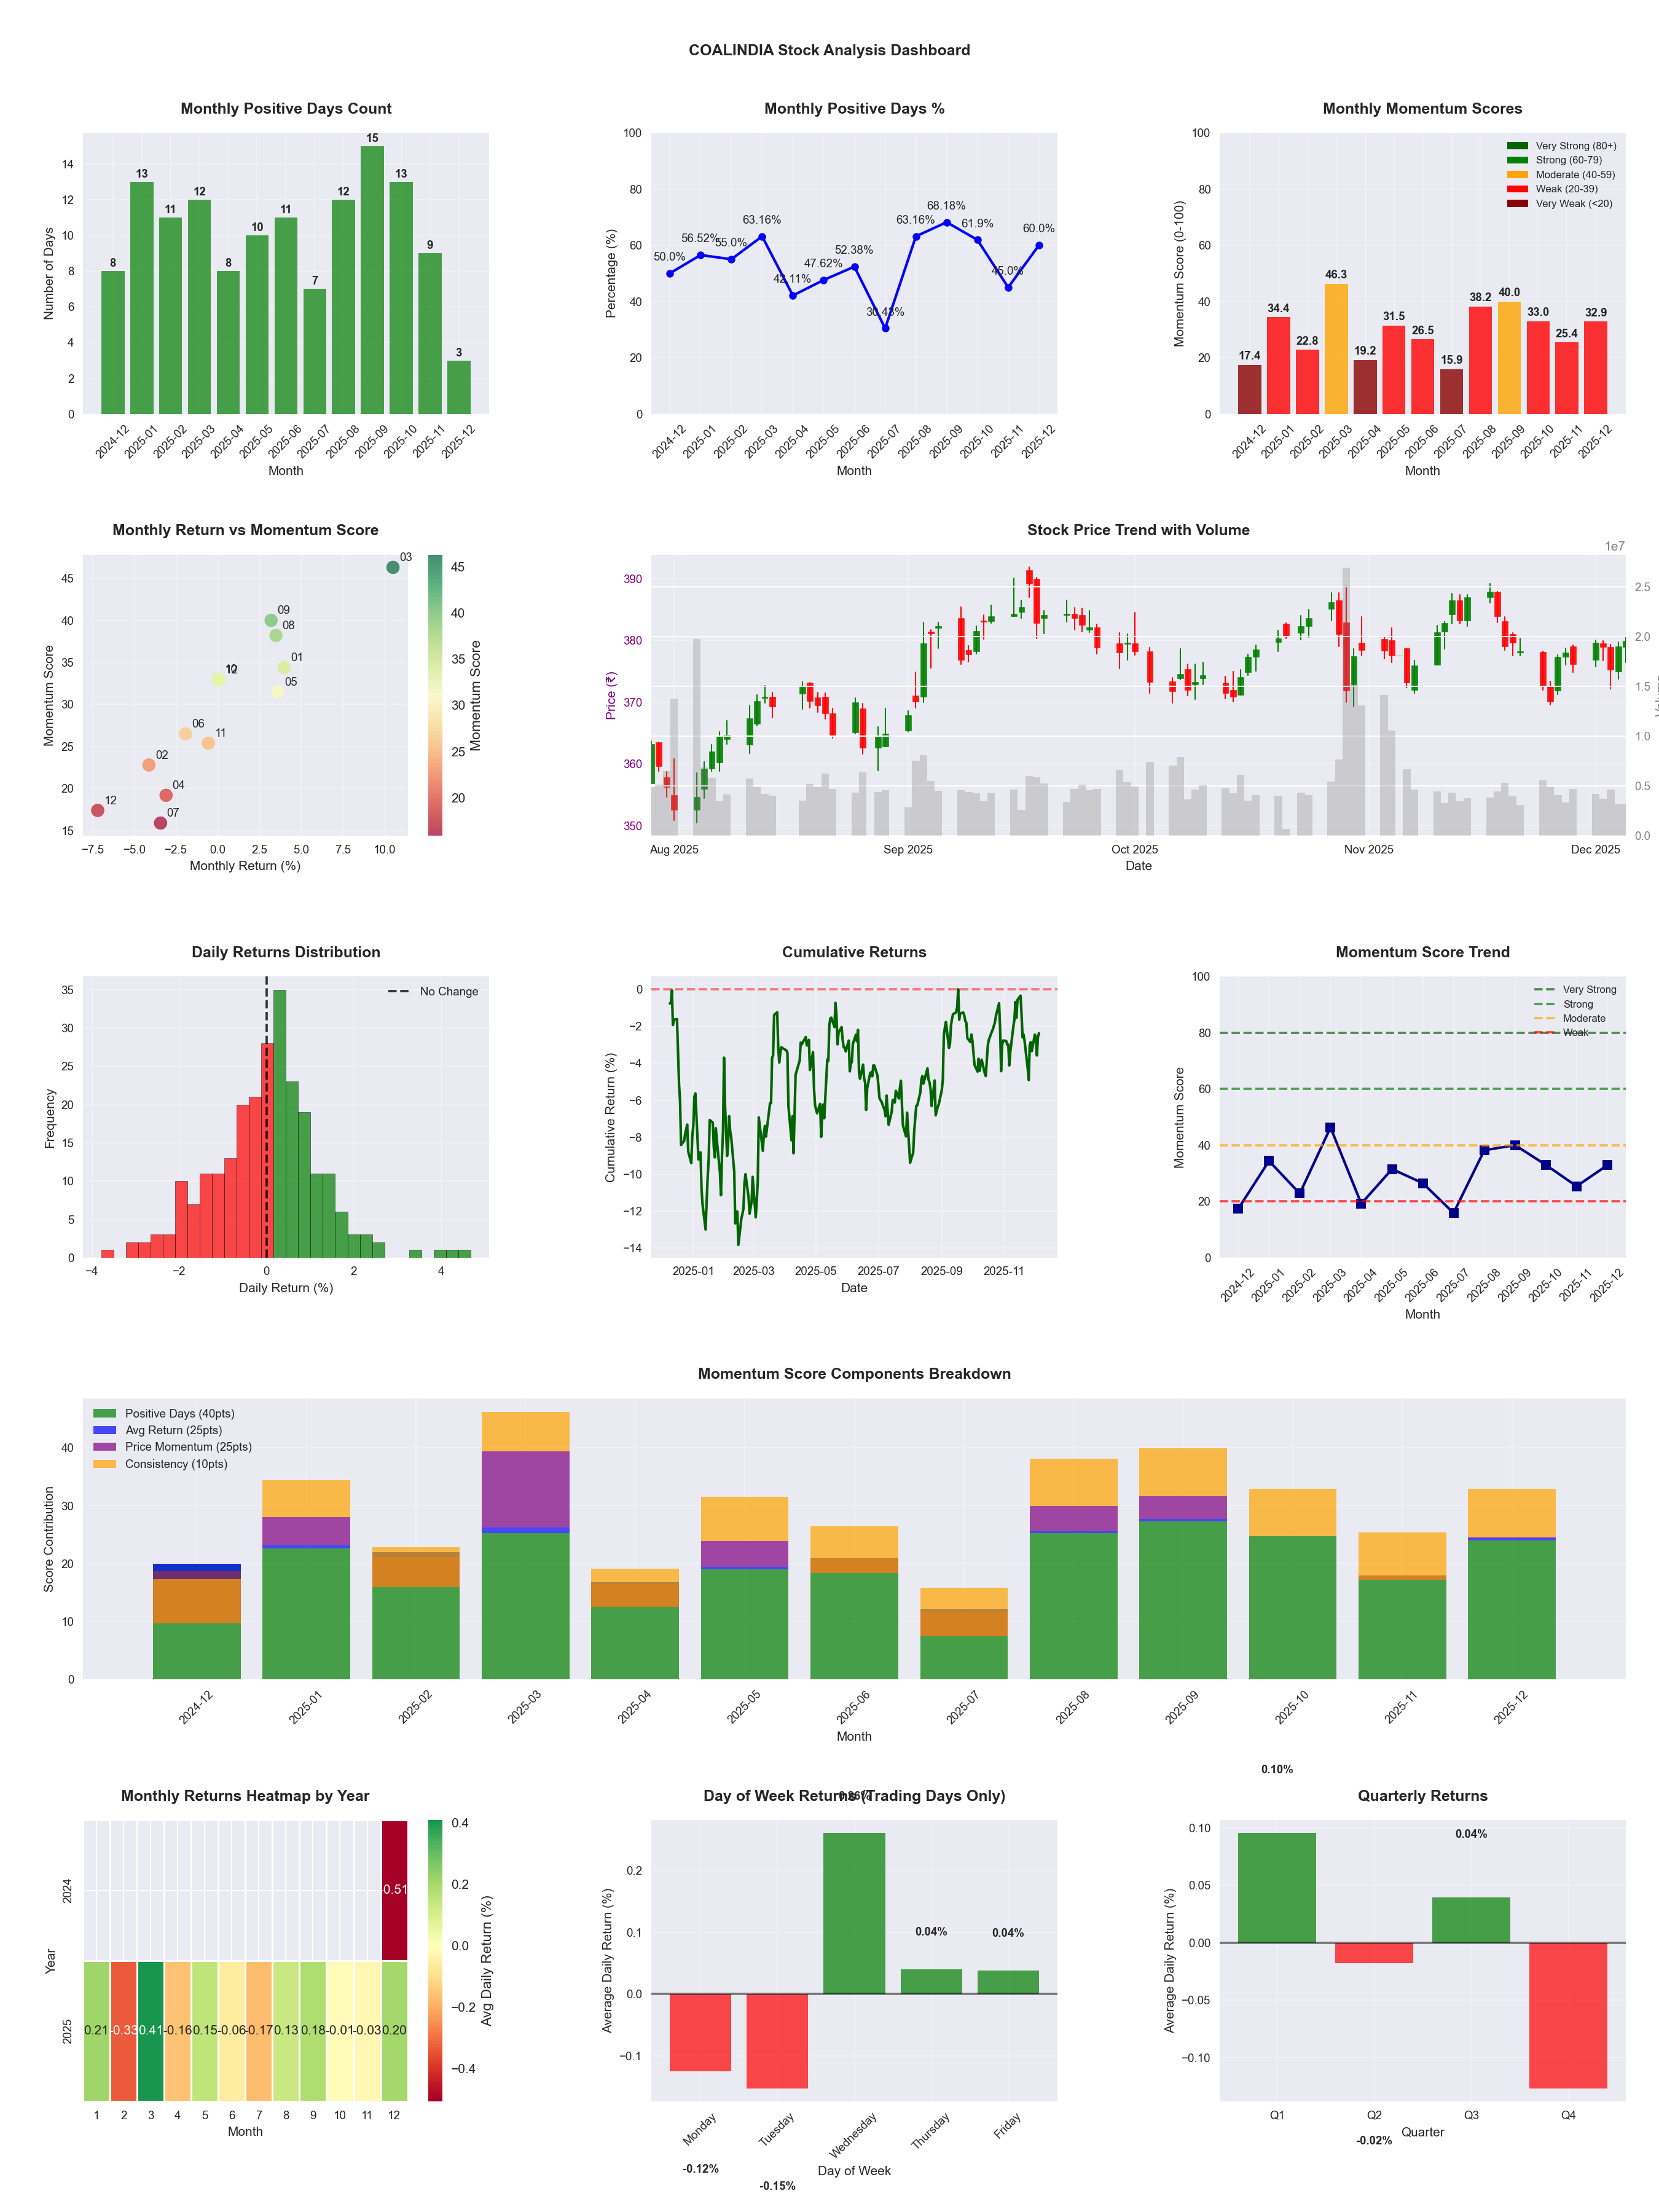
📈 COALINDIA
Date
📅 2026-04-11
Volatility
🟢 1.35%
Win Rate
⚠️ 52.0%
Avg Daily Return
📈 +0.08%
Max Drawdown
📉 -10.27%
IBD RS Score
📊 80.9
Strong
Market Rank
#94
Best Month
🏆 2025-12
Worst Month
📉 2025-07
Best Months to Trade
📅 Jan, Dec, Mar
Best Days to Trade
📅 Wednesday, Monday
📊 Key Insights & Metrics
Symbol
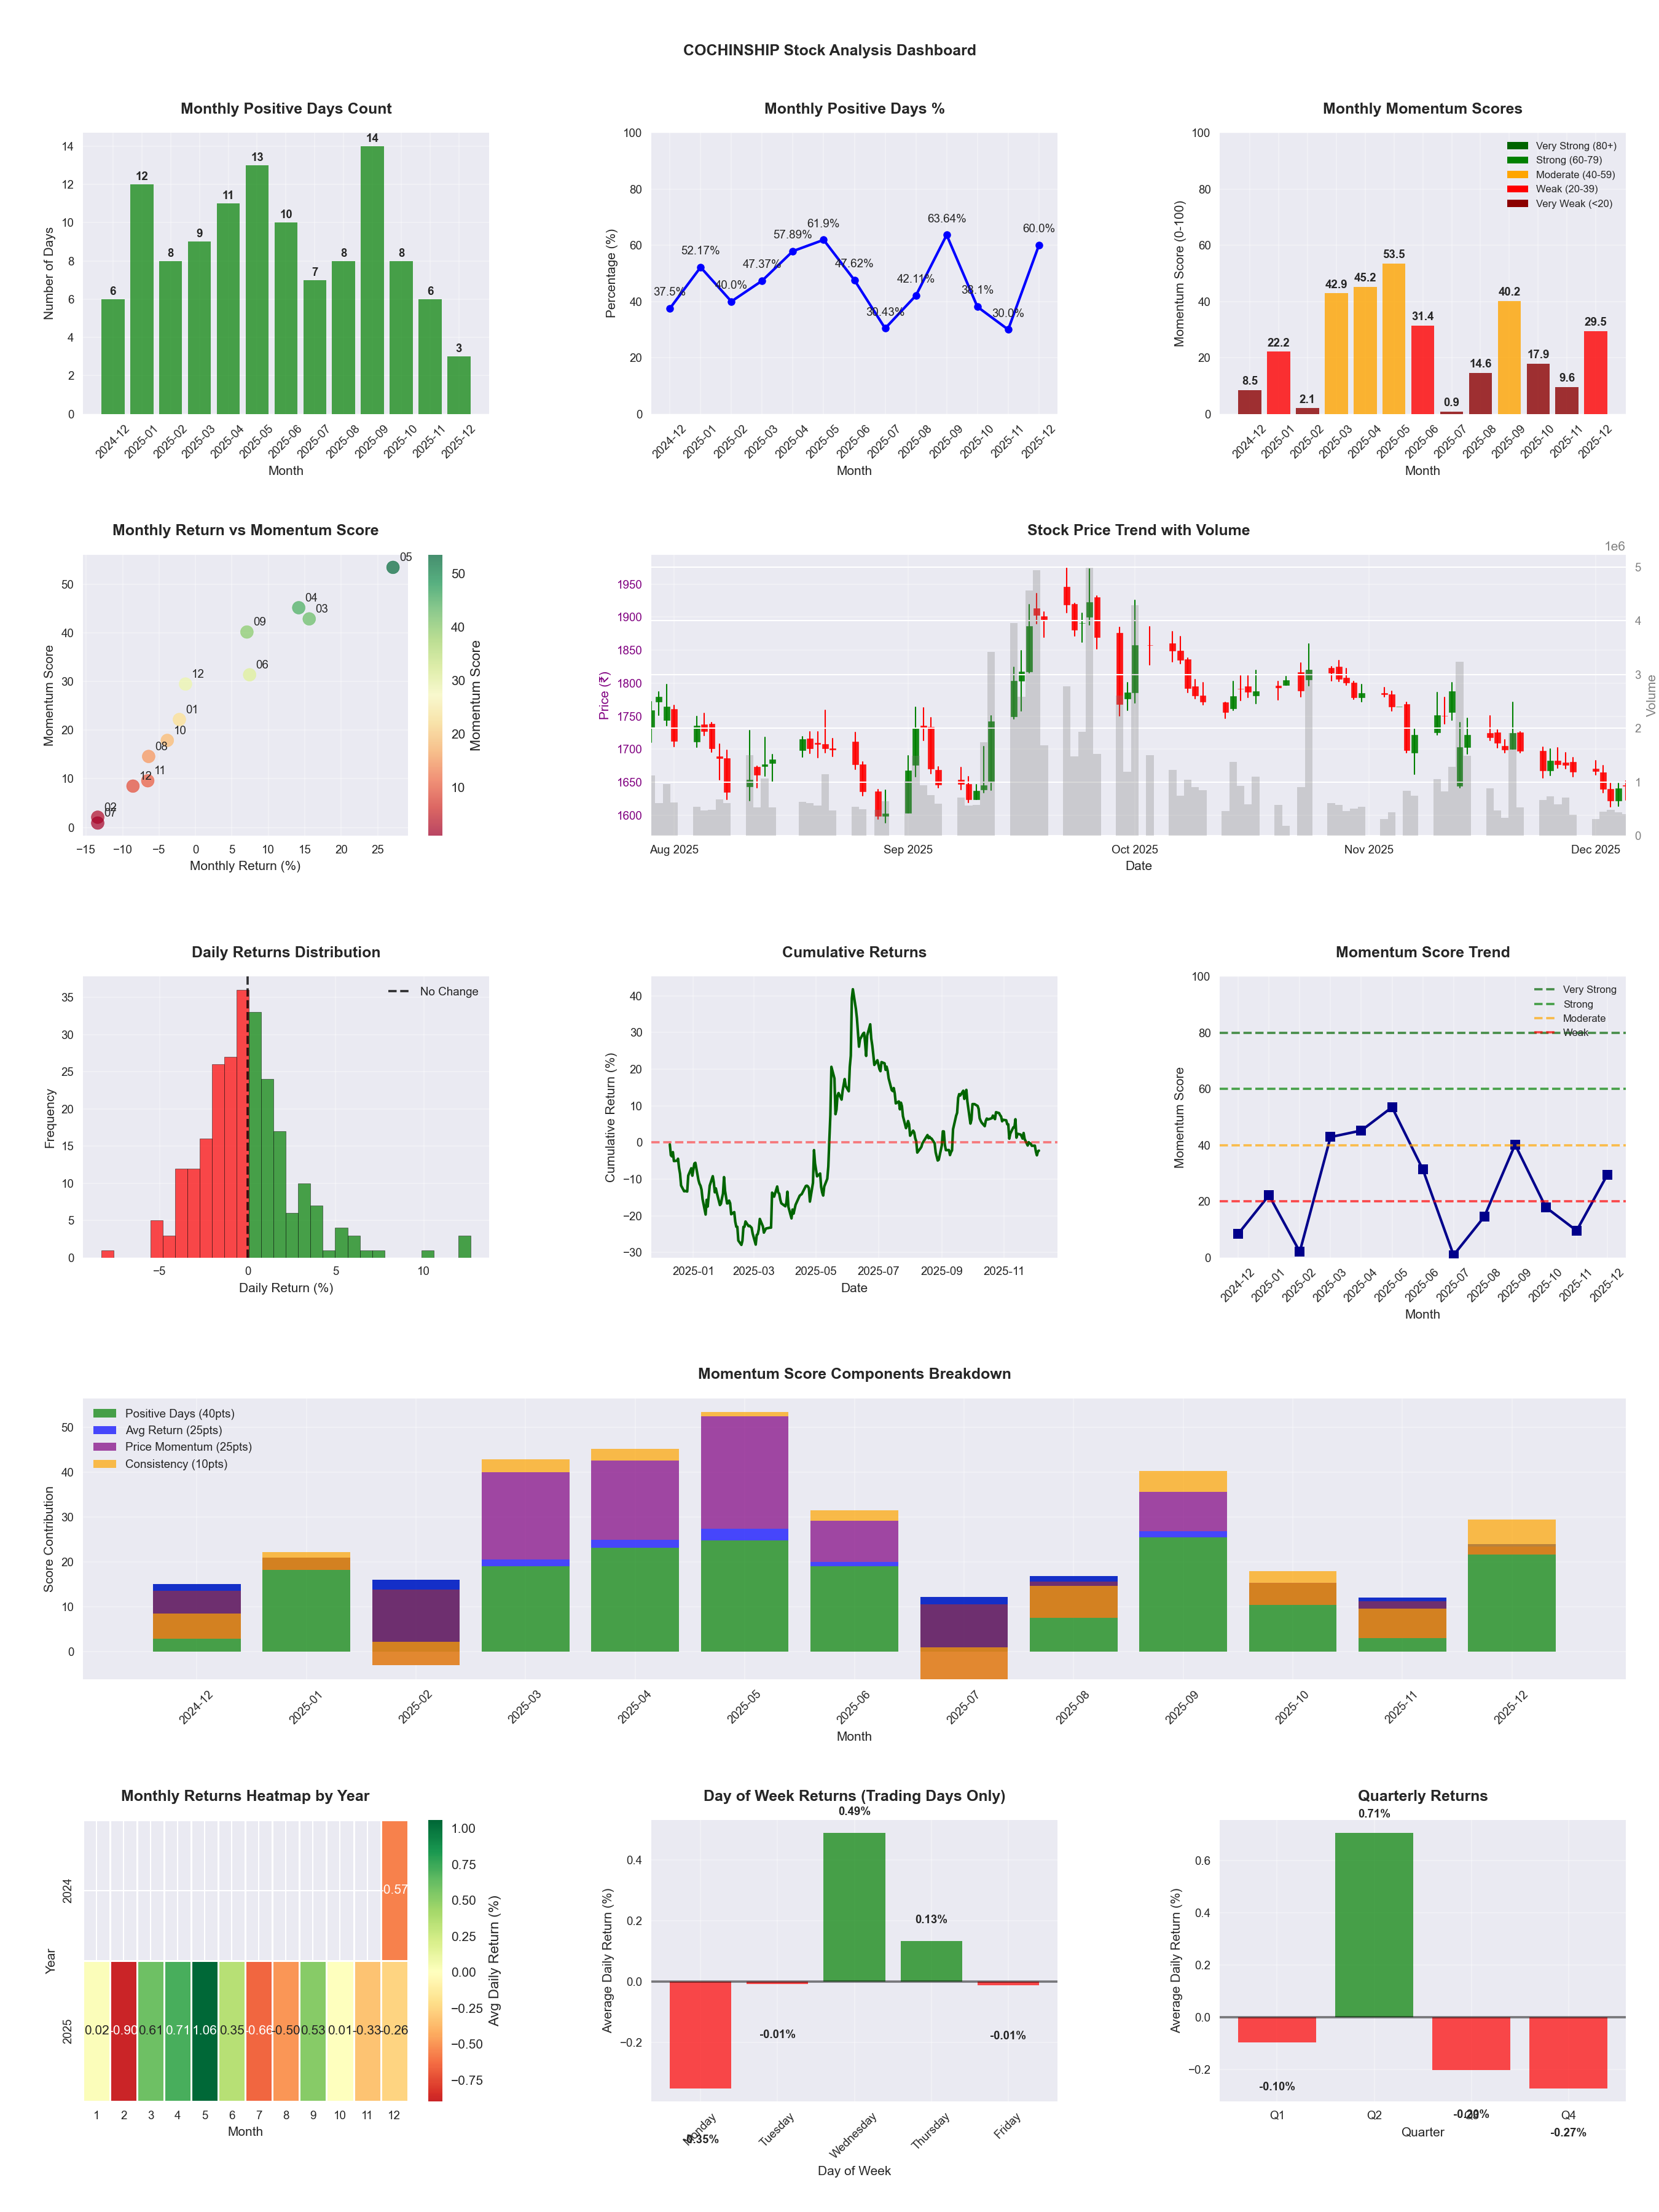
📈 COCHINSHIP
Date
📅 2026-04-11
Volatility
🟡 2.81%
Risk Profile
⚠️ suitable for aggressive investors
Win Rate
⚠️ 45.9%
Avg Daily Return
📈 +0.06%
Max Drawdown
📉 -49.83%
IBD RS Score
📊 37.9
Weak
Market Rank
#306
Best Month
🏆 2026-04
Best Months to Trade
📅 Apr, May, Sep
Best Days to Trade
📅 Wednesday, Friday
📊 Key Insights & Metrics
Symbol
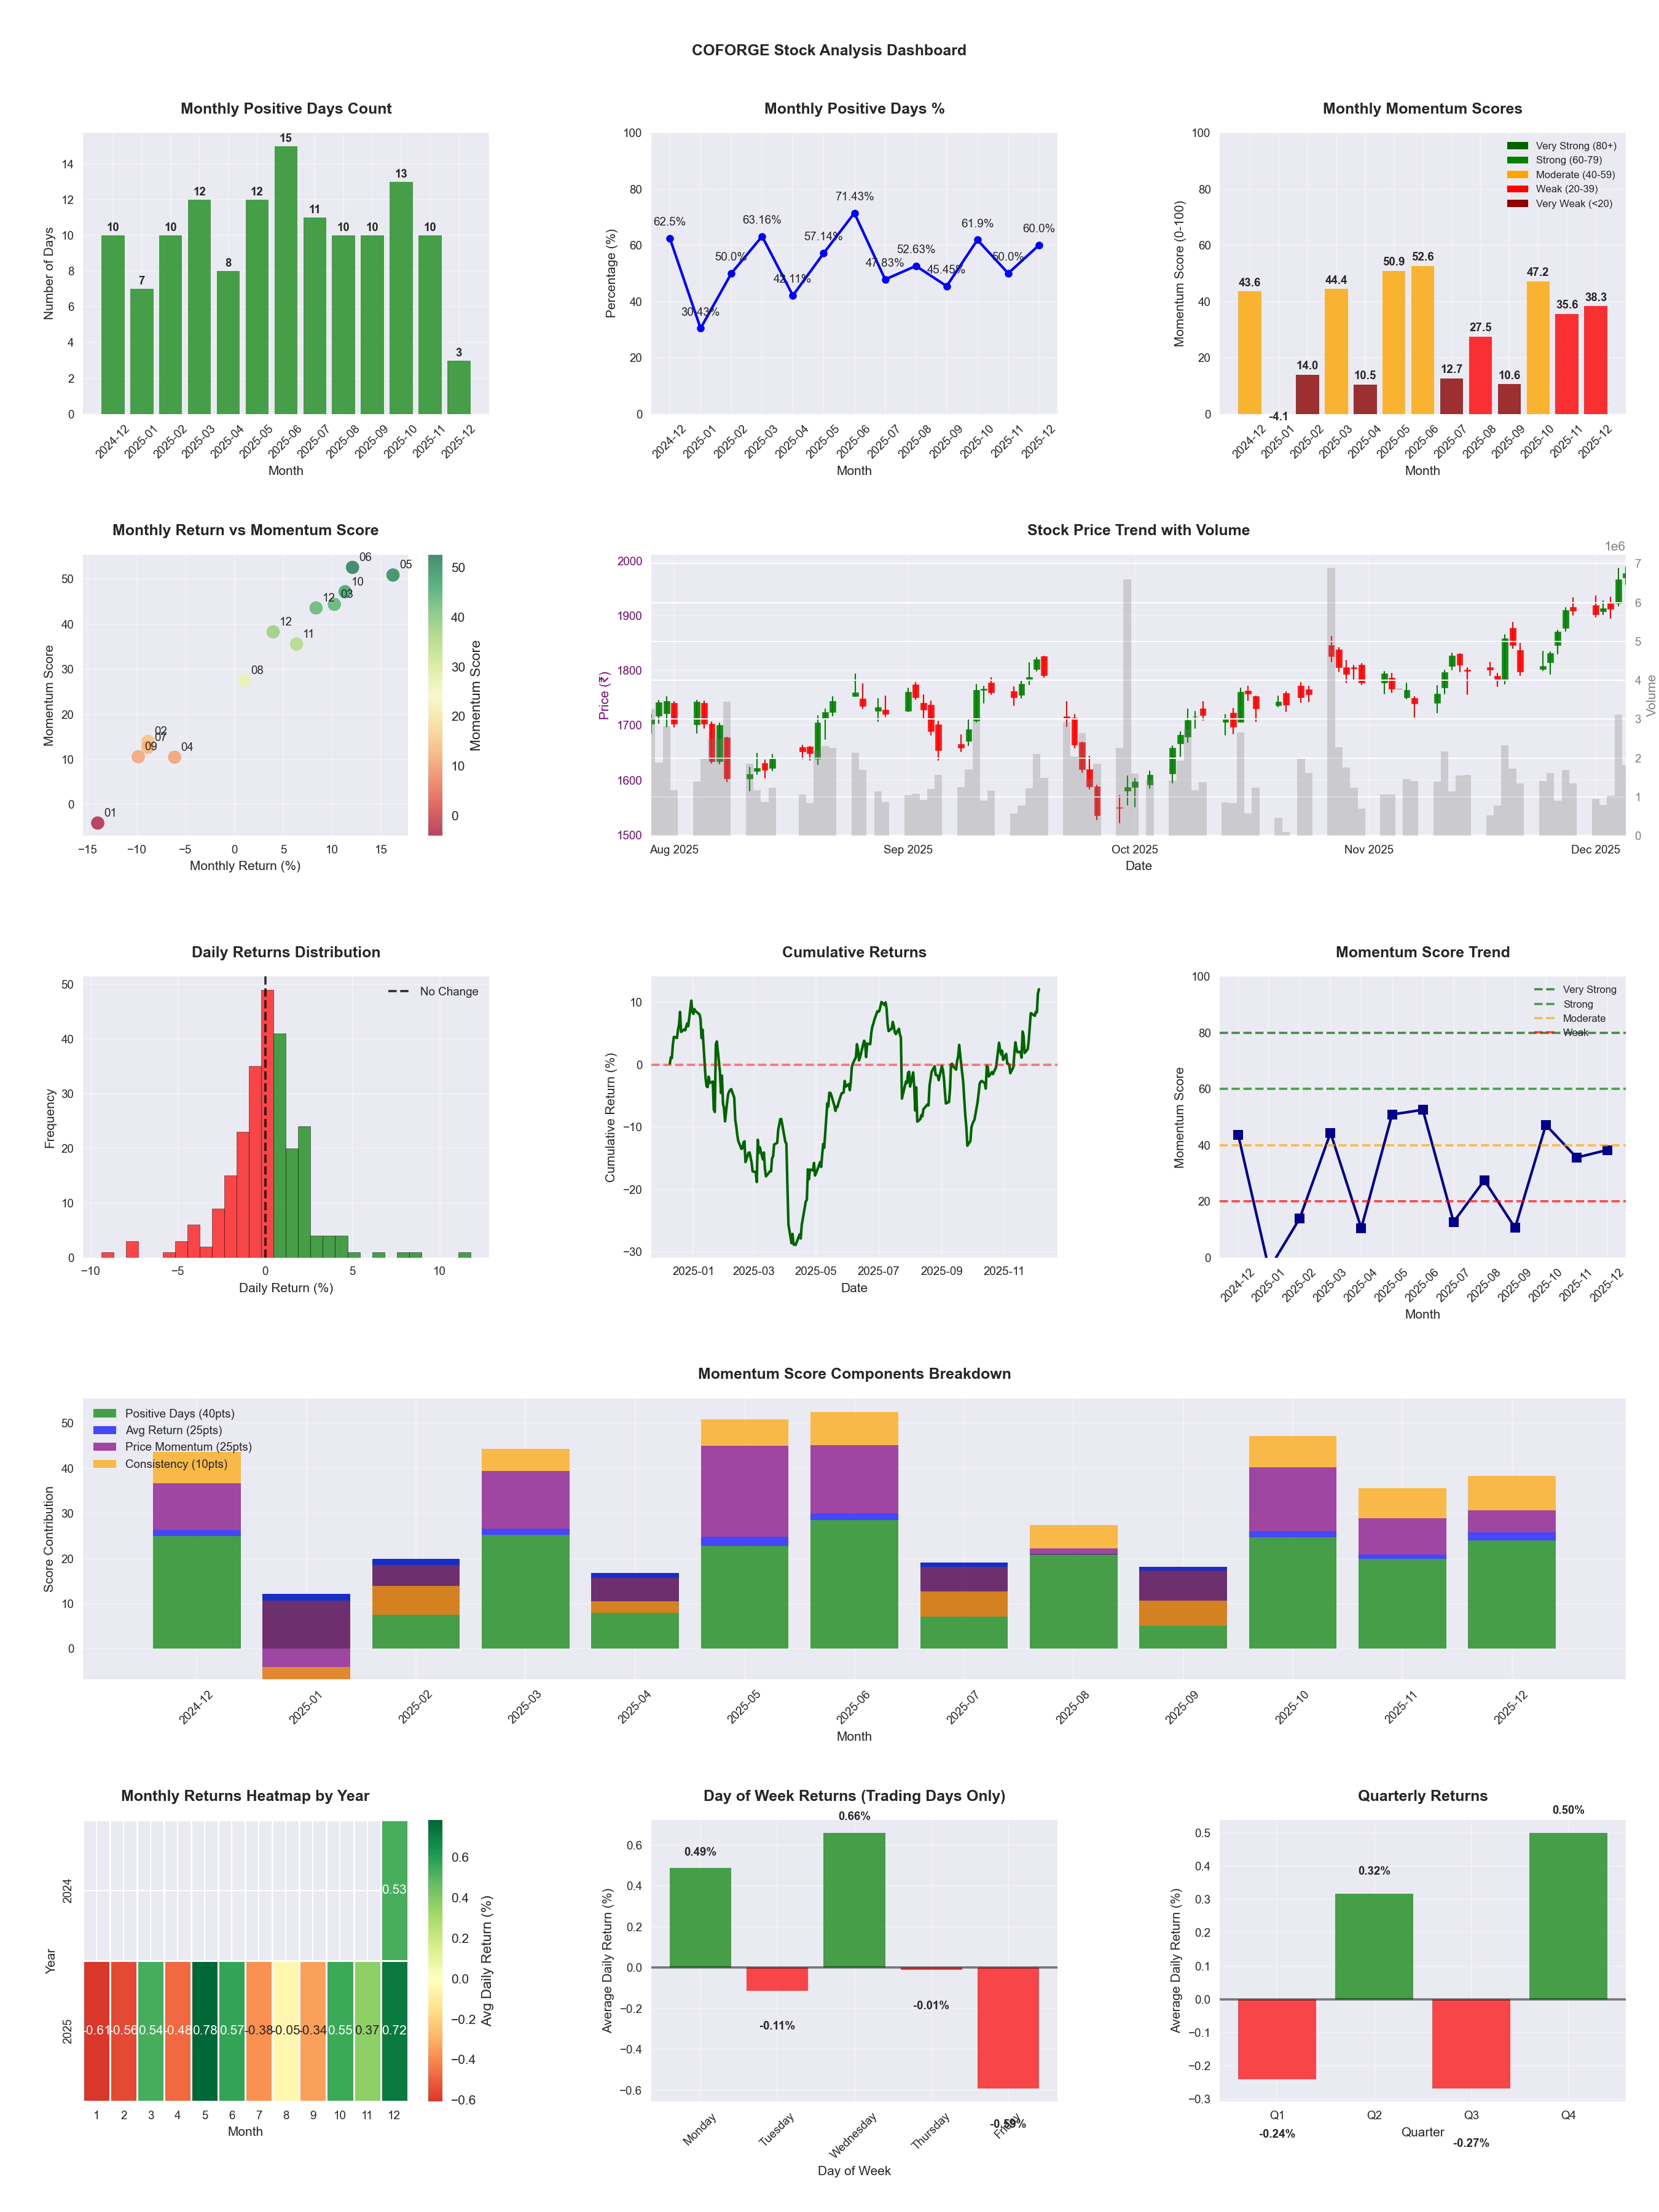
📈 COFORGE
Date
📅 2026-04-11
Volatility
🟡 2.16%
Risk Profile
⚠️ suitable for aggressive investors
Win Rate
⚠️ 50.8%
Avg Daily Return
📈 +0.01%
Max Drawdown
📉 -45.58%
IBD RS Score
📊 8.1
Weak
Market Rank
#453
Best Month
🏆 2025-06
Best Months to Trade
📅 Apr, May, Jun
Best Days to Trade
📅 Monday, Wednesday
📊 Key Insights & Metrics
Symbol
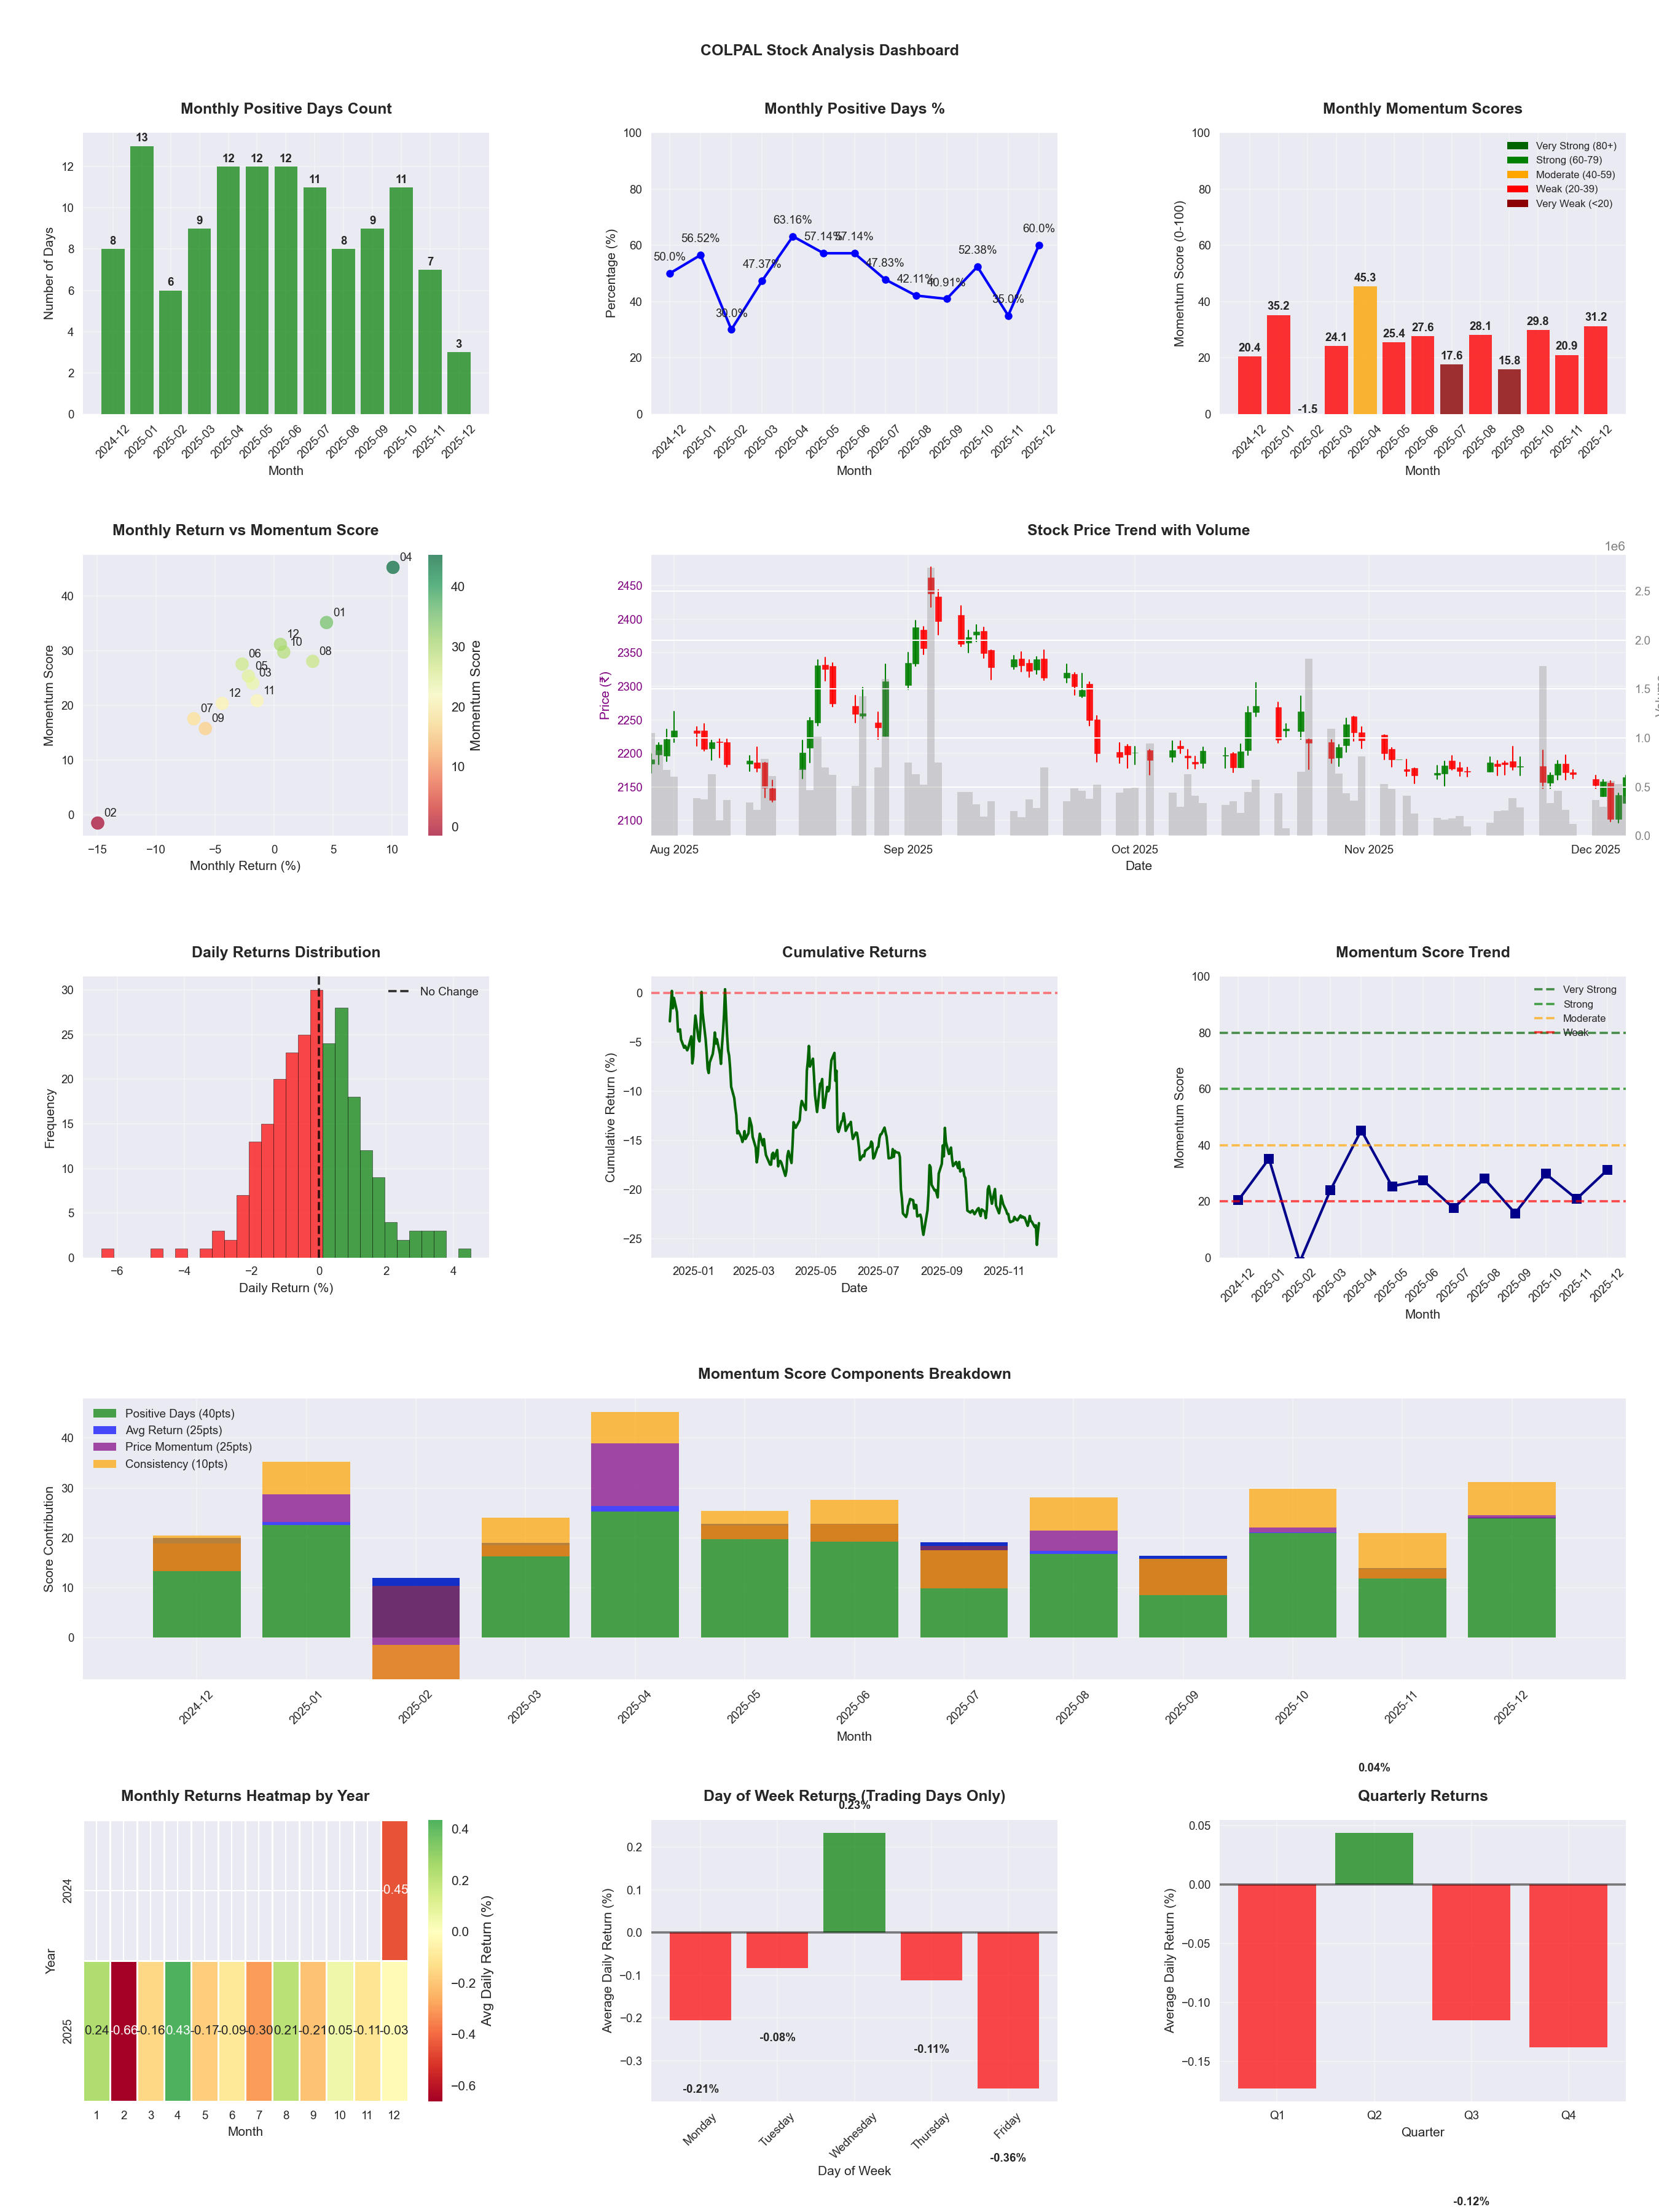
📈 COLPAL
Date
📅 2026-04-11
Volatility
🟢 1.49%
Win Rate
⚠️ 49.6%
Avg Daily Return
📉 -0.08%
Max Drawdown
📉 -33.10%
IBD RS Score
📊 31.4
Weak
Market Rank
#338
Best Month
🏆 2026-04
Best Months to Trade
📅 Apr, Feb, Aug
Best Days to Trade
📅 Tuesday, Monday
📊 Key Insights & Metrics
Symbol
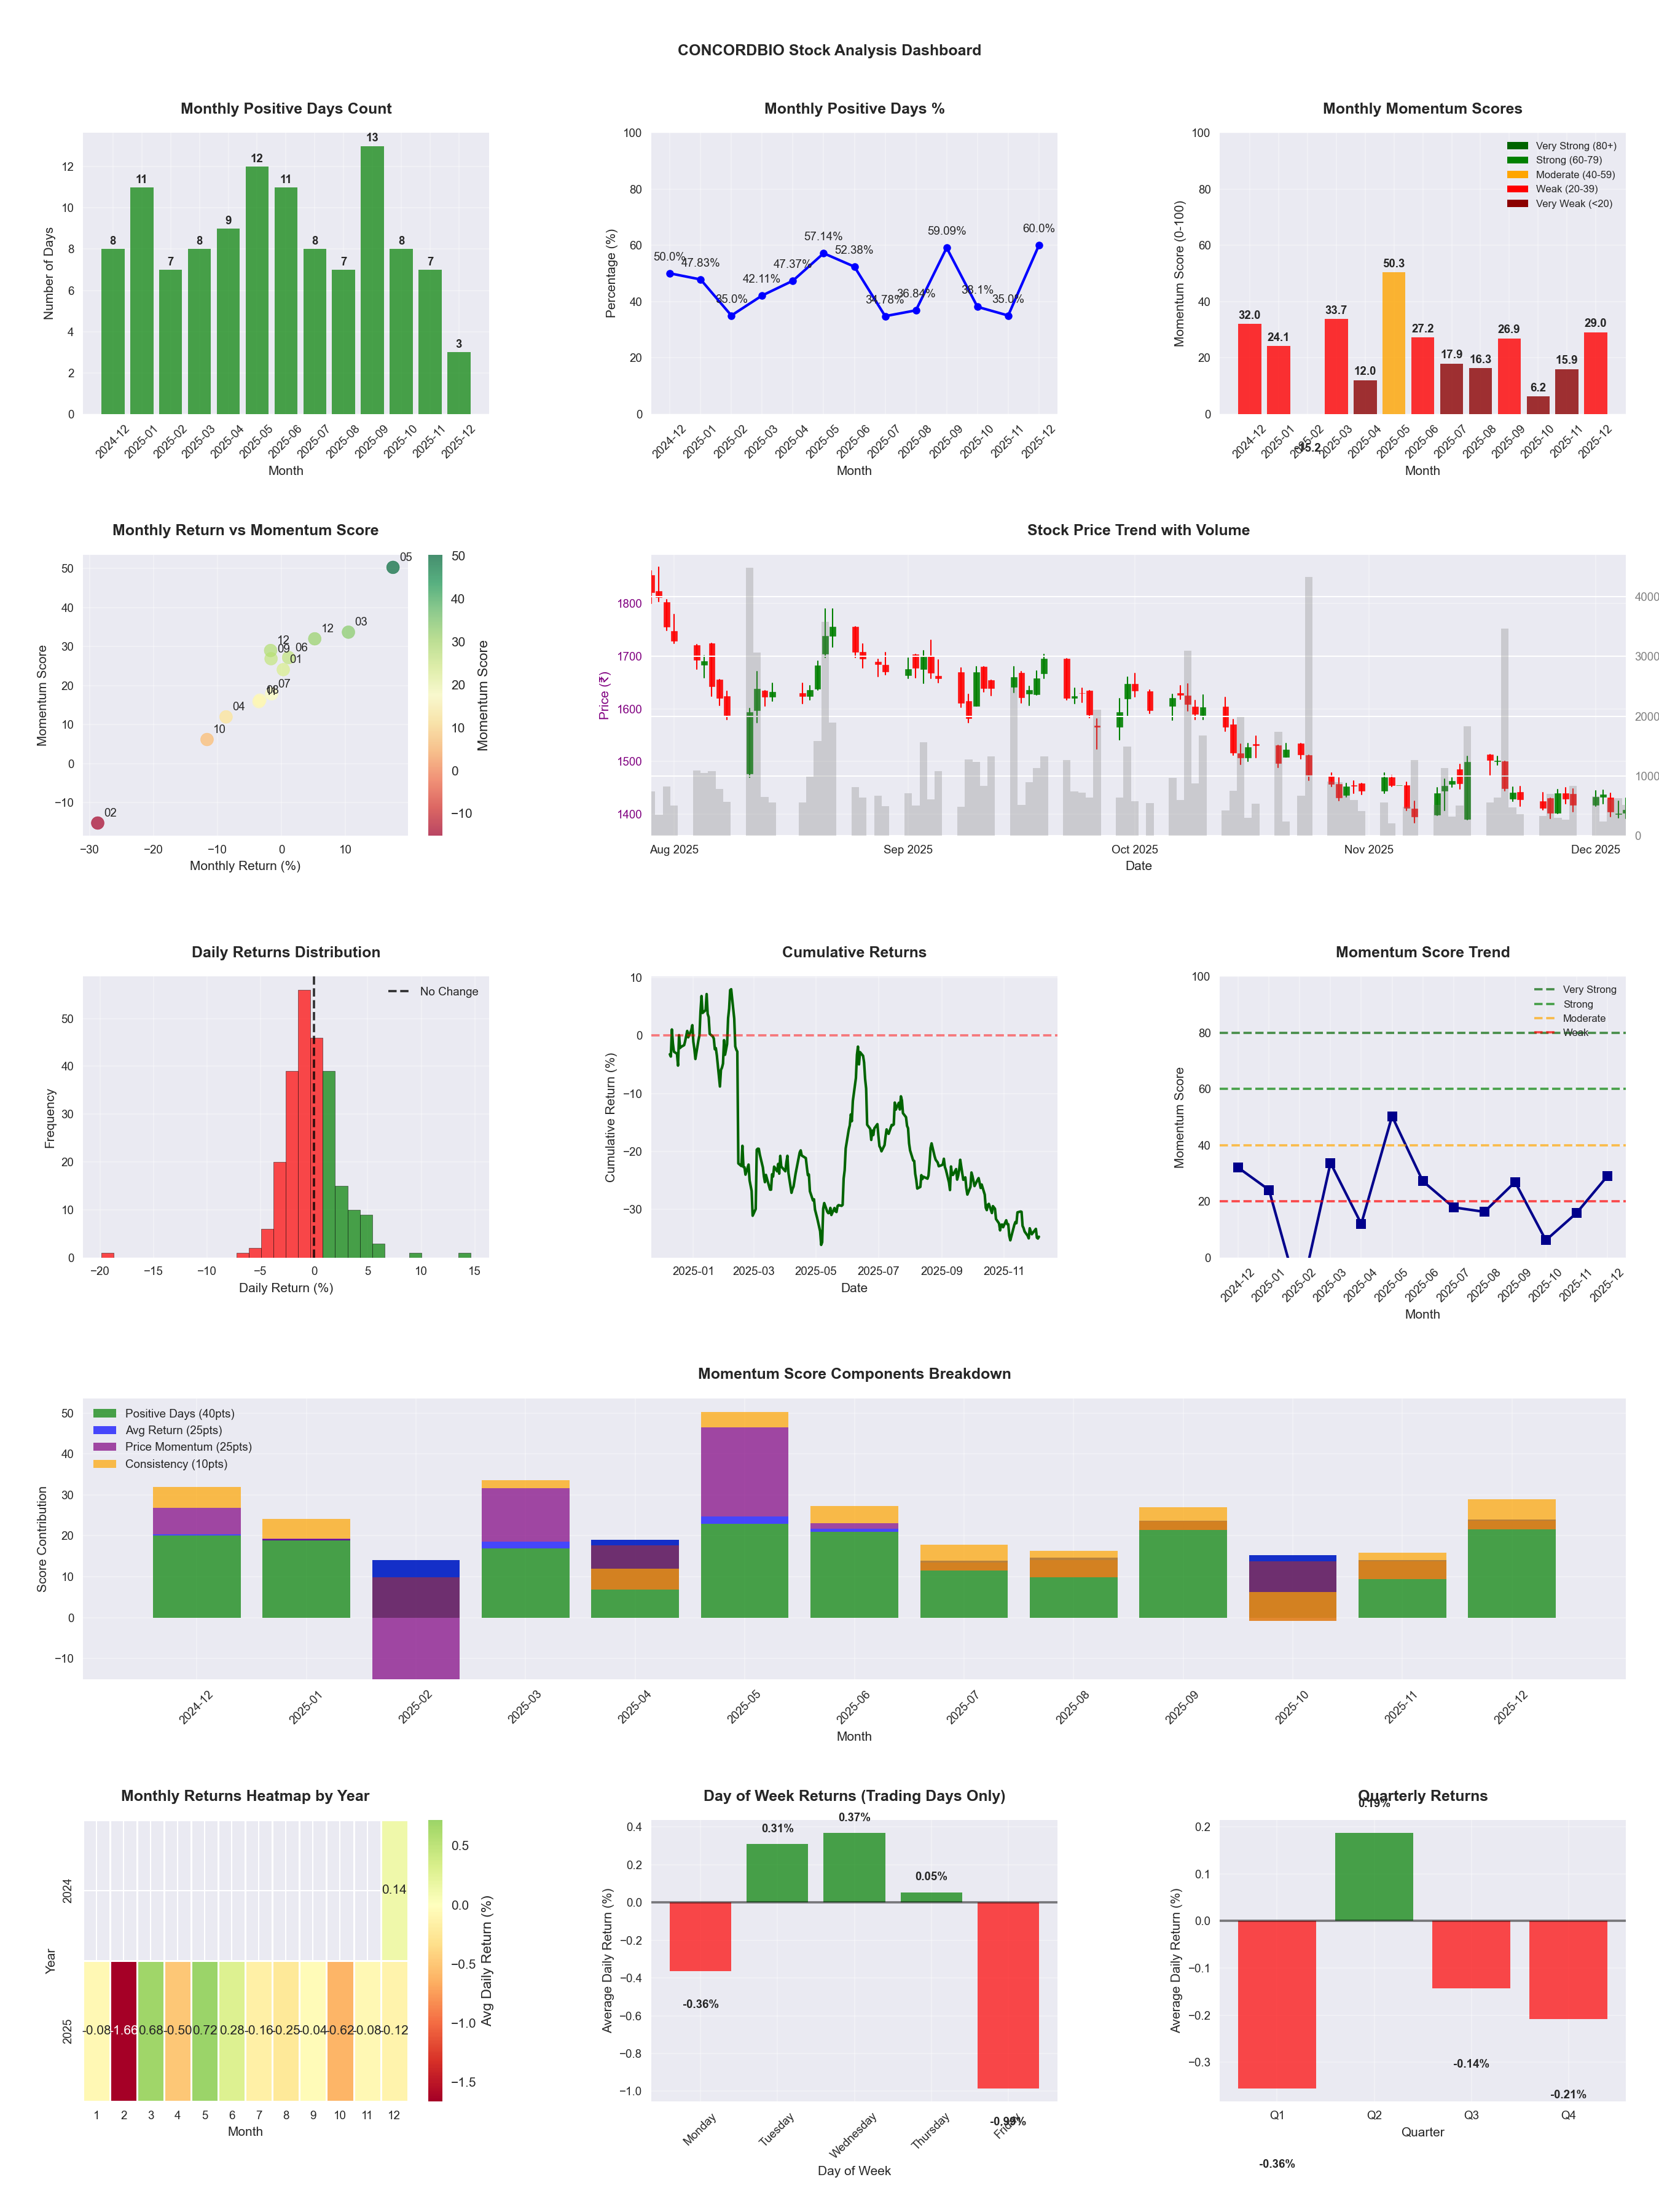
📈 CONCORDBIO
Date
📅 2026-04-11
Volatility
🟡 2.47%
Risk Profile
⚠️ suitable for aggressive investors
Win Rate
⚠️ 45.5%
Avg Daily Return
📉 -0.15%
Max Drawdown
📉 -52.06%
IBD RS Score
📊 3.7
Weak
Market Rank
#475
Best Month
🏆 2026-04
Worst Month
📉 2025-04
Best Months to Trade
📅 May, Feb, Jun
Best Days to Trade
📅 Wednesday, Tuesday
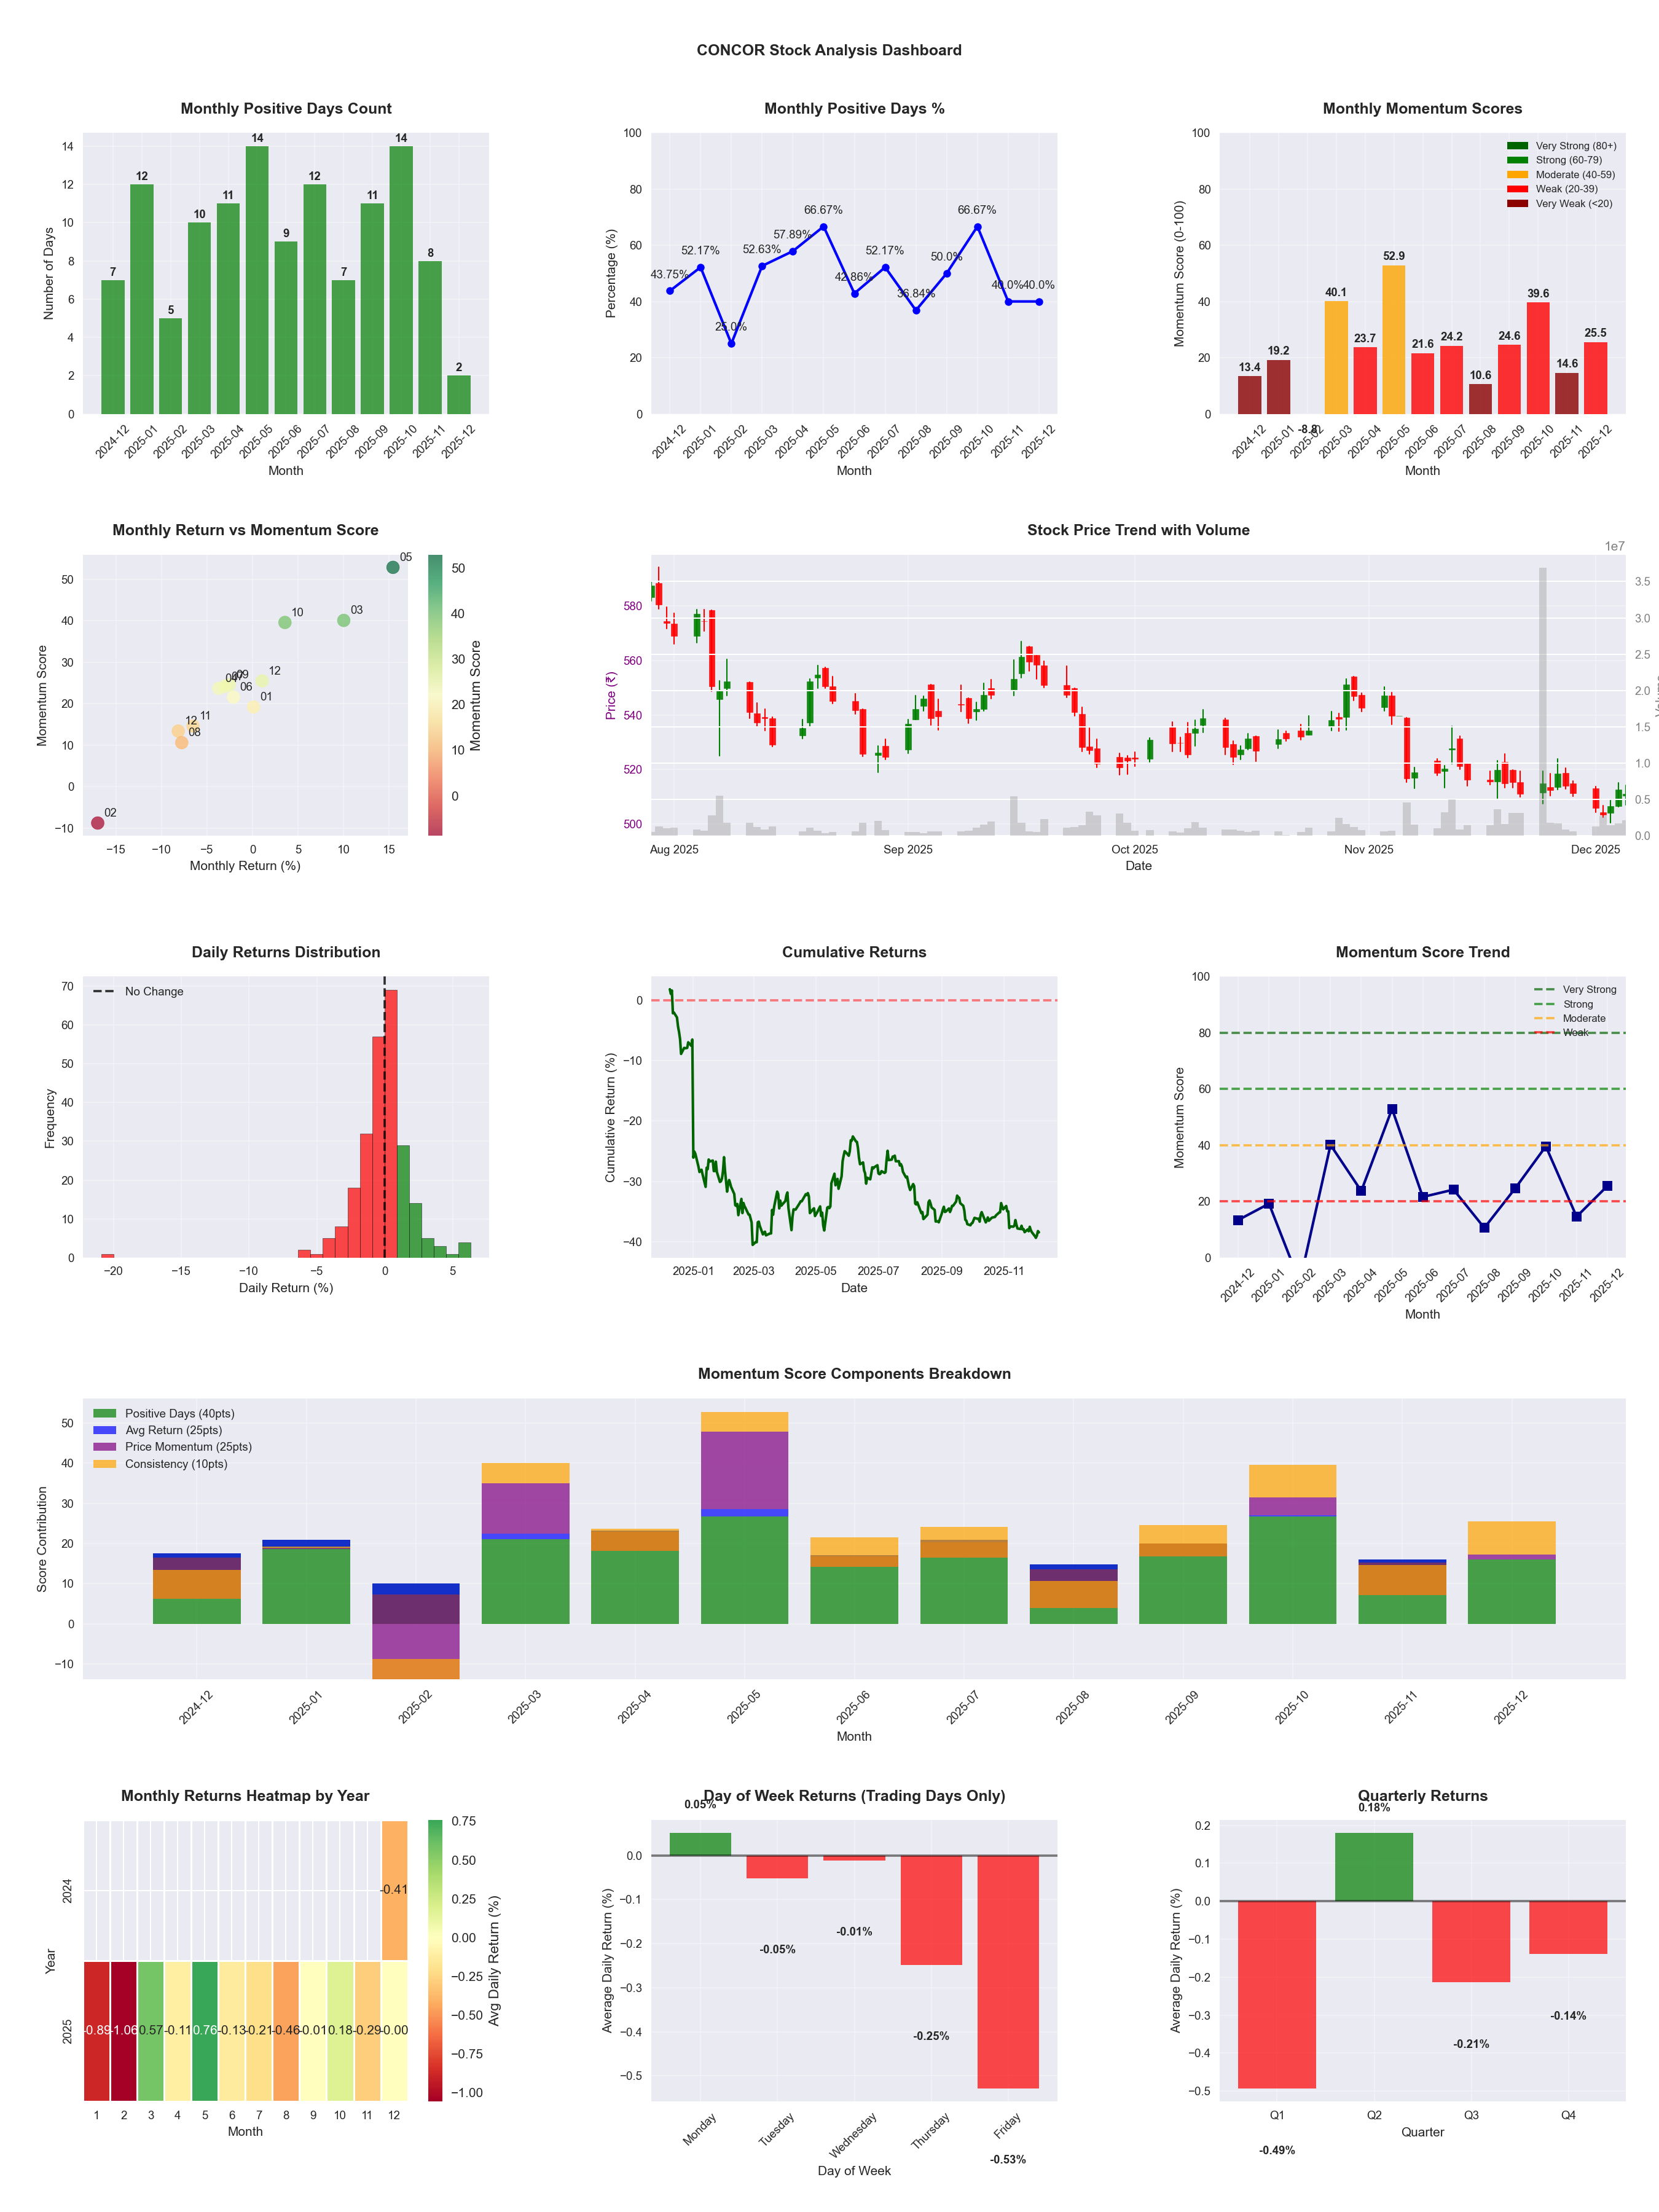
📊 Key Insights & Metrics
Symbol
📈 CONCOR
Date
📅 2026-04-11
Volatility
🟡 1.60%
Win Rate
⚠️ 49.2%
Avg Daily Return
📉 -0.03%
Max Drawdown
📉 -33.60%
IBD RS Score
📊 38.1
Weak
Market Rank
#305
Best Month
🏆 2026-04
Worst Month
📉 2026-03
Best Months to Trade
📅 May, Apr, Oct
Best Days to Trade
📅 Wednesday, Monday
📊 Key Insights & Metrics
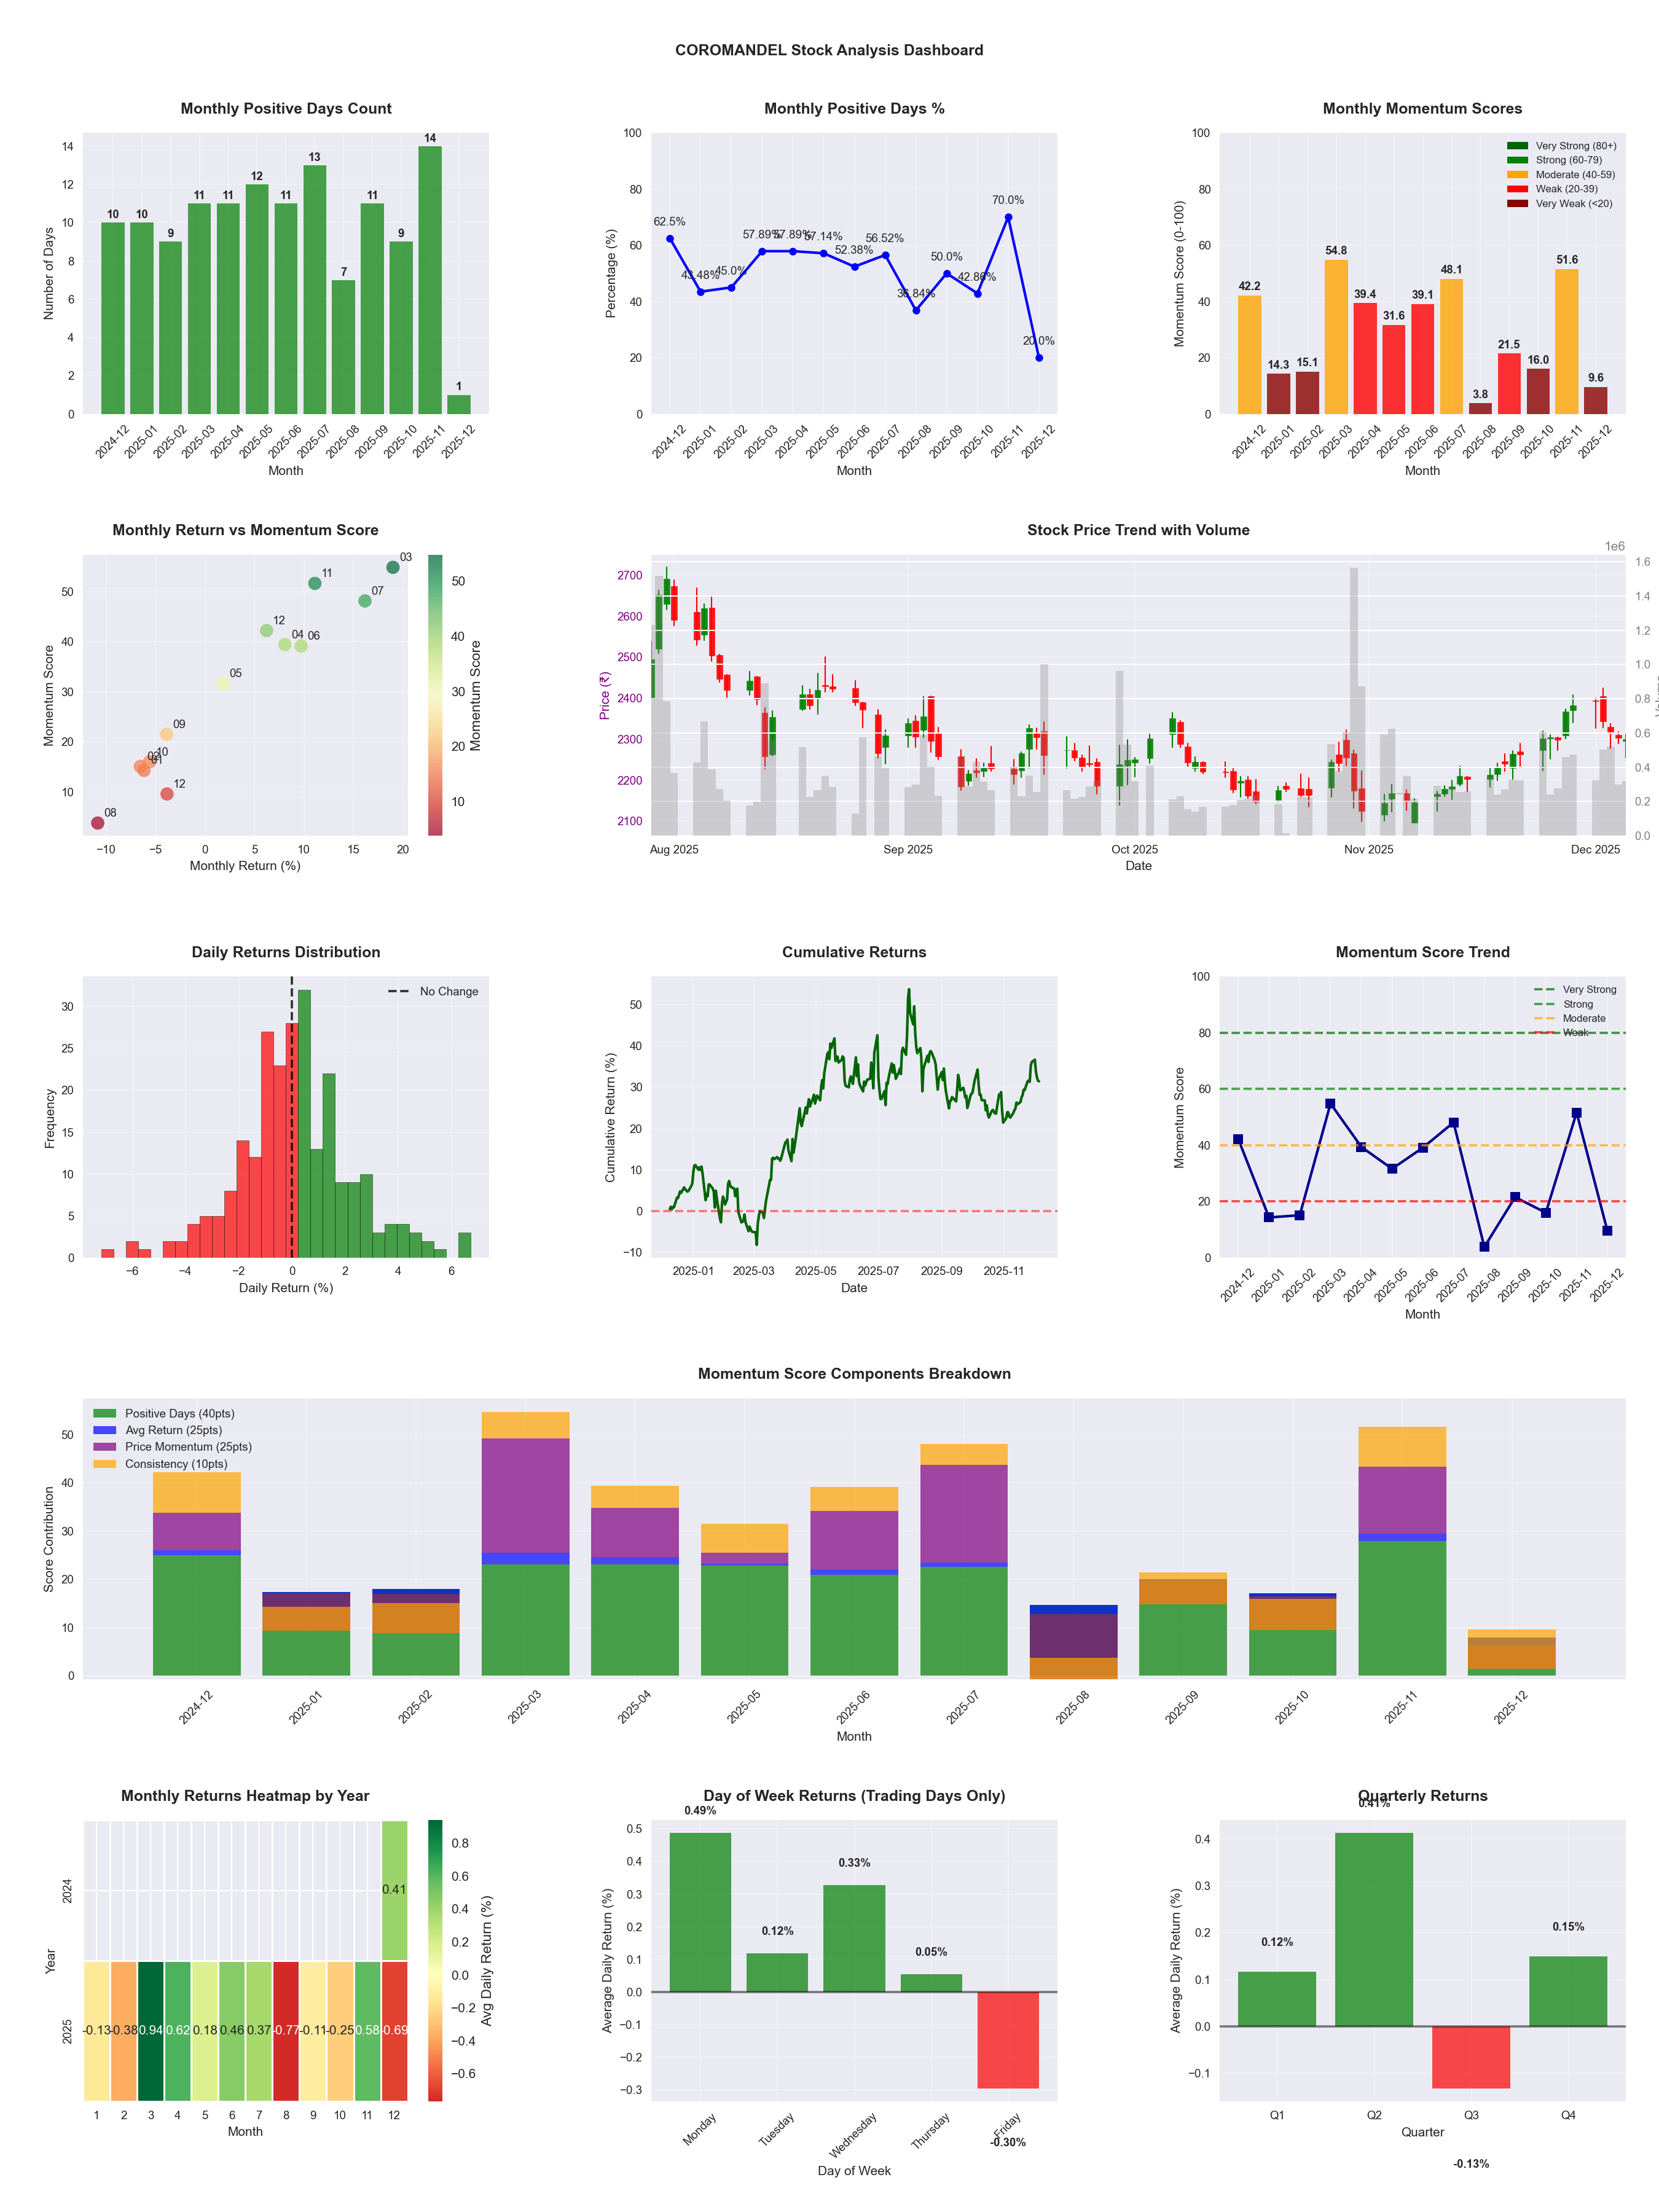
Symbol
📈 COROMANDEL
Date
📅 2026-04-11
Volatility
🟡 2.21%
Risk Profile
⚠️ suitable for aggressive investors
Win Rate
⚠️ 49.6%
Avg Daily Return
📈 +0.05%
Max Drawdown
📉 -31.12%
IBD RS Score
📊 54.6
Average
Market Rank
#224
Best Month
🏆 2026-04
Best Months to Trade
📅 Apr, Nov, Jun
Best Days to Trade
📅 Tuesday, Monday
📊 Key Insights & Metrics
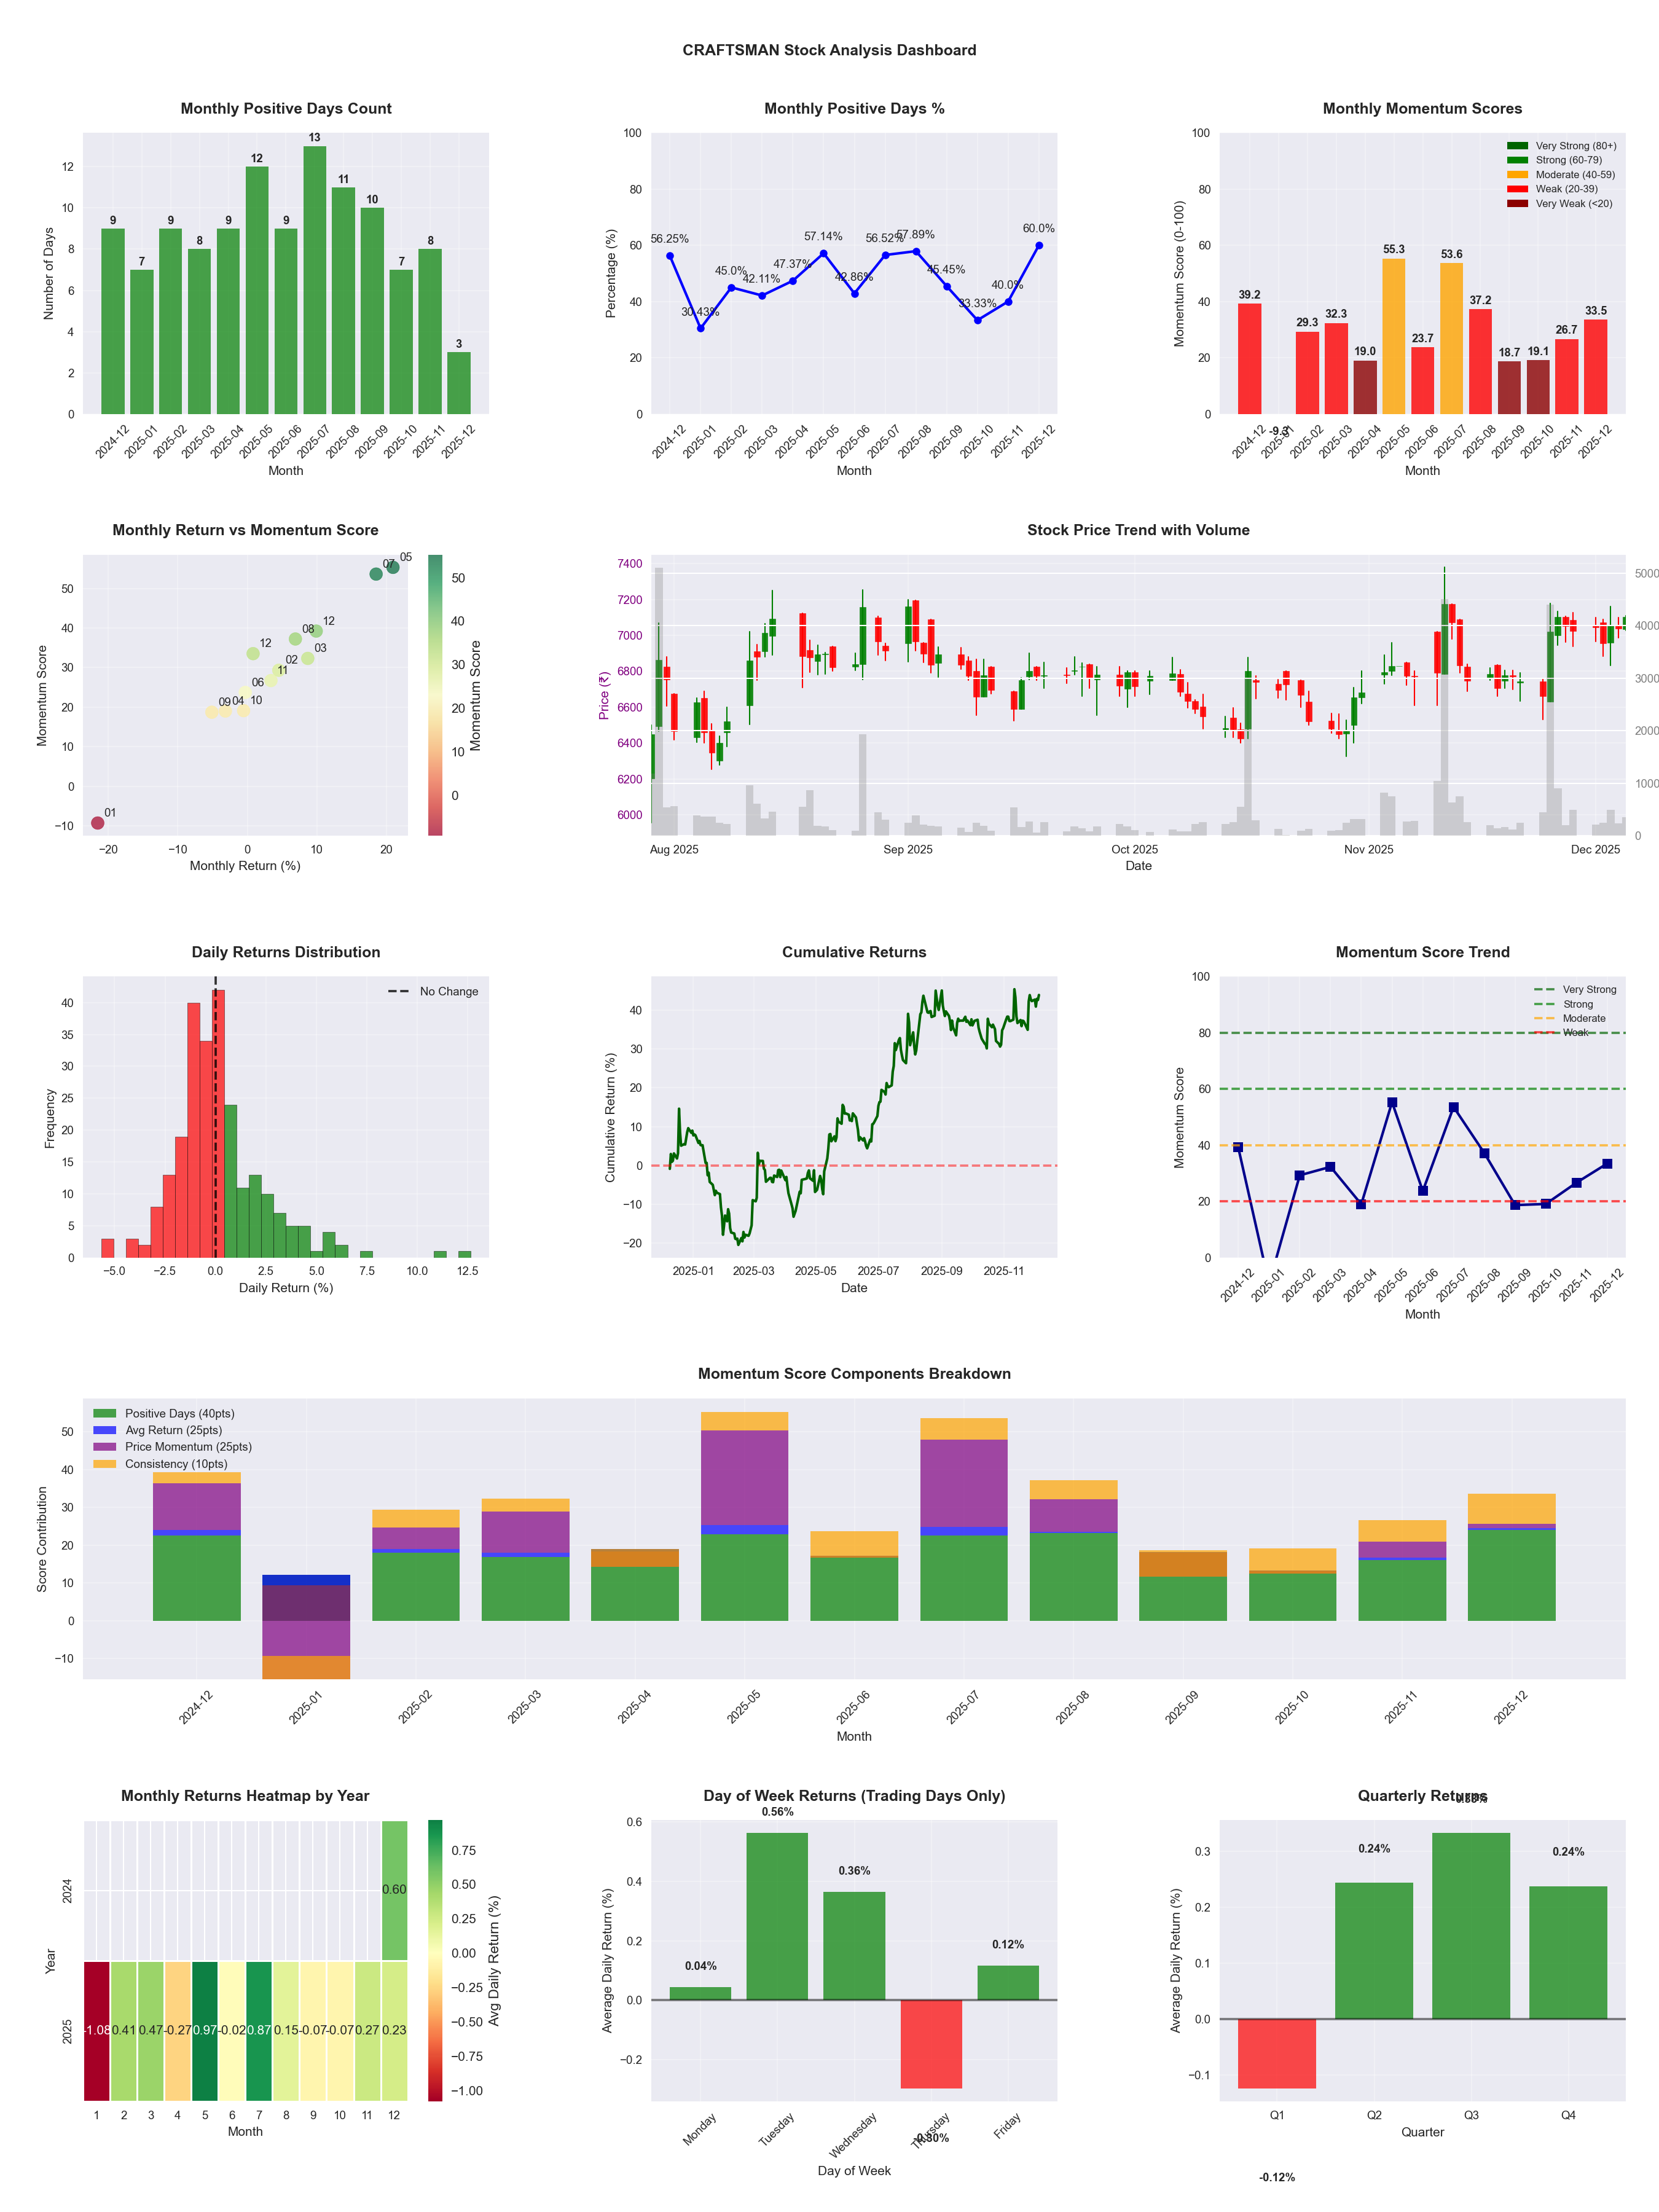
Symbol
📈 CRAFTSMAN
Date
📅 2026-04-11
Volatility
🟡 2.32%
Risk Profile
⚠️ suitable for aggressive investors
Win Rate
⚠️ 49.0%
Avg Daily Return
📈 +0.24%
Max Drawdown
📉 -19.37%
IBD RS Score
📊 87.4
Strong
Market Rank
#62
Best Month
🏆 2025-05
Worst Month
📉 2026-03
Best Months to Trade
📅 May, Jul, Apr
Best Days to Trade
📅 Tuesday, Wednesday
📊 Key Insights & Metrics
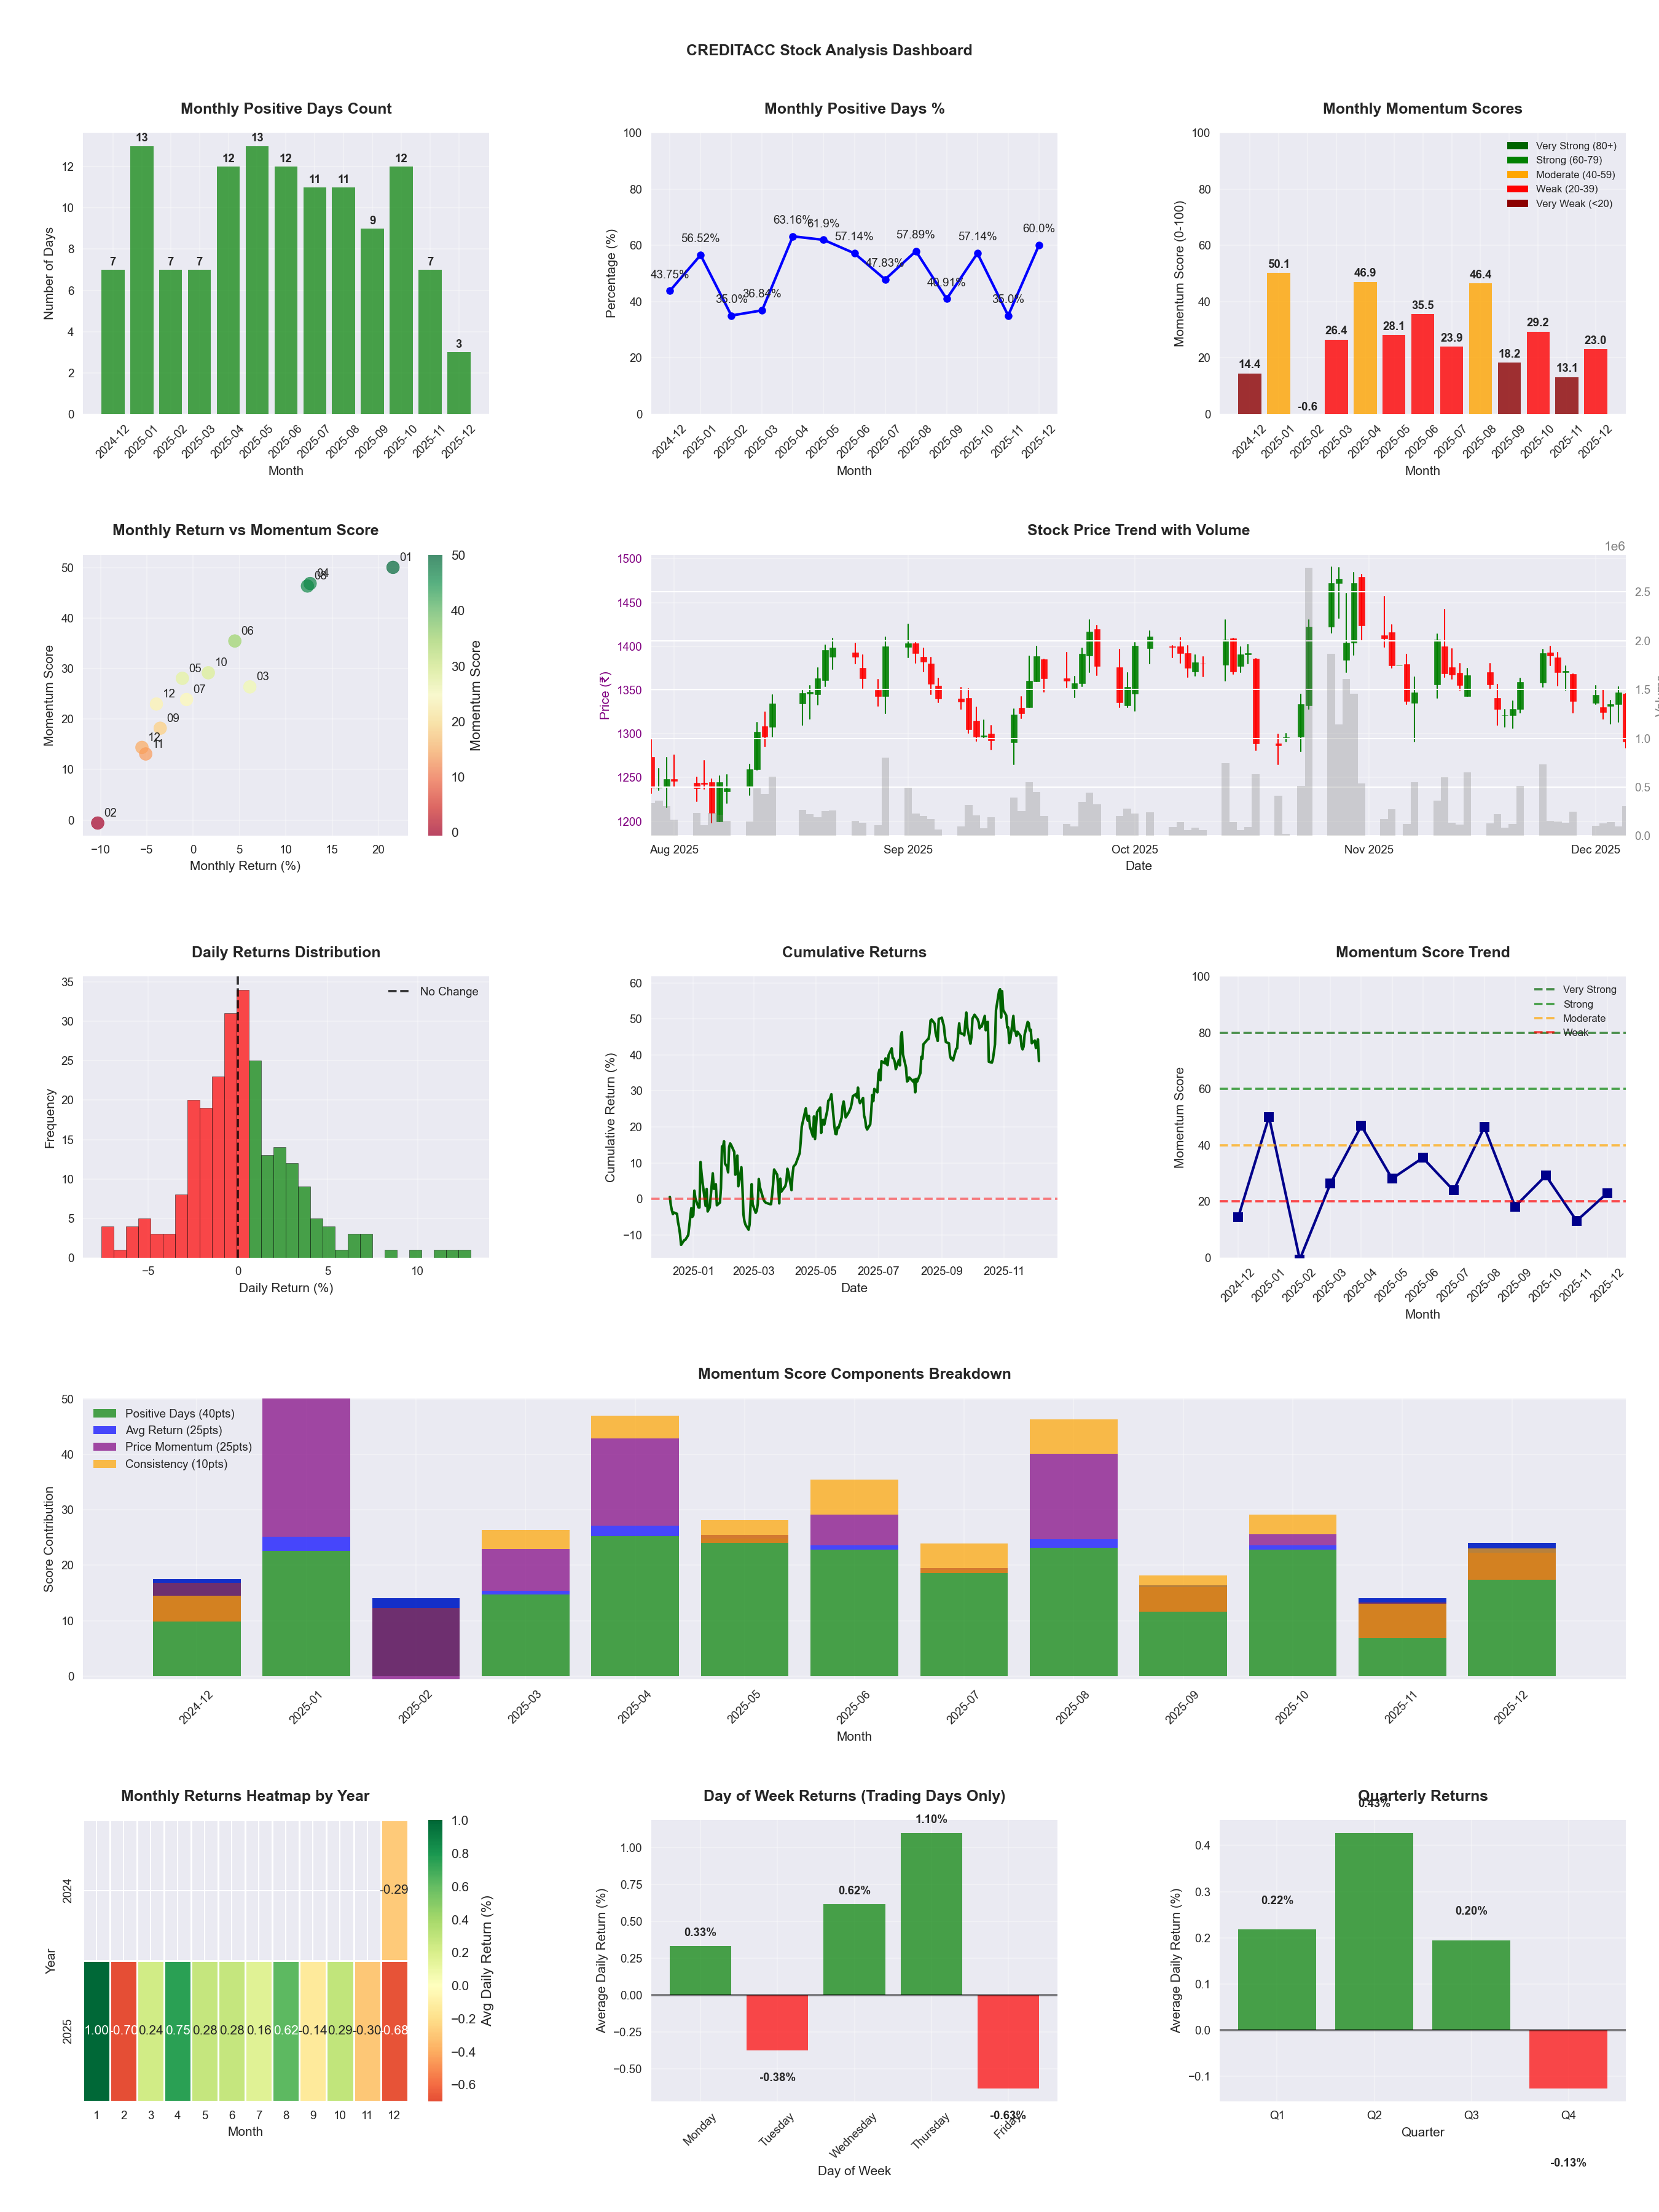
Symbol
📈 CREDITACC
Date
📅 2026-04-11
Volatility
🟡 2.45%
Risk Profile
⚠️ suitable for aggressive investors
Win Rate
⚠️ 50.8%
Avg Daily Return
📈 +0.10%
Max Drawdown
📉 -23.17%
IBD RS Score
📊 51.3
Average
Market Rank
#240
Best Month
🏆 2025-08
Worst Month
📉 2026-03
Best Months to Trade
📅 Apr, Aug, Oct
Best Days to Trade
📅 Wednesday, Thursday
📊 Key Insights & Metrics
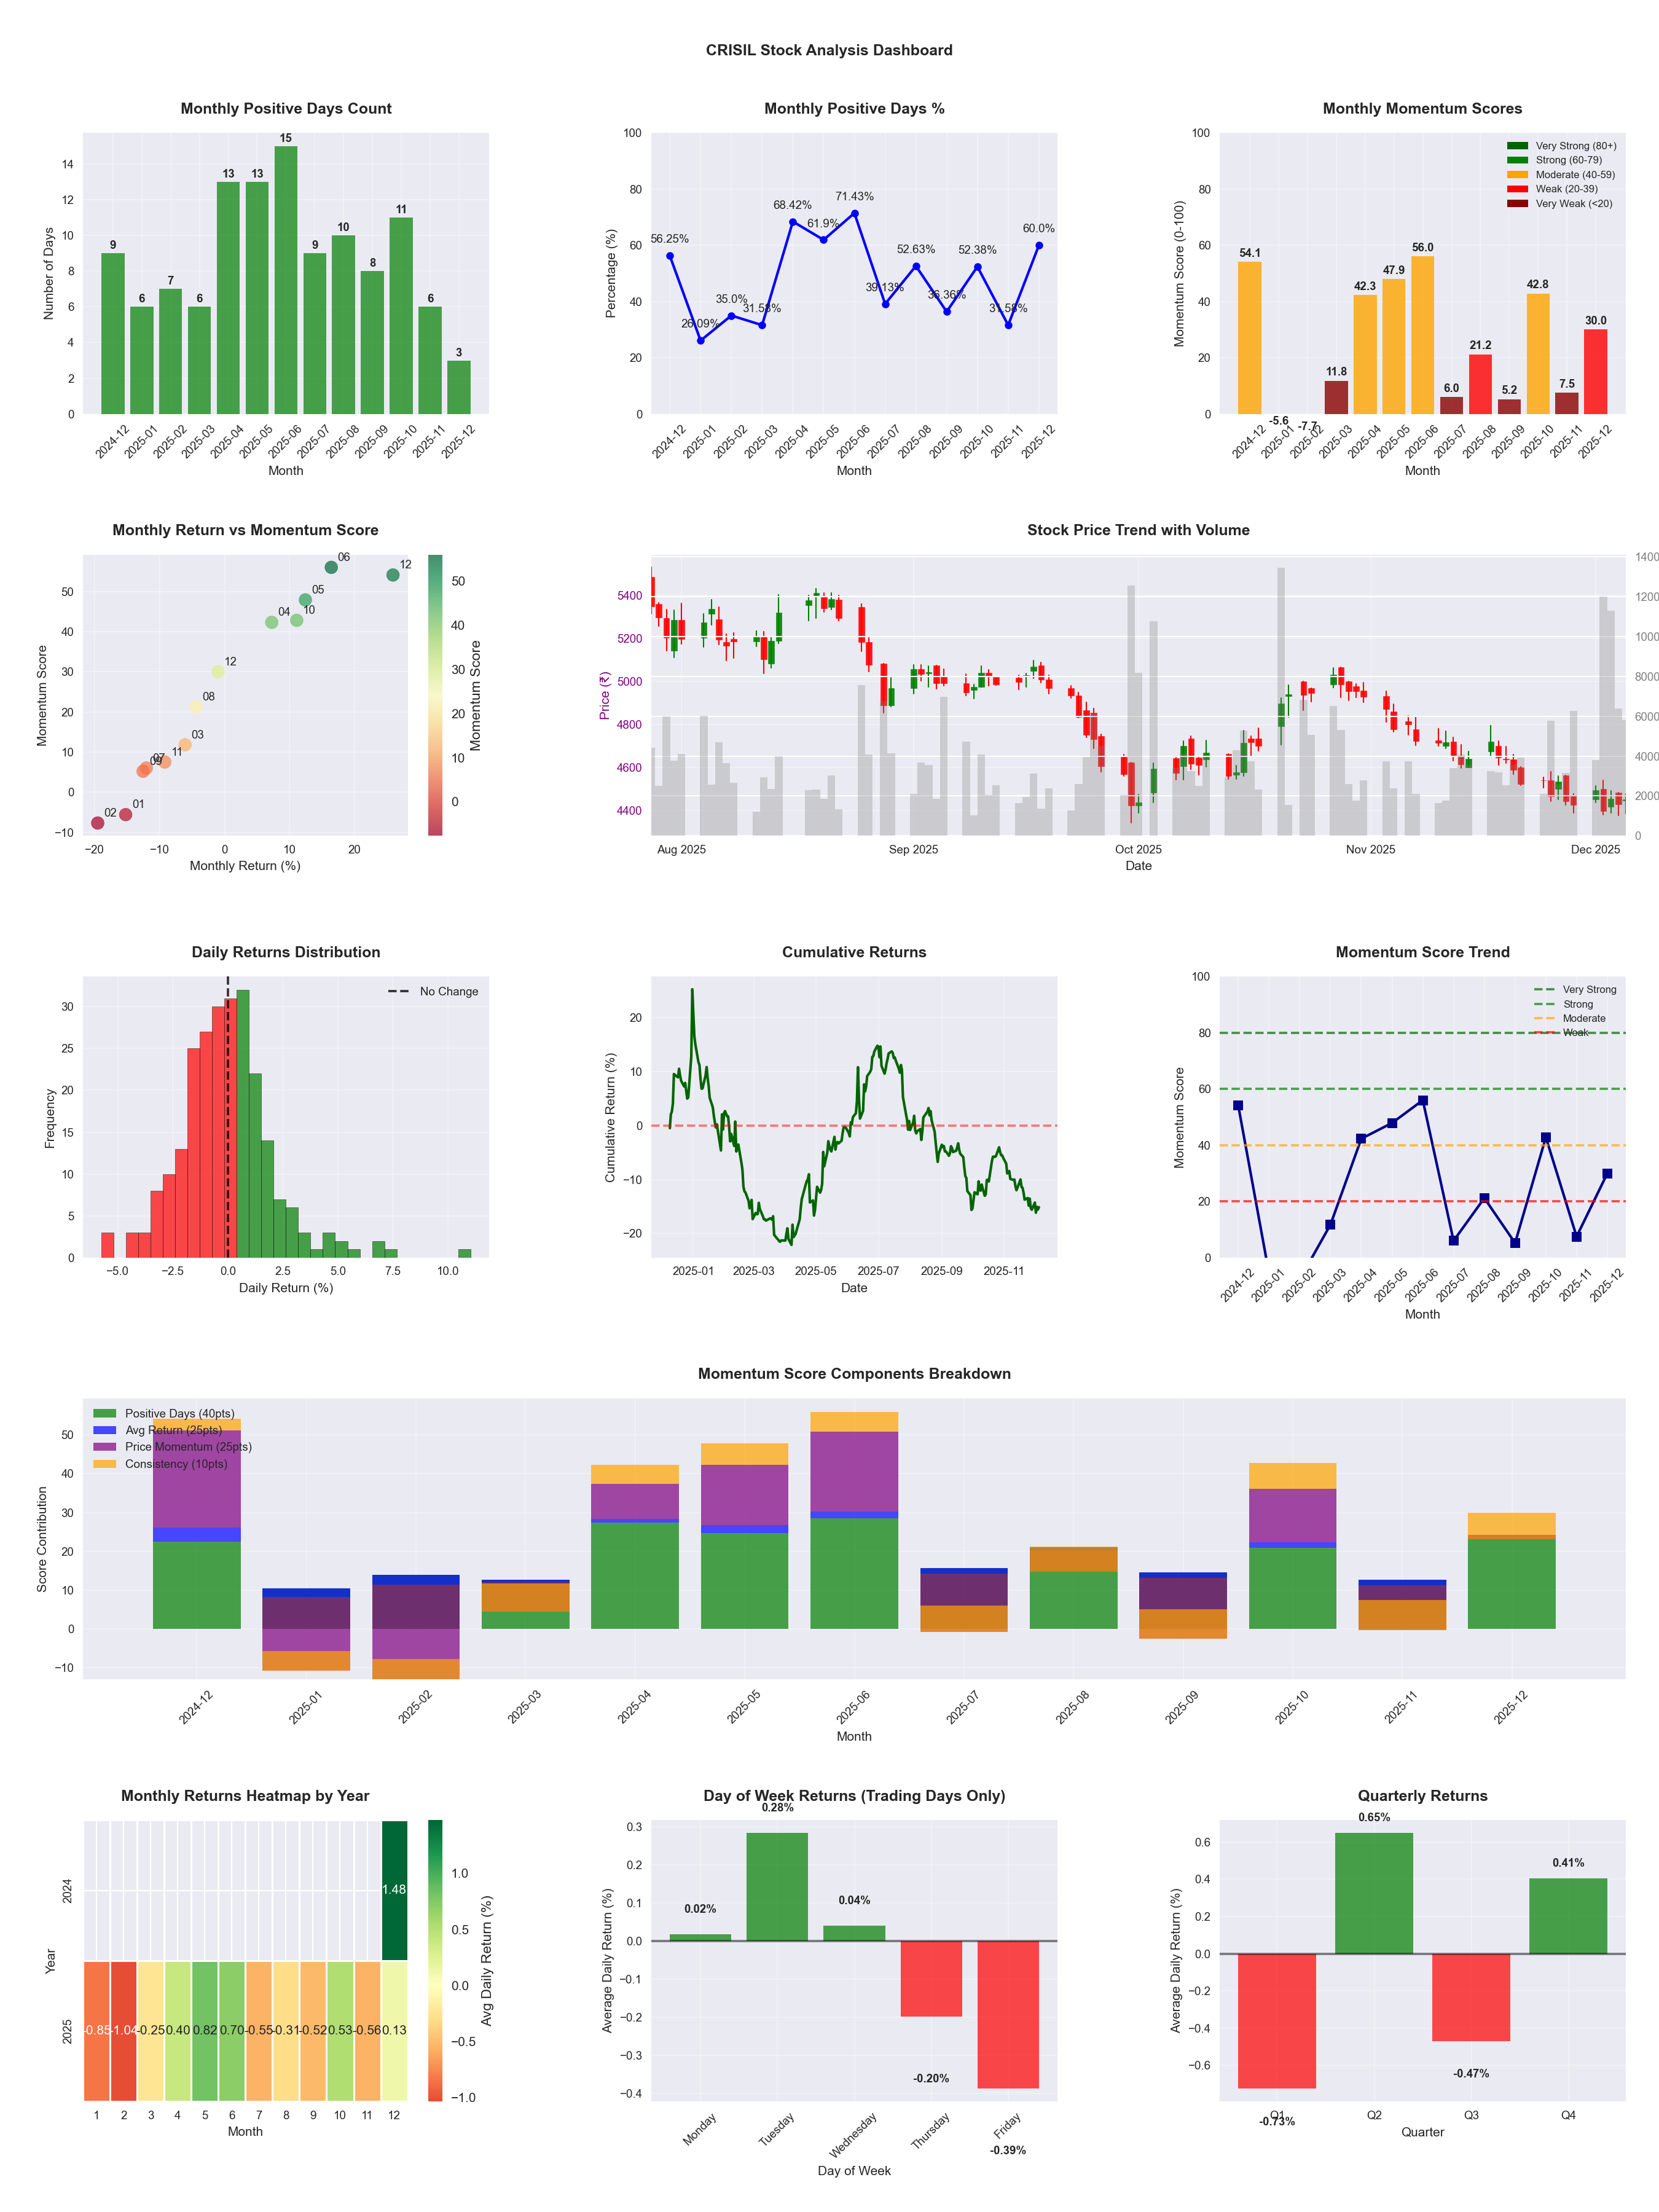
Symbol
📈 CRISIL
Date
📅 2026-04-11
Volatility
🟡 1.91%
Win Rate
⚠️ 49.2%
Avg Daily Return
📈 +0.01%
Max Drawdown
📉 -37.97%
IBD RS Score
📊 26.2
Weak
Market Rank
#364
Best Month
🏆 2025-06
Worst Month
📉 2026-03
Best Months to Trade
📅 Apr, May, Jun
Best Days to Trade
📅 Wednesday, Monday
📊 Key Insights & Metrics
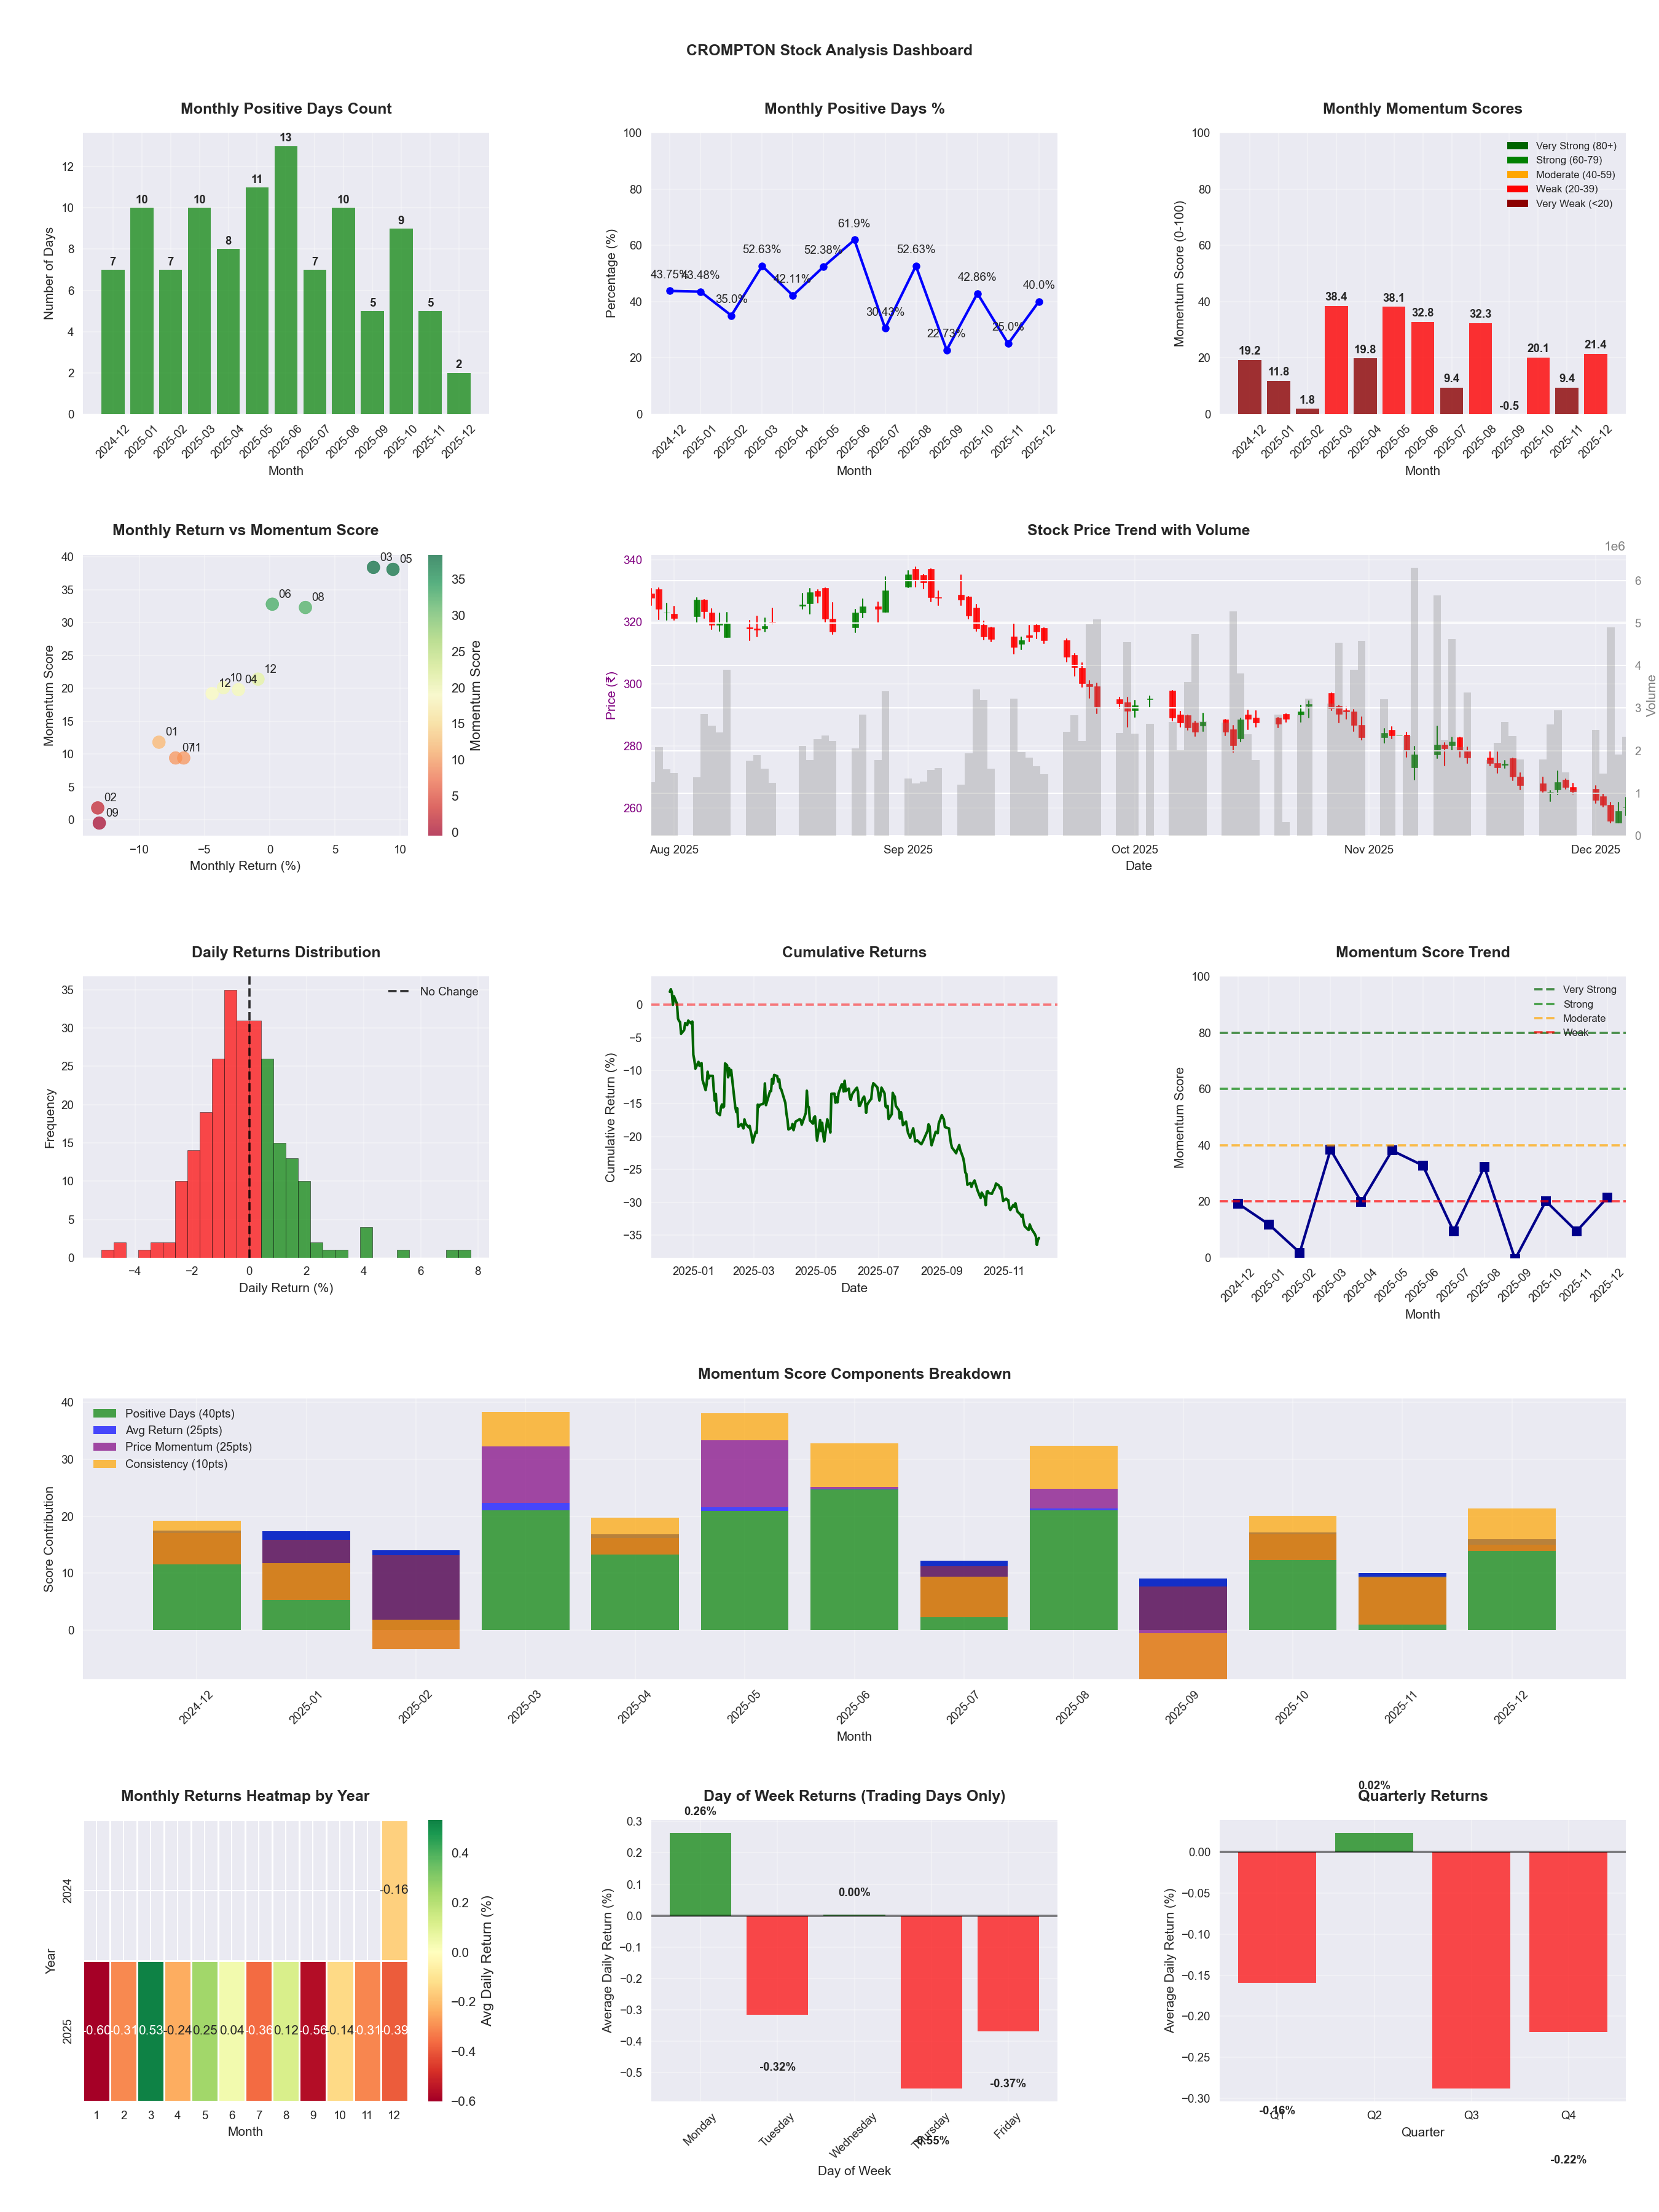
Symbol
📈 CROMPTON
Date
📅 2026-04-11
Volatility
🟡 1.69%
Win Rate
⚠️ 42.7%
Avg Daily Return
📉 -0.11%
Max Drawdown
📉 -37.82%
IBD RS Score
📊 22.1
Weak
Market Rank
#384
Best Month
🏆 2026-02
Best Months to Trade
📅 Feb, Apr, May
Best Days to Trade
📅 Wednesday, Monday
📊 Key Insights & Metrics
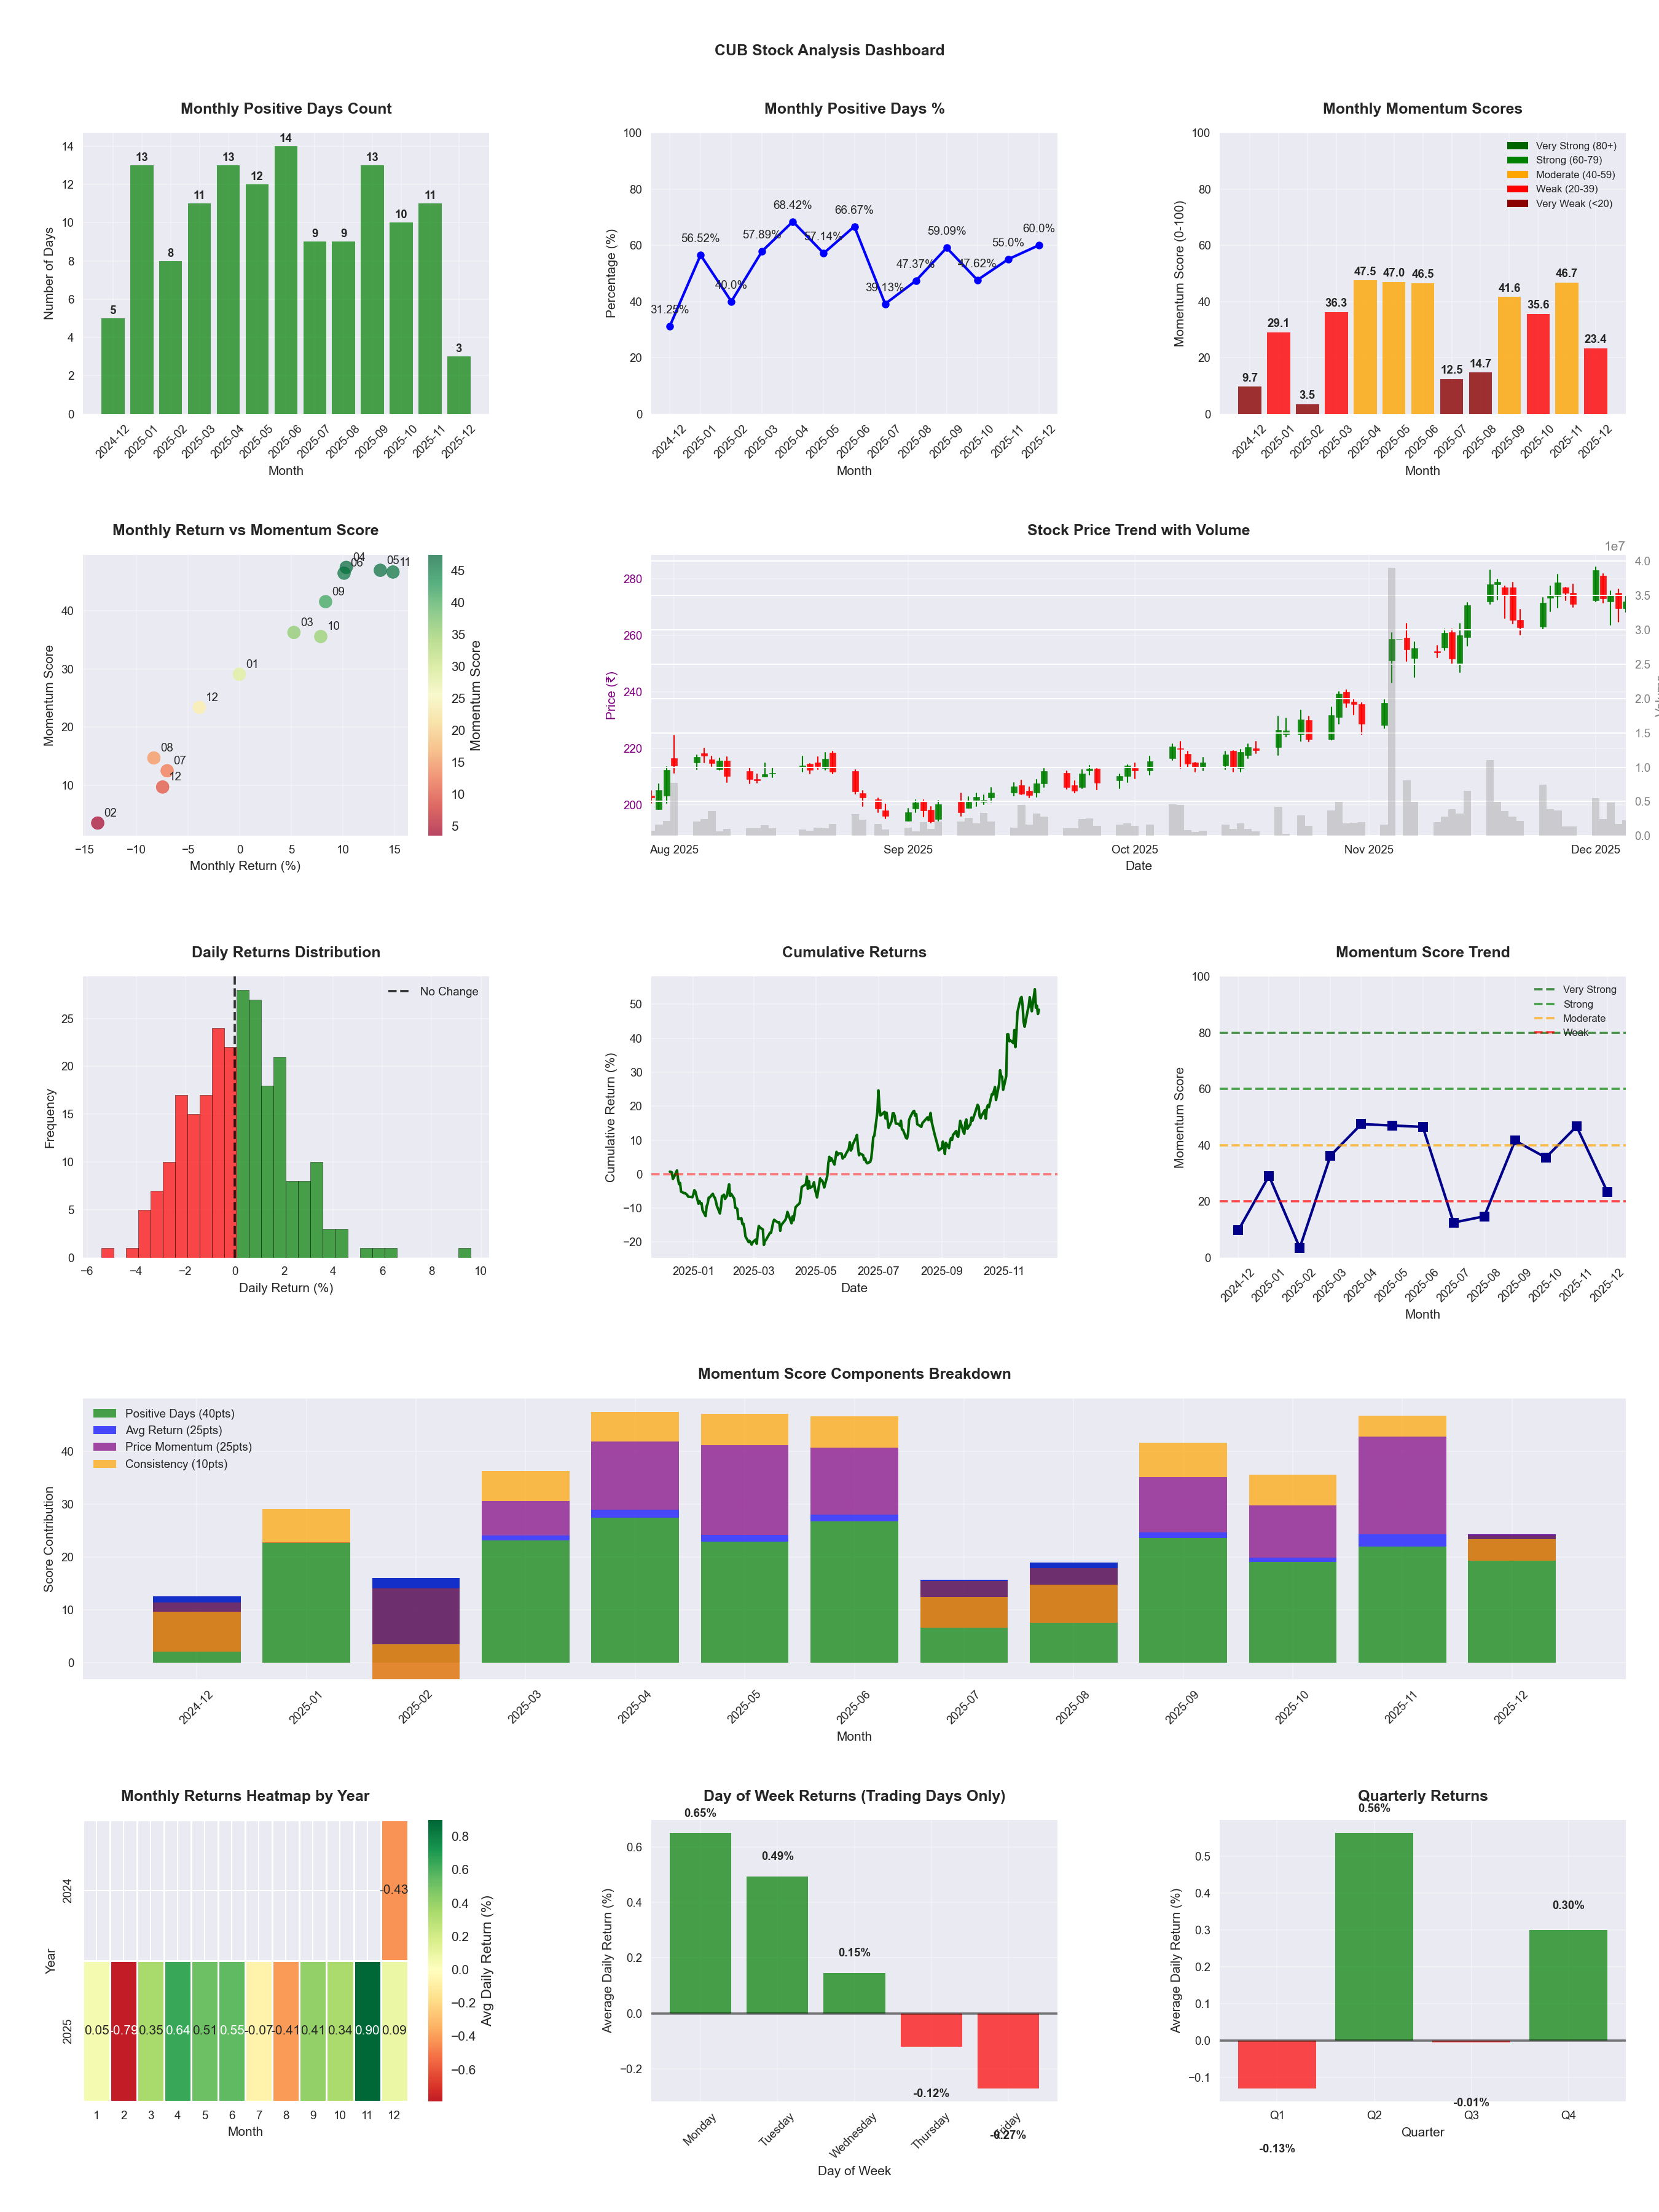
Symbol
📈 CUB
Date
📅 2026-04-11
Volatility
🟡 2.34%
Risk Profile
⚠️ suitable for aggressive investors
Win Rate
⚠️ 52.0%
Avg Daily Return
📈 +0.21%
Max Drawdown
📉 -23.28%
IBD RS Score
📊 81.3
Strong
Market Rank
#92
Best Month
🏆 2025-11
Best Months to Trade
📅 Nov, Apr, Jun
Best Days to Trade
📅 Tuesday, Monday
📊 Key Insights & Metrics
Symbol
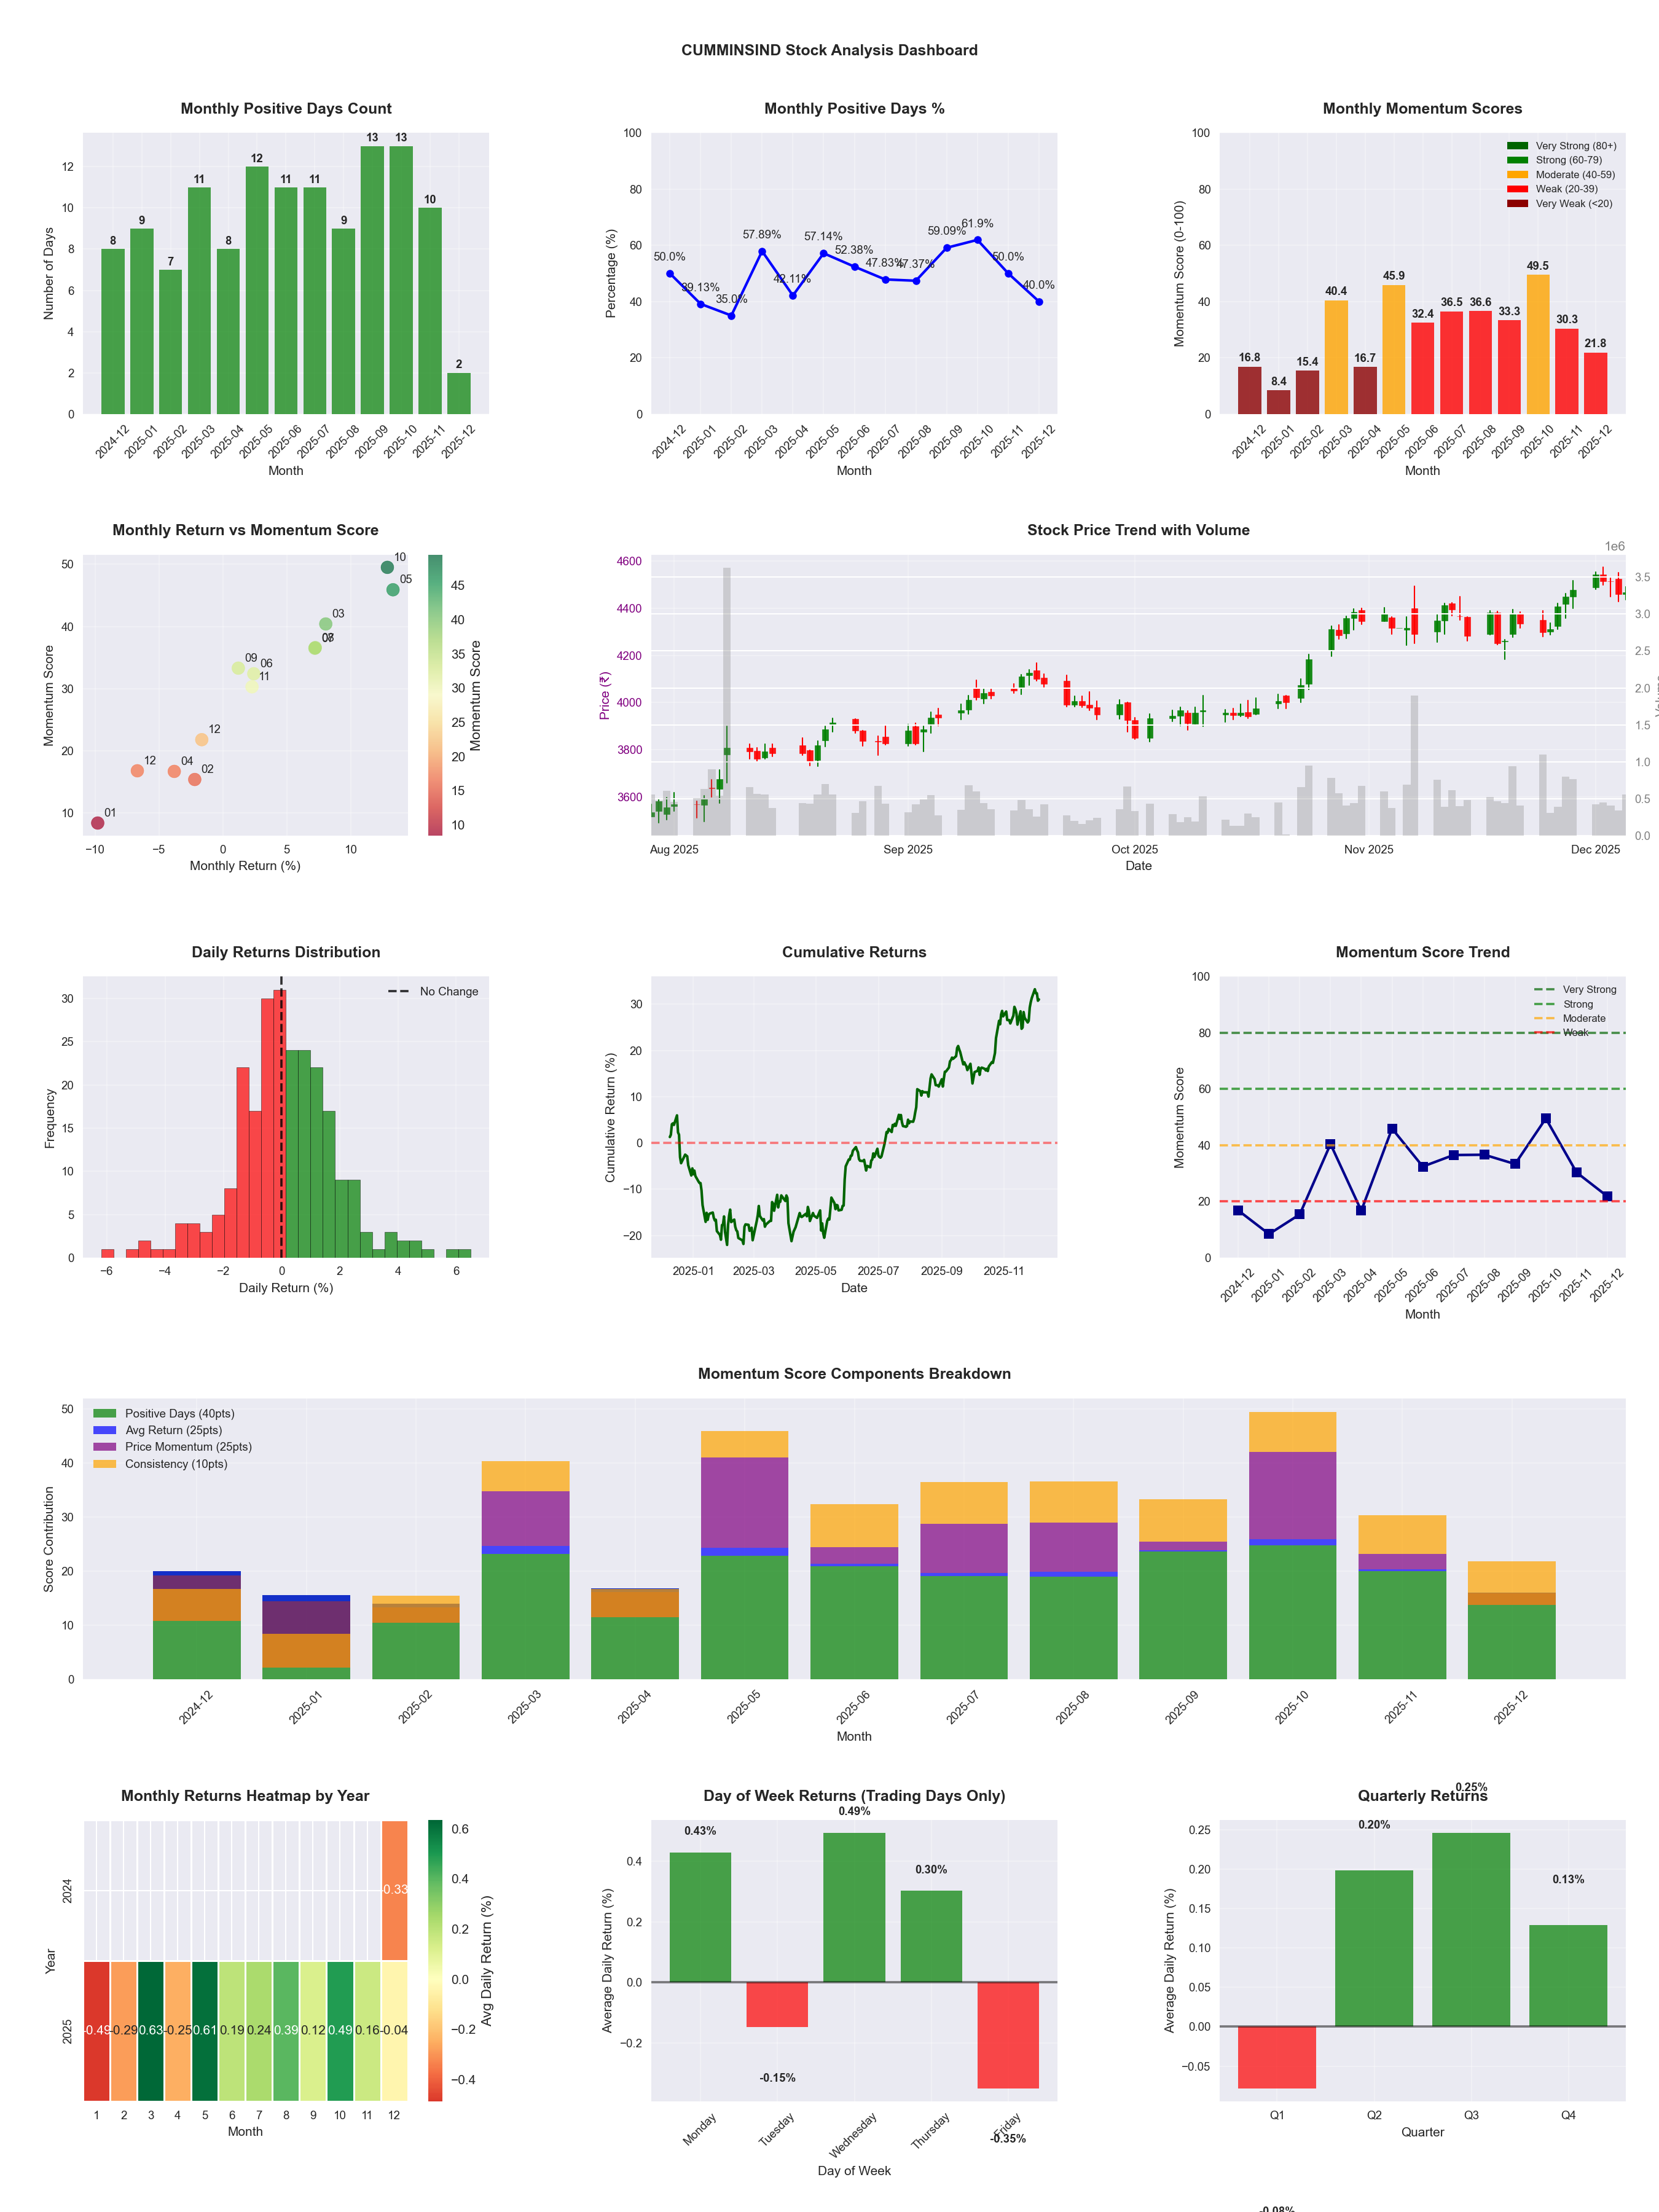
📈 CUMMINSIND
Date
📅 2026-04-11
Volatility
🟡 1.68%
Win Rate
⚠️ 53.2%
Avg Daily Return
📈 +0.26%
Max Drawdown
📉 -14.61%
IBD RS Score
📊 97.6
Leader
Market Rank
#12
Best Month
🏆 2026-02
Worst Month
📉 2026-03
Best Months to Trade
📅 Apr, Feb, May
Best Days to Trade
📅 Wednesday, Thursday
📊 Key Insights & Metrics
Symbol
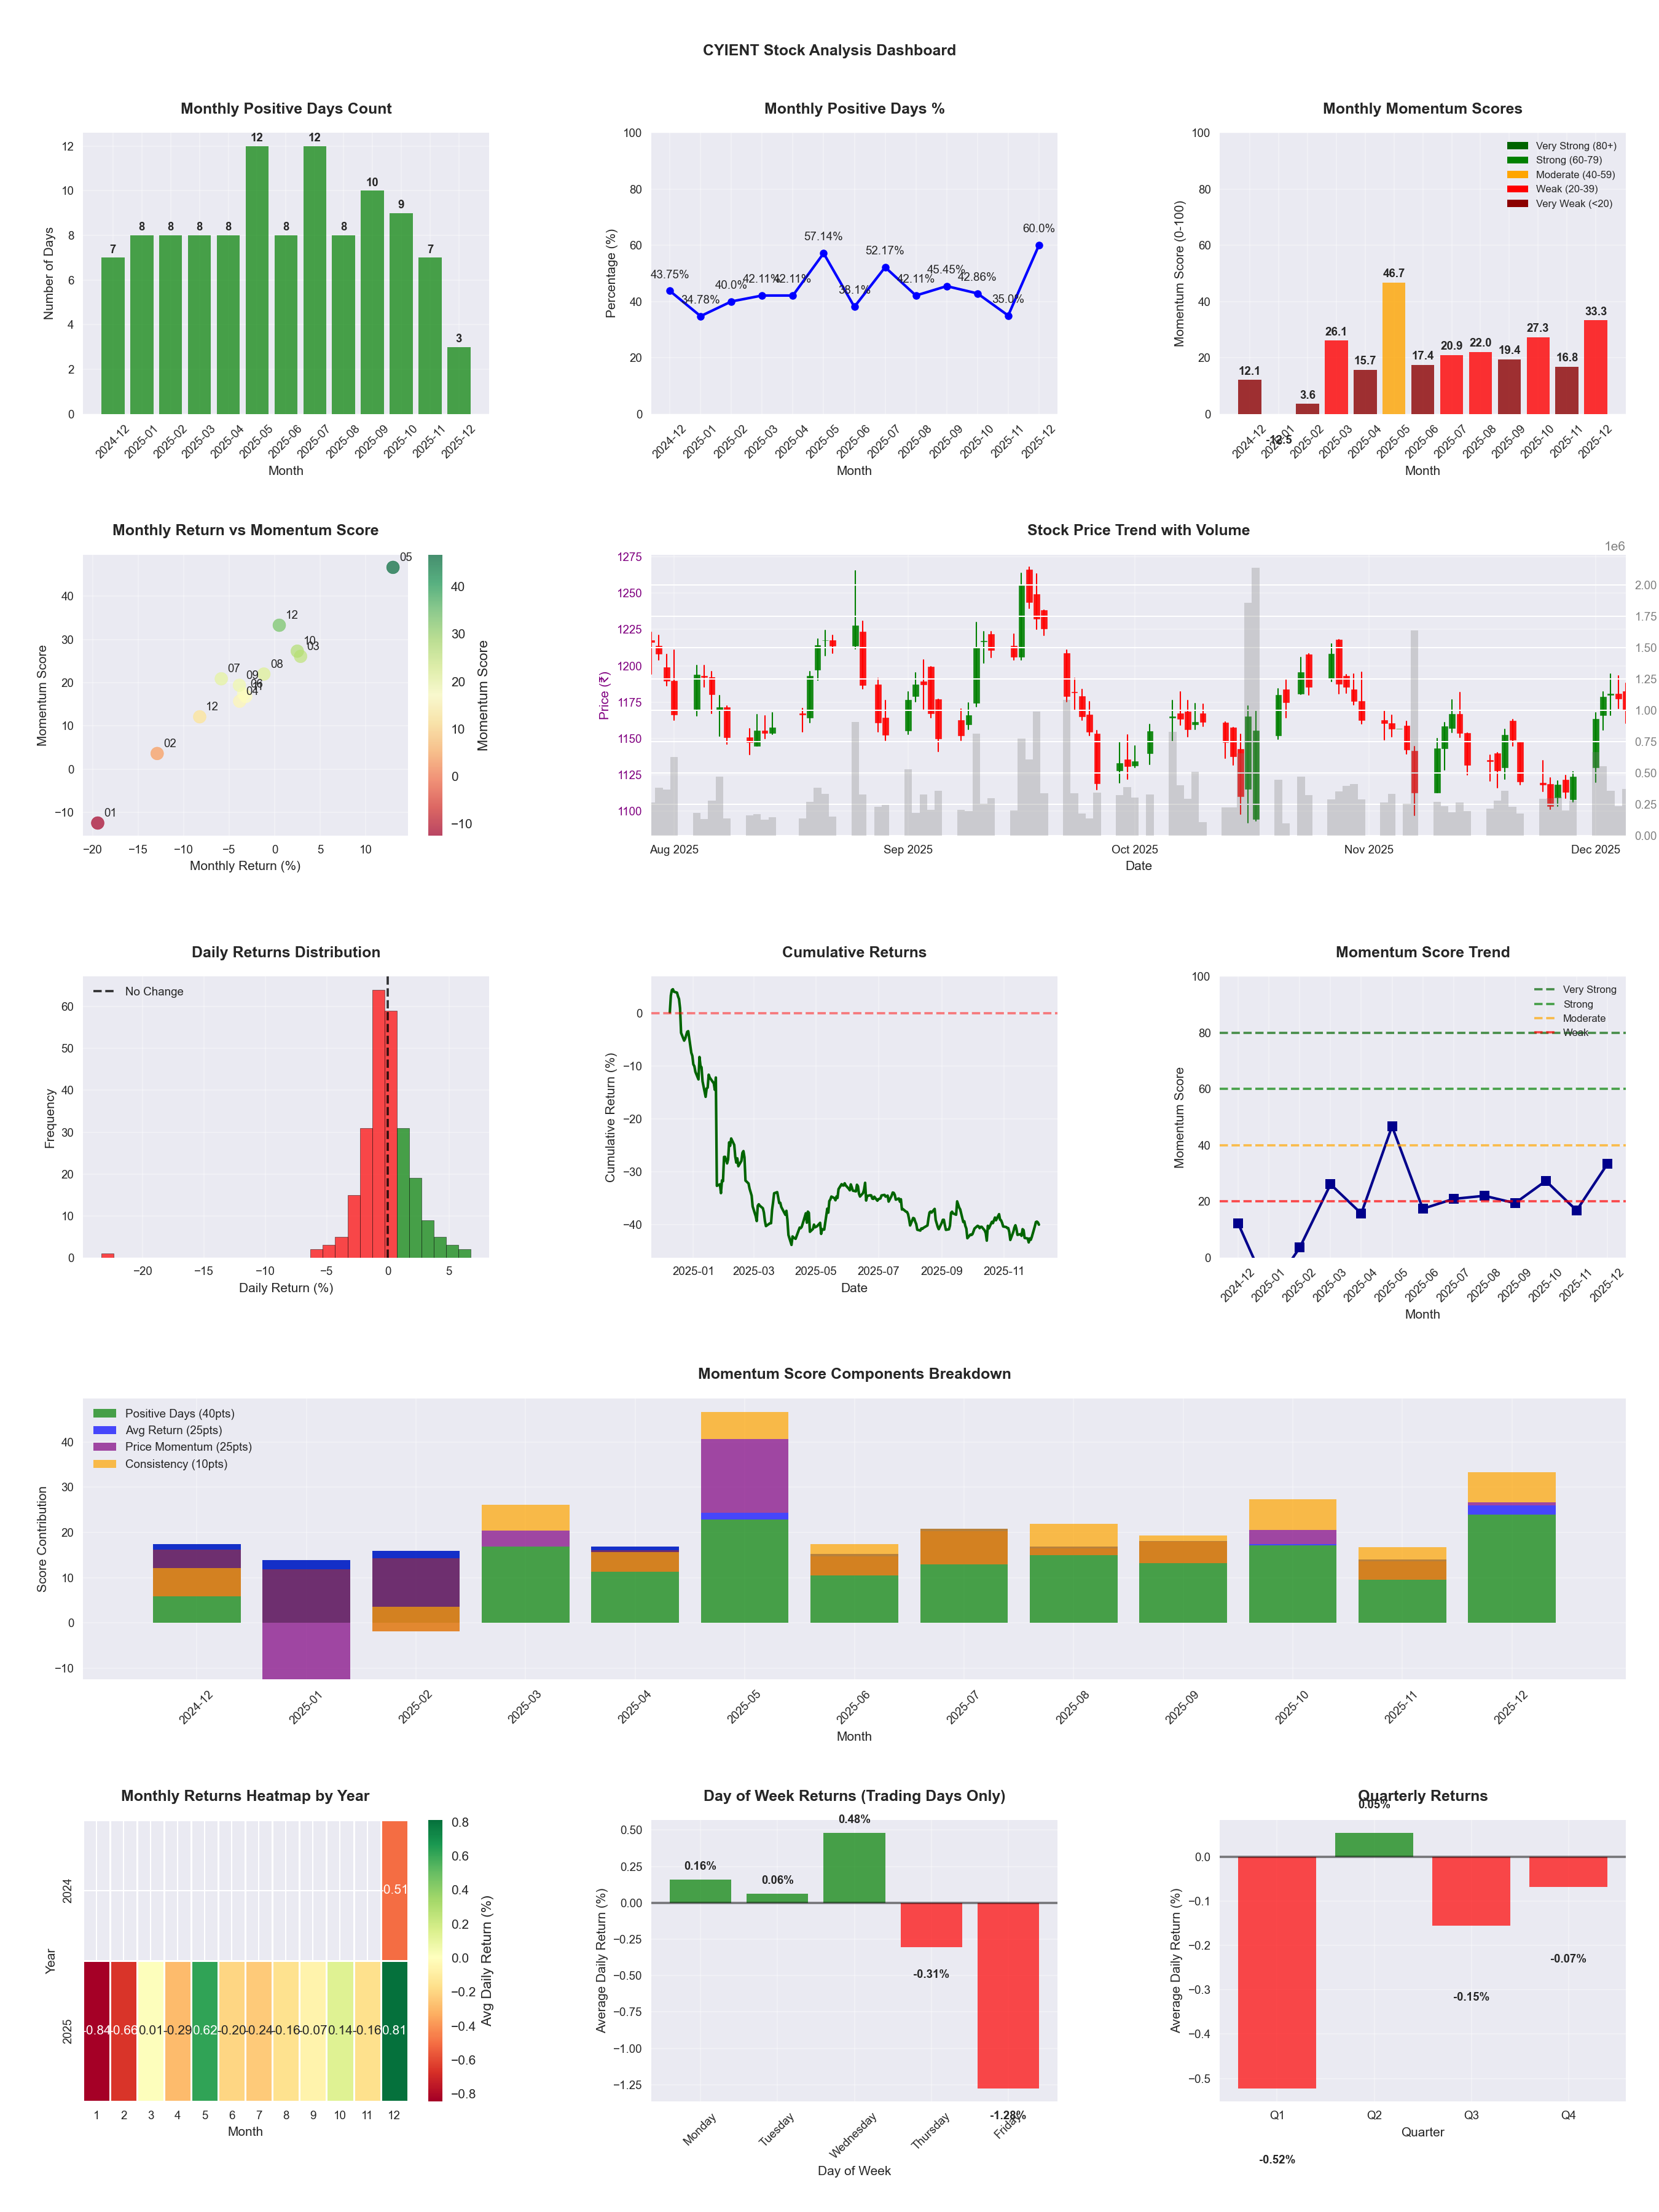
📈 CYIENT
Date
📅 2026-04-11
Volatility
🟡 1.91%
Win Rate
⚠️ 45.1%
Avg Daily Return
📉 -0.07%
Max Drawdown
📉 -43.14%
IBD RS Score
📊 10.5
Weak
Market Rank
#441
Best Month
🏆 2026-04
Best Months to Trade
📅 Apr, May, Oct
Best Days to Trade
📅 Wednesday, Monday
📊 Key Insights & Metrics
Symbol
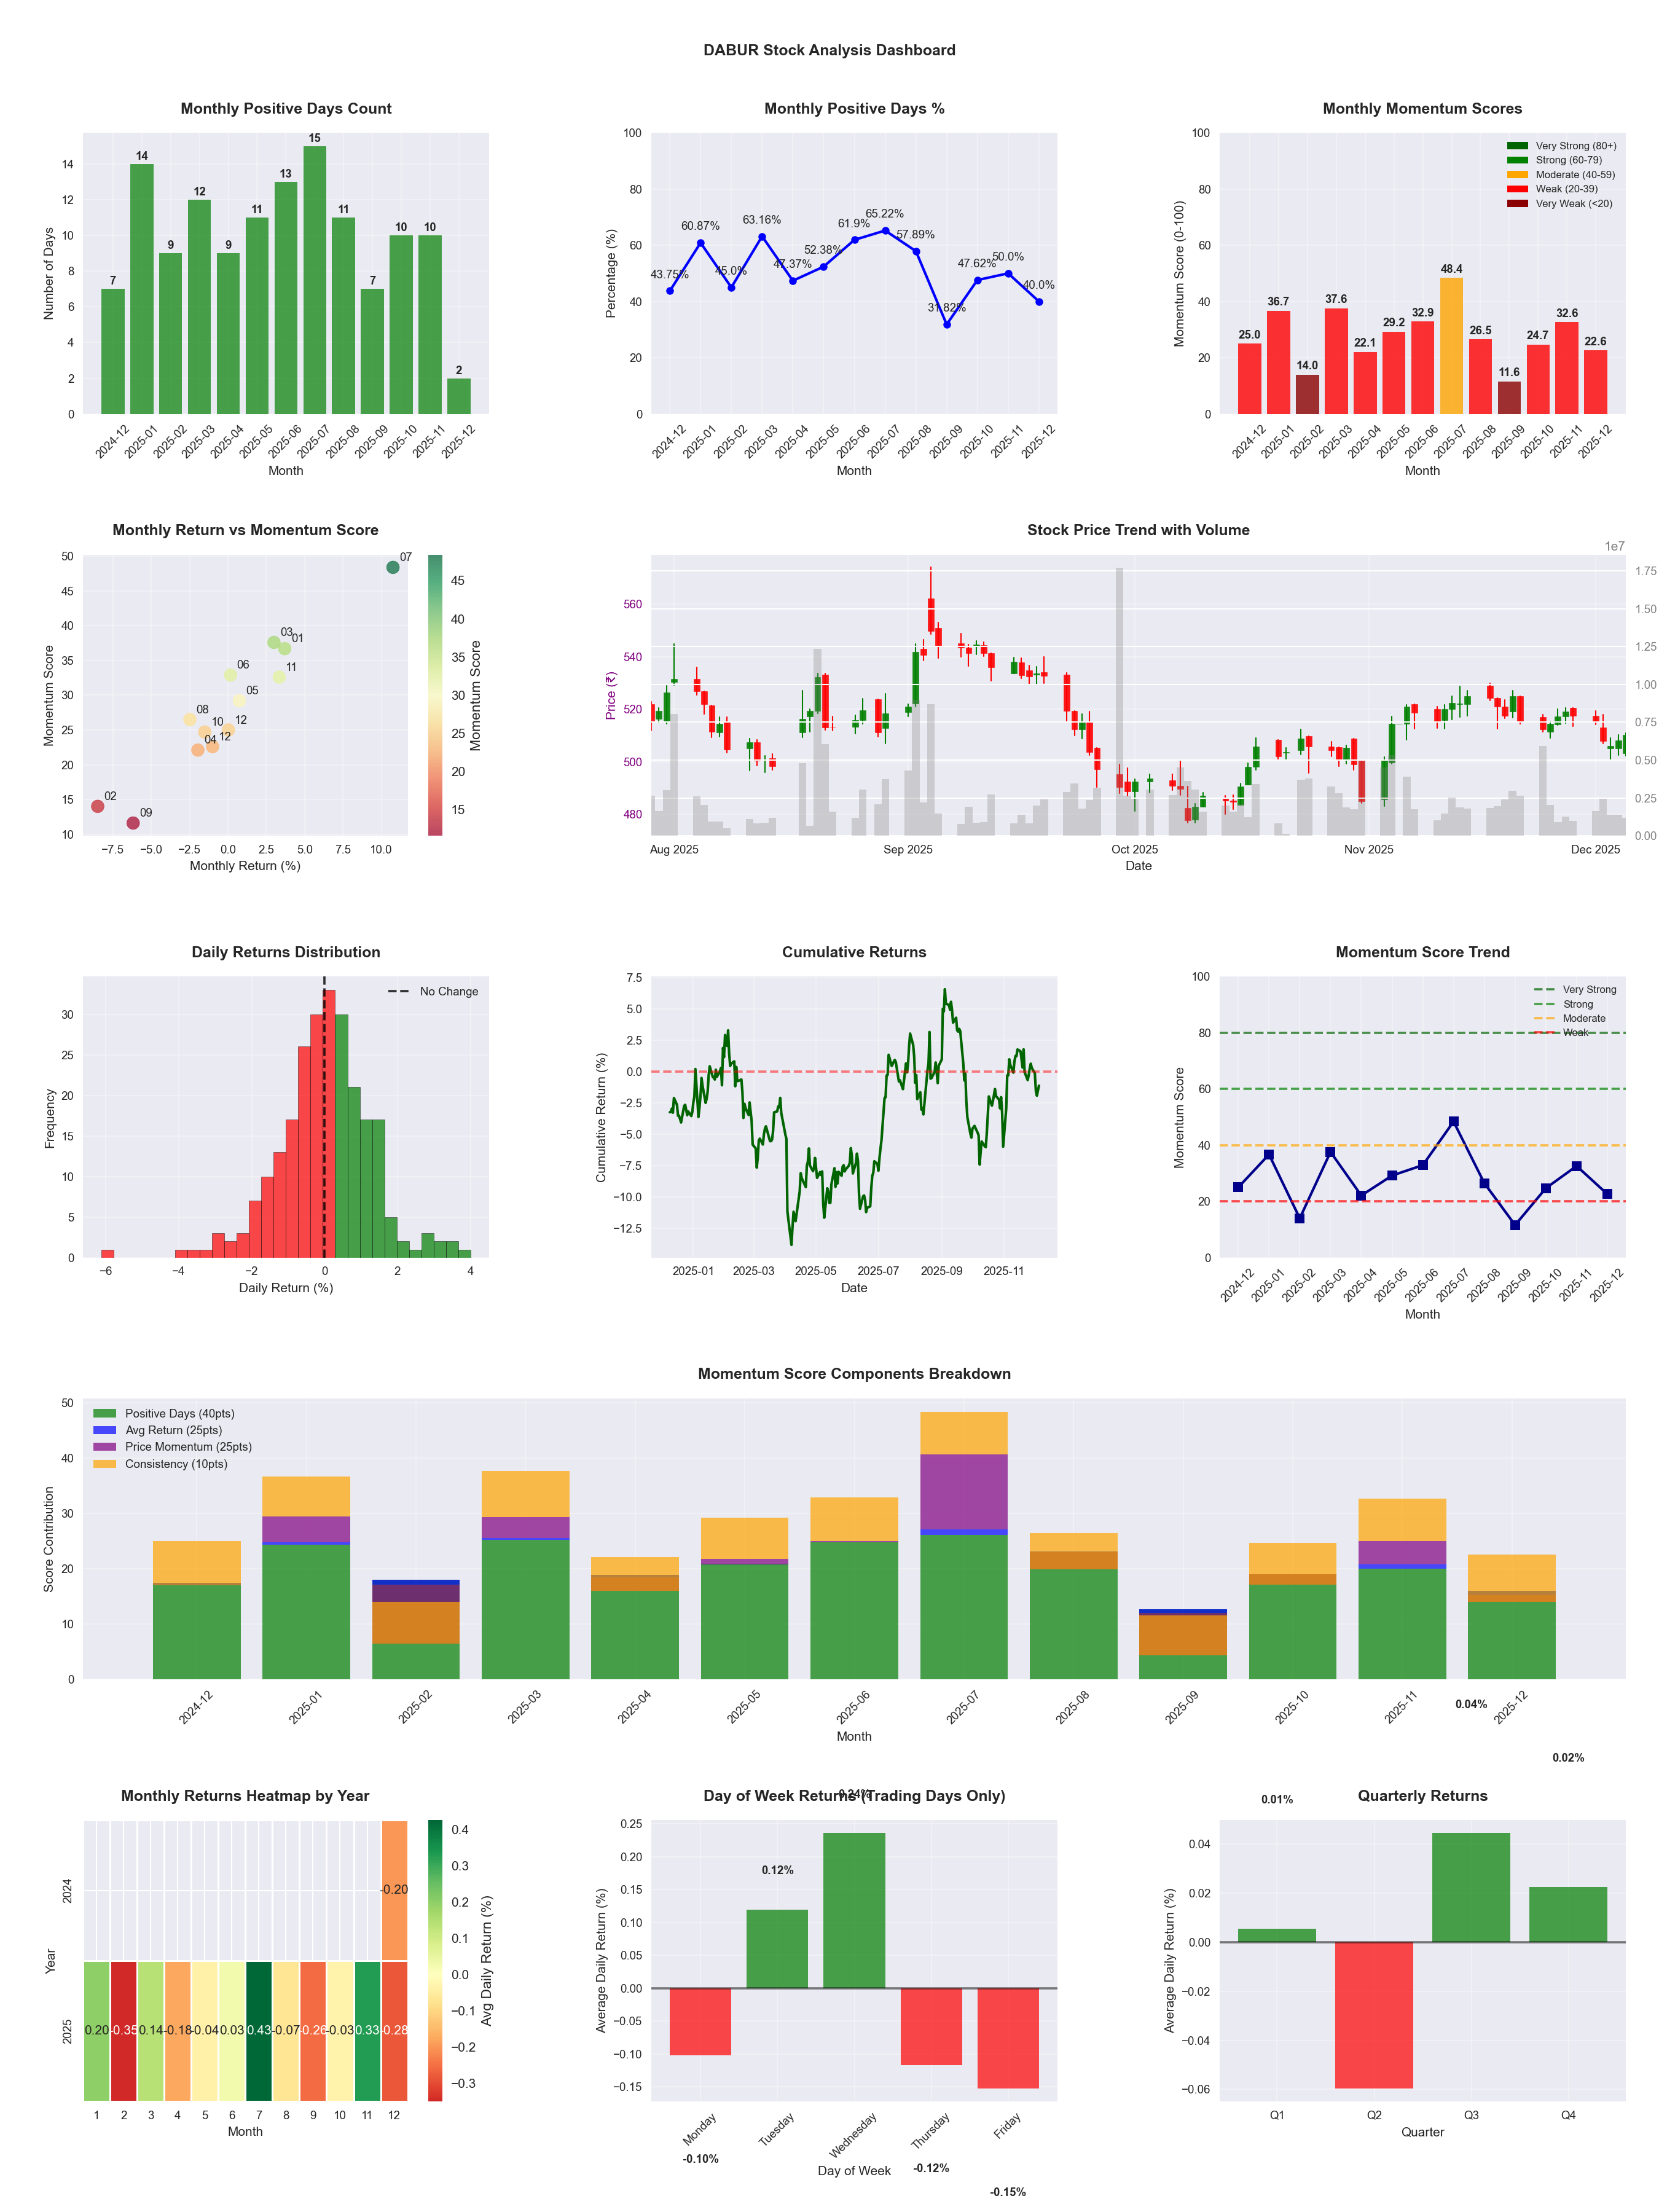
📈 DABUR
Date
📅 2026-04-11
Volatility
🟢 1.35%
Win Rate
⚠️ 50.8%
Avg Daily Return
📉 -0.01%
Max Drawdown
📉 -25.35%
IBD RS Score
📊 29.4
Weak
Market Rank
#348
Best Month
🏆 2026-04
Best Months to Trade
📅 Apr, Jul, Nov
Best Days to Trade
📅 Wednesday, Tuesday
📊 Key Insights & Metrics
Symbol
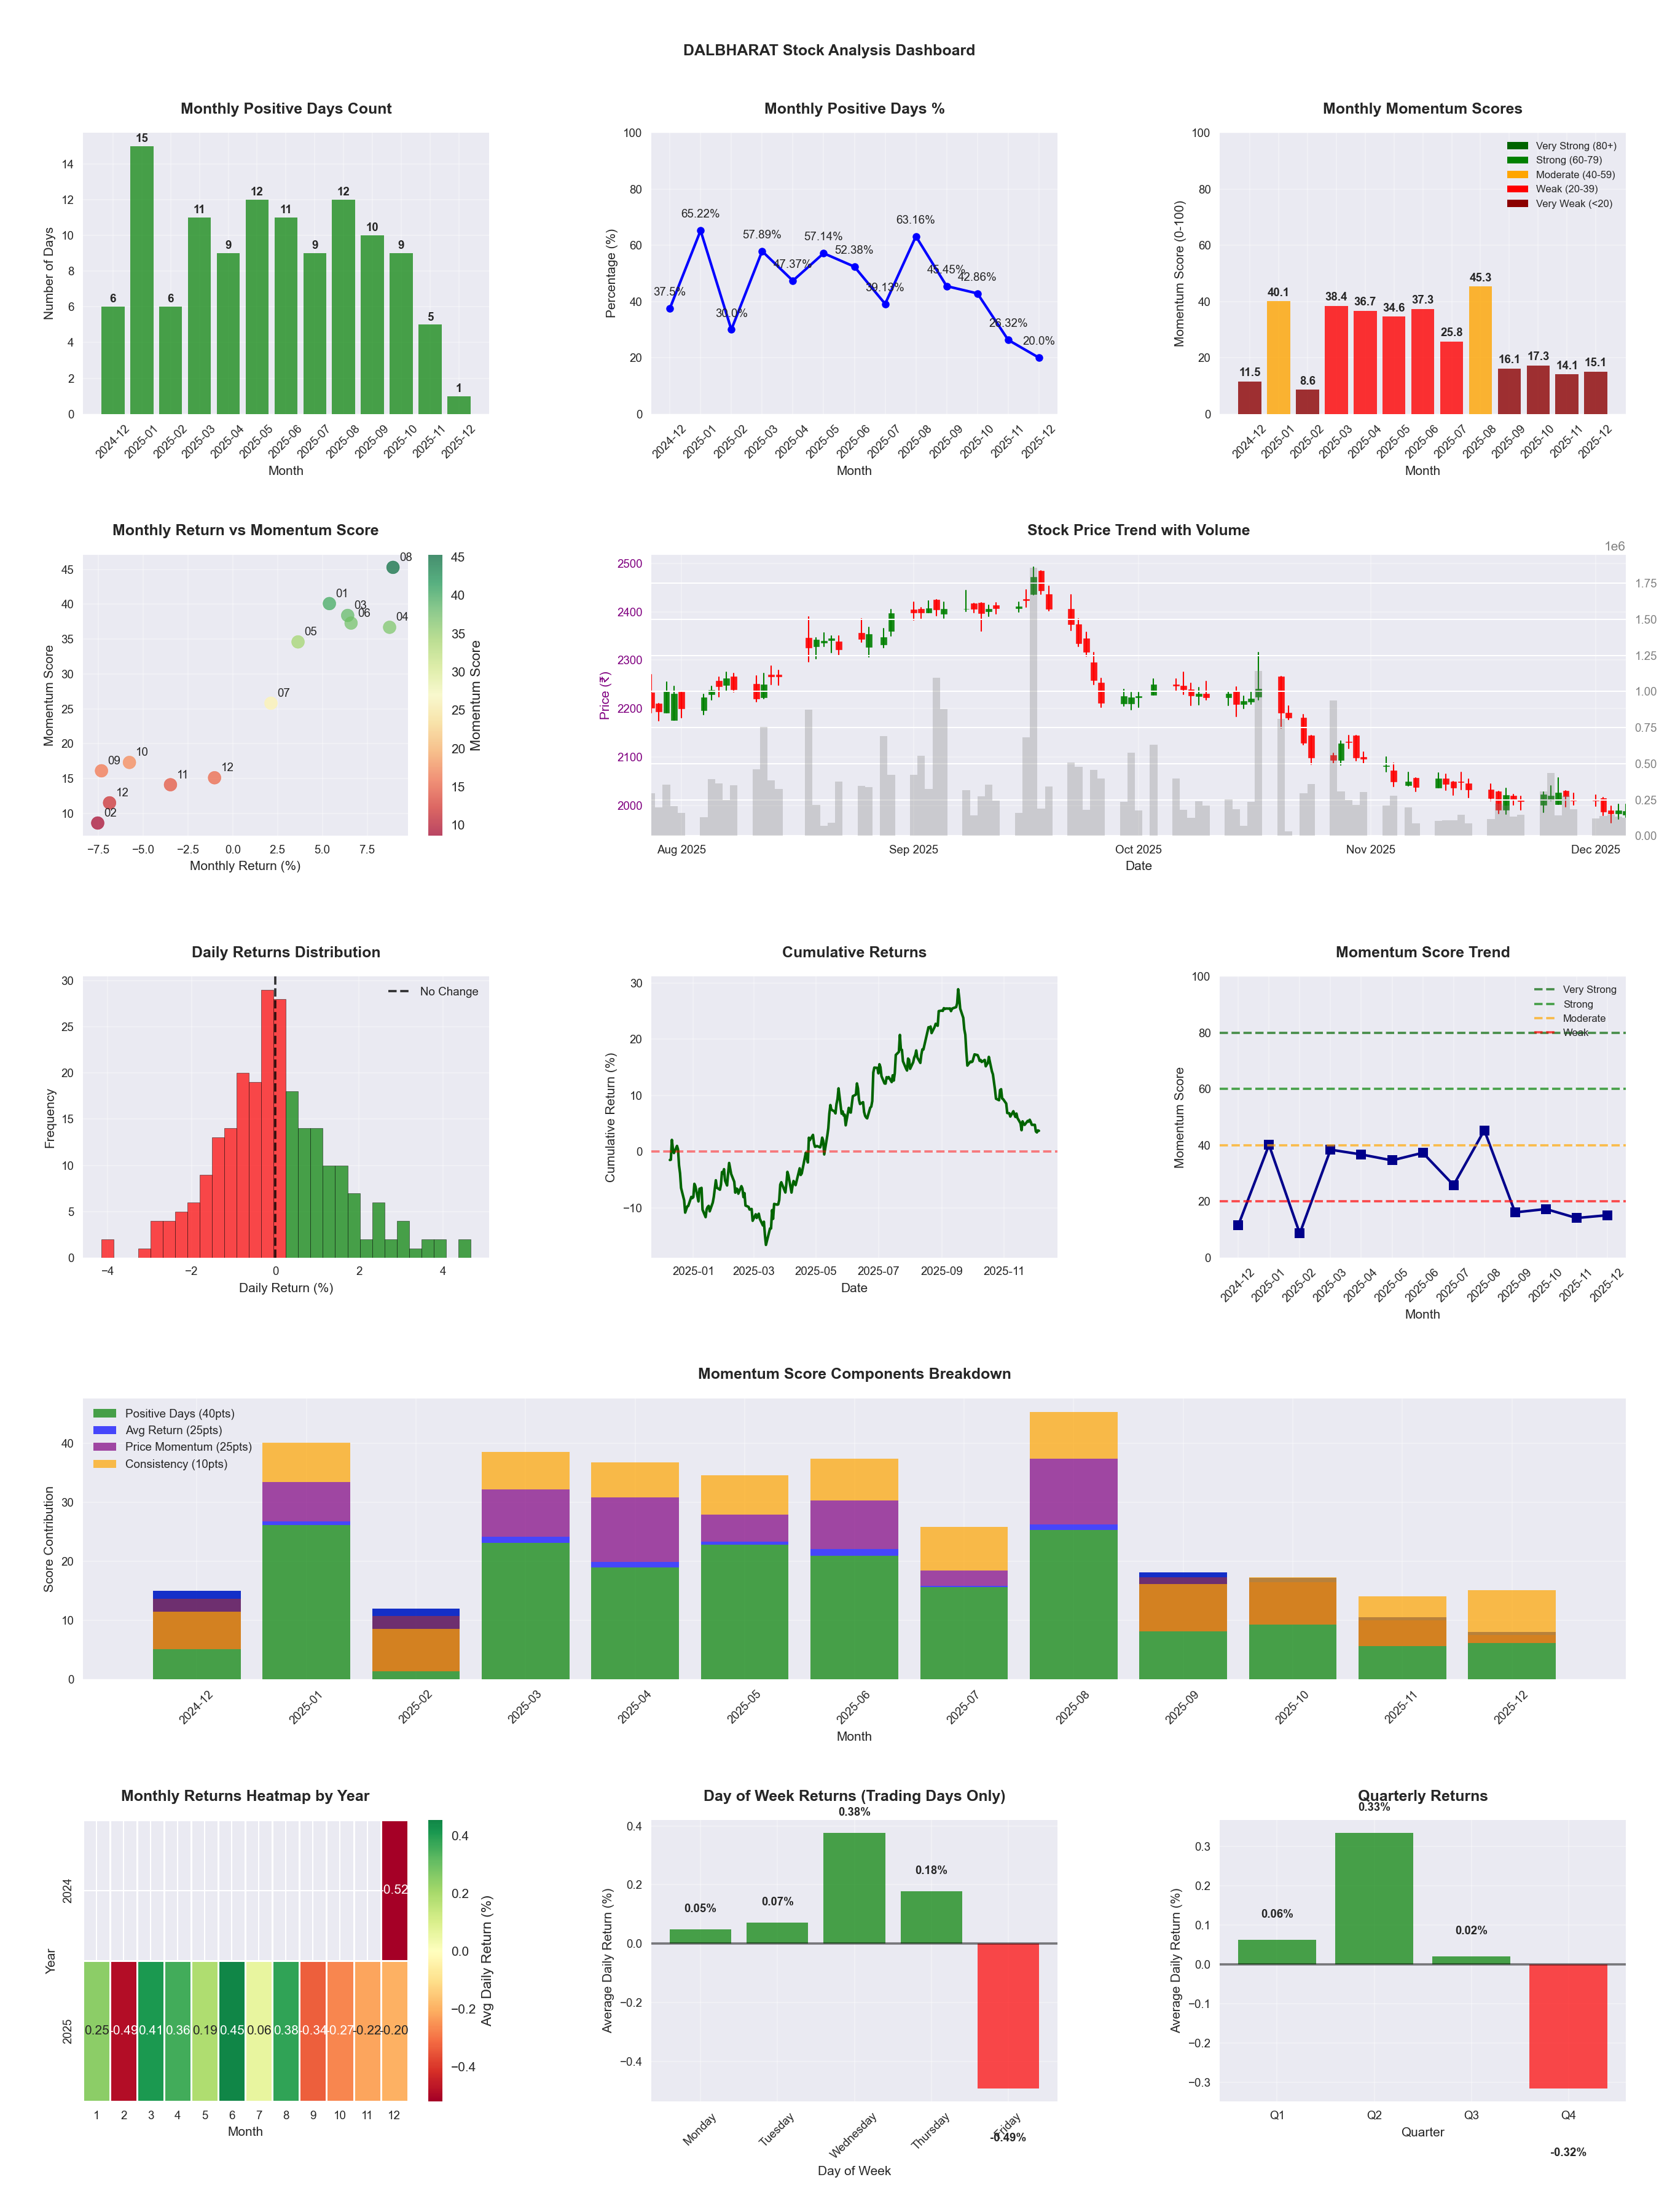
📈 DALBHARAT
Date
📅 2026-04-11
Volatility
🟡 1.63%
Win Rate
⚠️ 45.9%
Avg Daily Return
📈 +0.05%
Max Drawdown
📉 -29.35%
IBD RS Score
📊 52.5
Average
Market Rank
#234
Best Month
🏆 2025-08
Worst Month
📉 2026-03
Best Months to Trade
📅 Apr, Jun, Aug
Best Days to Trade
📅 Wednesday, Monday
📊 Key Insights & Metrics
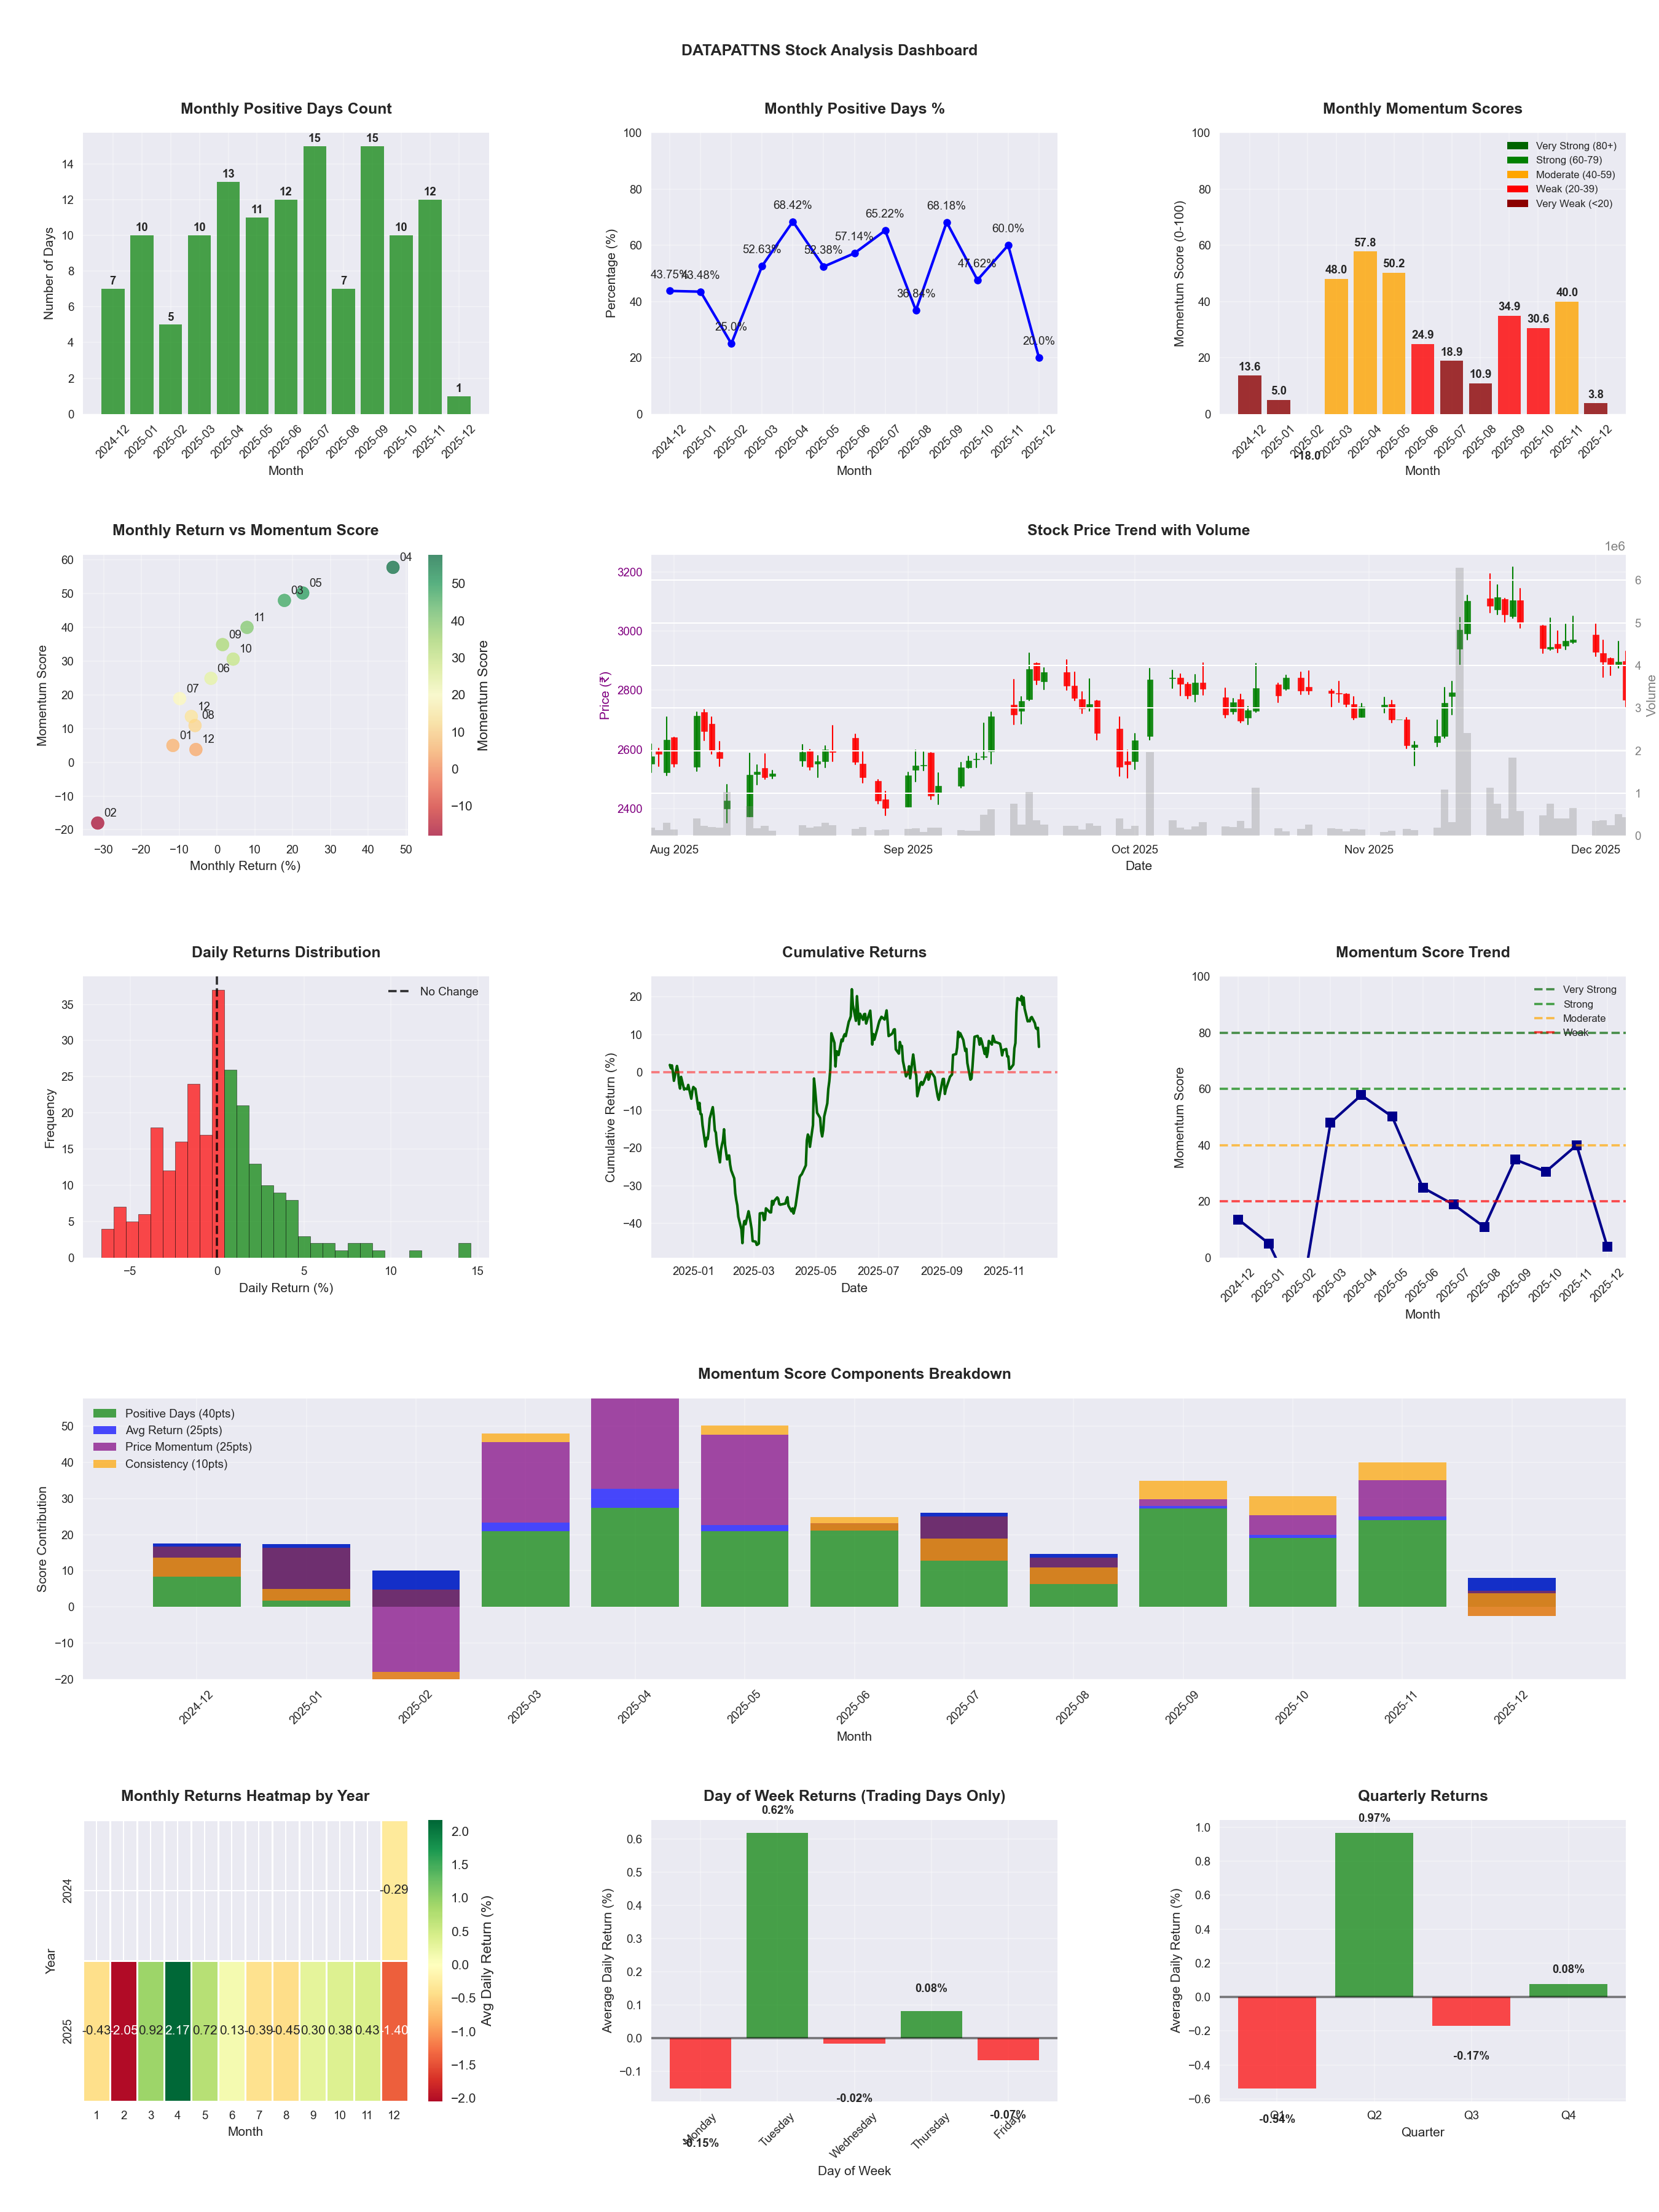
Symbol
📈 DATAPATTNS
Date
📅 2026-04-11
Volatility
🔴 3.22%
Risk Profile
⚠️ suitable for aggressive investors
Win Rate
⚠️ 53.2%
Avg Daily Return
📈 +0.32%
Max Drawdown
📉 -30.97%
IBD RS Score
📊 94.7
Leader
Market Rank
#26
Best Month
🏆 2025-04
Worst Month
📉 2026-03
Best Months to Trade
📅 Apr, Feb, May
Best Days to Trade
📅 Tuesday, Thursday
📊 Key Insights & Metrics
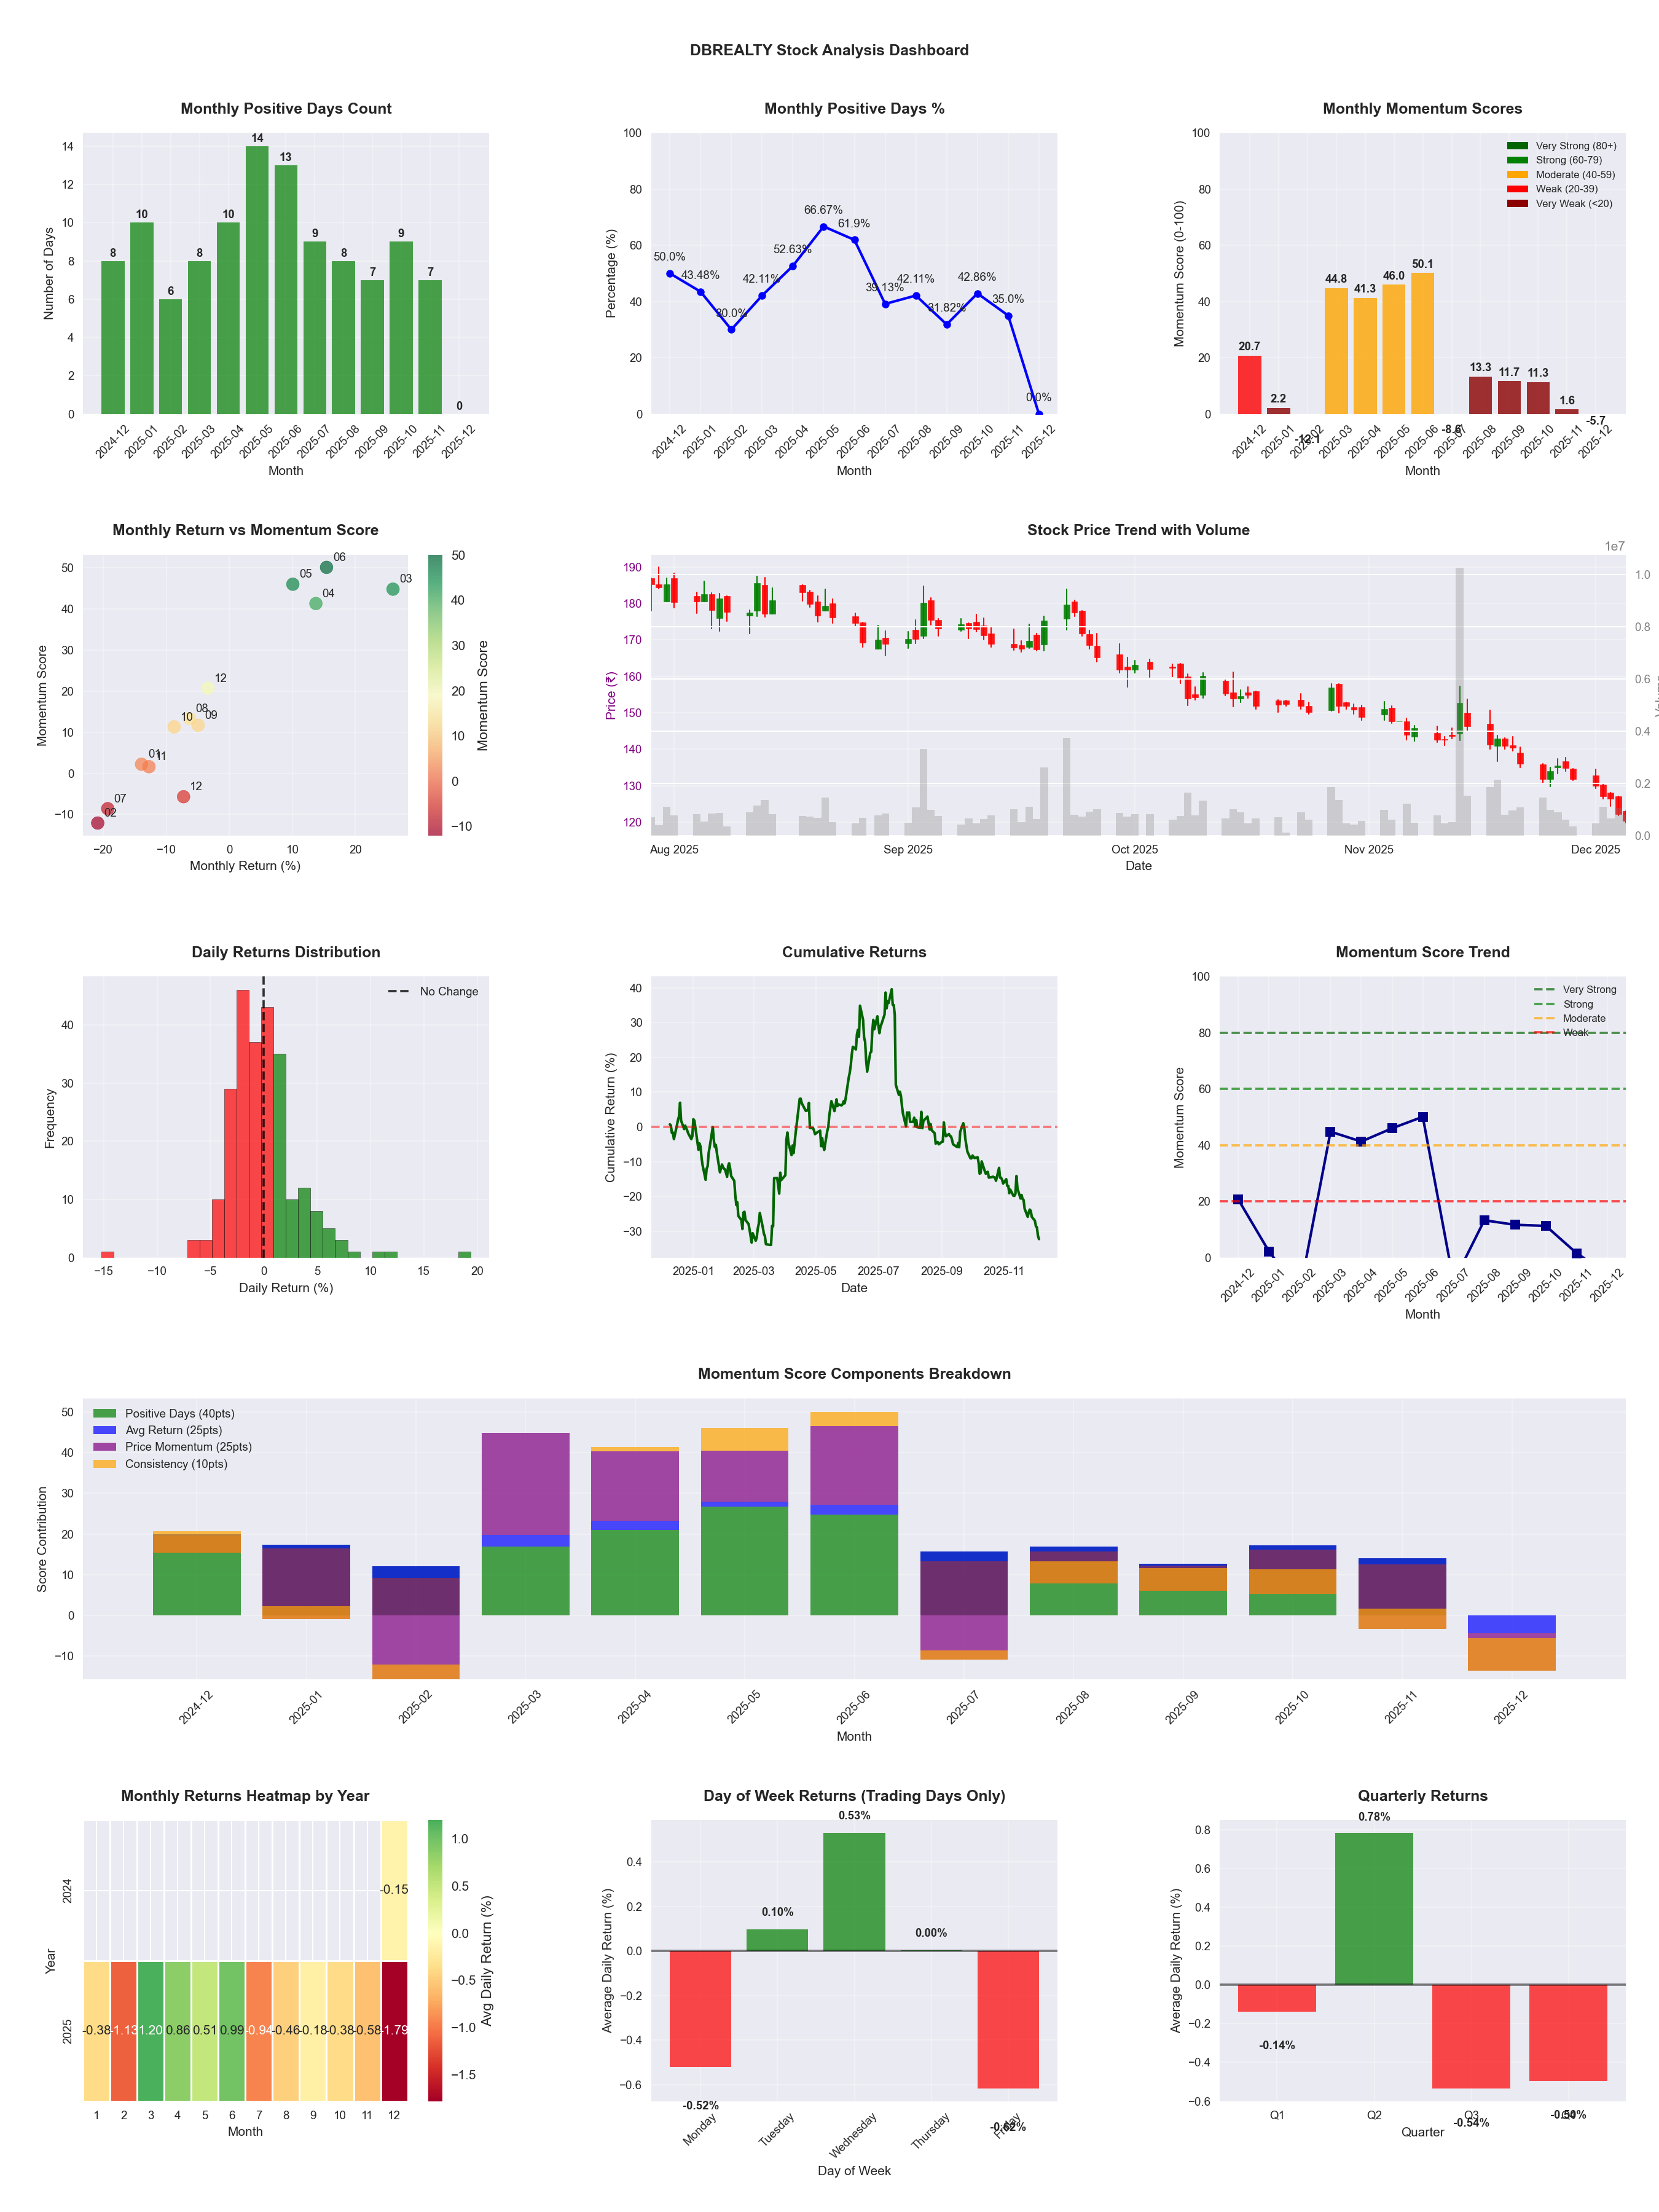
Symbol
📈 DBREALTY
Date
📅 2026-04-11
Volatility
🔴 3.10%
Risk Profile
⚠️ suitable for aggressive investors
Win Rate
⚠️ 44.3%
Avg Daily Return
📉 -0.18%
Max Drawdown
📉 -66.19%
IBD RS Score
📊 3.0
Weak
Market Rank
#478
Best Month
🏆 2025-06
Best Months to Trade
📅 Apr, Jun, May
Best Days to Trade
📅 Wednesday, Tuesday
📊 Key Insights & Metrics
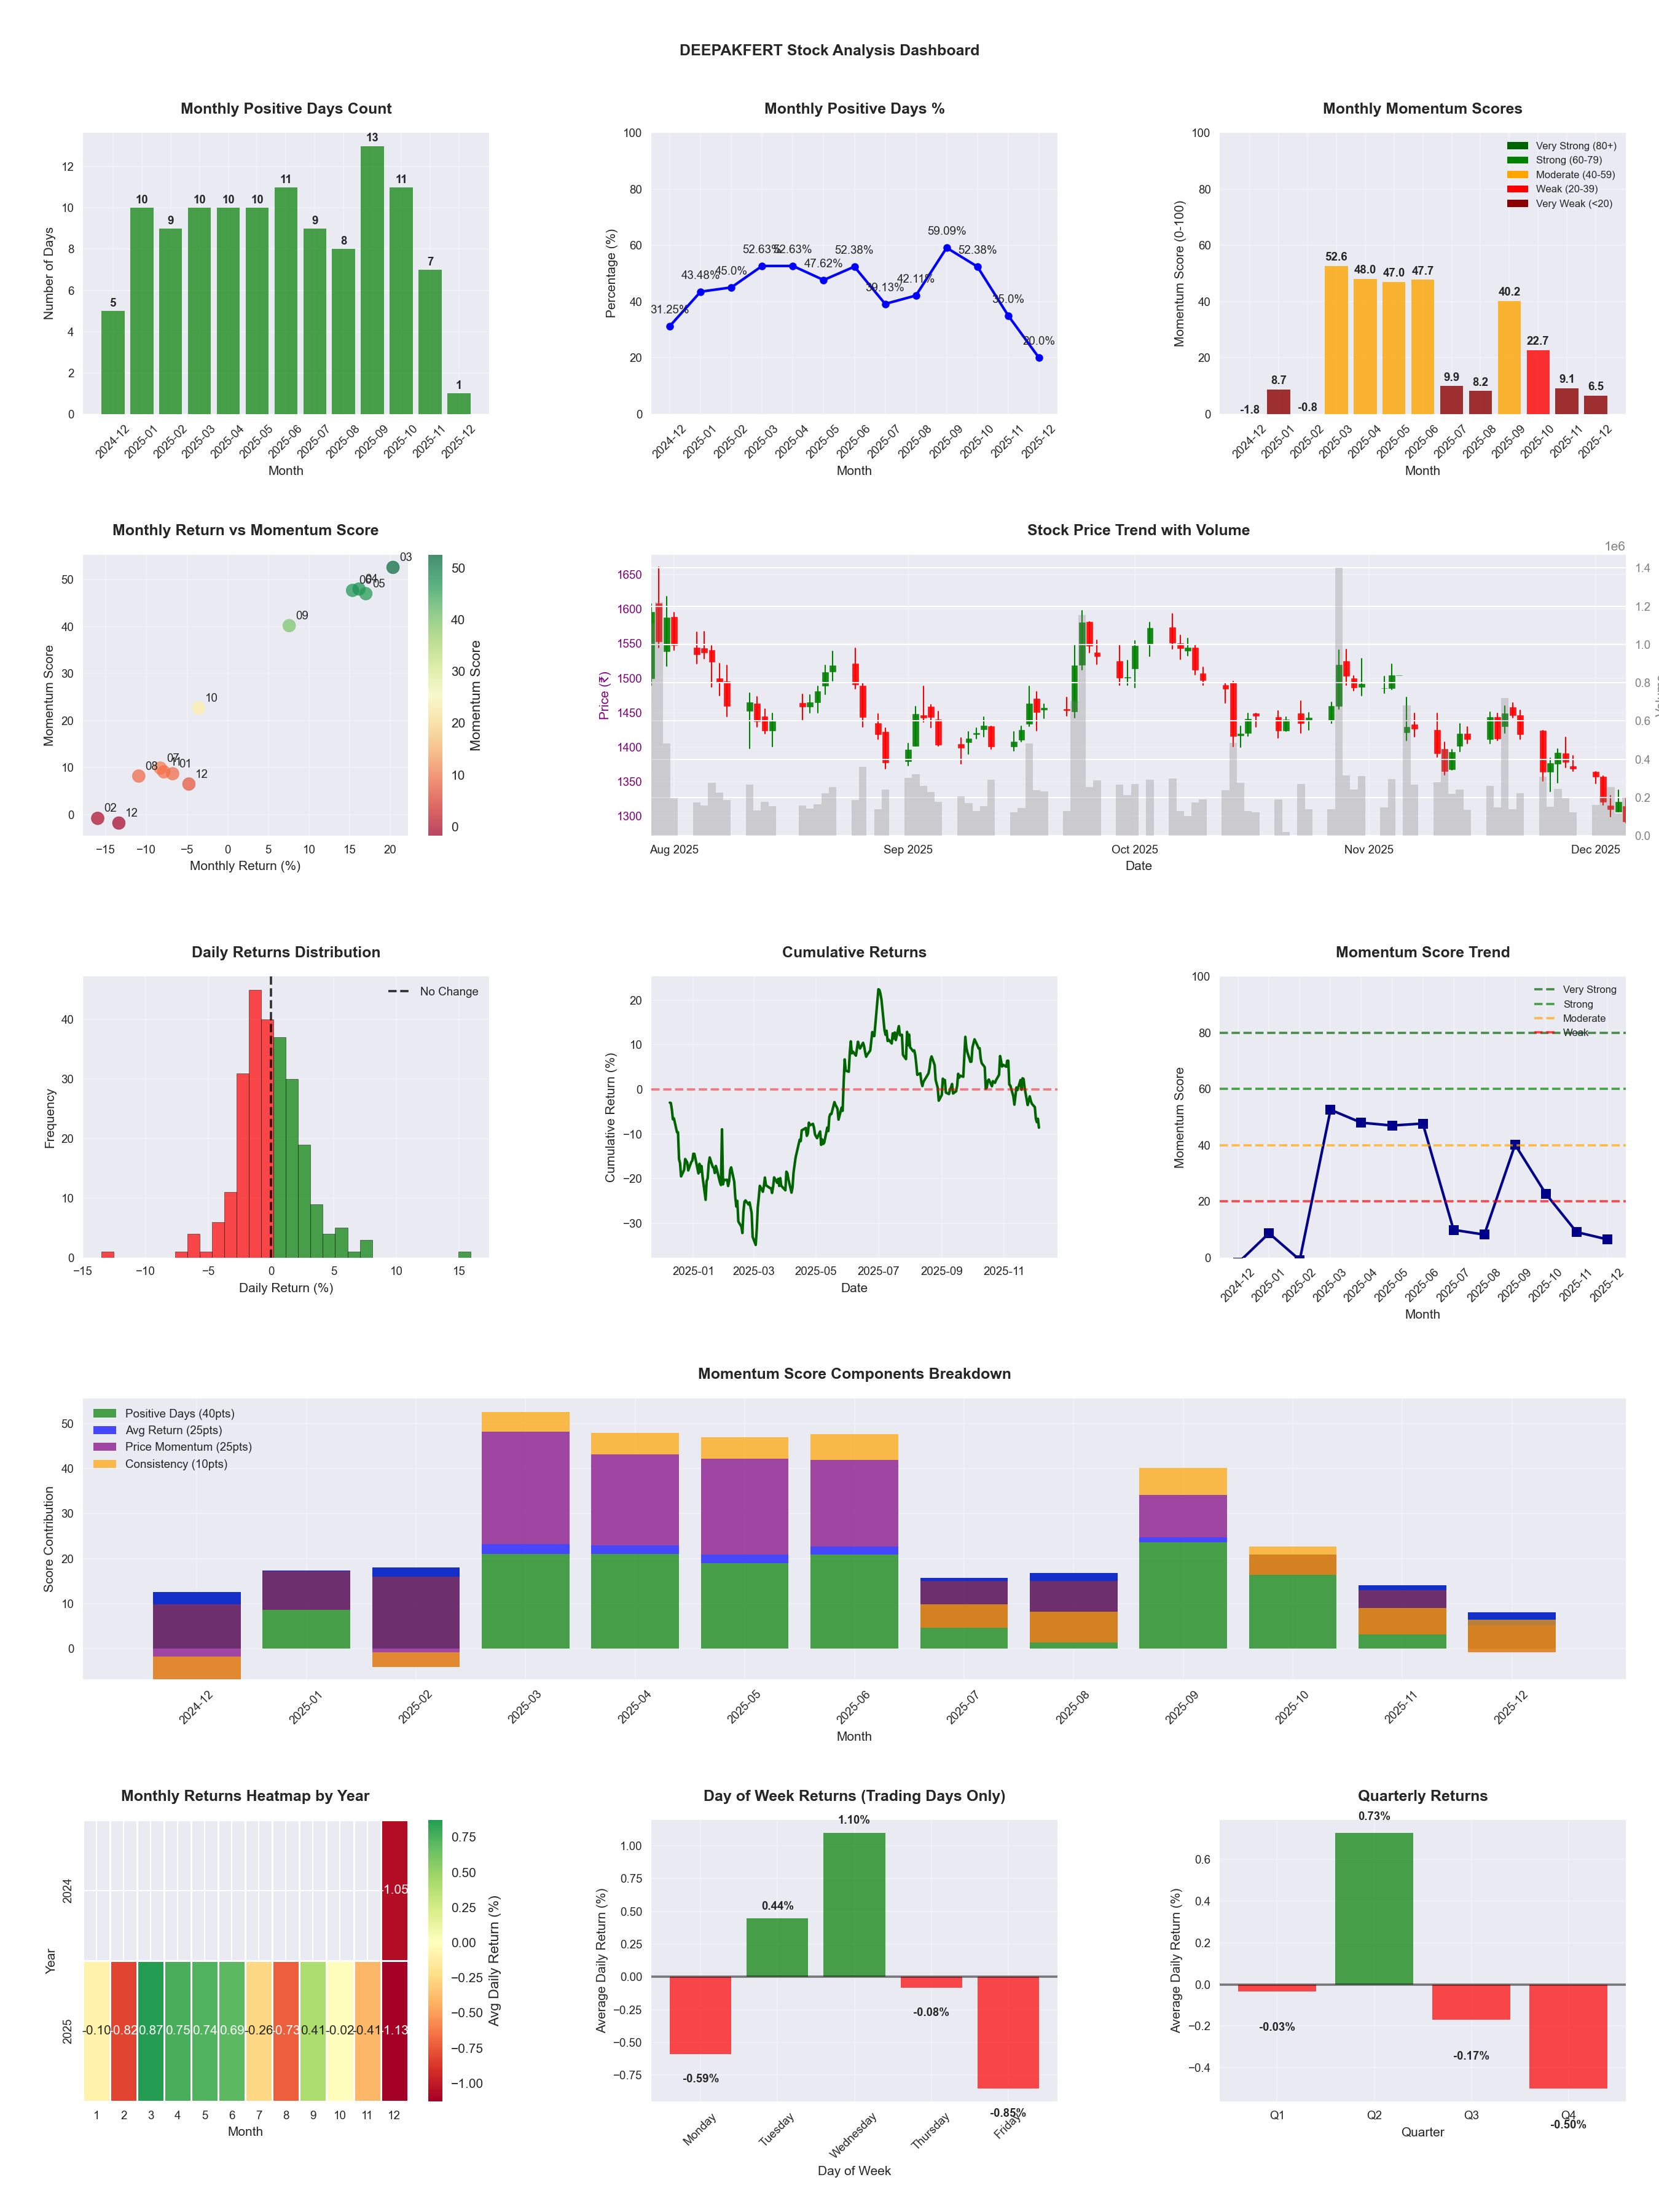
Symbol
📈 DEEPAKFERT
Date
📅 2026-04-11
Volatility
🟡 2.48%
Risk Profile
⚠️ suitable for aggressive investors
Win Rate
⚠️ 45.1%
Avg Daily Return
📉 -0.01%
Max Drawdown
📉 -49.62%
IBD RS Score
📊 17.4
Weak
Market Rank
#407
Best Month
🏆 2026-04
Best Months to Trade
📅 Apr, May, Jun
Best Days to Trade
📅 Wednesday, Tuesday
📊 Key Insights & Metrics
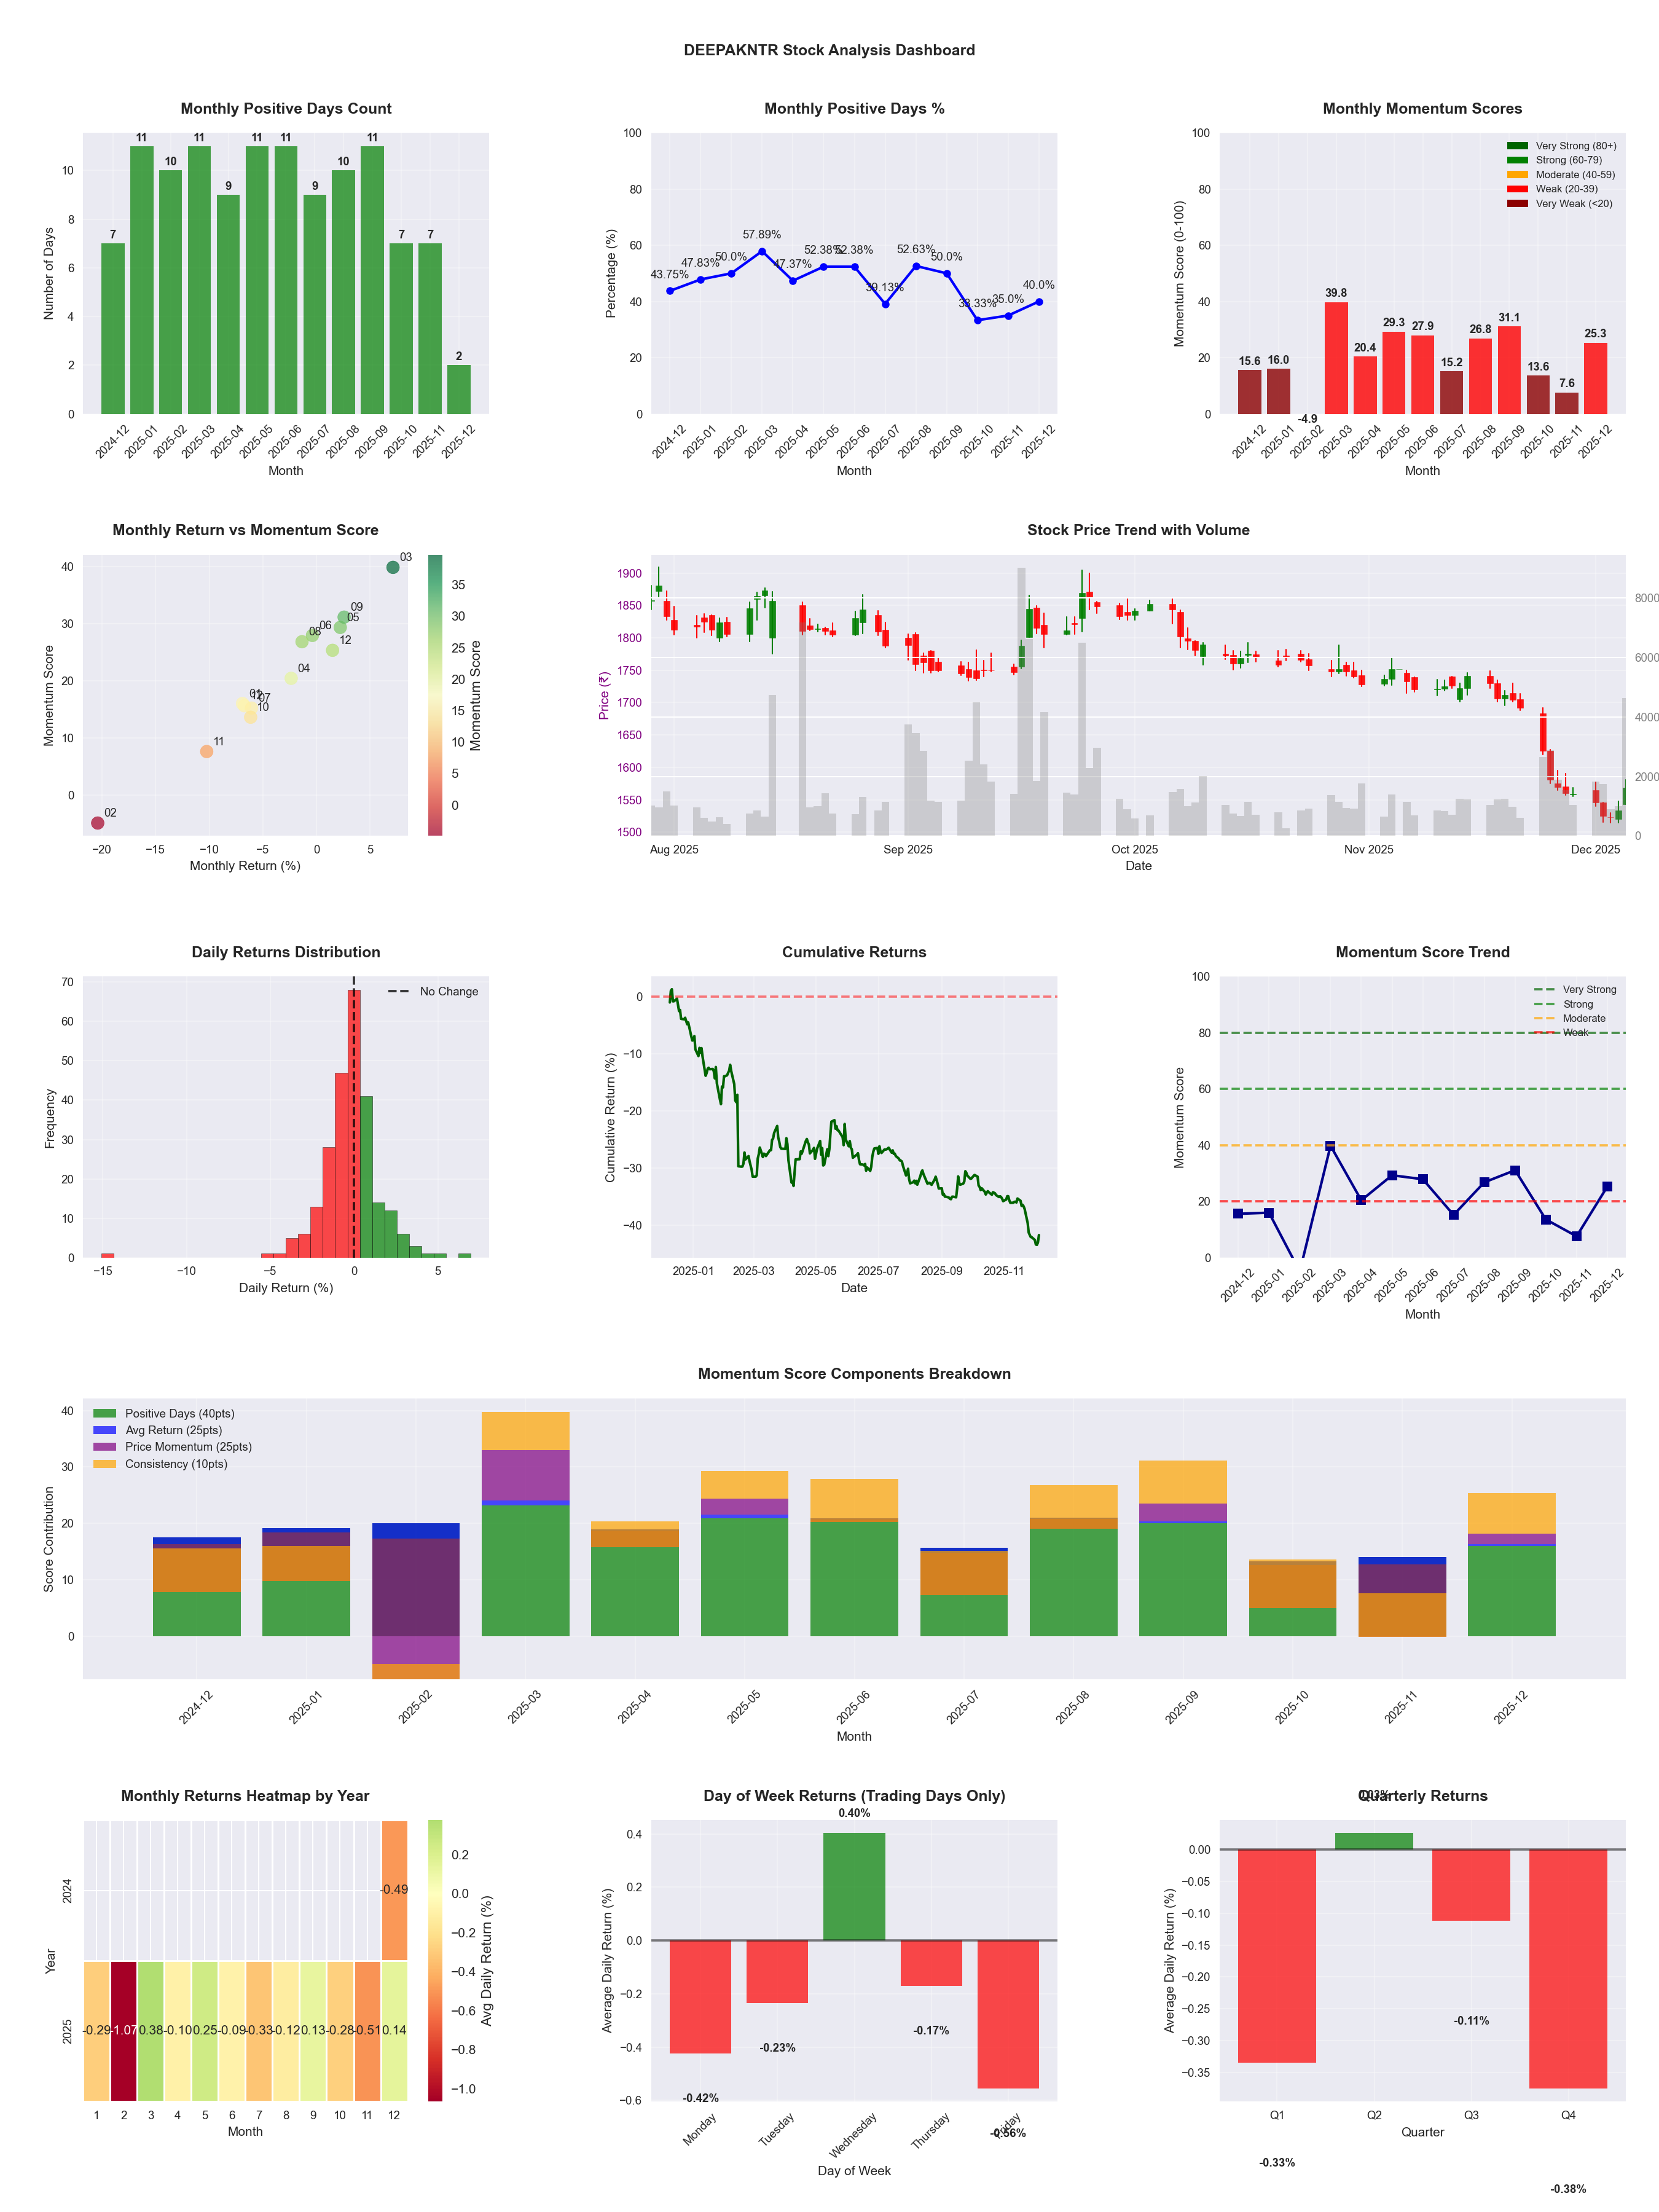
Symbol
📈 DEEPAKNTR
Date
📅 2026-04-11
Volatility
🟡 1.64%
Win Rate
⚠️ 45.5%
Avg Daily Return
📉 -0.10%
Max Drawdown
📉 -39.01%
IBD RS Score
📊 19.5
Weak
Market Rank
#397
Best Month
🏆 2026-04
Best Months to Trade
📅 Apr, Dec, May
Best Days to Trade
📅 Wednesday, Tuesday
📊 Key Insights & Metrics
Symbol
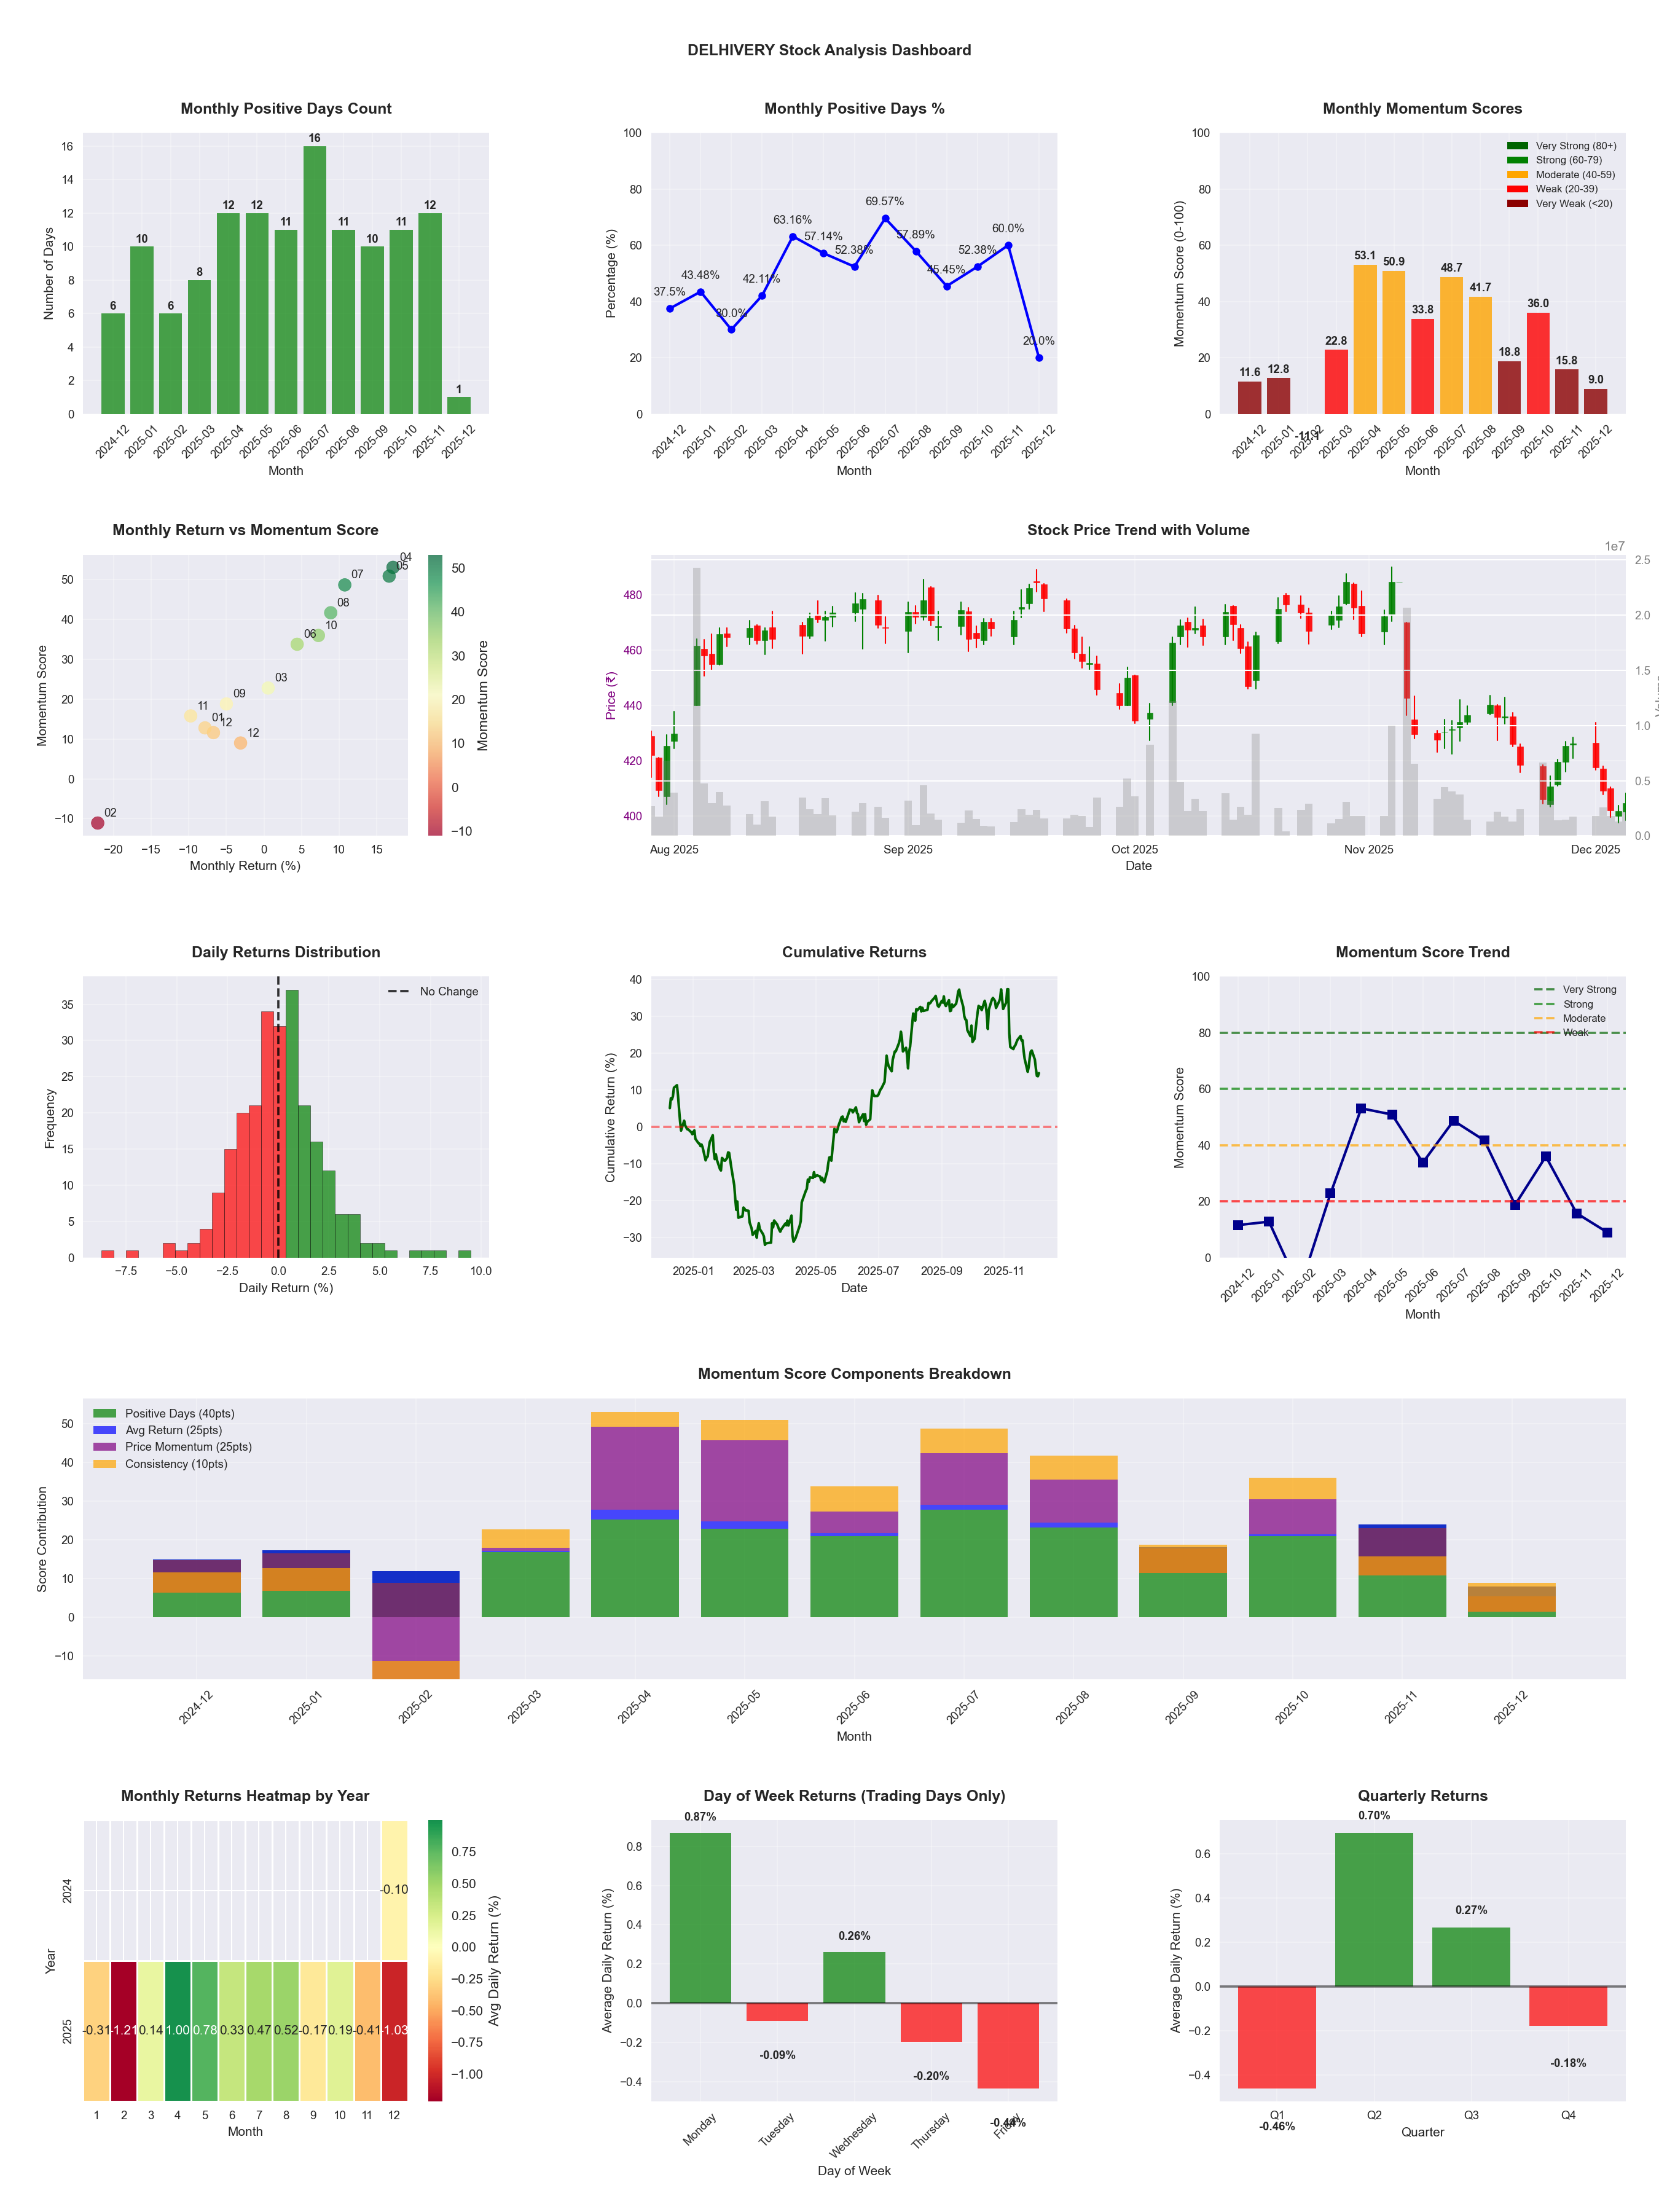
📈 DELHIVERY
Date
📅 2026-04-11
Volatility
🟡 2.04%
Risk Profile
⚠️ suitable for aggressive investors
Win Rate
⚠️ 55.7%
Avg Daily Return
📈 +0.28%
Max Drawdown
📉 -21.93%
IBD RS Score
📊 90.1
Leader
Market Rank
#49
Best Month
🏆 2025-04
Worst Month
📉 2026-03
Best Months to Trade
📅 Apr, May, Aug
Best Days to Trade
📅 Monday, Tuesday
📊 Key Insights & Metrics
Symbol
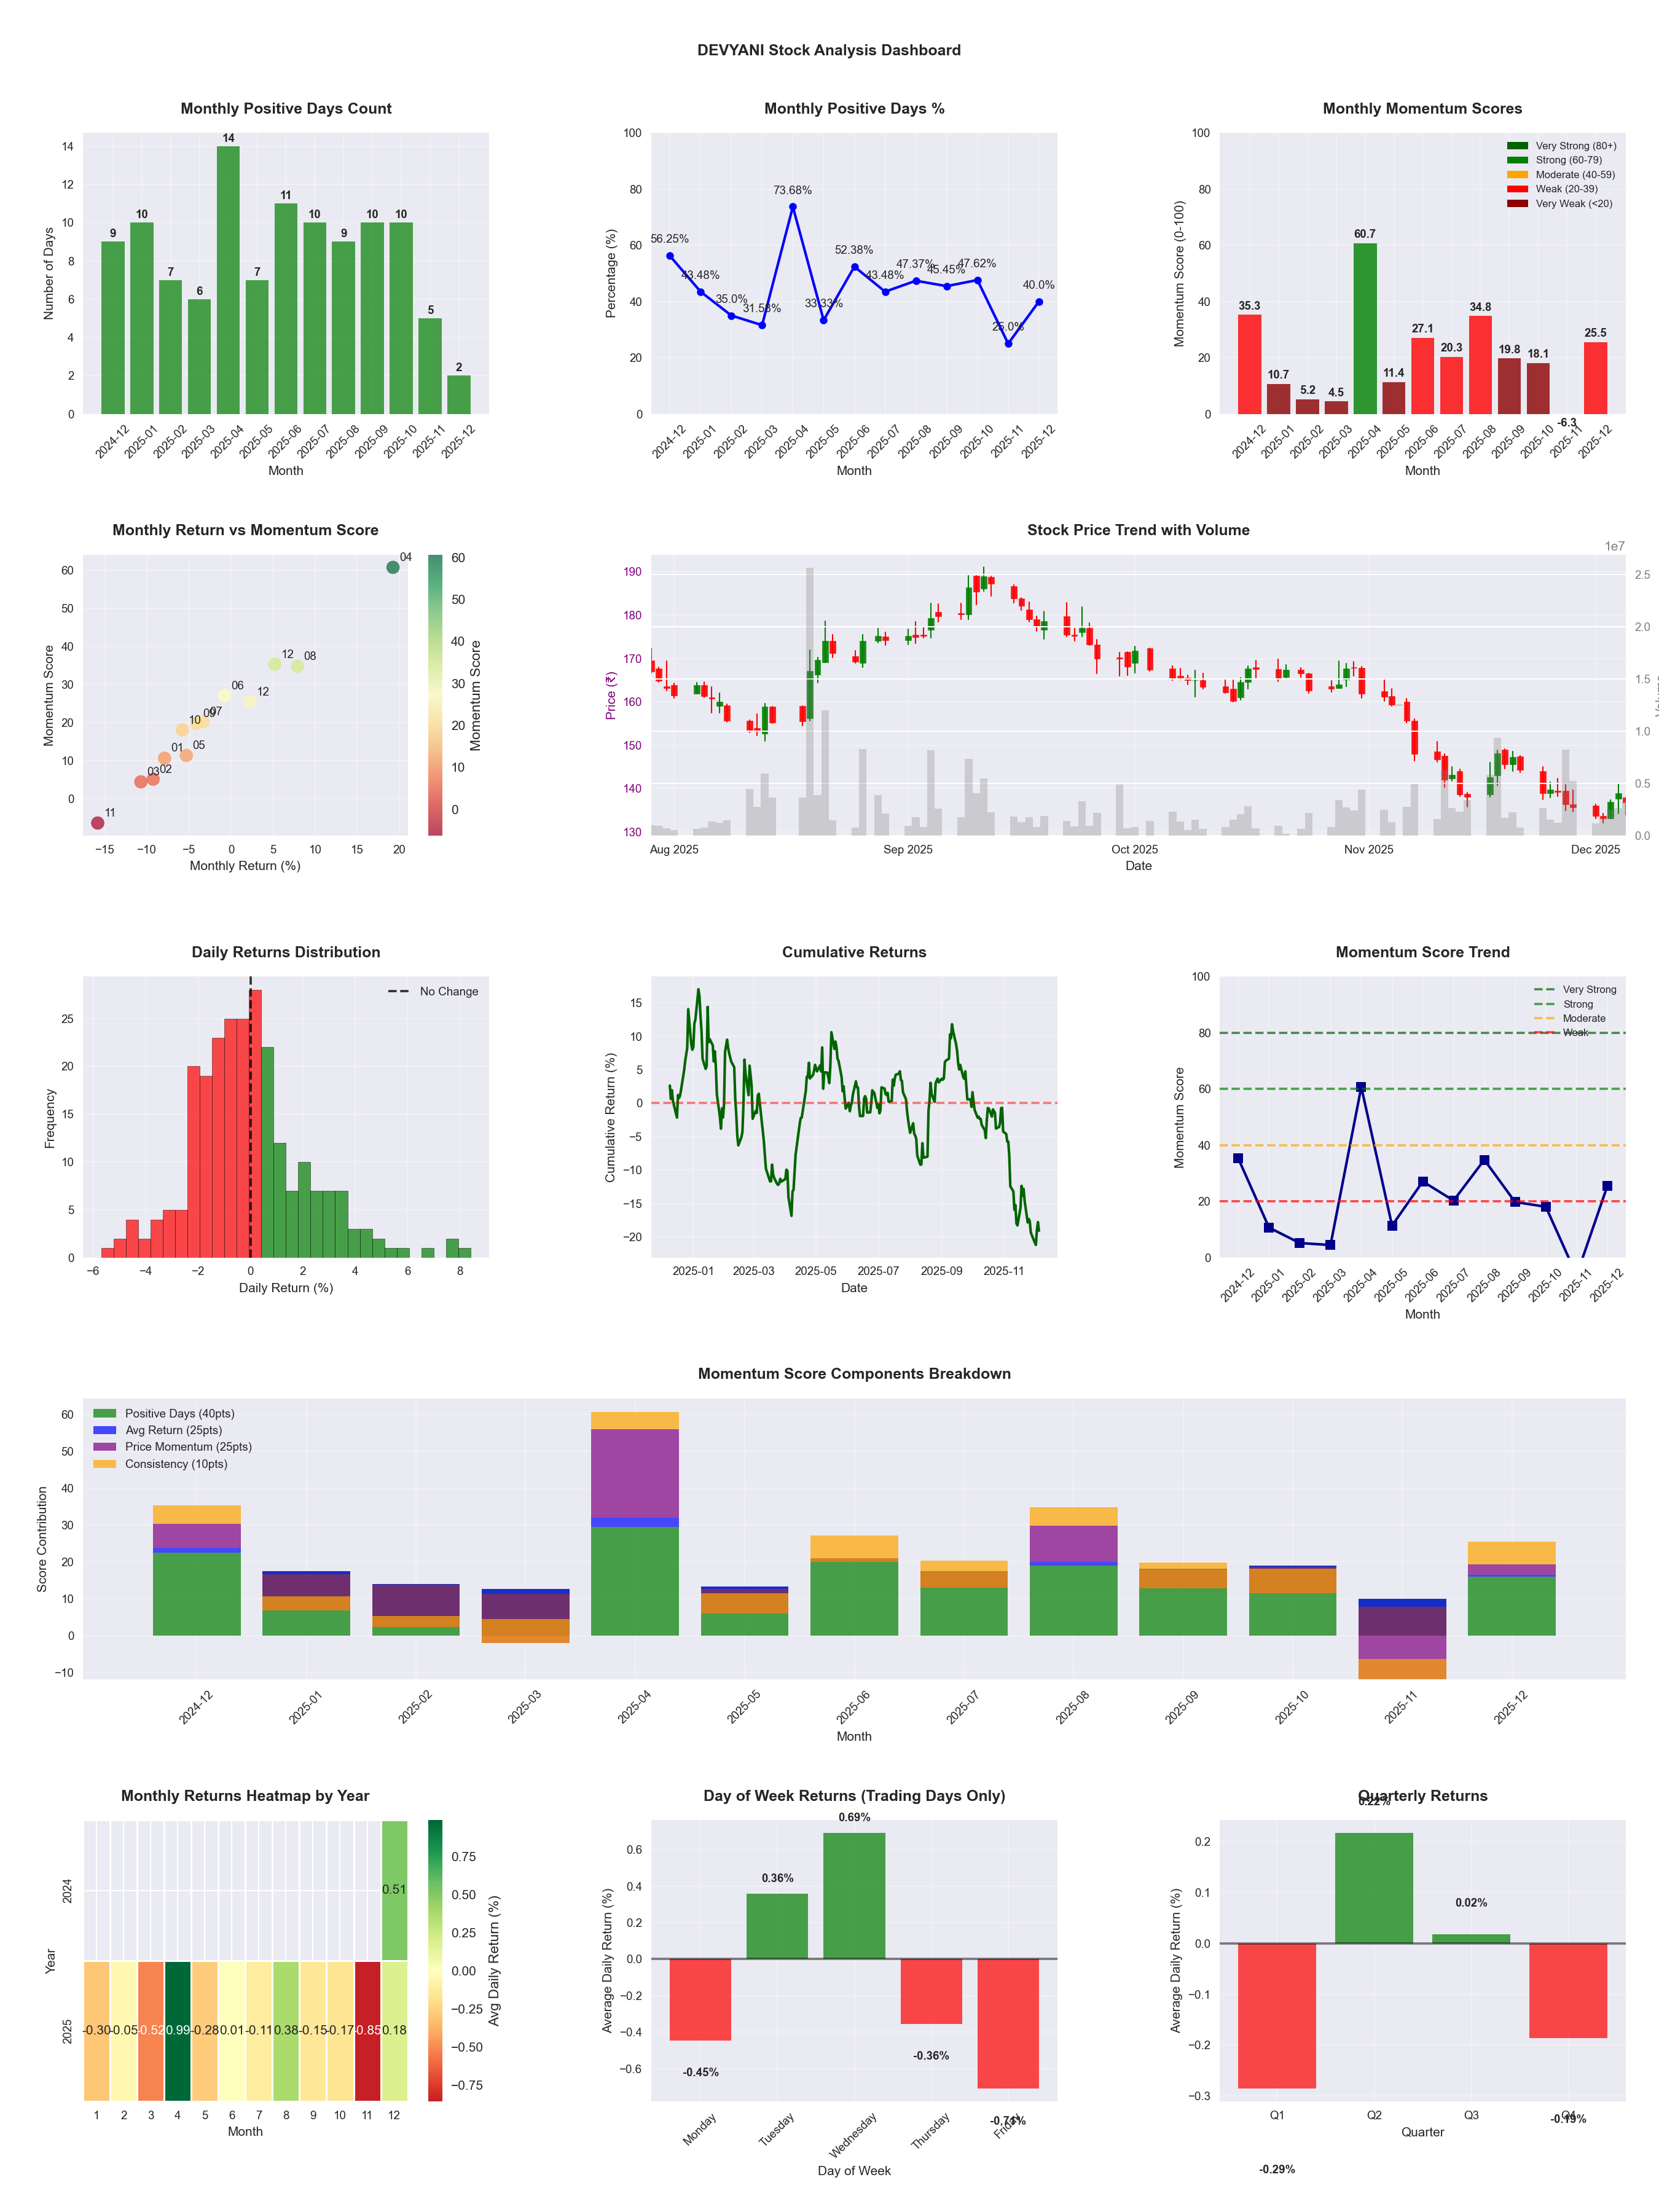
📈 DEVYANI
Date
📅 2026-04-11
Volatility
🟡 2.20%
Risk Profile
⚠️ suitable for aggressive investors
Win Rate
⚠️ 42.7%
Avg Daily Return
📉 -0.12%
Max Drawdown
📉 -49.93%
IBD RS Score
📊 4.5
Weak
Market Rank
#471
Best Month
🏆 2025-04
Best Months to Trade
📅 Apr, Feb, Dec
Best Days to Trade
📅 Wednesday, Tuesday
📊 Key Insights & Metrics
Symbol
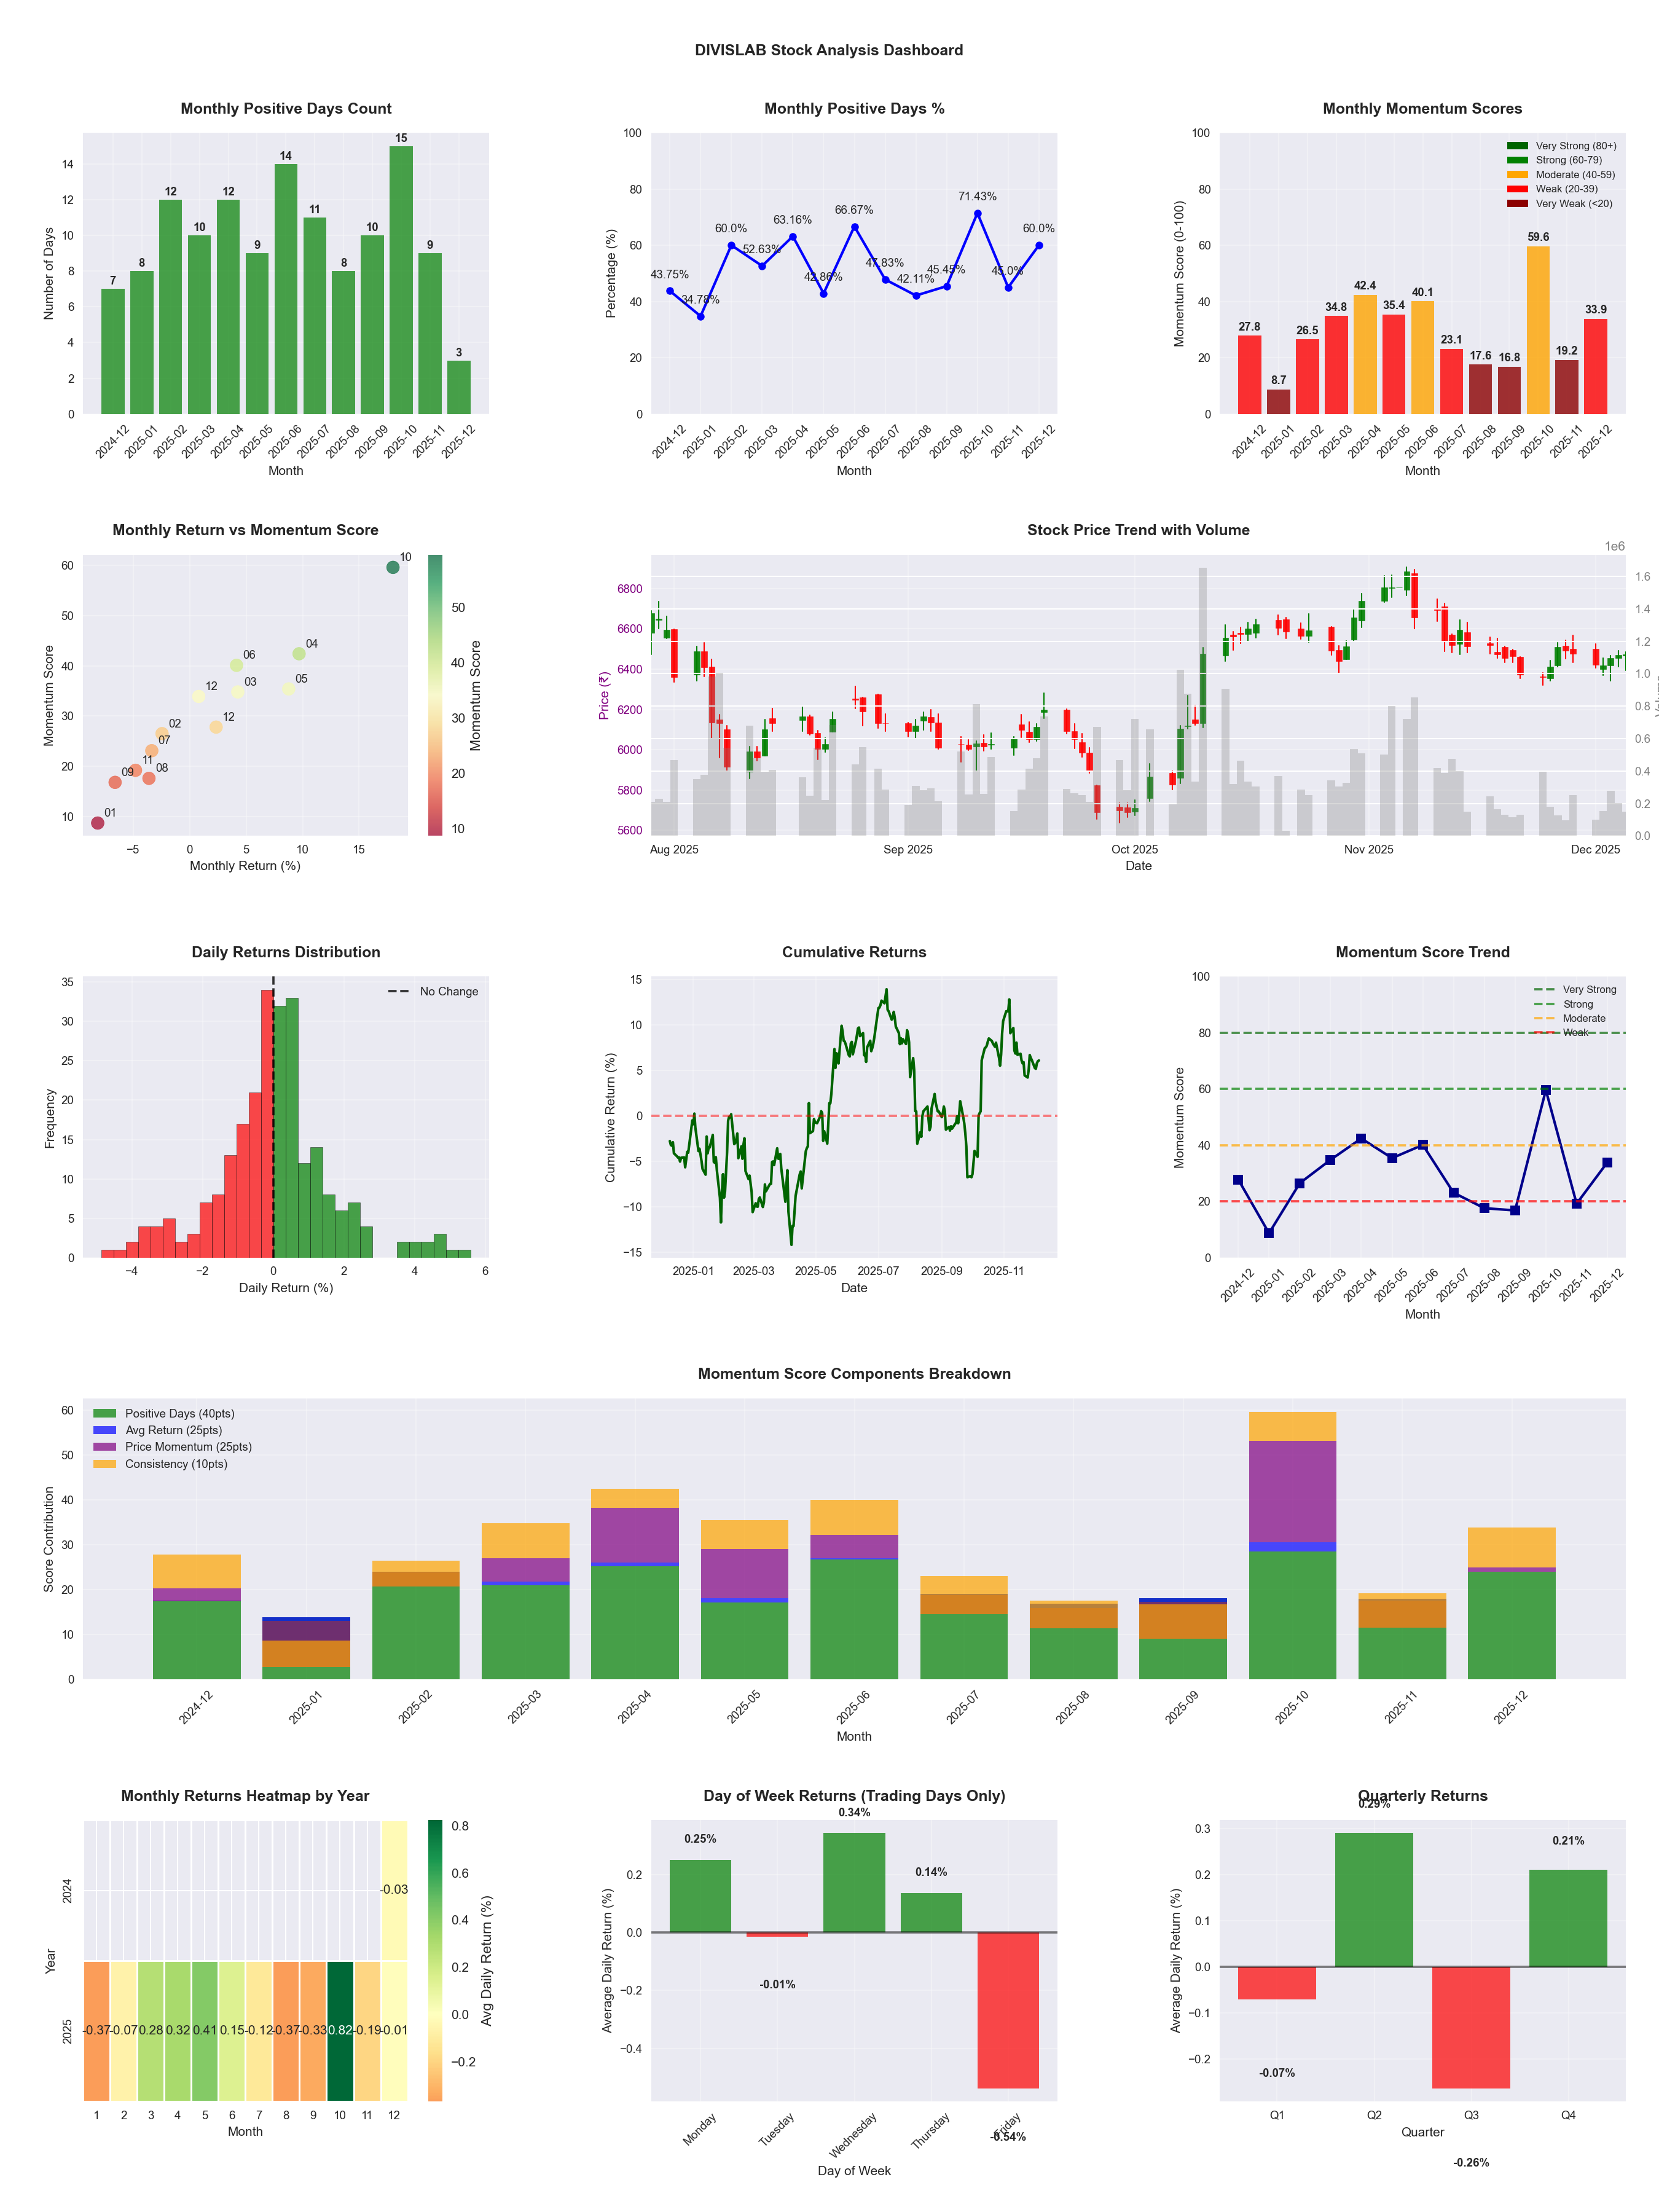
📈 DIVISLAB
Date
📅 2026-04-11
Volatility
🟡 1.51%
Win Rate
⚠️ 50.0%
Avg Daily Return
📈 +0.05%
Max Drawdown
📉 -18.16%
IBD RS Score
📊 52.9
Average
Market Rank
#232
Best Month
🏆 2025-10
Worst Month
📉 2026-03
Best Months to Trade
📅 Oct, Apr, May
Best Days to Trade
📅 Wednesday, Tuesday
📊 Key Insights & Metrics
Symbol
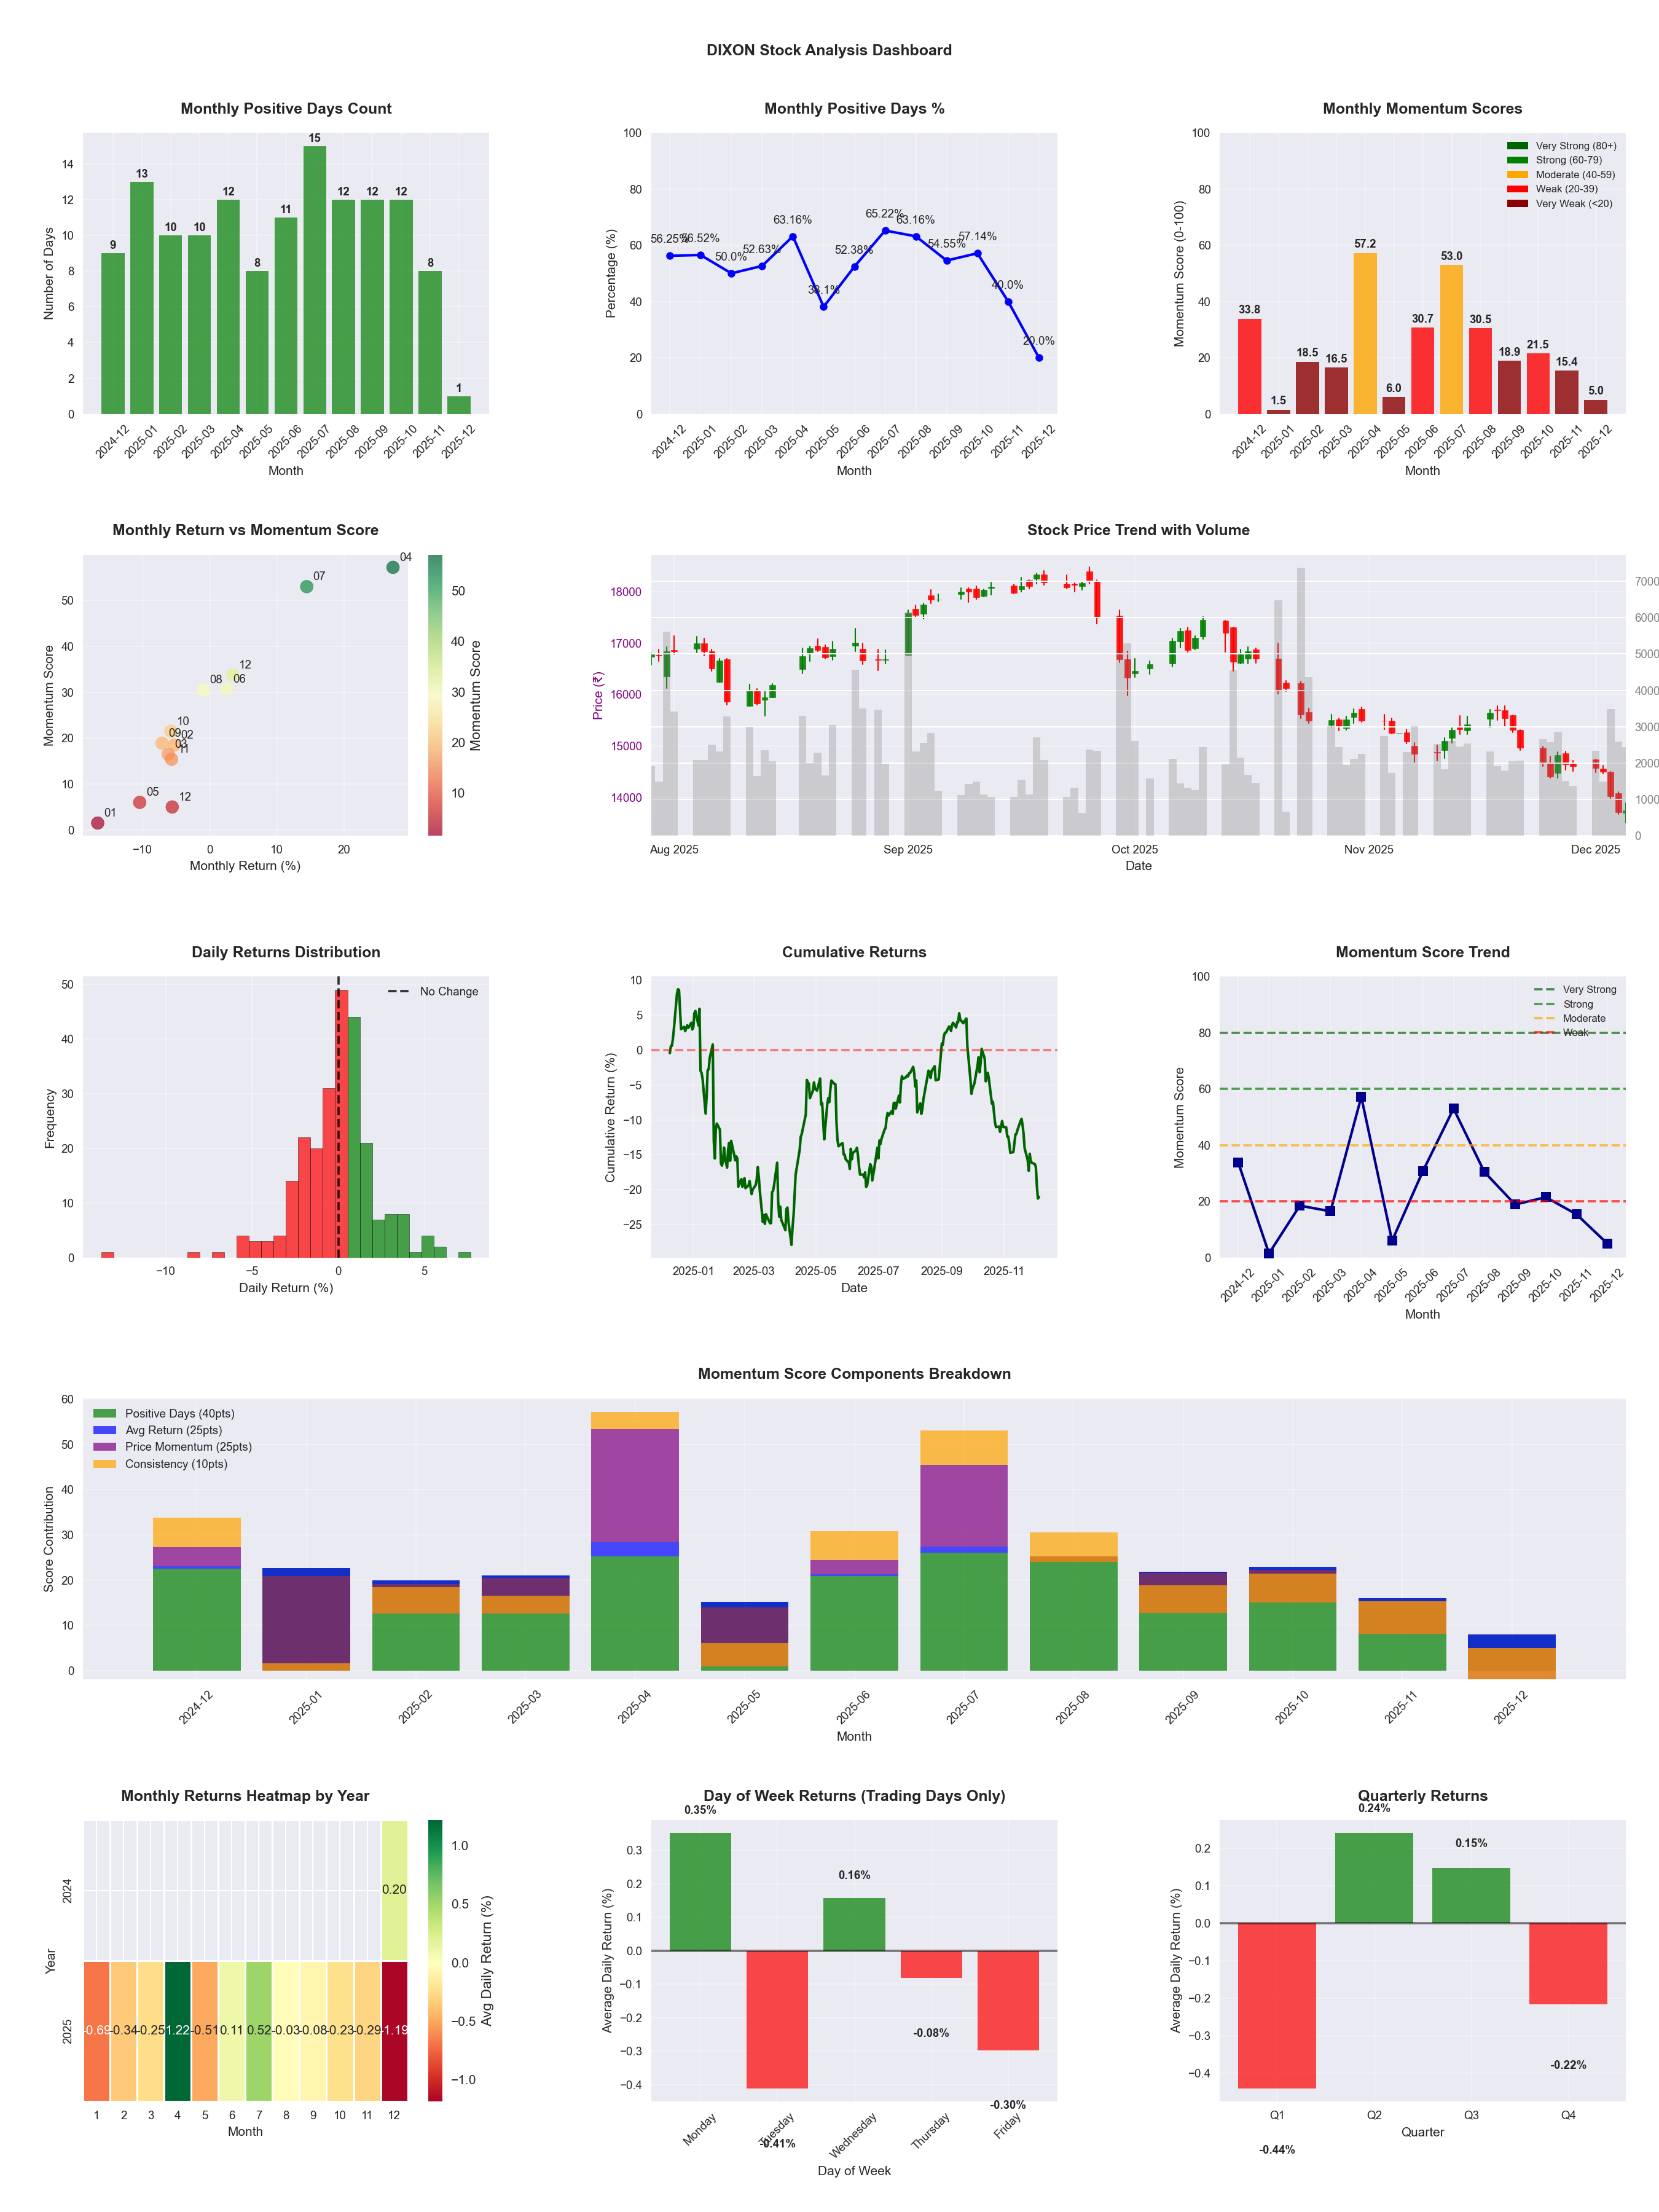
📈 DIXON
Date
📅 2026-04-11
Volatility
🟡 2.32%
Risk Profile
⚠️ suitable for aggressive investors
Win Rate
⚠️ 48.0%
Avg Daily Return
📉 -0.09%
Max Drawdown
📉 -47.23%
IBD RS Score
📊 8.5
Weak
Market Rank
#451
Best Month
🏆 2025-07
Best Months to Trade
📅 Apr, Jul, Jun
Best Days to Trade
📅 Wednesday, Monday
📊 Key Insights & Metrics
Symbol
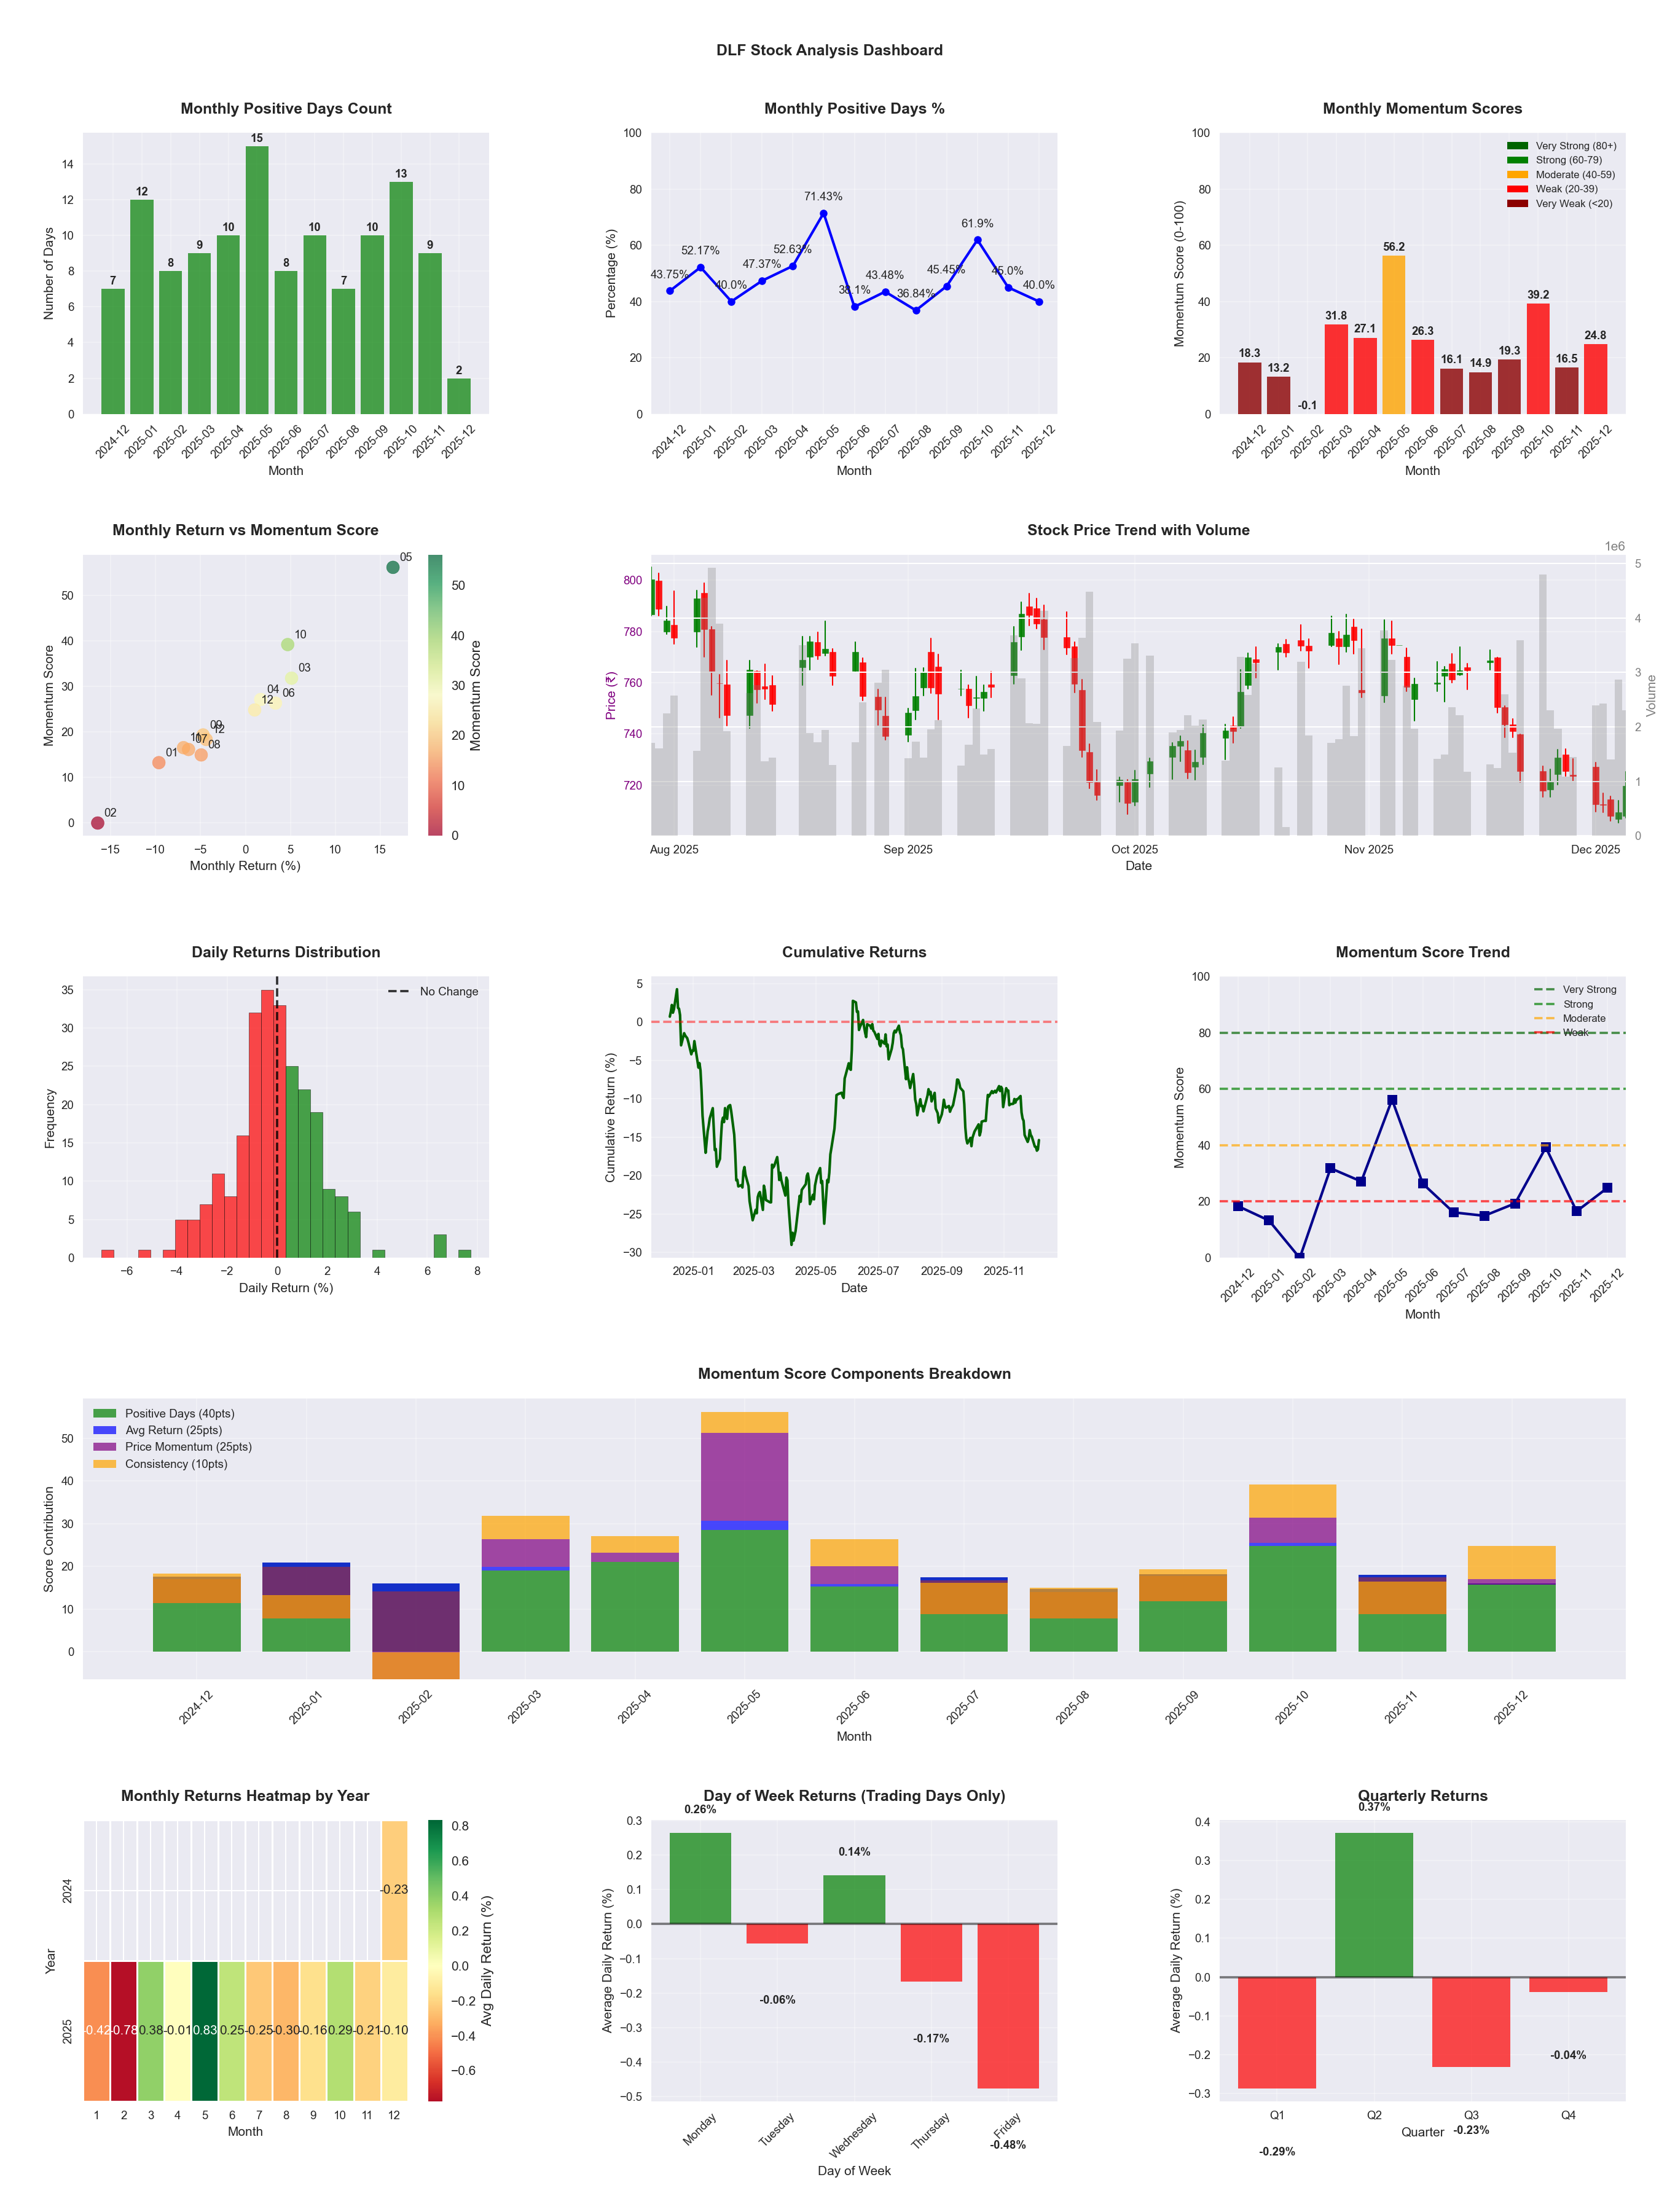
📈 DLF
Date
📅 2026-04-11
Volatility
🟡 1.86%
Win Rate
⚠️ 48.4%
Avg Daily Return
📉 -0.02%
Max Drawdown
📉 -42.32%
IBD RS Score
📊 14.2
Weak
Market Rank
#423
Best Month
🏆 2026-04
Best Months to Trade
📅 Apr, May, Oct
Best Days to Trade
📅 Monday, Wednesday
📊 Key Insights & Metrics
Symbol
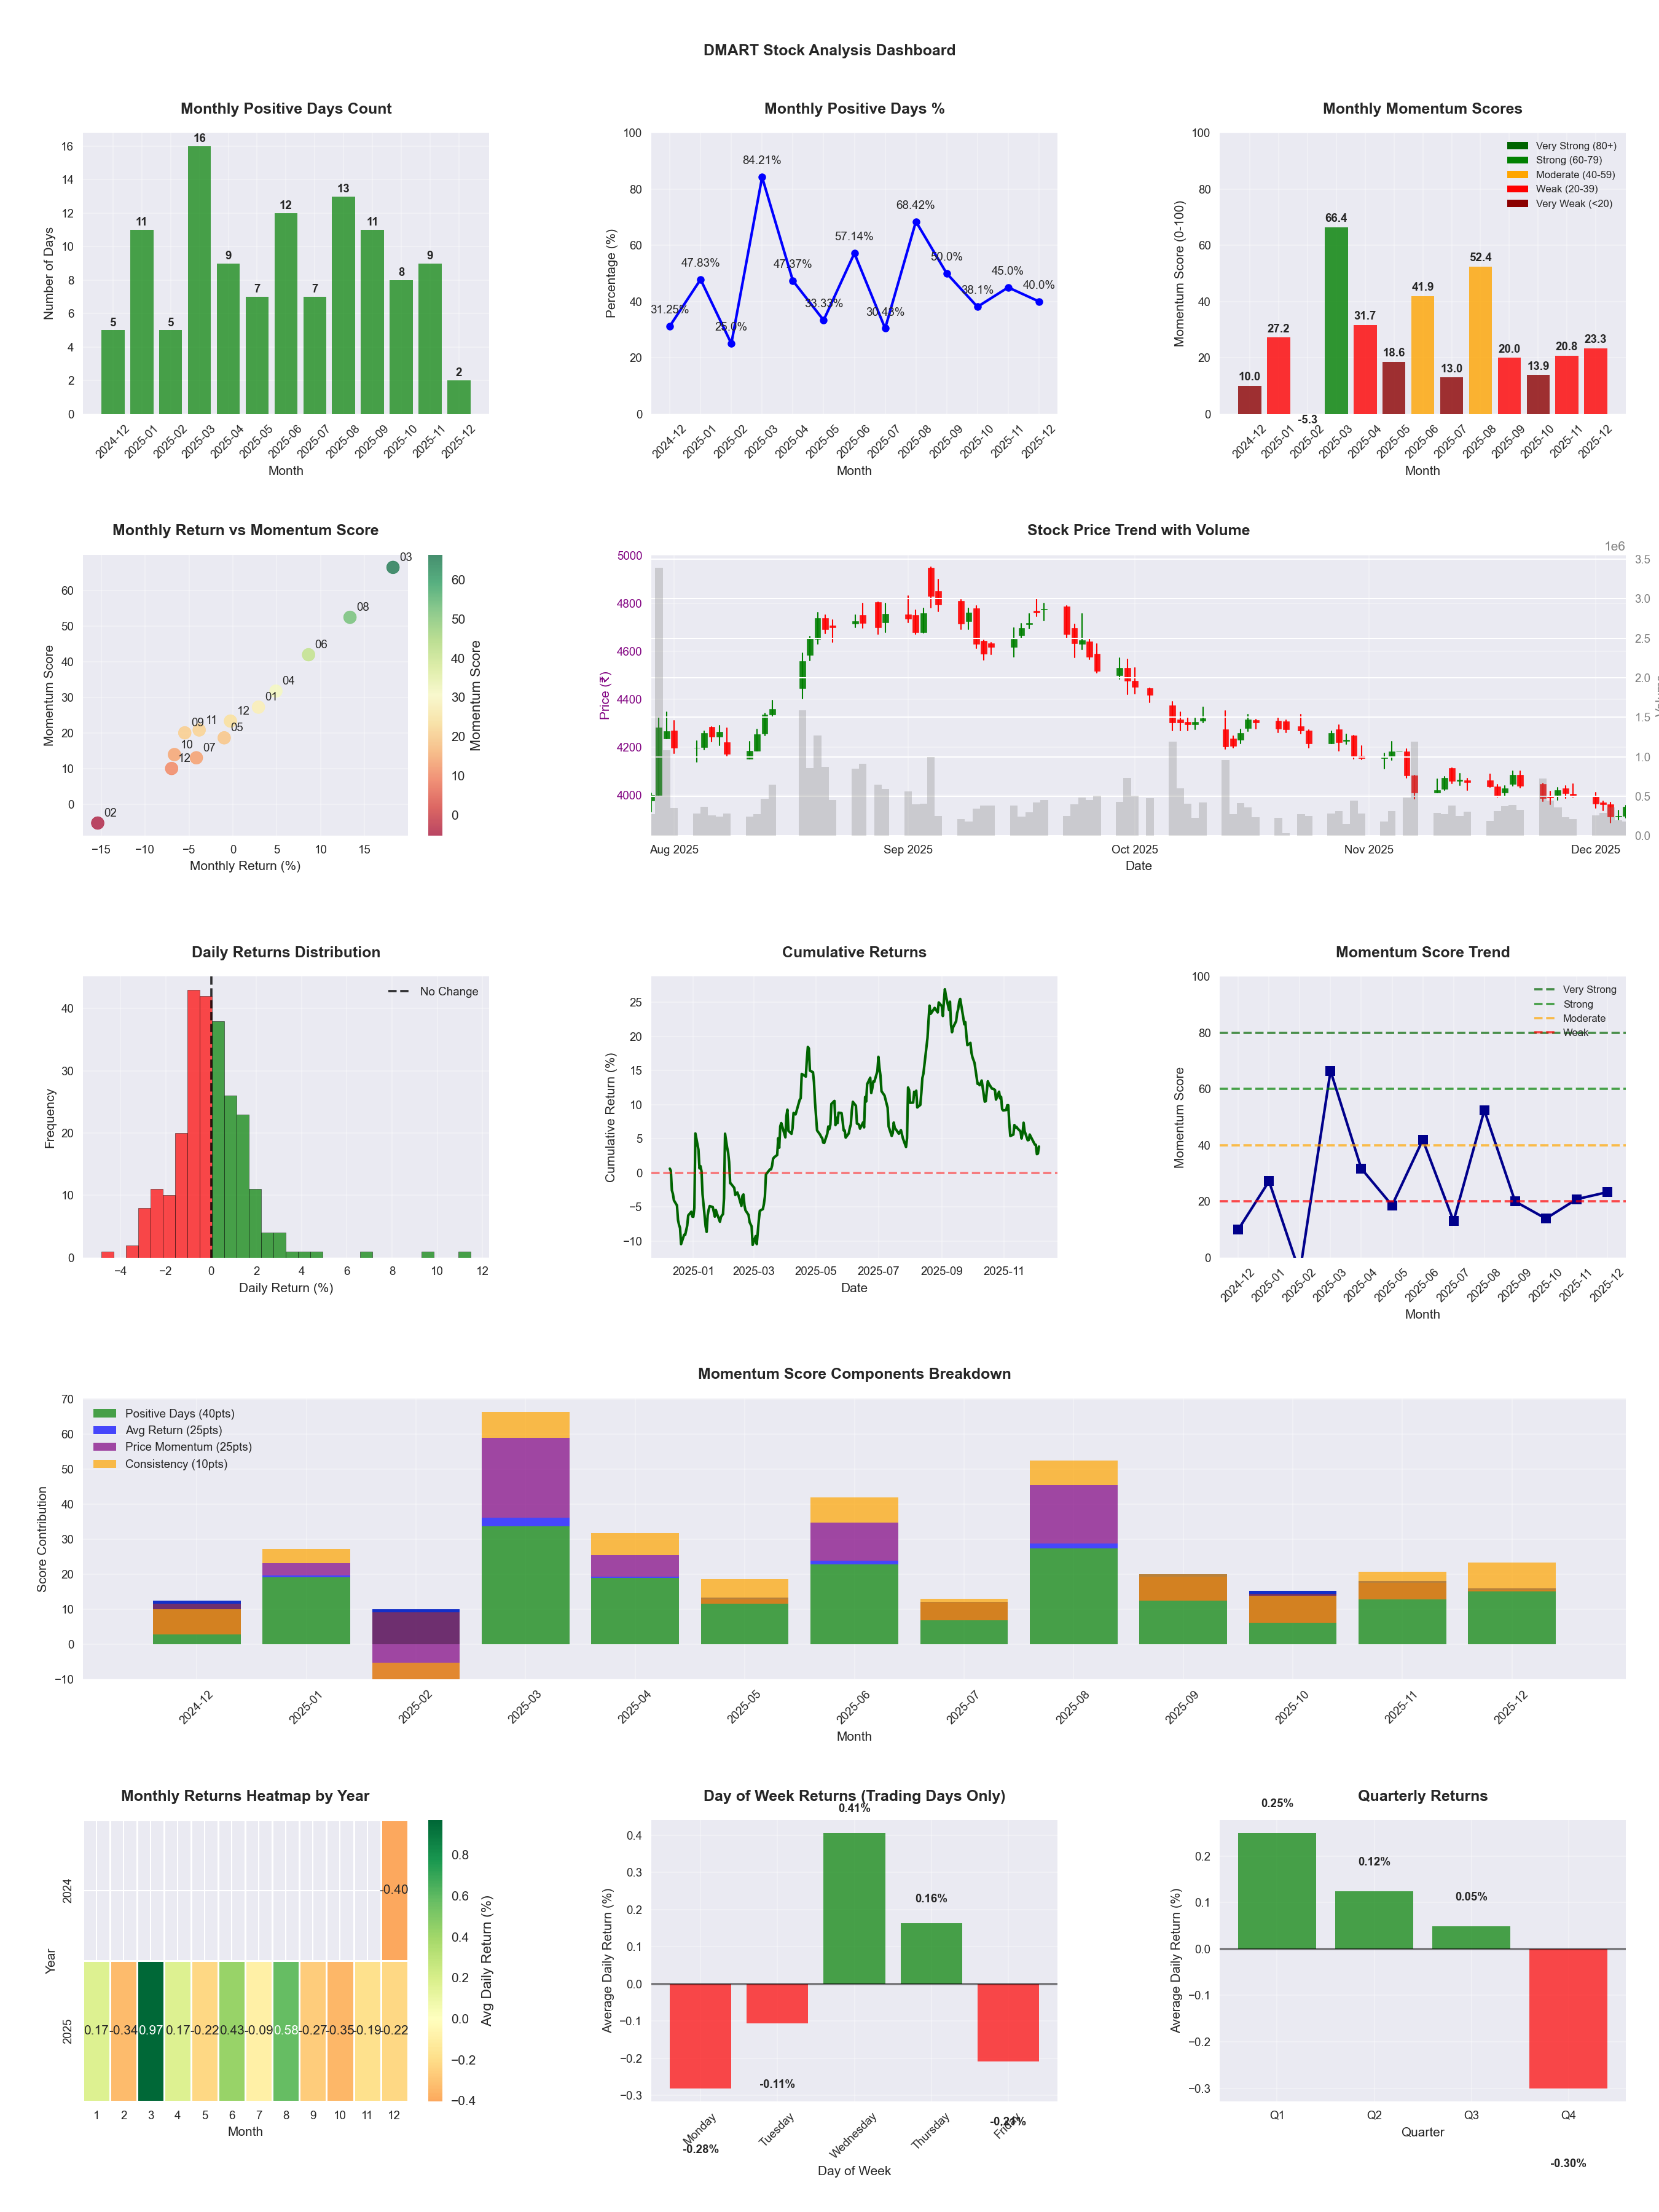
📈 DMART
Date
📅 2026-04-11
Volatility
🟡 1.57%
Win Rate
⚠️ 46.8%
Avg Daily Return
📈 +0.04%
Max Drawdown
📉 -24.50%
IBD RS Score
📊 76.3
Strong
Market Rank
#117
Best Month
🏆 2025-08
Worst Month
📉 2025-07
Best Months to Trade
📅 Apr, Aug, Jun
Best Days to Trade
📅 Wednesday, Tuesday
📊 Key Insights & Metrics
Symbol
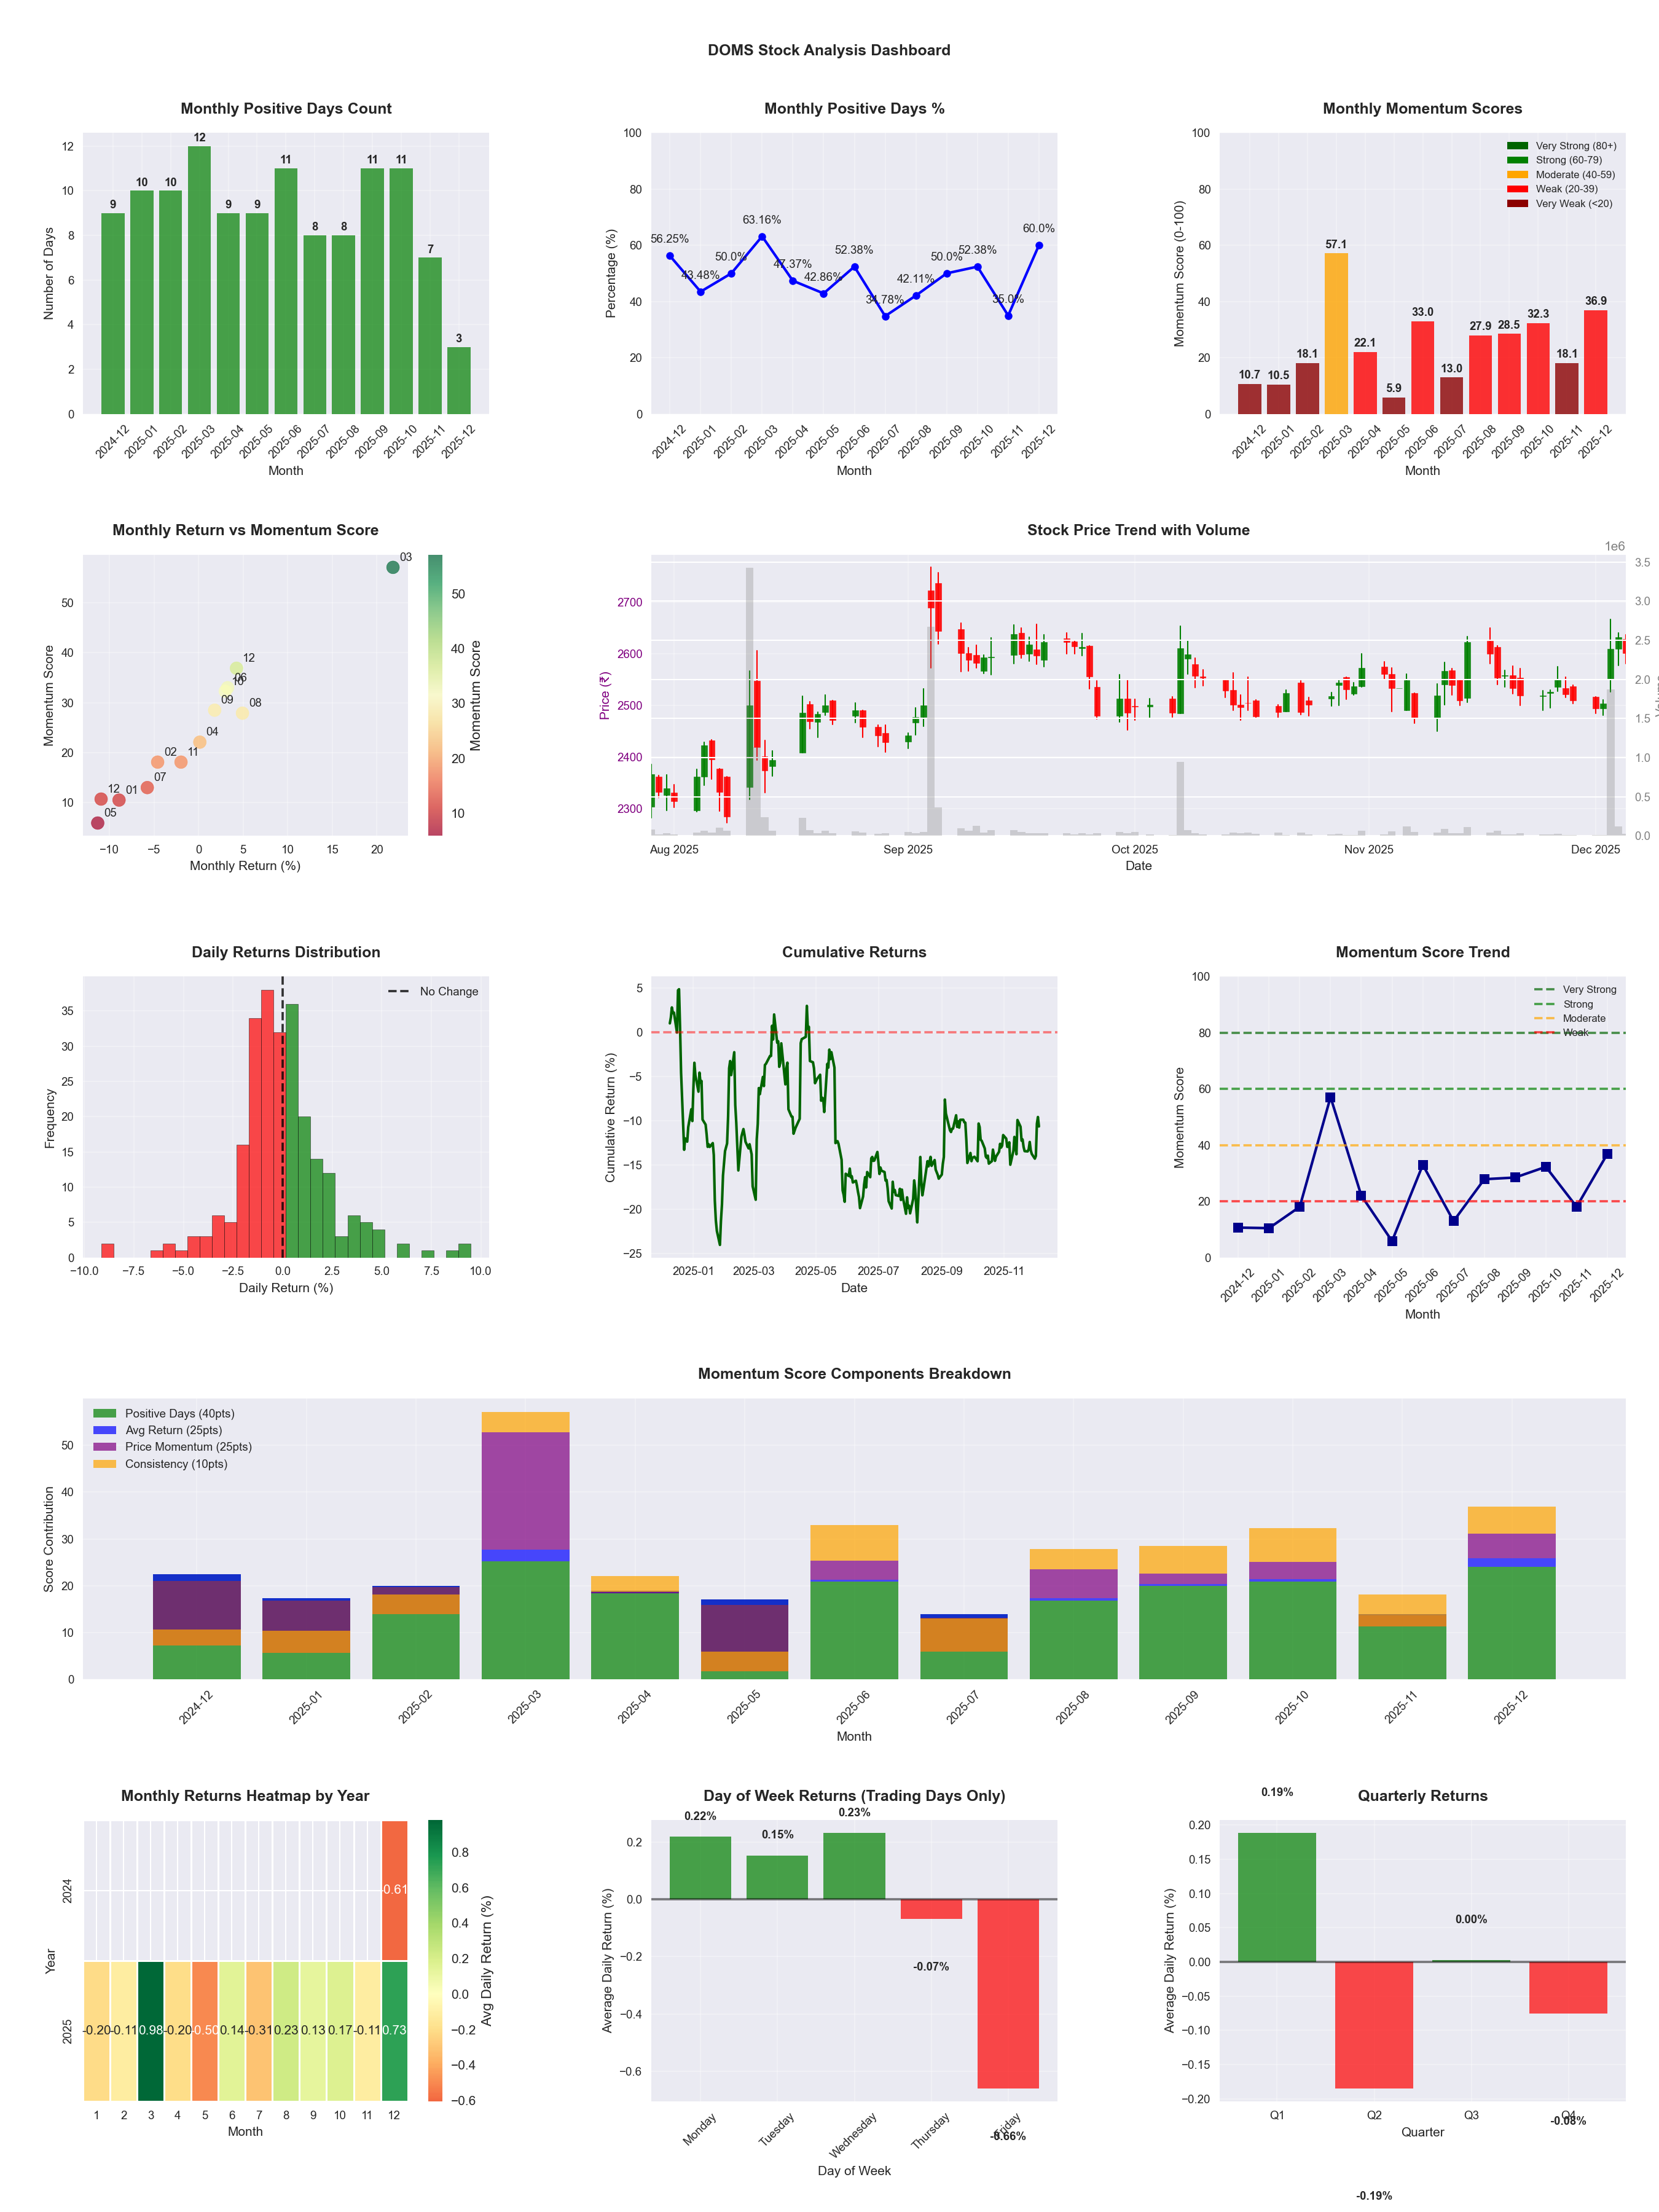
📈 DOMS
Date
📅 2026-04-11
Volatility
🟡 2.07%
Risk Profile
⚠️ suitable for aggressive investors
Win Rate
⚠️ 45.9%
Avg Daily Return
📉 -0.01%
Max Drawdown
📉 -31.40%
IBD RS Score
📊 49.7
Weak
Market Rank
#248
Best Month
🏆 2026-04
Worst Month
📉 2025-05
Best Months to Trade
📅 Apr, Aug, Dec
Best Days to Trade
📅 Monday, Wednesday
📊 Key Insights & Metrics
Symbol
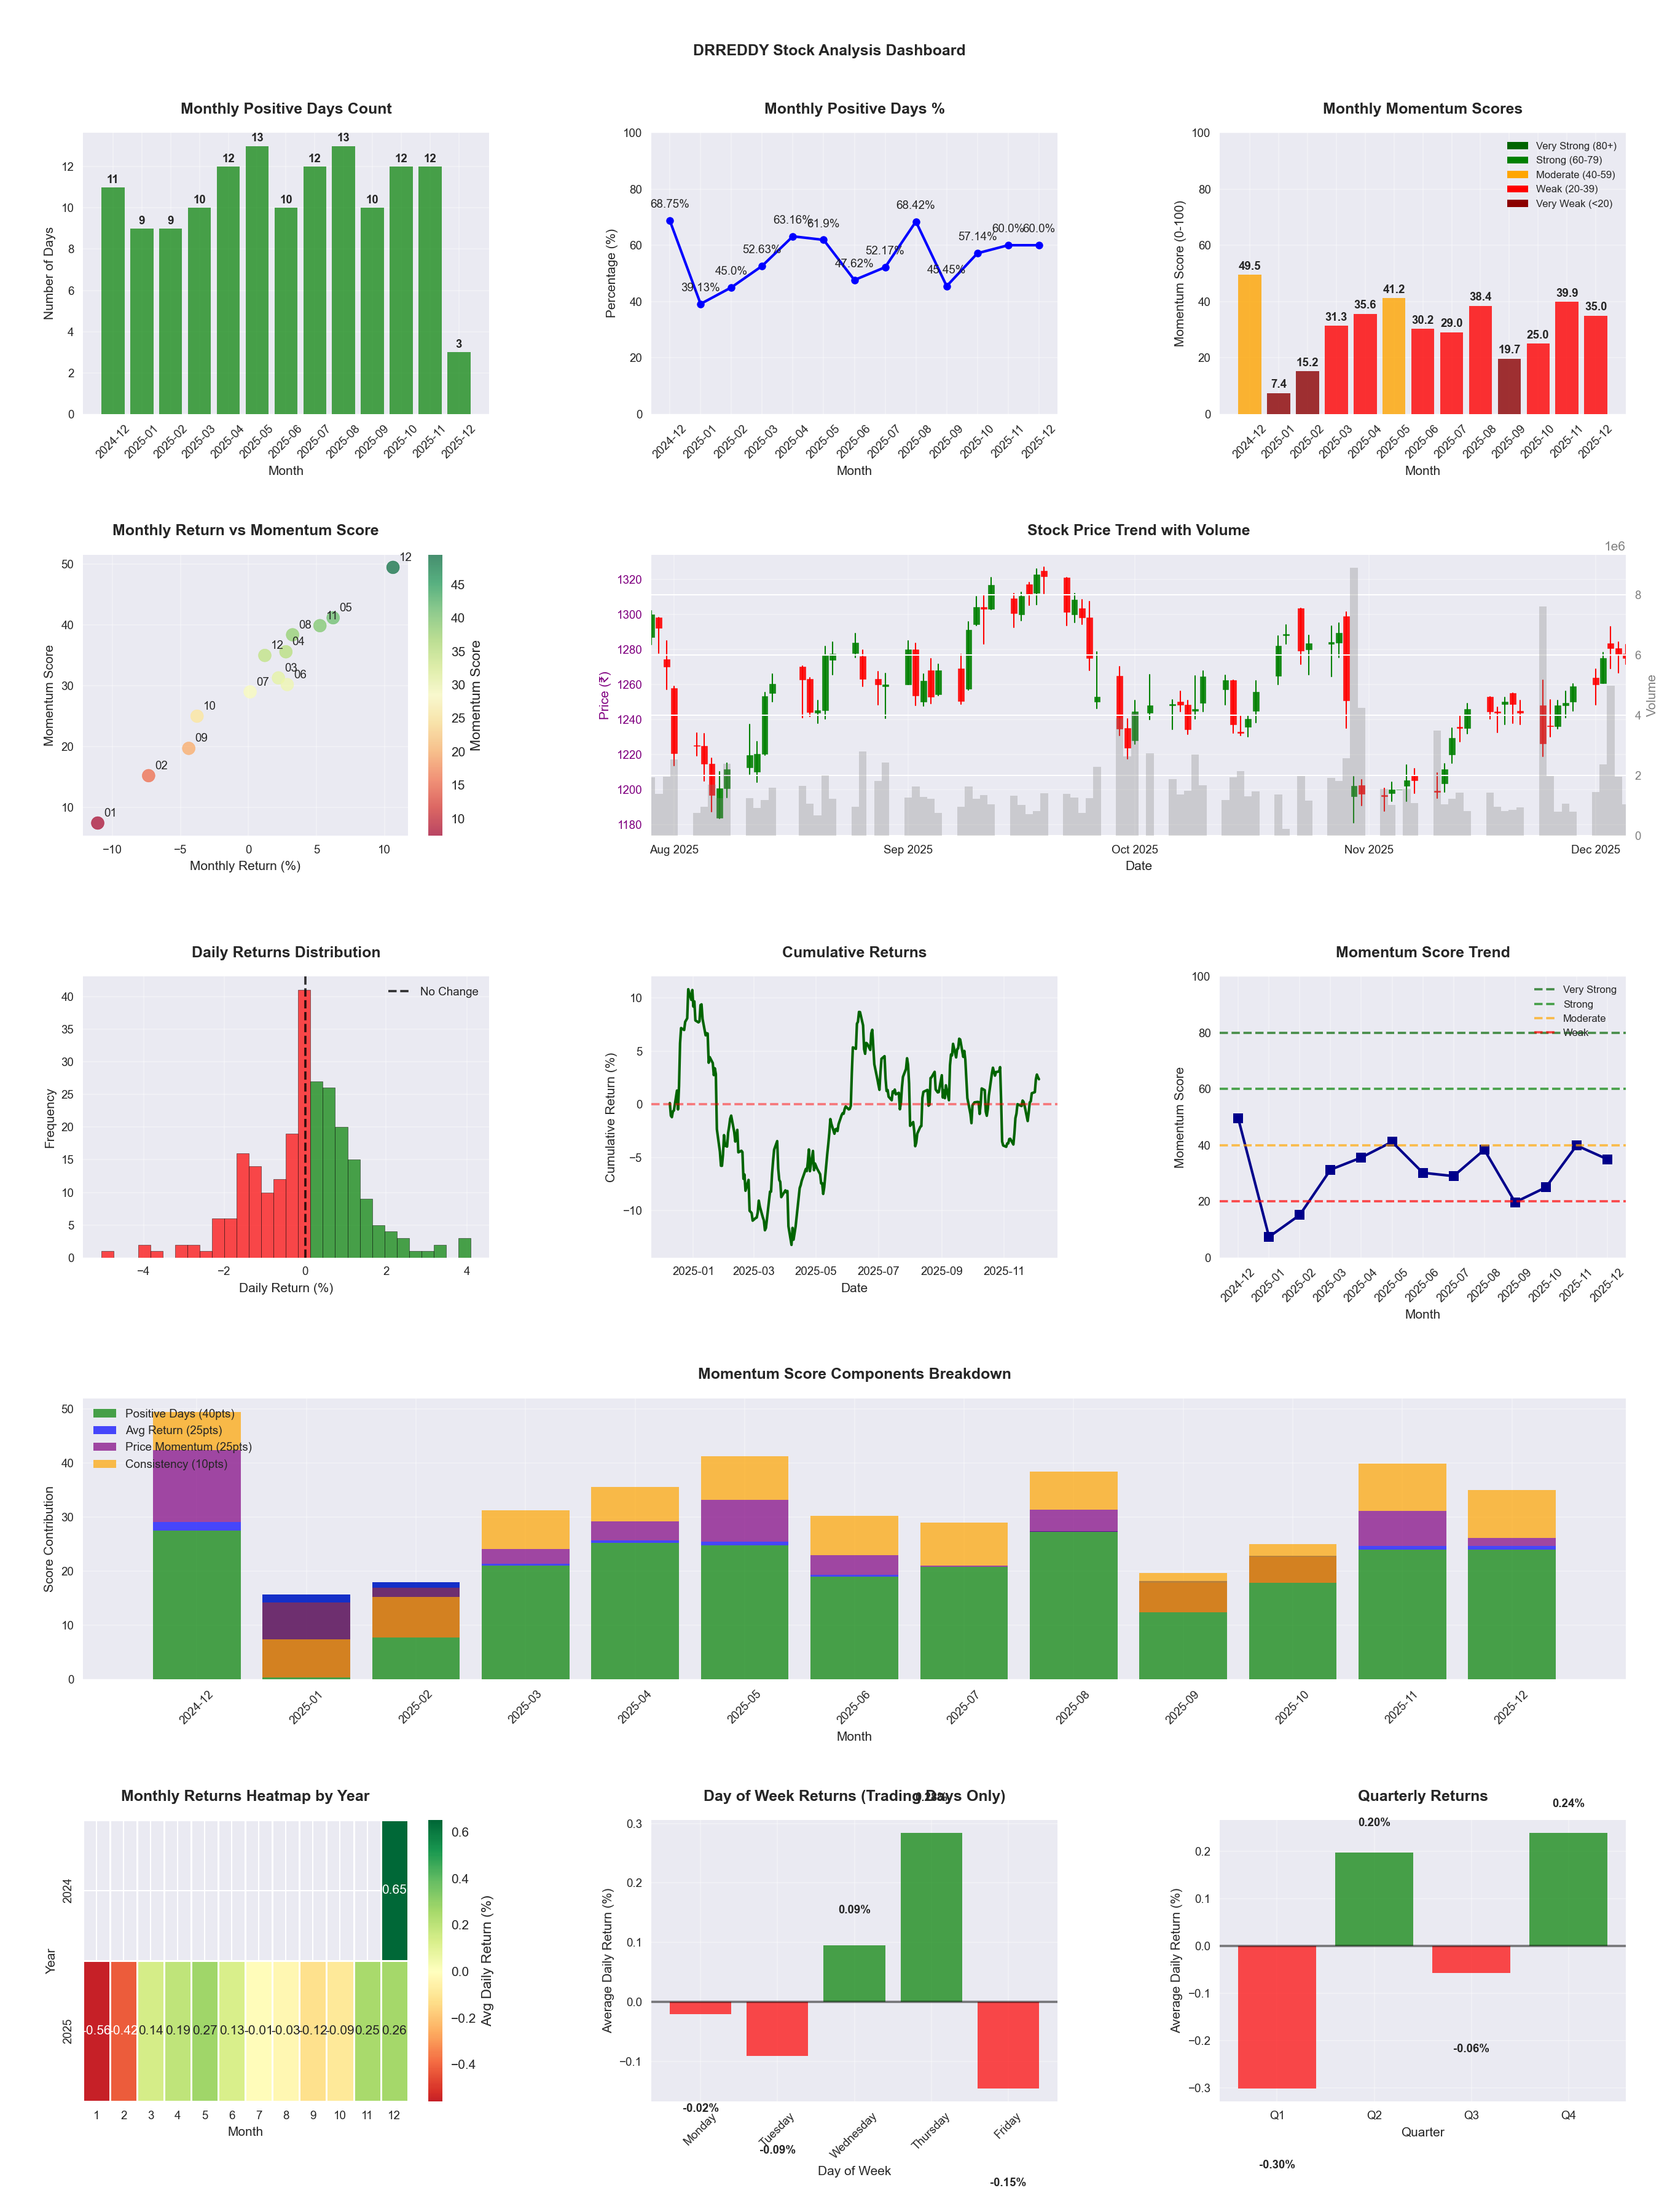
📈 DRREDDY
Date
📅 2026-04-11
Volatility
🟢 1.34%
Win Rate
⚠️ 54.9%
Avg Daily Return
📈 +0.05%
Max Drawdown
📉 -14.54%
IBD RS Score
📊 64.9
Average
Market Rank
#173
Best Month
🏆 2026-02
Worst Month
📉 2026-01
Best Months to Trade
📅 Feb, Apr, May
Best Days to Trade
📅 Thursday, Tuesday
📊 Key Insights & Metrics
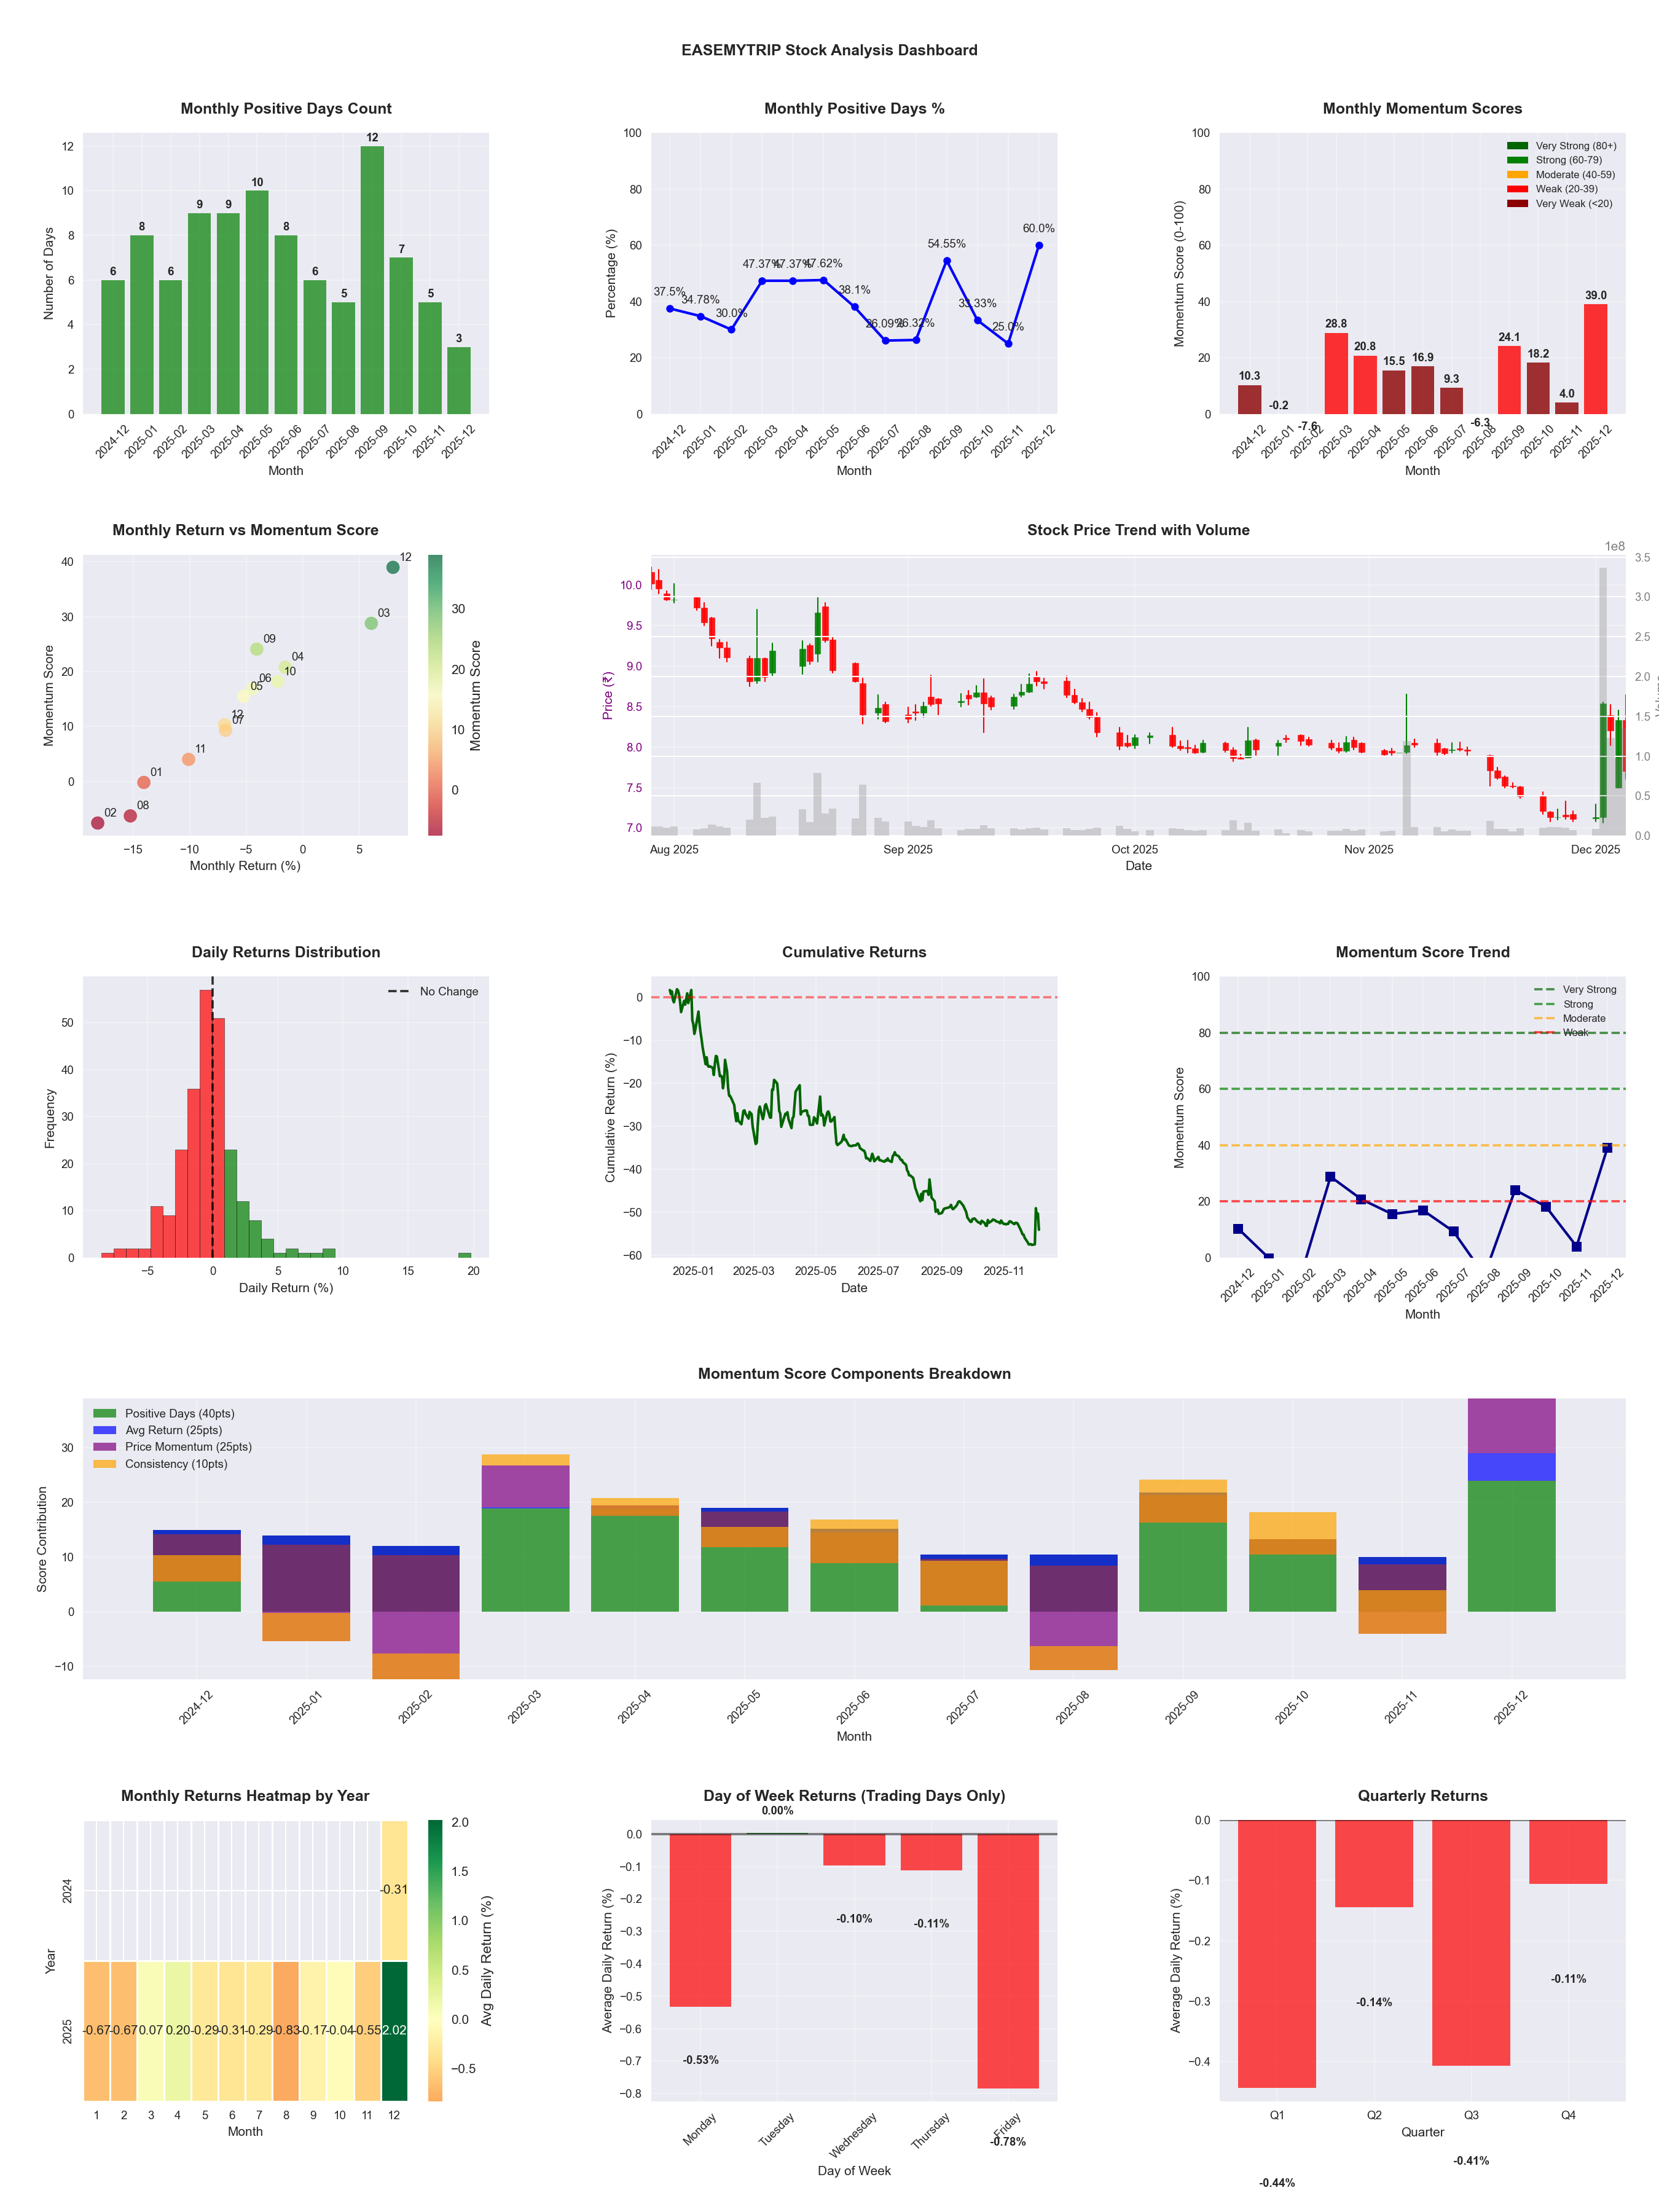
Symbol
📈 EASEMYTRIP
Date
📅 2026-03-21
Volatility
🔴 3.05%
Risk Profile
⚠️ suitable for aggressive investors
Win Rate
❌ 36.0%
Avg Daily Return
📉 -0.23%
Max Drawdown
📉 -53.58%
Best Month
🏆 2026-02
Best Months to Trade
📅 Feb, Dec, Apr
Best Days to Trade
📅 Tuesday, Monday
📊 Key Insights & Metrics
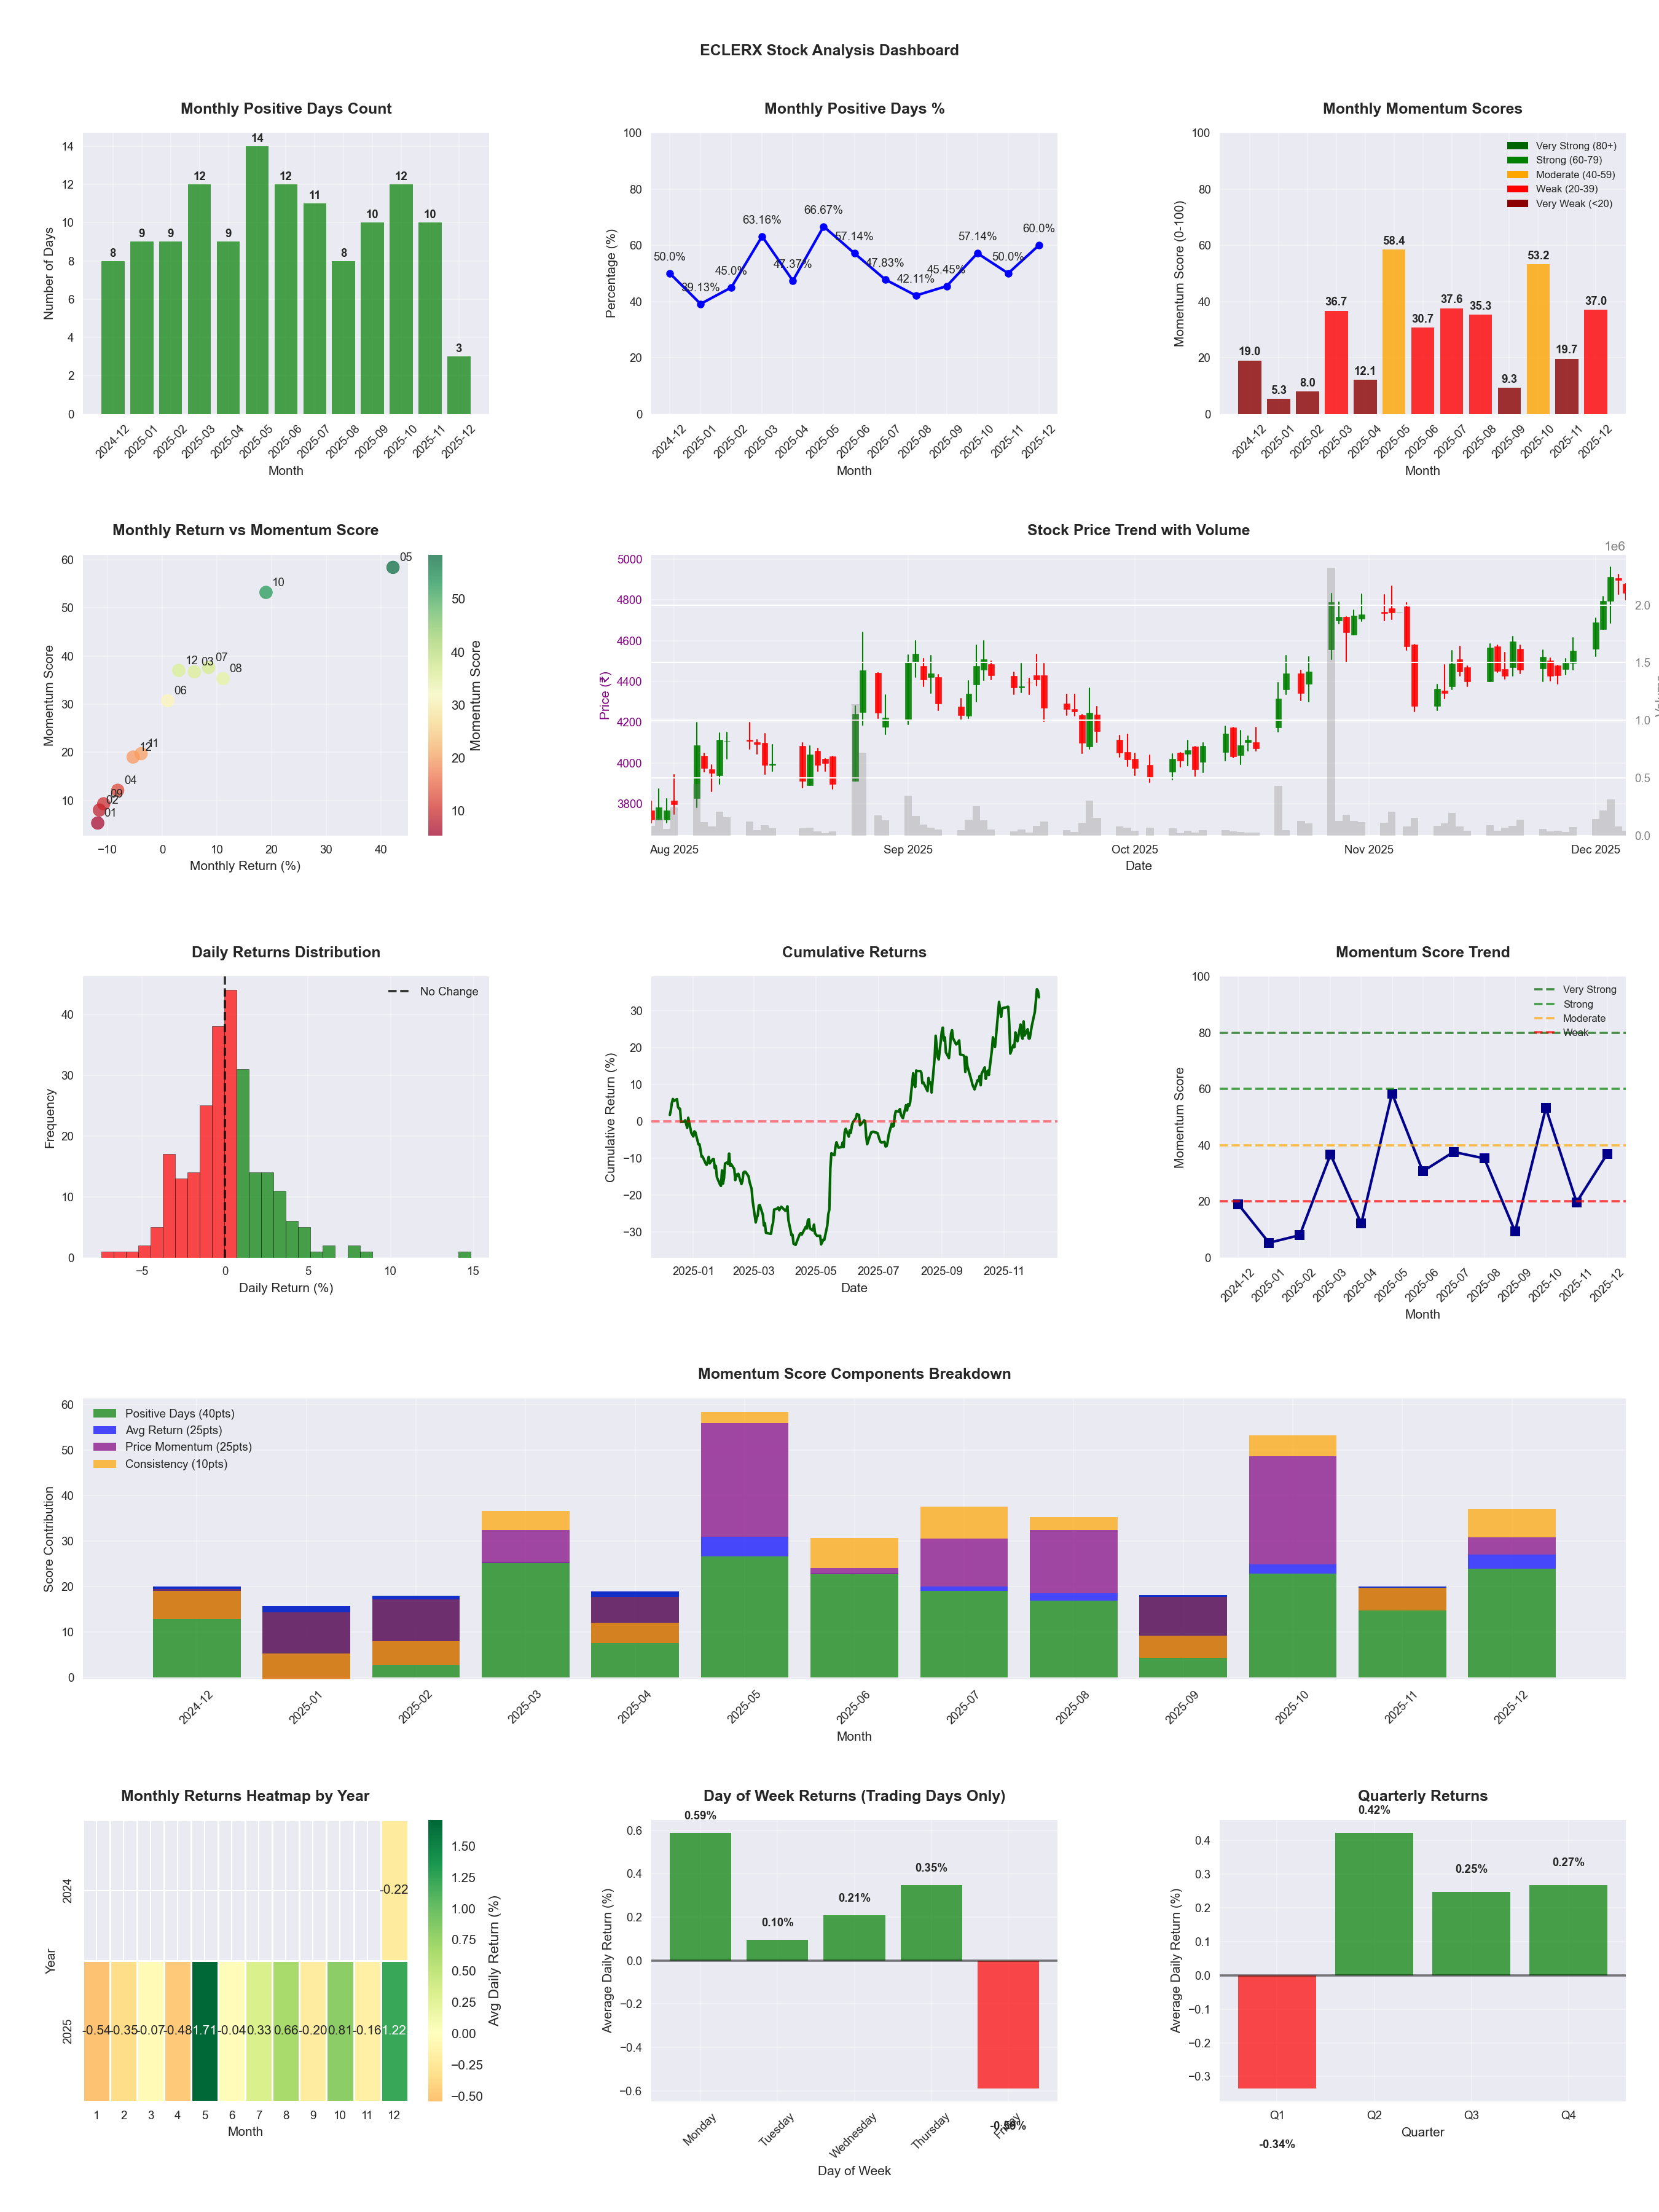
Symbol
📈 ECLERX
Date
📅 2026-04-11
Volatility
🟡 2.79%
Risk Profile
⚠️ suitable for aggressive investors
Win Rate
⚠️ 48.8%
Avg Daily Return
📈 +0.13%
Max Drawdown
📉 -43.92%
IBD RS Score
📊 16.8
Weak
Market Rank
#410
Best Month
🏆 2025-05
Best Months to Trade
📅 May, Oct, Apr
Best Days to Trade
📅 Monday, Thursday
📊 Key Insights & Metrics
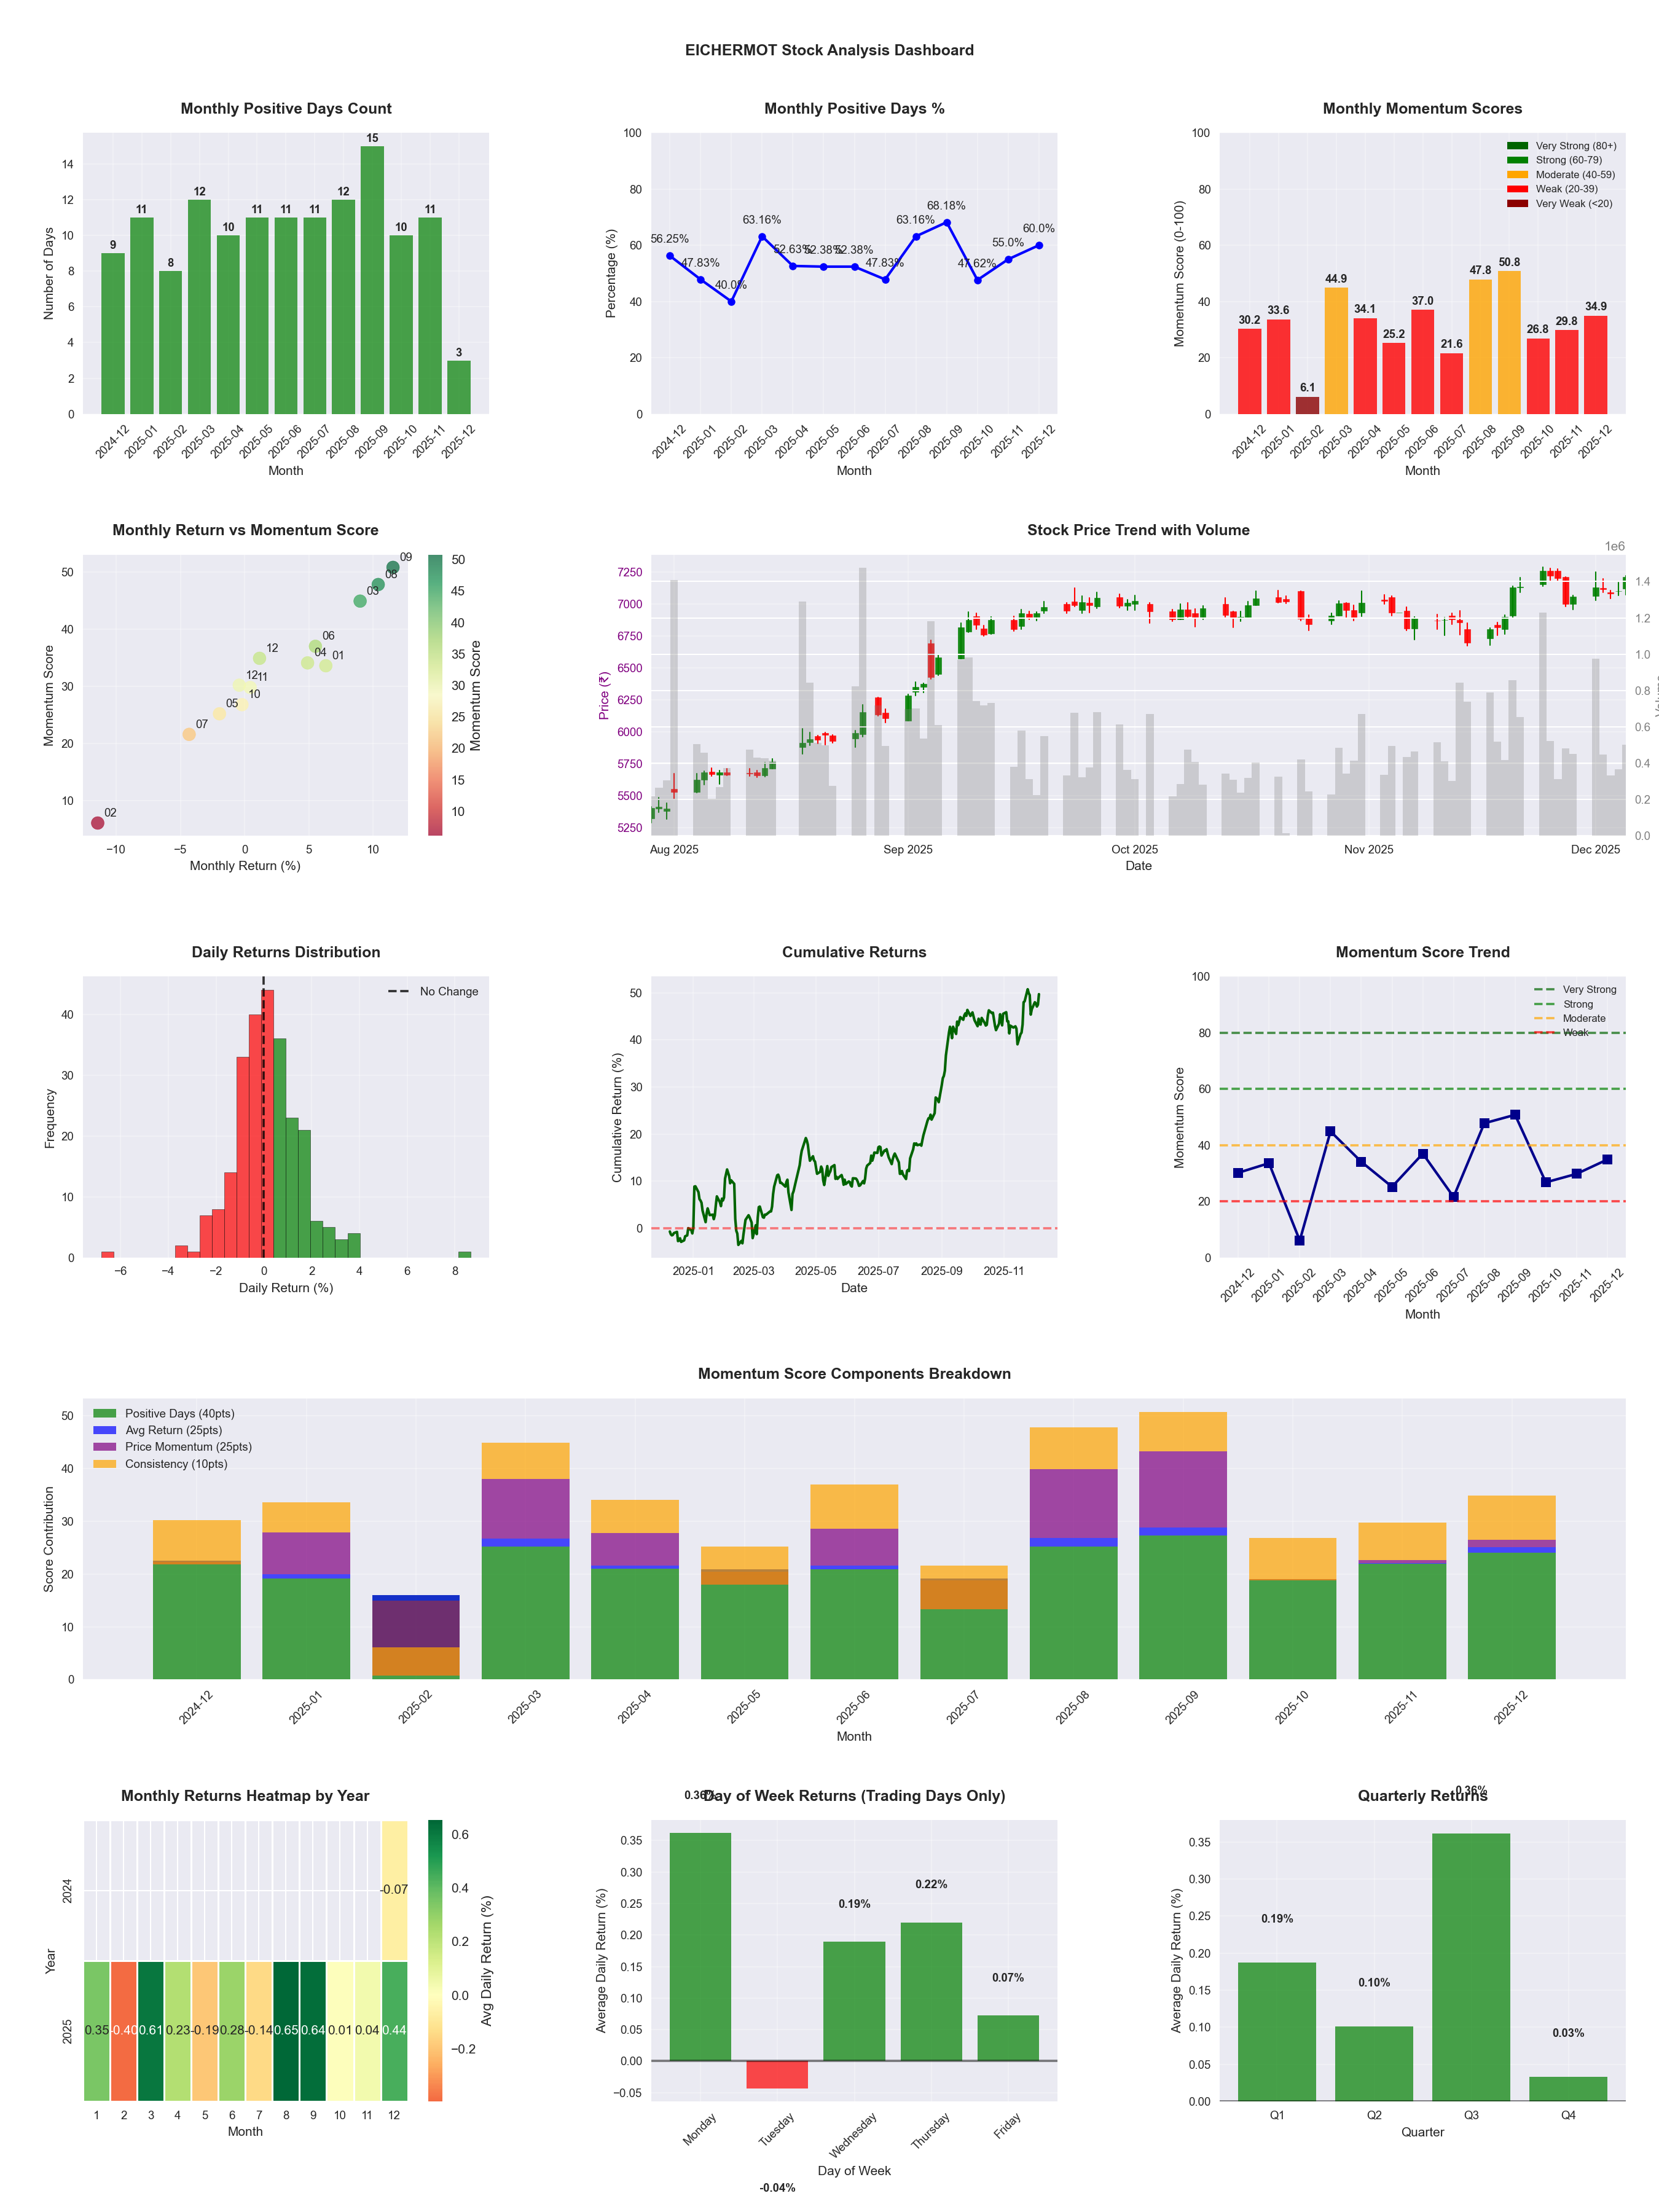
Symbol
📈 EICHERMOT
Date
📅 2026-04-11
Volatility
🟡 1.57%
Win Rate
⚠️ 52.9%
Avg Daily Return
📈 +0.15%
Max Drawdown
📉 -19.58%
IBD RS Score
📊 83.2
Strong
Market Rank
#83
Best Month
🏆 2025-09
Best Months to Trade
📅 Apr, Aug, Sep
Best Days to Trade
📅 Wednesday, Tuesday
📊 Key Insights & Metrics
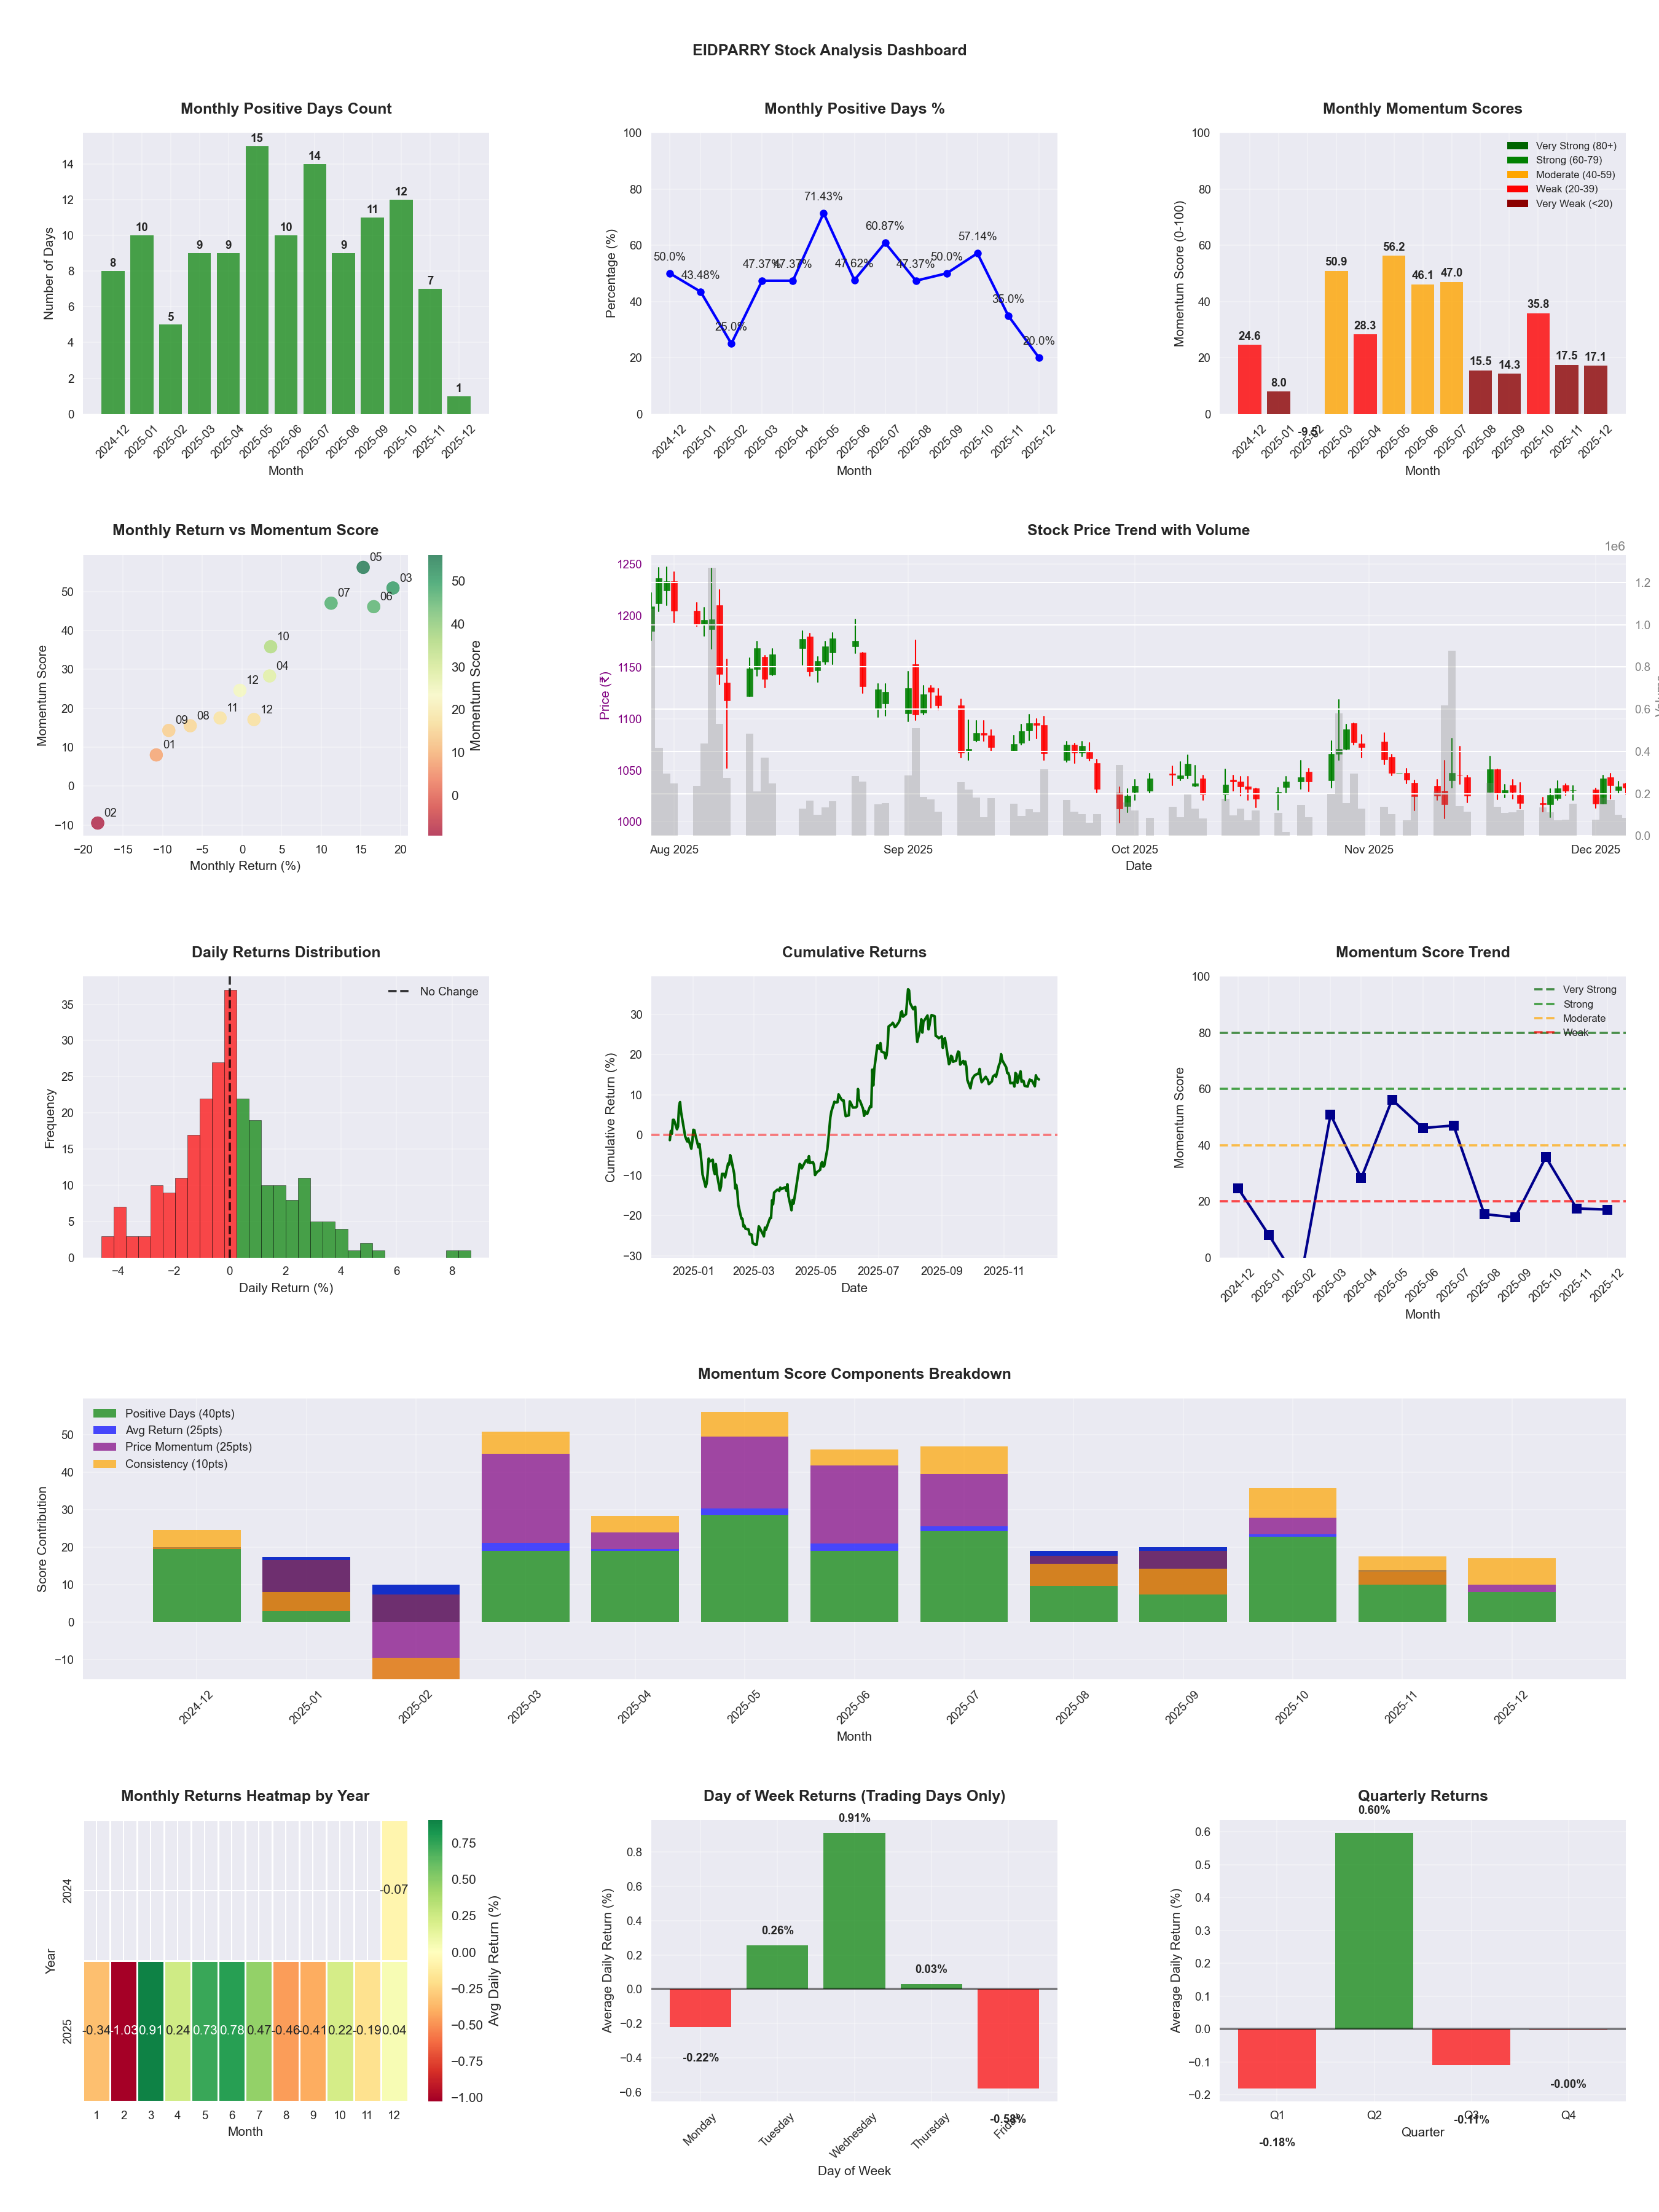
Symbol
📈 EIDPARRY
Date
📅 2026-04-11
Volatility
🟡 1.90%
Win Rate
⚠️ 48.4%
Avg Daily Return
📈 +0.05%
Max Drawdown
📉 -38.05%
IBD RS Score
📊 33.5
Weak
Market Rank
#328
Best Month
🏆 2025-05
Worst Month
📉 2026-03
Best Months to Trade
📅 Apr, Jun, May
Best Days to Trade
📅 Wednesday, Tuesday
📊 Key Insights & Metrics
Symbol
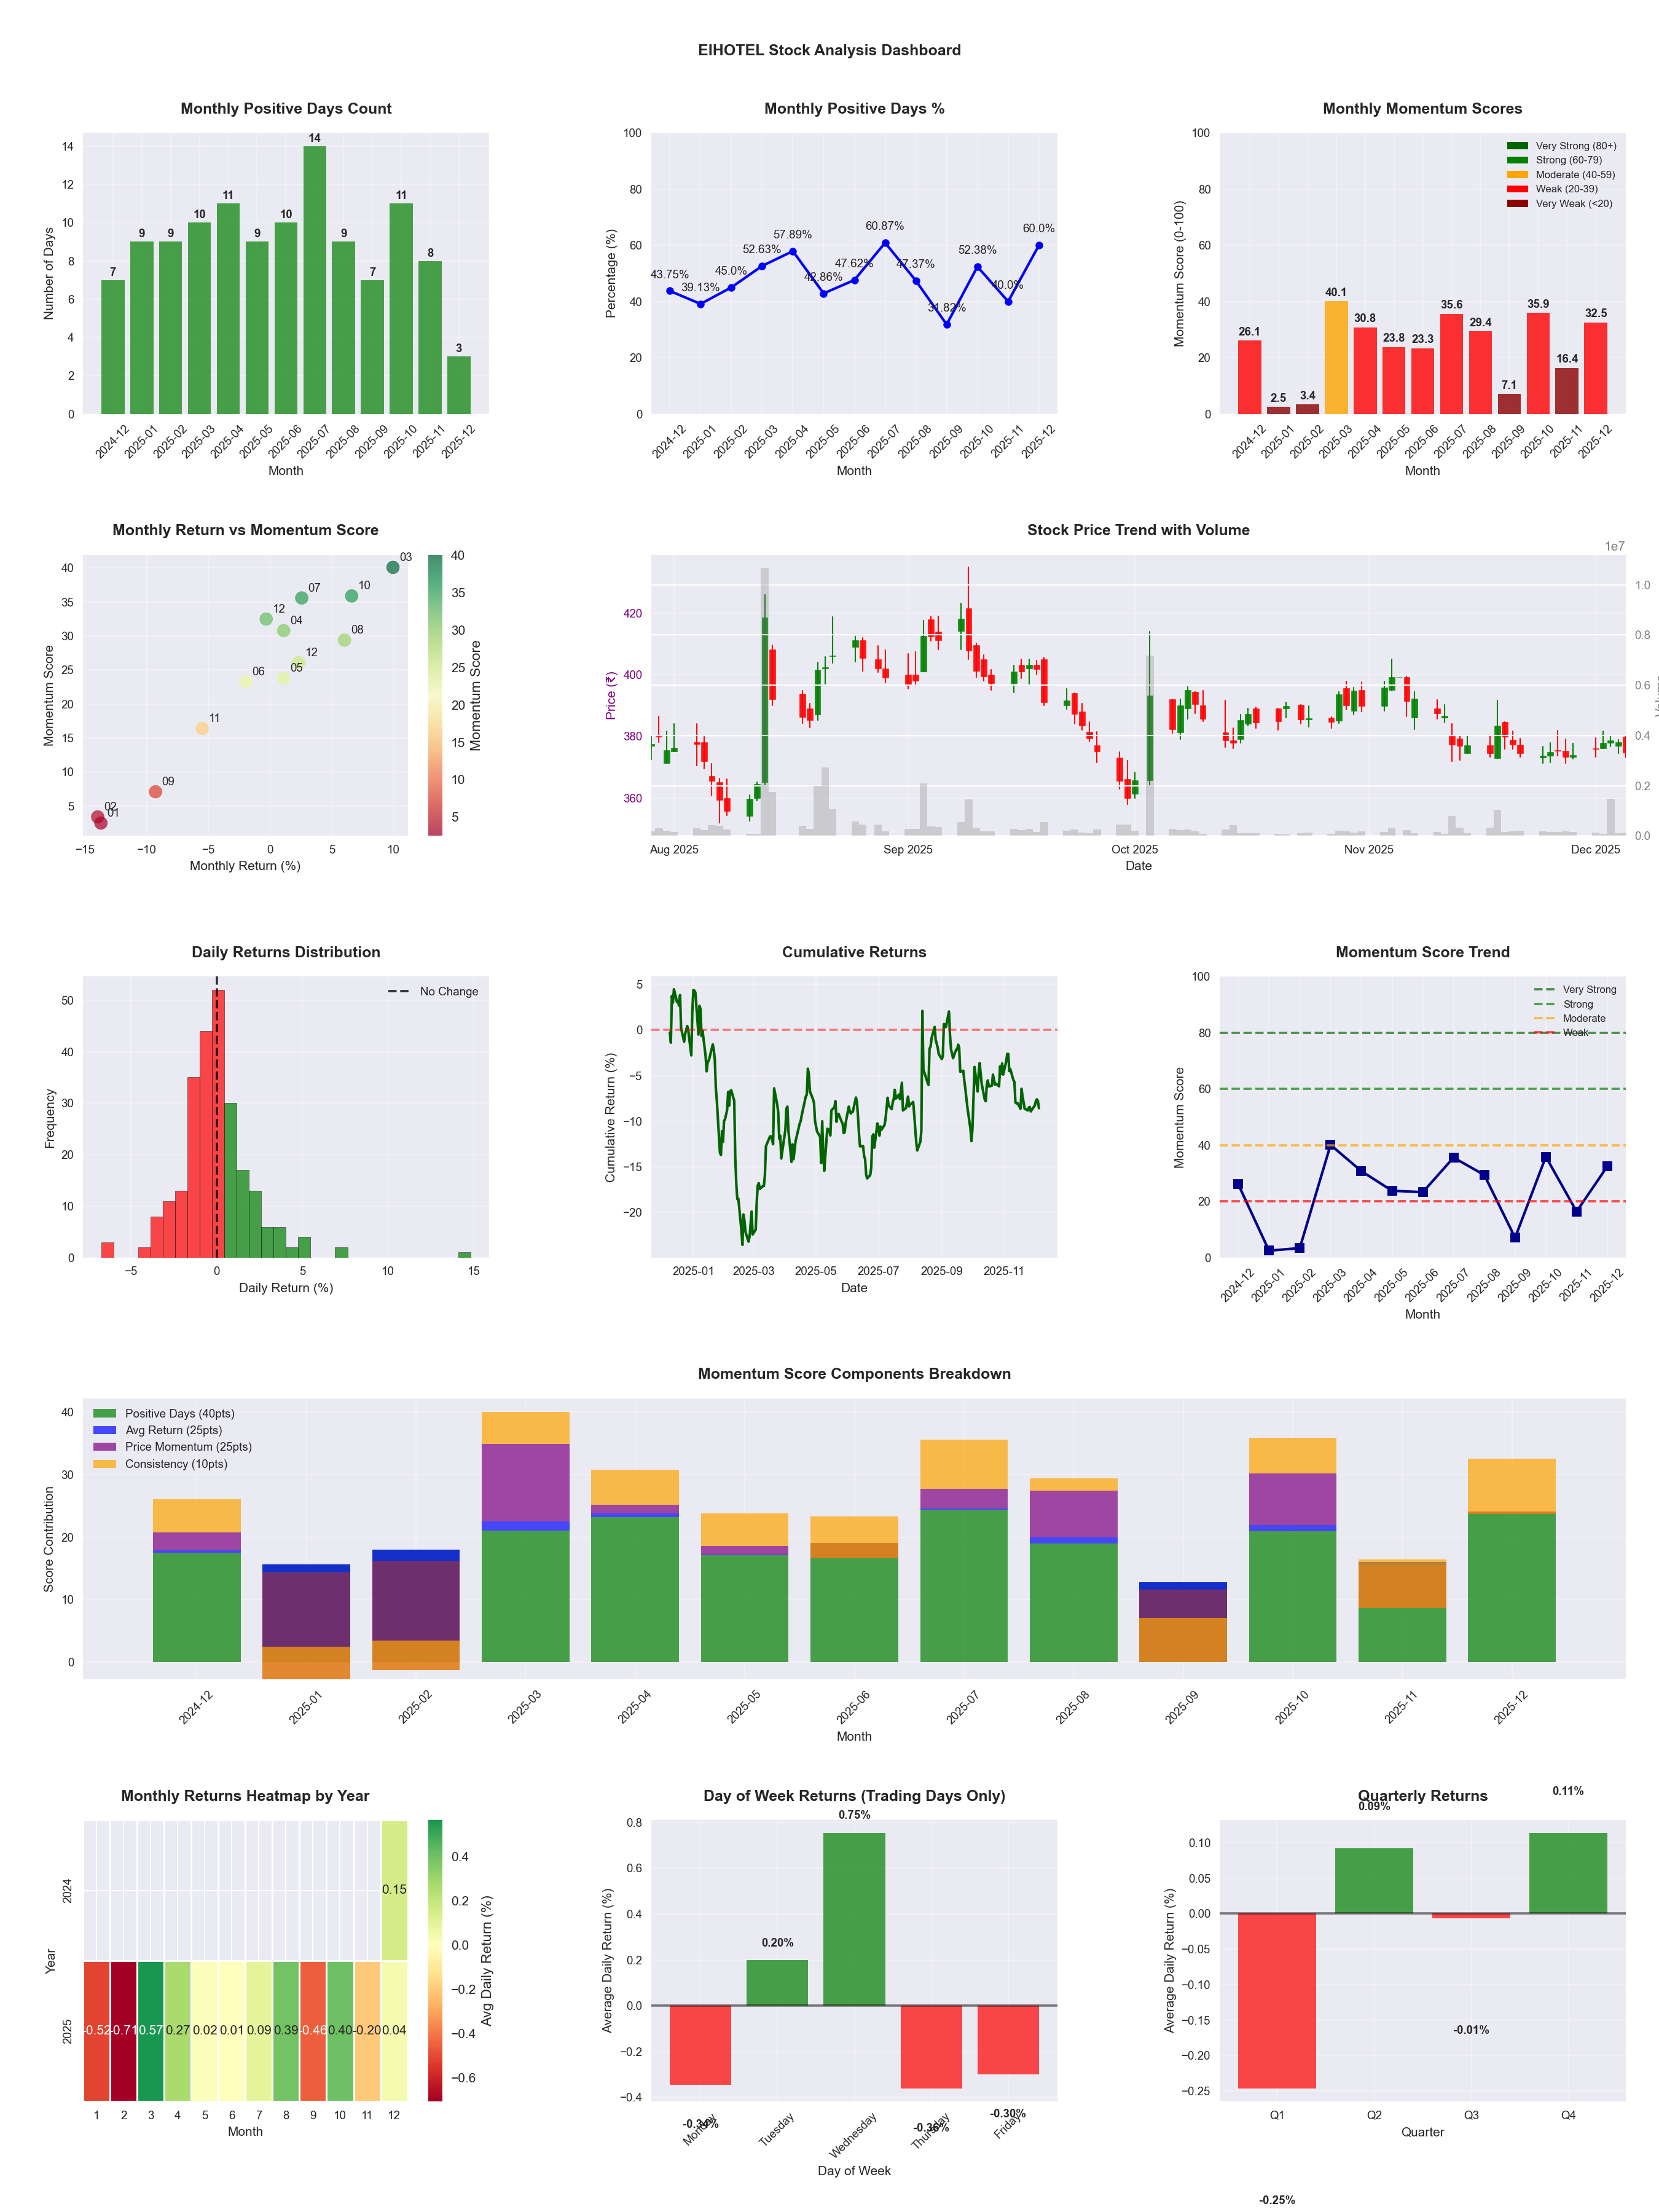
📈 EIHOTEL
Date
📅 2026-04-11
Volatility
🟡 2.06%
Risk Profile
⚠️ suitable for aggressive investors
Win Rate
⚠️ 45.5%
Avg Daily Return
📉 -0.04%
Max Drawdown
📉 -34.63%
IBD RS Score
📊 28.0
Weak
Market Rank
#355
Best Month
🏆 2026-04
Best Months to Trade
📅 Apr, Oct, Aug
Best Days to Trade
📅 Wednesday, Tuesday
📊 Key Insights & Metrics
Symbol
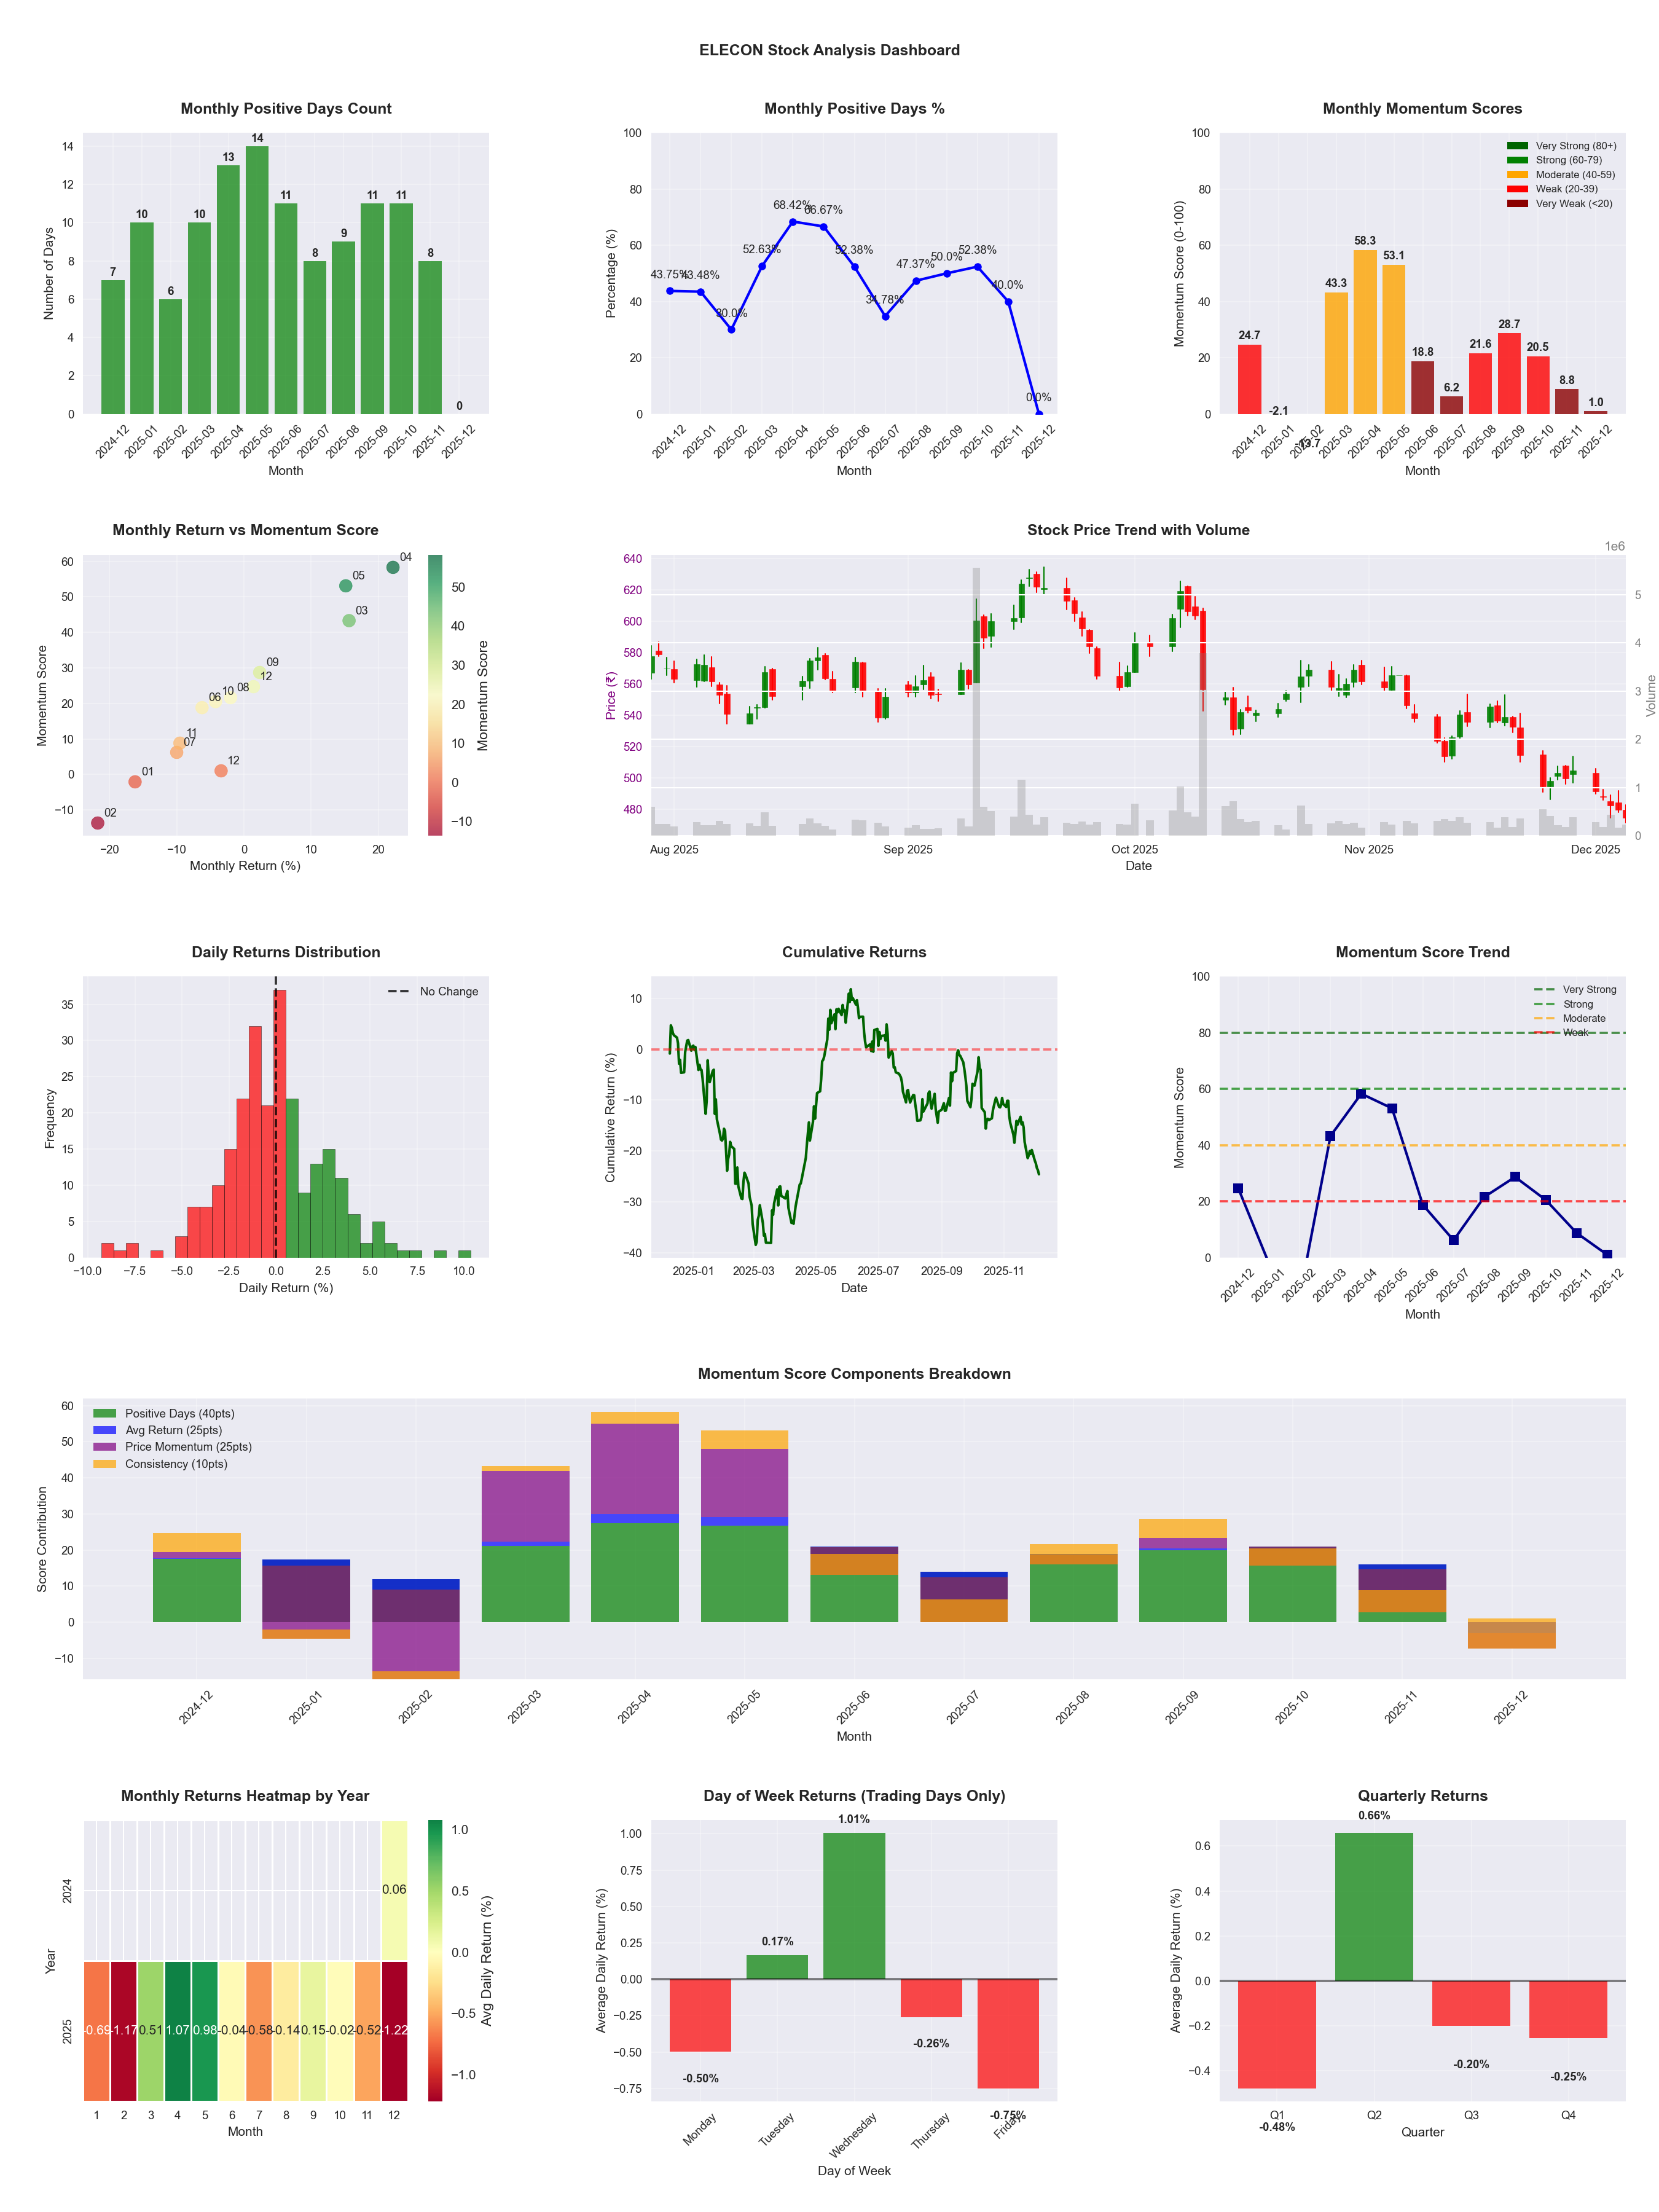
📈 ELECON
Date
📅 2026-04-11
Volatility
🟡 2.75%
Risk Profile
⚠️ suitable for aggressive investors
Win Rate
⚠️ 47.6%
Avg Daily Return
📈 +0.02%
Max Drawdown
📉 -49.55%
IBD RS Score
📊 28.8
Weak
Market Rank
#351
Best Month
🏆 2025-04
Best Months to Trade
📅 Apr, May, Feb
Best Days to Trade
📅 Wednesday, Tuesday
📊 Key Insights & Metrics
Symbol
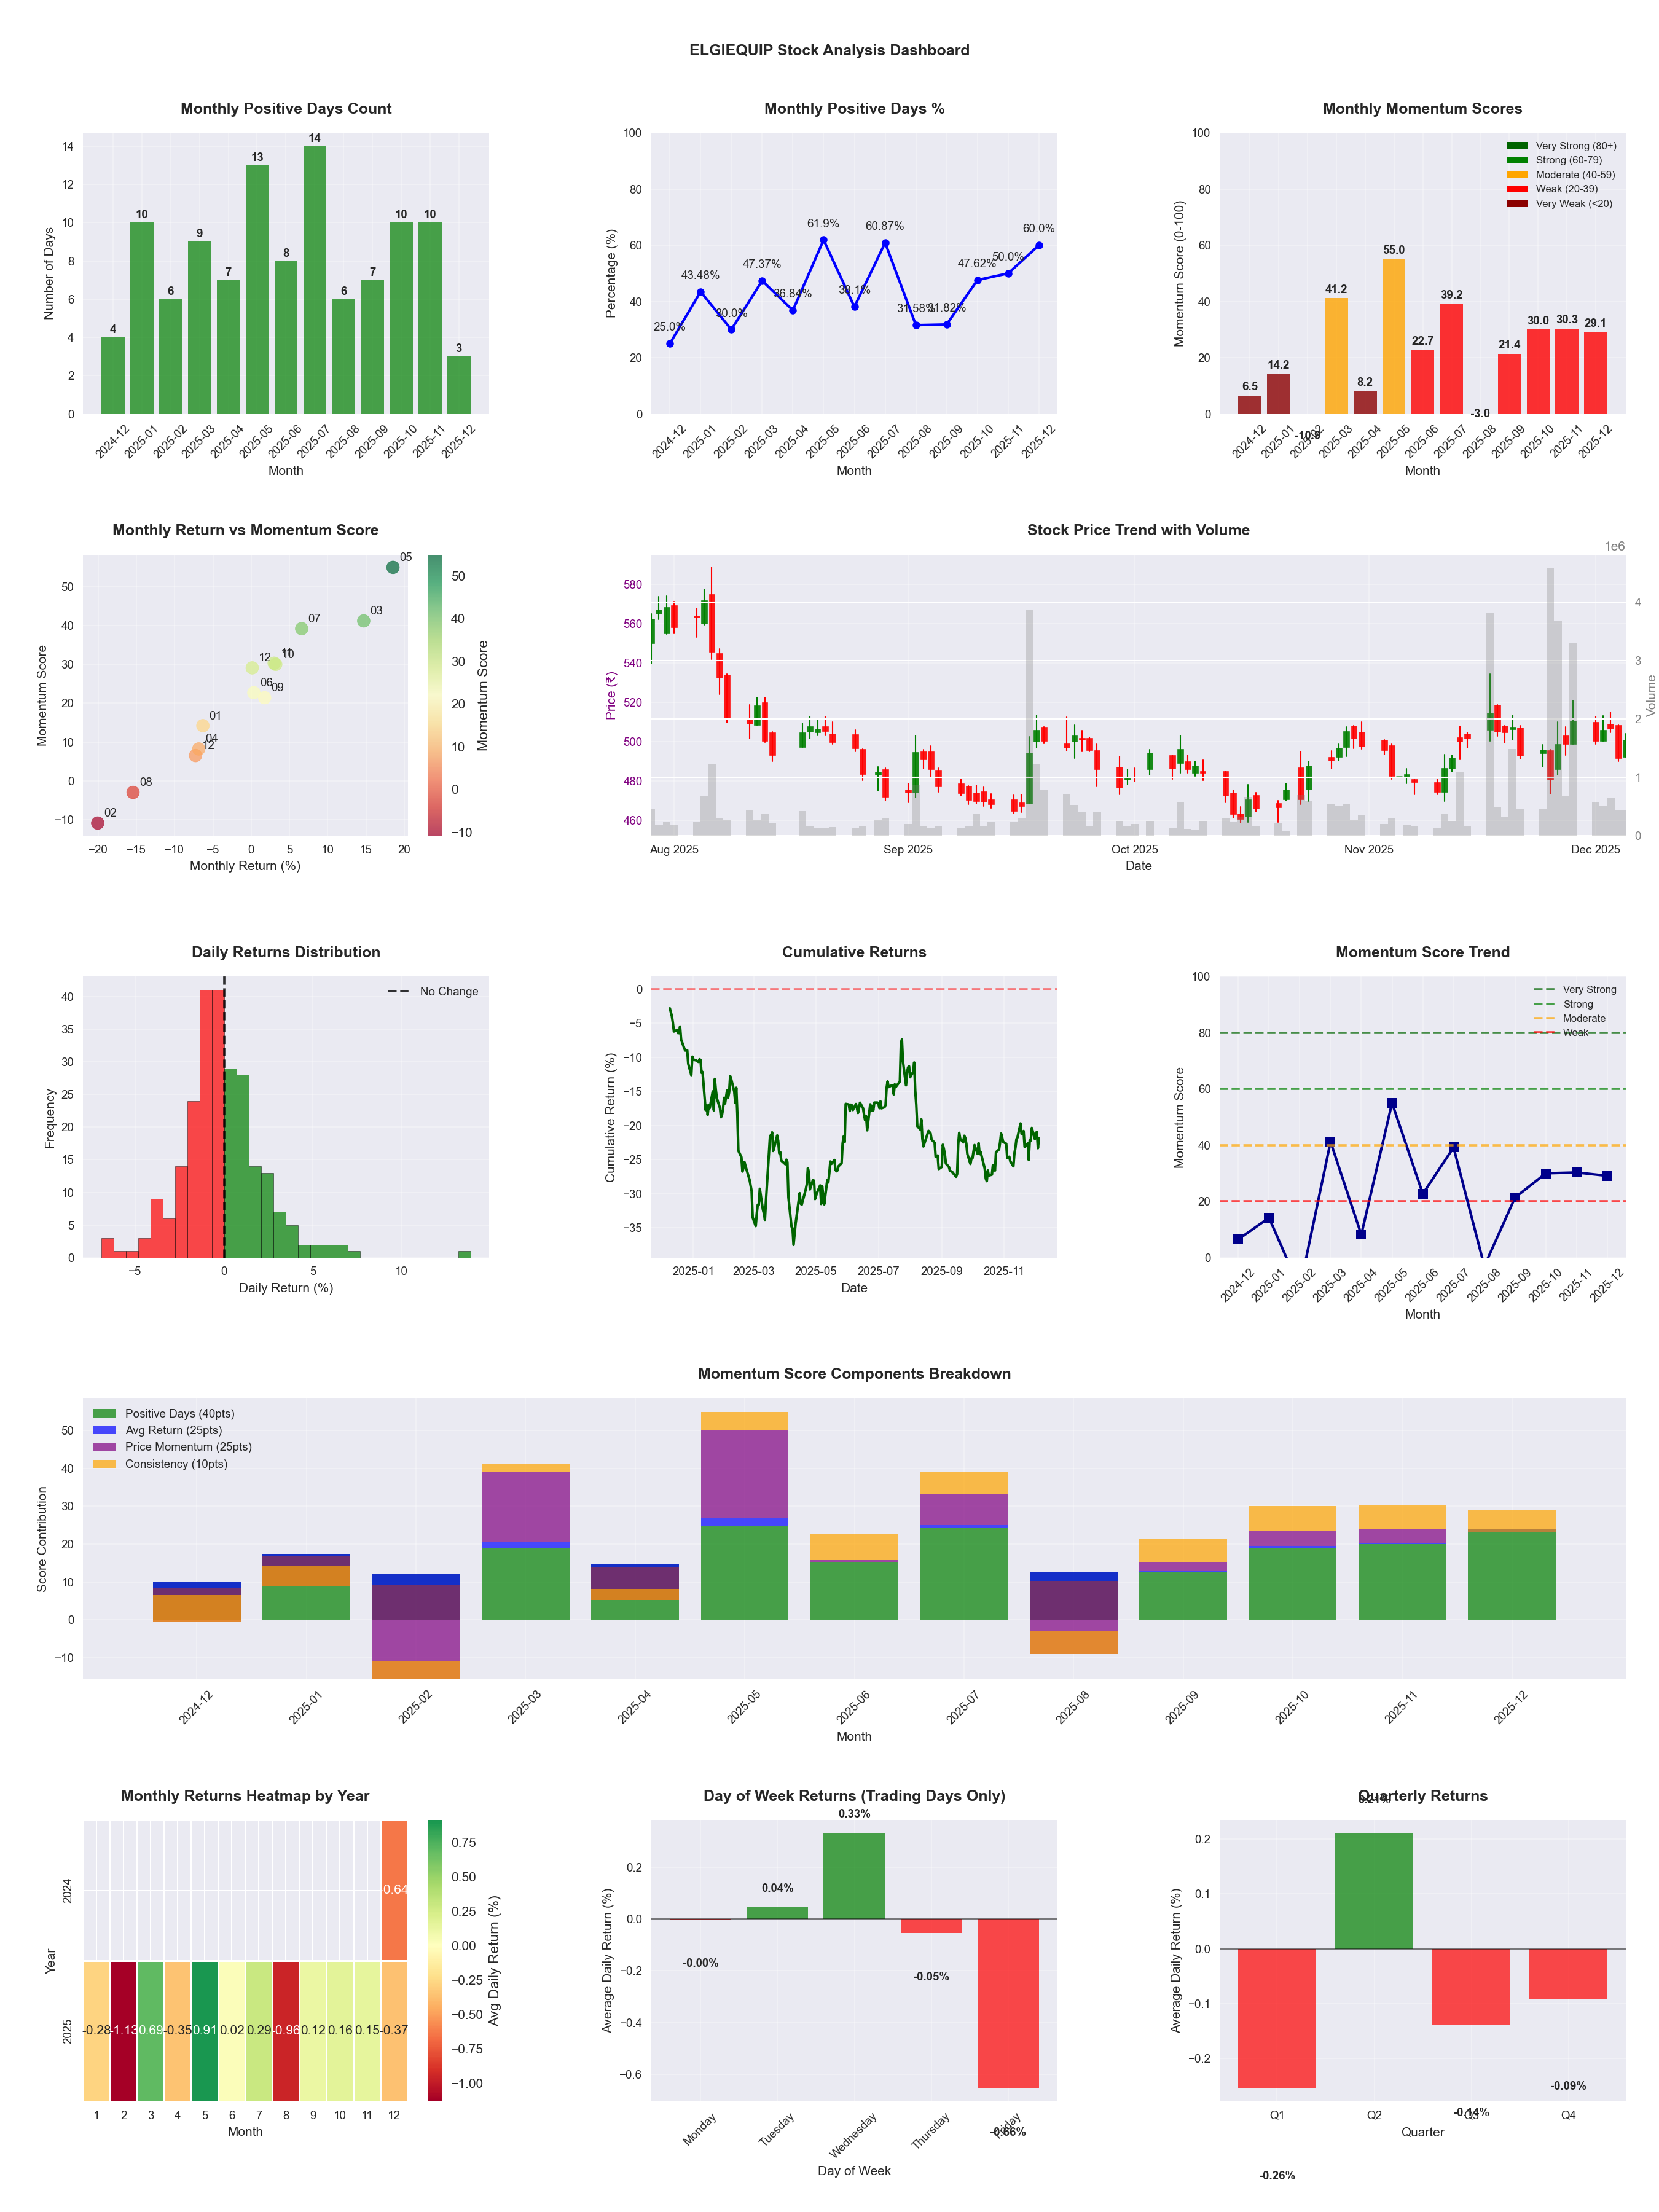
📈 ELGIEQUIP
Date
📅 2026-04-11
Volatility
🟡 2.26%
Risk Profile
⚠️ suitable for aggressive investors
Win Rate
⚠️ 47.1%
Avg Daily Return
📈 +0.11%
Max Drawdown
📉 -29.99%
IBD RS Score
📊 76.9
Strong
Market Rank
#114
Best Month
🏆 2026-04
Best Months to Trade
📅 Feb, May, Apr
Best Days to Trade
📅 Tuesday, Wednesday
📊 Key Insights & Metrics
Symbol
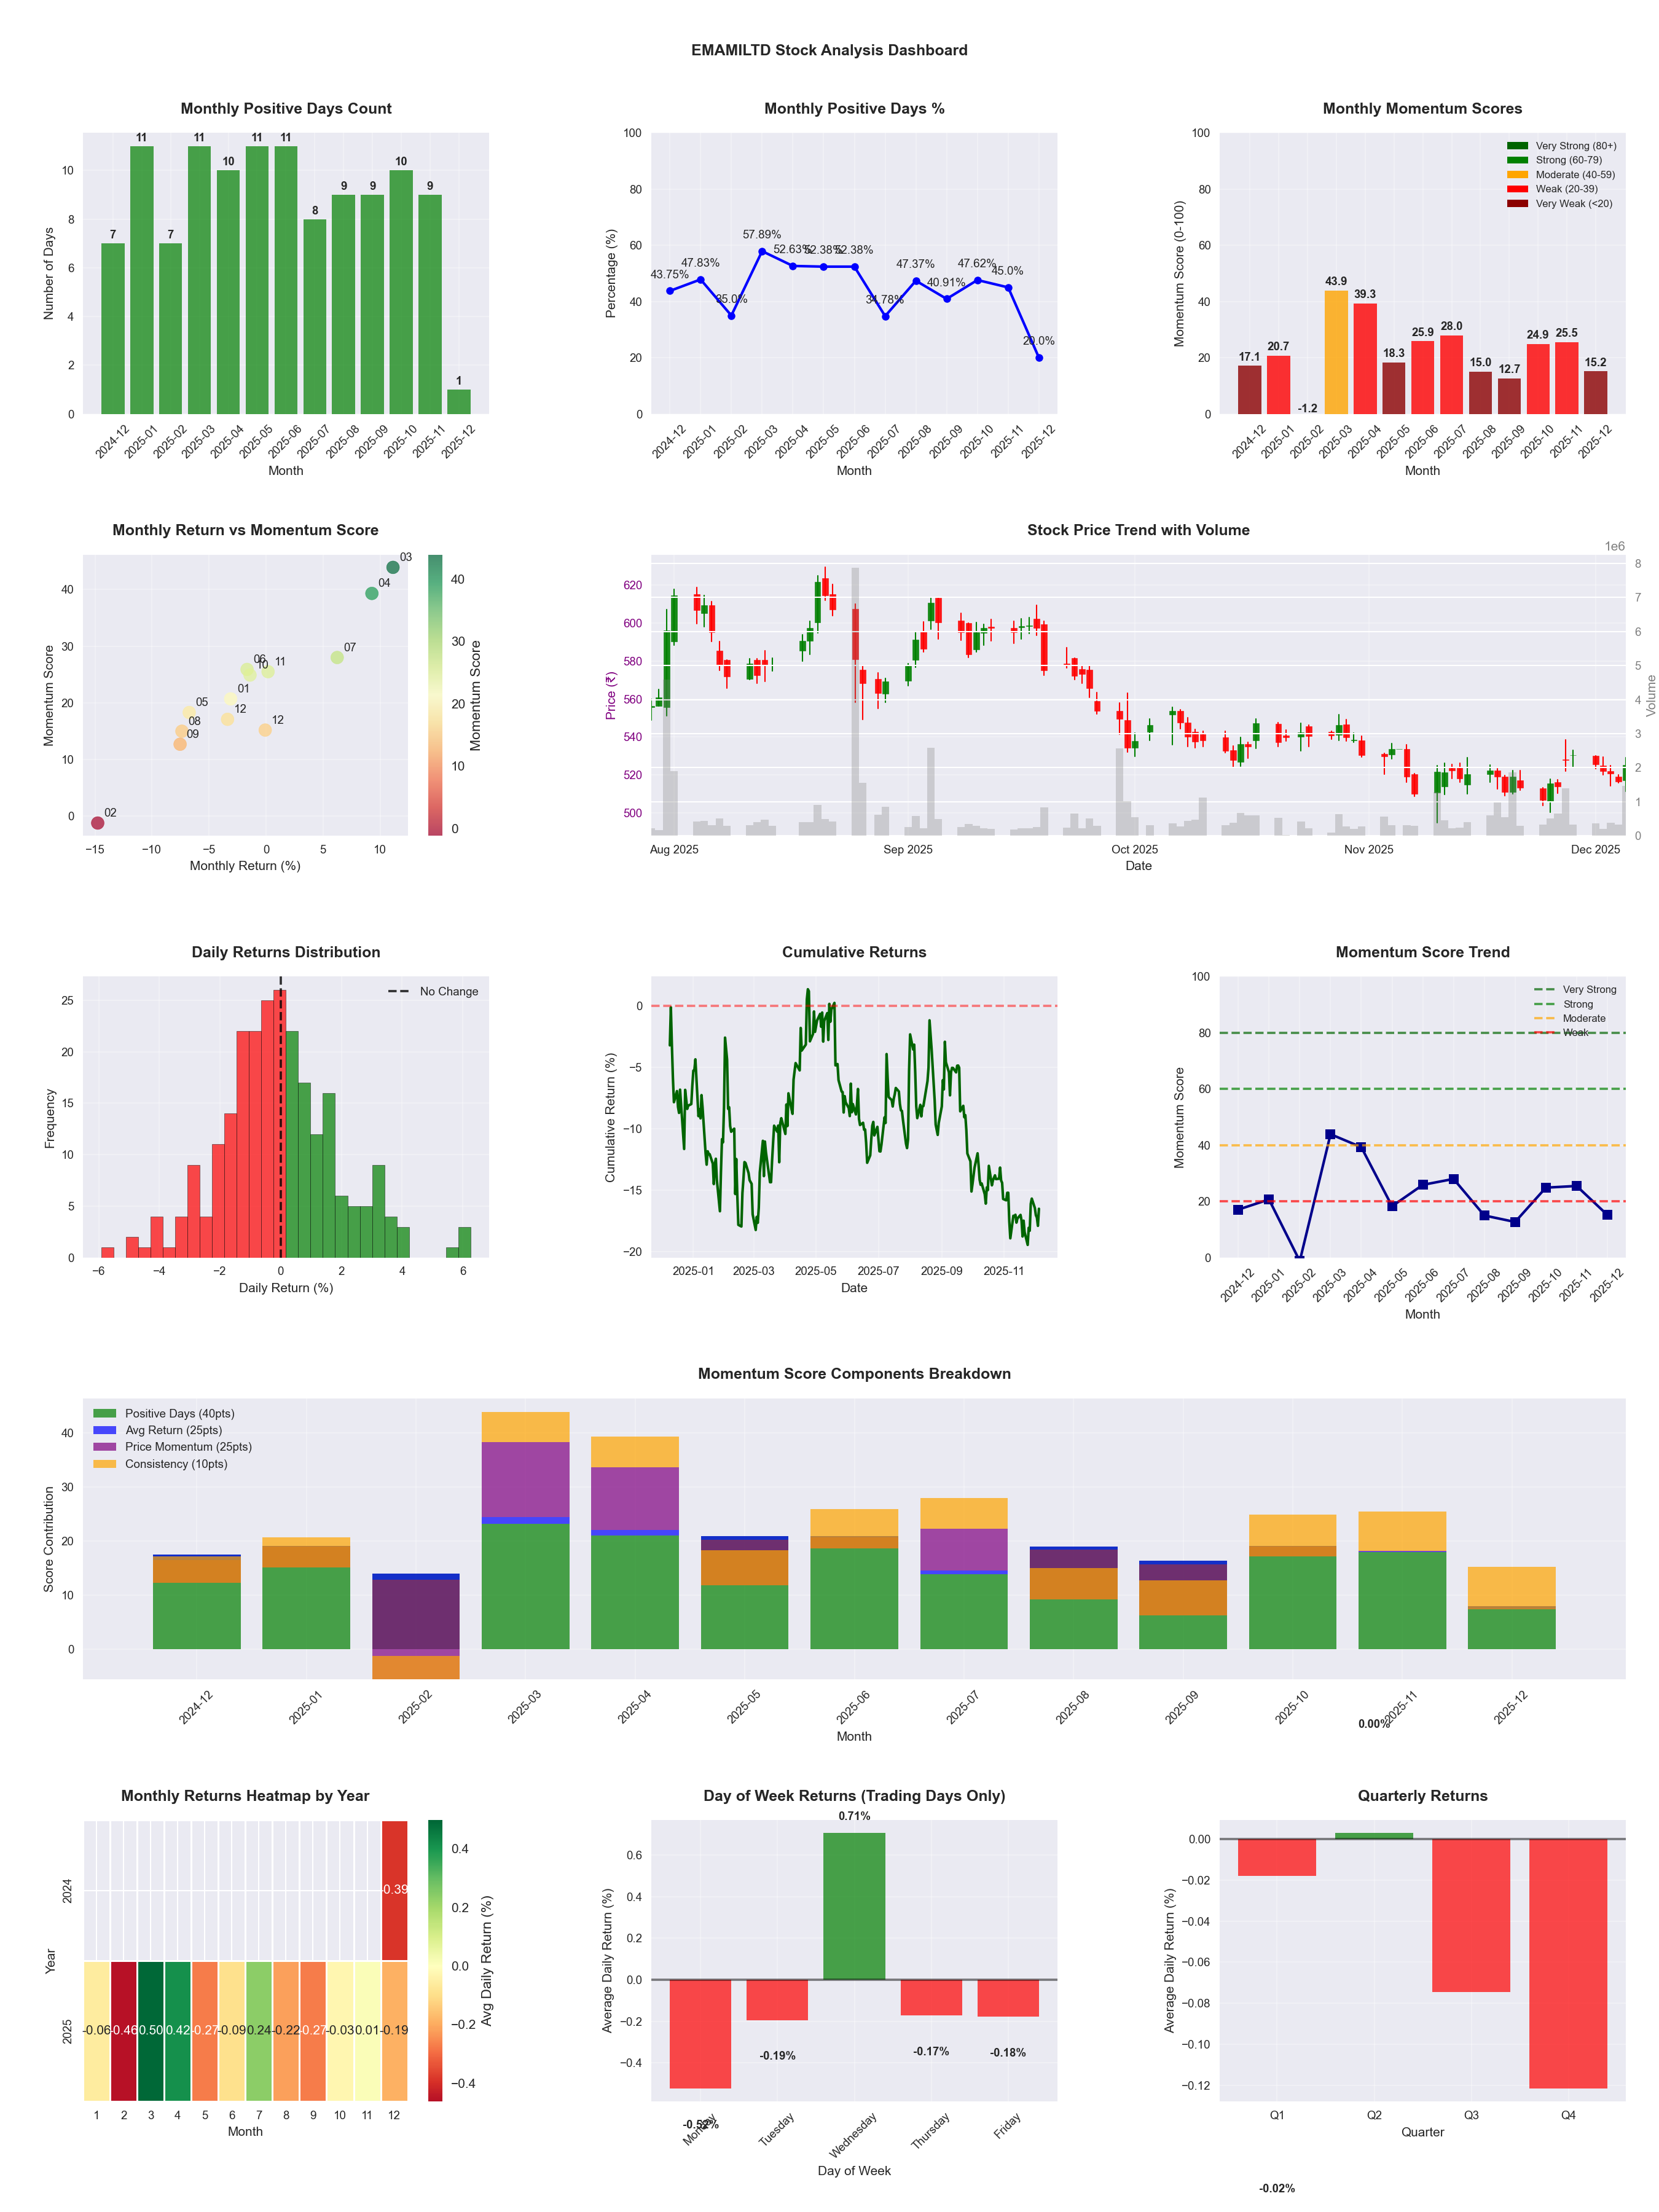
📈 EMAMILTD
Date
📅 2026-04-11
Volatility
🟡 1.63%
Win Rate
⚠️ 45.1%
Avg Daily Return
📉 -0.12%
Max Drawdown
📉 -37.62%
IBD RS Score
📊 12.8
Weak
Market Rank
#430
Best Month
🏆 2026-04
Worst Month
📉 2026-03
Best Months to Trade
📅 Apr, Jul, Nov
Best Days to Trade
📅 Wednesday, Monday
📊 Key Insights & Metrics
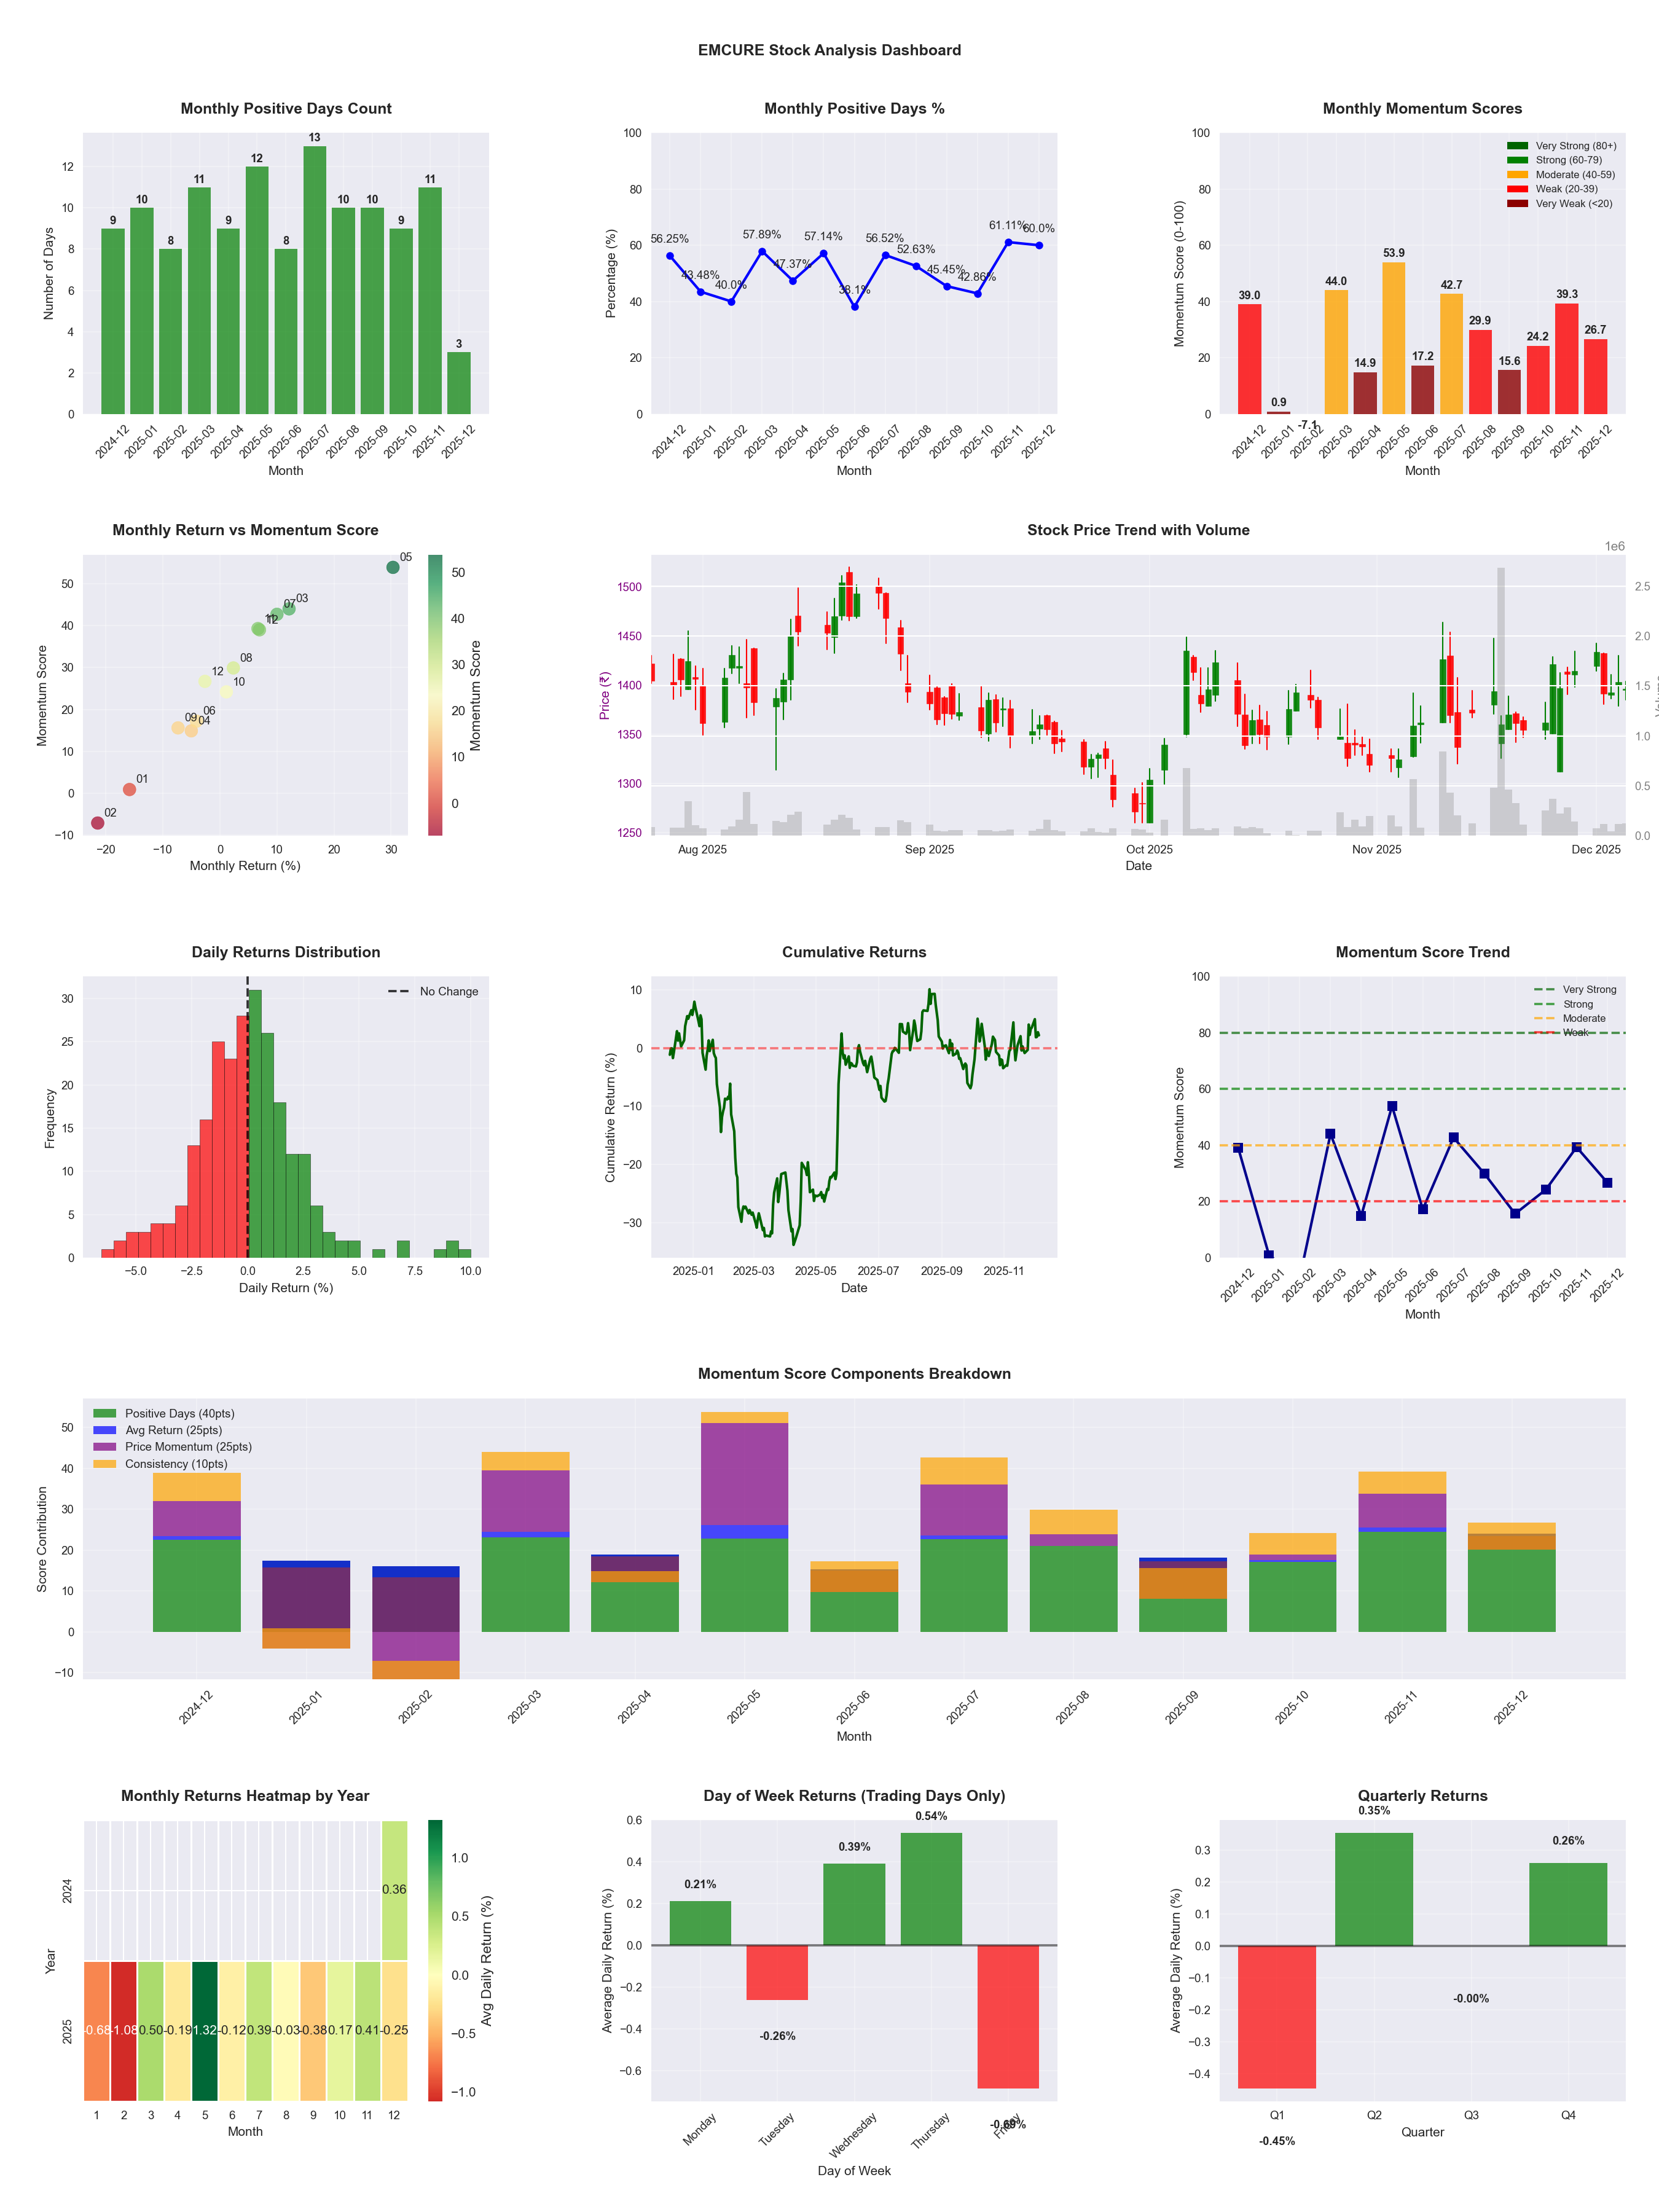
Symbol
📈 EMCURE
Date
📅 2026-04-11
Volatility
🟡 2.29%
Risk Profile
⚠️ suitable for aggressive investors
Win Rate
⚠️ 50.0%
Avg Daily Return
📈 +0.25%
Max Drawdown
📉 -15.47%
IBD RS Score
📊 90.9
Leader
Market Rank
#45
Best Month
🏆 2025-05
Worst Month
📉 2025-09
Best Months to Trade
📅 May, Apr, Mar
Best Days to Trade
📅 Monday, Wednesday
📊 Key Insights & Metrics
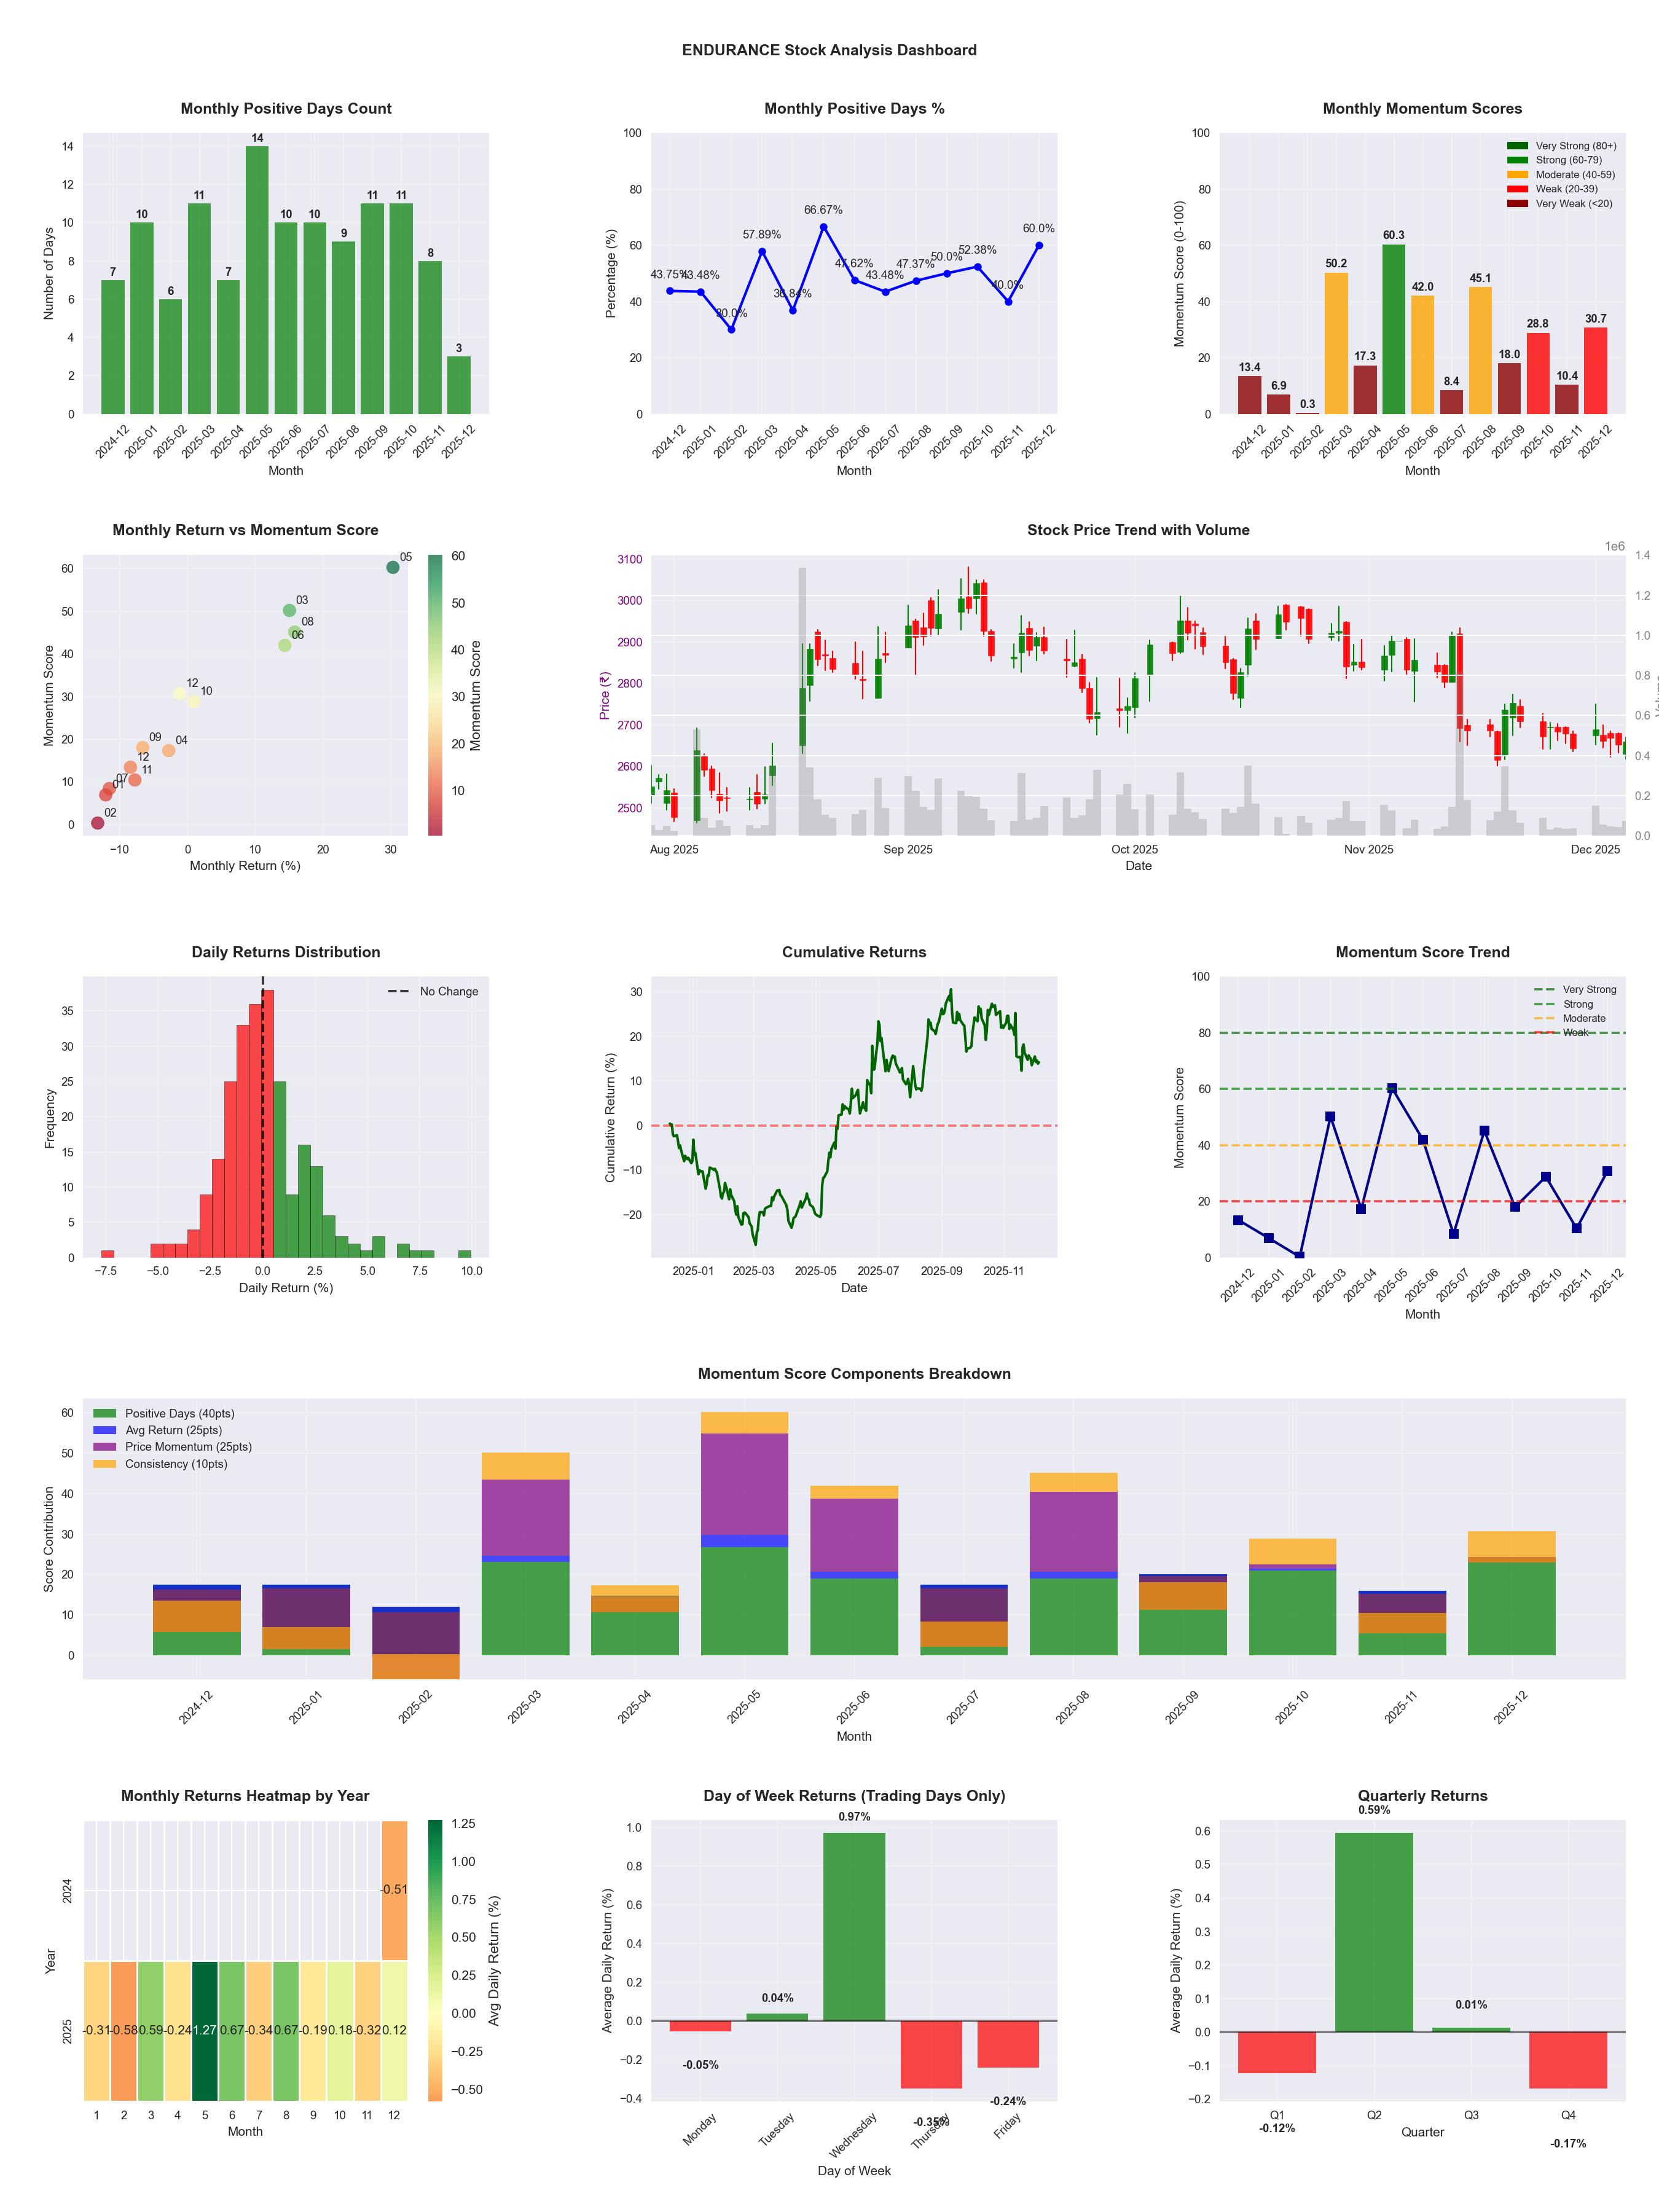
Symbol
📈 ENDURANCE
Date
📅 2026-04-11
Volatility
🟡 2.23%
Risk Profile
⚠️ suitable for aggressive investors
Win Rate
⚠️ 48.4%
Avg Daily Return
📈 +0.14%
Max Drawdown
📉 -27.62%
IBD RS Score
📊 59.2
Average
Market Rank
#201
Best Month
🏆 2025-05
Best Months to Trade
📅 May, Jun, Aug
Best Days to Trade
📅 Wednesday, Monday
📊 Key Insights & Metrics
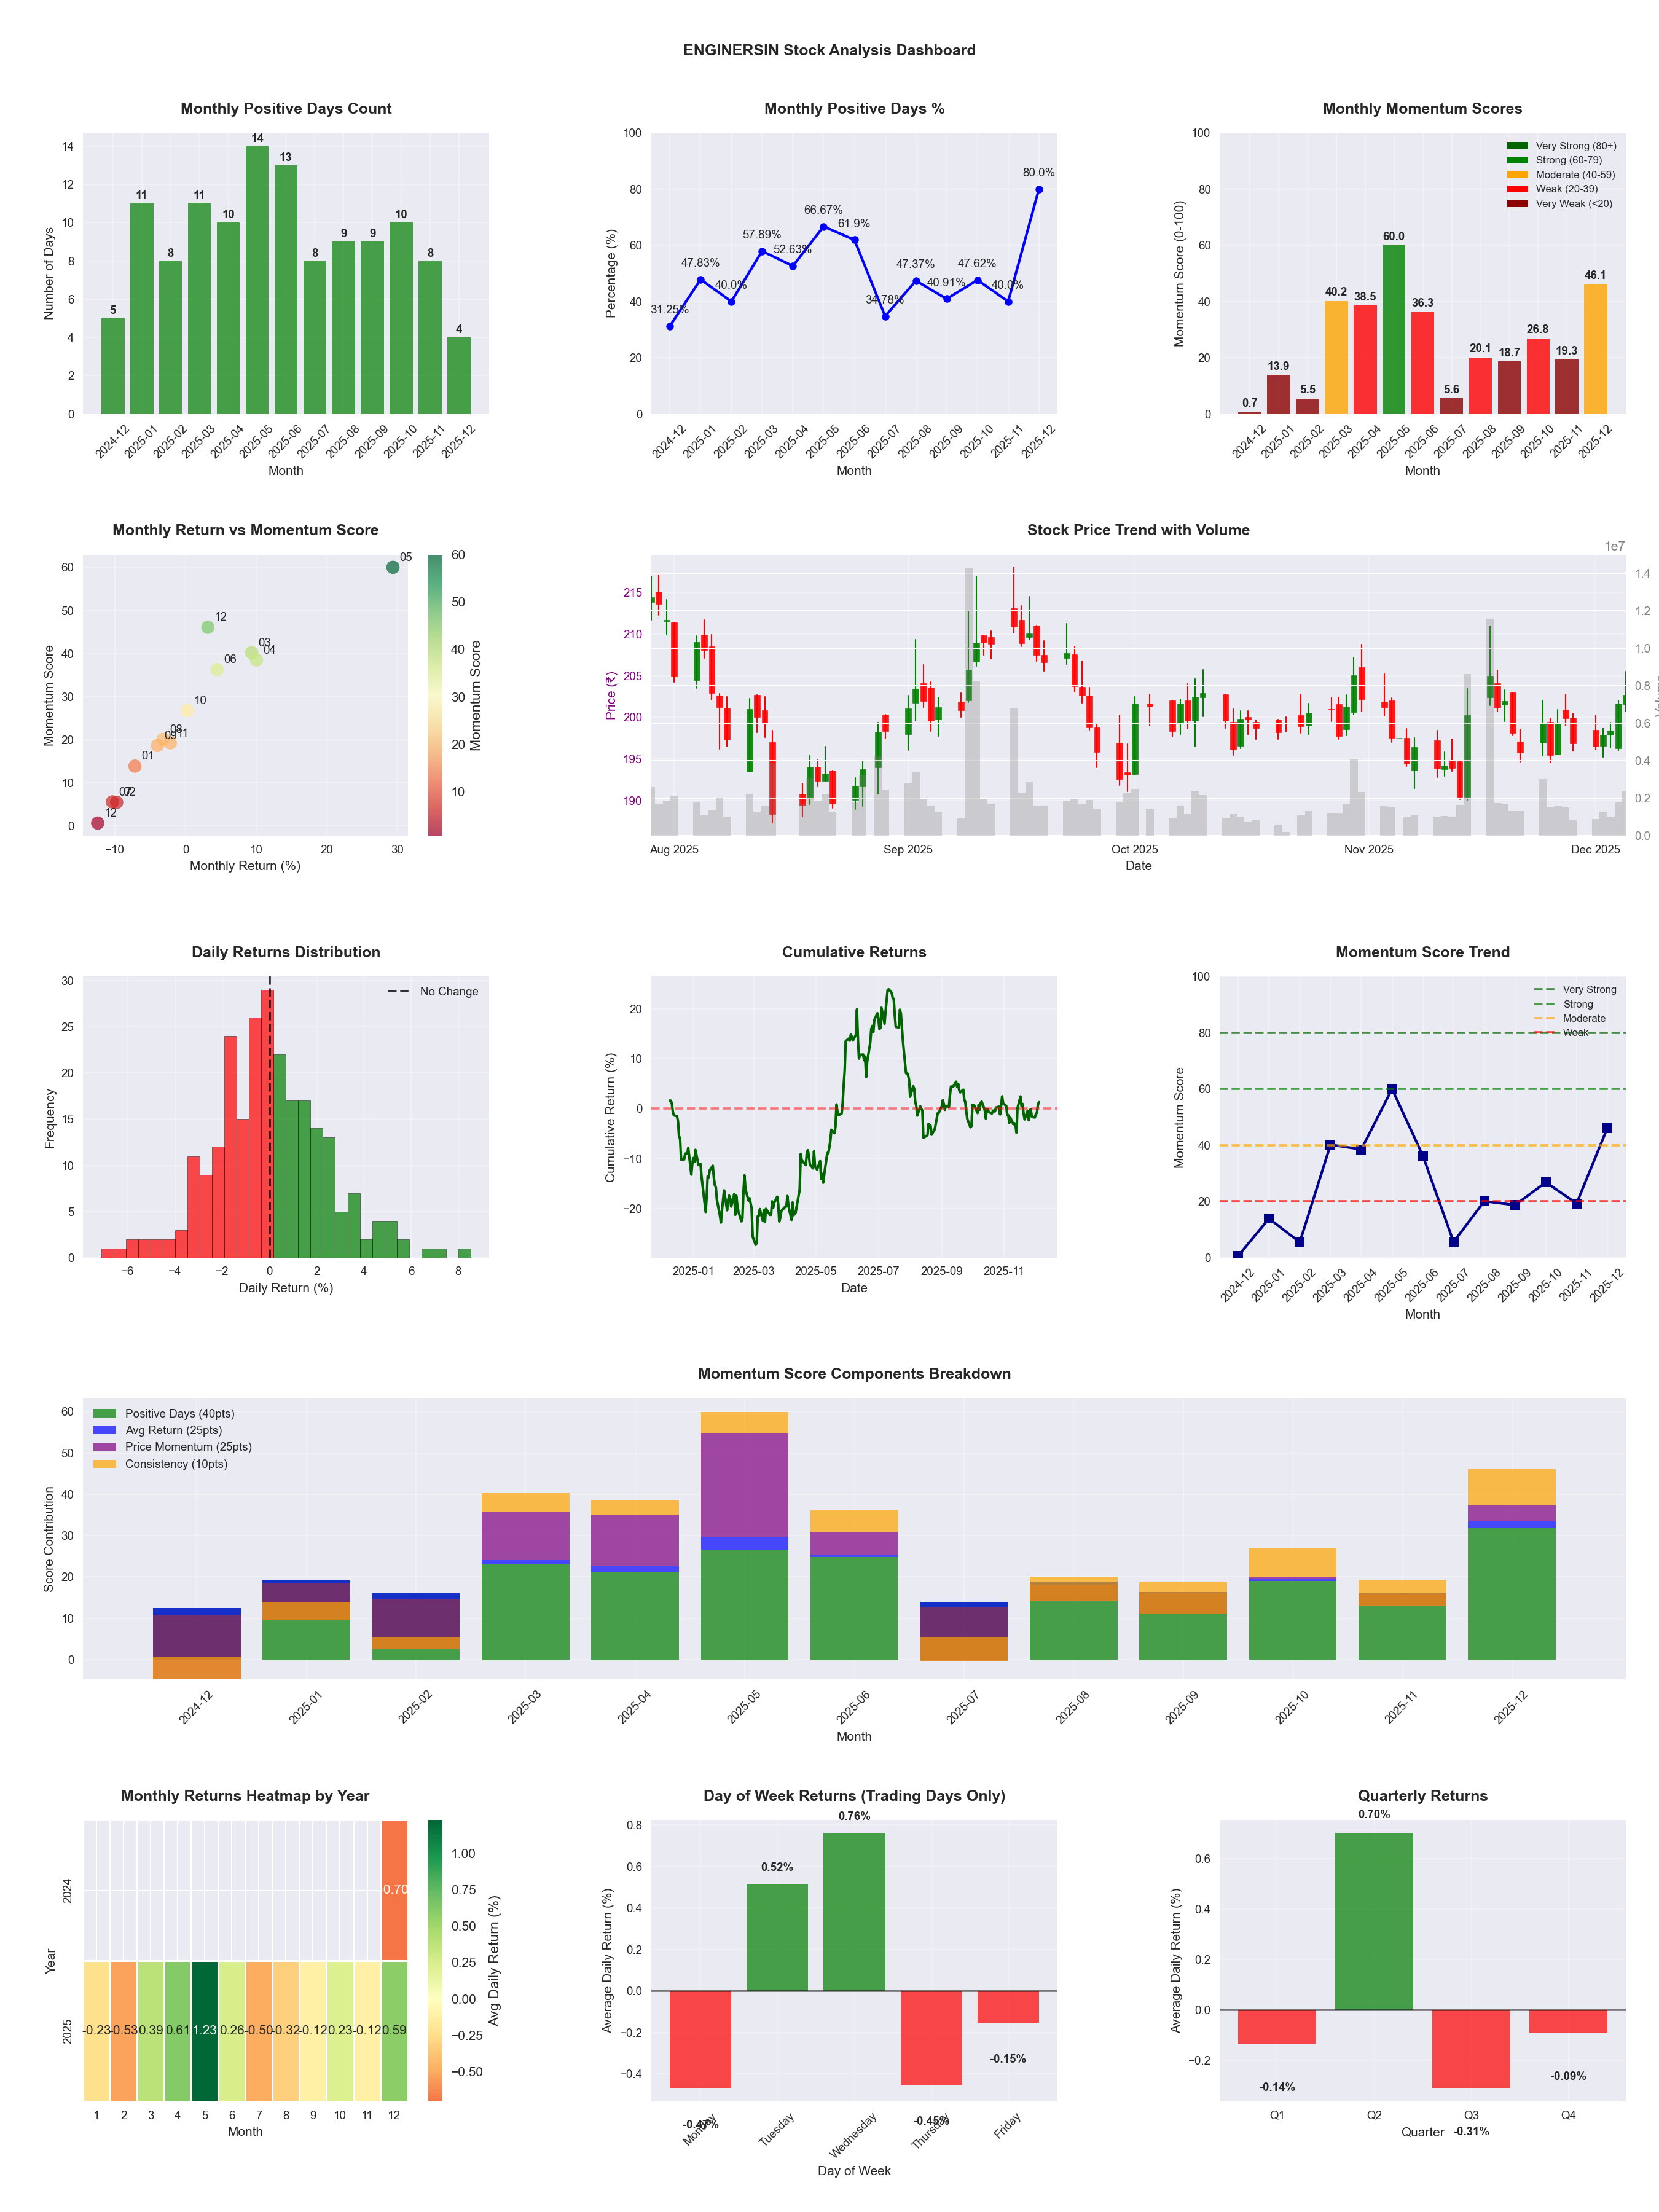
Symbol
📈 ENGINERSIN
Date
📅 2026-04-11
Volatility
🟡 2.59%
Risk Profile
⚠️ suitable for aggressive investors
Win Rate
⚠️ 49.6%
Avg Daily Return
📈 +0.16%
Max Drawdown
📉 -33.31%
IBD RS Score
📊 74.8
Strong
Market Rank
#124
Best Month
🏆 2025-05
Best Months to Trade
📅 Apr, Feb, May
Best Days to Trade
📅 Wednesday, Tuesday
📊 Key Insights & Metrics
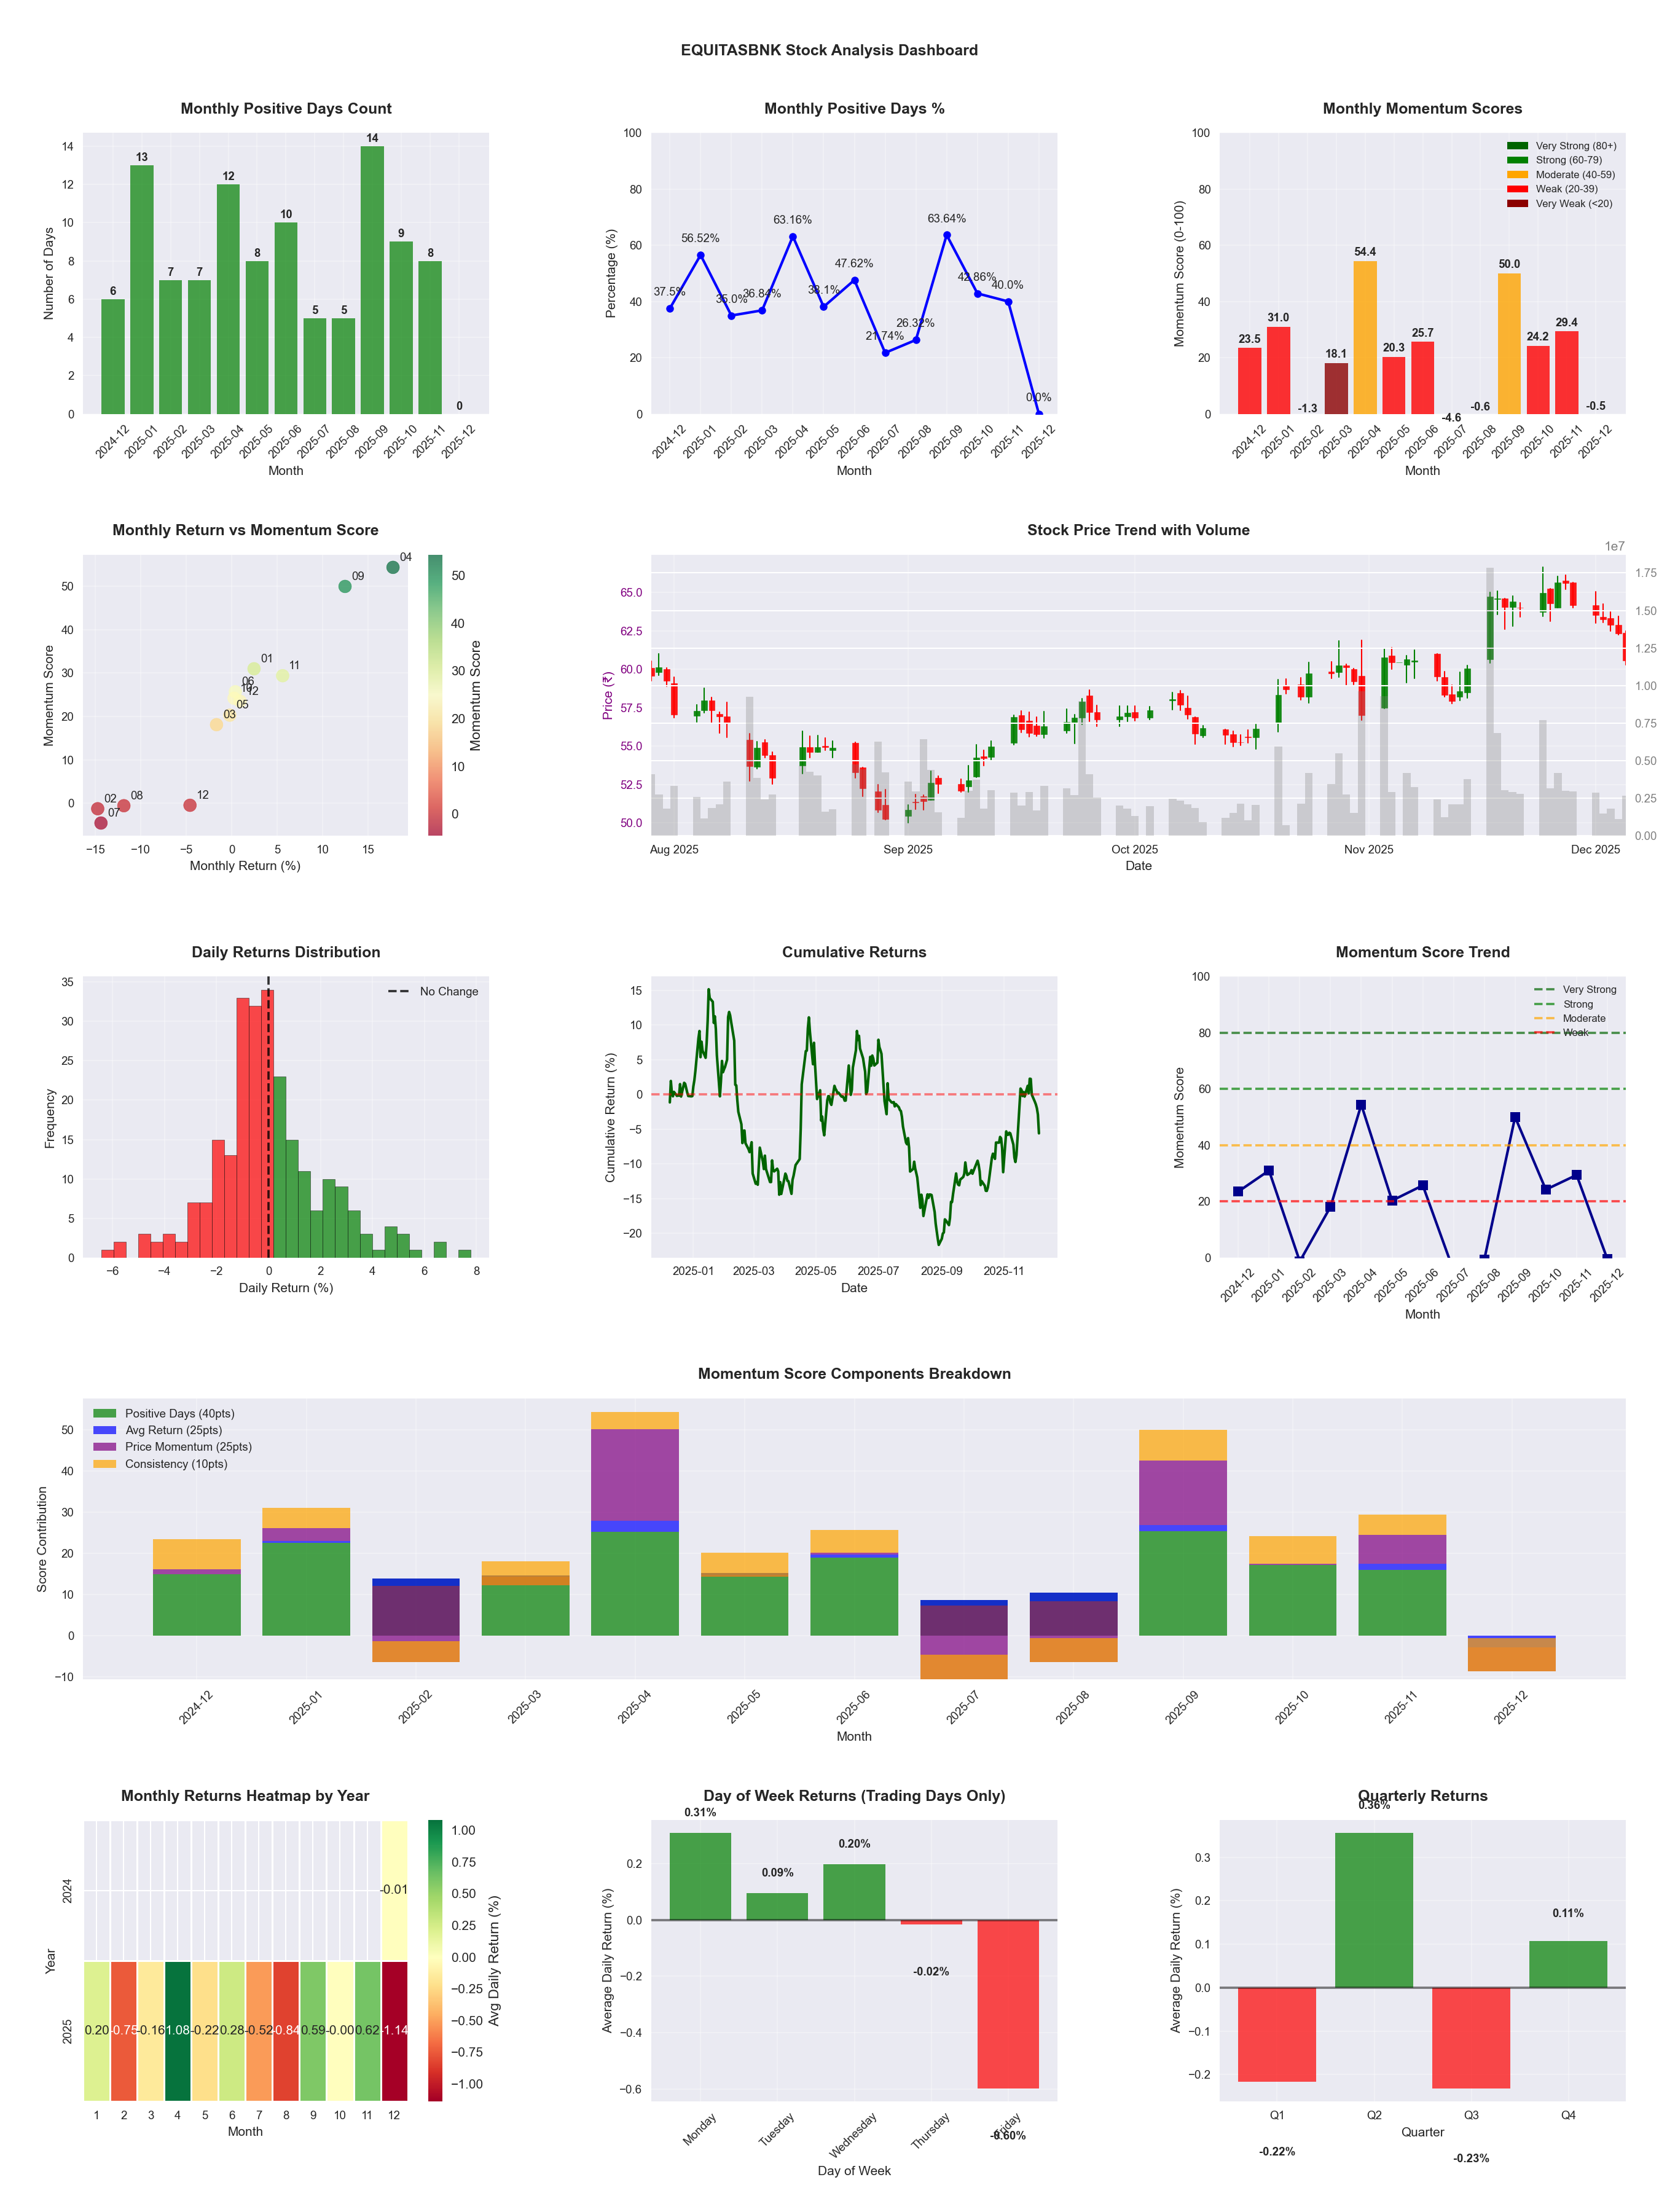
Symbol
📈 EQUITASBNK
Date
📅 2026-03-21
Volatility
🟡 2.09%
Risk Profile
⚠️ suitable for aggressive investors
Win Rate
⚠️ 42.5%
Avg Daily Return
📈 +0.02%
Max Drawdown
📉 -29.50%
Best Month
🏆 2025-04
Best Months to Trade
📅 Apr, Nov, Sep
Best Days to Trade
📅 Monday, Wednesday
📊 Key Insights & Metrics
Symbol
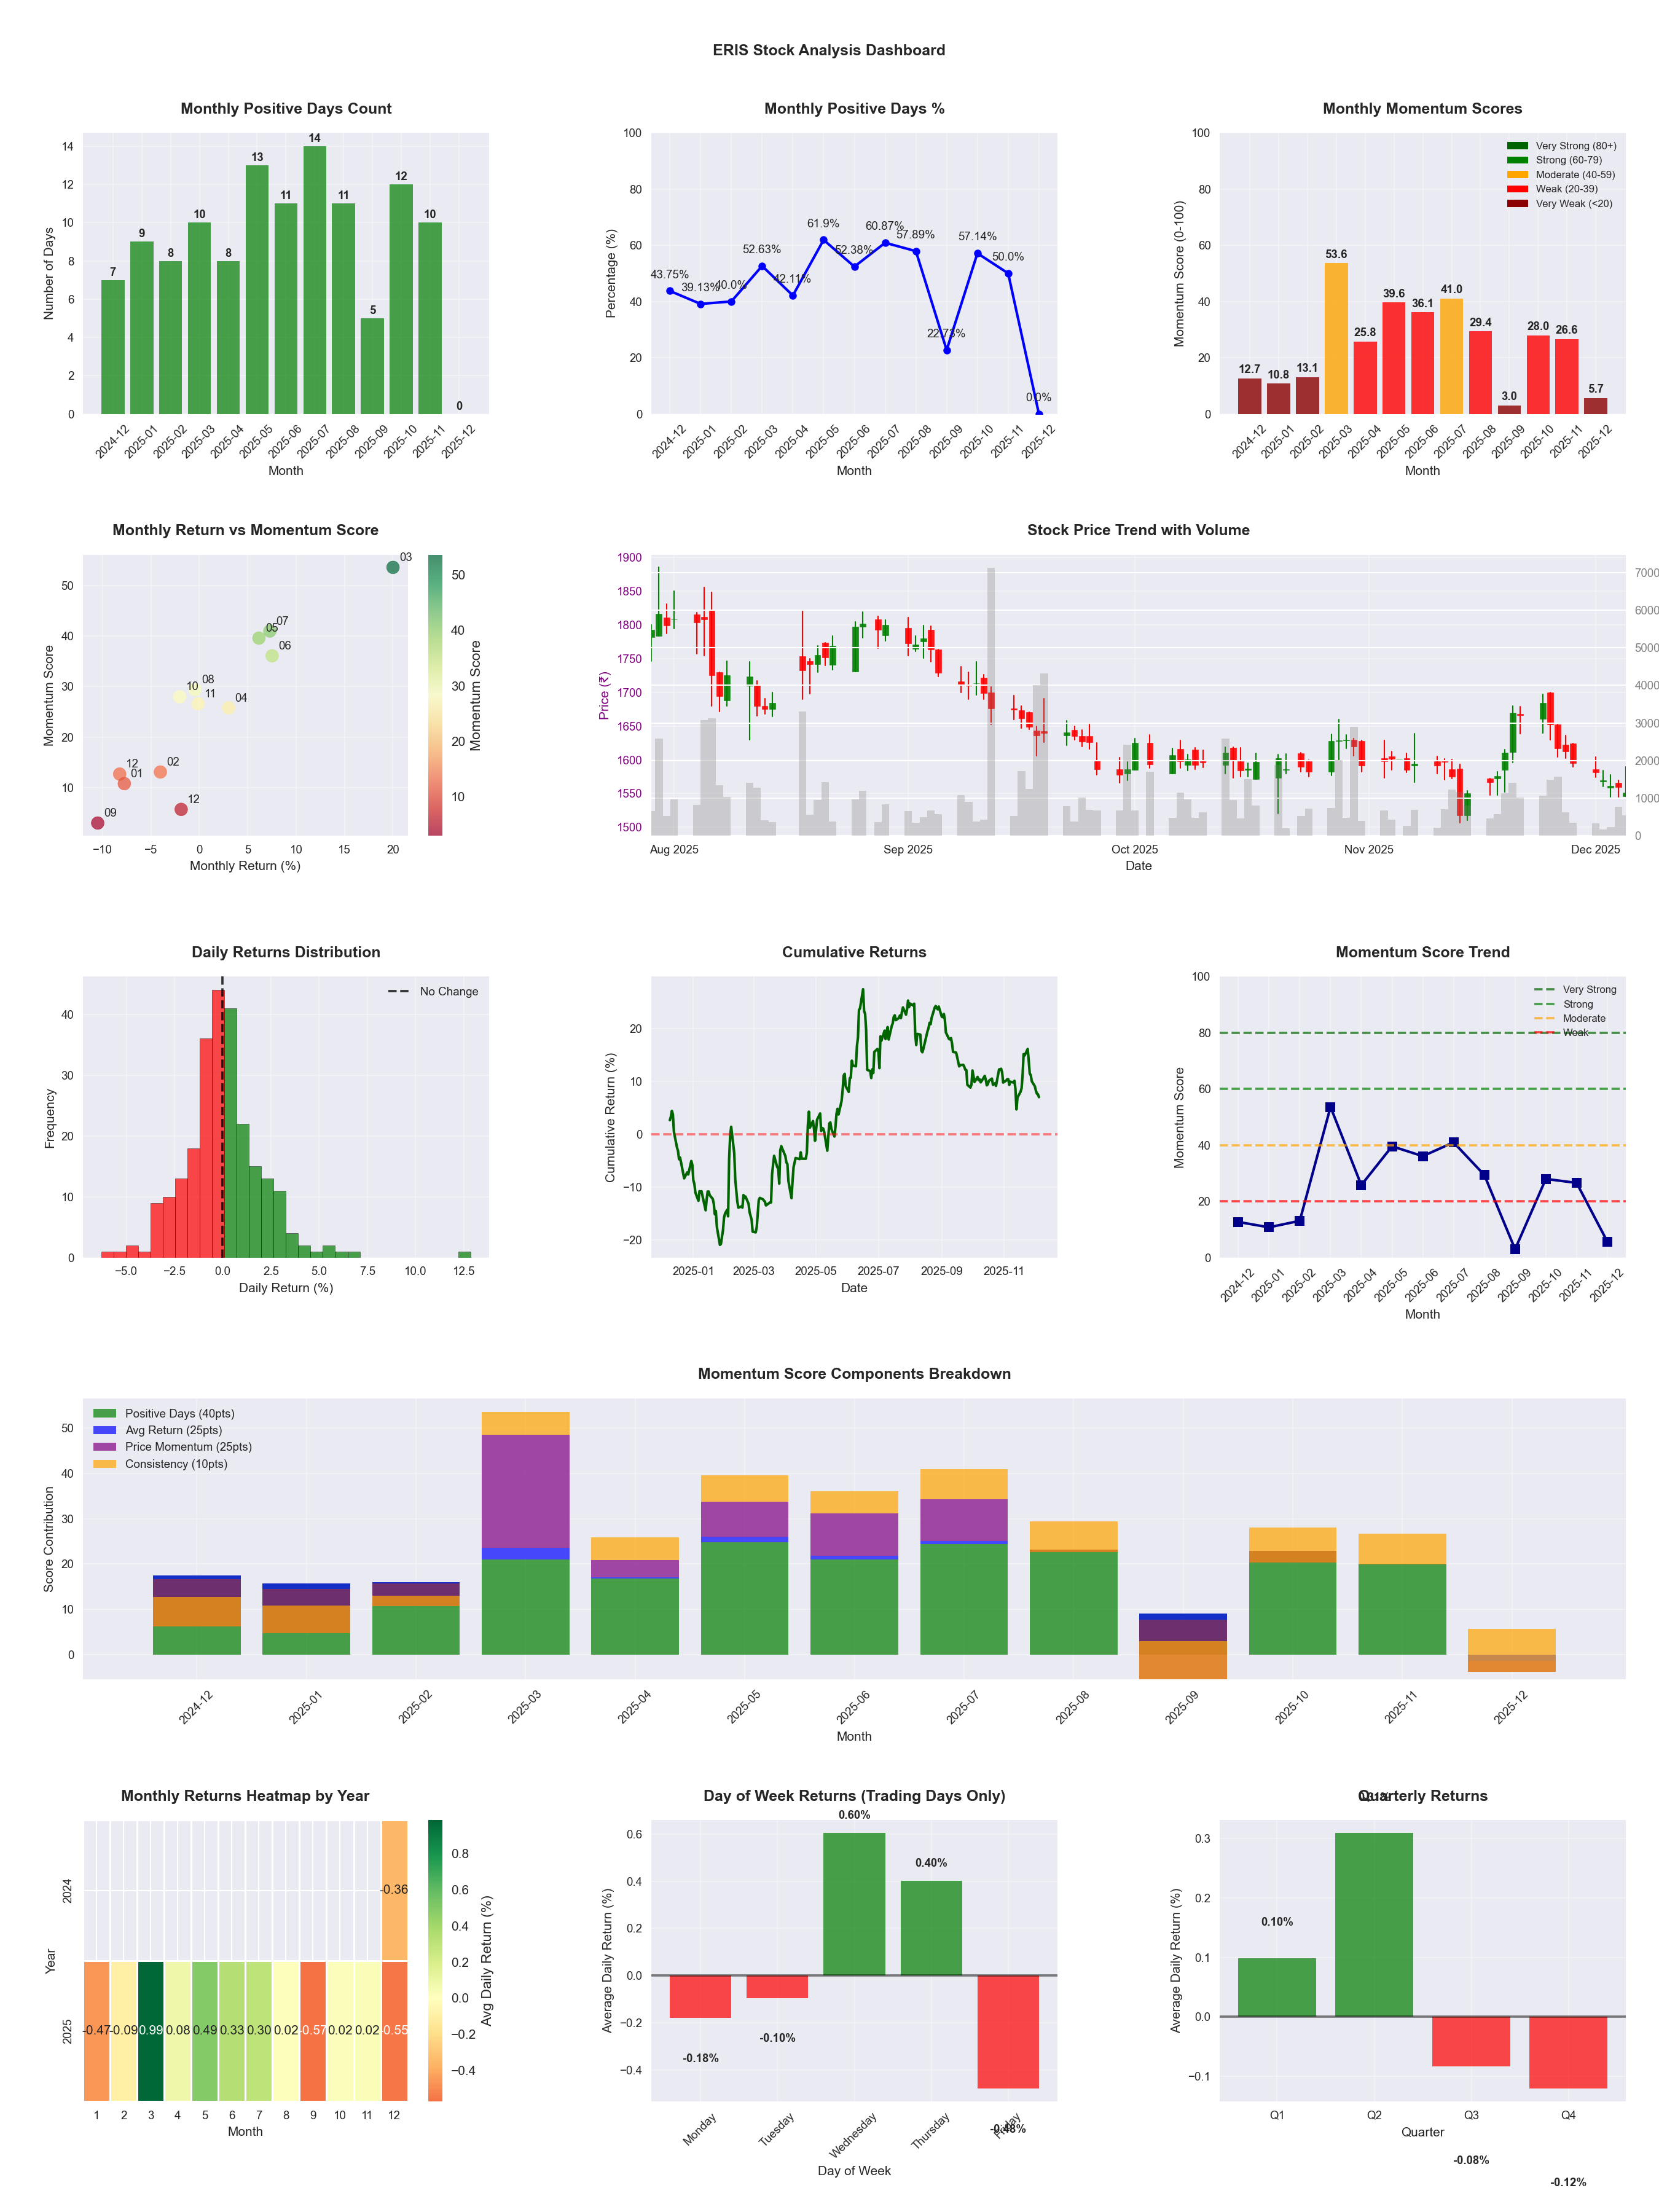
📈 ERIS
Date
📅 2026-04-11
Volatility
🟡 1.91%
Win Rate
⚠️ 47.8%
Avg Daily Return
📈 +0.01%
Max Drawdown
📉 -31.21%
IBD RS Score
📊 33.9
Weak
Market Rank
#326
Best Month
🏆 2026-04
Worst Month
📉 2025-09
Best Months to Trade
📅 Apr, May, Jun
Best Days to Trade
📅 Wednesday, Thursday
📊 Key Insights & Metrics
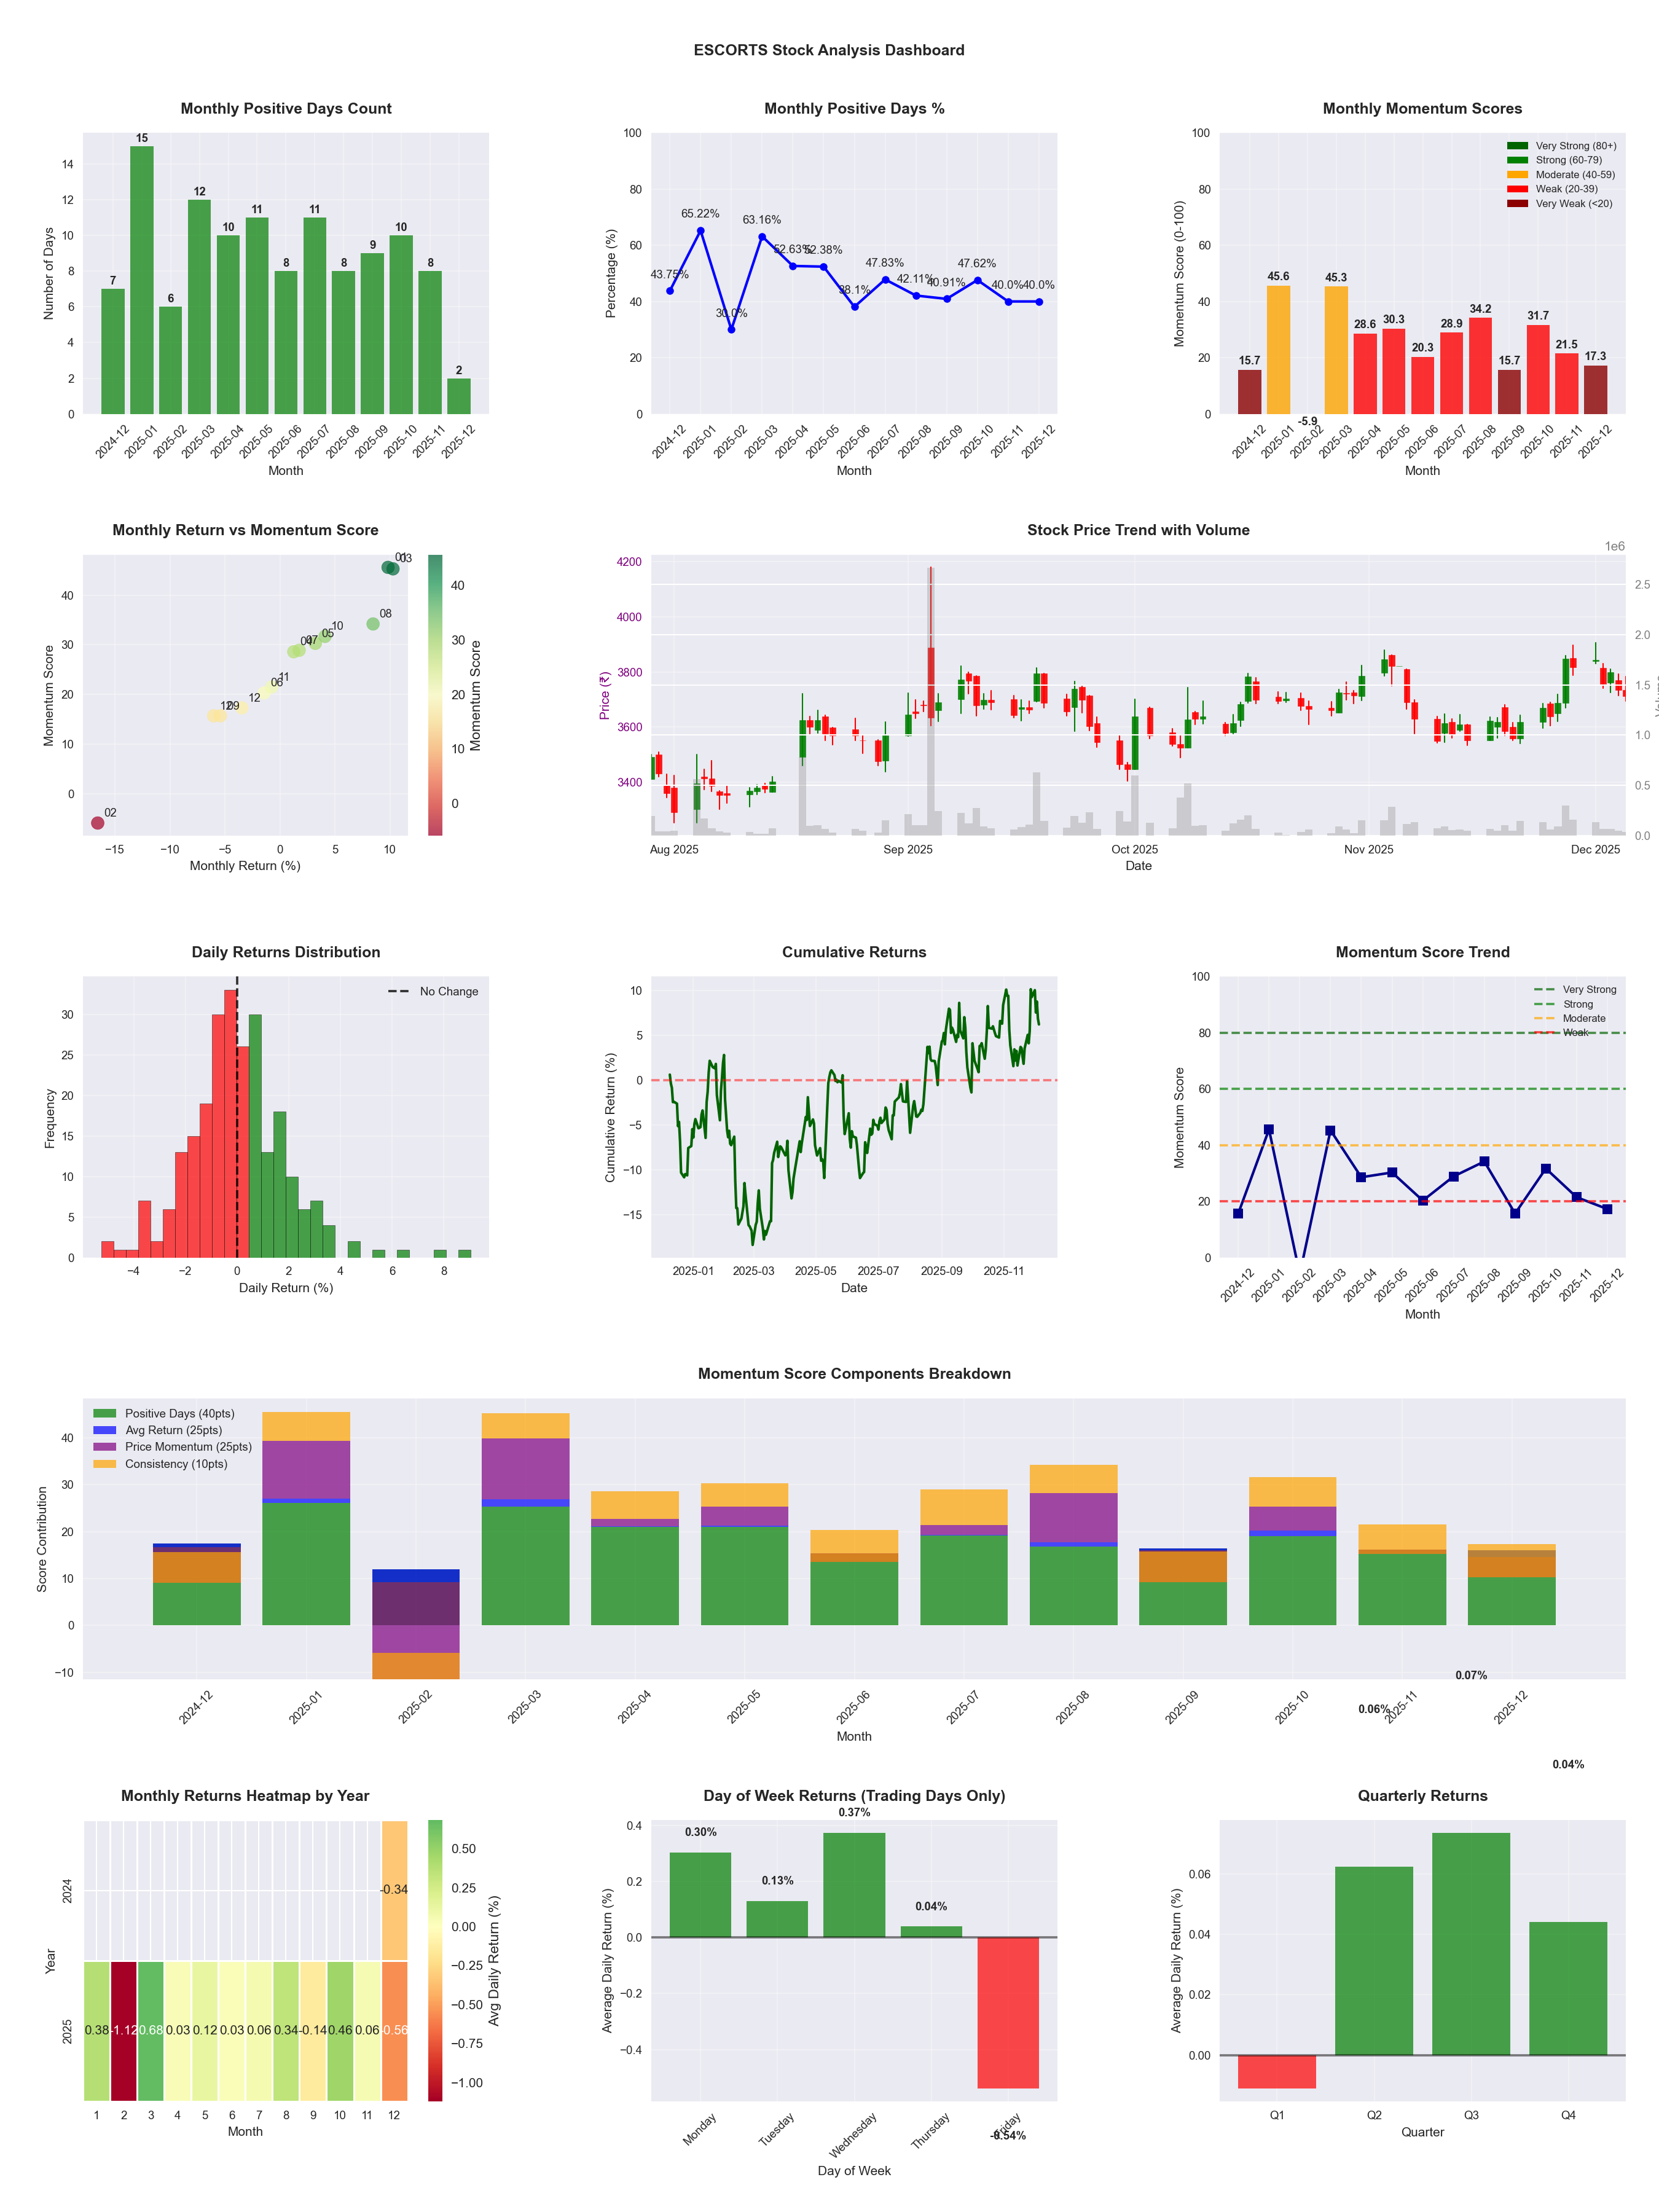
Symbol
📈 ESCORTS
Date
📅 2026-04-11
Volatility
🟡 2.04%
Risk Profile
⚠️ suitable for aggressive investors
Win Rate
⚠️ 43.9%
Avg Daily Return
📈 +0.03%
Max Drawdown
📉 -30.49%
IBD RS Score
📊 40.0
Weak
Market Rank
#296
Best Month
🏆 2026-04
Best Months to Trade
📅 Apr, Oct, Aug
Best Days to Trade
📅 Tuesday, Monday
📊 Key Insights & Metrics
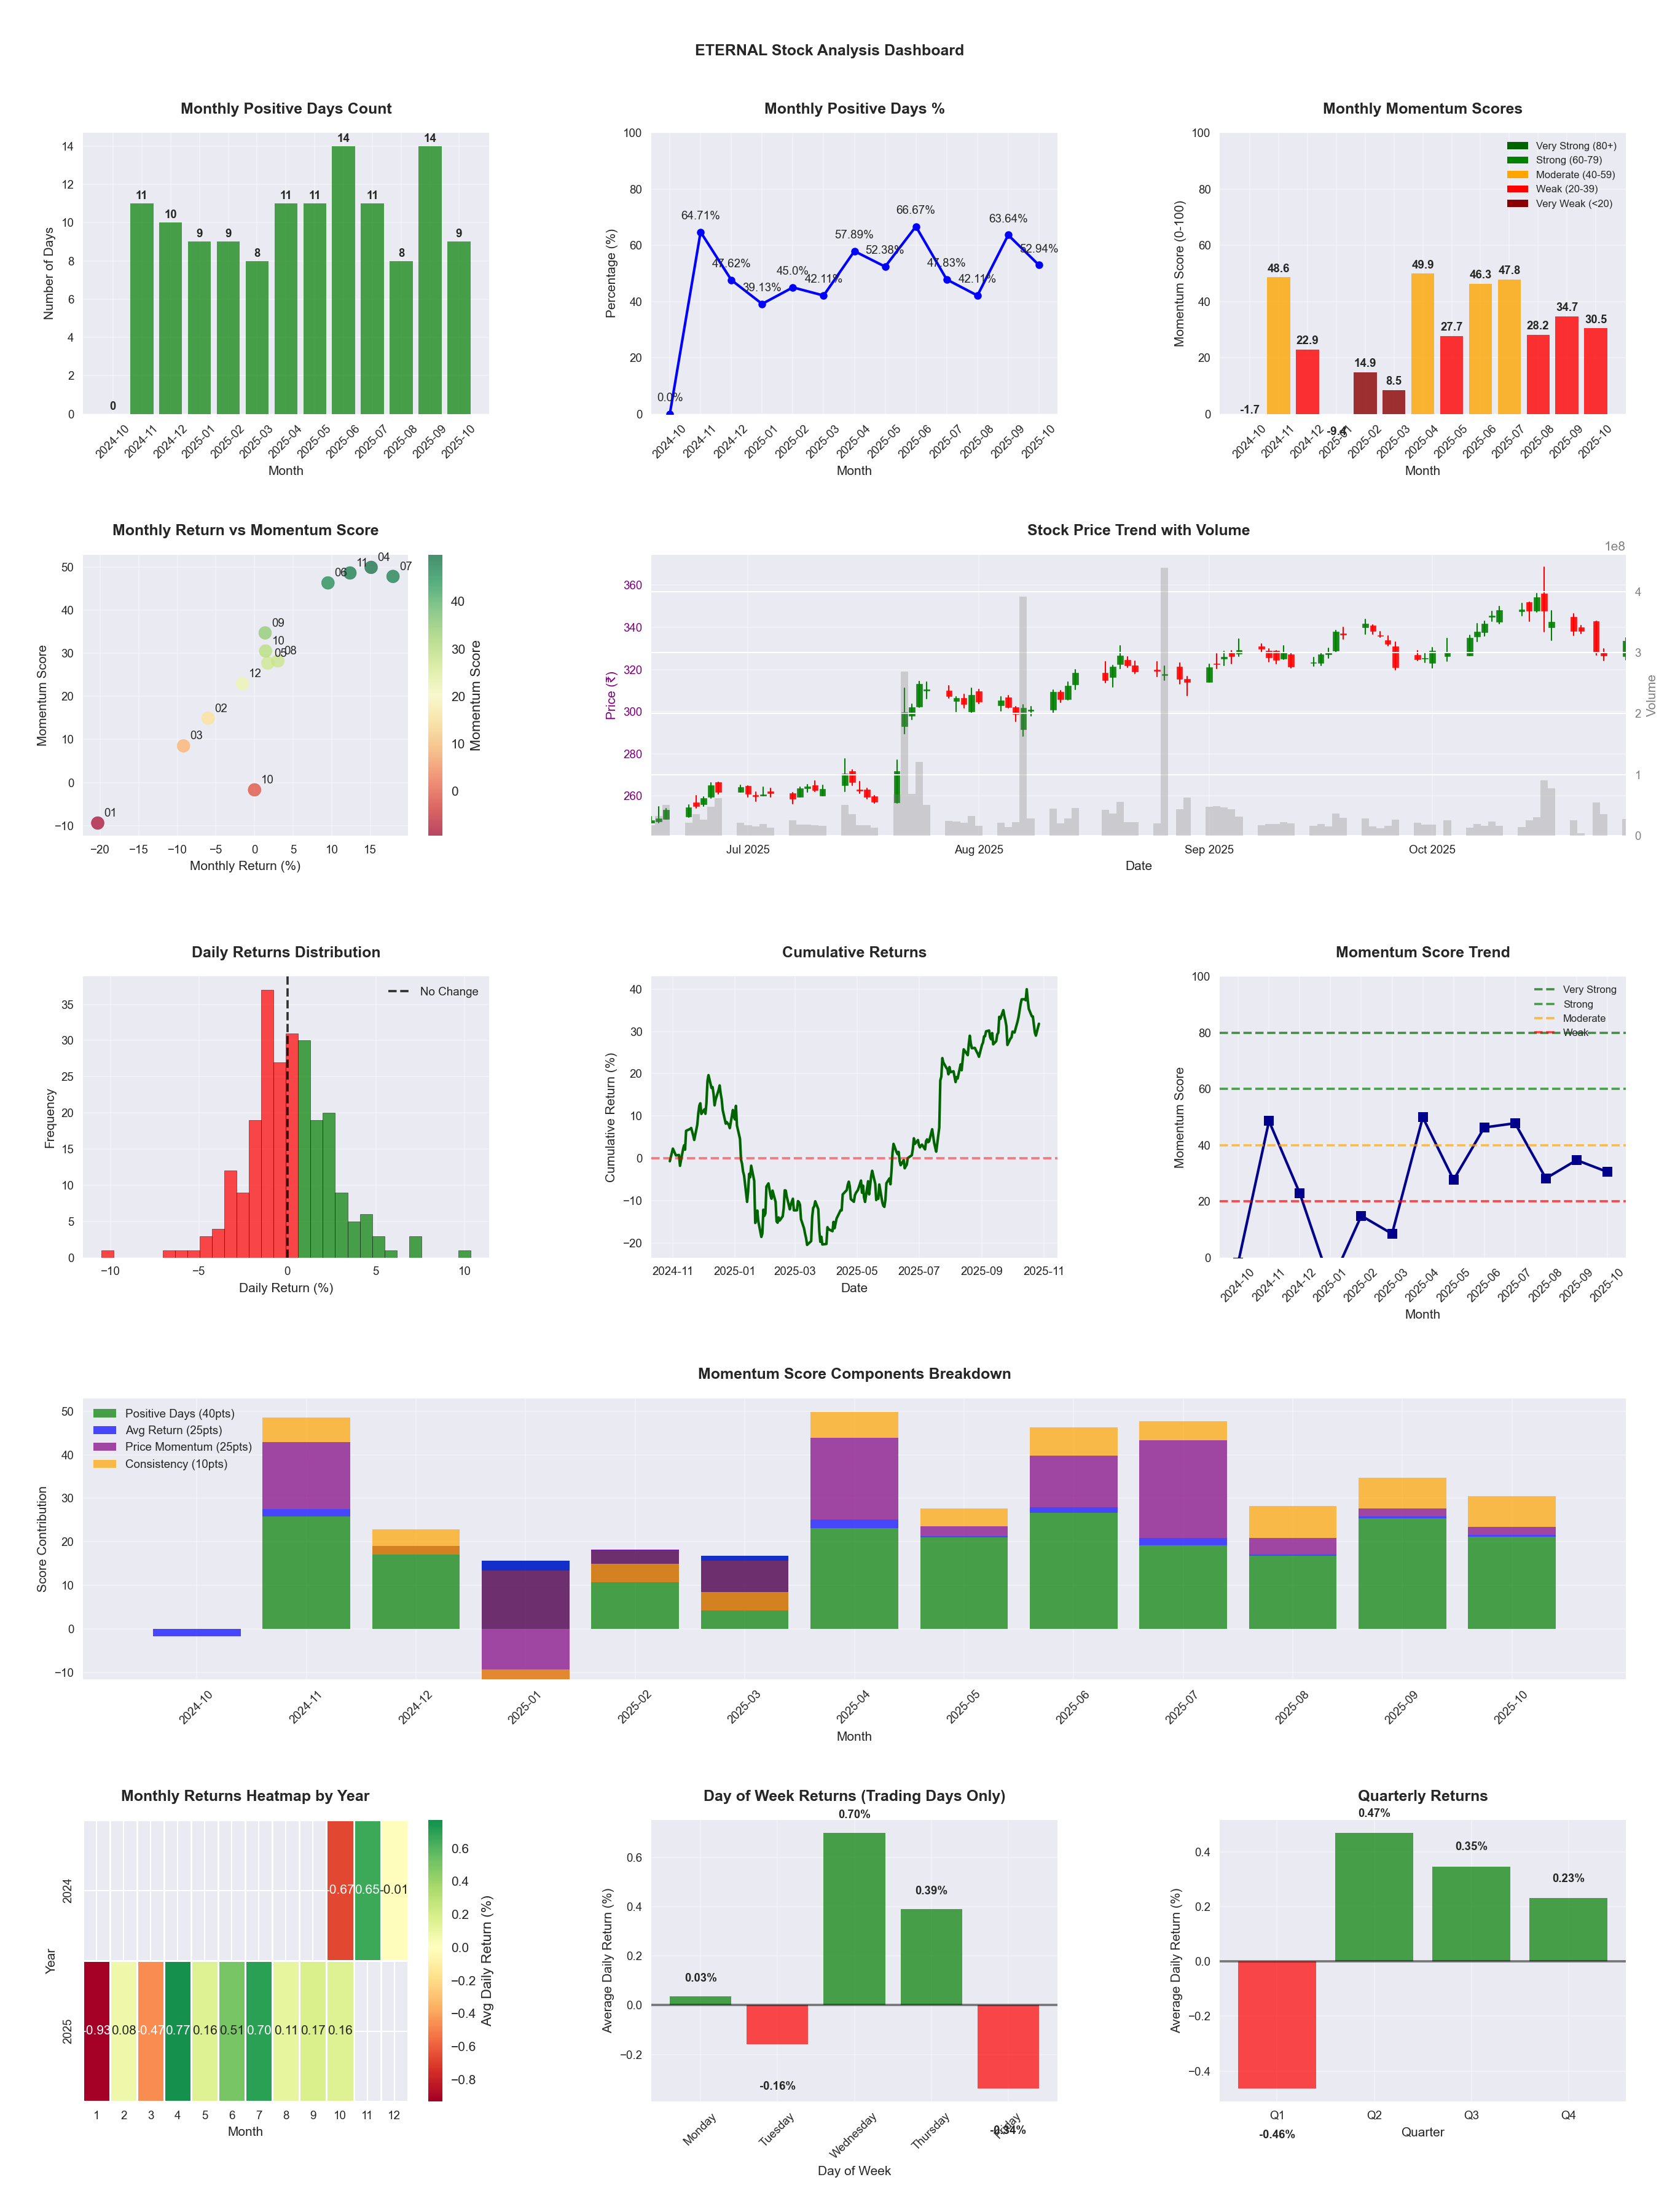
Symbol
📈 ETERNAL
Date
📅 2026-04-11
Volatility
🟡 2.22%
Risk Profile
⚠️ suitable for aggressive investors
Win Rate
⚠️ 49.8%
Avg Daily Return
📈 +0.07%
Max Drawdown
📉 -39.13%
IBD RS Score
📊 31.2
Weak
Market Rank
#339
Best Month
🏆 2025-07
Worst Month
📉 2026-02
Best Months to Trade
📅 Jul, Apr, Jun
Best Days to Trade
📅 Wednesday, Monday
📊 Key Insights & Metrics
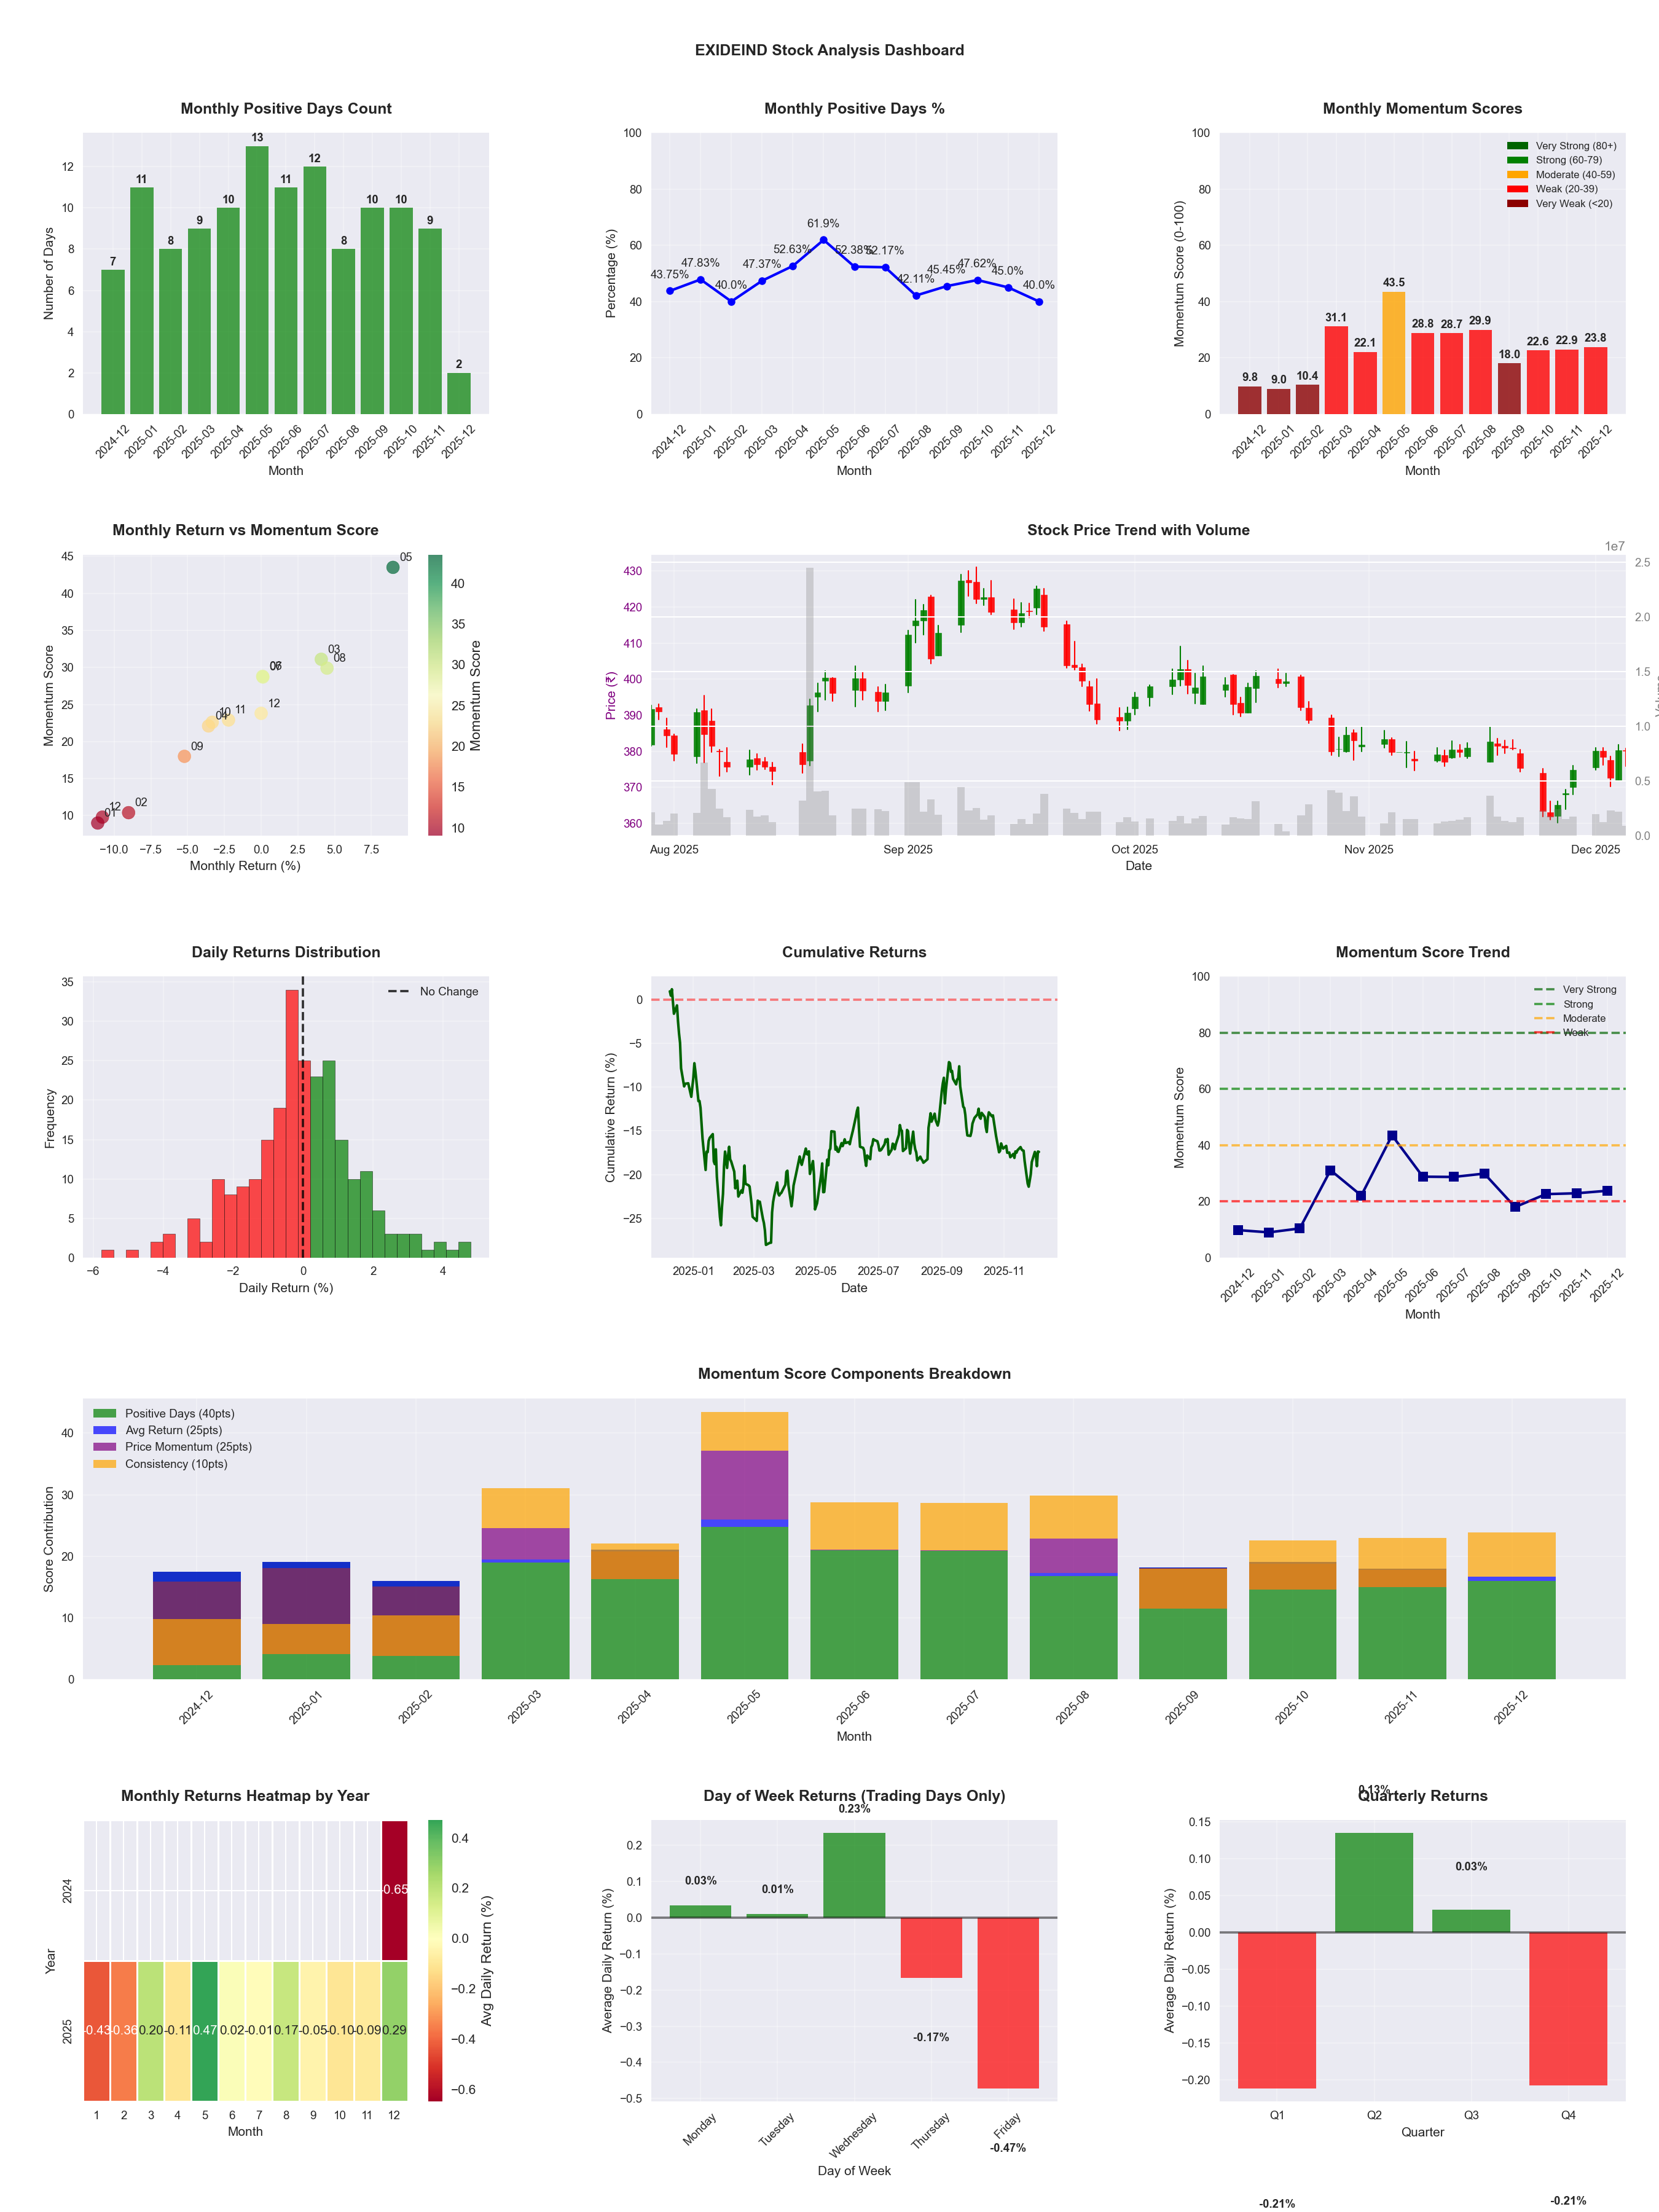
Symbol
📈 EXIDEIND
Date
📅 2026-04-11
Volatility
🟡 1.62%
Win Rate
⚠️ 45.1%
Avg Daily Return
📉 -0.04%
Max Drawdown
📉 -32.63%
IBD RS Score
📊 32.9
Weak
Market Rank
#331
Best Month
🏆 2025-05
Worst Month
📉 2026-01
Best Months to Trade
📅 May, Apr, Feb
Best Days to Trade
📅 Monday, Wednesday
📊 Key Insights & Metrics
Symbol
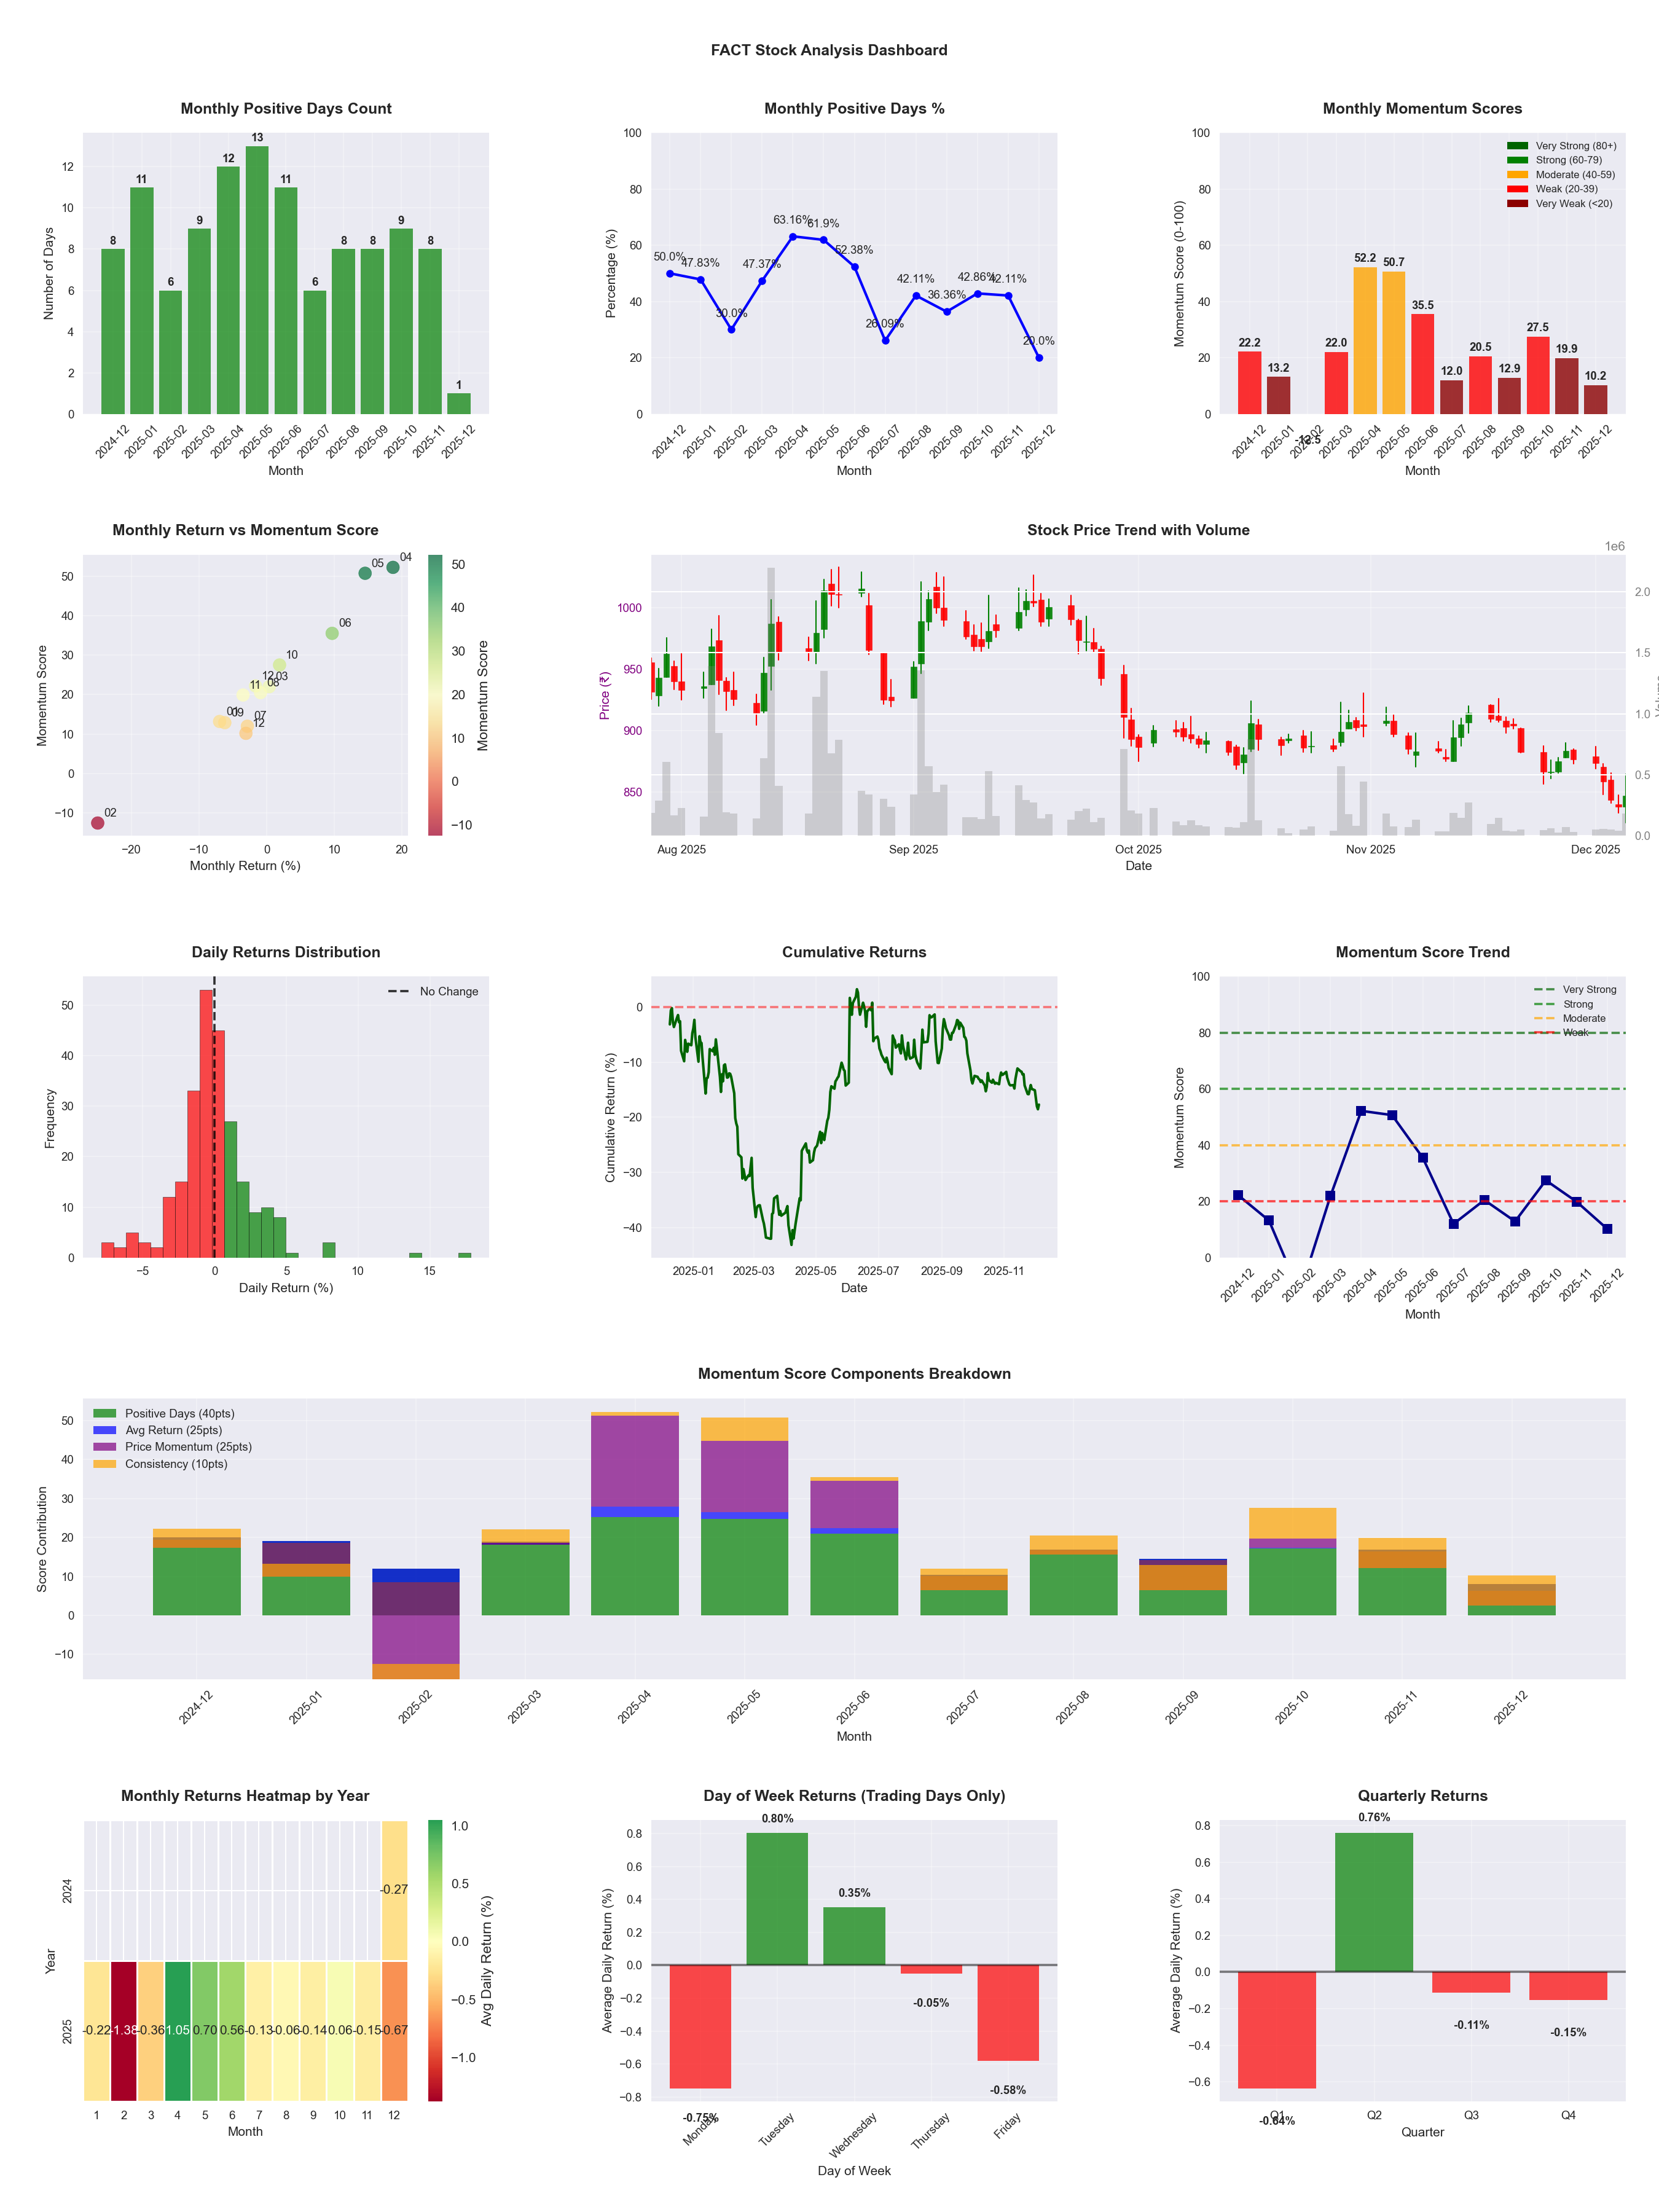
📈 FACT
Date
📅 2026-04-11
Volatility
🟡 2.97%
Risk Profile
⚠️ suitable for aggressive investors
Win Rate
⚠️ 44.7%
Avg Daily Return
📈 +0.17%
Max Drawdown
📉 -37.69%
IBD RS Score
📊 62.5
Average
Market Rank
#185
Best Month
🏆 2025-05
Worst Month
📉 2026-01
Best Months to Trade
📅 Apr, May, Jun
Best Days to Trade
📅 Tuesday, Wednesday
📊 Key Insights & Metrics
Symbol
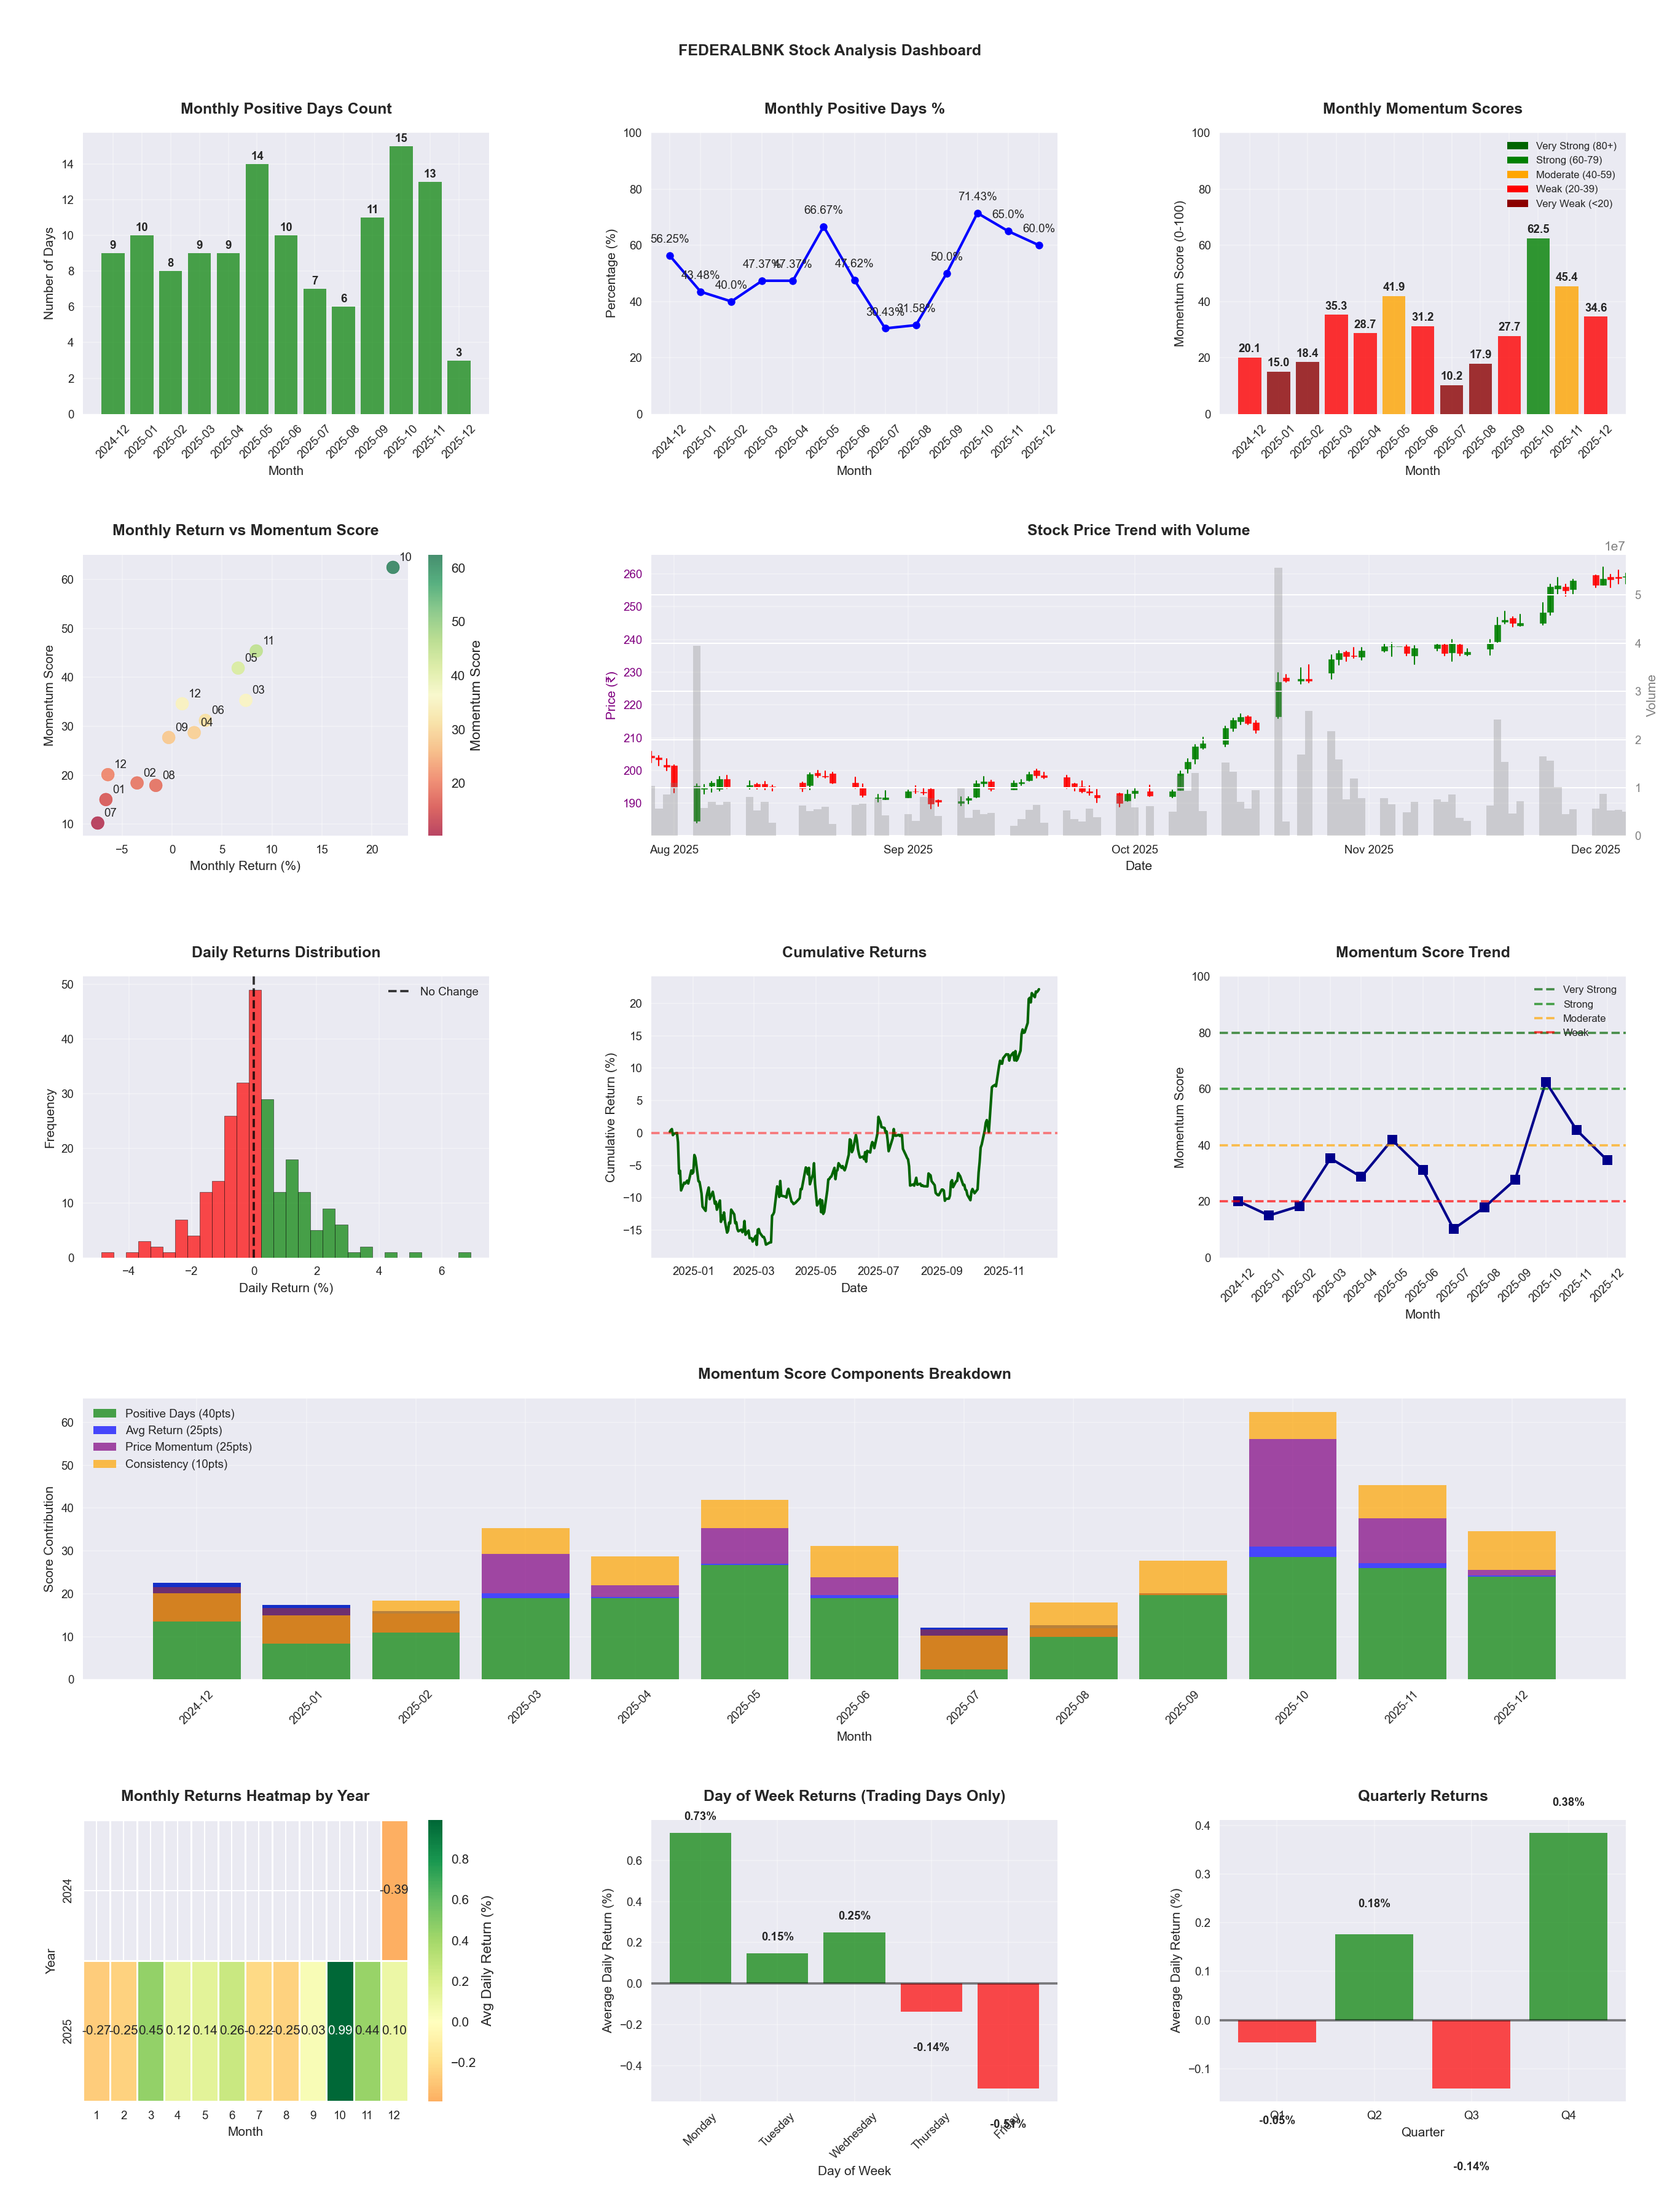
📈 FEDERALBNK
Date
📅 2026-04-11
Volatility
🟡 1.62%
Win Rate
⚠️ 52.9%
Avg Daily Return
📈 +0.19%
Max Drawdown
📉 -15.17%
IBD RS Score
📊 94.9
Leader
Market Rank
#25
Best Month
🏆 2025-10
Worst Month
📉 2026-03
Best Months to Trade
📅 Oct, Apr, Nov
Best Days to Trade
📅 Monday, Wednesday
📊 Key Insights & Metrics
Symbol
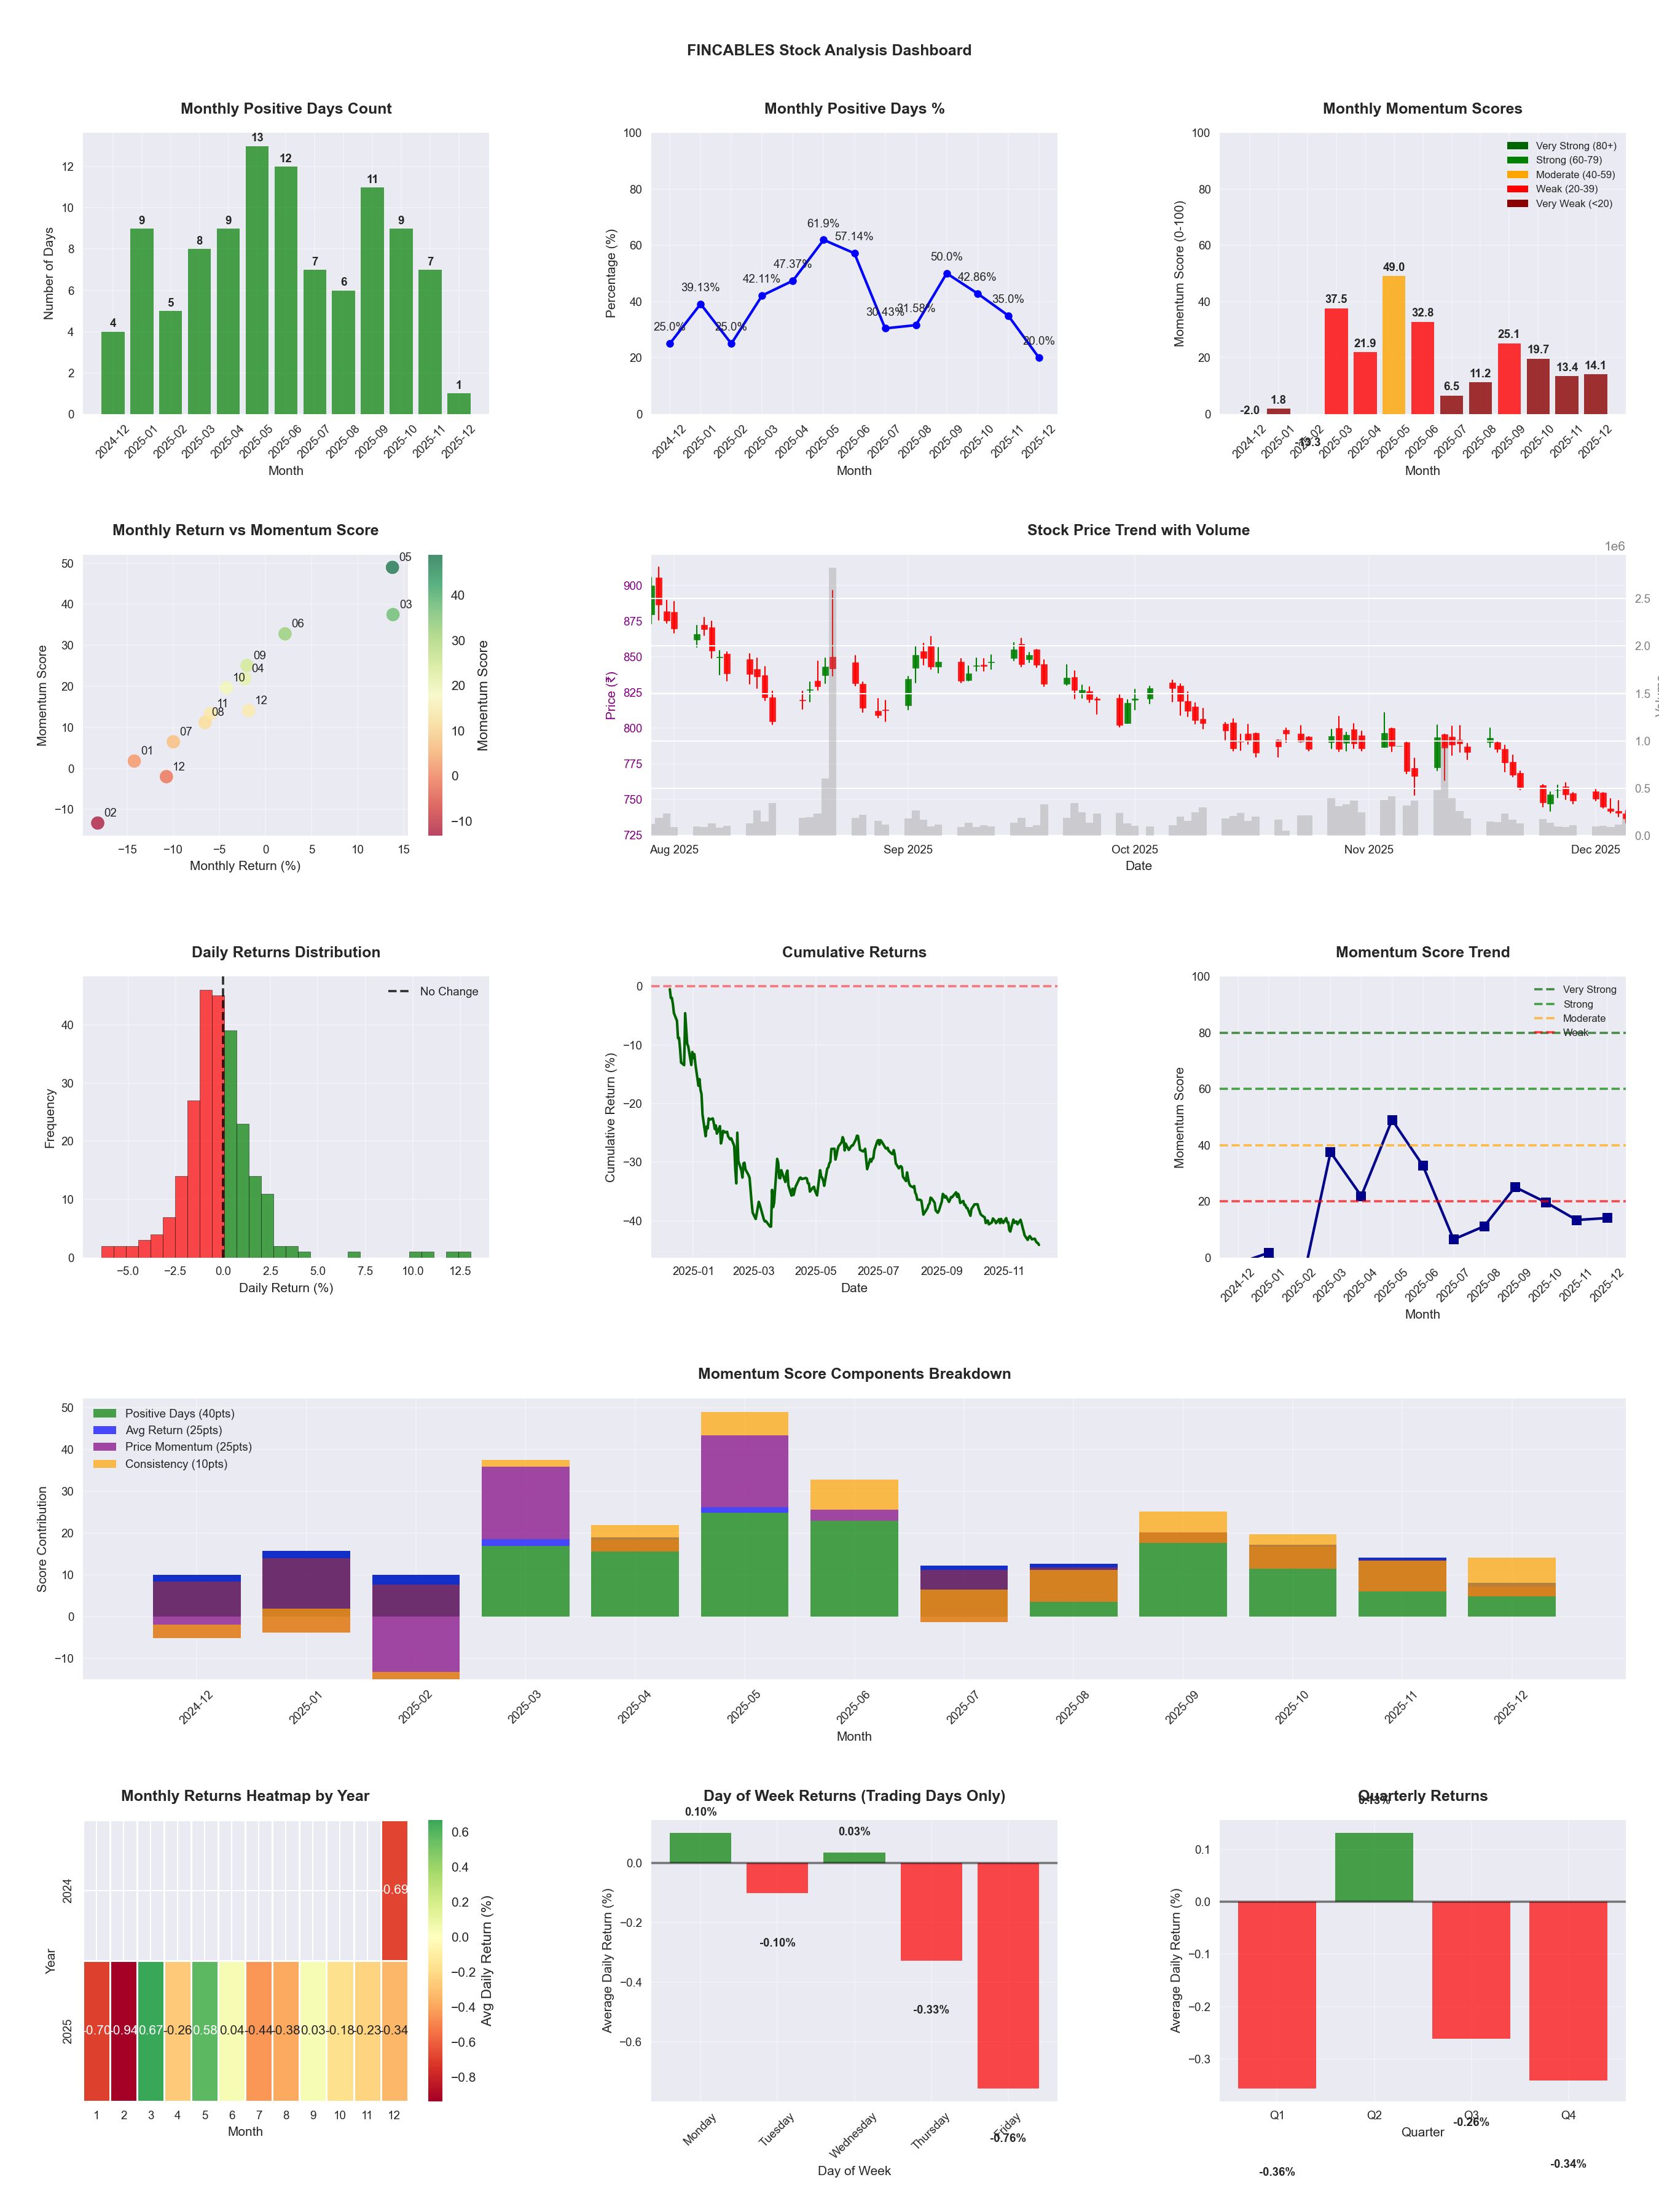
📈 FINCABLES
Date
📅 2026-04-11
Volatility
🟡 1.87%
Win Rate
⚠️ 47.1%
Avg Daily Return
📈 +0.01%
Max Drawdown
📉 -27.64%
IBD RS Score
📊 67.3
Average
Market Rank
#161
Best Month
🏆 2026-02
Best Months to Trade
📅 Feb, May, Apr
Best Days to Trade
📅 Monday, Wednesday
📊 Key Insights & Metrics
Symbol
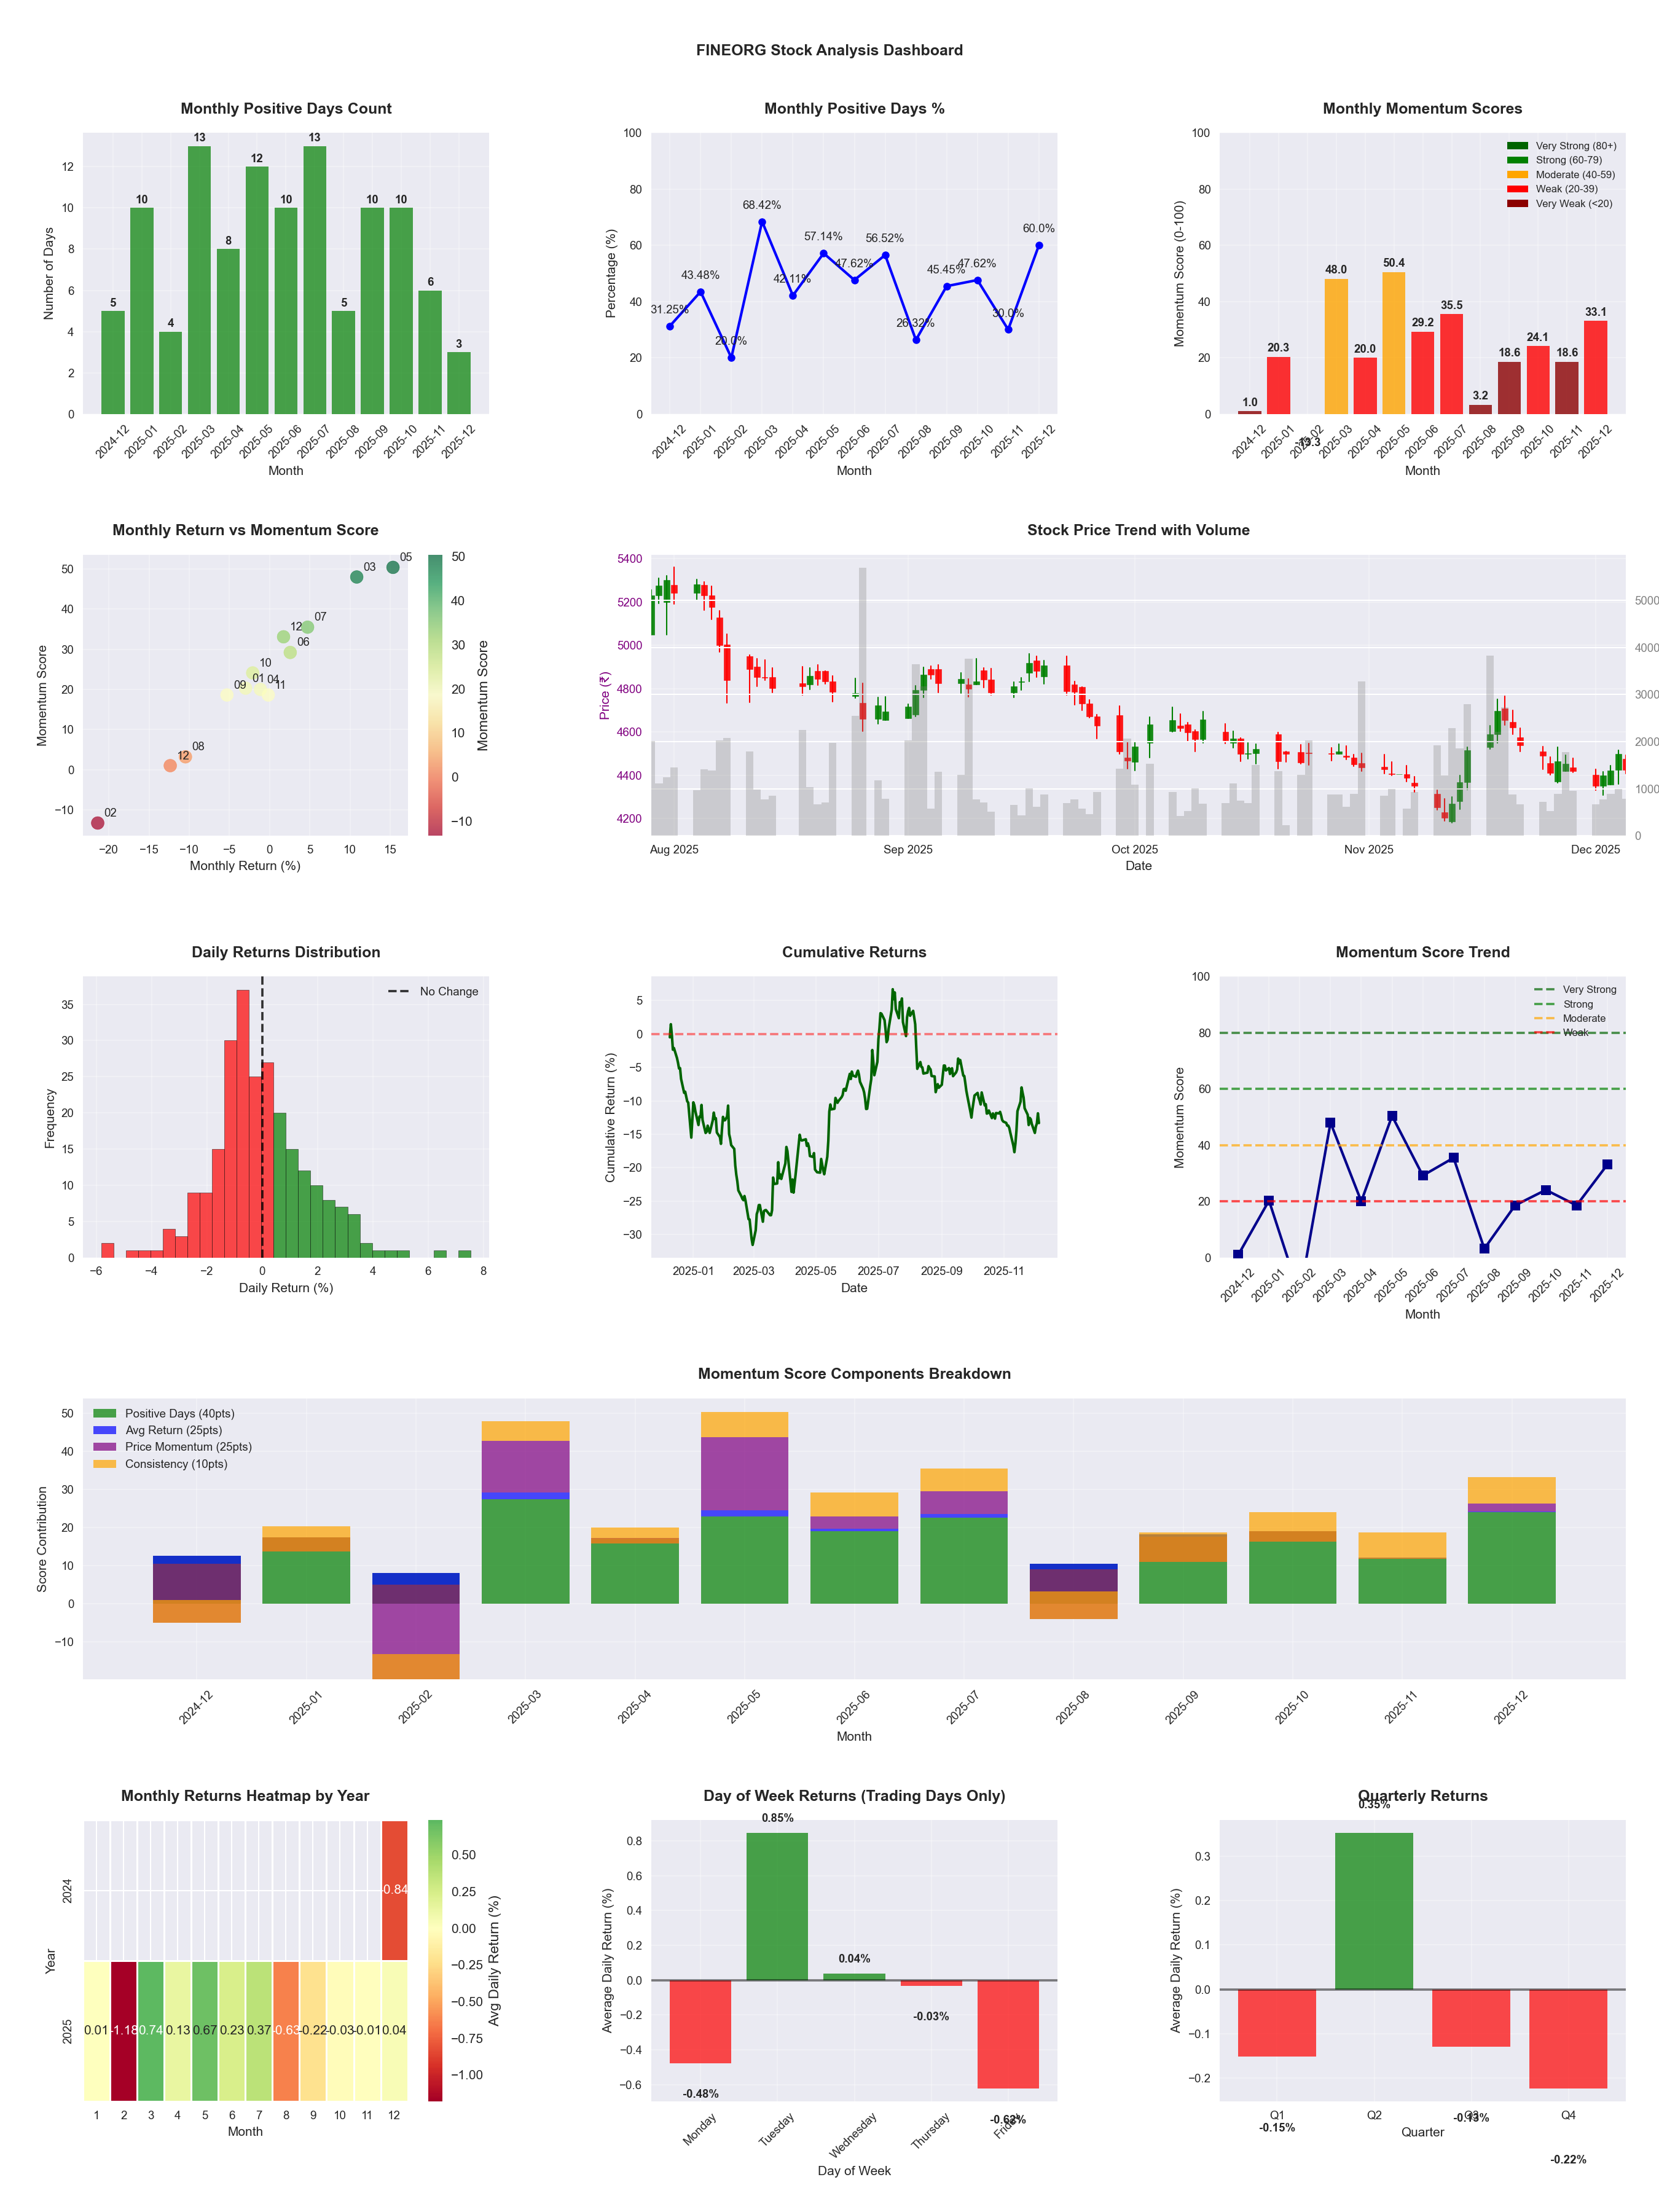
📈 FINEORG
Date
📅 2026-03-21
Volatility
🟡 1.84%
Win Rate
⚠️ 43.3%
Avg Daily Return
📈 +0.05%
Max Drawdown
📉 -28.62%
Best Month
🏆 2025-05
Worst Month
📉 2025-08
Best Months to Trade
📅 May, Feb, Jul
Best Days to Trade
📅 Tuesday, Wednesday
📊 Key Insights & Metrics
Symbol
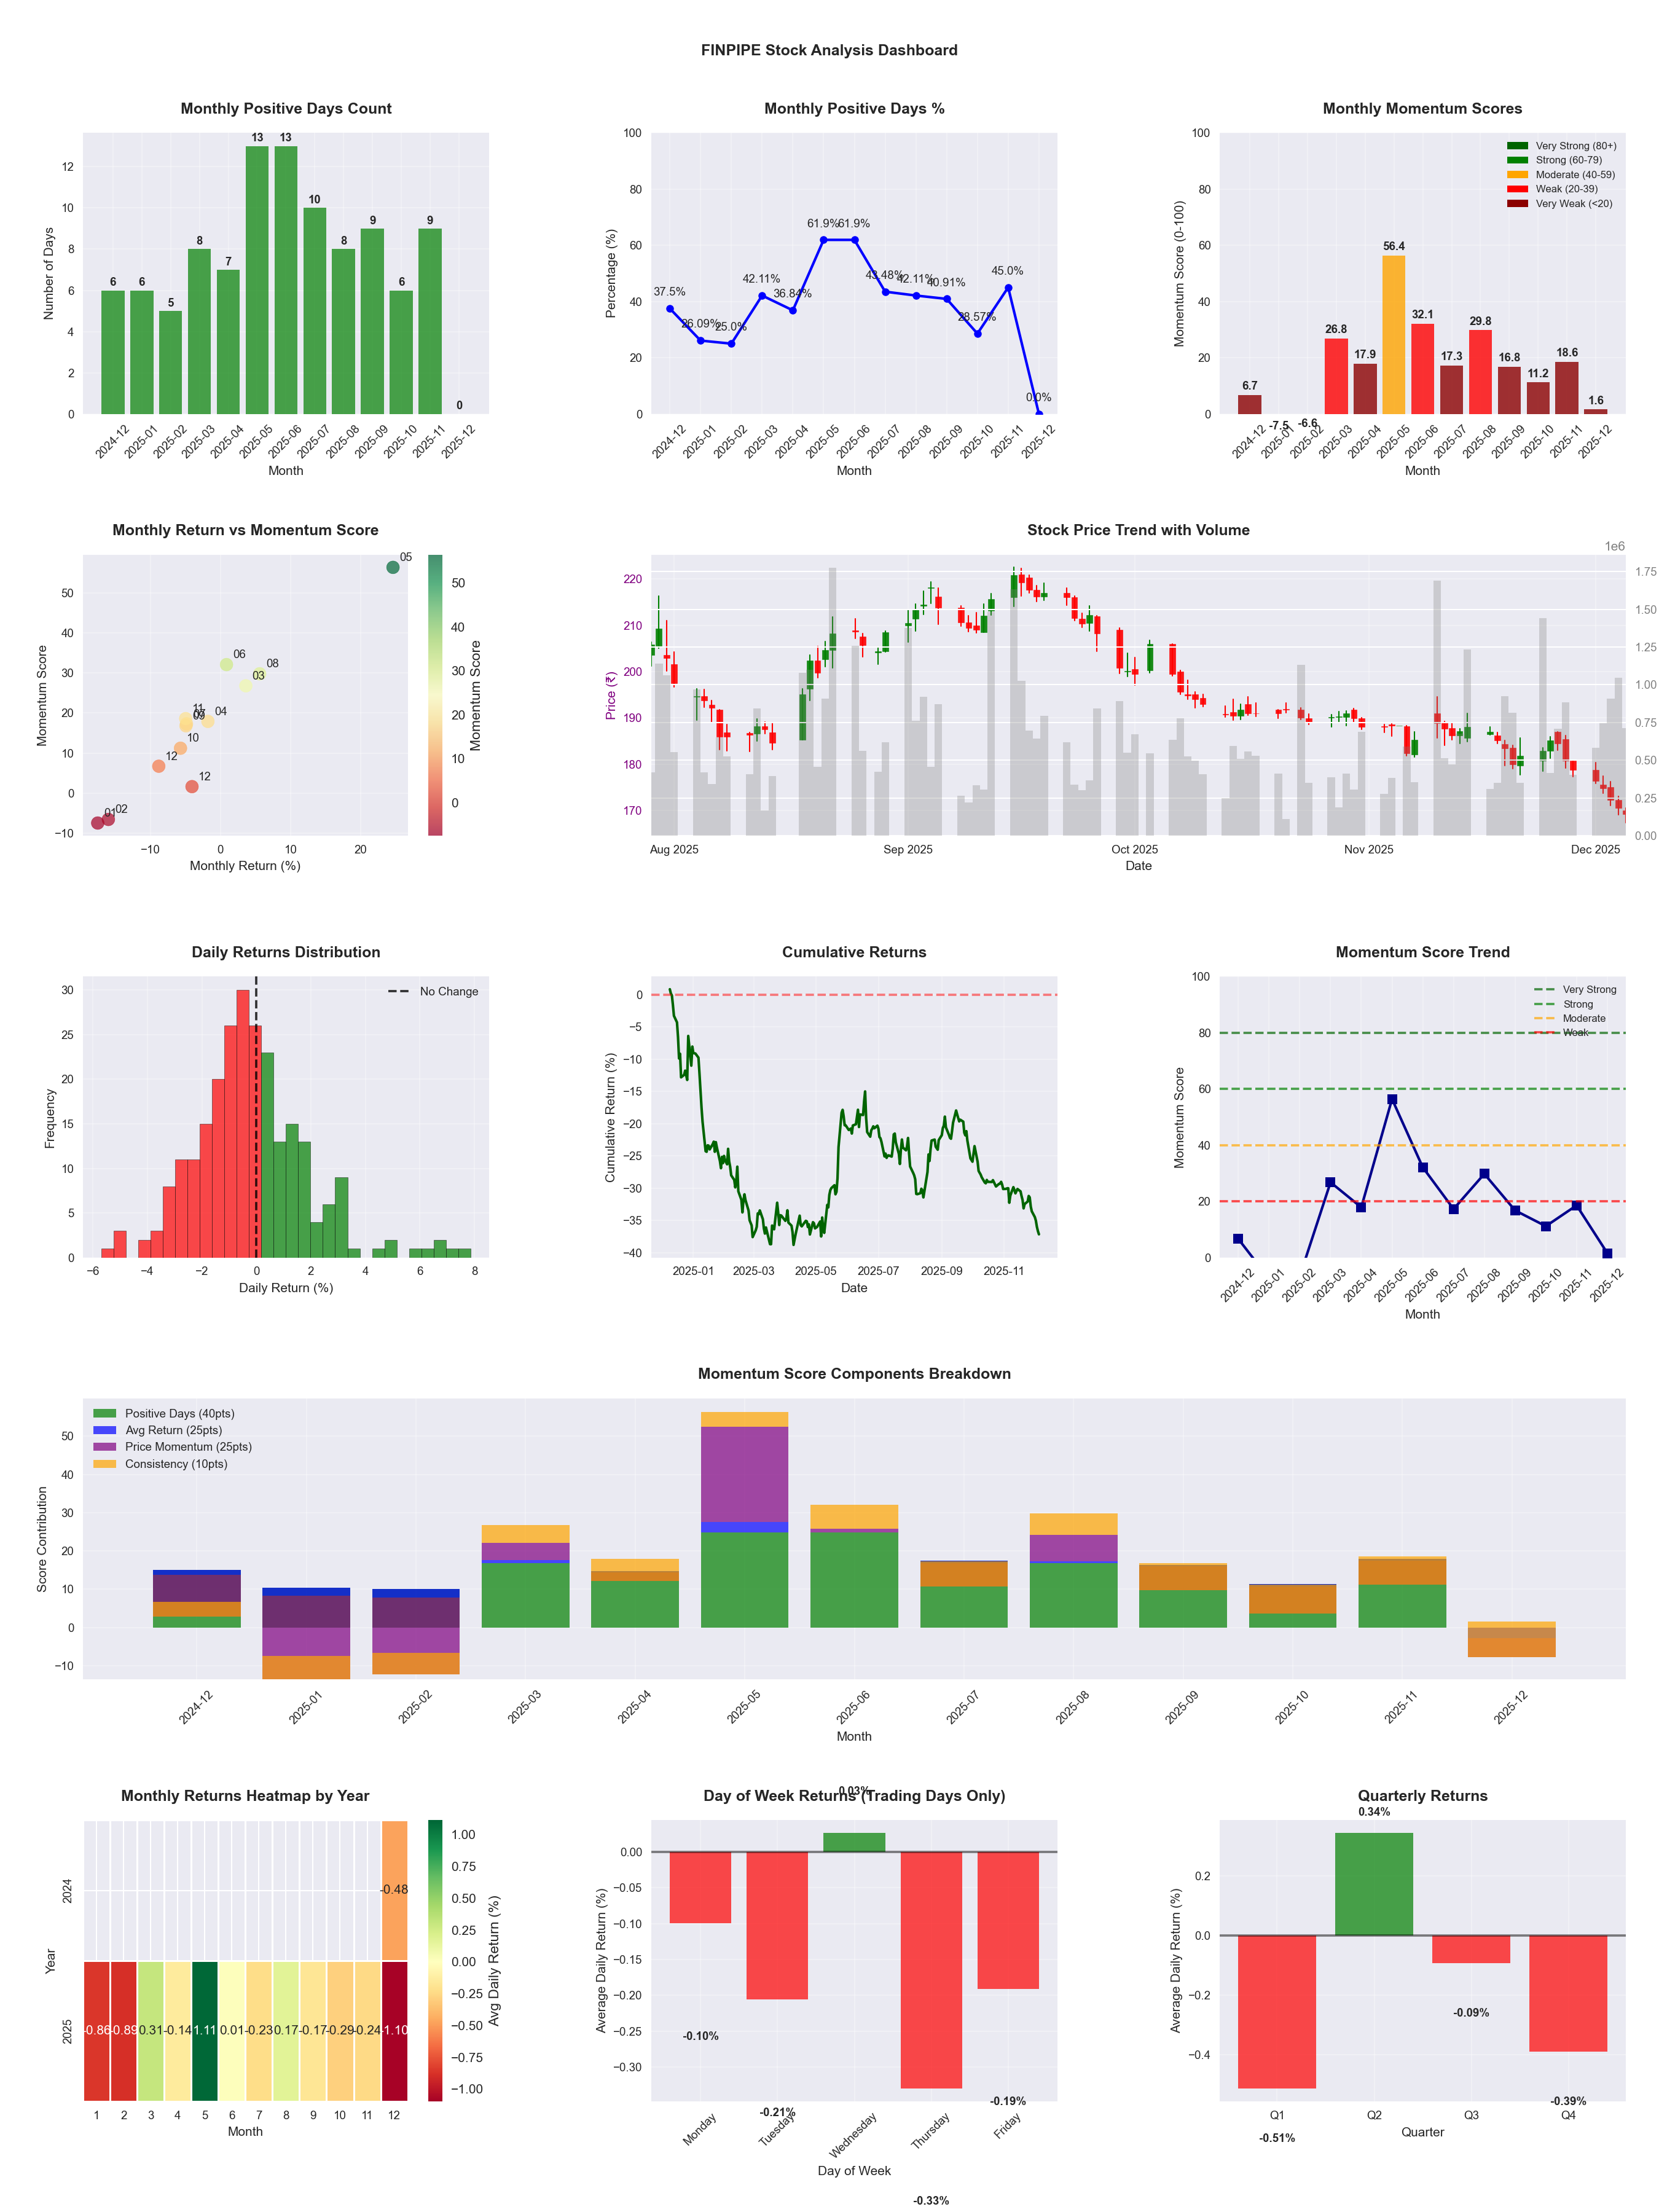
📈 FINPIPE
Date
📅 2026-04-11
Volatility
🟡 1.93%
Win Rate
⚠️ 48.2%
Avg Daily Return
📈 +0.01%
Max Drawdown
📉 -34.43%
IBD RS Score
📊 36.9
Weak
Market Rank
#311
Best Month
🏆 2025-05
Best Months to Trade
📅 May, Apr, Feb
Best Days to Trade
📅 Wednesday, Friday
📊 Key Insights & Metrics
Symbol
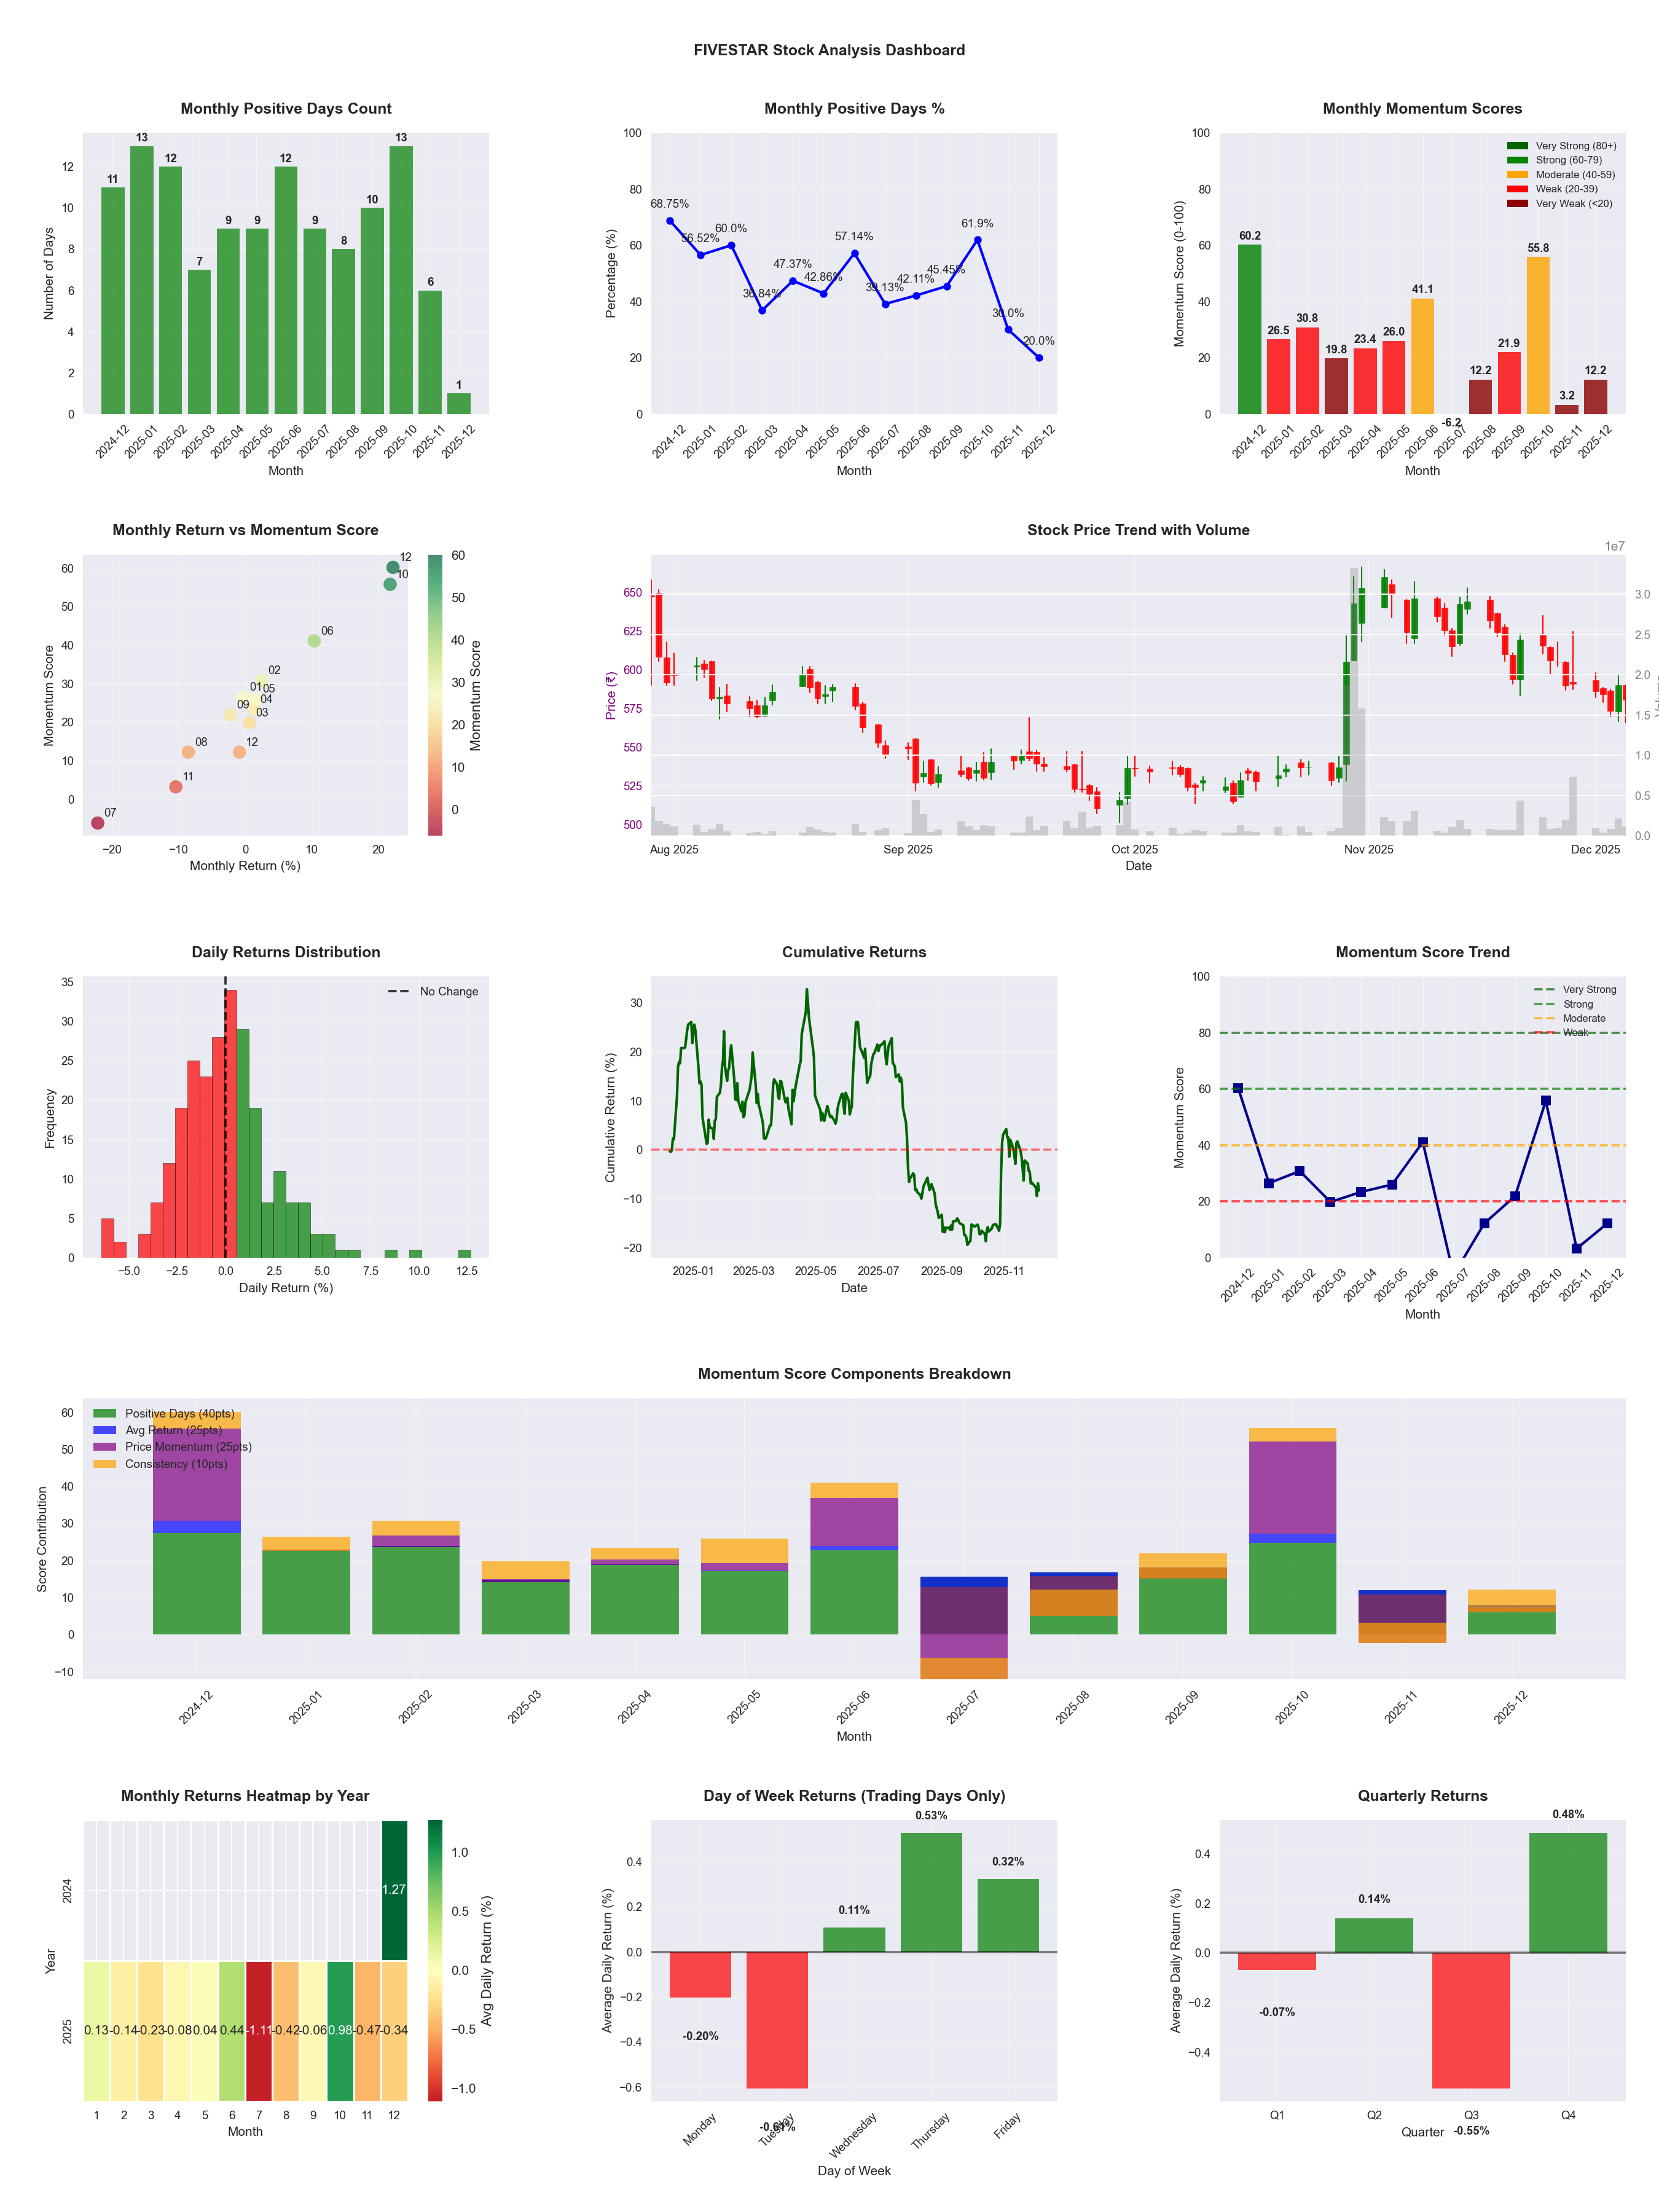
📈 FIVESTAR
Date
📅 2026-04-11
Volatility
🟡 2.52%
Risk Profile
⚠️ suitable for aggressive investors
Win Rate
⚠️ 43.1%
Avg Daily Return
📉 -0.18%
Max Drawdown
📉 -58.69%
IBD RS Score
📊 5.1
Weak
Market Rank
#468
Best Month
🏆 2026-04
Best Months to Trade
📅 Apr, Oct, Jun
Best Days to Trade
📅 Wednesday, Tuesday
📊 Key Insights & Metrics
Symbol
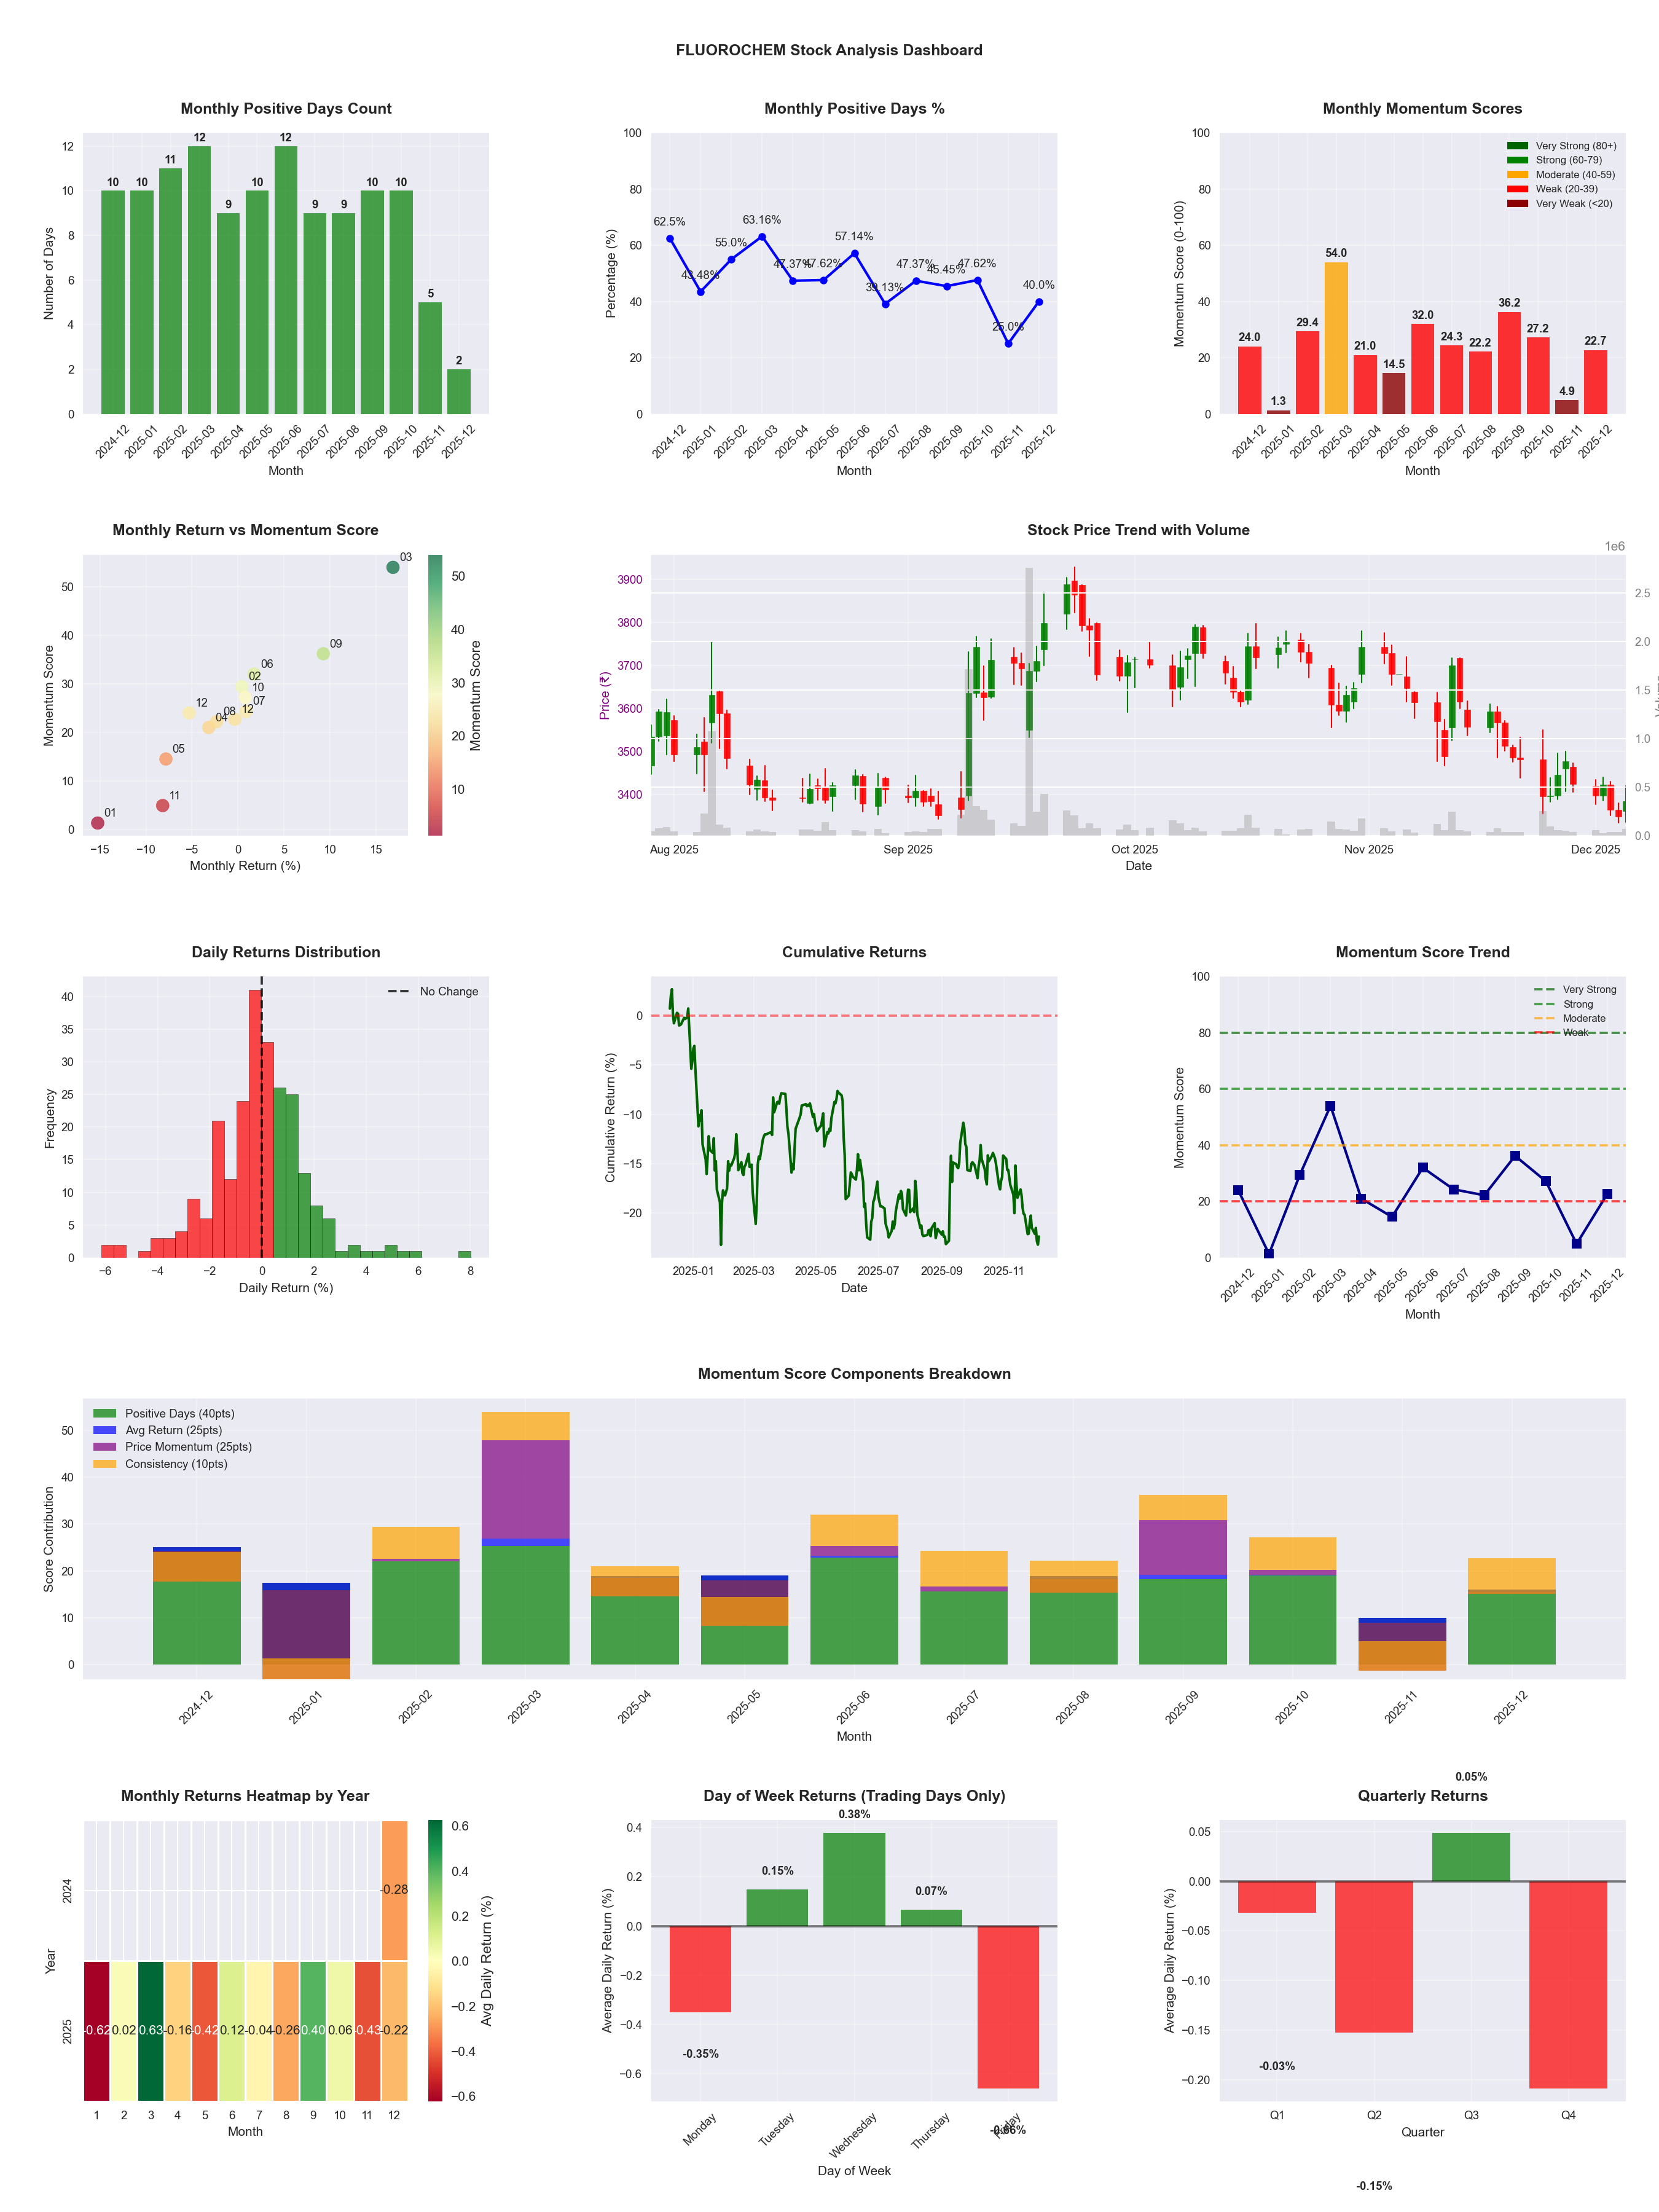
📈 FLUOROCHEM
Date
📅 2026-04-11
Volatility
🟡 1.85%
Win Rate
⚠️ 48.0%
Avg Daily Return
📉 -0.04%
Max Drawdown
📉 -26.04%
IBD RS Score
📊 46.7
Weak
Market Rank
#263
Best Month
🏆 2026-02
Best Months to Trade
📅 Feb, Apr, Sep
Best Days to Trade
📅 Wednesday, Tuesday
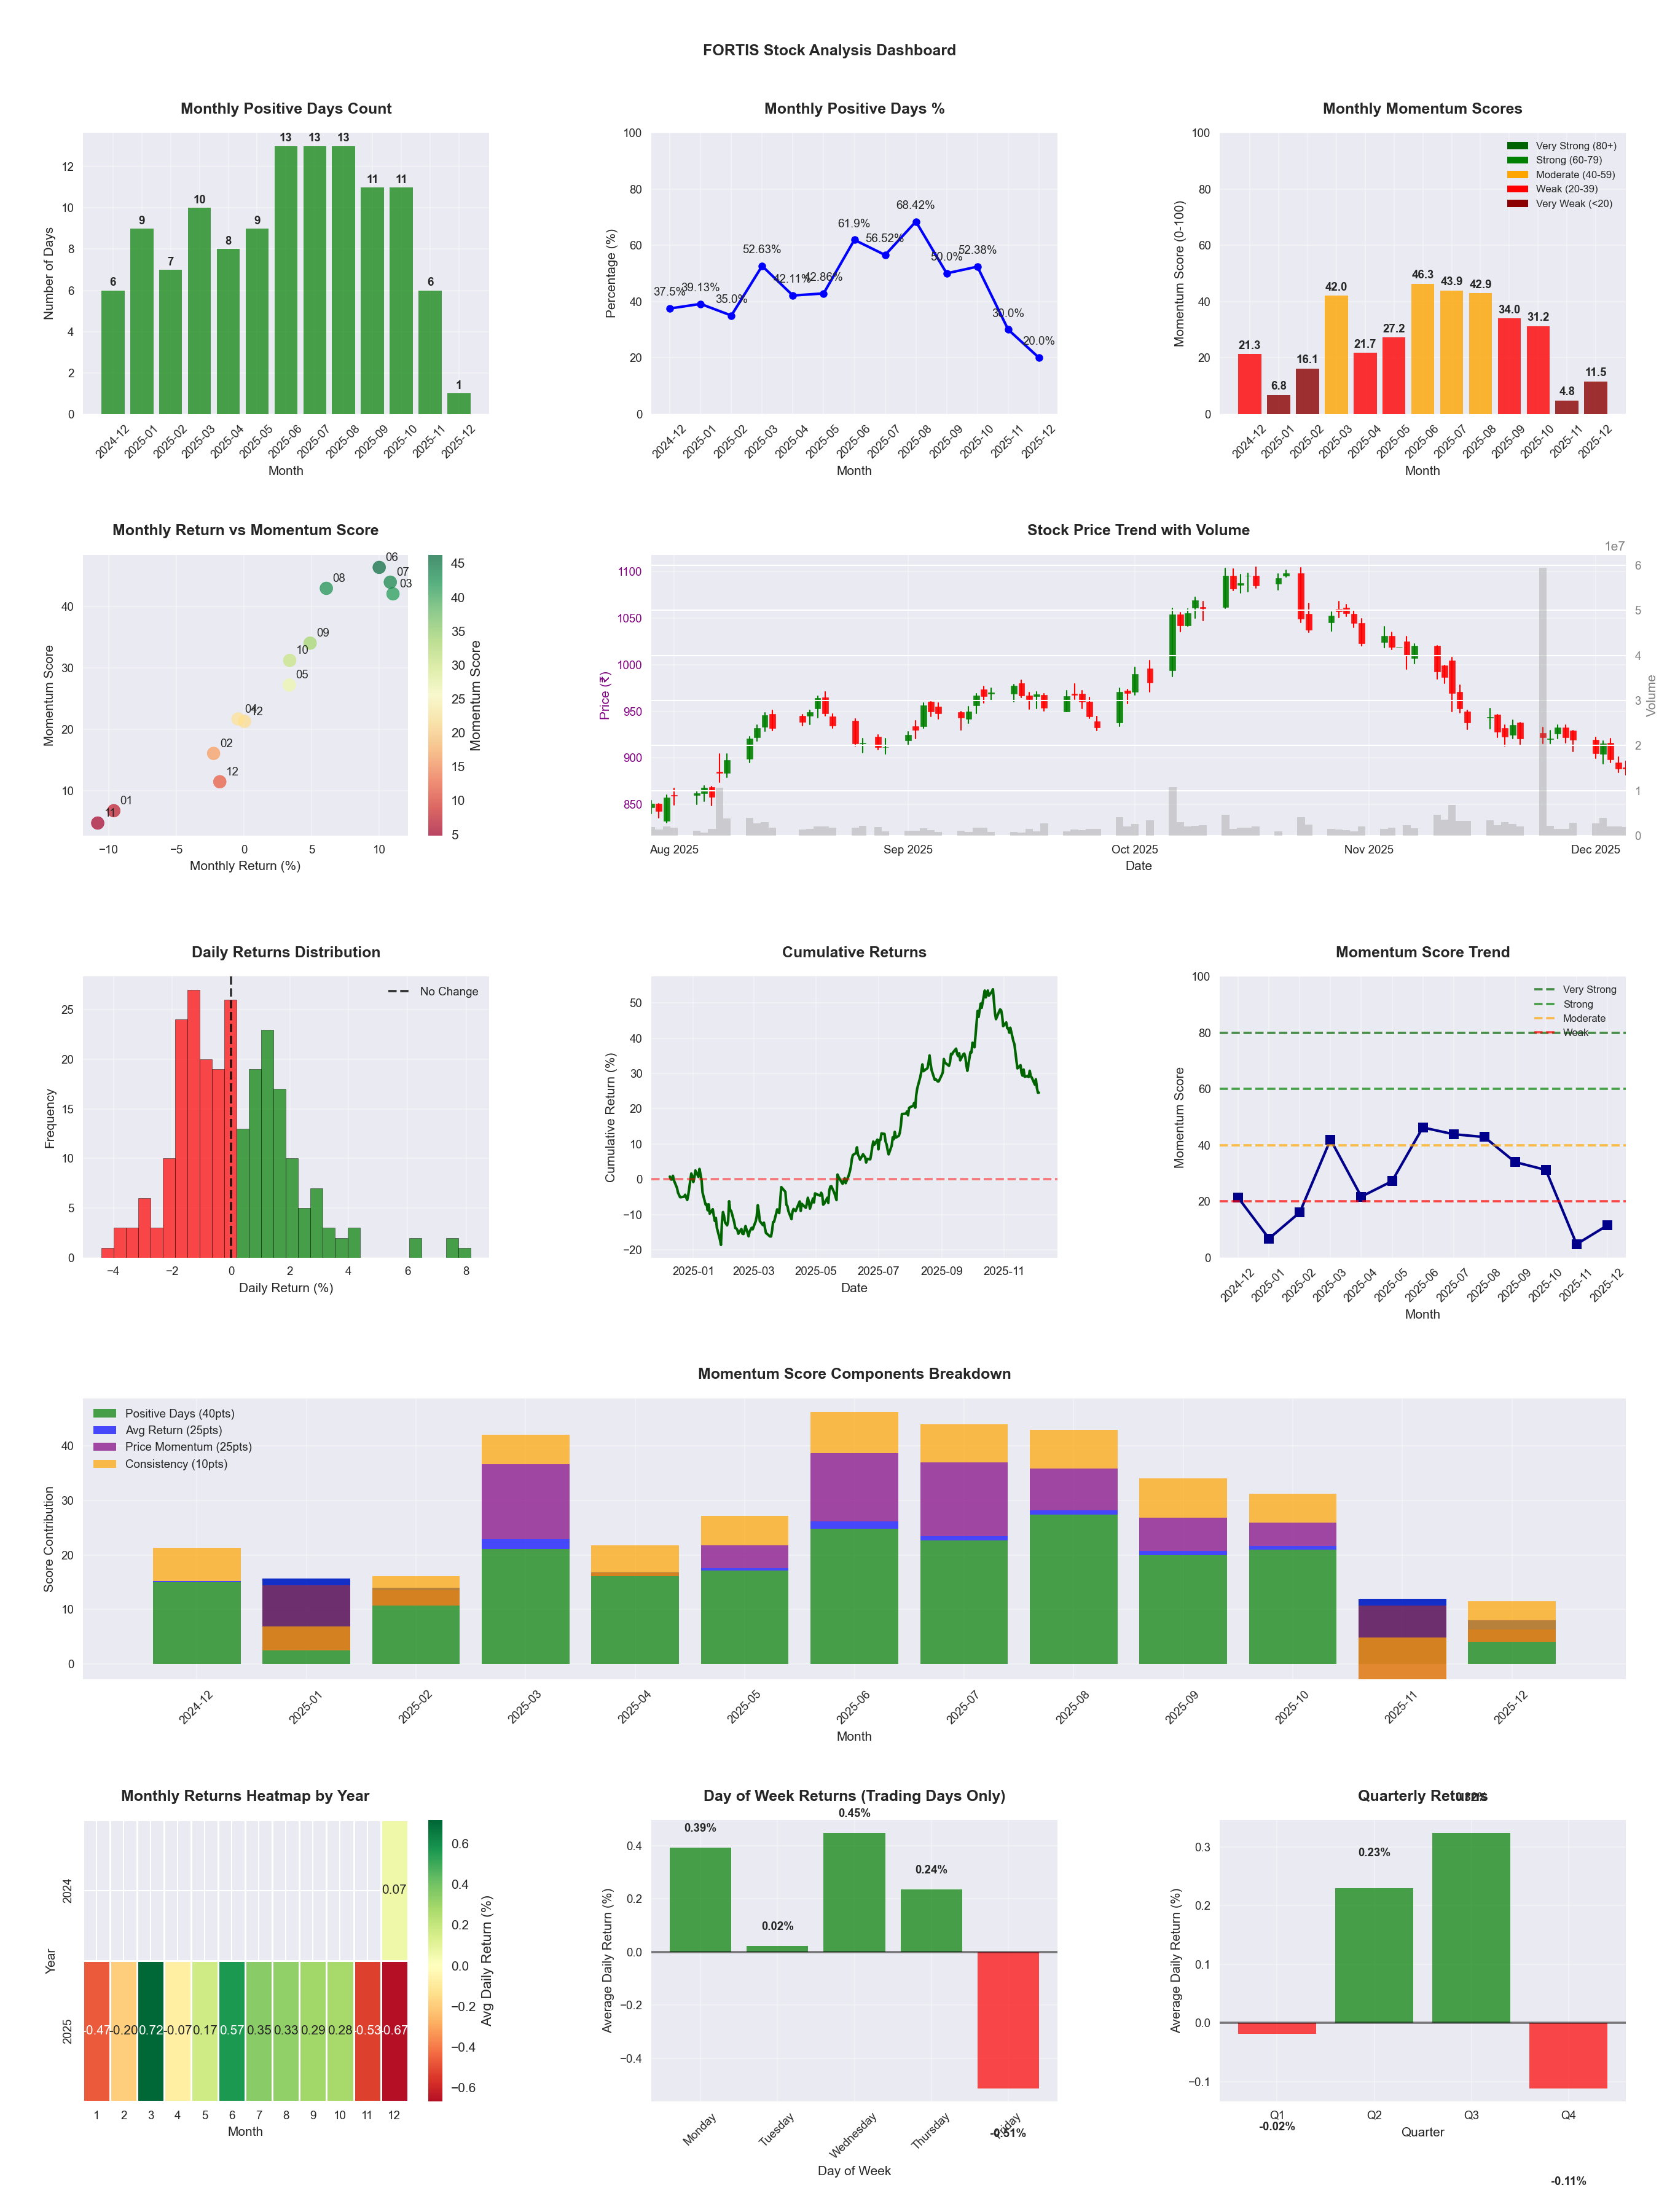
📊 Key Insights & Metrics
Symbol
📈 FORTIS
Date
📅 2026-04-11
Volatility
🟡 1.75%
Win Rate
⚠️ 48.8%
Avg Daily Return
📈 +0.12%
Max Drawdown
📉 -28.16%
IBD RS Score
📊 63.7
Average
Market Rank
#179
Best Month
🏆 2025-06
Best Months to Trade
📅 Apr, Jun, Feb
Best Days to Trade
📅 Wednesday, Monday
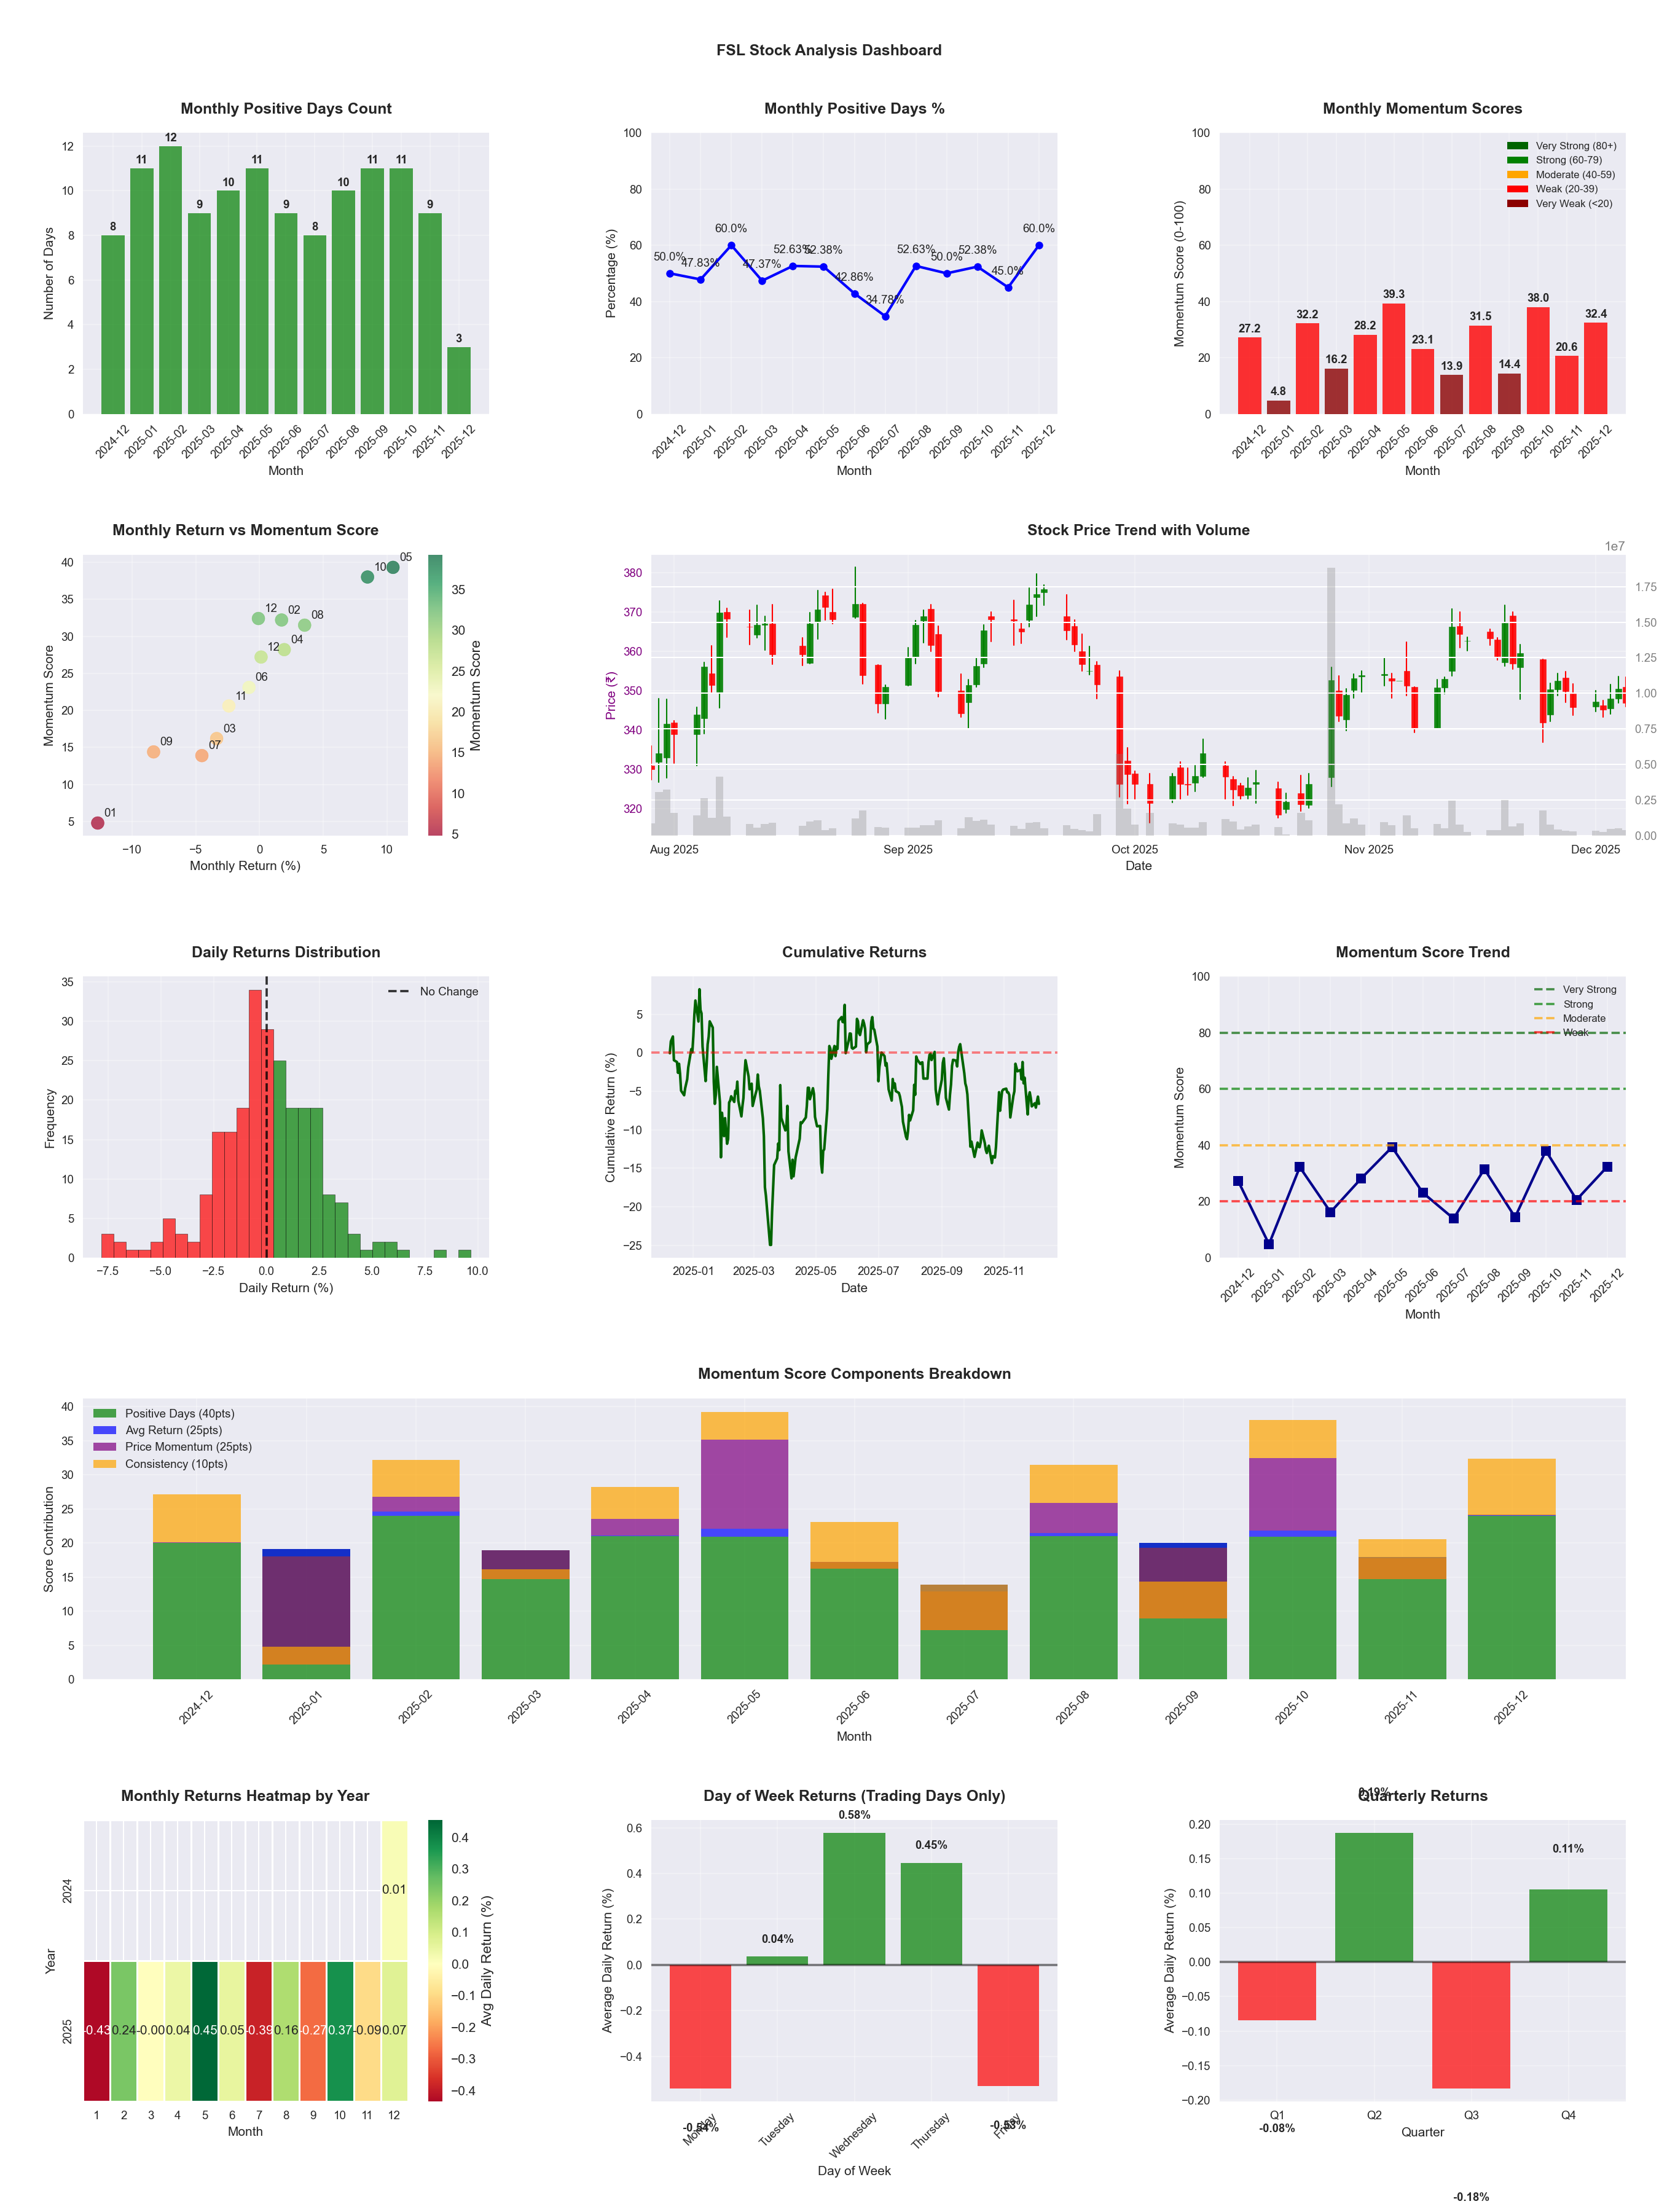
📊 Key Insights & Metrics
Symbol
📈 FSL
Date
📅 2026-04-11
Volatility
🟡 2.27%
Risk Profile
⚠️ suitable for aggressive investors
Win Rate
⚠️ 46.3%
Avg Daily Return
📉 -0.12%
Max Drawdown
📉 -47.09%
IBD RS Score
📊 2.8
Weak
Market Rank
#479
Best Month
🏆 2026-04
Best Months to Trade
📅 Apr, May, Oct
Best Days to Trade
📅 Wednesday, Tuesday
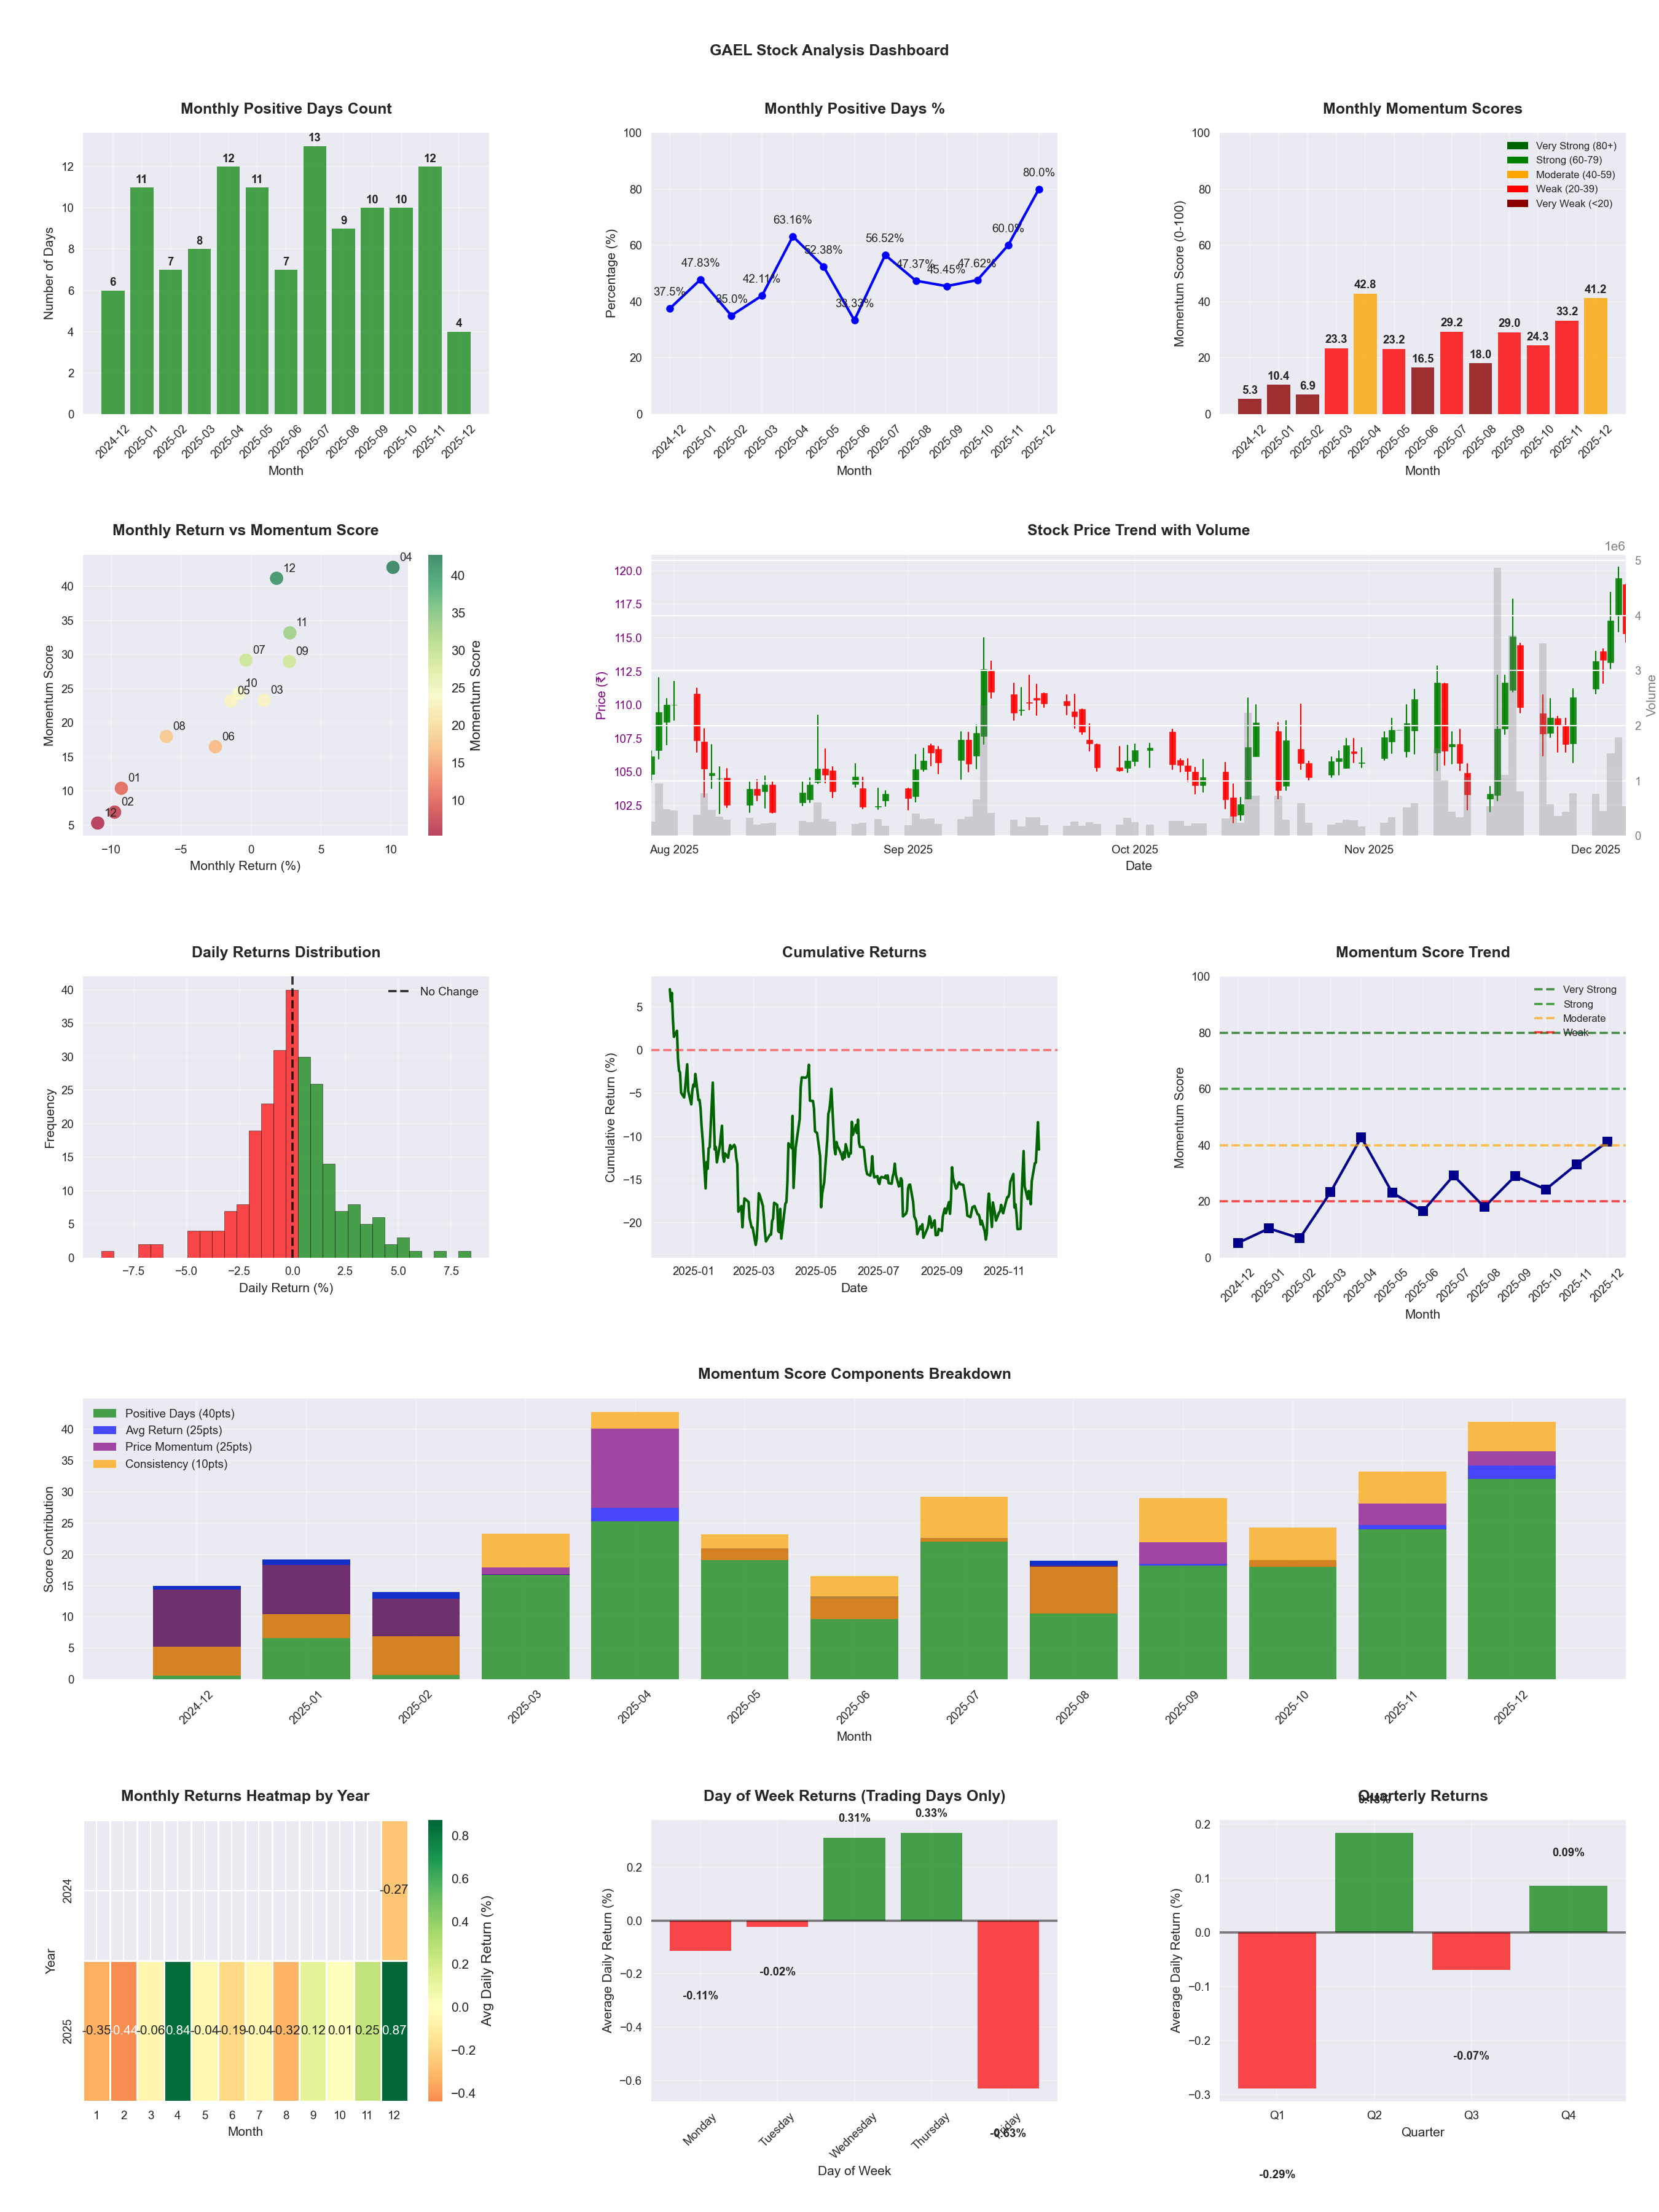
📊 Key Insights & Metrics
Symbol
📈 GAEL
Date
📅 2026-03-21
Volatility
🟡 2.26%
Risk Profile
⚠️ suitable for aggressive investors
Win Rate
⚠️ 51.8%
Avg Daily Return
📈 +0.12%
Max Drawdown
📉 -20.58%
Best Month
🏆 2025-12
Worst Month
📉 2025-03
Best Months to Trade
📅 Dec, Apr, Nov
Best Days to Trade
📅 Wednesday, Thursday
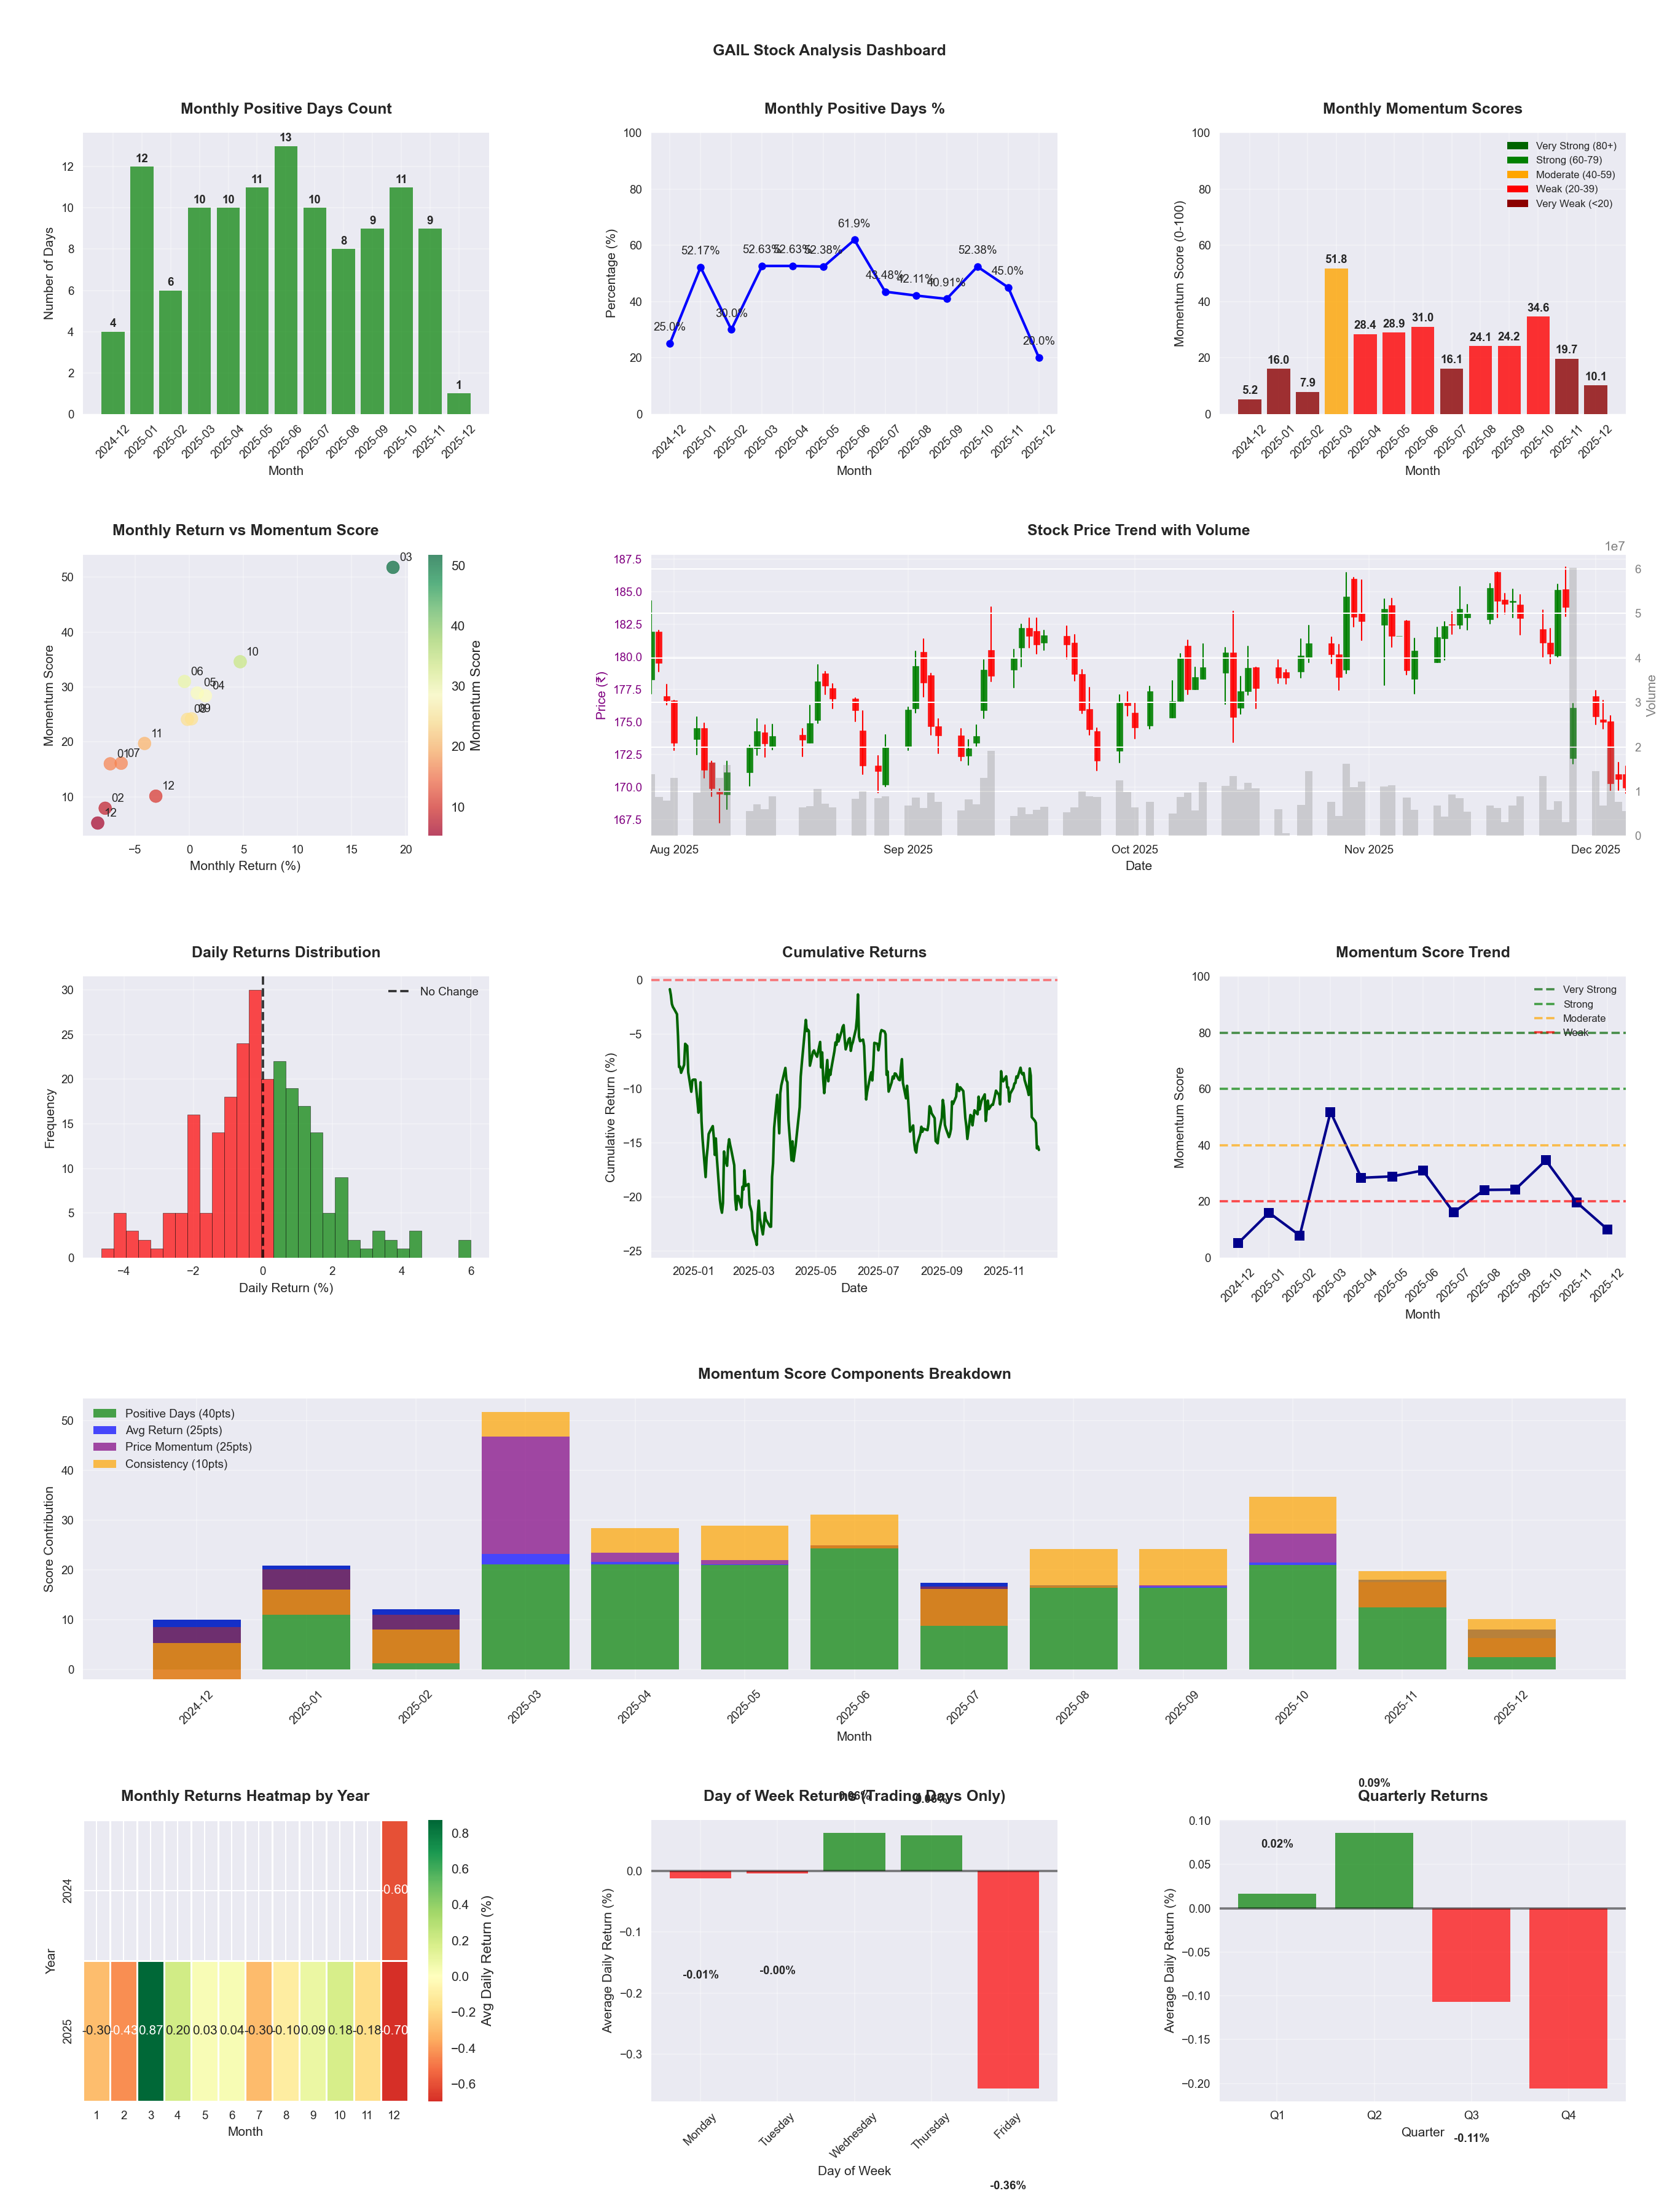
📊 Key Insights & Metrics
Symbol
📈 GAIL
Date
📅 2026-04-11
Volatility
🟡 1.61%
Win Rate
⚠️ 50.0%
Avg Daily Return
📉 -0.02%
Max Drawdown
📉 -29.82%
IBD RS Score
📊 40.8
Weak
Market Rank
#292
Best Month
🏆 2026-04
Best Months to Trade
📅 Apr, Feb, Oct
Best Days to Trade
📅 Wednesday, Monday
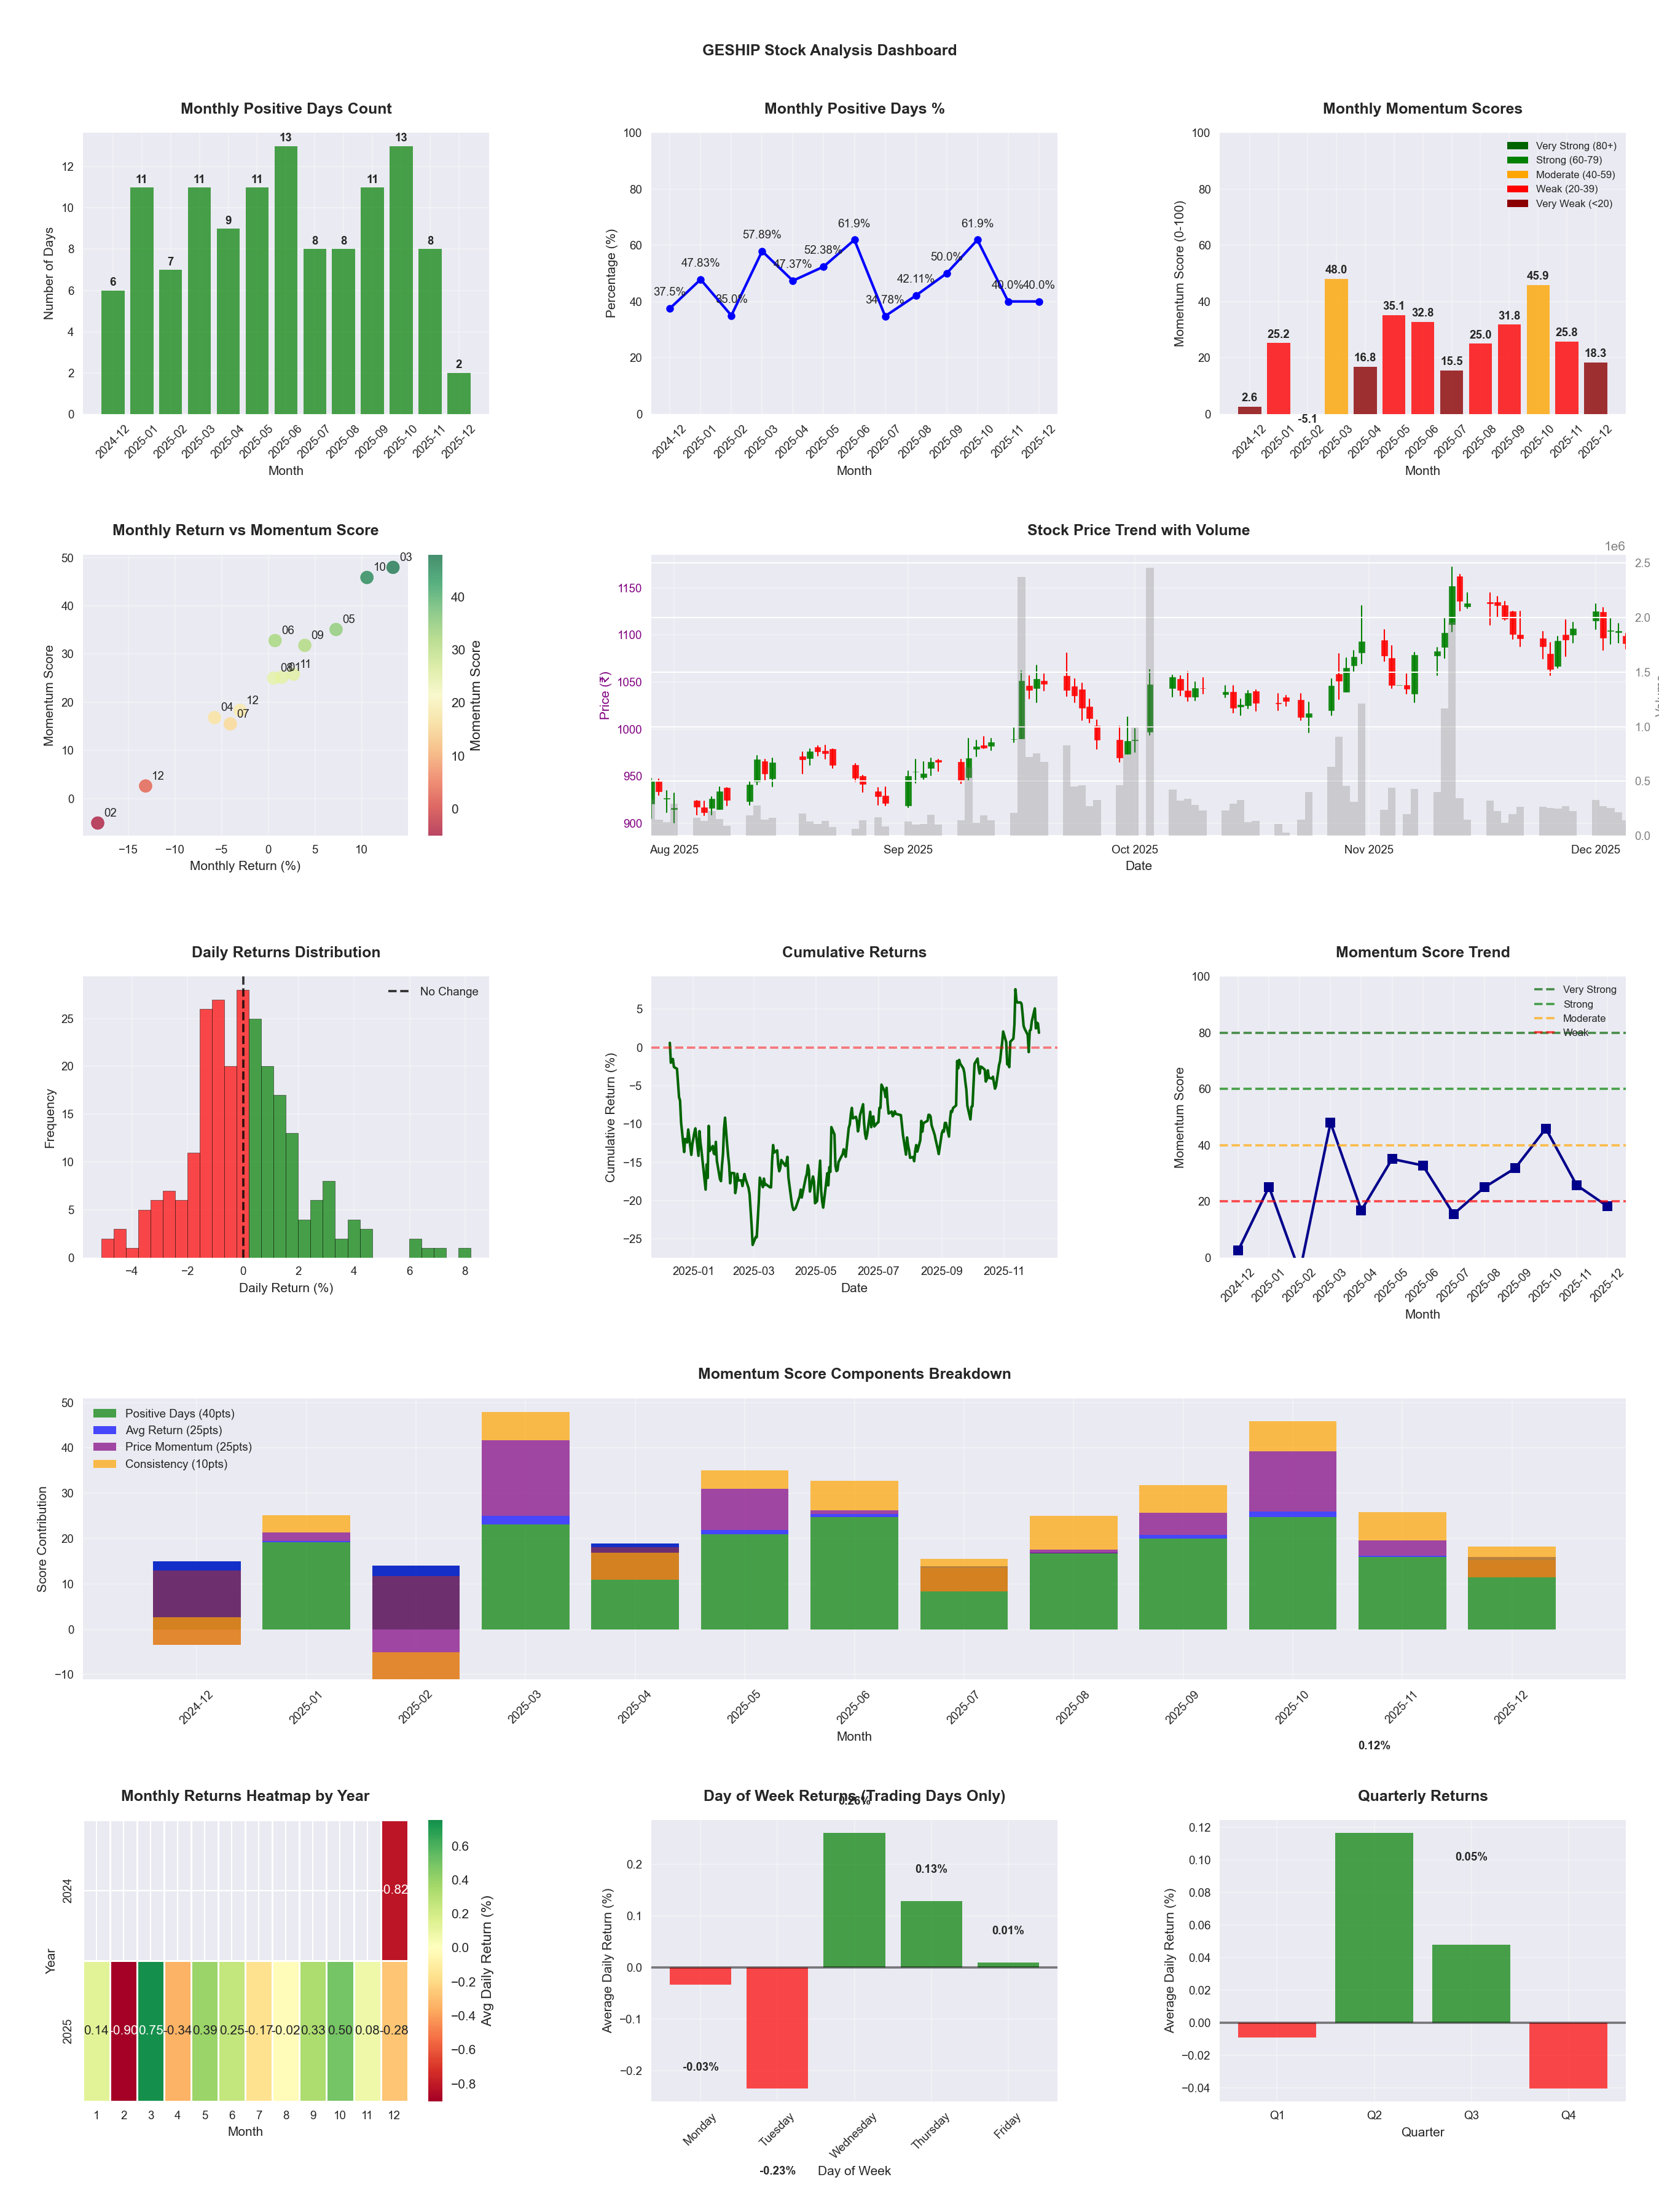
📊 Key Insights & Metrics
Symbol
📈 GESHIP
Date
📅 2026-04-11
Volatility
🟡 1.93%
Win Rate
⚠️ 52.9%
Avg Daily Return
📈 +0.22%
Max Drawdown
📉 -10.50%
IBD RS Score
📊 97.2
Leader
Market Rank
#14
Best Month
🏆 2026-02
Worst Month
📉 2026-04
Best Months to Trade
📅 Feb, Oct, May
Best Days to Trade
📅 Wednesday, Monday
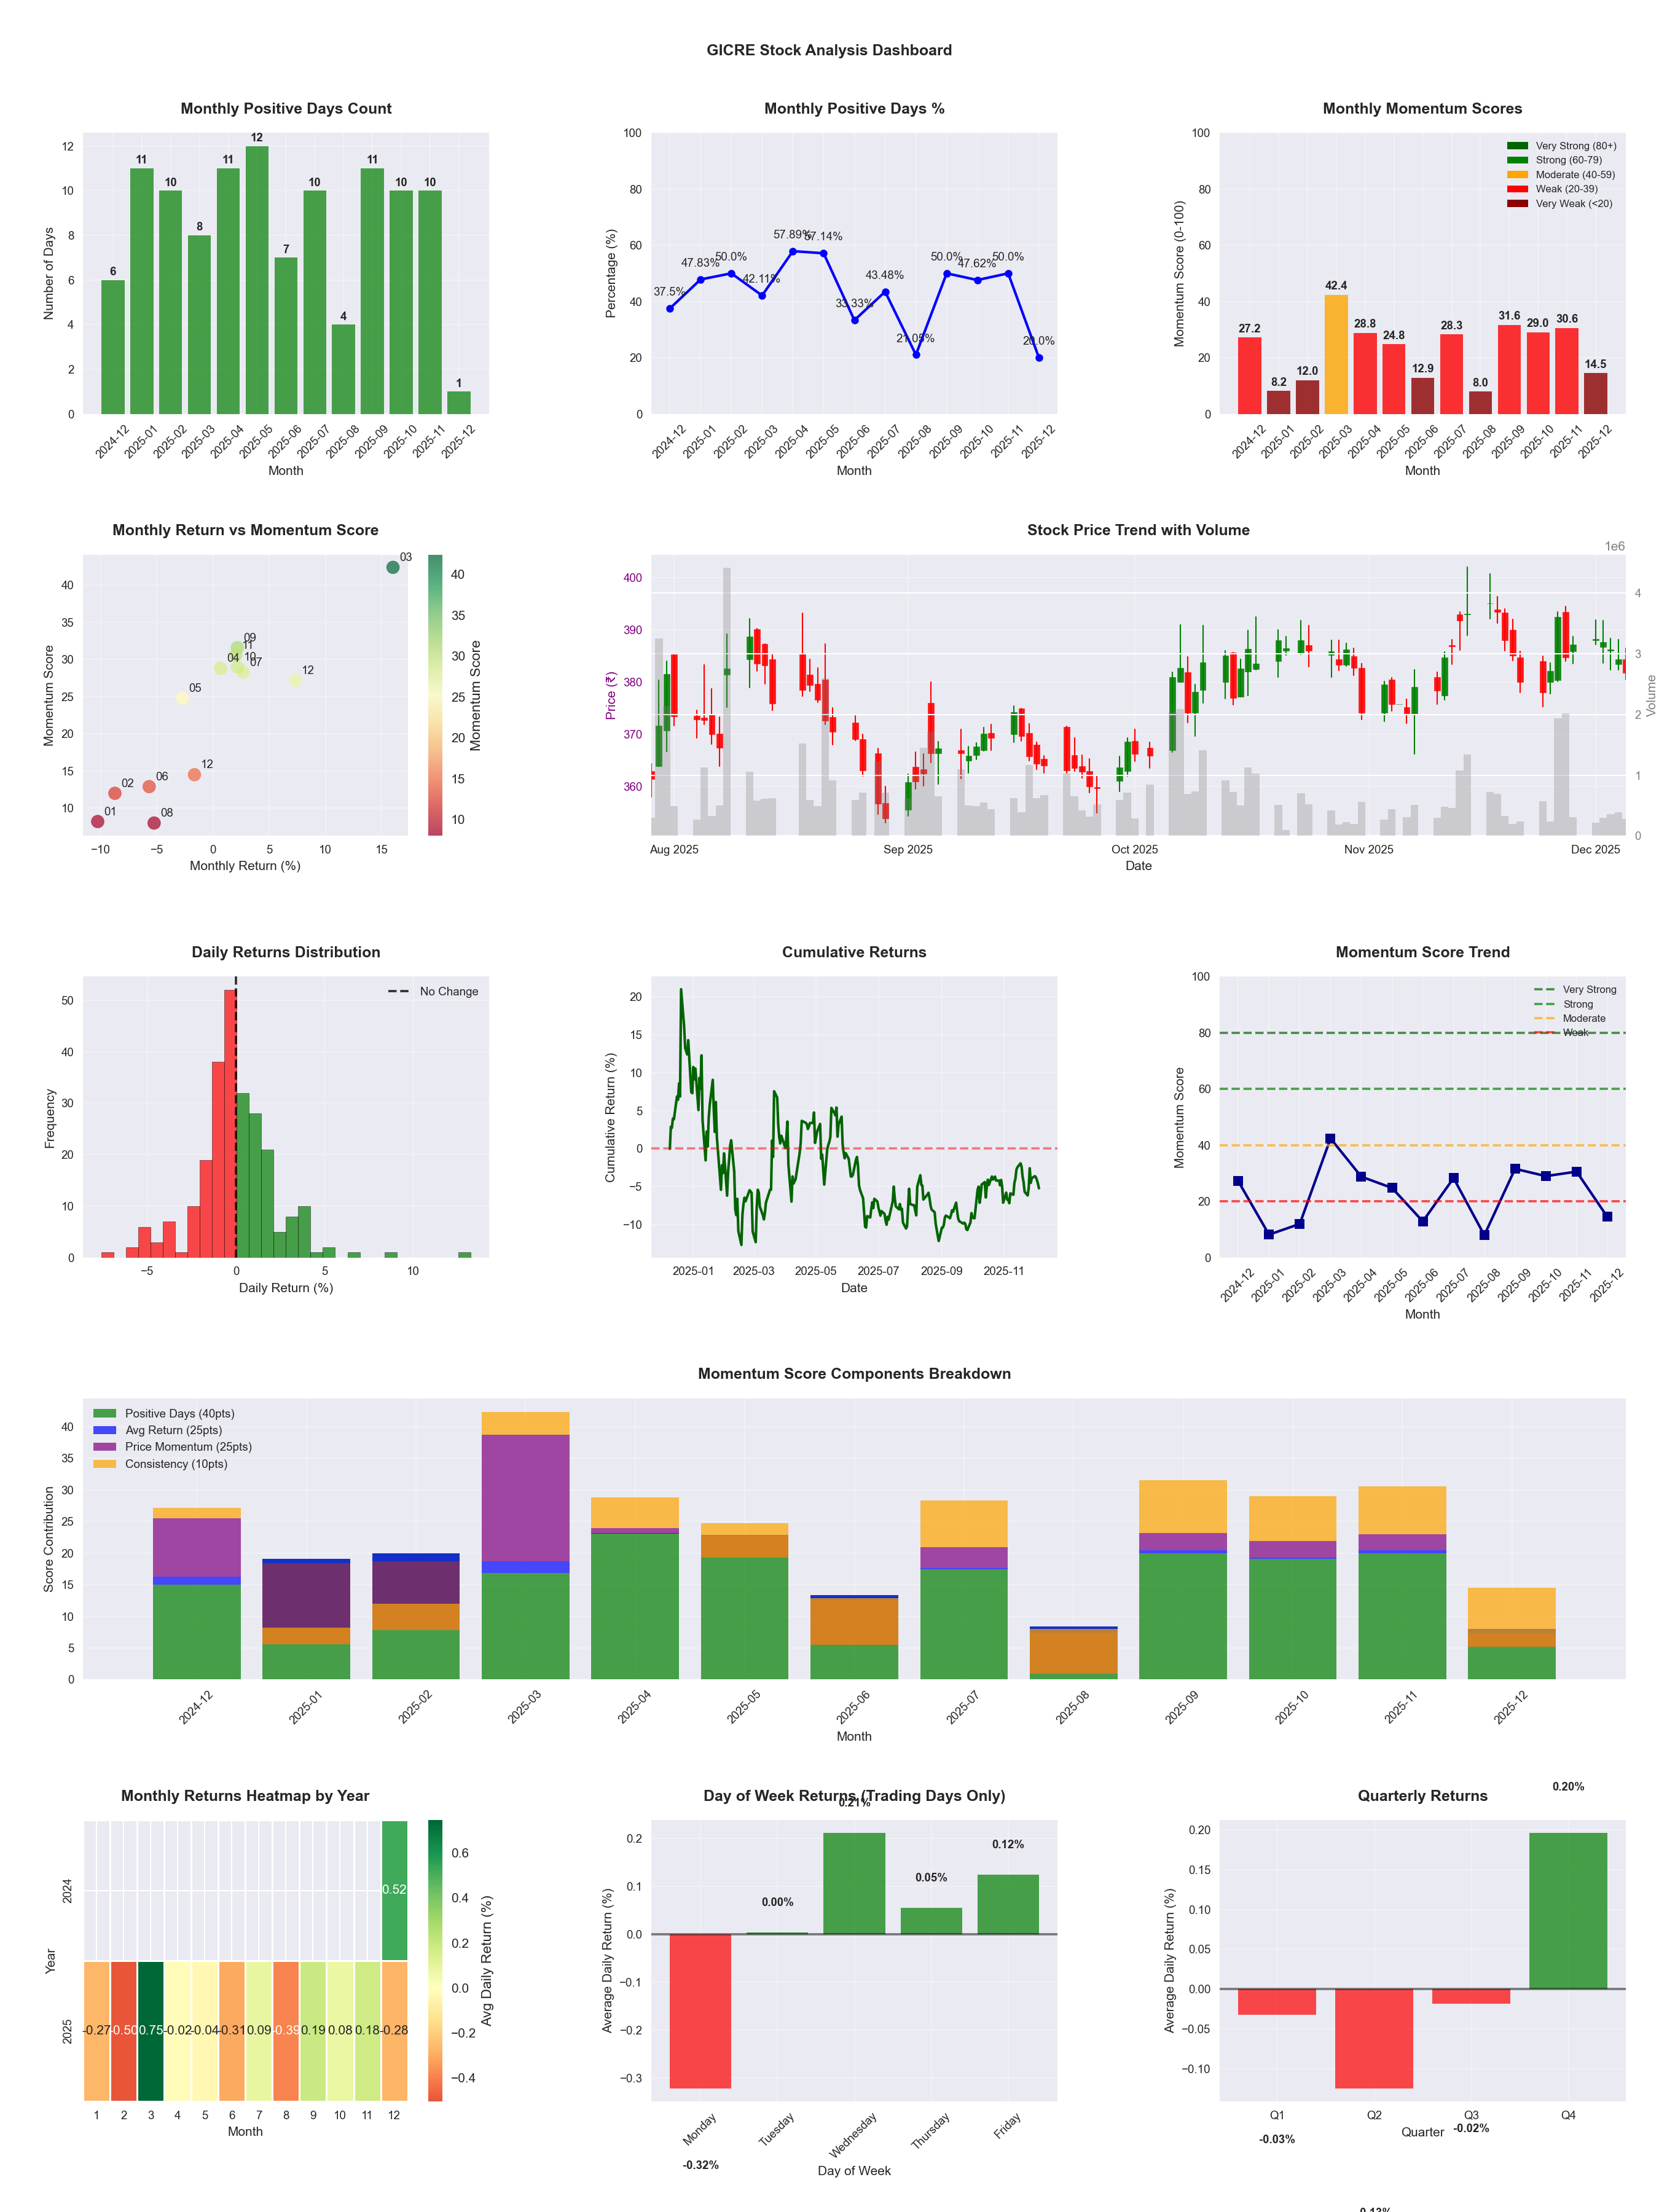
📊 Key Insights & Metrics
Symbol
📈 GICRE
Date
📅 2026-04-11
Volatility
🟡 1.50%
Win Rate
⚠️ 45.1%
Avg Daily Return
📈 +0.02%
Max Drawdown
📉 -16.68%
IBD RS Score
📊 70.6
Strong
Market Rank
#145
Best Month
🏆 2026-04
Worst Month
📉 2025-08
Best Months to Trade
📅 Apr, Sep, Nov
Best Days to Trade
📅 Monday, Friday
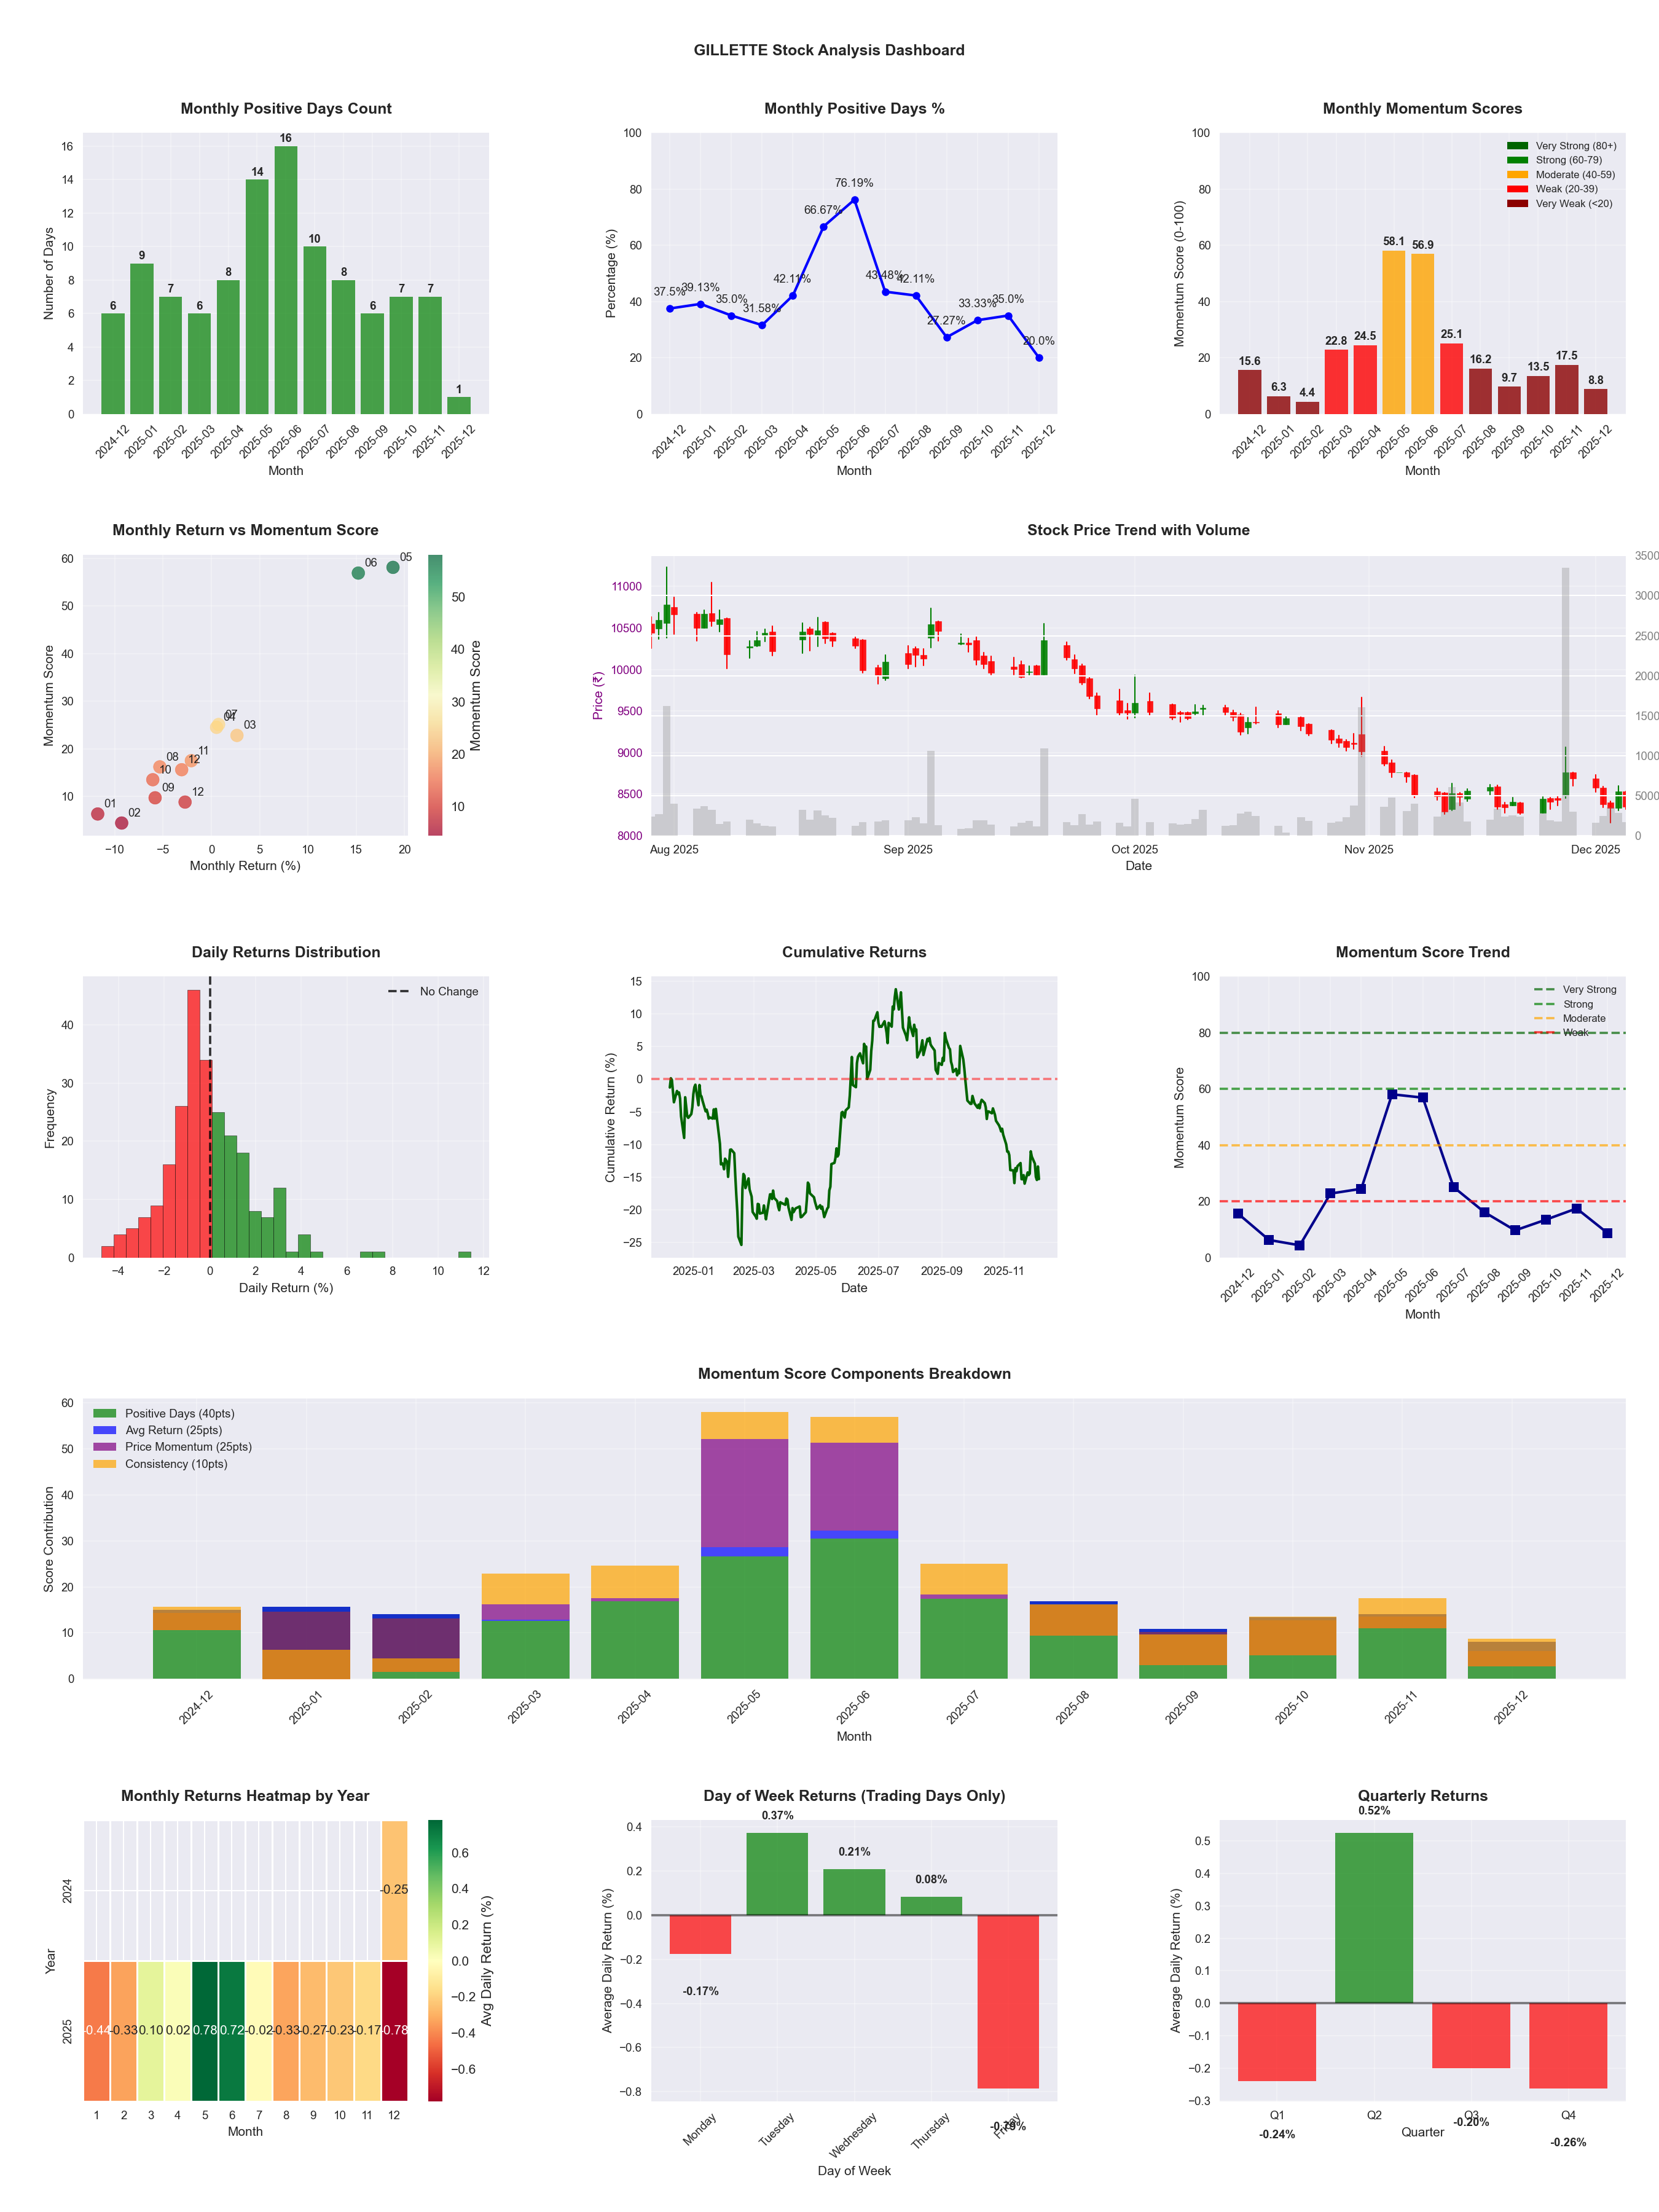
📊 Key Insights & Metrics
Symbol
📈 GILLETTE
Date
📅 2026-04-11
Volatility
🟡 1.73%
Win Rate
⚠️ 43.9%
Avg Daily Return
📈 +0.01%
Max Drawdown
📉 -33.93%
IBD RS Score
📊 41.4
Weak
Market Rank
#289
Best Month
🏆 2025-05
Worst Month
📉 2026-03
Best Months to Trade
📅 May, Jun, Apr
Best Days to Trade
📅 Wednesday, Thursday
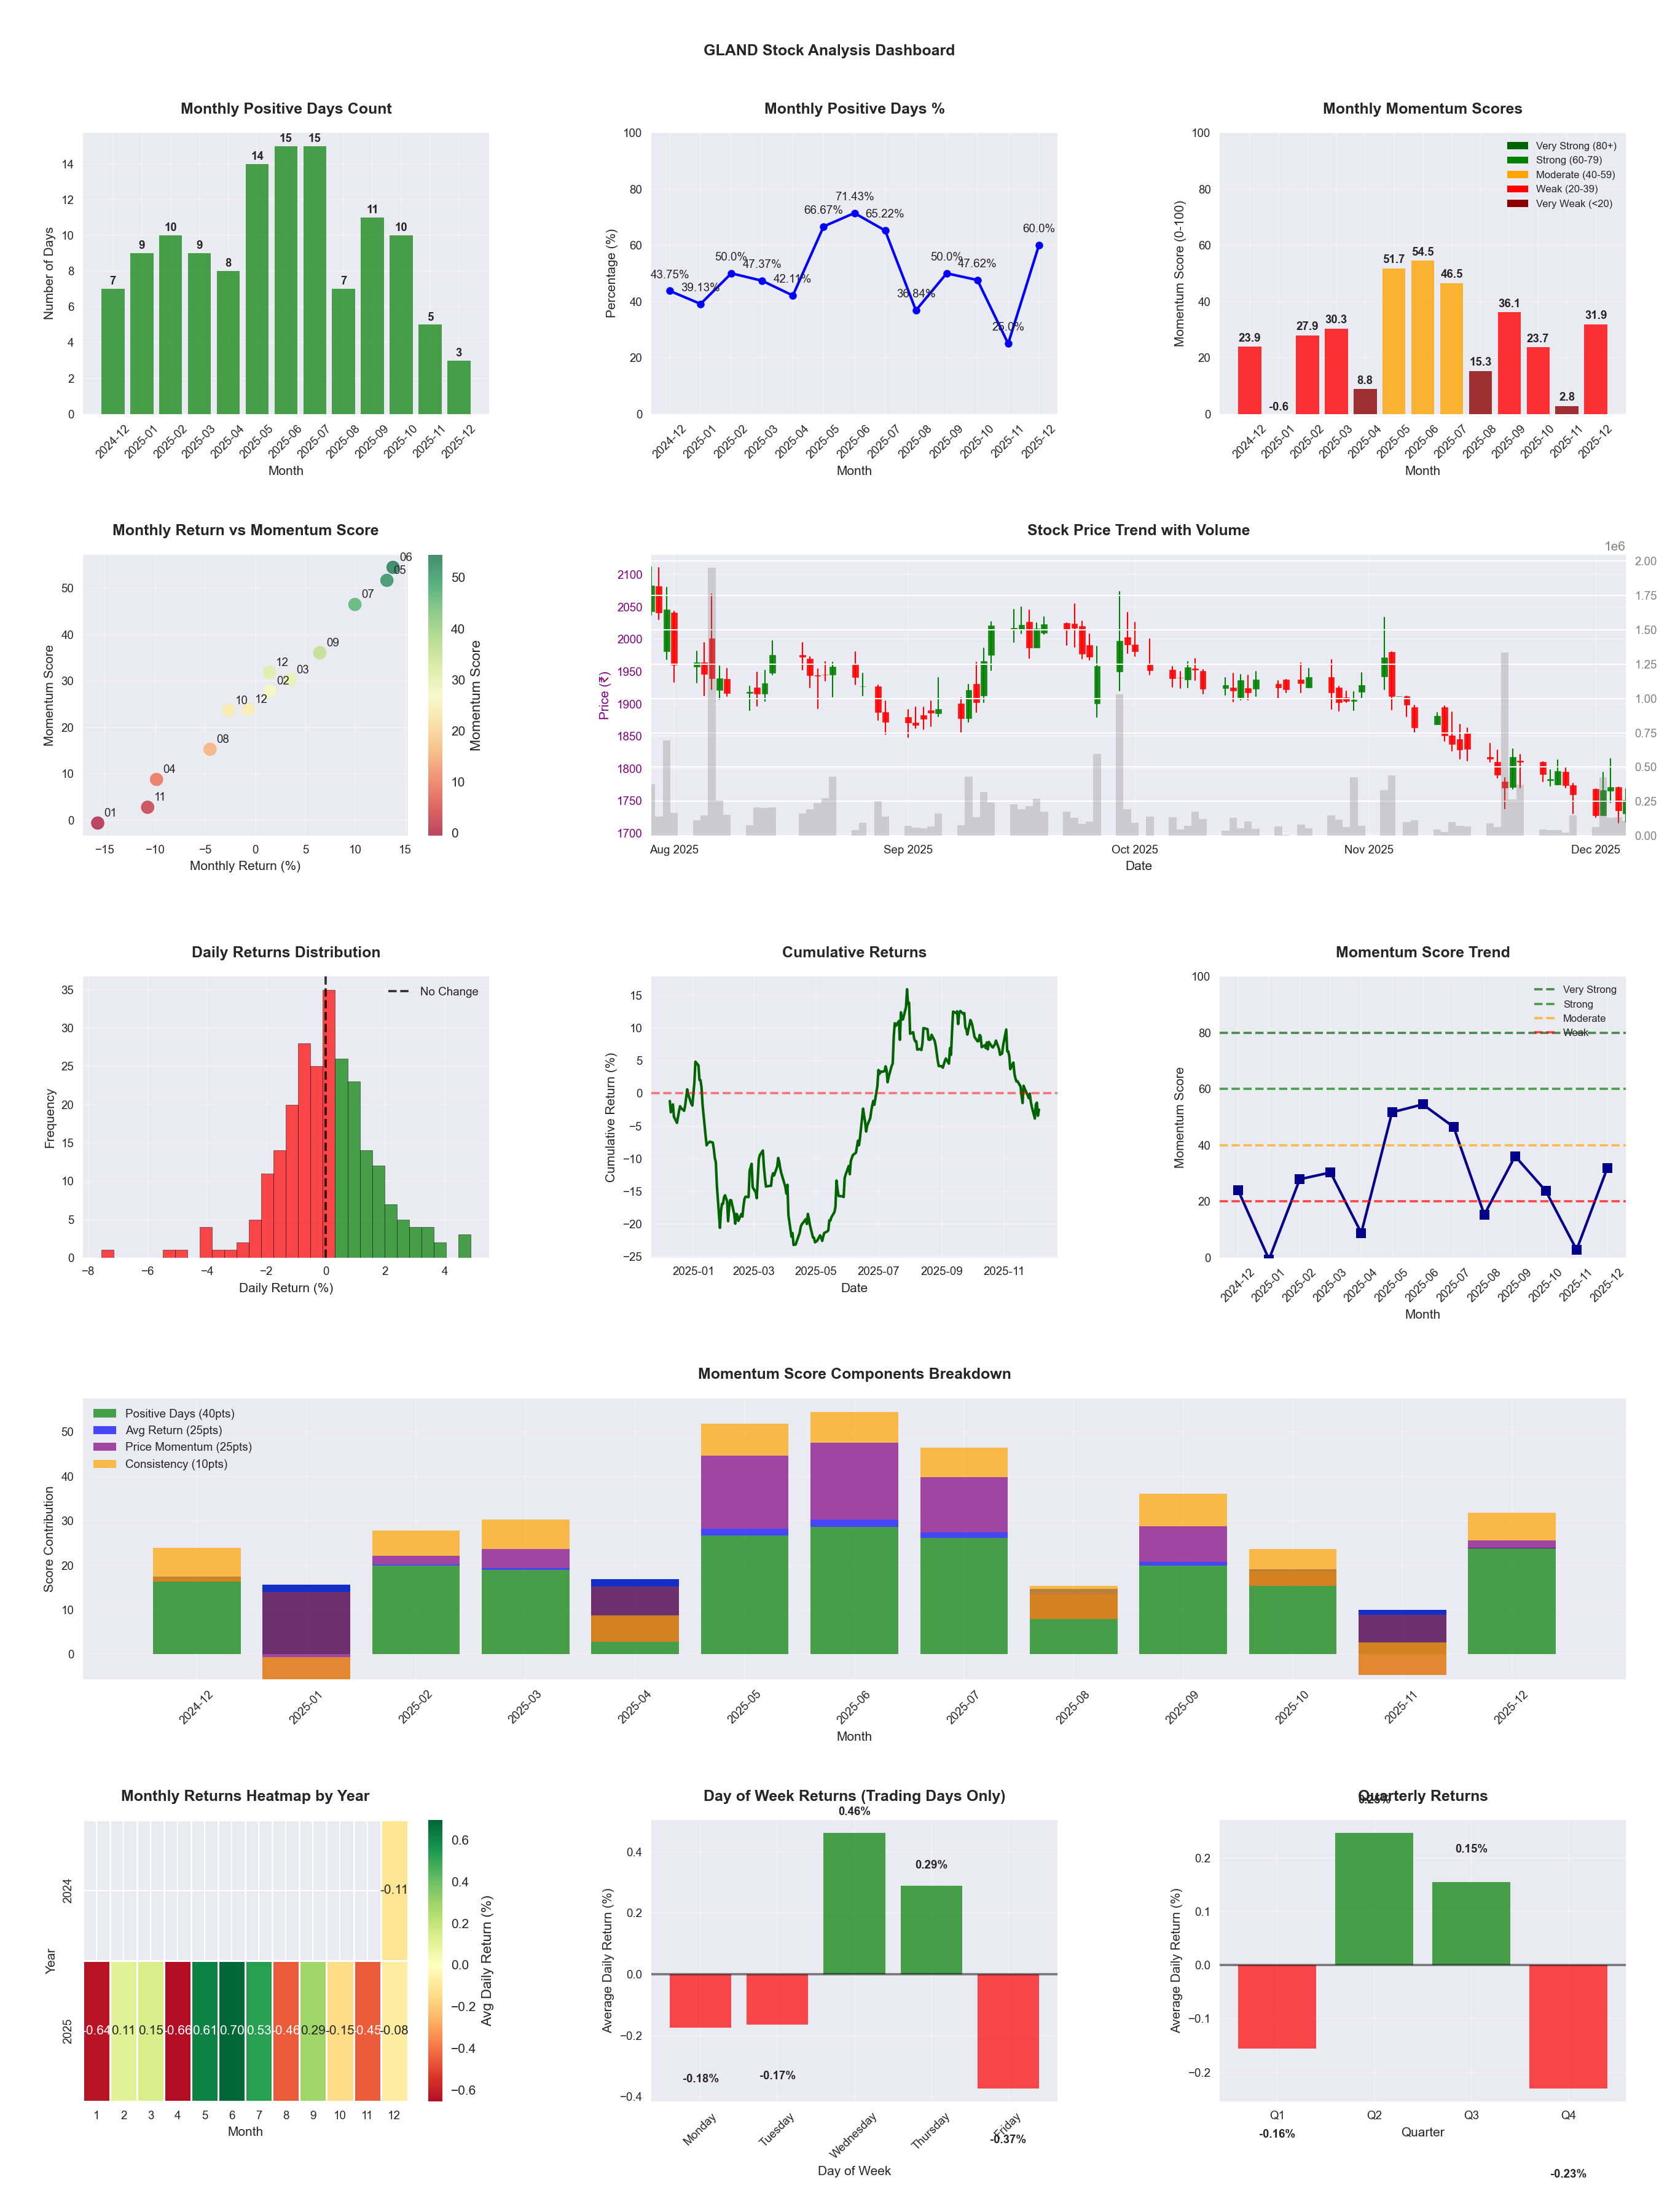
📊 Key Insights & Metrics
Symbol
📈 GLAND
Date
📅 2026-04-11
Volatility
🟡 1.55%
Win Rate
⚠️ 51.0%
Avg Daily Return
📈 +0.11%
Max Drawdown
📉 -23.33%
IBD RS Score
📊 66.9
Average
Market Rank
#163
Best Month
🏆 2025-06
Worst Month
📉 2025-11
Best Months to Trade
📅 Jun, May, Jul
Best Days to Trade
📅 Wednesday, Monday
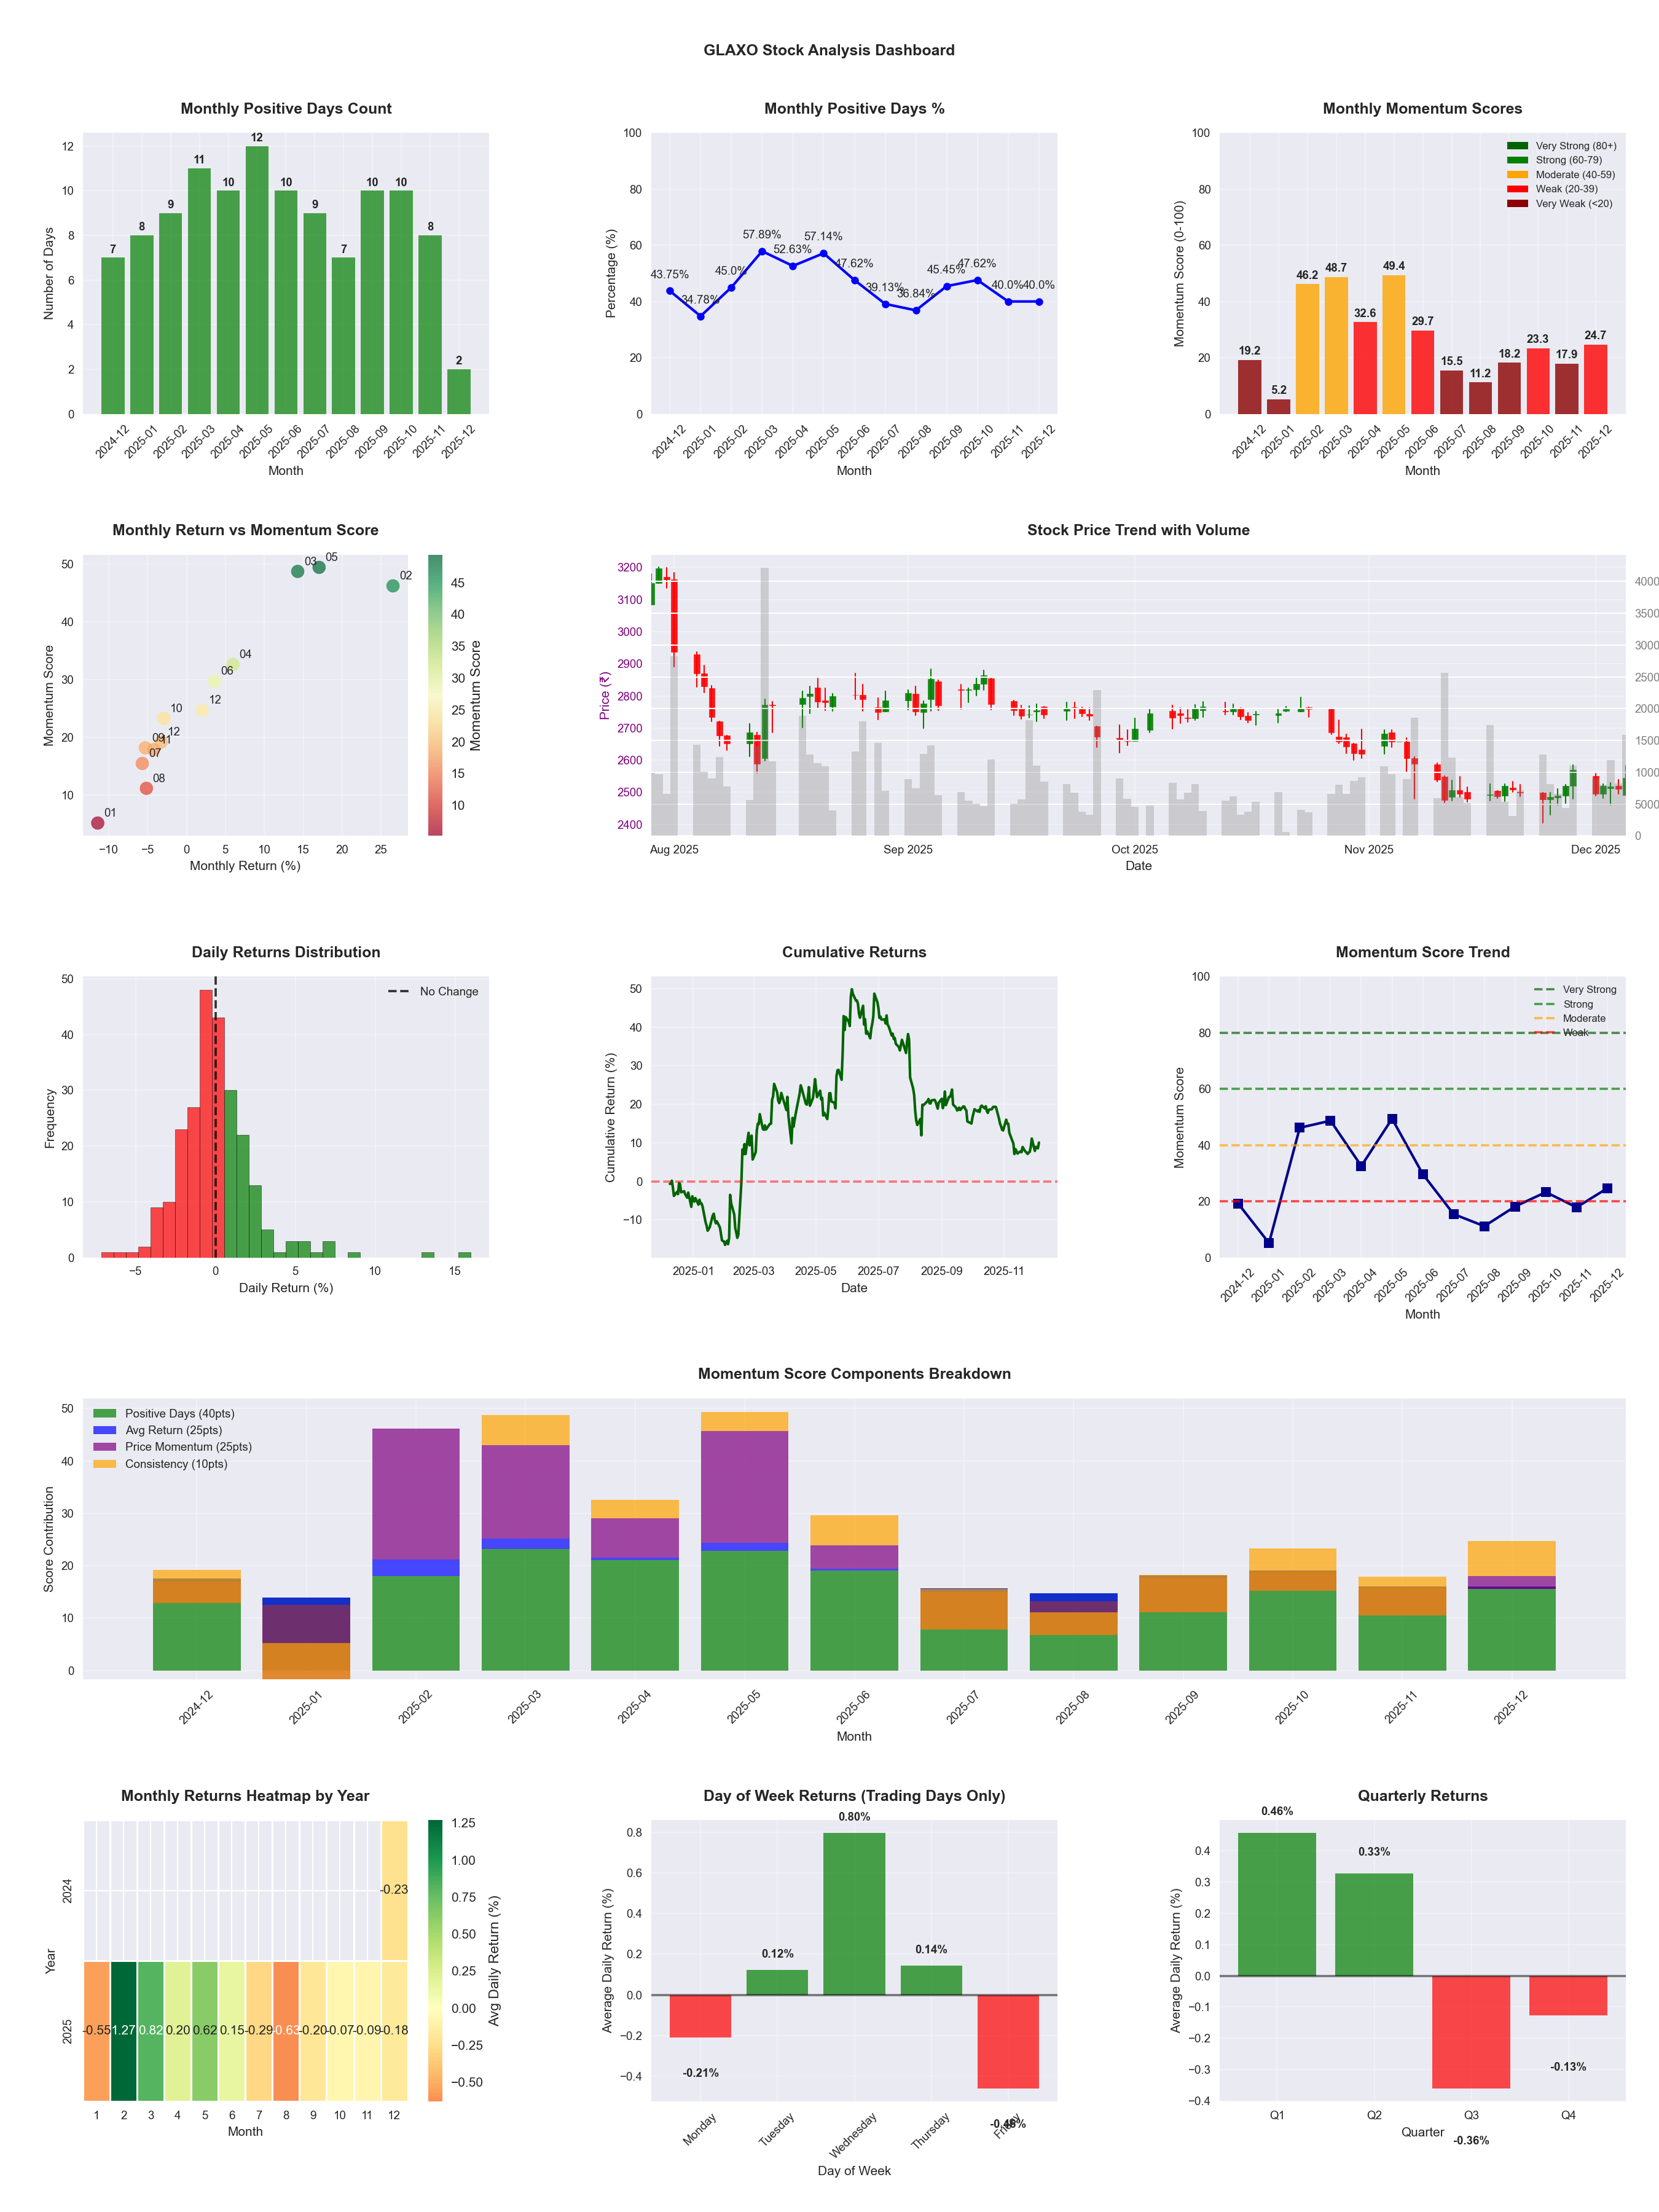
📊 Key Insights & Metrics
Symbol
📈 GLAXO
Date
📅 2026-04-11
Volatility
🟡 1.91%
Win Rate
⚠️ 47.1%
Avg Daily Return
📉 -0.03%
Max Drawdown
📉 -34.81%
IBD RS Score
📊 35.9
Weak
Market Rank
#316
Best Month
🏆 2025-05
Worst Month
📉 2025-08
Best Months to Trade
📅 Apr, May, Feb
Best Days to Trade
📅 Wednesday, Tuesday
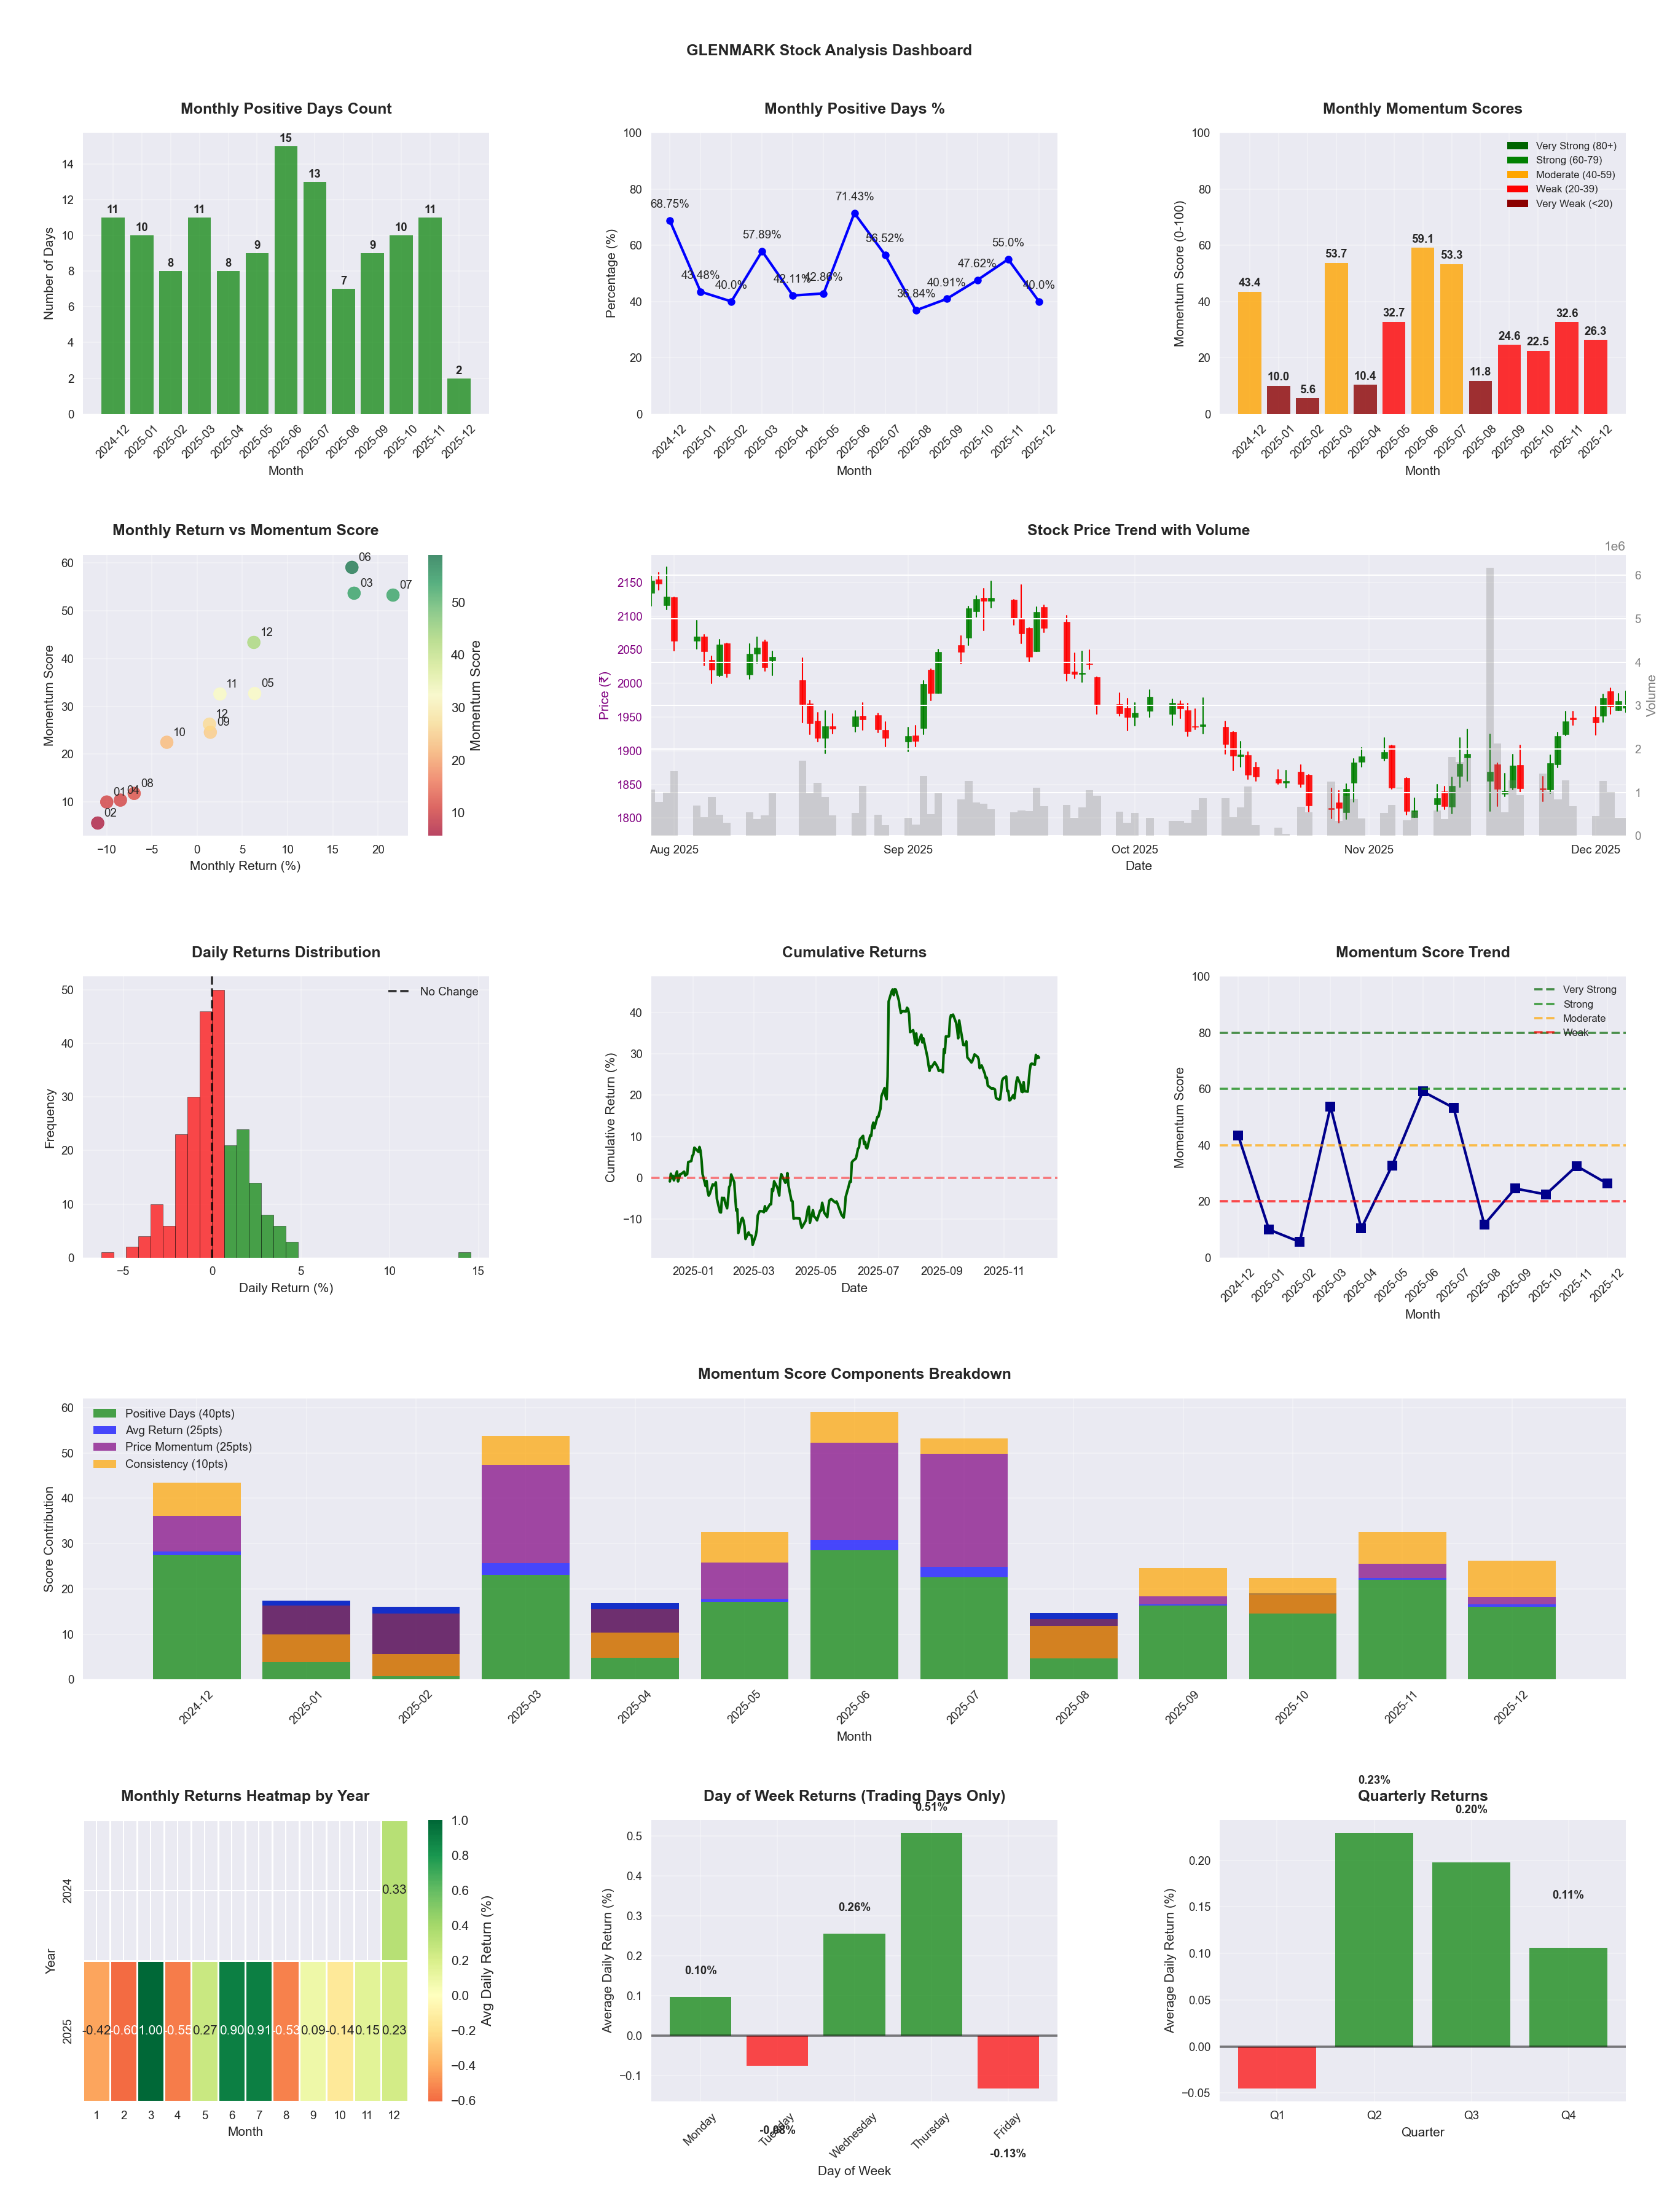
📊 Key Insights & Metrics
Symbol
📈 GLENMARK
Date
📅 2026-04-11
Volatility
🟡 1.90%
Win Rate
⚠️ 51.6%
Avg Daily Return
📈 +0.20%
Max Drawdown
📉 -18.50%
IBD RS Score
📊 86.4
Strong
Market Rank
#67
Best Month
🏆 2025-06
Worst Month
📉 2025-08
Best Months to Trade
📅 Jul, Jun, Feb
Best Days to Trade
📅 Thursday, Wednesday
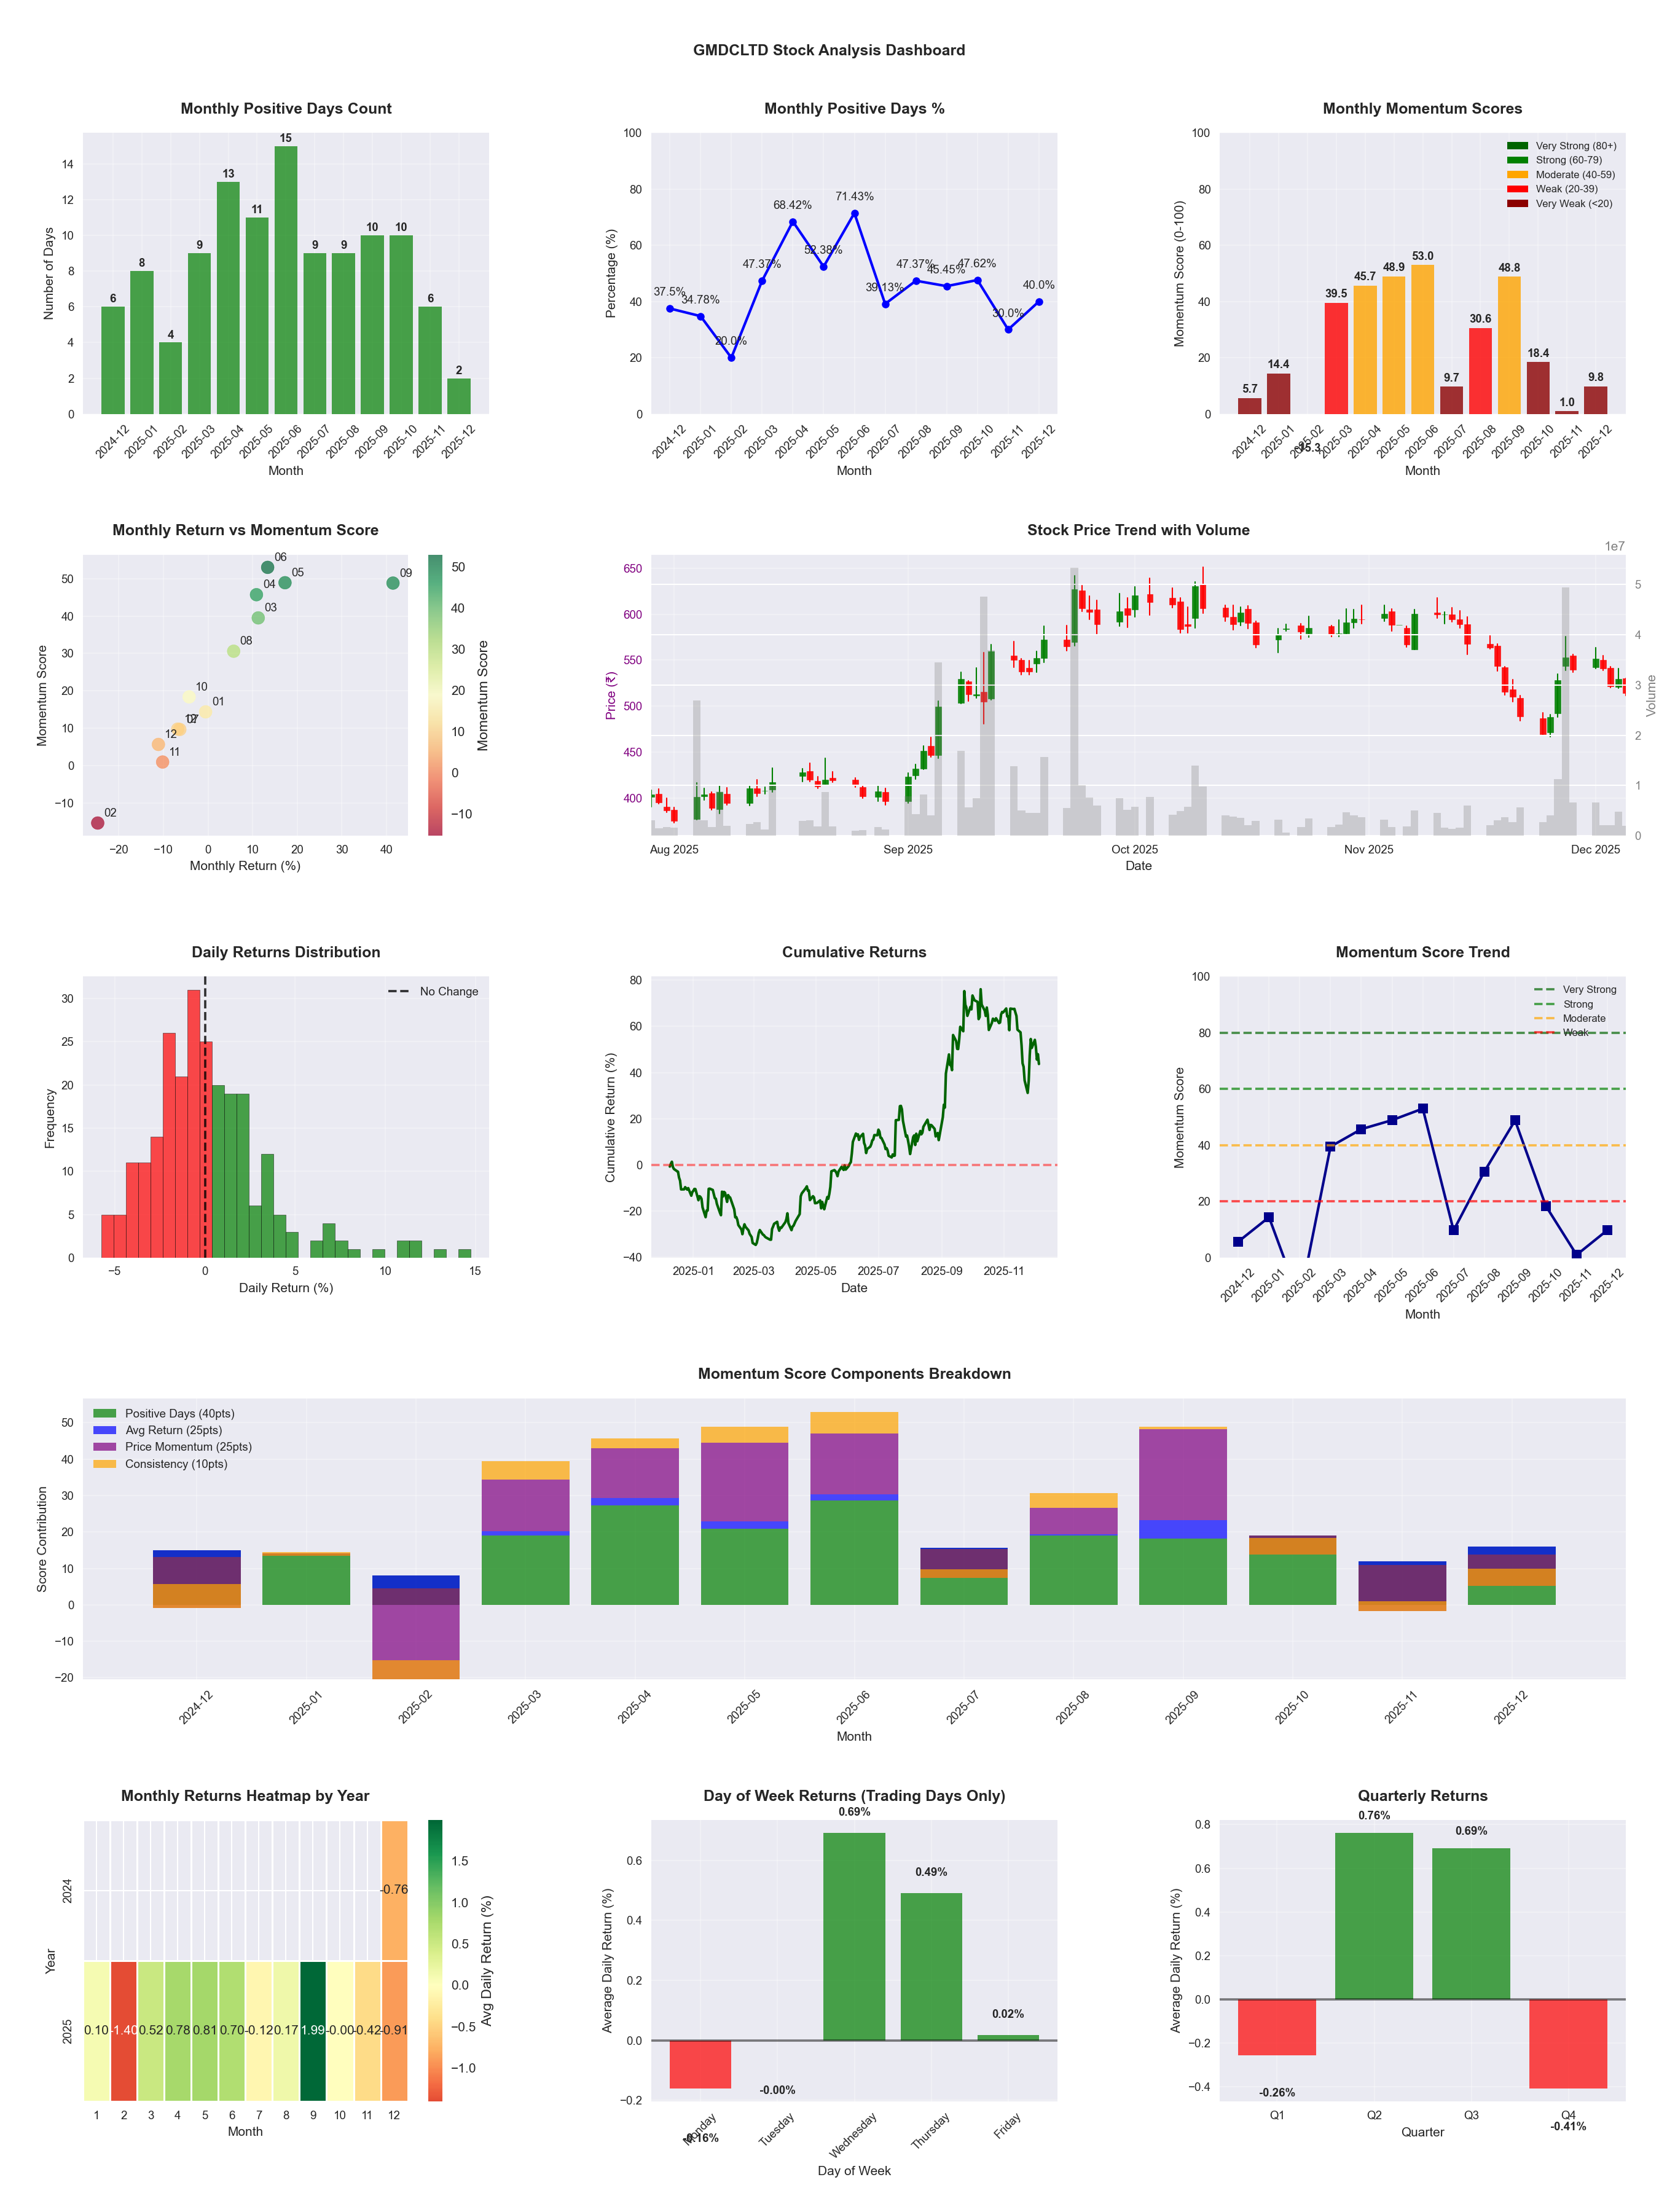
📊 Key Insights & Metrics
Symbol
📈 GMDCLTD
Date
📅 2026-04-11
Volatility
🔴 3.30%
Risk Profile
⚠️ suitable for aggressive investors
Win Rate
⚠️ 50.0%
Avg Daily Return
📈 +0.38%
Max Drawdown
📉 -25.50%
IBD RS Score
📊 96.3
Leader
Market Rank
#18
Best Month
🏆 2025-06
Worst Month
📉 2025-11
Best Months to Trade
📅 Sep, Apr, May
Best Days to Trade
📅 Monday, Wednesday
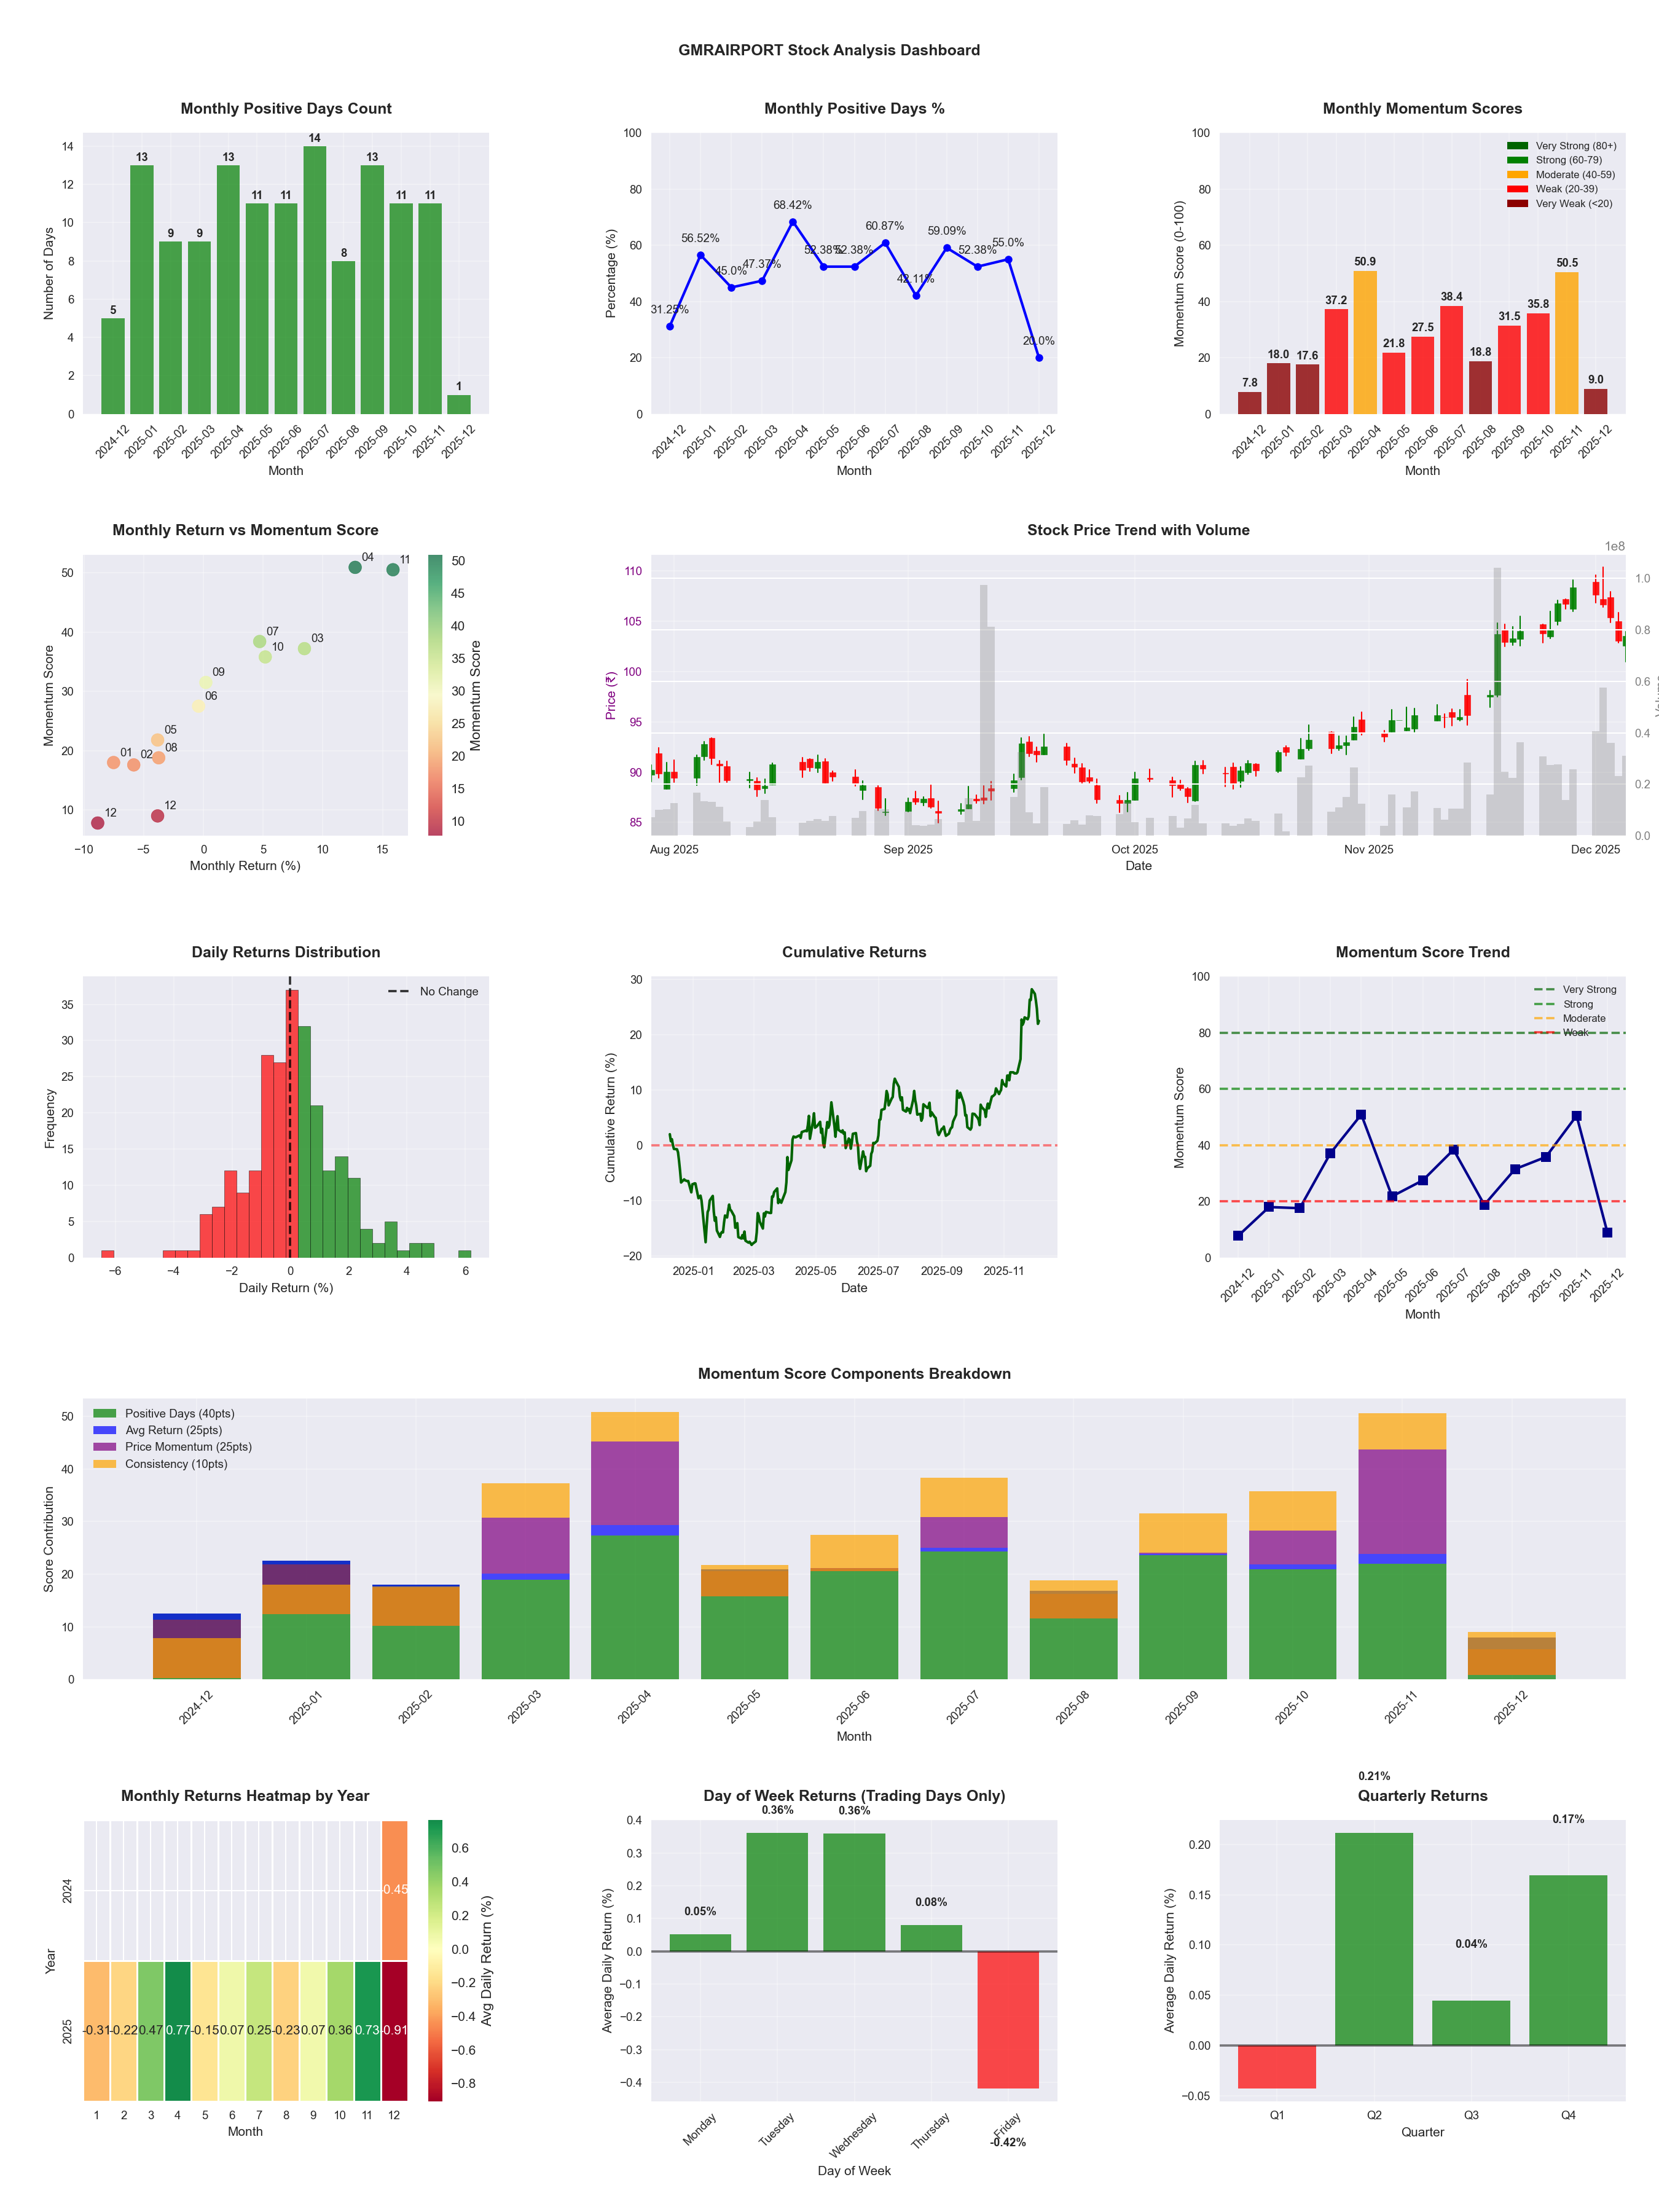
📊 Key Insights & Metrics
Symbol
📈 GMRAIRPORT
Date
📅 2026-04-11
Volatility
🟡 1.88%
Win Rate
⚠️ 51.2%
Avg Daily Return
📈 +0.06%
Max Drawdown
📉 -21.78%
IBD RS Score
📊 66.7
Average
Market Rank
#164
Best Month
🏆 2025-11
Worst Month
📉 2026-03
Best Months to Trade
📅 Apr, Nov, Feb
Best Days to Trade
📅 Tuesday, Wednesday
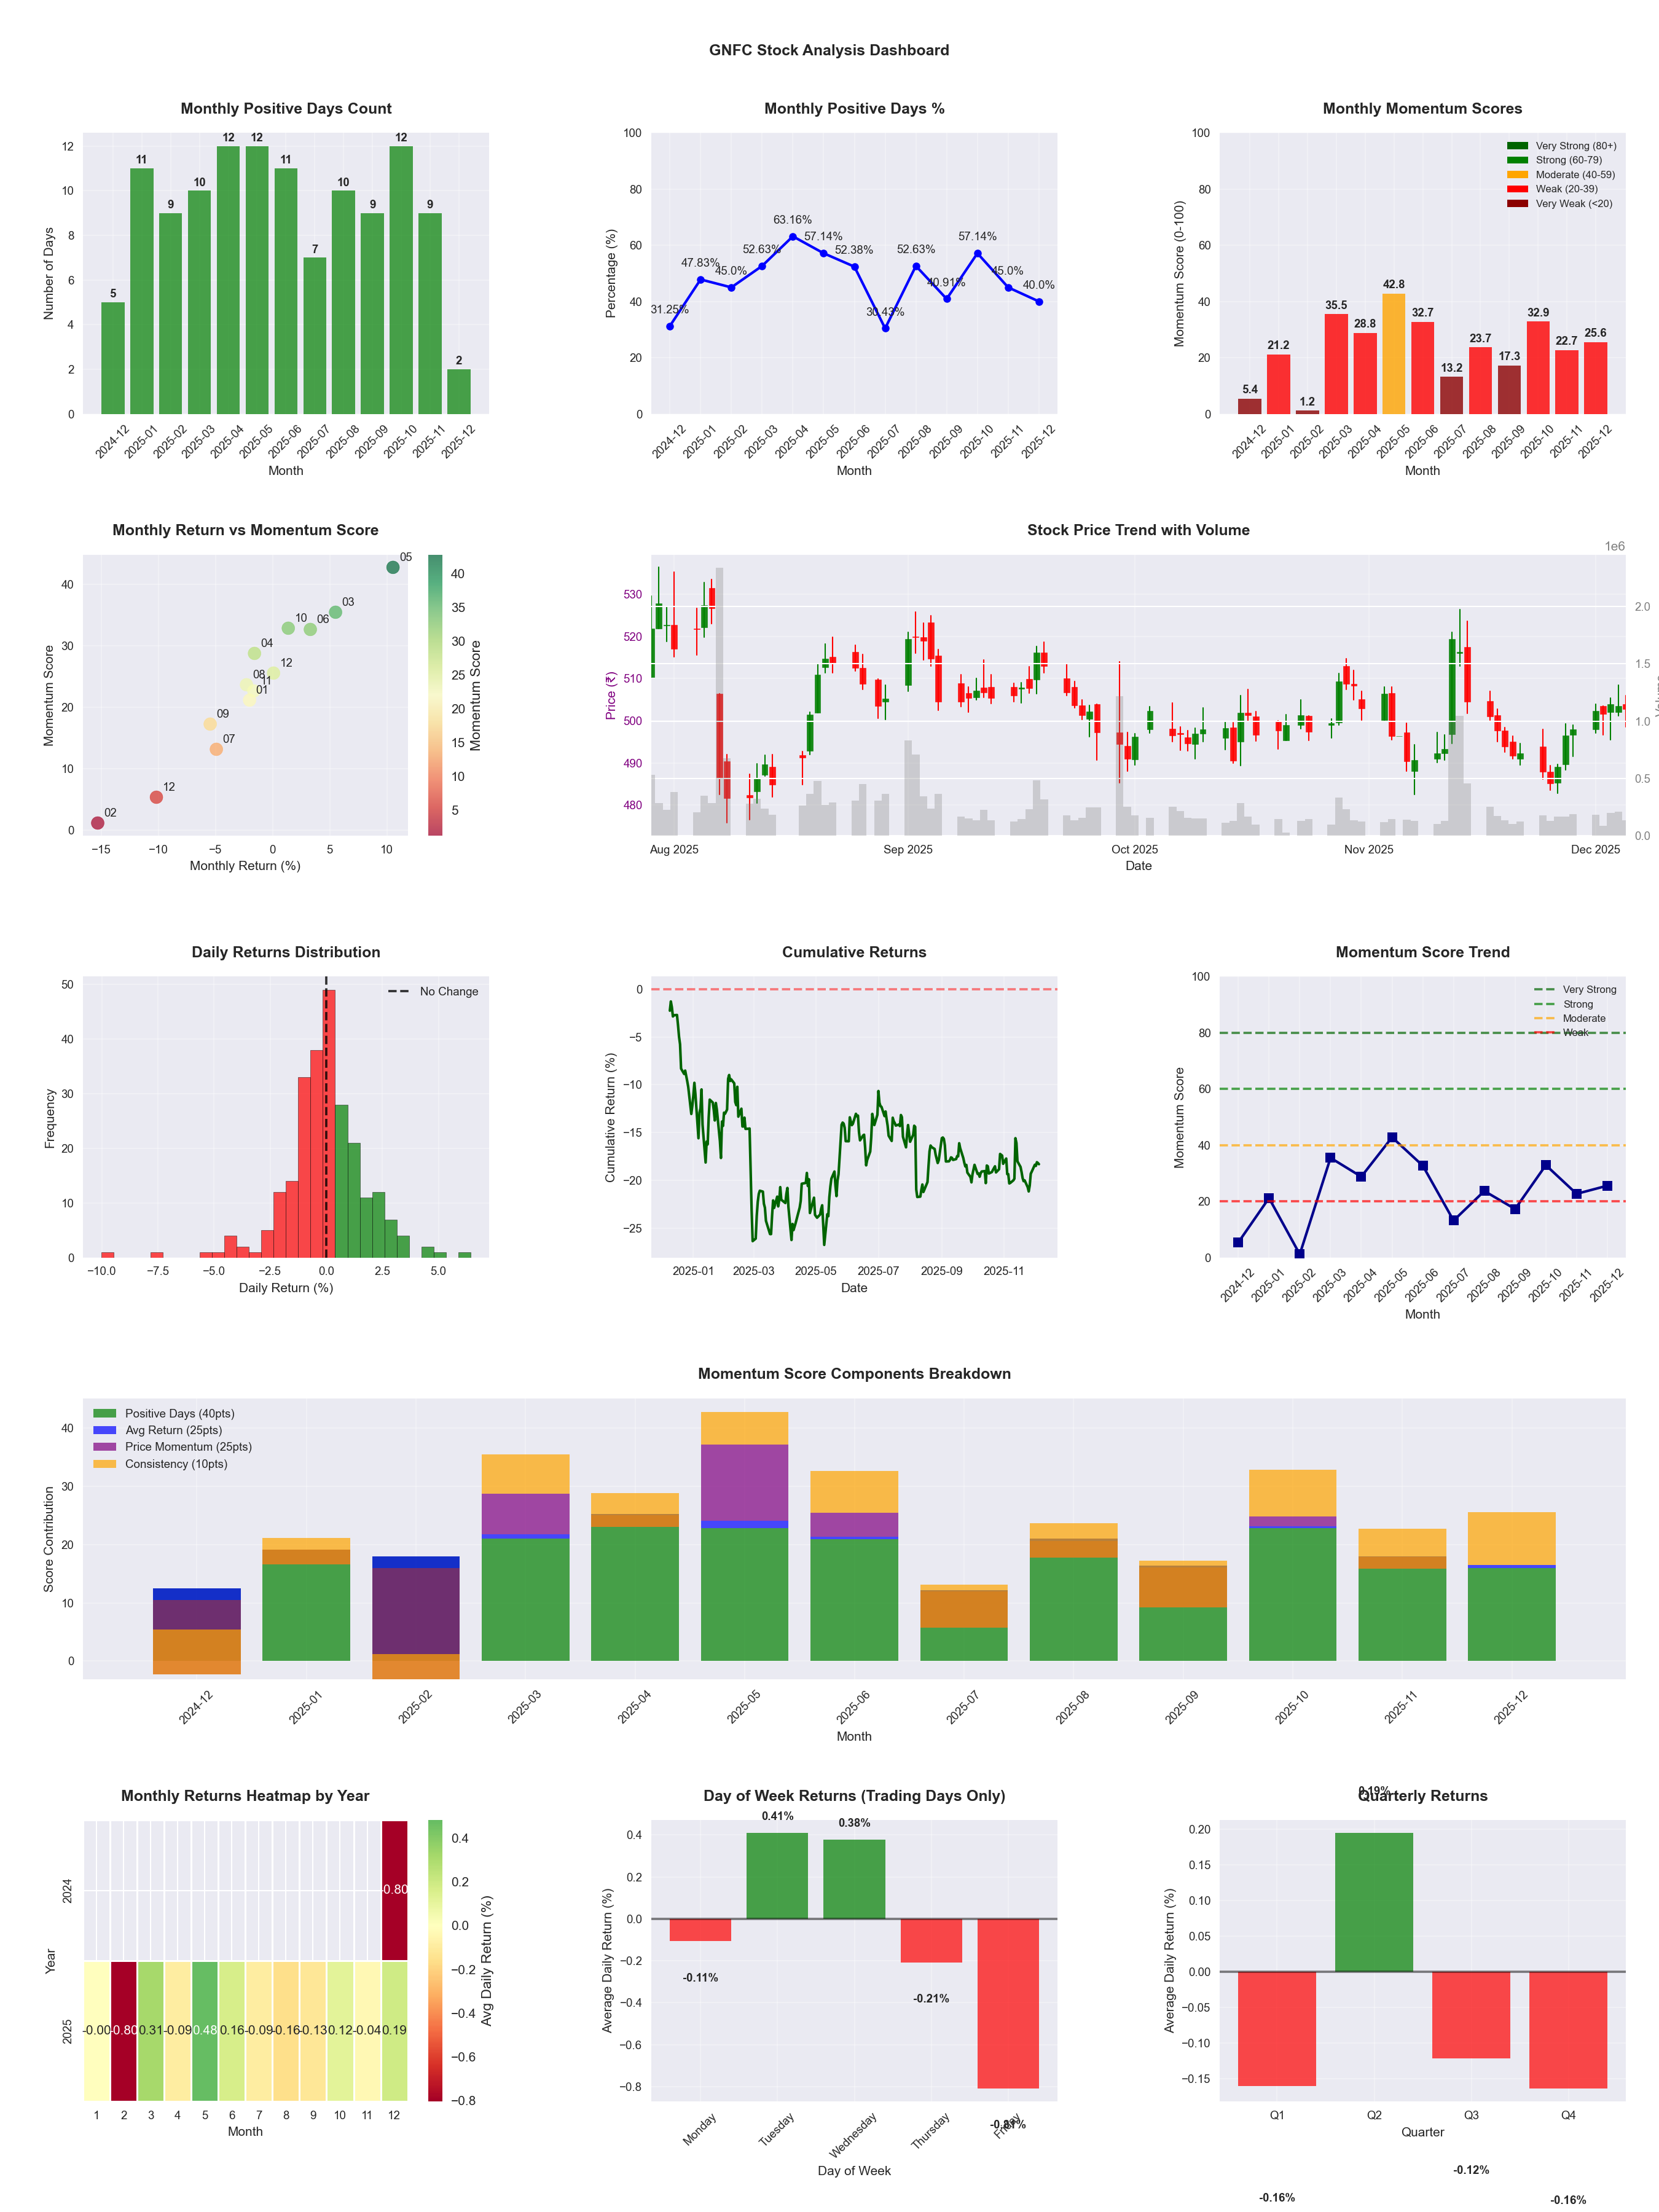
📊 Key Insights & Metrics
Symbol
📈 GNFC
Date
📅 2026-03-21
Volatility
🟡 1.61%
Win Rate
⚠️ 45.3%
Avg Daily Return
📉 -0.05%
Max Drawdown
📉 -25.97%
Best Month
🏆 2025-05
Worst Month
📉 2026-03
Best Months to Trade
📅 May, Jun, Oct
Best Days to Trade
📅 Tuesday, Wednesday
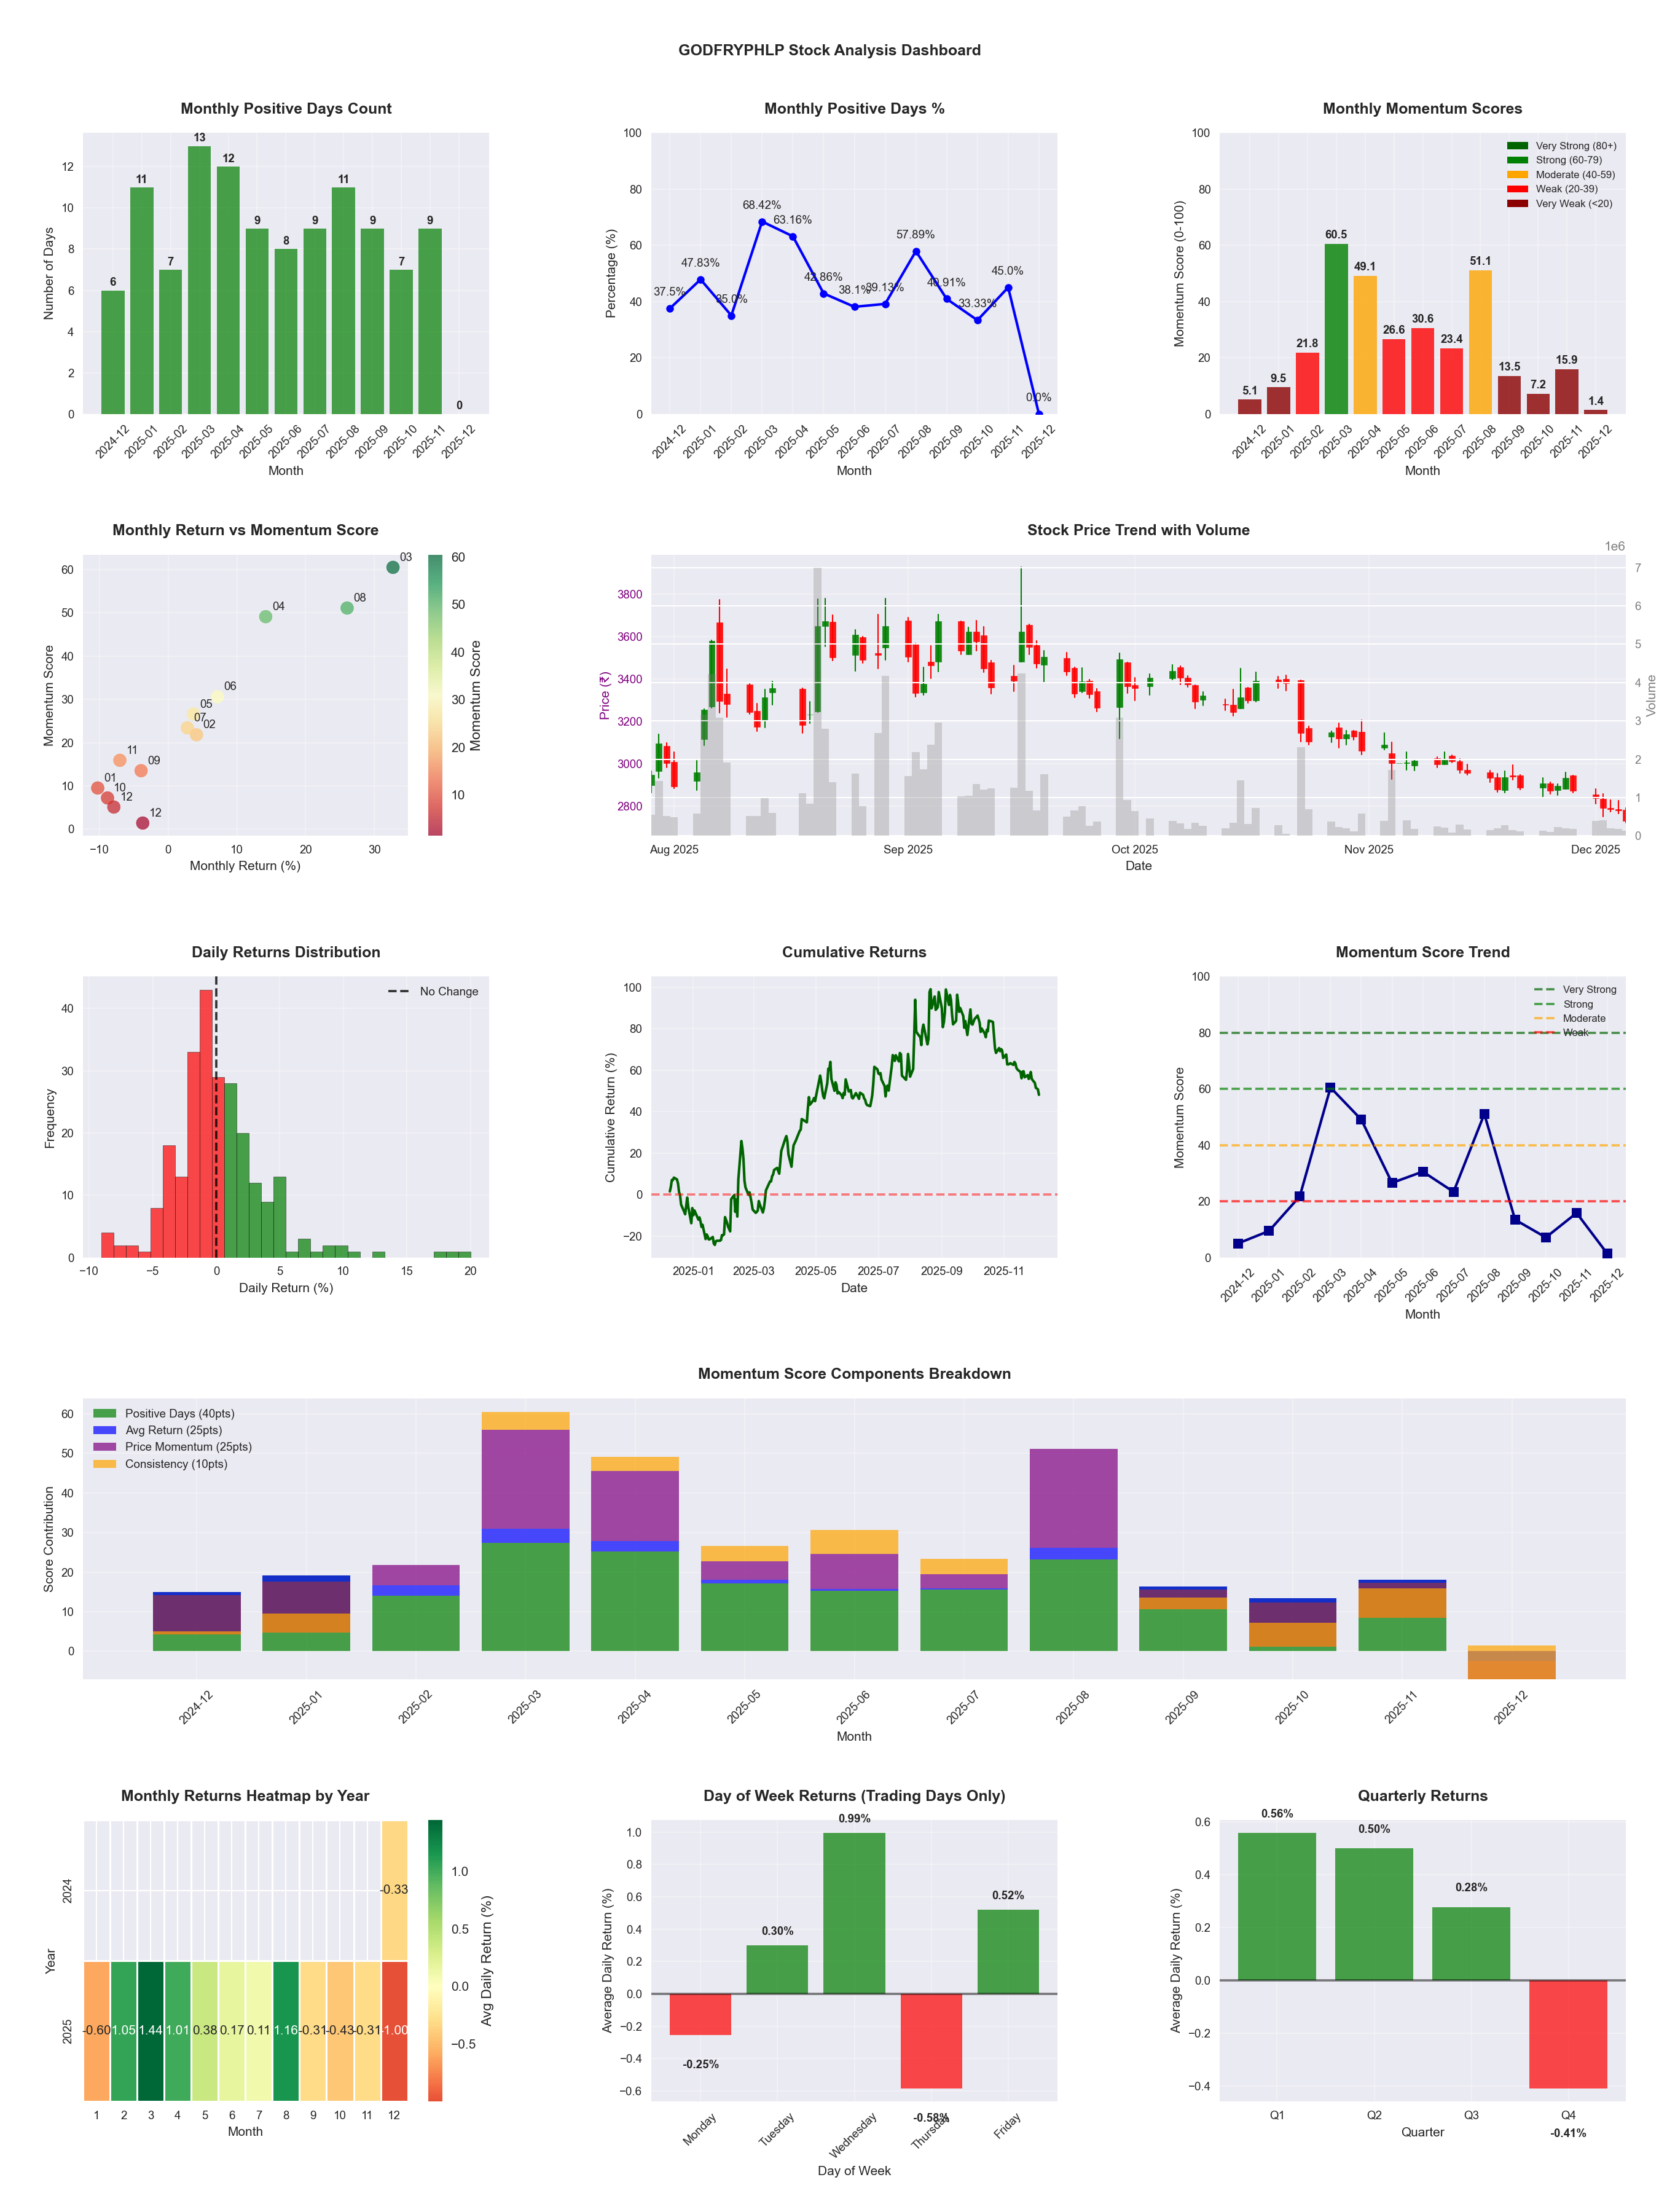
📊 Key Insights & Metrics
Symbol
📈 GODFRYPHLP
Date
📅 2026-04-11
Volatility
🔴 3.50%
Risk Profile
⚠️ suitable for aggressive investors
Win Rate
⚠️ 44.3%
Avg Daily Return
📈 +0.02%
Max Drawdown
📉 -49.79%
IBD RS Score
📊 21.5
Weak
Market Rank
#387
Best Month
🏆 2026-04
Worst Month
📉 2026-01
Best Months to Trade
📅 Apr, Aug, May
Best Days to Trade
📅 Wednesday, Tuesday
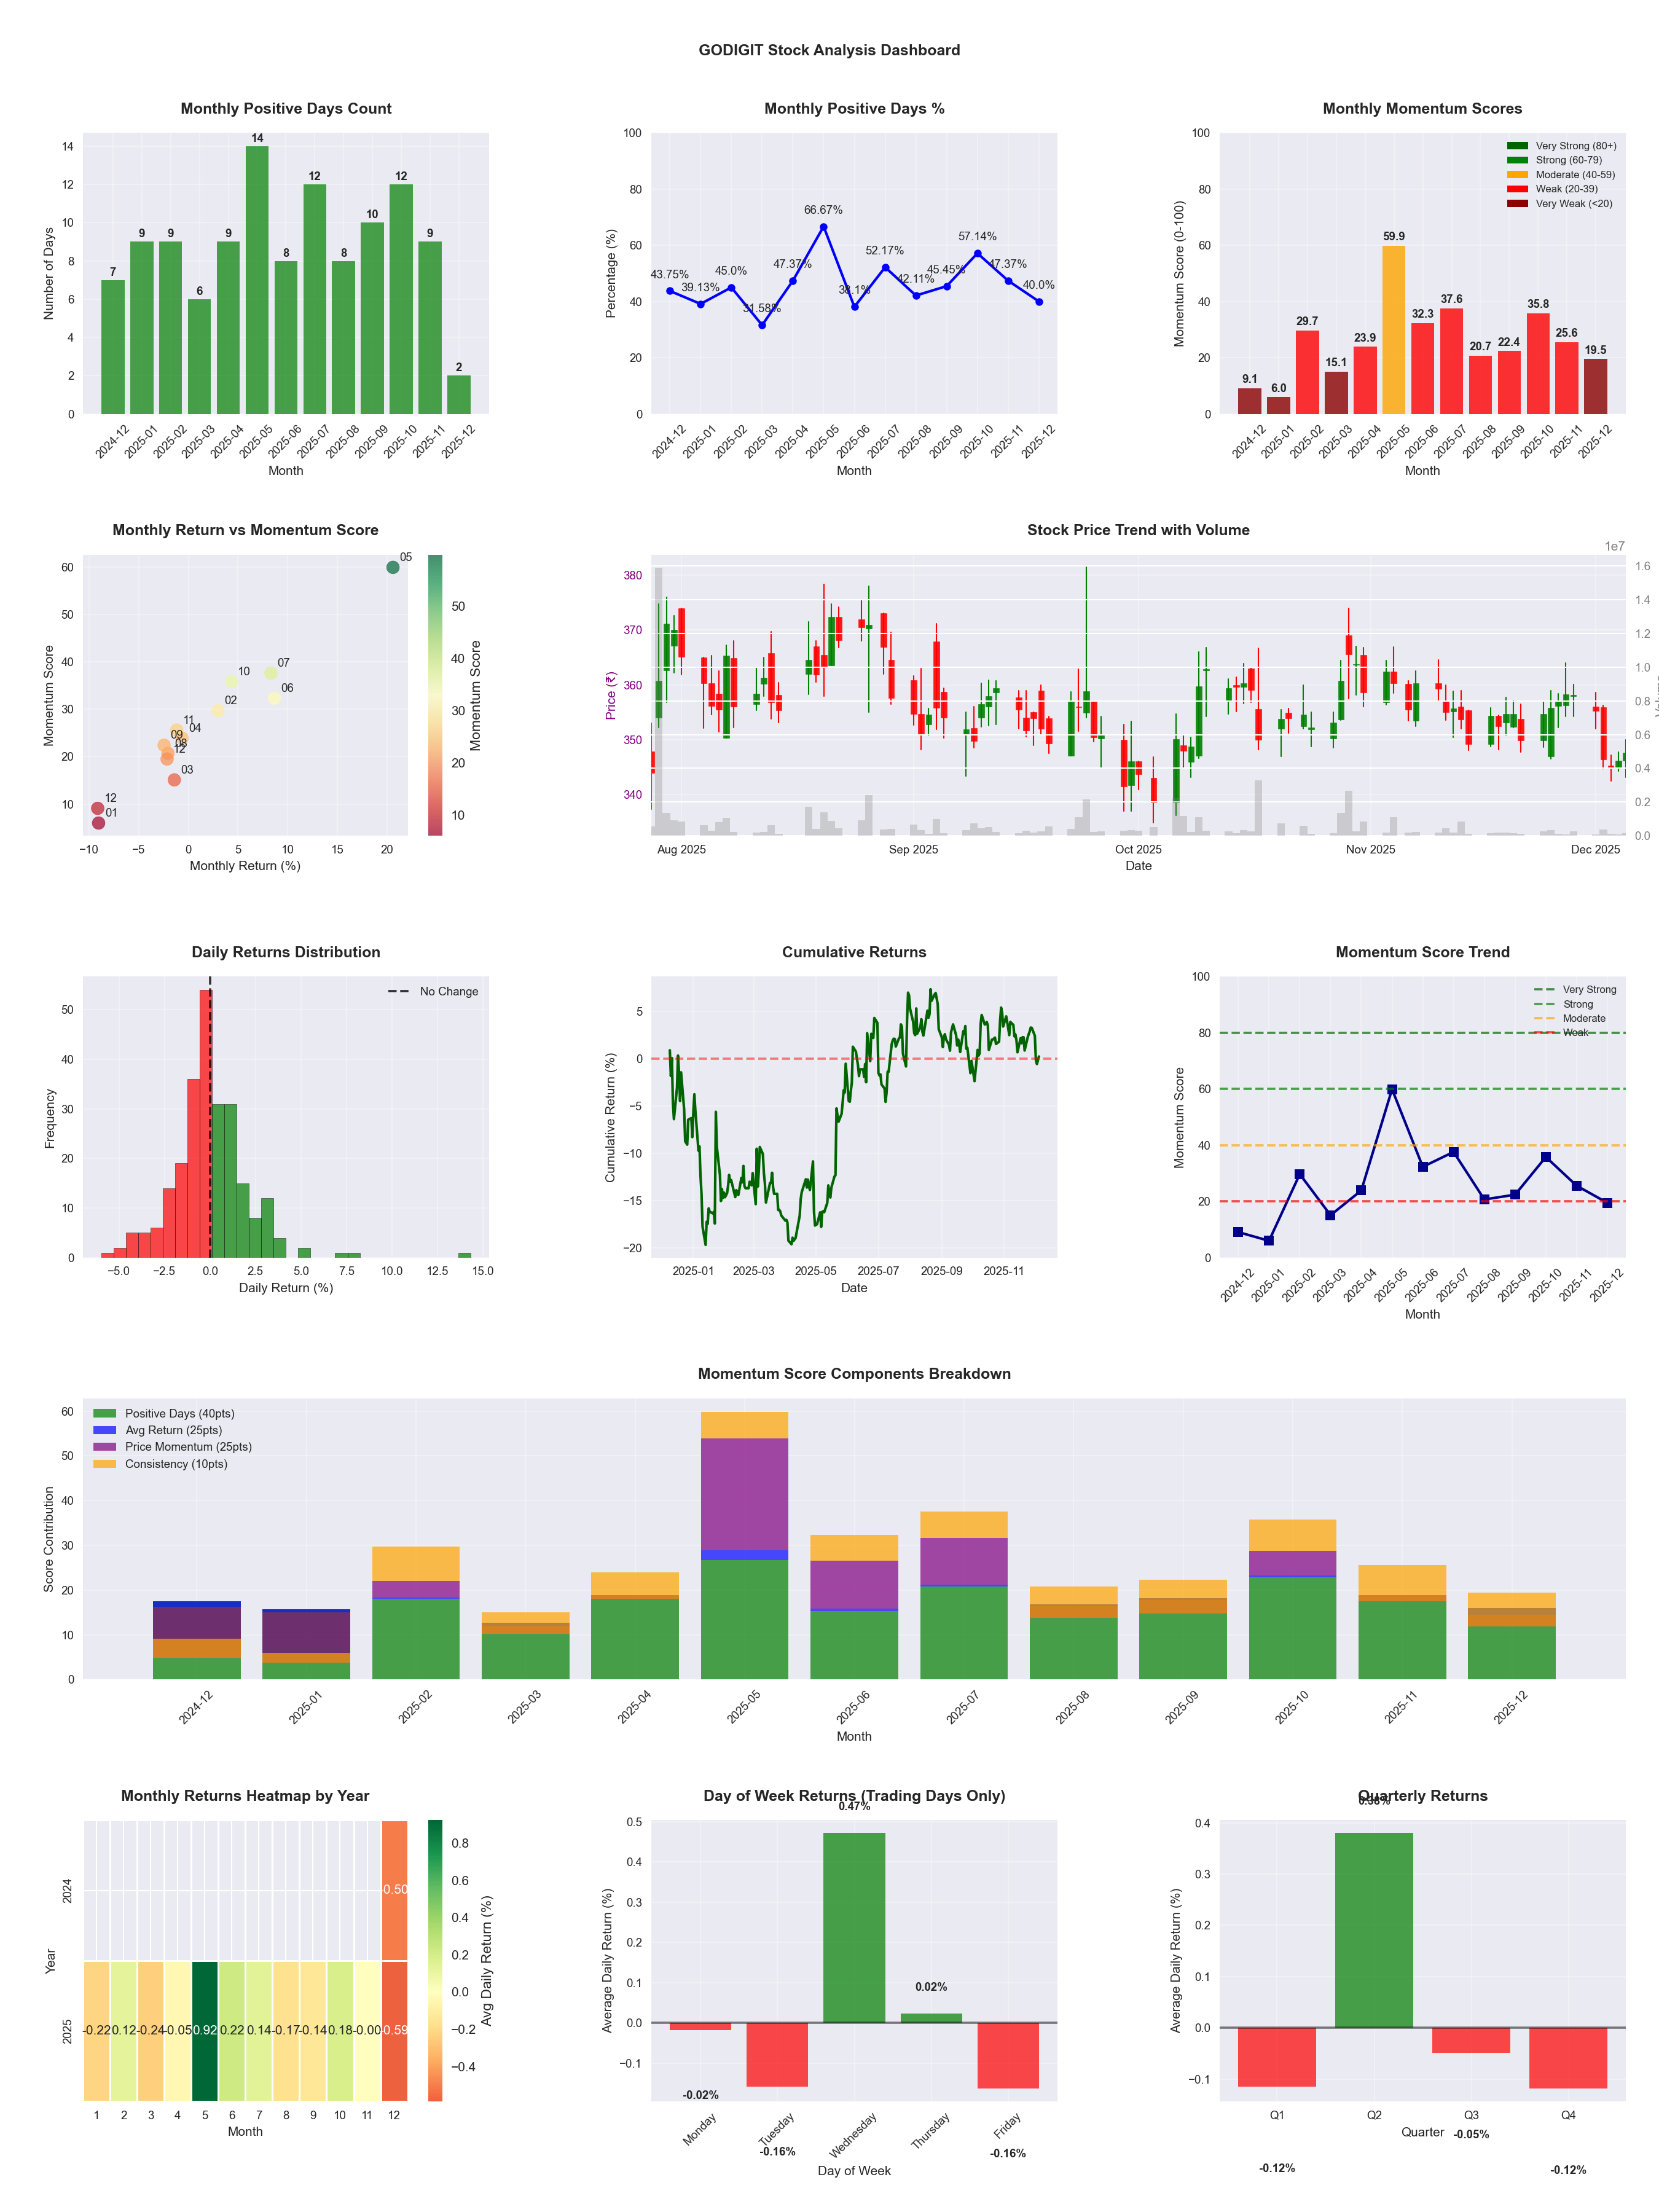
📊 Key Insights & Metrics
Symbol
📈 GODIGIT
Date
📅 2026-04-11
Volatility
🟡 1.63%
Win Rate
⚠️ 48.2%
Avg Daily Return
📈 +0.07%
Max Drawdown
📉 -16.25%
IBD RS Score
📊 53.1
Average
Market Rank
#231
Best Month
🏆 2025-05
Worst Month
📉 2026-01
Best Months to Trade
📅 May, Jun, Oct
Best Days to Trade
📅 Wednesday, Monday
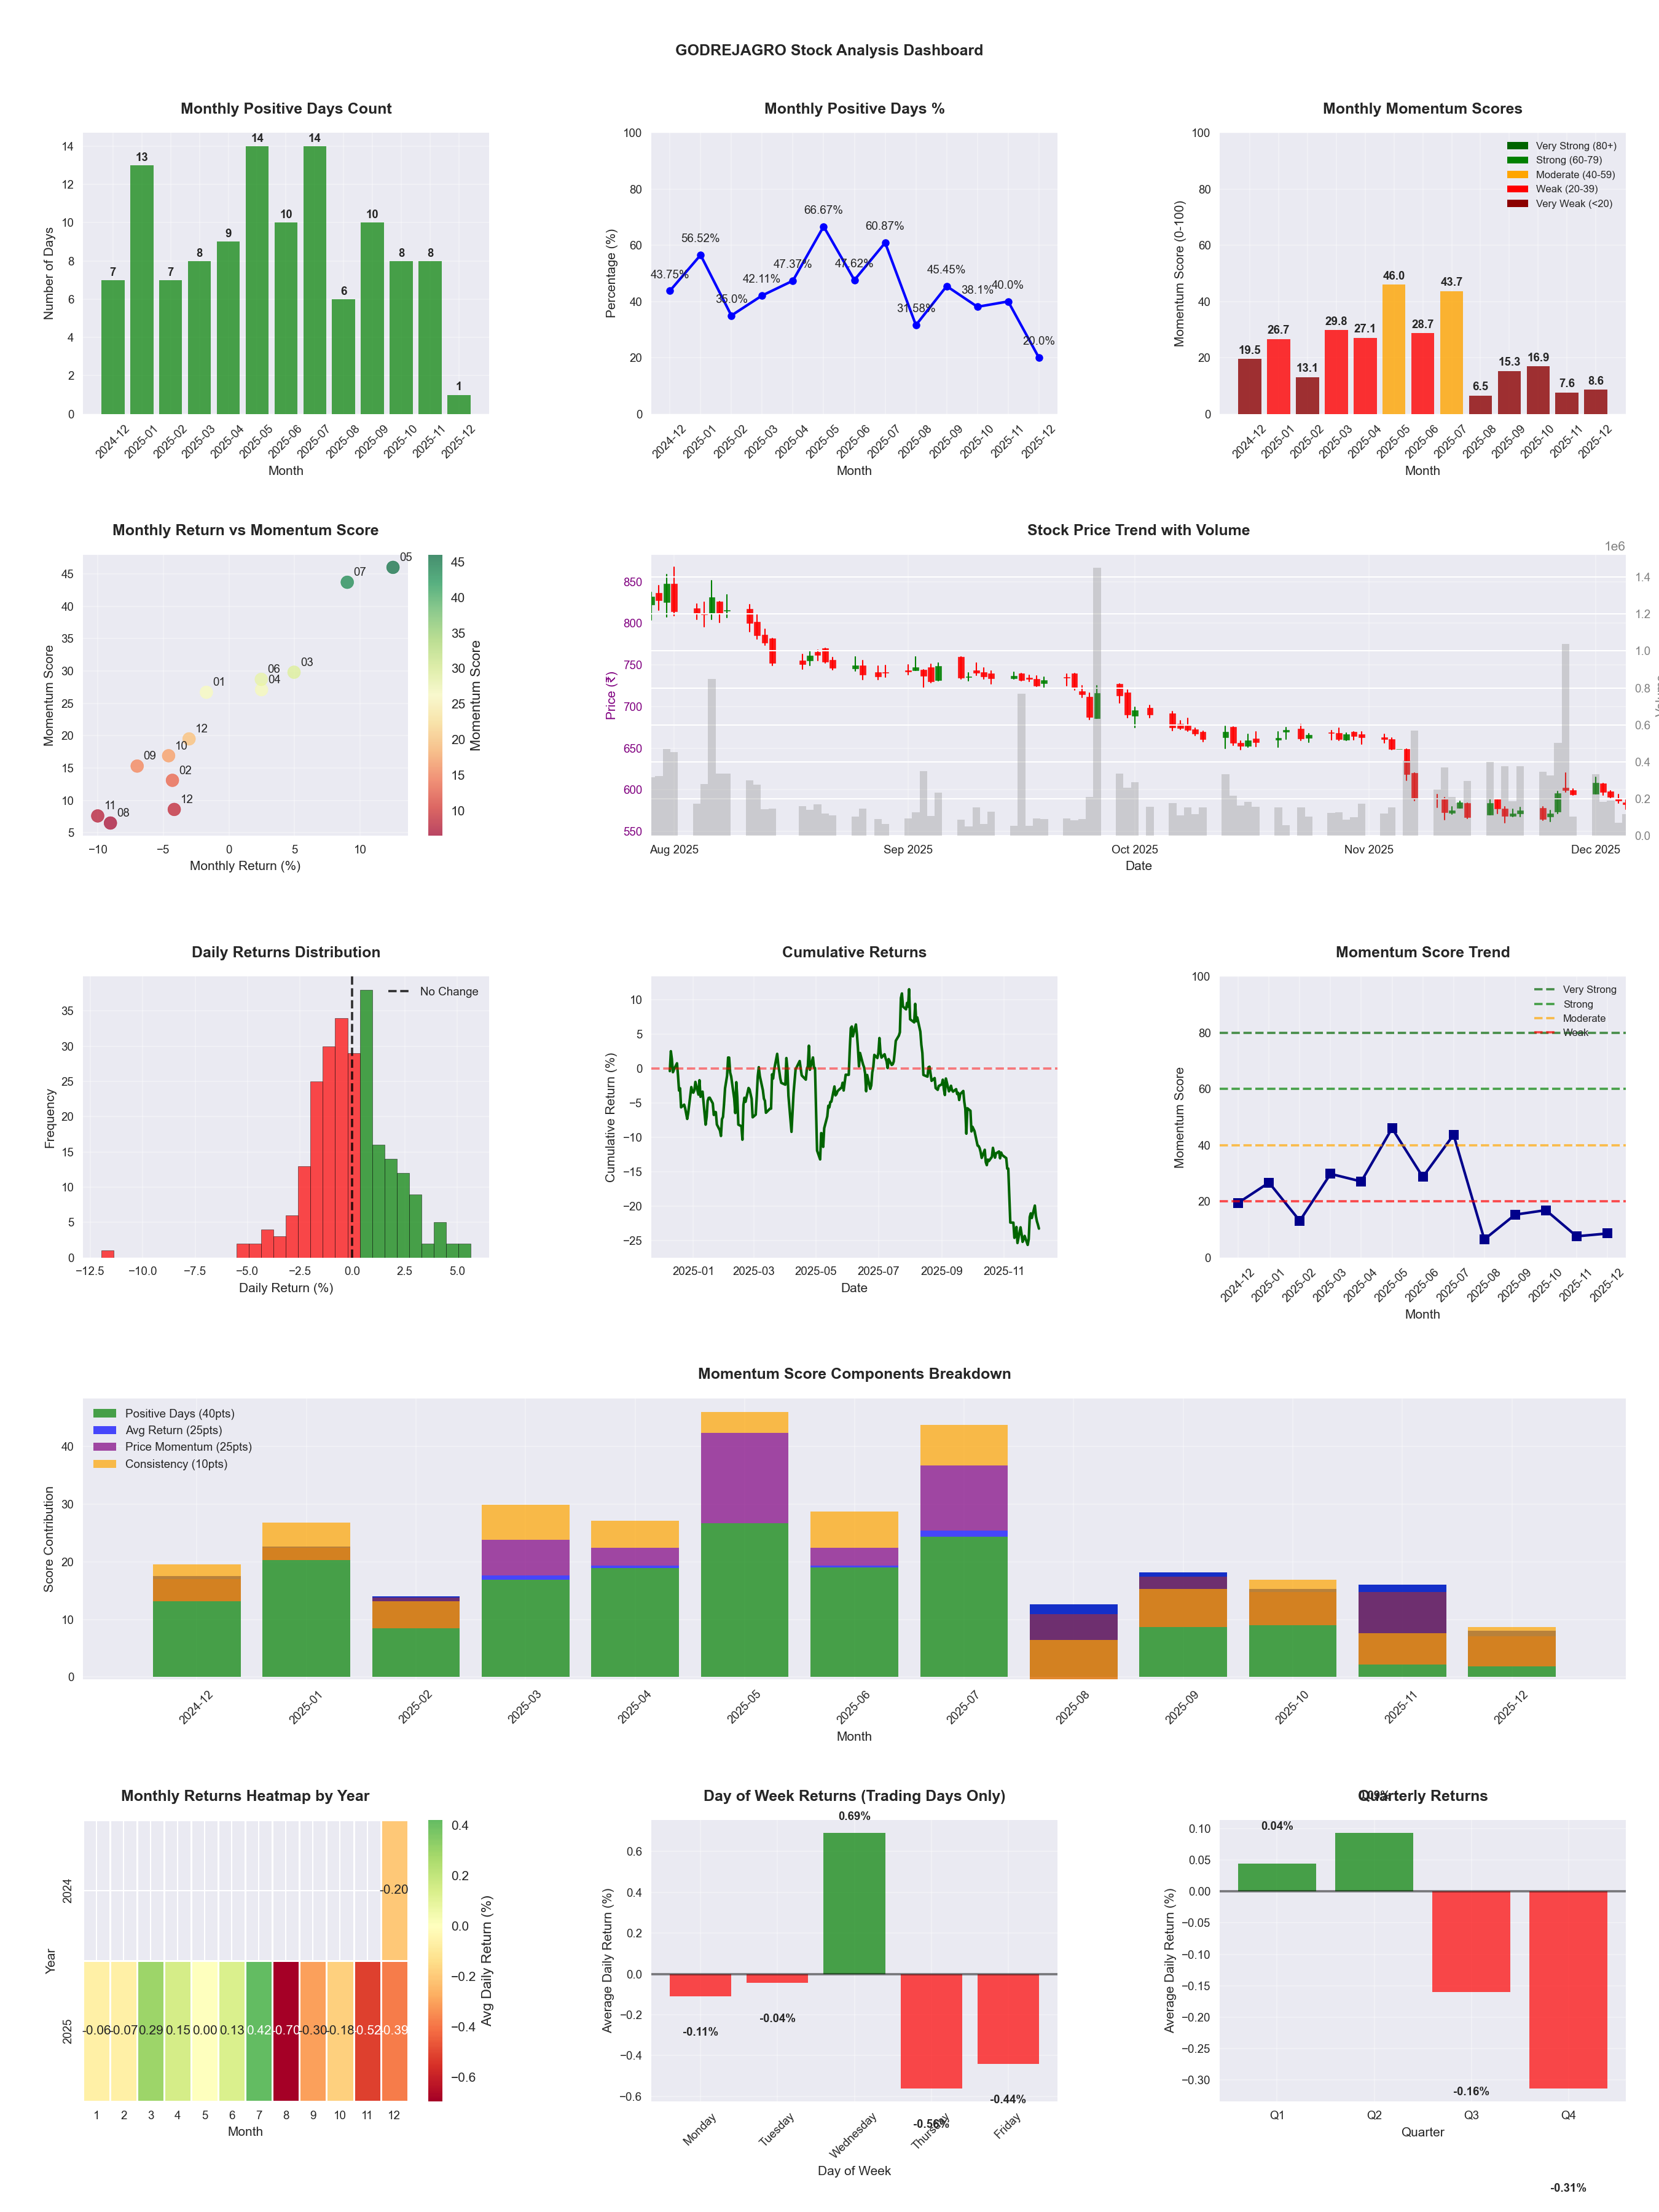
📊 Key Insights & Metrics
Symbol
📈 GODREJAGRO
Date
📅 2026-04-11
Volatility
🟡 2.03%
Risk Profile
⚠️ suitable for aggressive investors
Win Rate
⚠️ 45.9%
Avg Daily Return
📉 -0.08%
Max Drawdown
📉 -39.45%
IBD RS Score
📊 42.8
Weak
Market Rank
#282
Best Month
🏆 2026-02
Worst Month
📉 2025-08
Best Months to Trade
📅 Feb, Apr, Jul
Best Days to Trade
📅 Wednesday, Tuesday
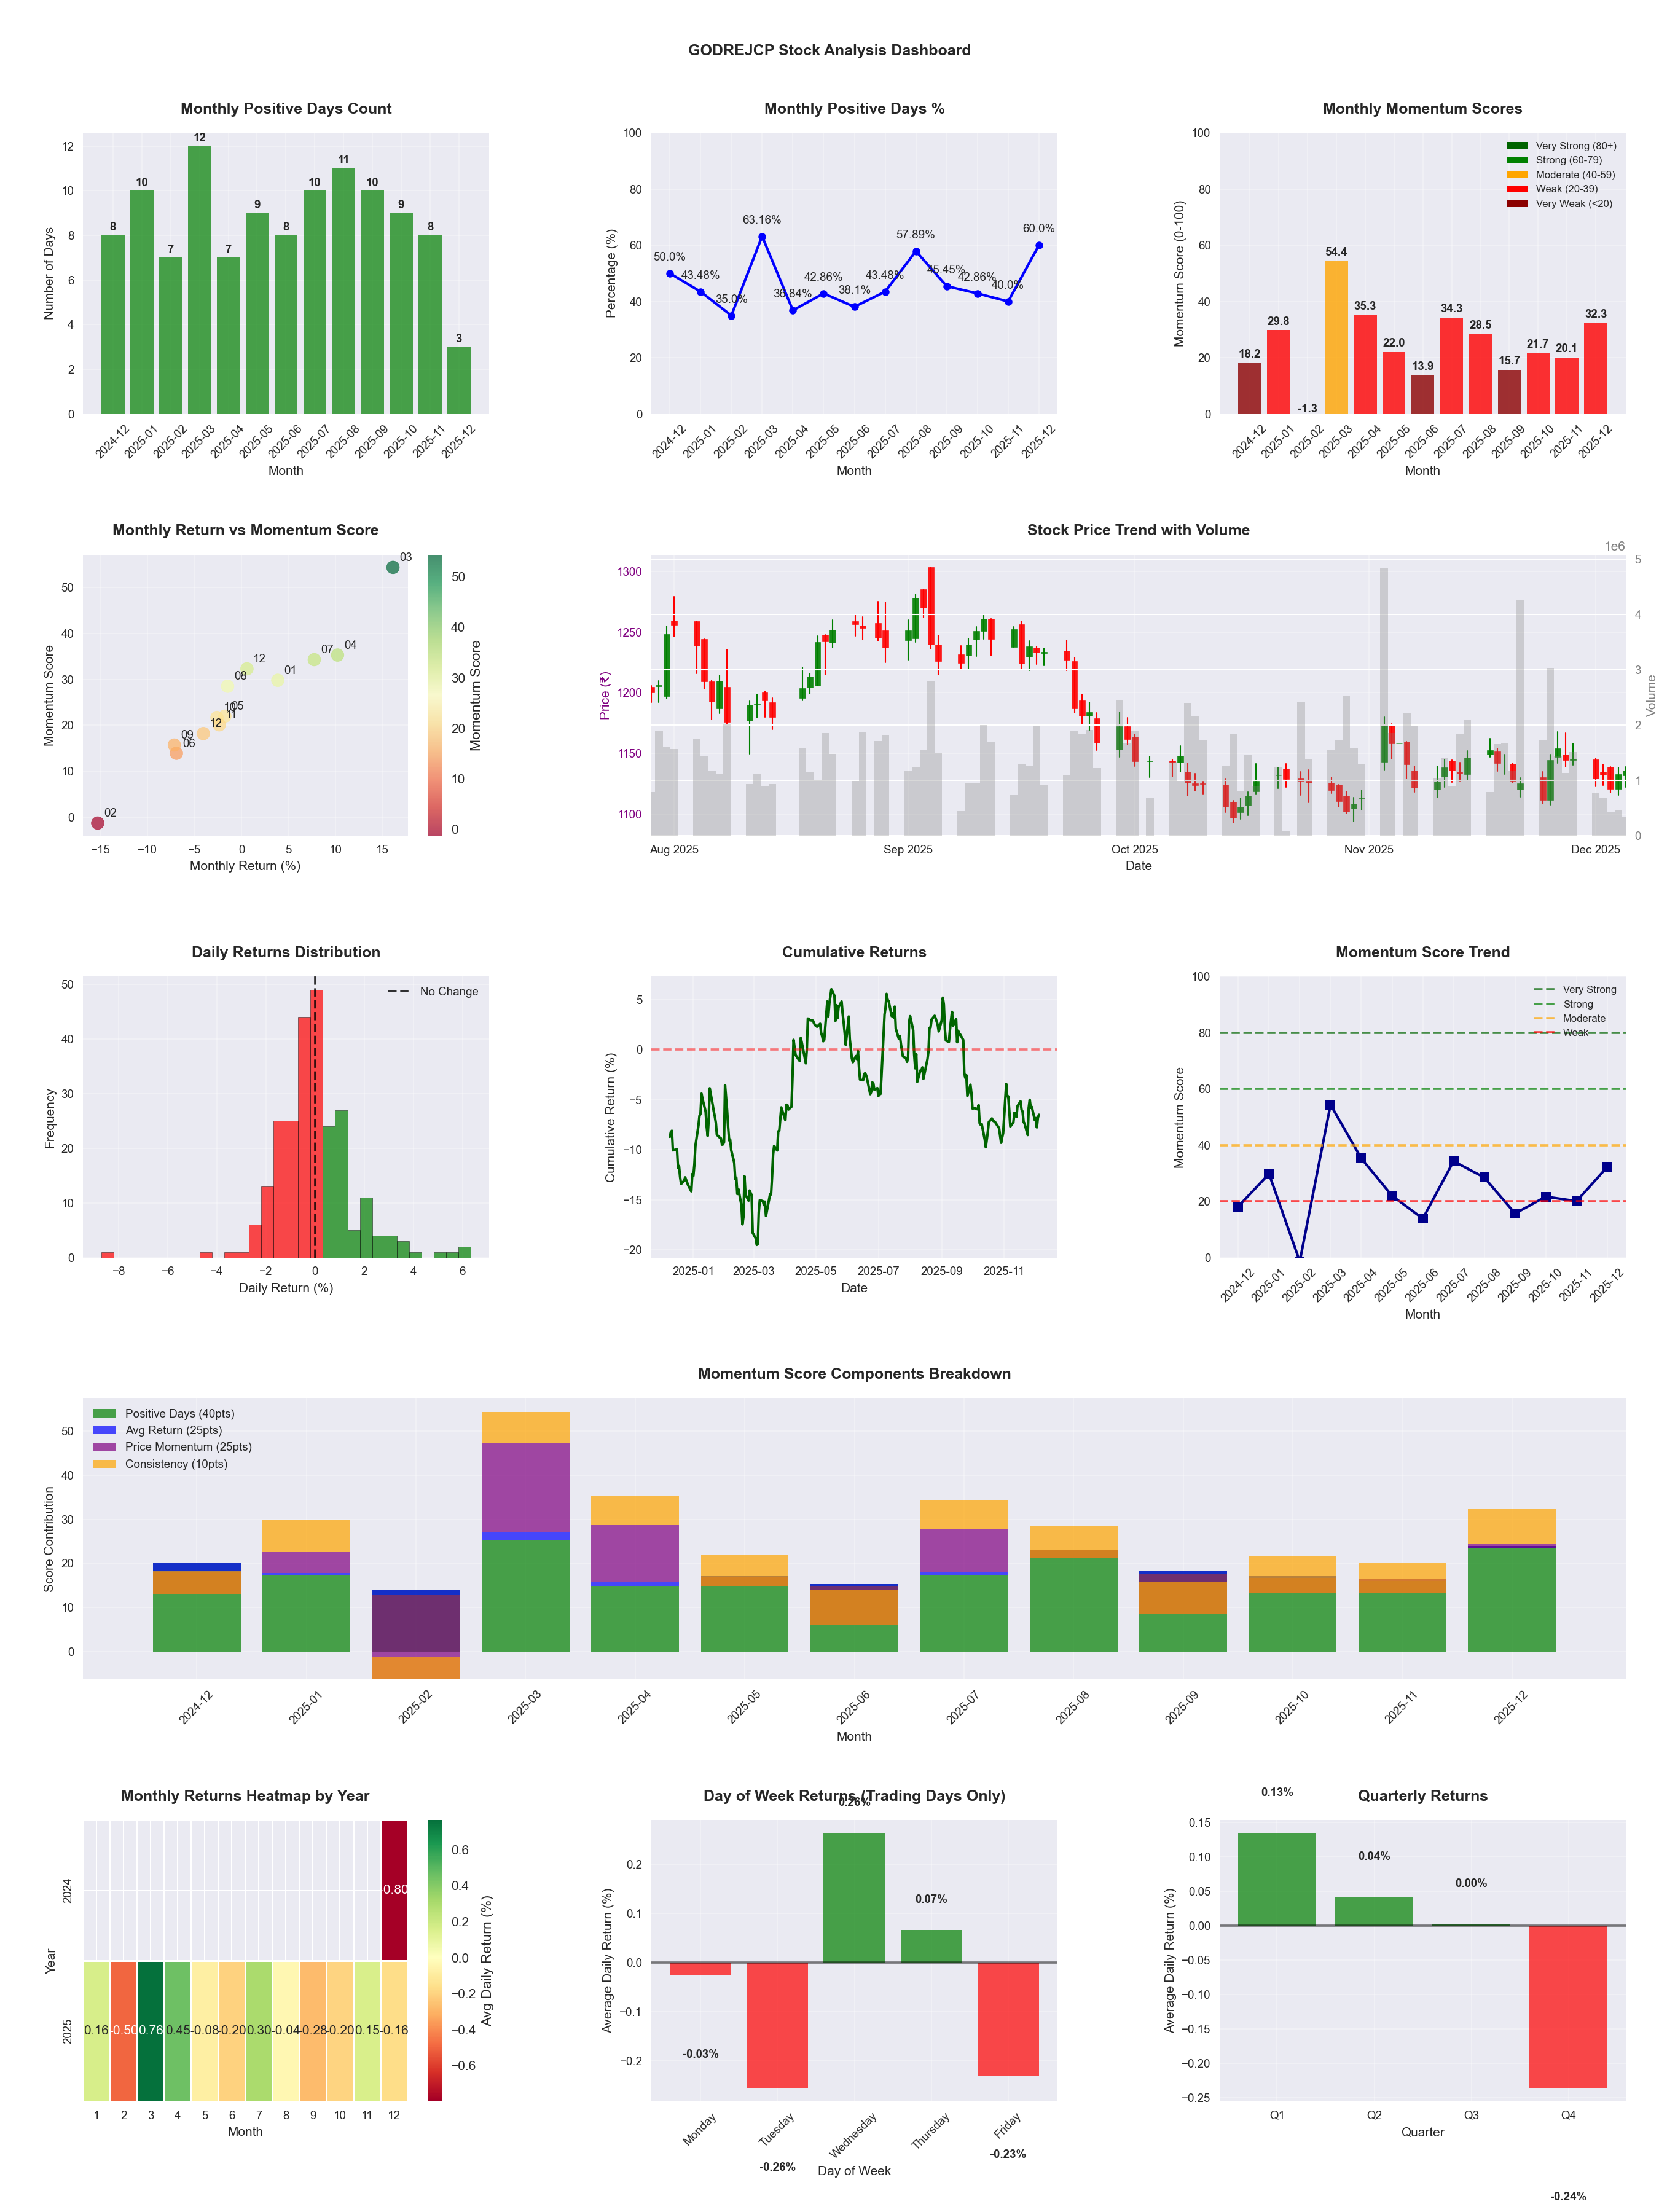
📊 Key Insights & Metrics
Symbol
📈 GODREJCP
Date
📅 2026-04-11
Volatility
🟢 1.46%
Win Rate
⚠️ 47.6%
Avg Daily Return
📉 -0.03%
Max Drawdown
📉 -23.23%
IBD RS Score
📊 37.3
Weak
Market Rank
#309
Best Month
🏆 2026-04
Best Months to Trade
📅 Apr, Jul, Dec
Best Days to Trade
📅 Wednesday, Monday
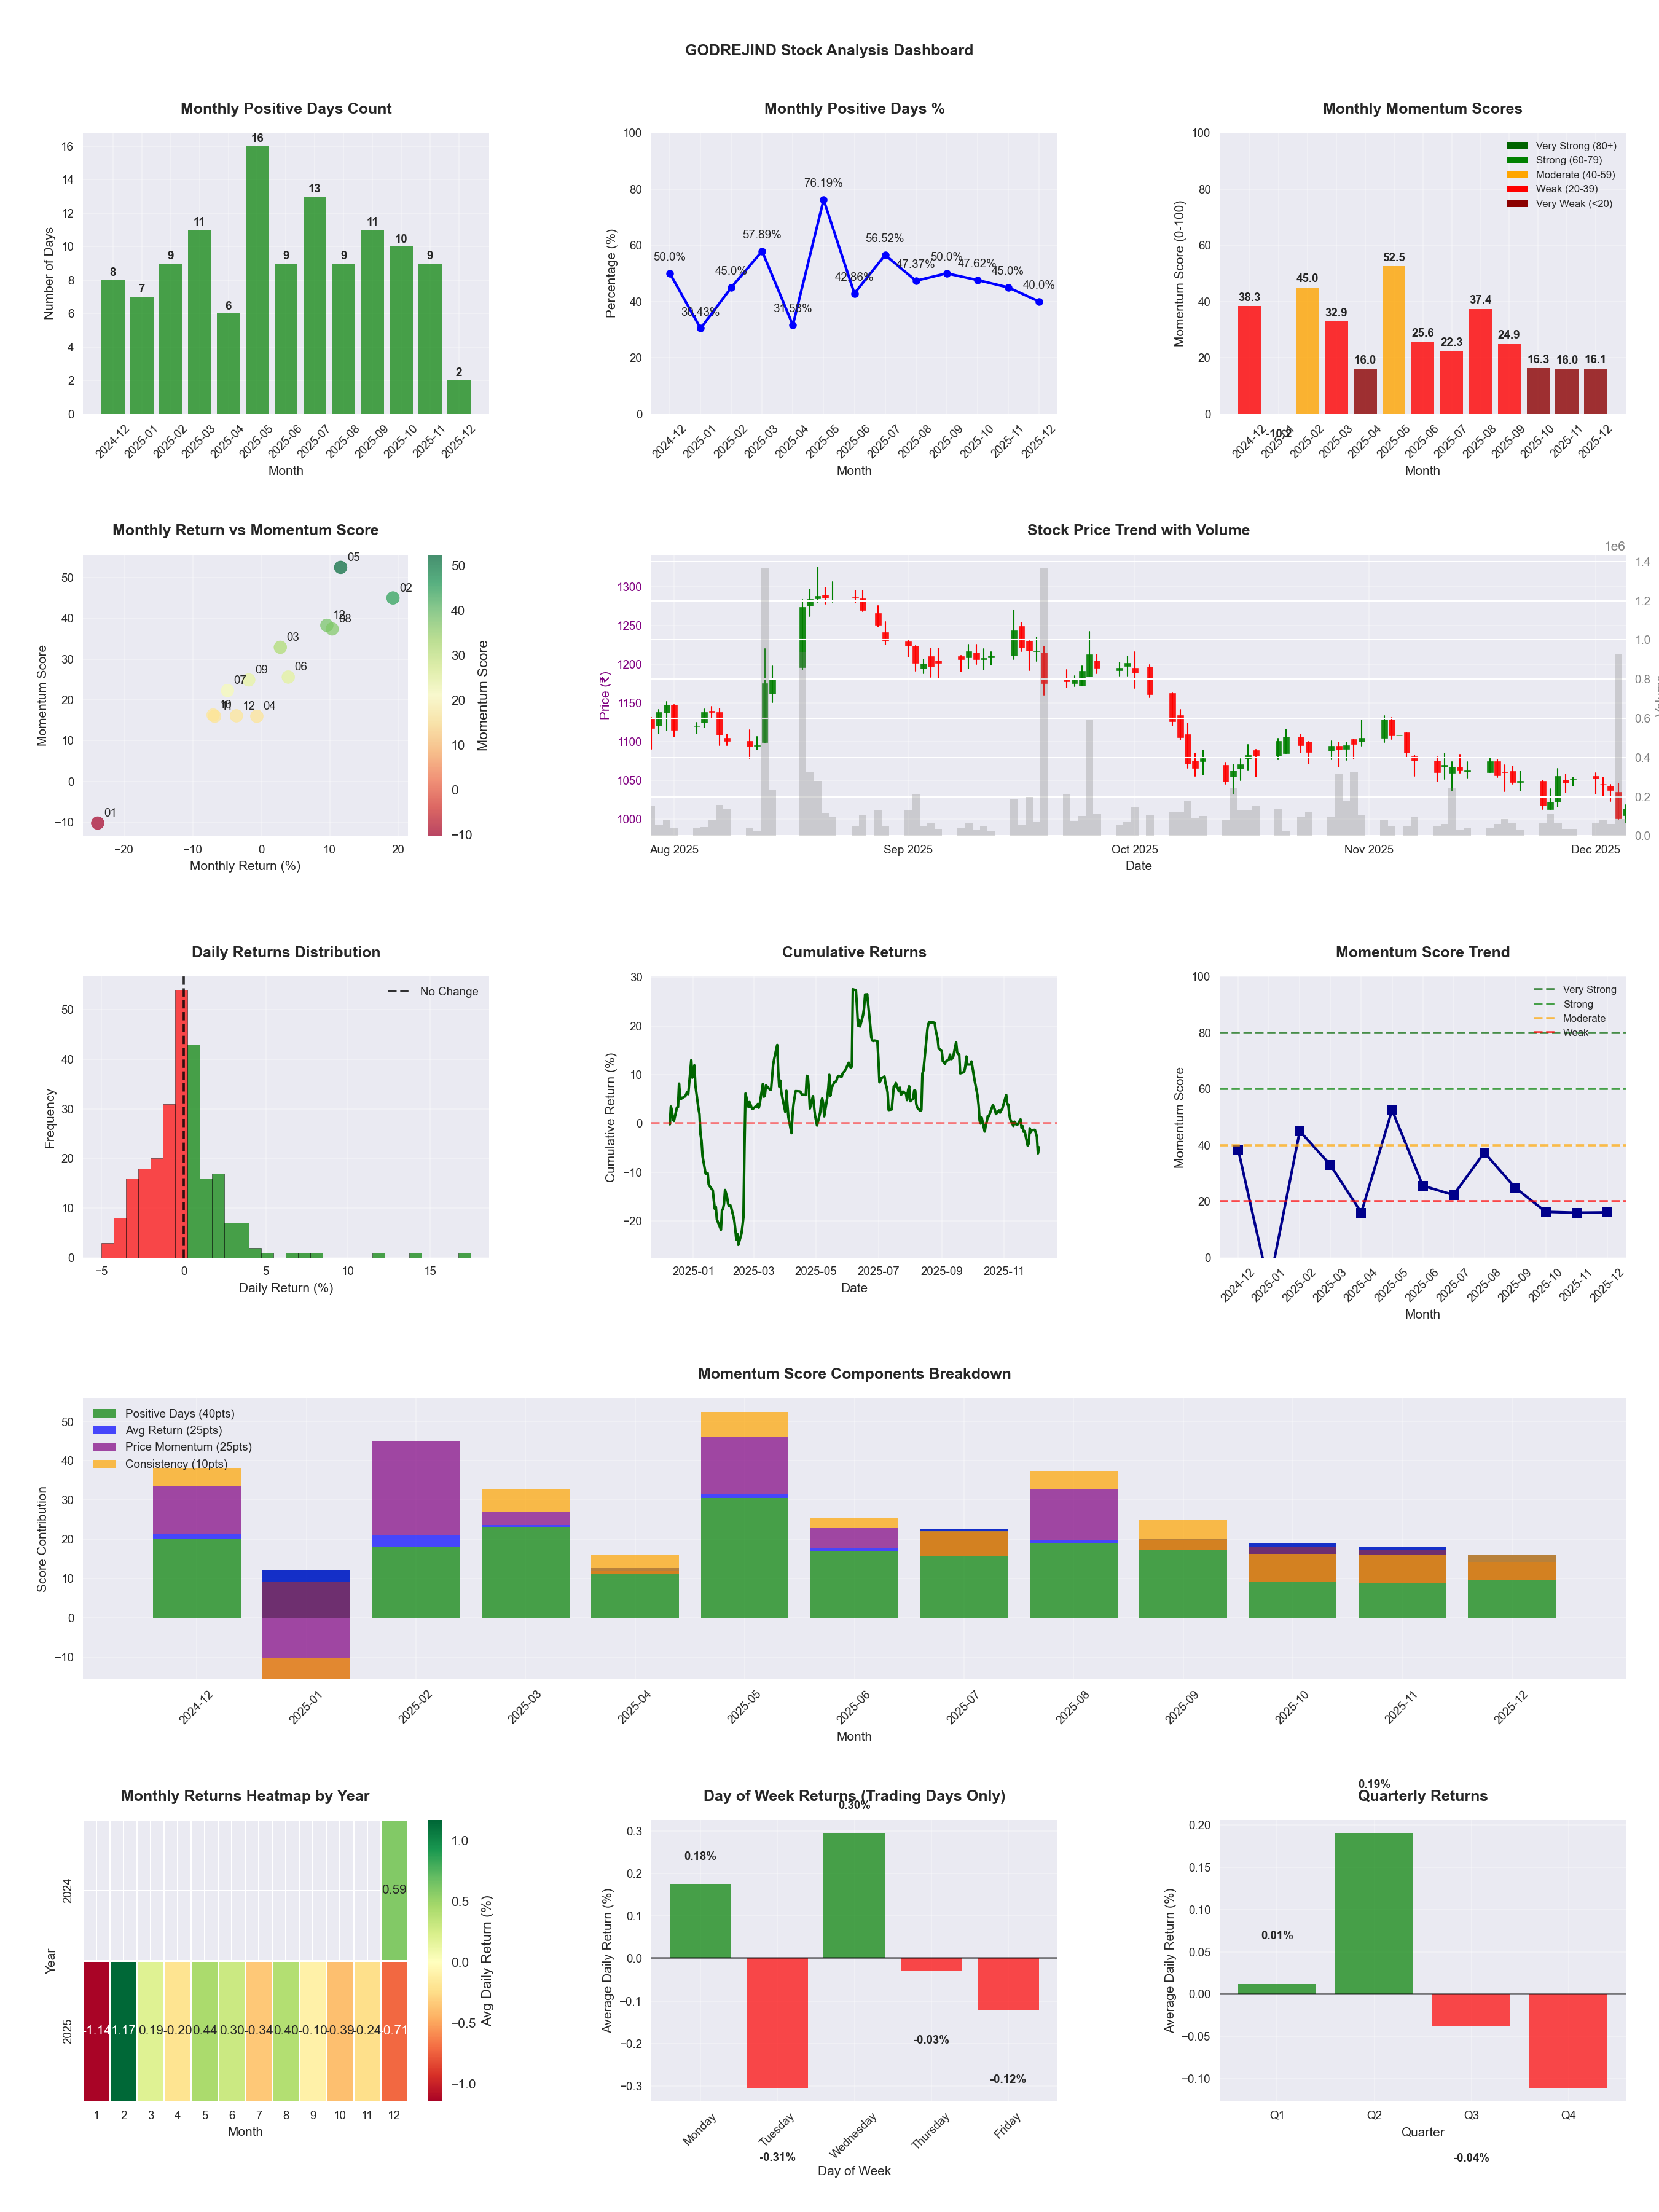
📊 Key Insights & Metrics
Symbol
📈 GODREJIND
Date
📅 2026-04-11
Volatility
🟡 2.21%
Risk Profile
⚠️ suitable for aggressive investors
Win Rate
⚠️ 50.0%
Avg Daily Return
📉 -0.07%
Max Drawdown
📉 -44.91%
IBD RS Score
📊 21.3
Weak
Market Rank
#388
Best Month
🏆 2025-05
Best Months to Trade
📅 Apr, May, Aug
Best Days to Trade
📅 Wednesday, Monday
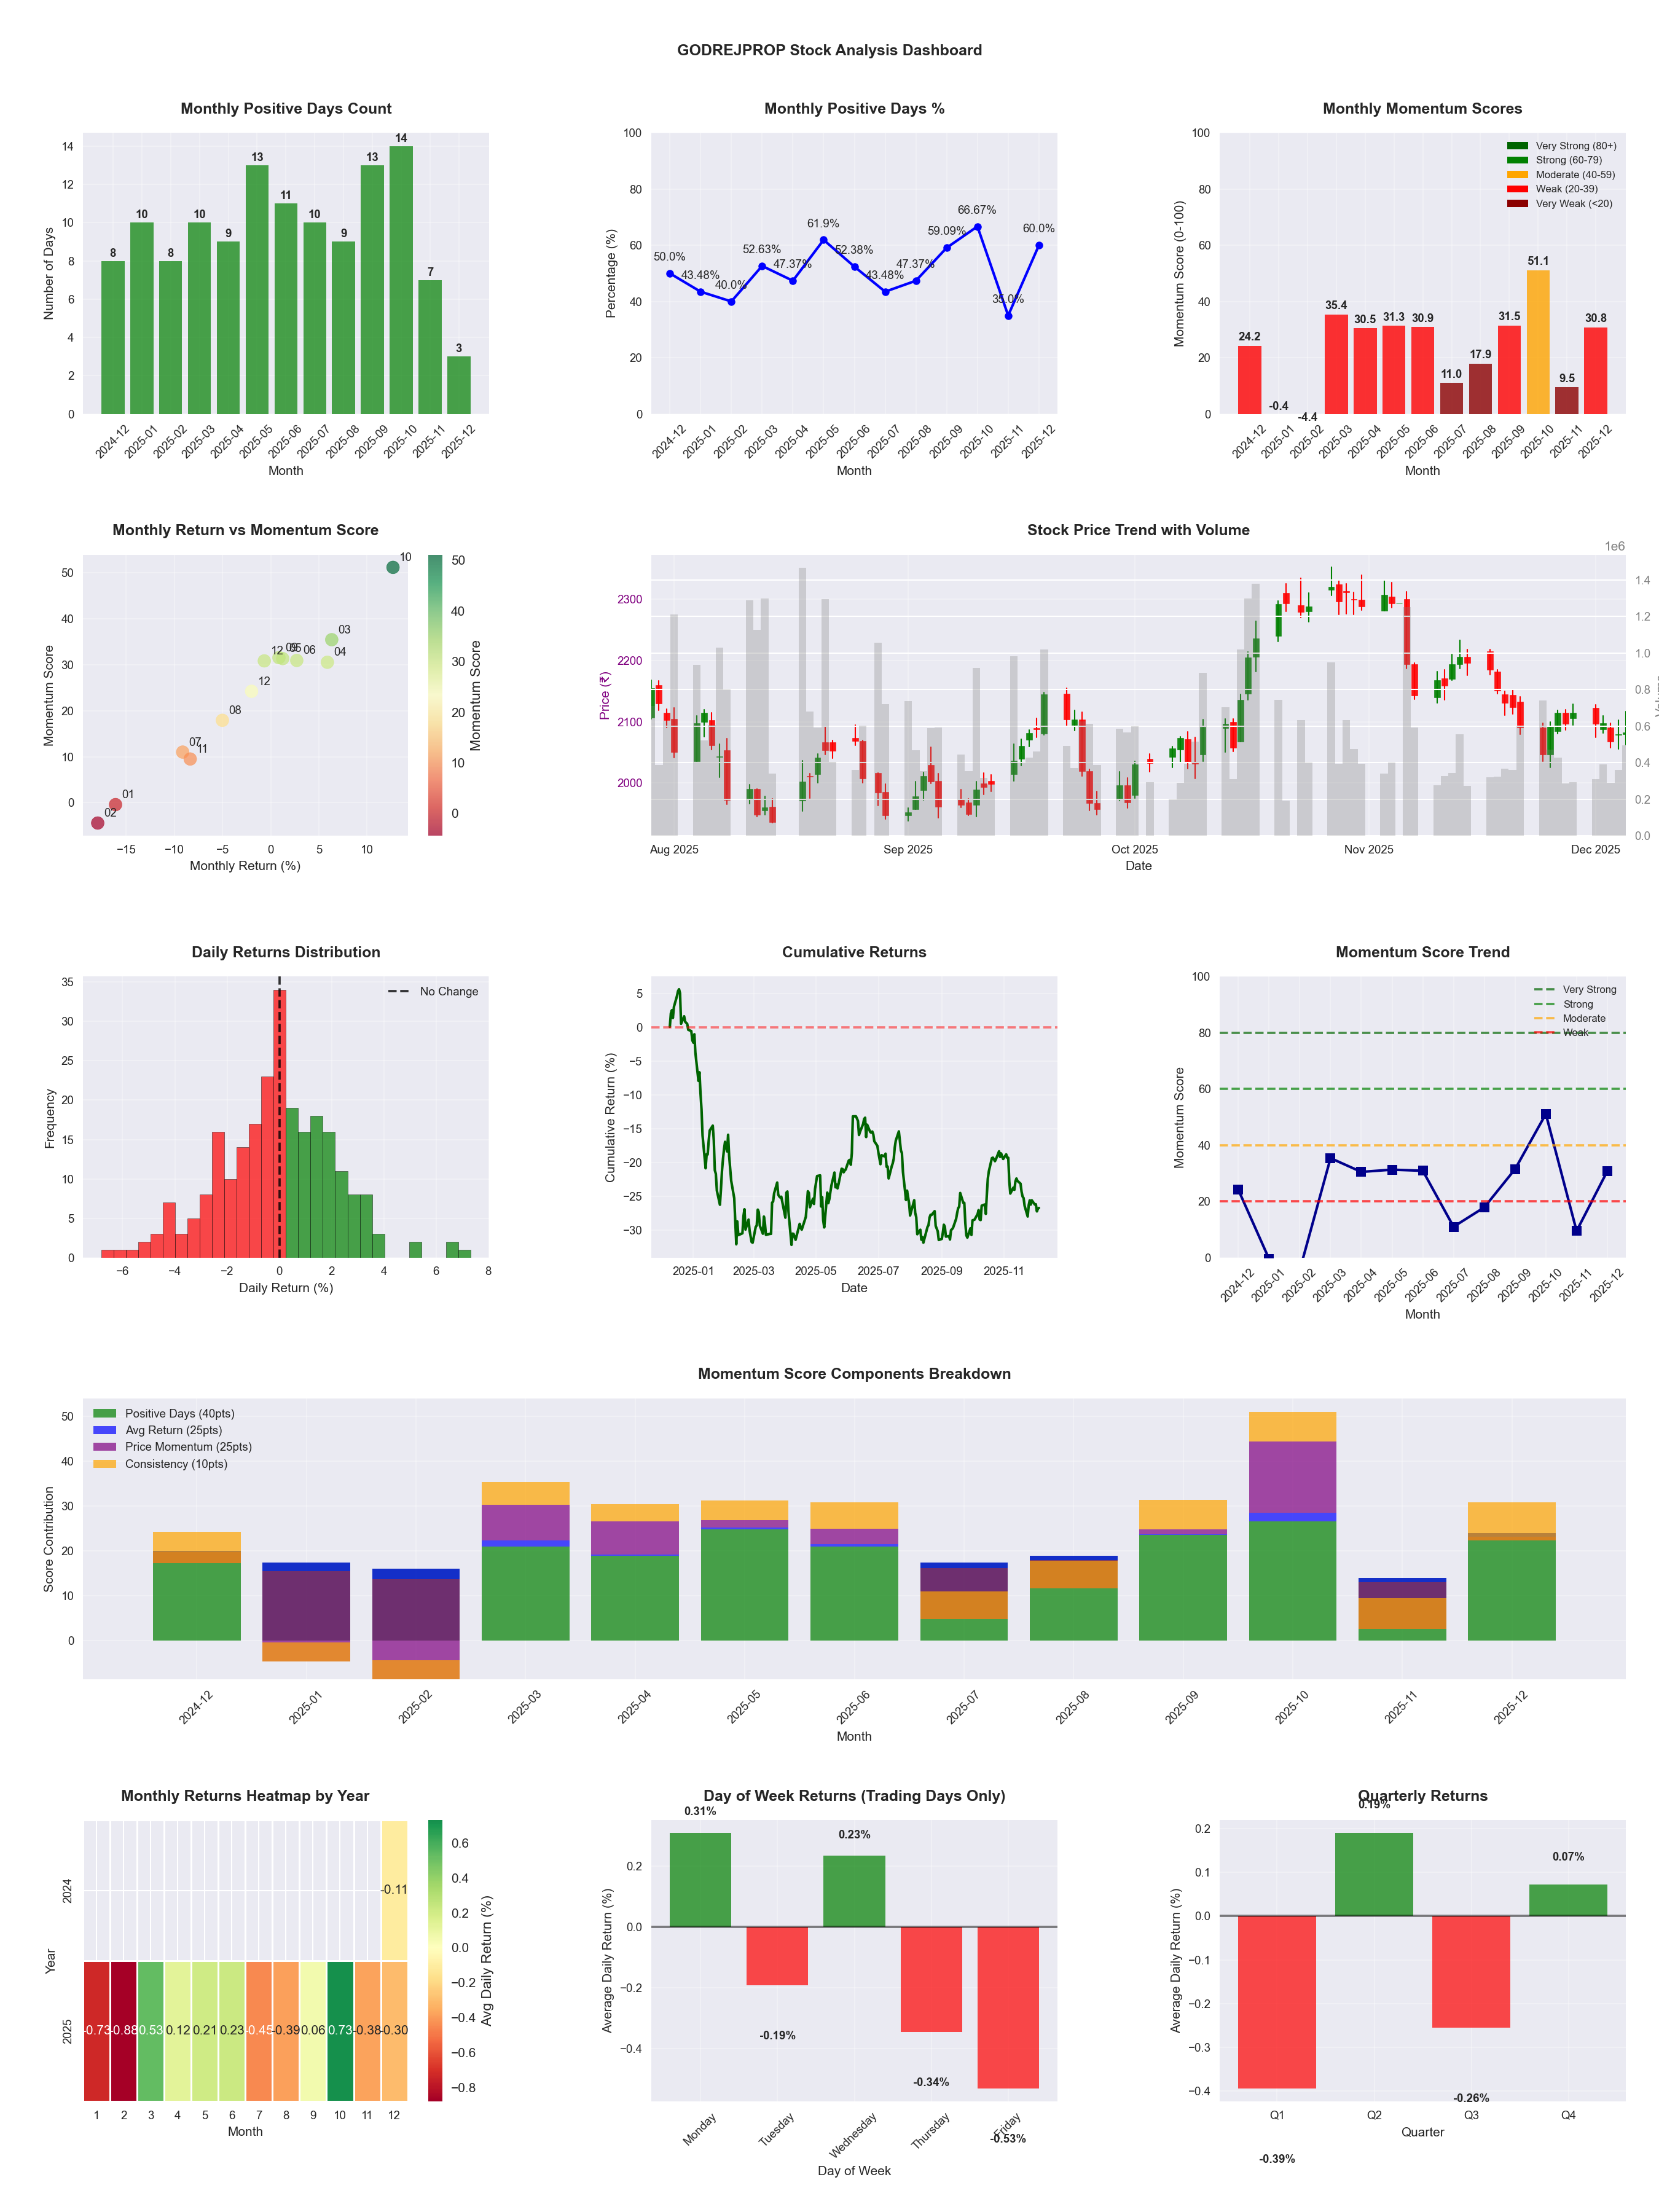
📊 Key Insights & Metrics
Symbol
📈 GODREJPROP
Date
📅 2026-04-11
Volatility
🟡 2.24%
Risk Profile
⚠️ suitable for aggressive investors
Win Rate
⚠️ 50.8%
Avg Daily Return
📉 -0.03%
Max Drawdown
📉 -40.37%
IBD RS Score
📊 20.1
Weak
Market Rank
#394
Best Month
🏆 2026-04
Best Months to Trade
📅 Apr, Oct, Feb
Best Days to Trade
📅 Monday, Wednesday
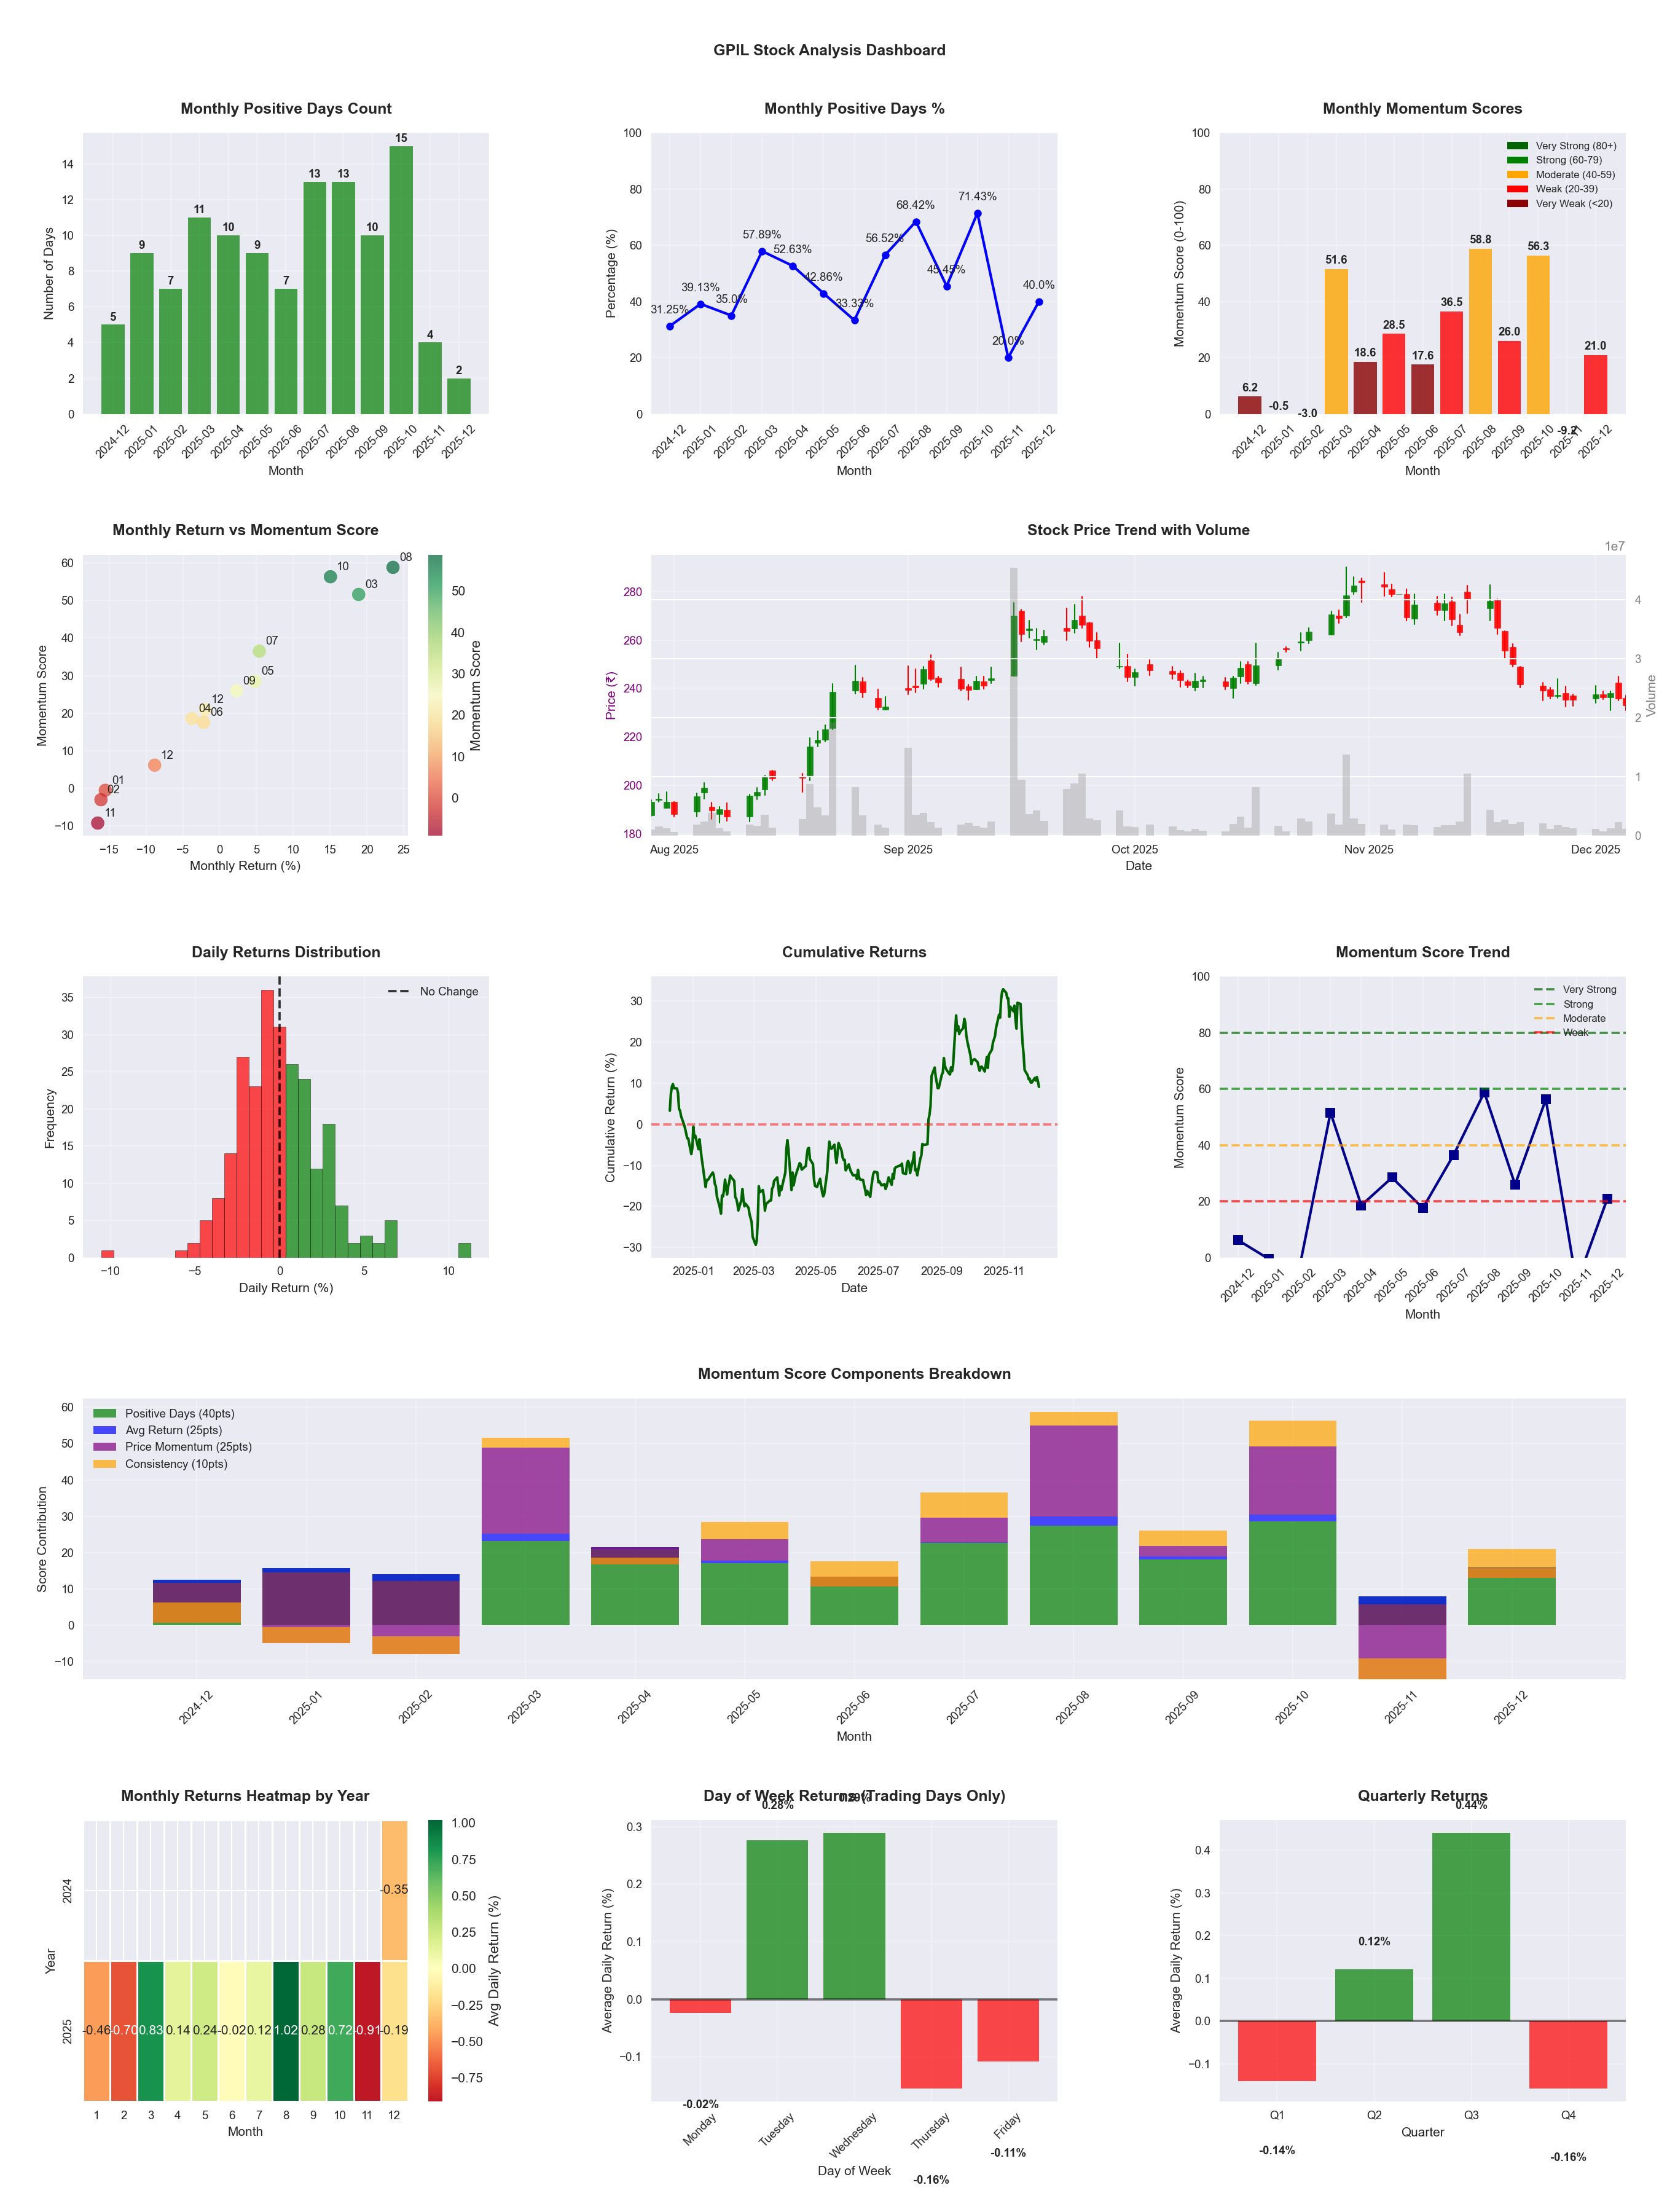
📊 Key Insights & Metrics
Symbol
📈 GPIL
Date
📅 2026-04-11
Volatility
🟡 2.36%
Risk Profile
⚠️ suitable for aggressive investors
Win Rate
⚠️ 50.4%
Avg Daily Return
📈 +0.21%
Max Drawdown
📉 -19.97%
IBD RS Score
📊 94.5
Leader
Market Rank
#27
Best Month
🏆 2025-08
Best Months to Trade
📅 Aug, Oct, Dec
Best Days to Trade
📅 Tuesday, Monday
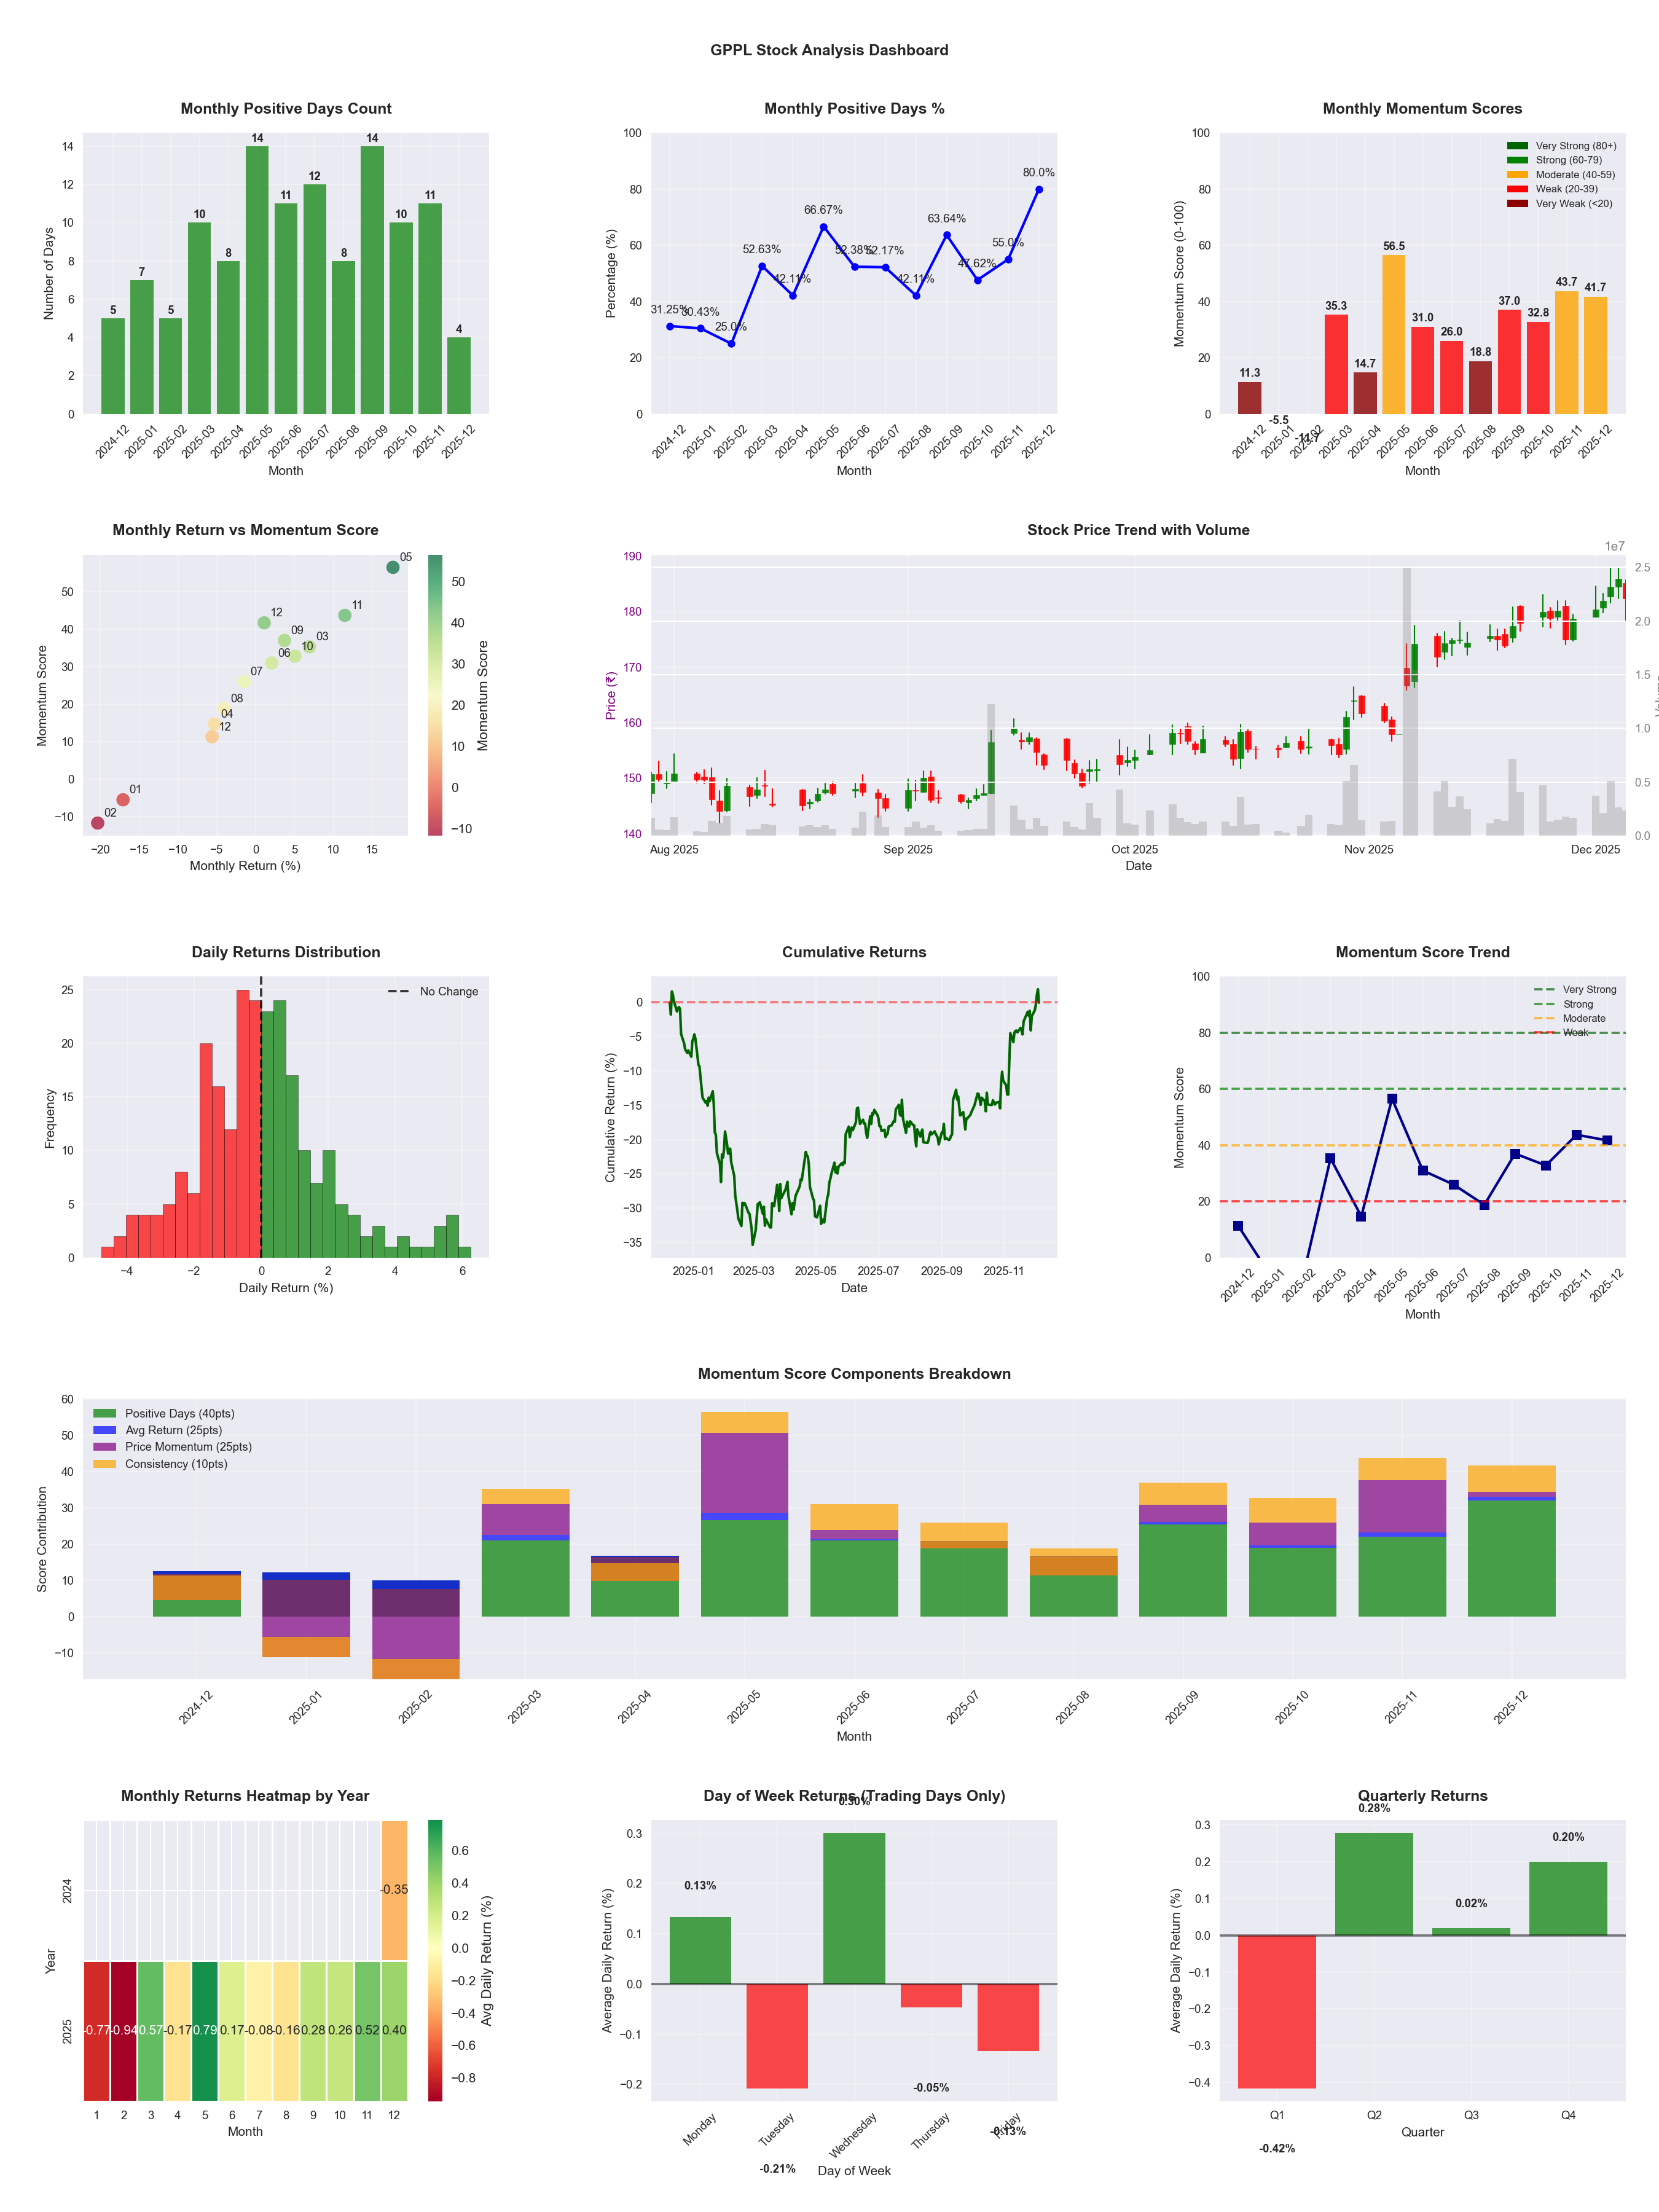
📊 Key Insights & Metrics
Symbol
📈 GPPL
Date
📅 2026-03-21
Volatility
🟡 2.01%
Risk Profile
⚠️ suitable for aggressive investors
Win Rate
⚠️ 53.4%
Avg Daily Return
📈 +0.09%
Max Drawdown
📉 -22.74%
Best Month
🏆 2025-05
Worst Month
📉 2026-03
Best Months to Trade
📅 May, Nov, Feb
Best Days to Trade
📅 Monday, Friday
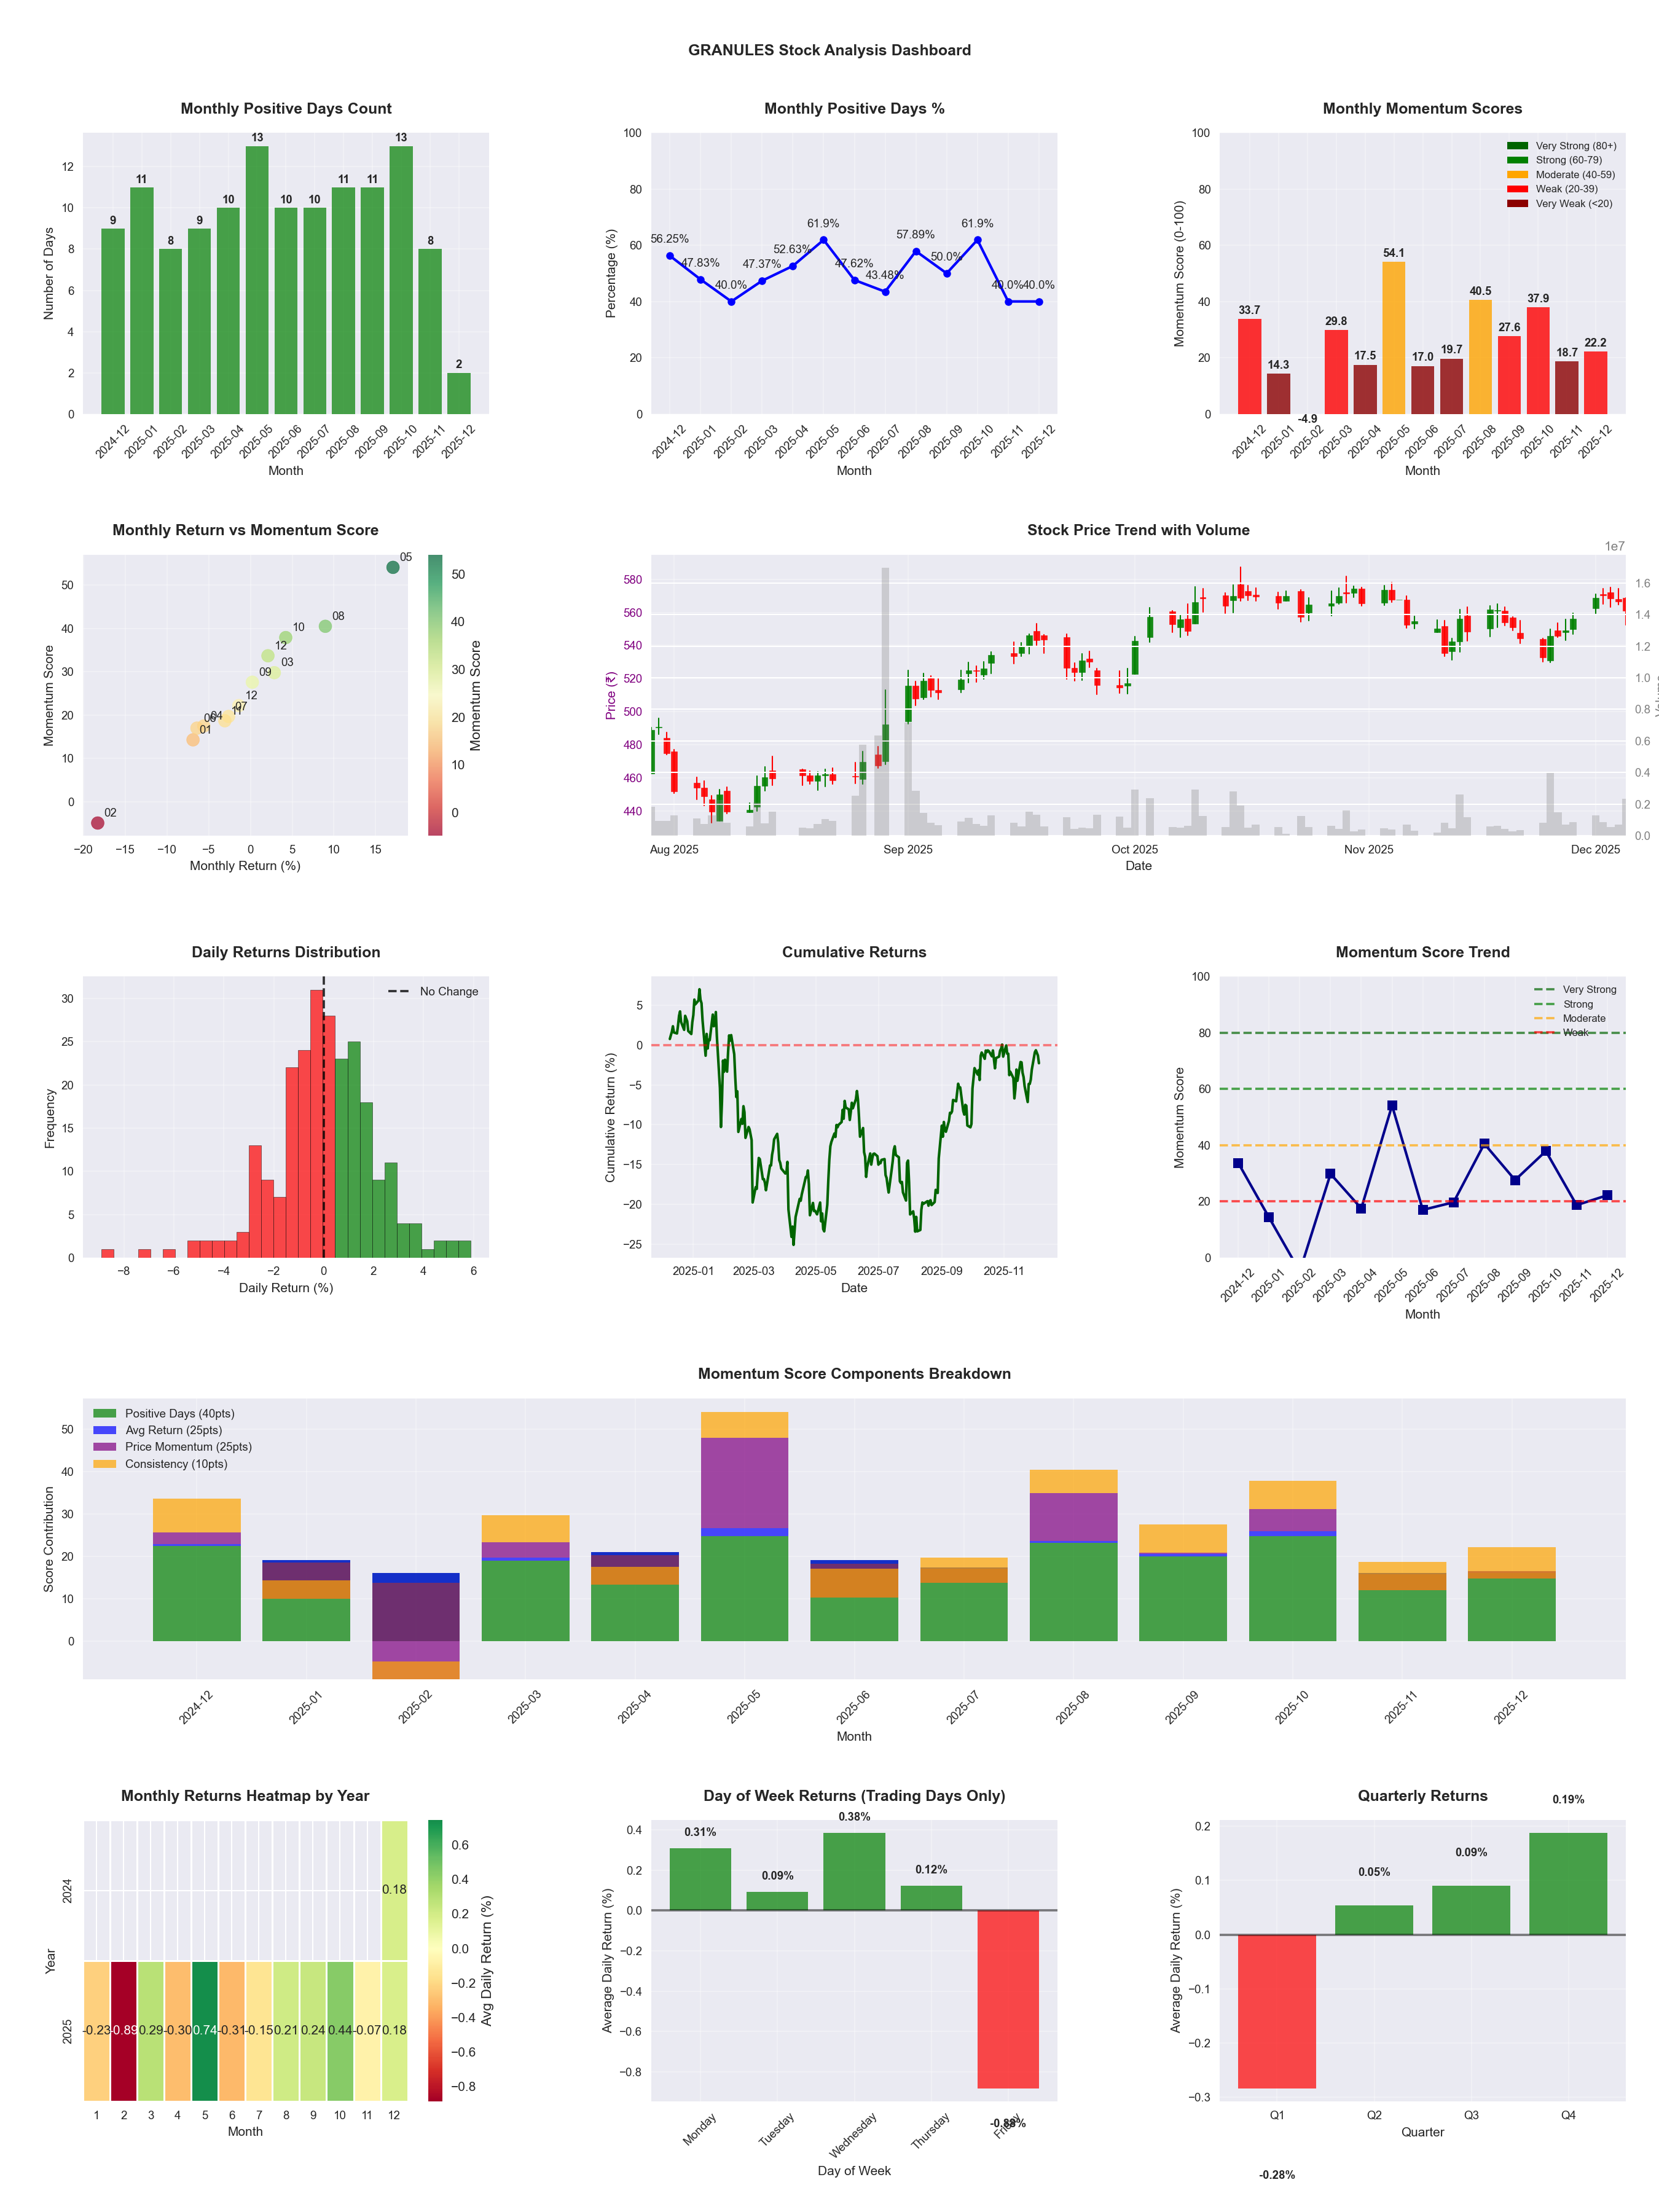
📊 Key Insights & Metrics
Symbol
📈 GRANULES
Date
📅 2026-04-11
Volatility
🟡 1.94%
Win Rate
⚠️ 51.4%
Avg Daily Return
📈 +0.16%
Max Drawdown
📉 -18.76%
IBD RS Score
📊 86.0
Strong
Market Rank
#69
Best Month
🏆 2025-05
Worst Month
📉 2026-01
Best Months to Trade
📅 May, Oct, Mar
Best Days to Trade
📅 Tuesday, Wednesday
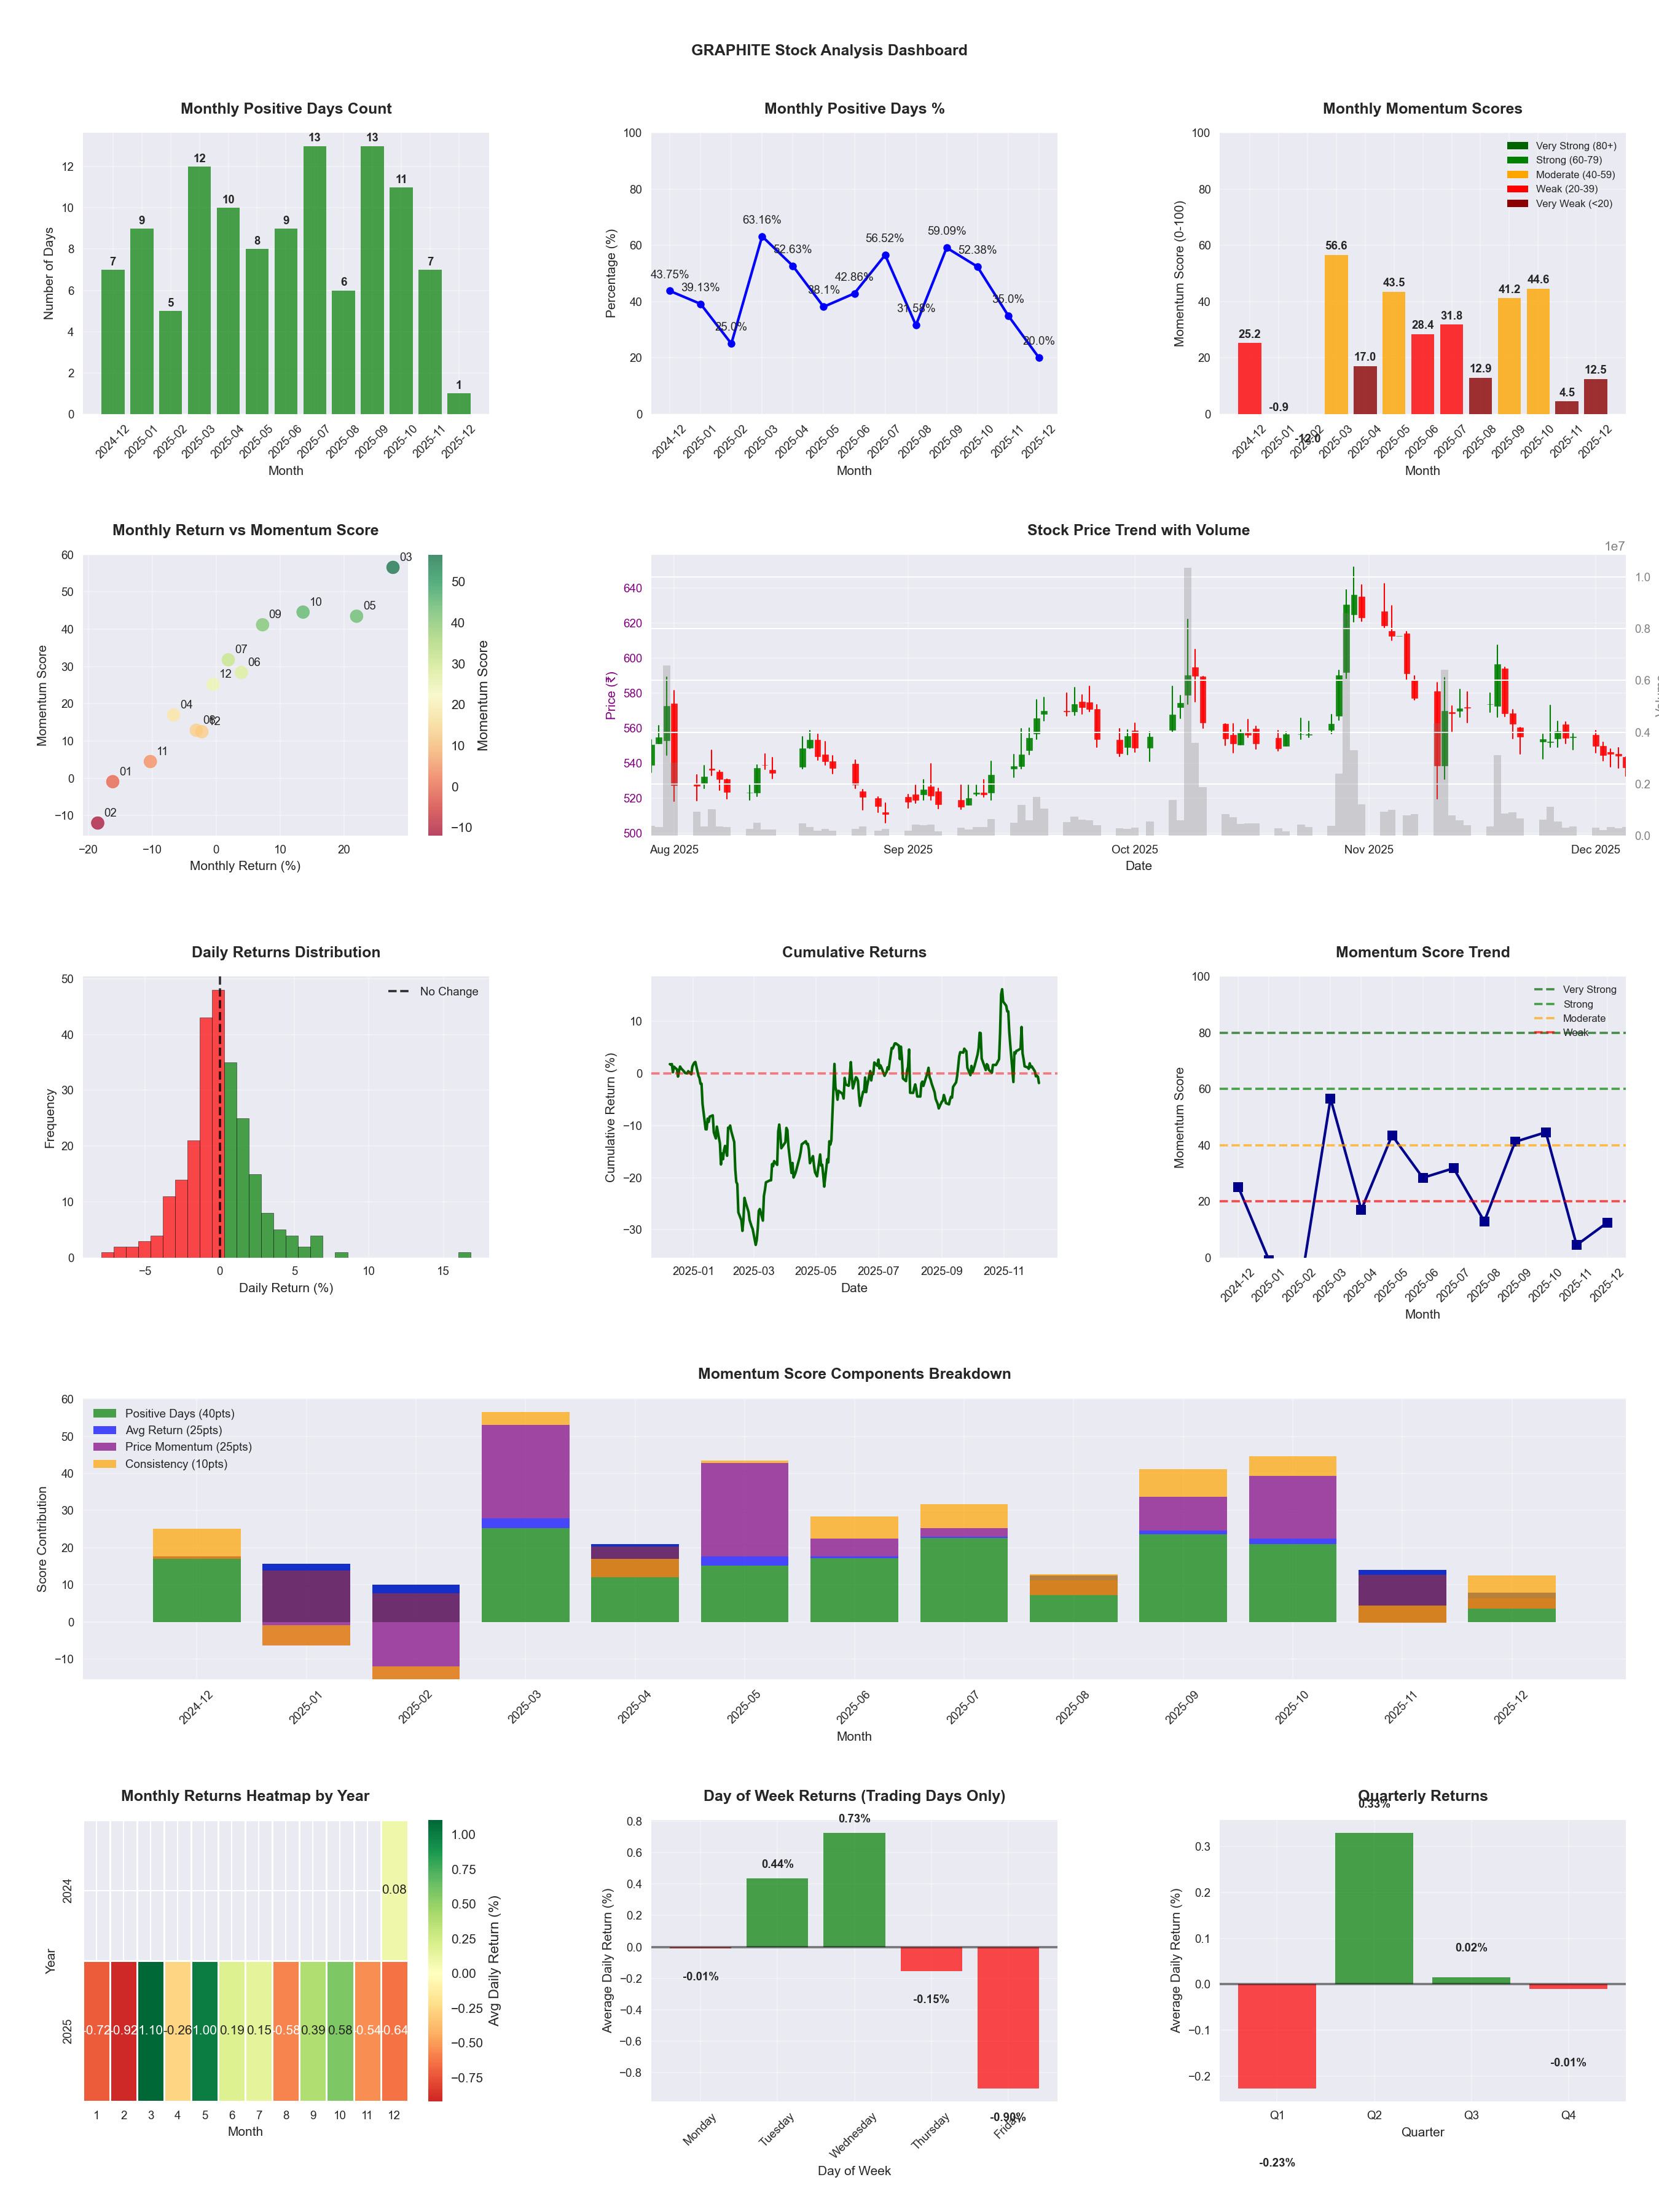
📊 Key Insights & Metrics
Symbol
📈 GRAPHITE
Date
📅 2026-04-11
Volatility
🟡 2.71%
Risk Profile
⚠️ suitable for aggressive investors
Win Rate
⚠️ 48.8%
Avg Daily Return
📈 +0.18%
Max Drawdown
📉 -22.80%
IBD RS Score
📊 80.5
Strong
Market Rank
#96
Best Month
🏆 2026-02
Worst Month
📉 2026-03
Best Months to Trade
📅 May, Feb, Dec
Best Days to Trade
📅 Wednesday, Tuesday
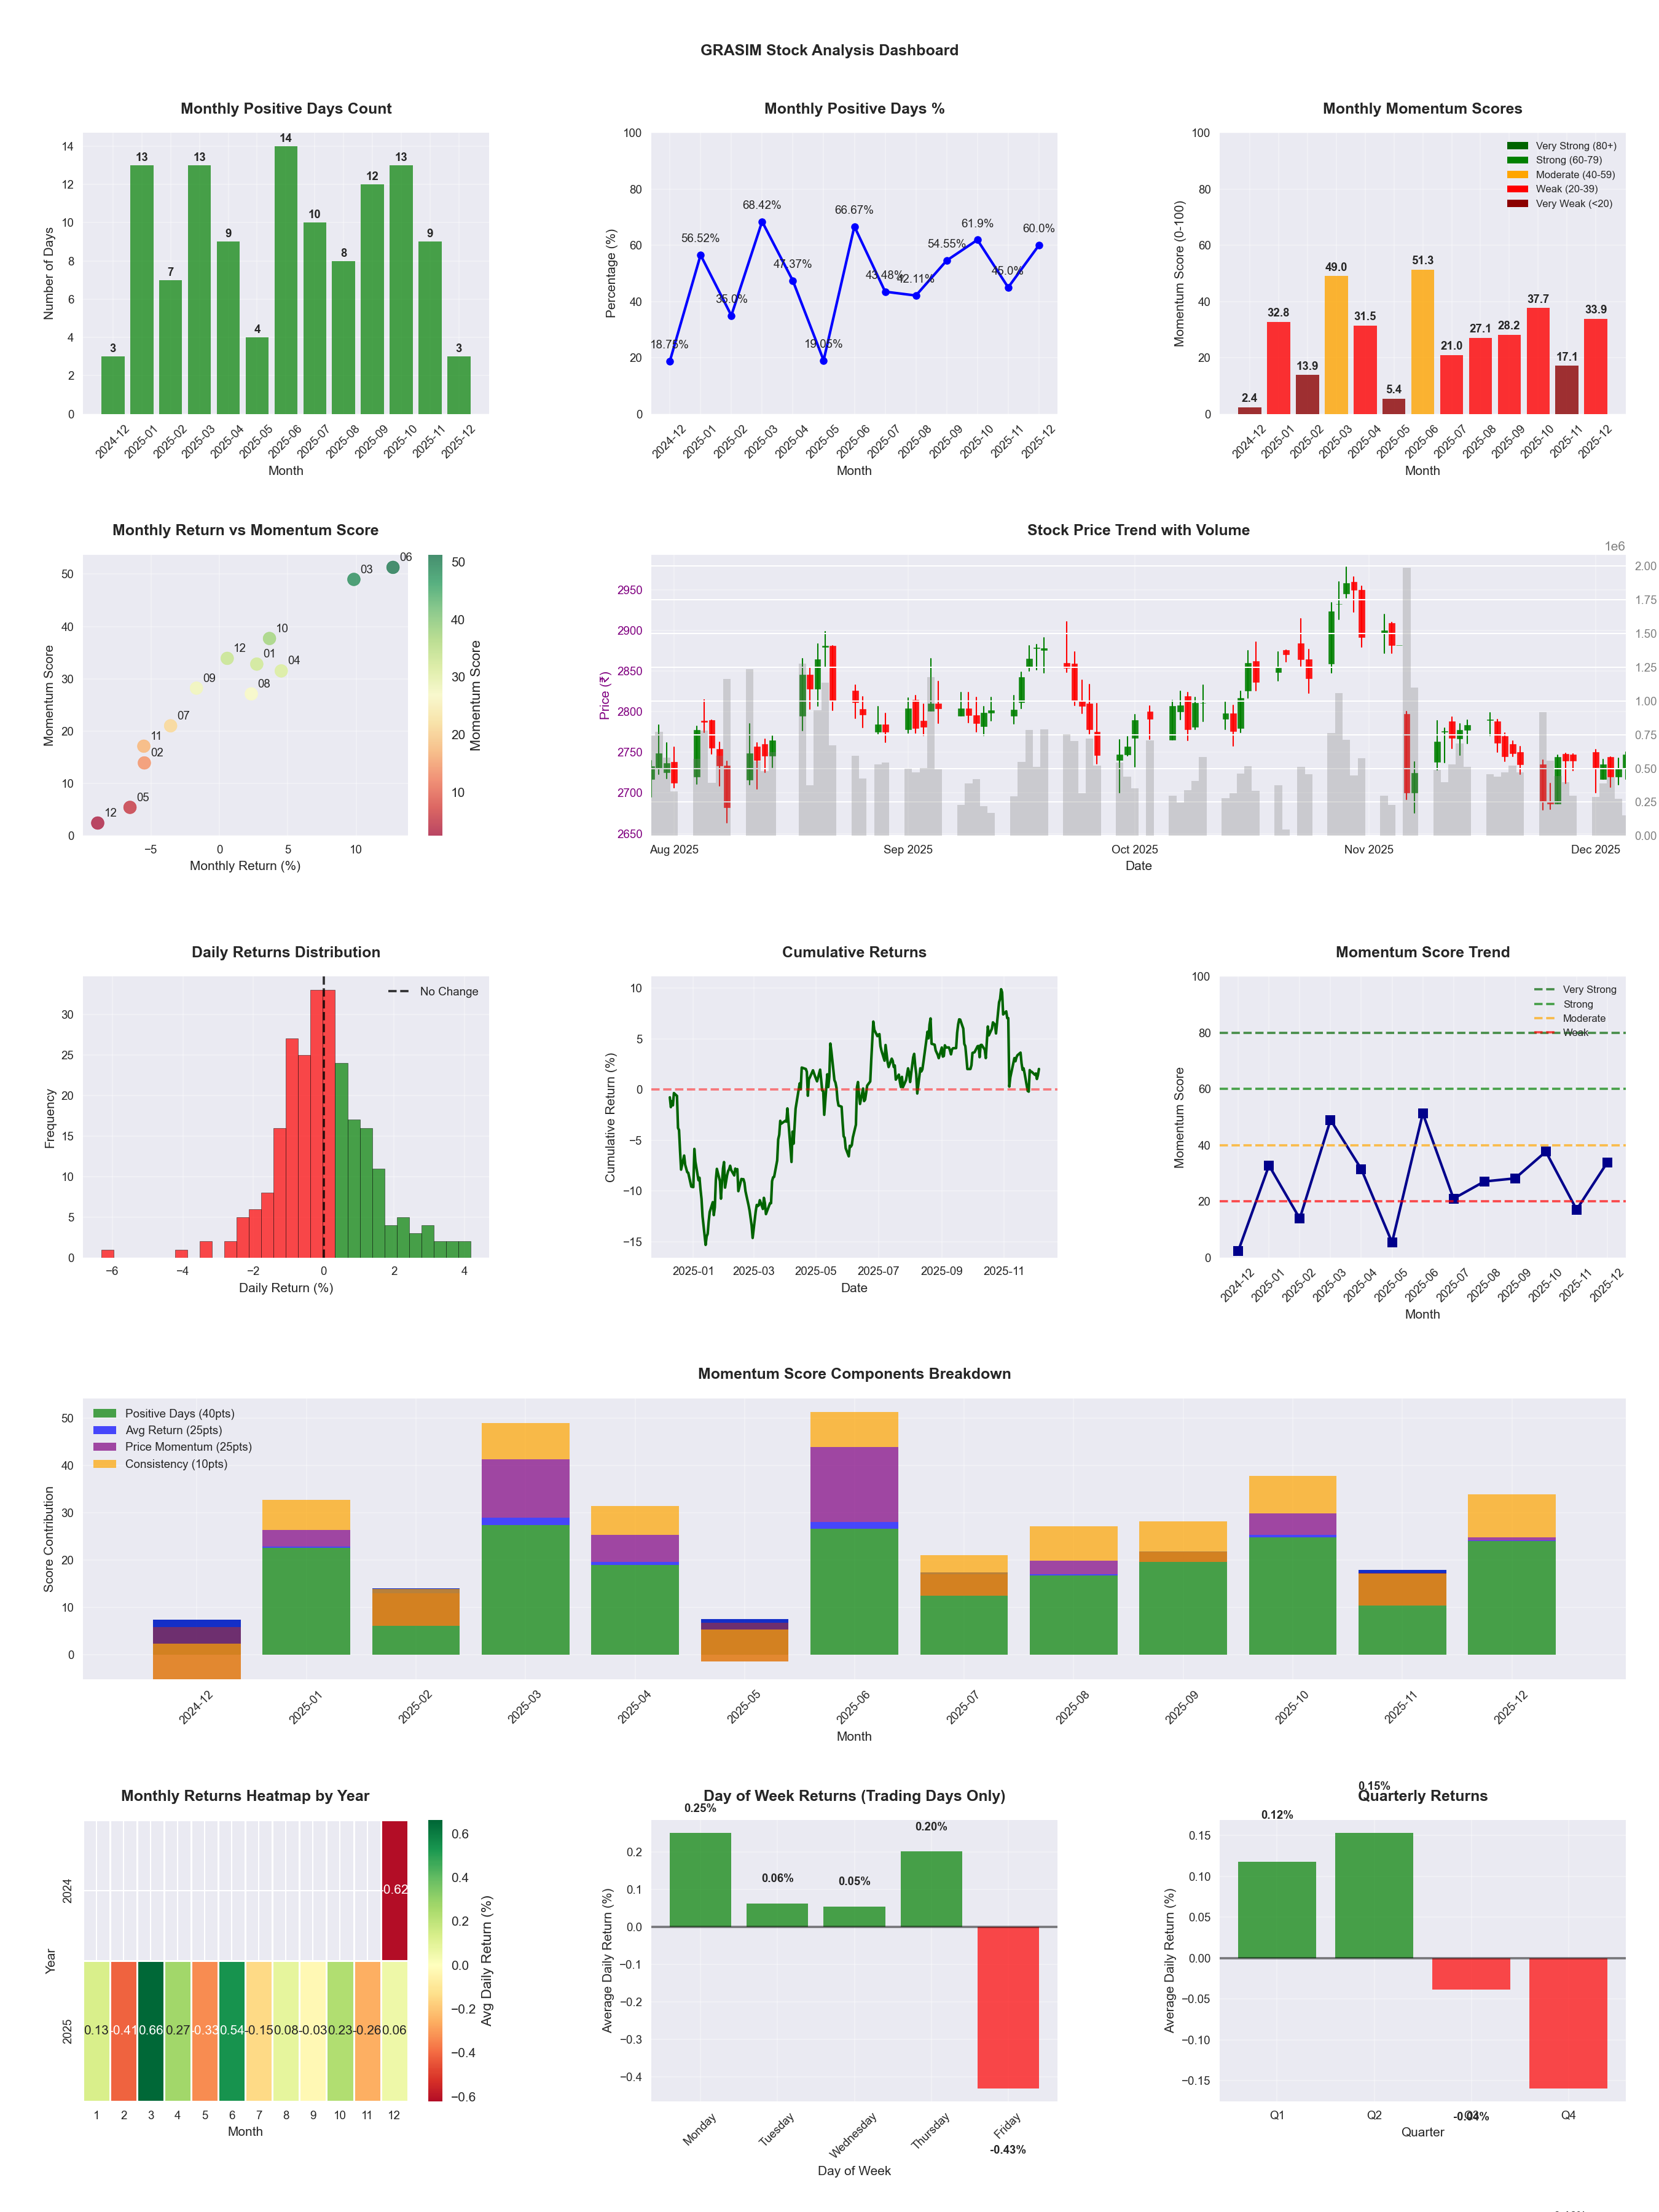
📊 Key Insights & Metrics
Symbol
📈 GRASIM
Date
📅 2026-04-11
Volatility
🟢 1.39%
Win Rate
⚠️ 48.0%
Avg Daily Return
📈 +0.02%
Max Drawdown
📉 -14.45%
IBD RS Score
📊 62.1
Average
Market Rank
#187
Best Month
🏆 2025-06
Worst Month
📉 2025-05
Best Months to Trade
📅 Apr, Jun, Oct
Best Days to Trade
📅 Monday, Wednesday
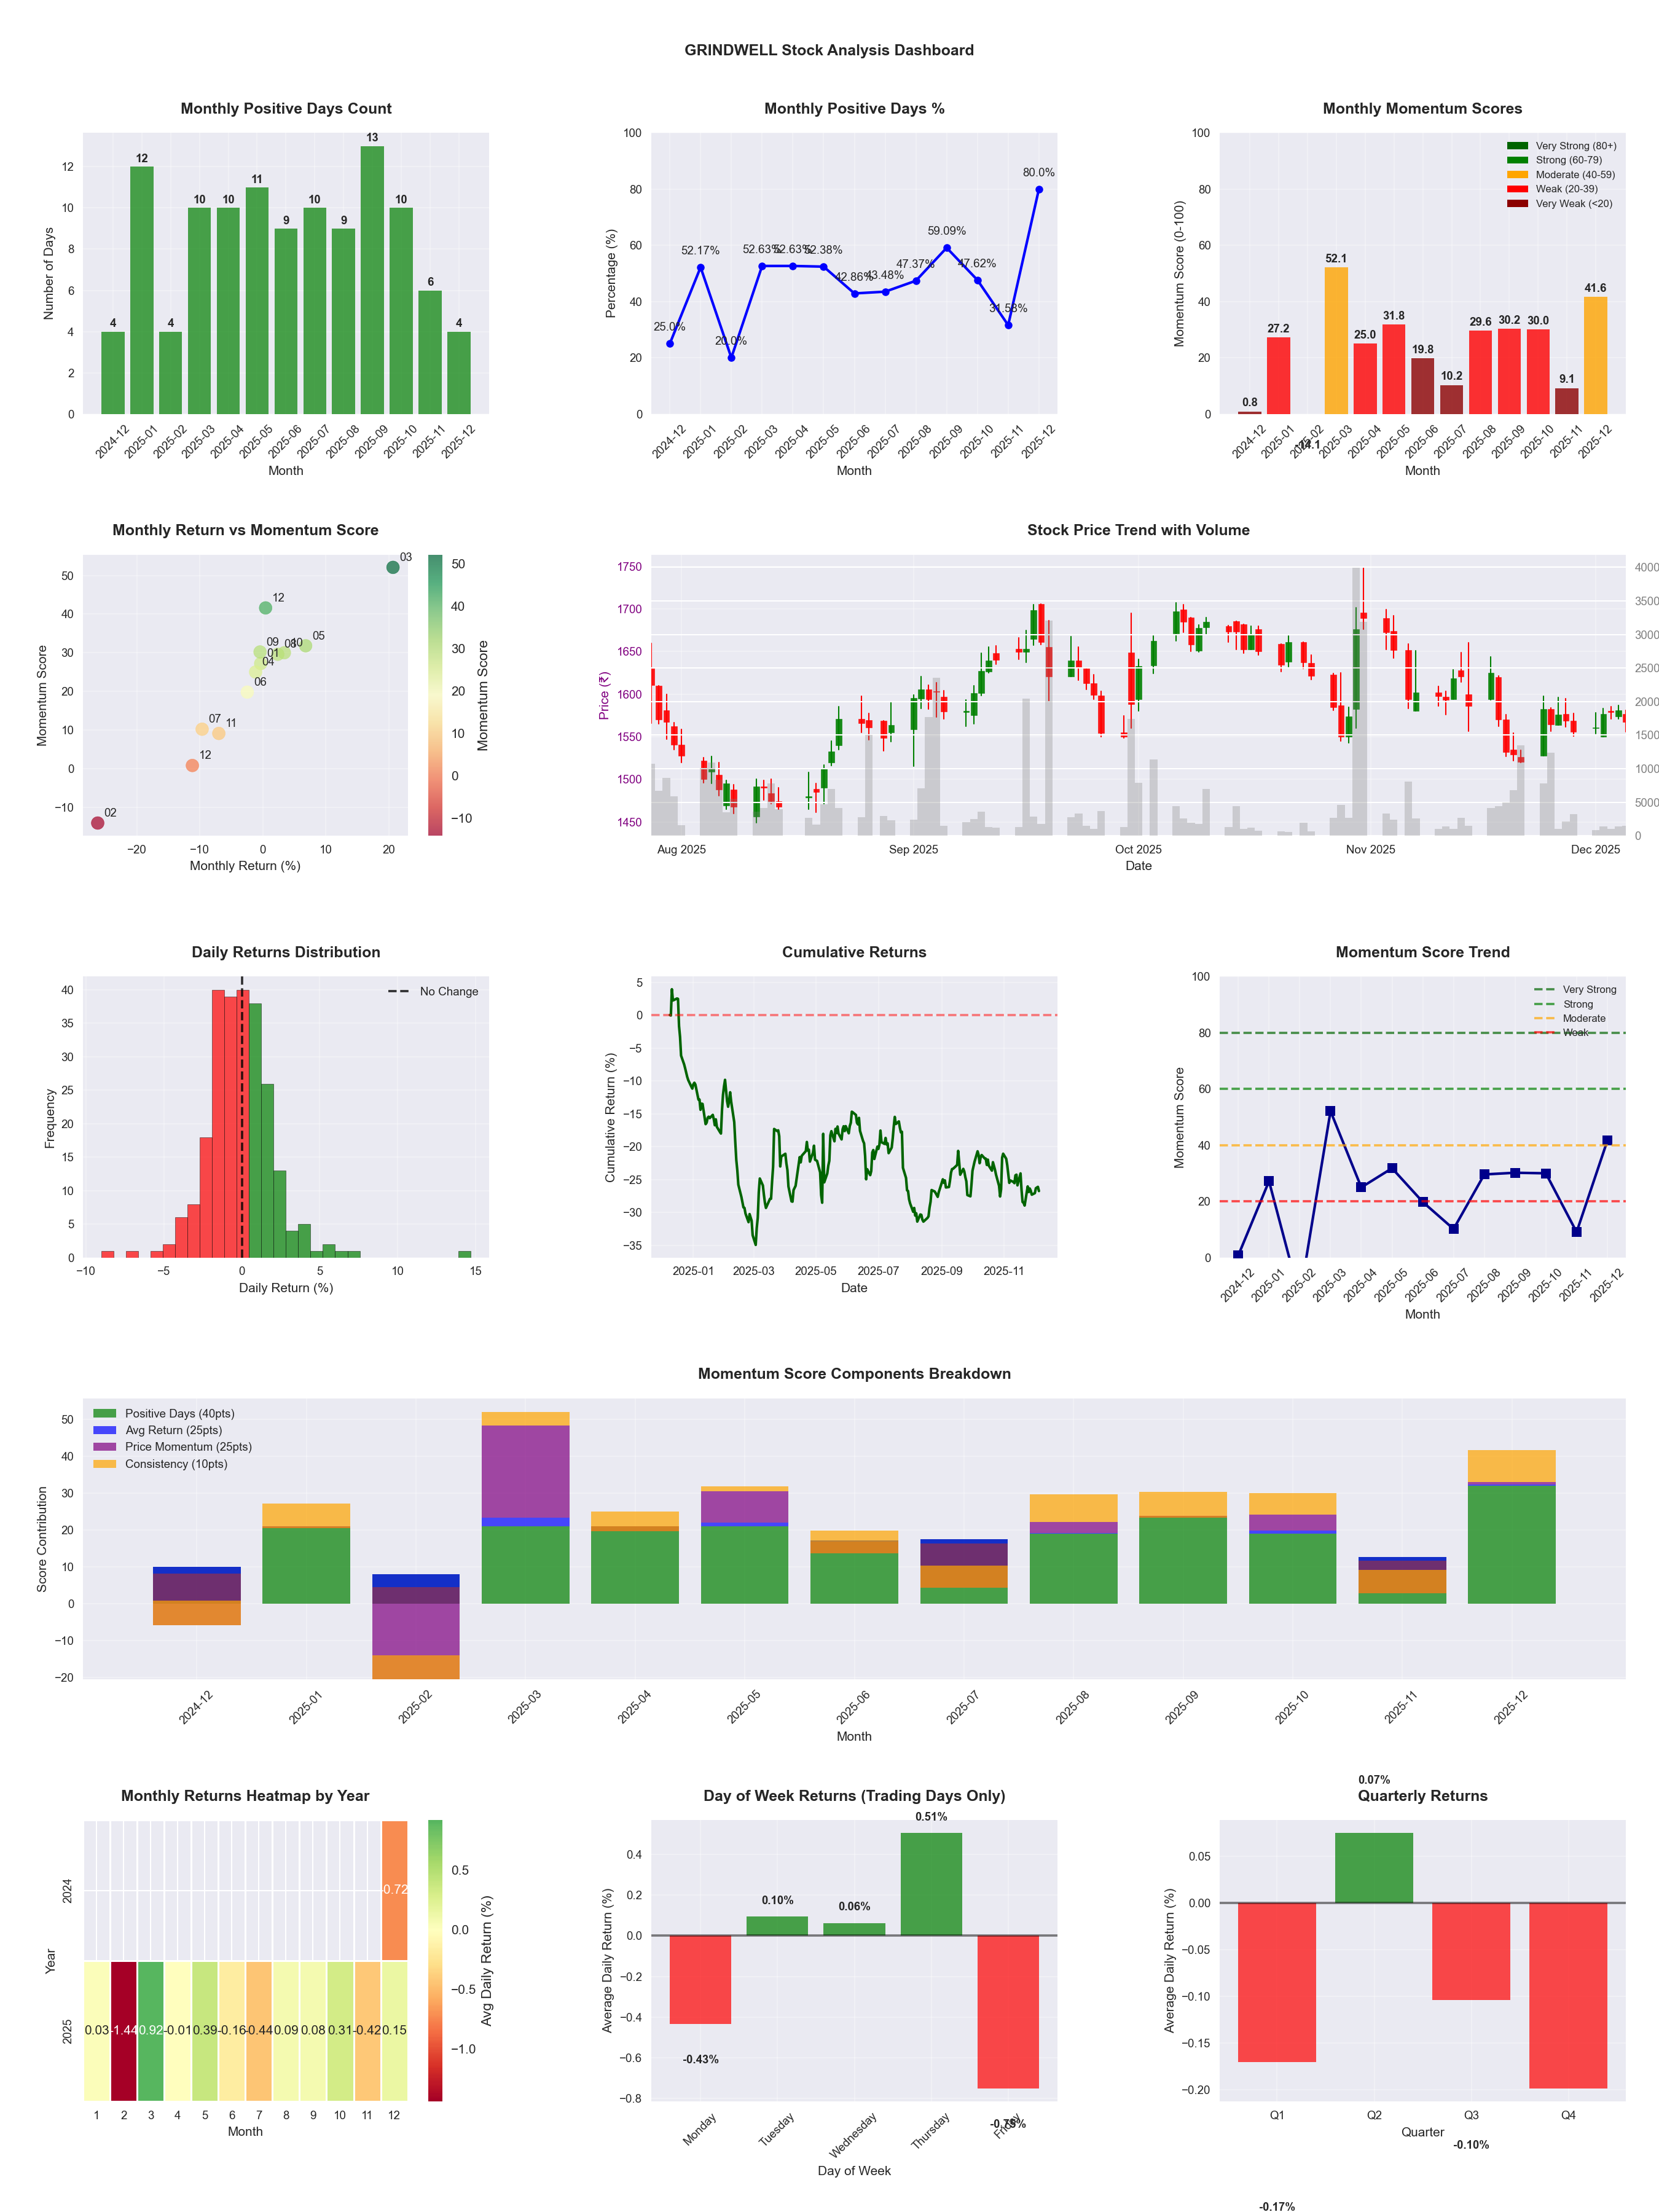
📊 Key Insights & Metrics
Symbol
📈 GRINDWELL
Date
📅 2026-03-21
Volatility
🟡 2.13%
Risk Profile
⚠️ suitable for aggressive investors
Win Rate
⚠️ 46.1%
Avg Daily Return
📉 -0.07%
Max Drawdown
📉 -23.73%
Best Month
🏆 2026-02
Best Months to Trade
📅 Feb, May, Oct
Best Days to Trade
📅 Tuesday, Thursday
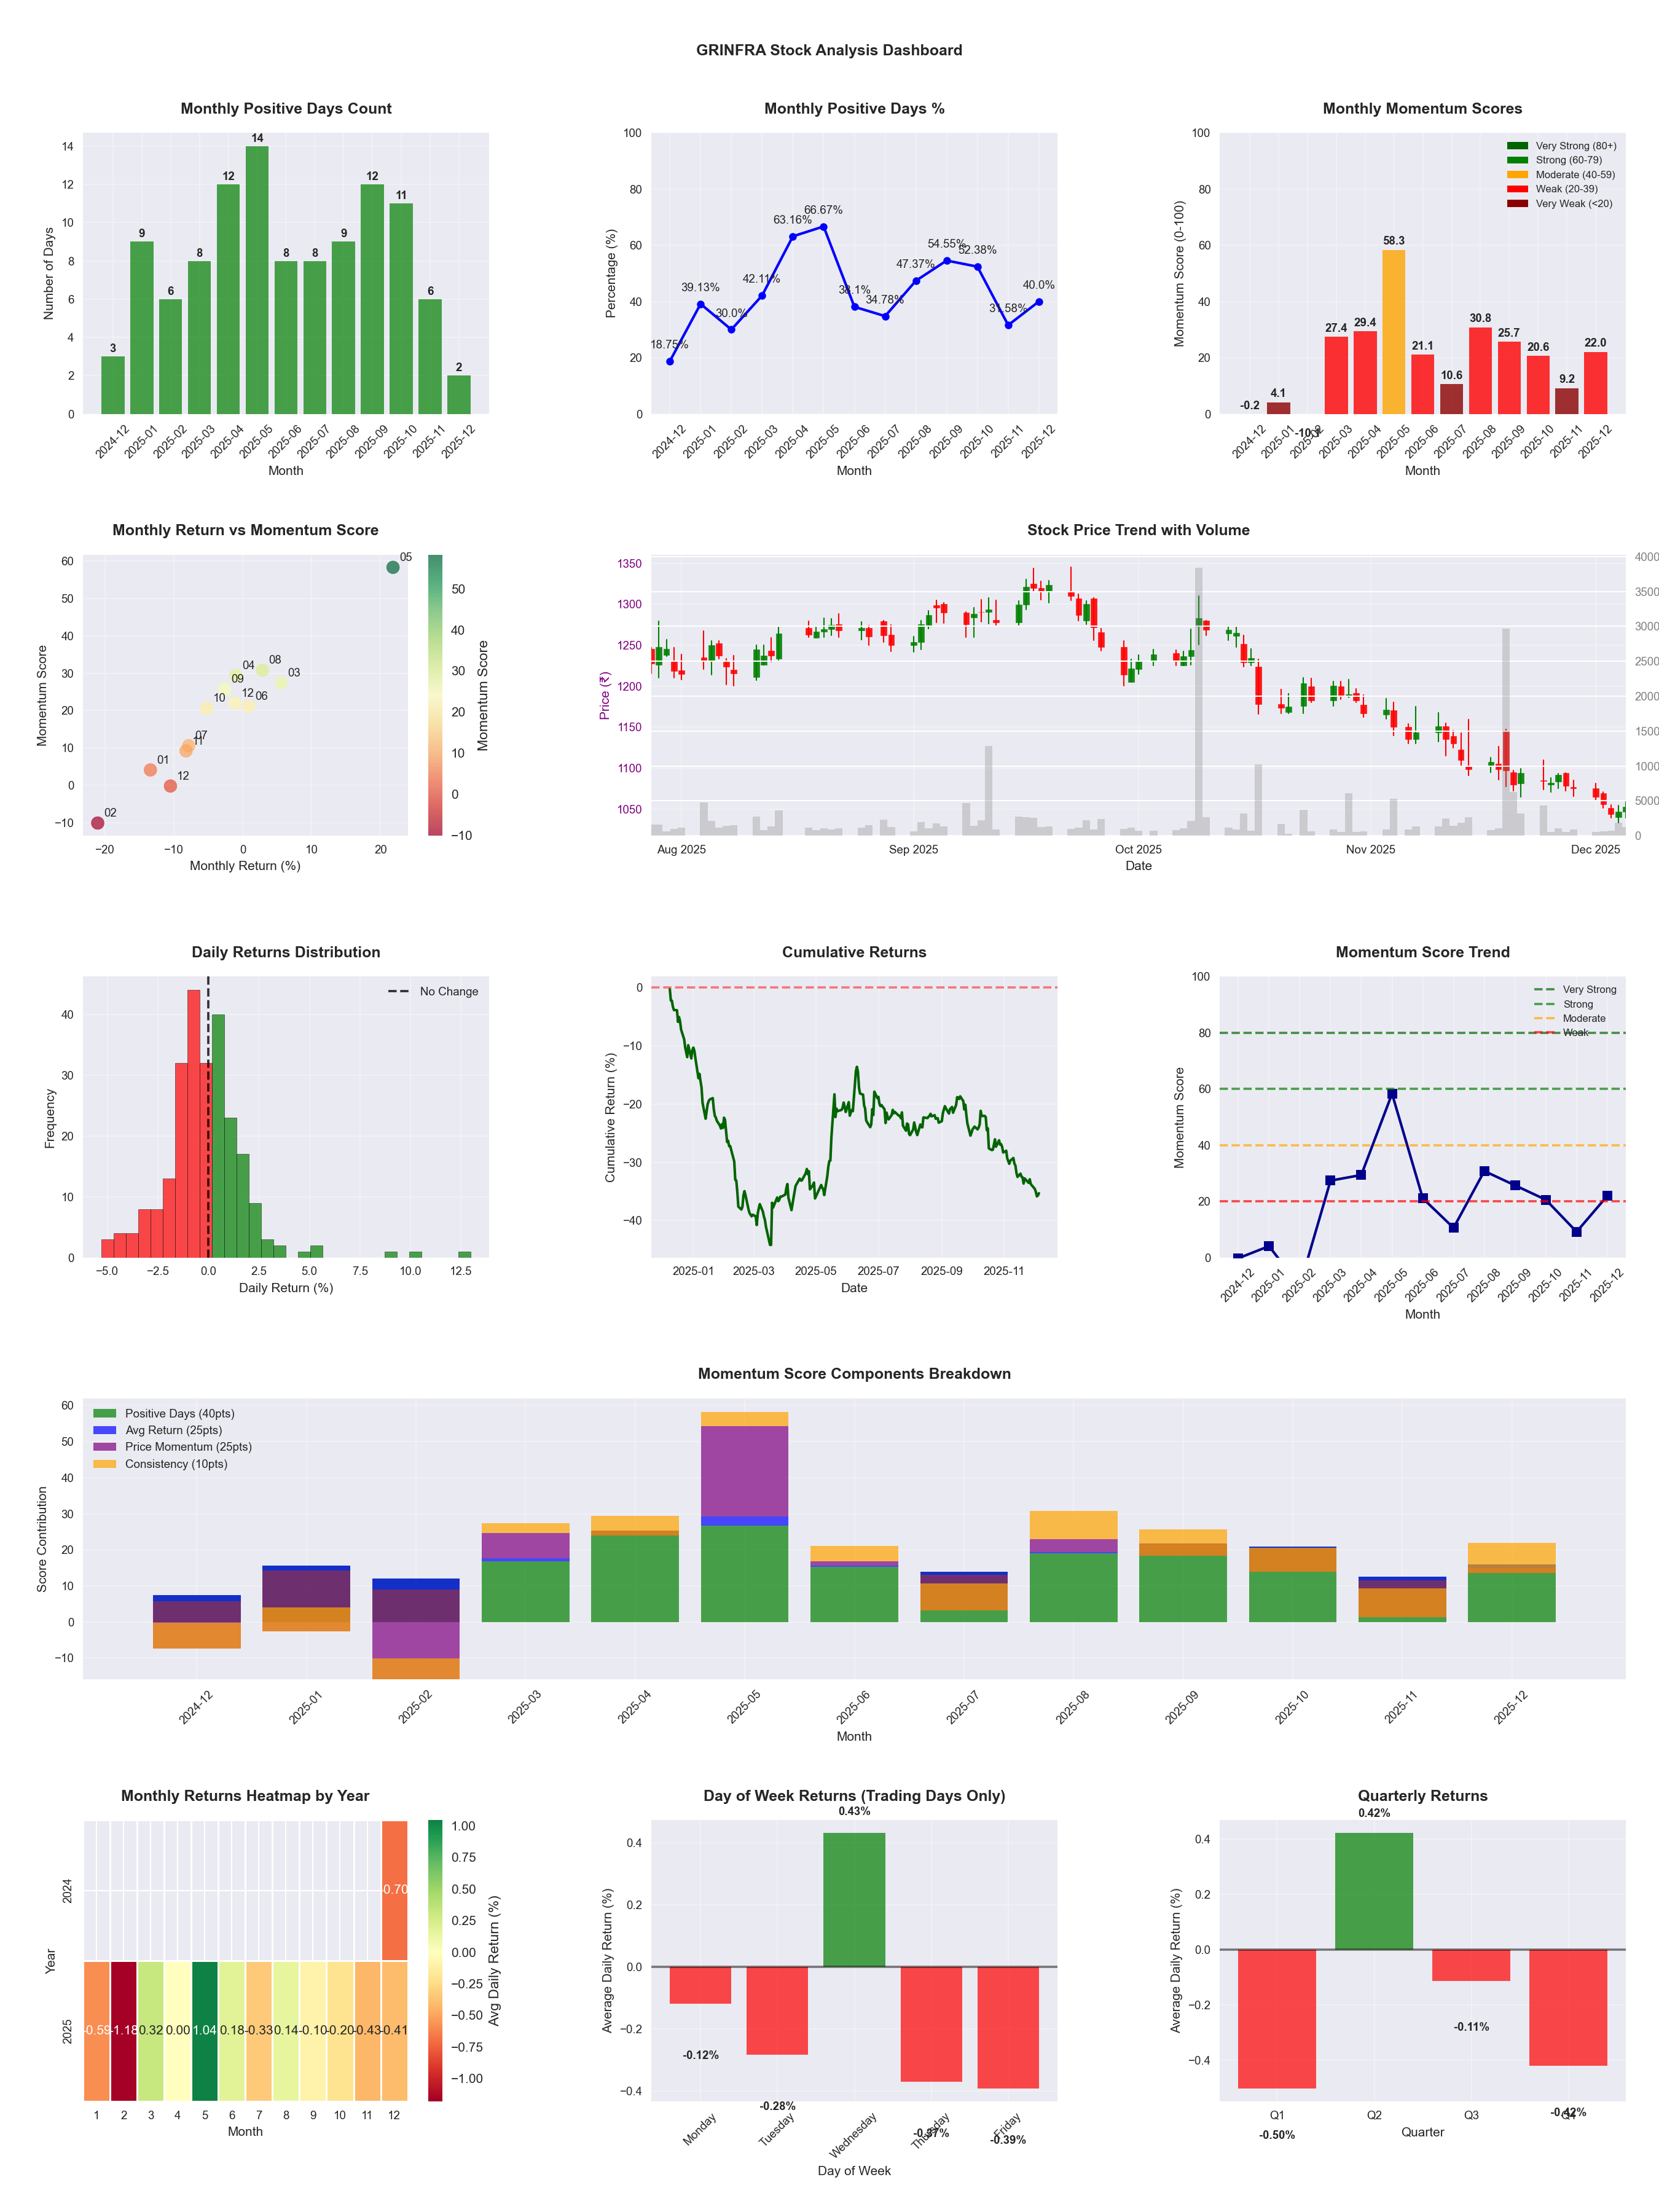
📊 Key Insights & Metrics
Symbol
📈 GRINFRA
Date
📅 2026-03-21
Volatility
🟡 1.82%
Win Rate
⚠️ 49.0%
Avg Daily Return
📉 -0.05%
Max Drawdown
📉 -38.71%
Best Month
🏆 2025-05
Worst Month
📉 2025-11
Best Months to Trade
📅 May, Jun, Aug
Best Days to Trade
📅 Monday, Tuesday
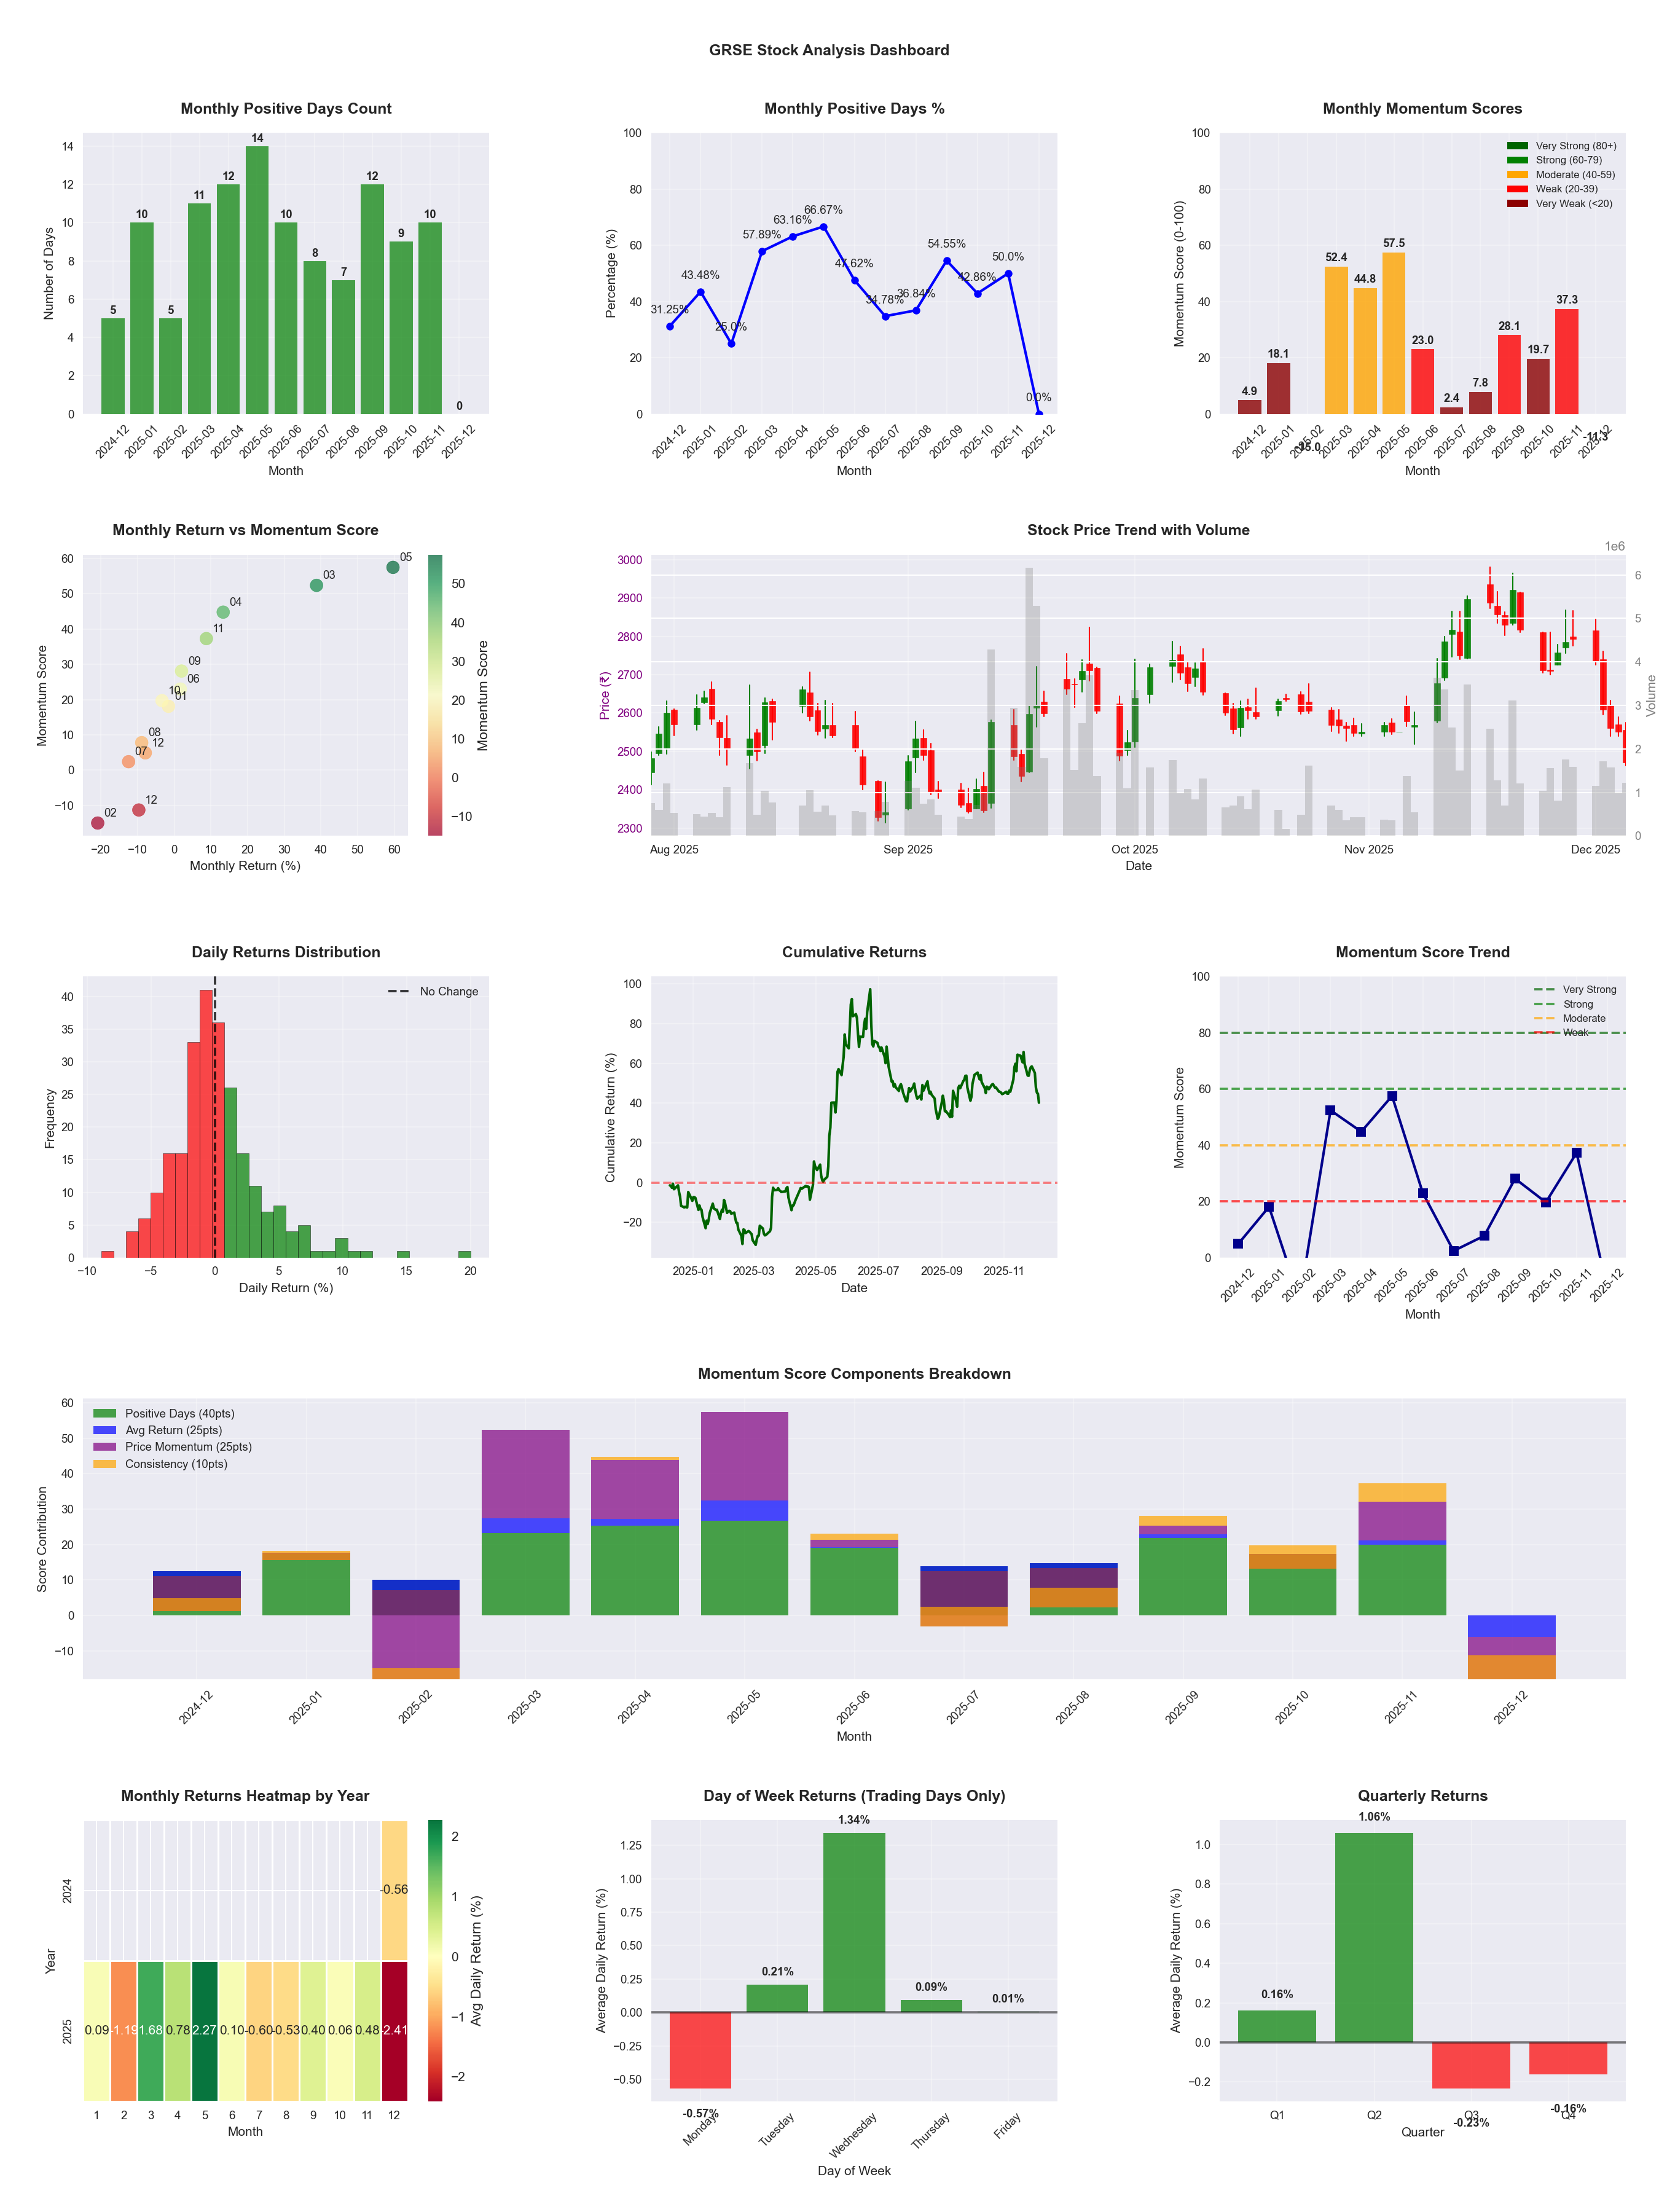
📊 Key Insights & Metrics
Symbol
📈 GRSE
Date
📅 2026-04-11
Volatility
🔴 3.49%
Risk Profile
⚠️ suitable for aggressive investors
Win Rate
⚠️ 45.1%
Avg Daily Return
📈 +0.25%
Max Drawdown
📉 -43.12%
IBD RS Score
📊 77.3
Strong
Market Rank
#112
Best Month
🏆 2025-05
Best Months to Trade
📅 Apr, May, Jan
Best Days to Trade
📅 Wednesday, Tuesday
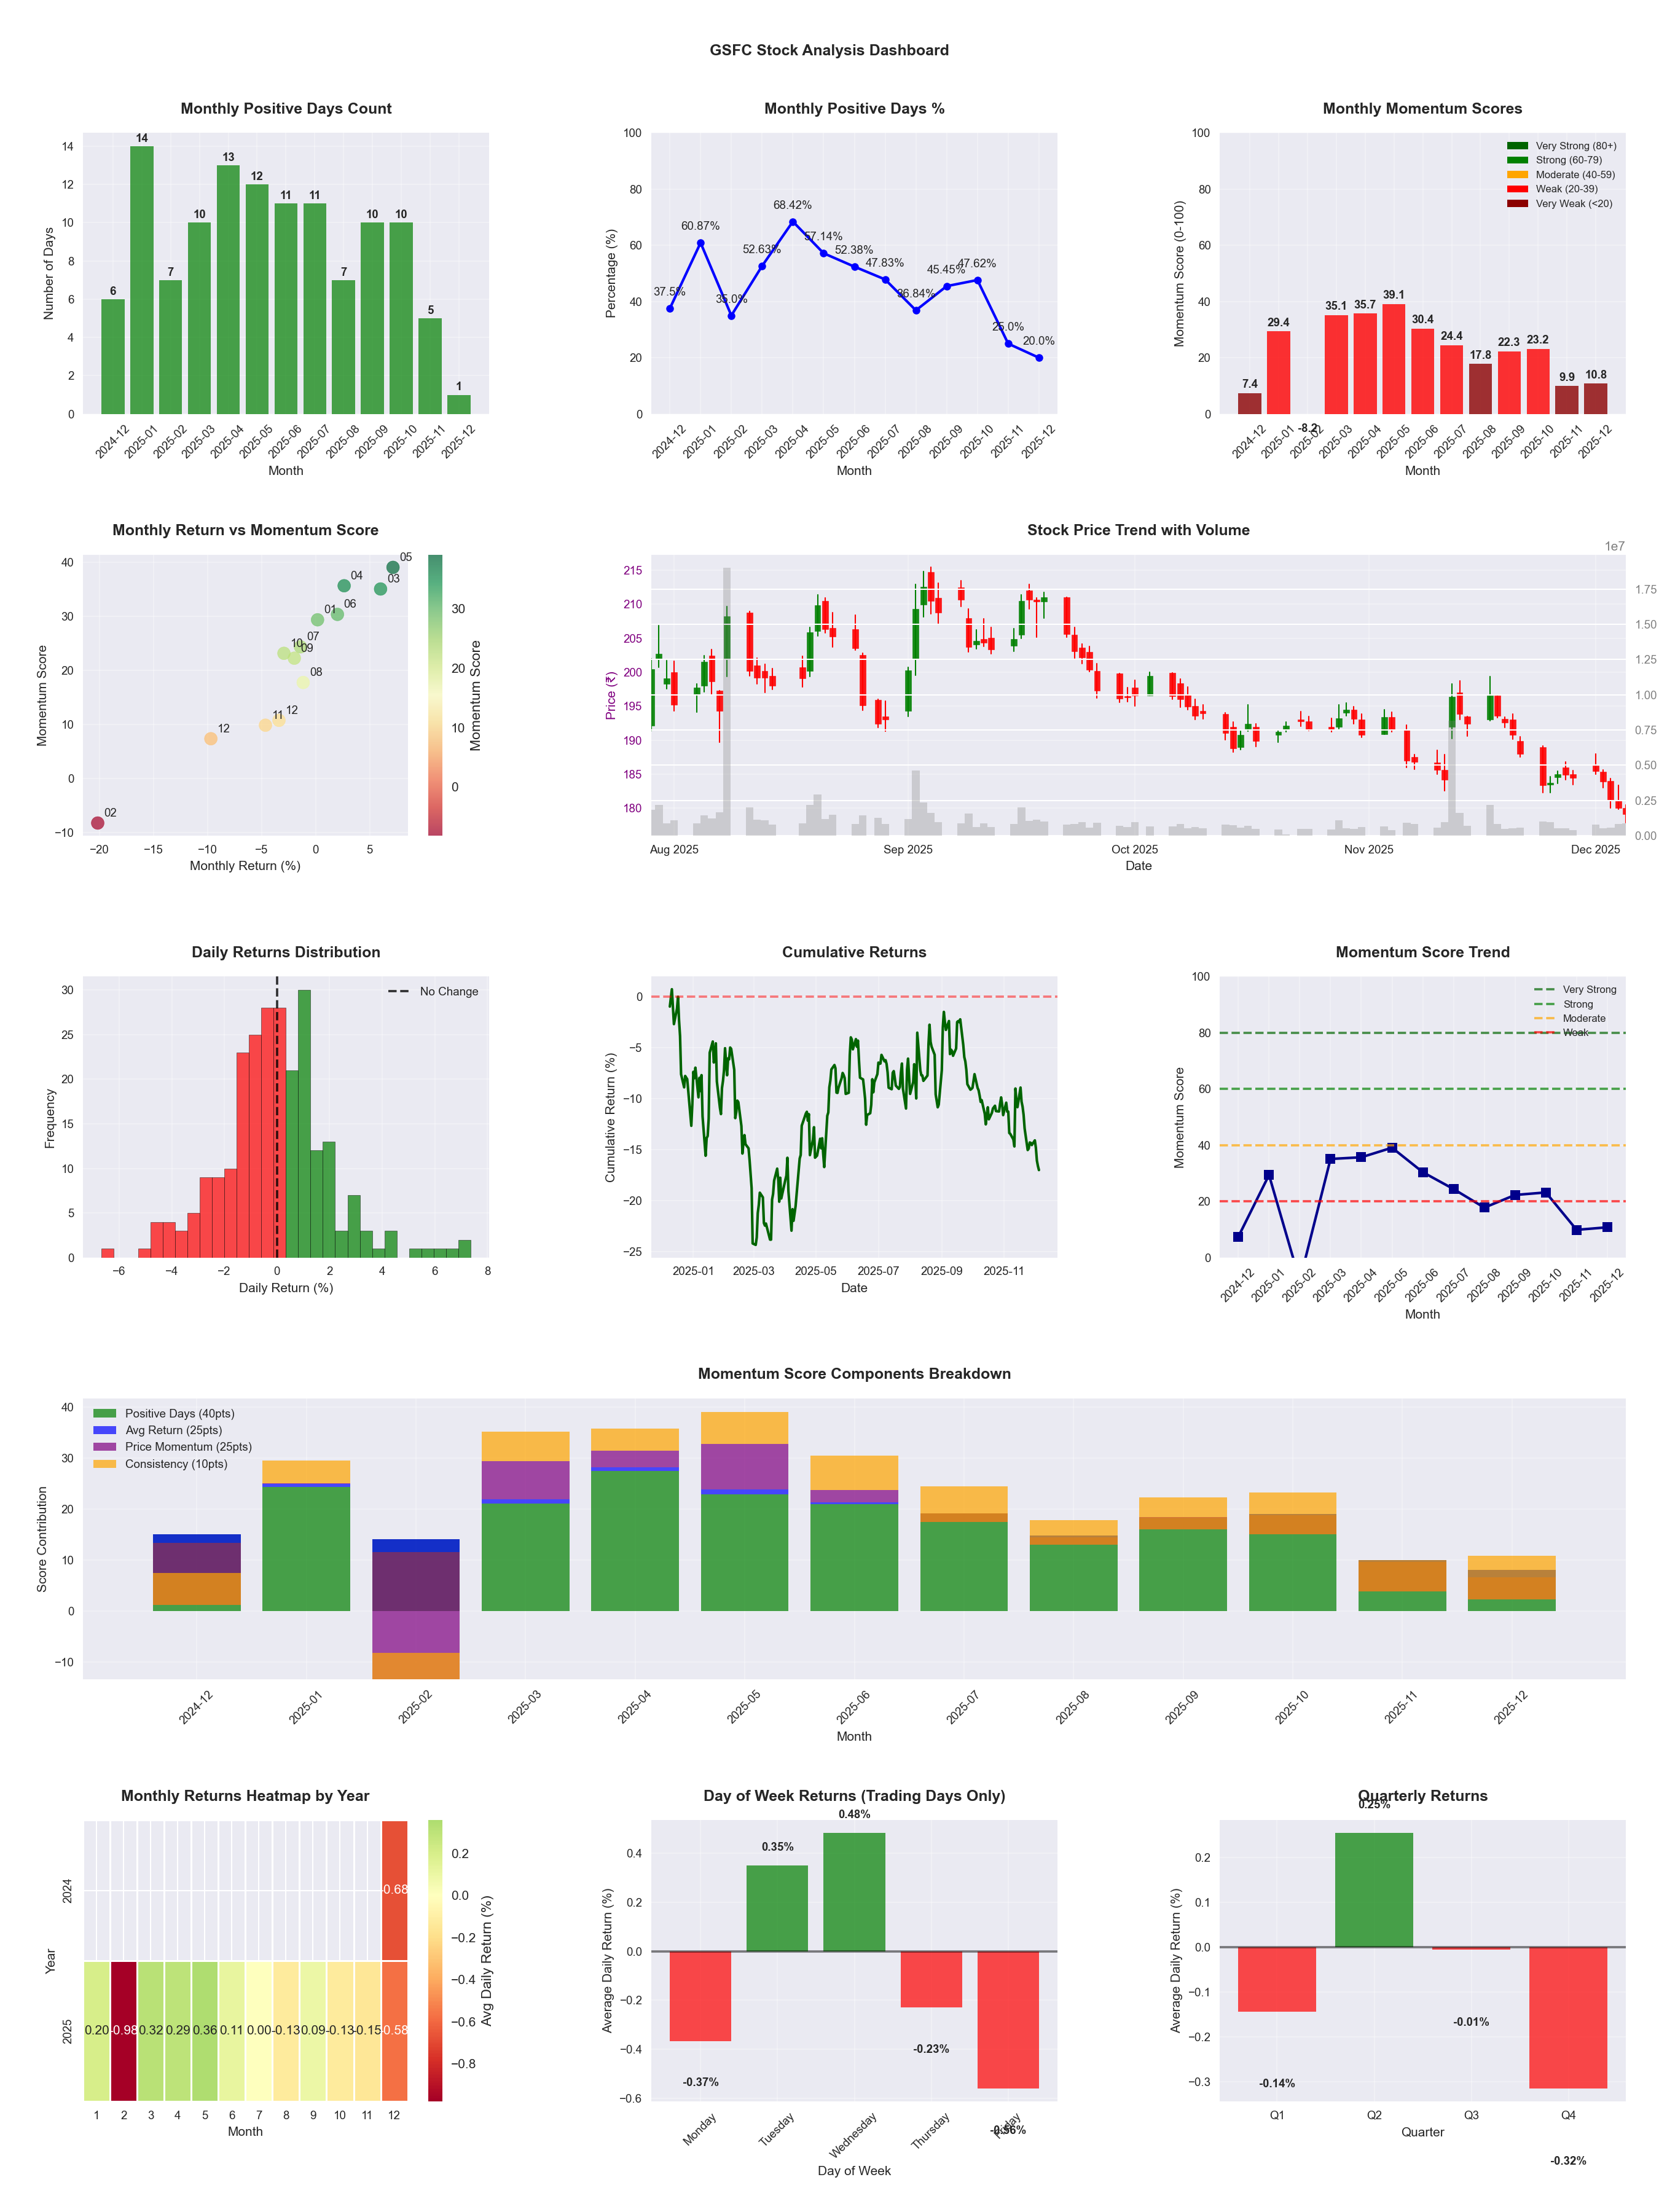
📊 Key Insights & Metrics
Symbol
📈 GSFC
Date
📅 2026-03-21
Volatility
🟡 1.92%
Win Rate
⚠️ 45.8%
Avg Daily Return
📉 -0.04%
Max Drawdown
📉 -29.25%
Best Month
🏆 2025-05
Worst Month
📉 2026-03
Best Months to Trade
📅 May, Apr, Jun
Best Days to Trade
📅 Tuesday, Wednesday
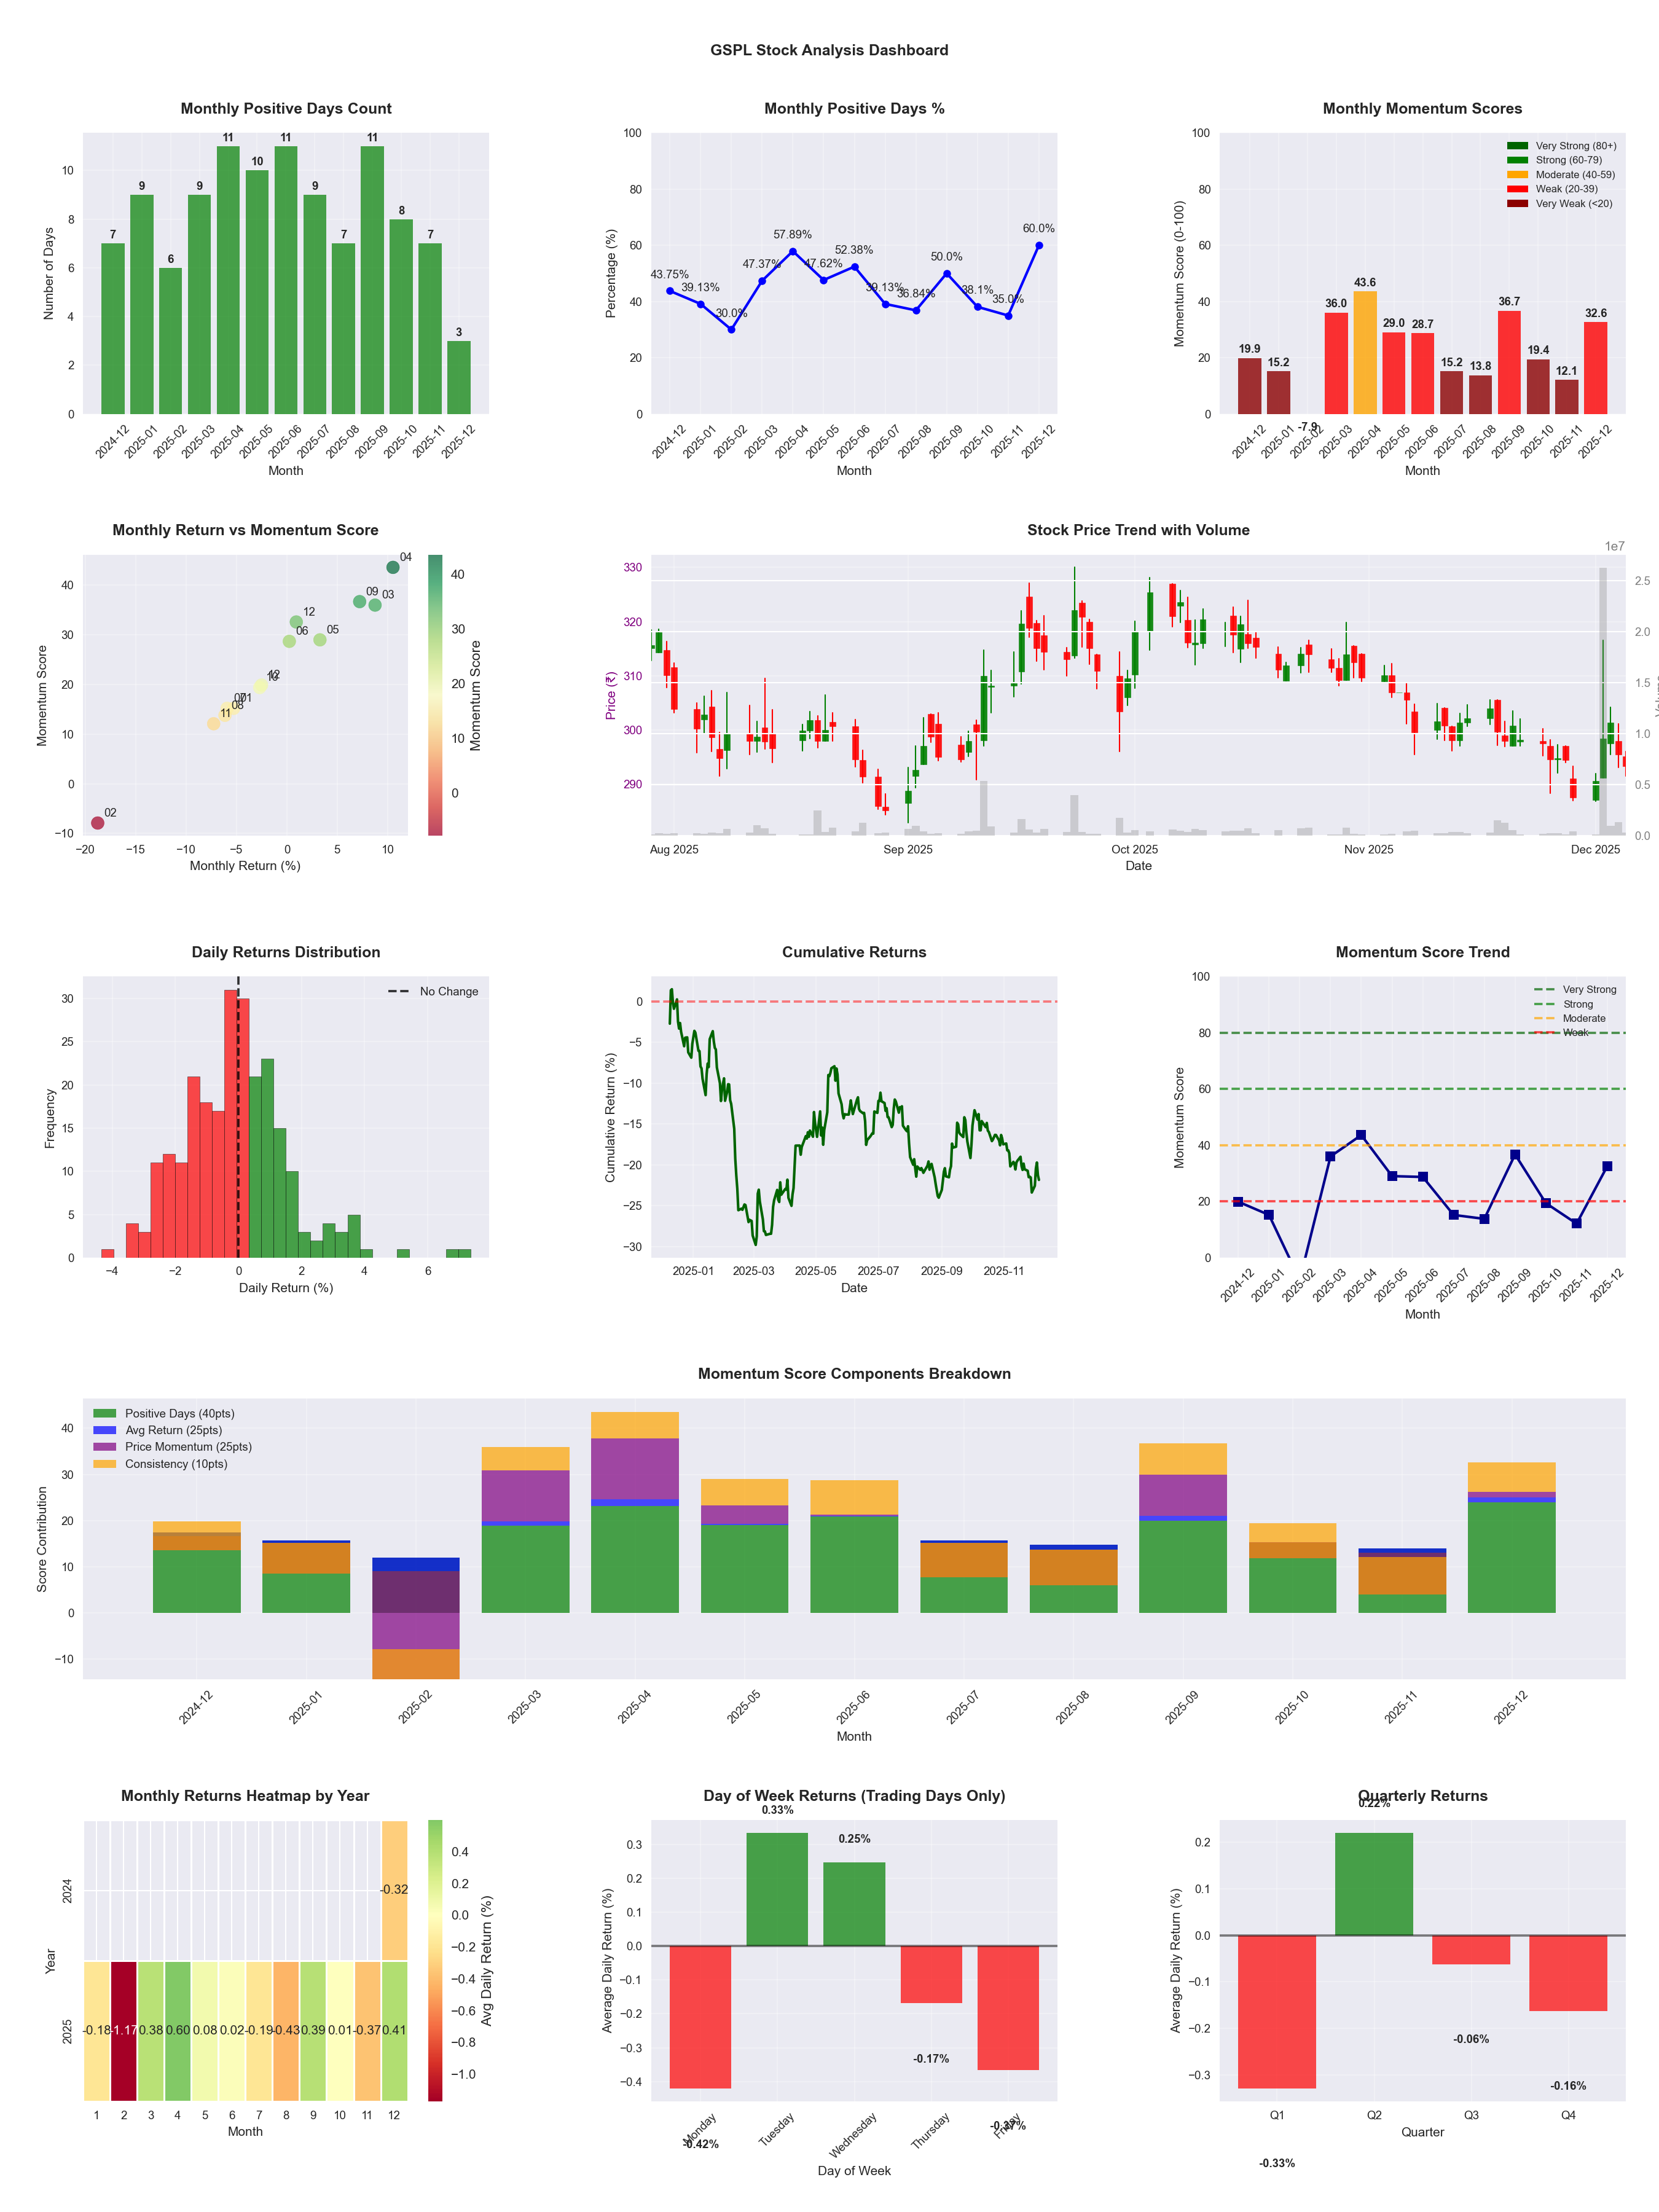
📊 Key Insights & Metrics
Symbol
📈 GSPL
Date
📅 2026-04-11
Volatility
🟡 1.64%
Win Rate
⚠️ 44.1%
Avg Daily Return
📉 -0.09%
Max Drawdown
📉 -33.54%
IBD RS Score
📊 9.5
Weak
Market Rank
#446
Best Month
🏆 2025-09
Best Months to Trade
📅 Apr, Sep, Dec
Best Days to Trade
📅 Wednesday, Tuesday
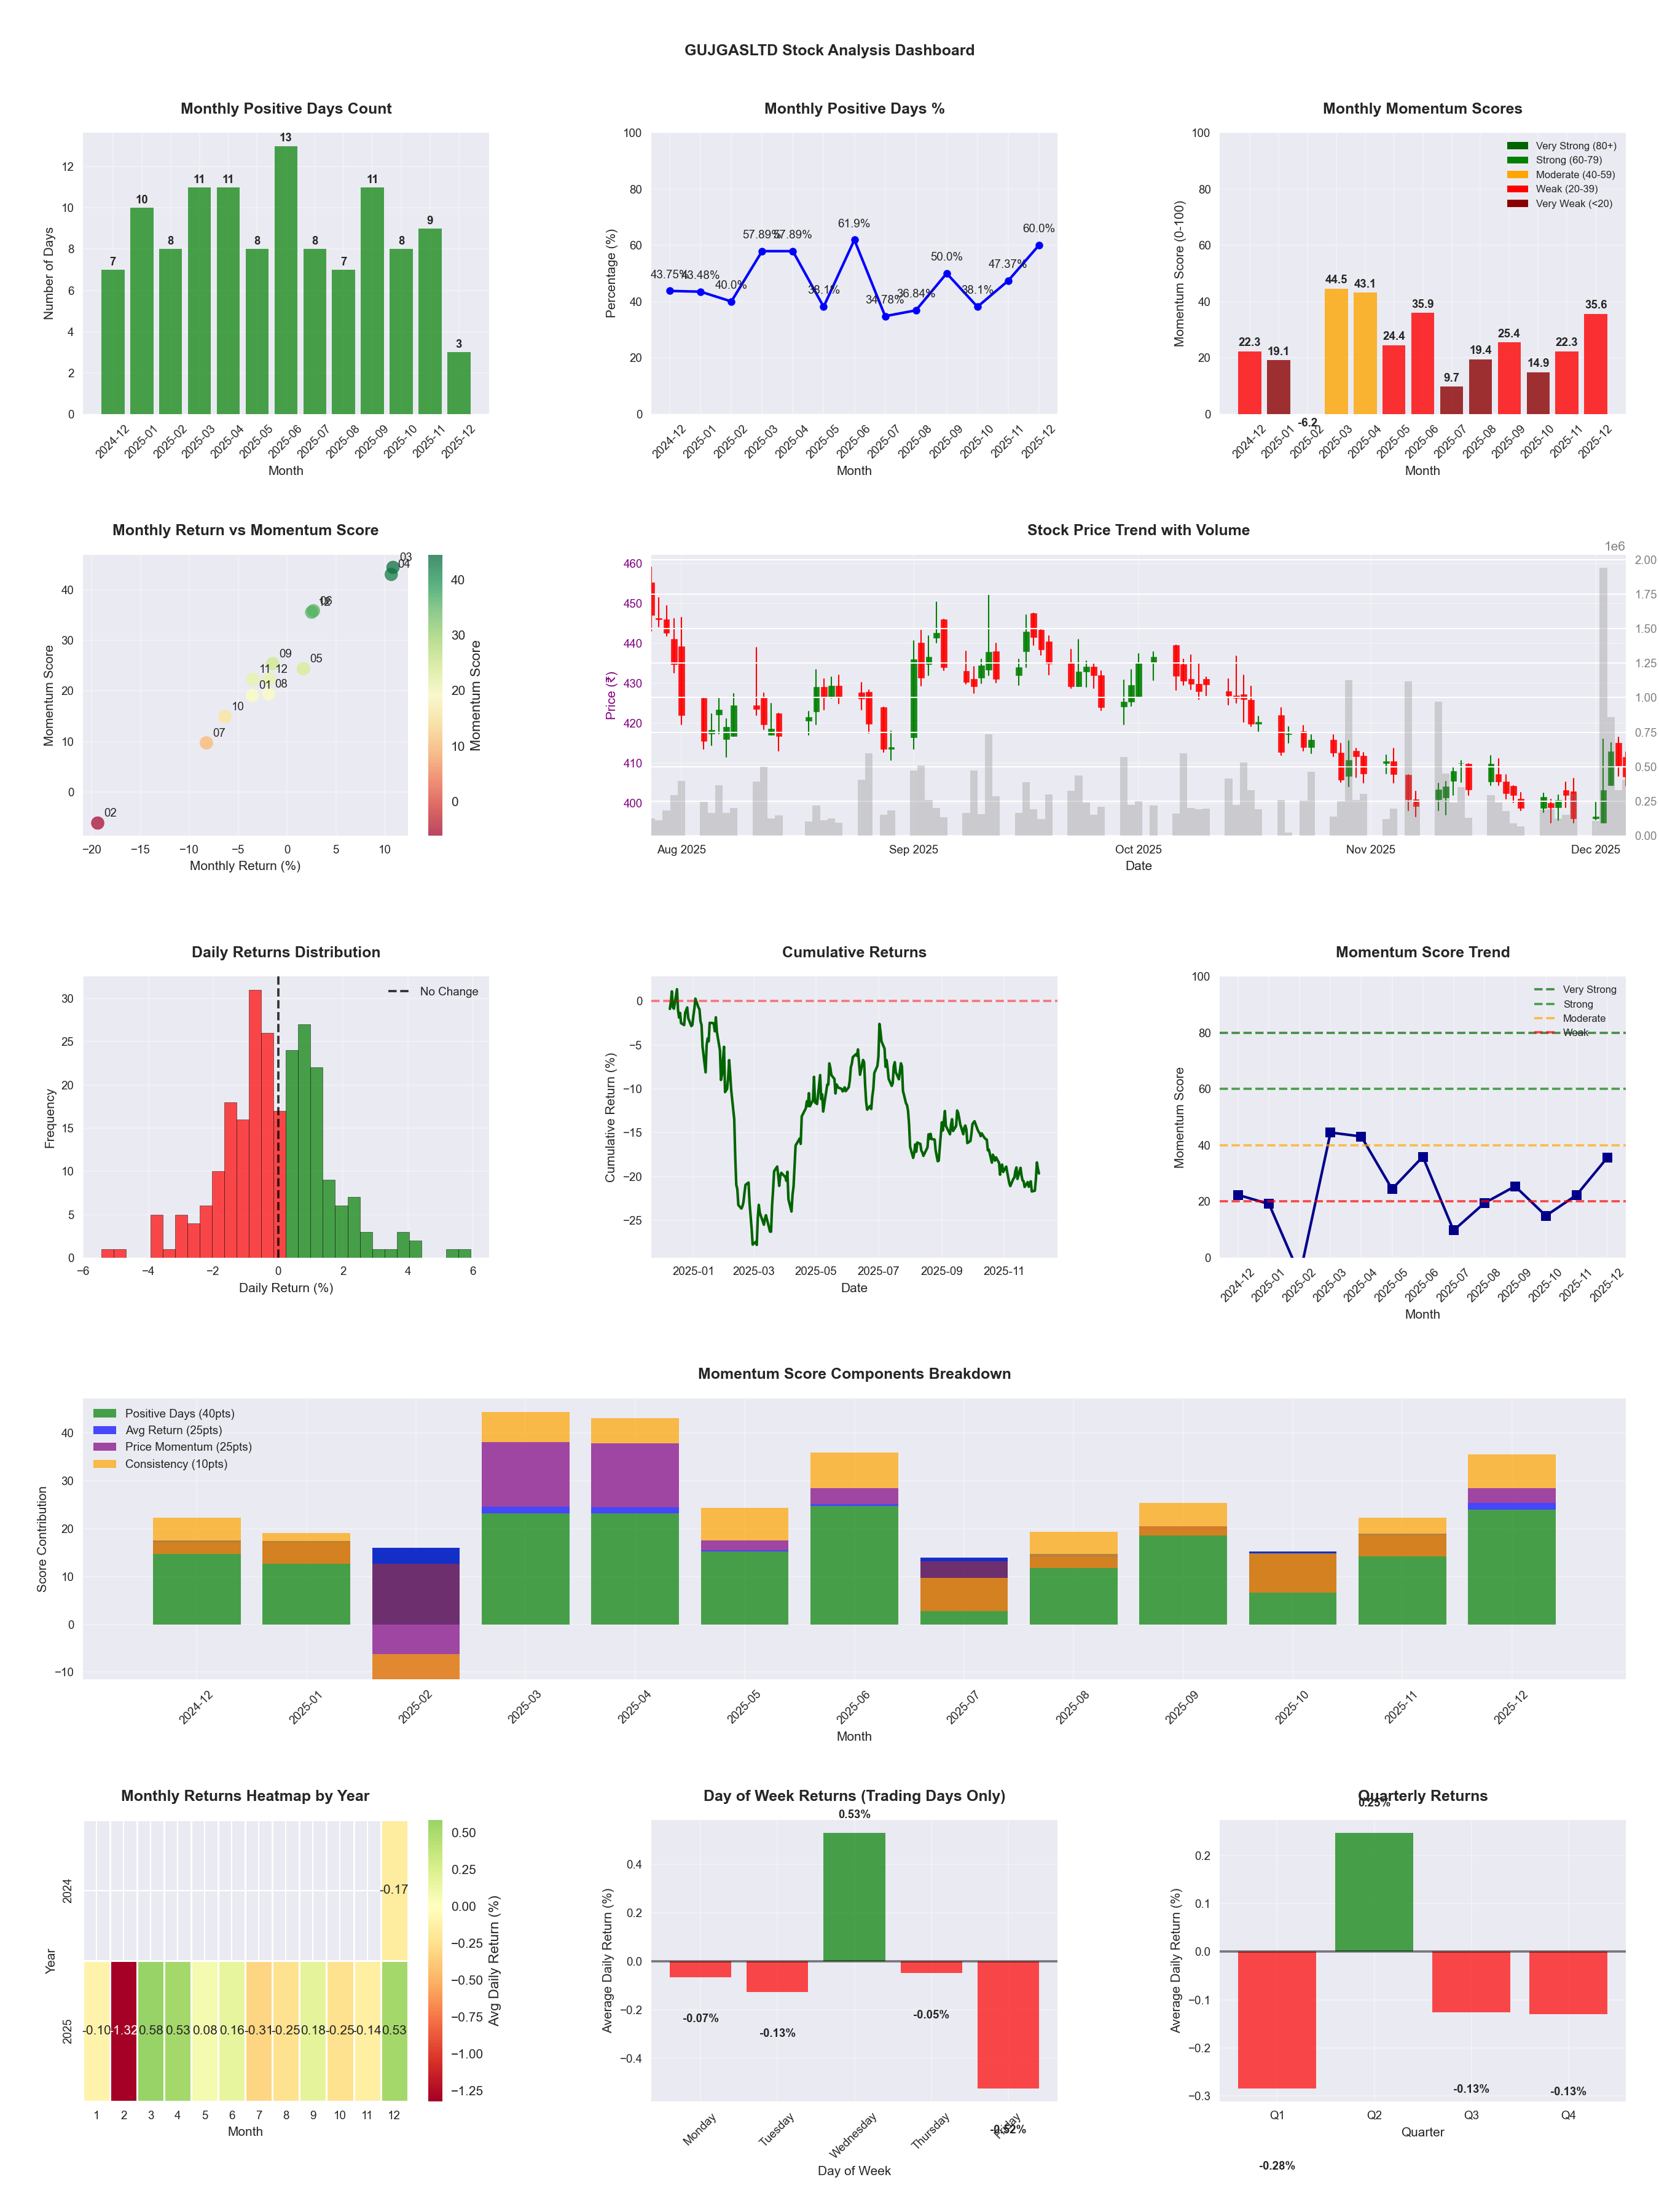
📊 Key Insights & Metrics
Symbol
📈 GUJGASLTD
Date
📅 2026-04-11
Volatility
🟡 1.63%
Win Rate
⚠️ 43.3%
Avg Daily Return
📉 -0.10%
Max Drawdown
📉 -37.66%
IBD RS Score
📊 7.1
Weak
Market Rank
#458
Best Month
🏆 2025-04
Best Months to Trade
📅 Apr, Dec, Sep
Best Days to Trade
📅 Wednesday, Tuesday
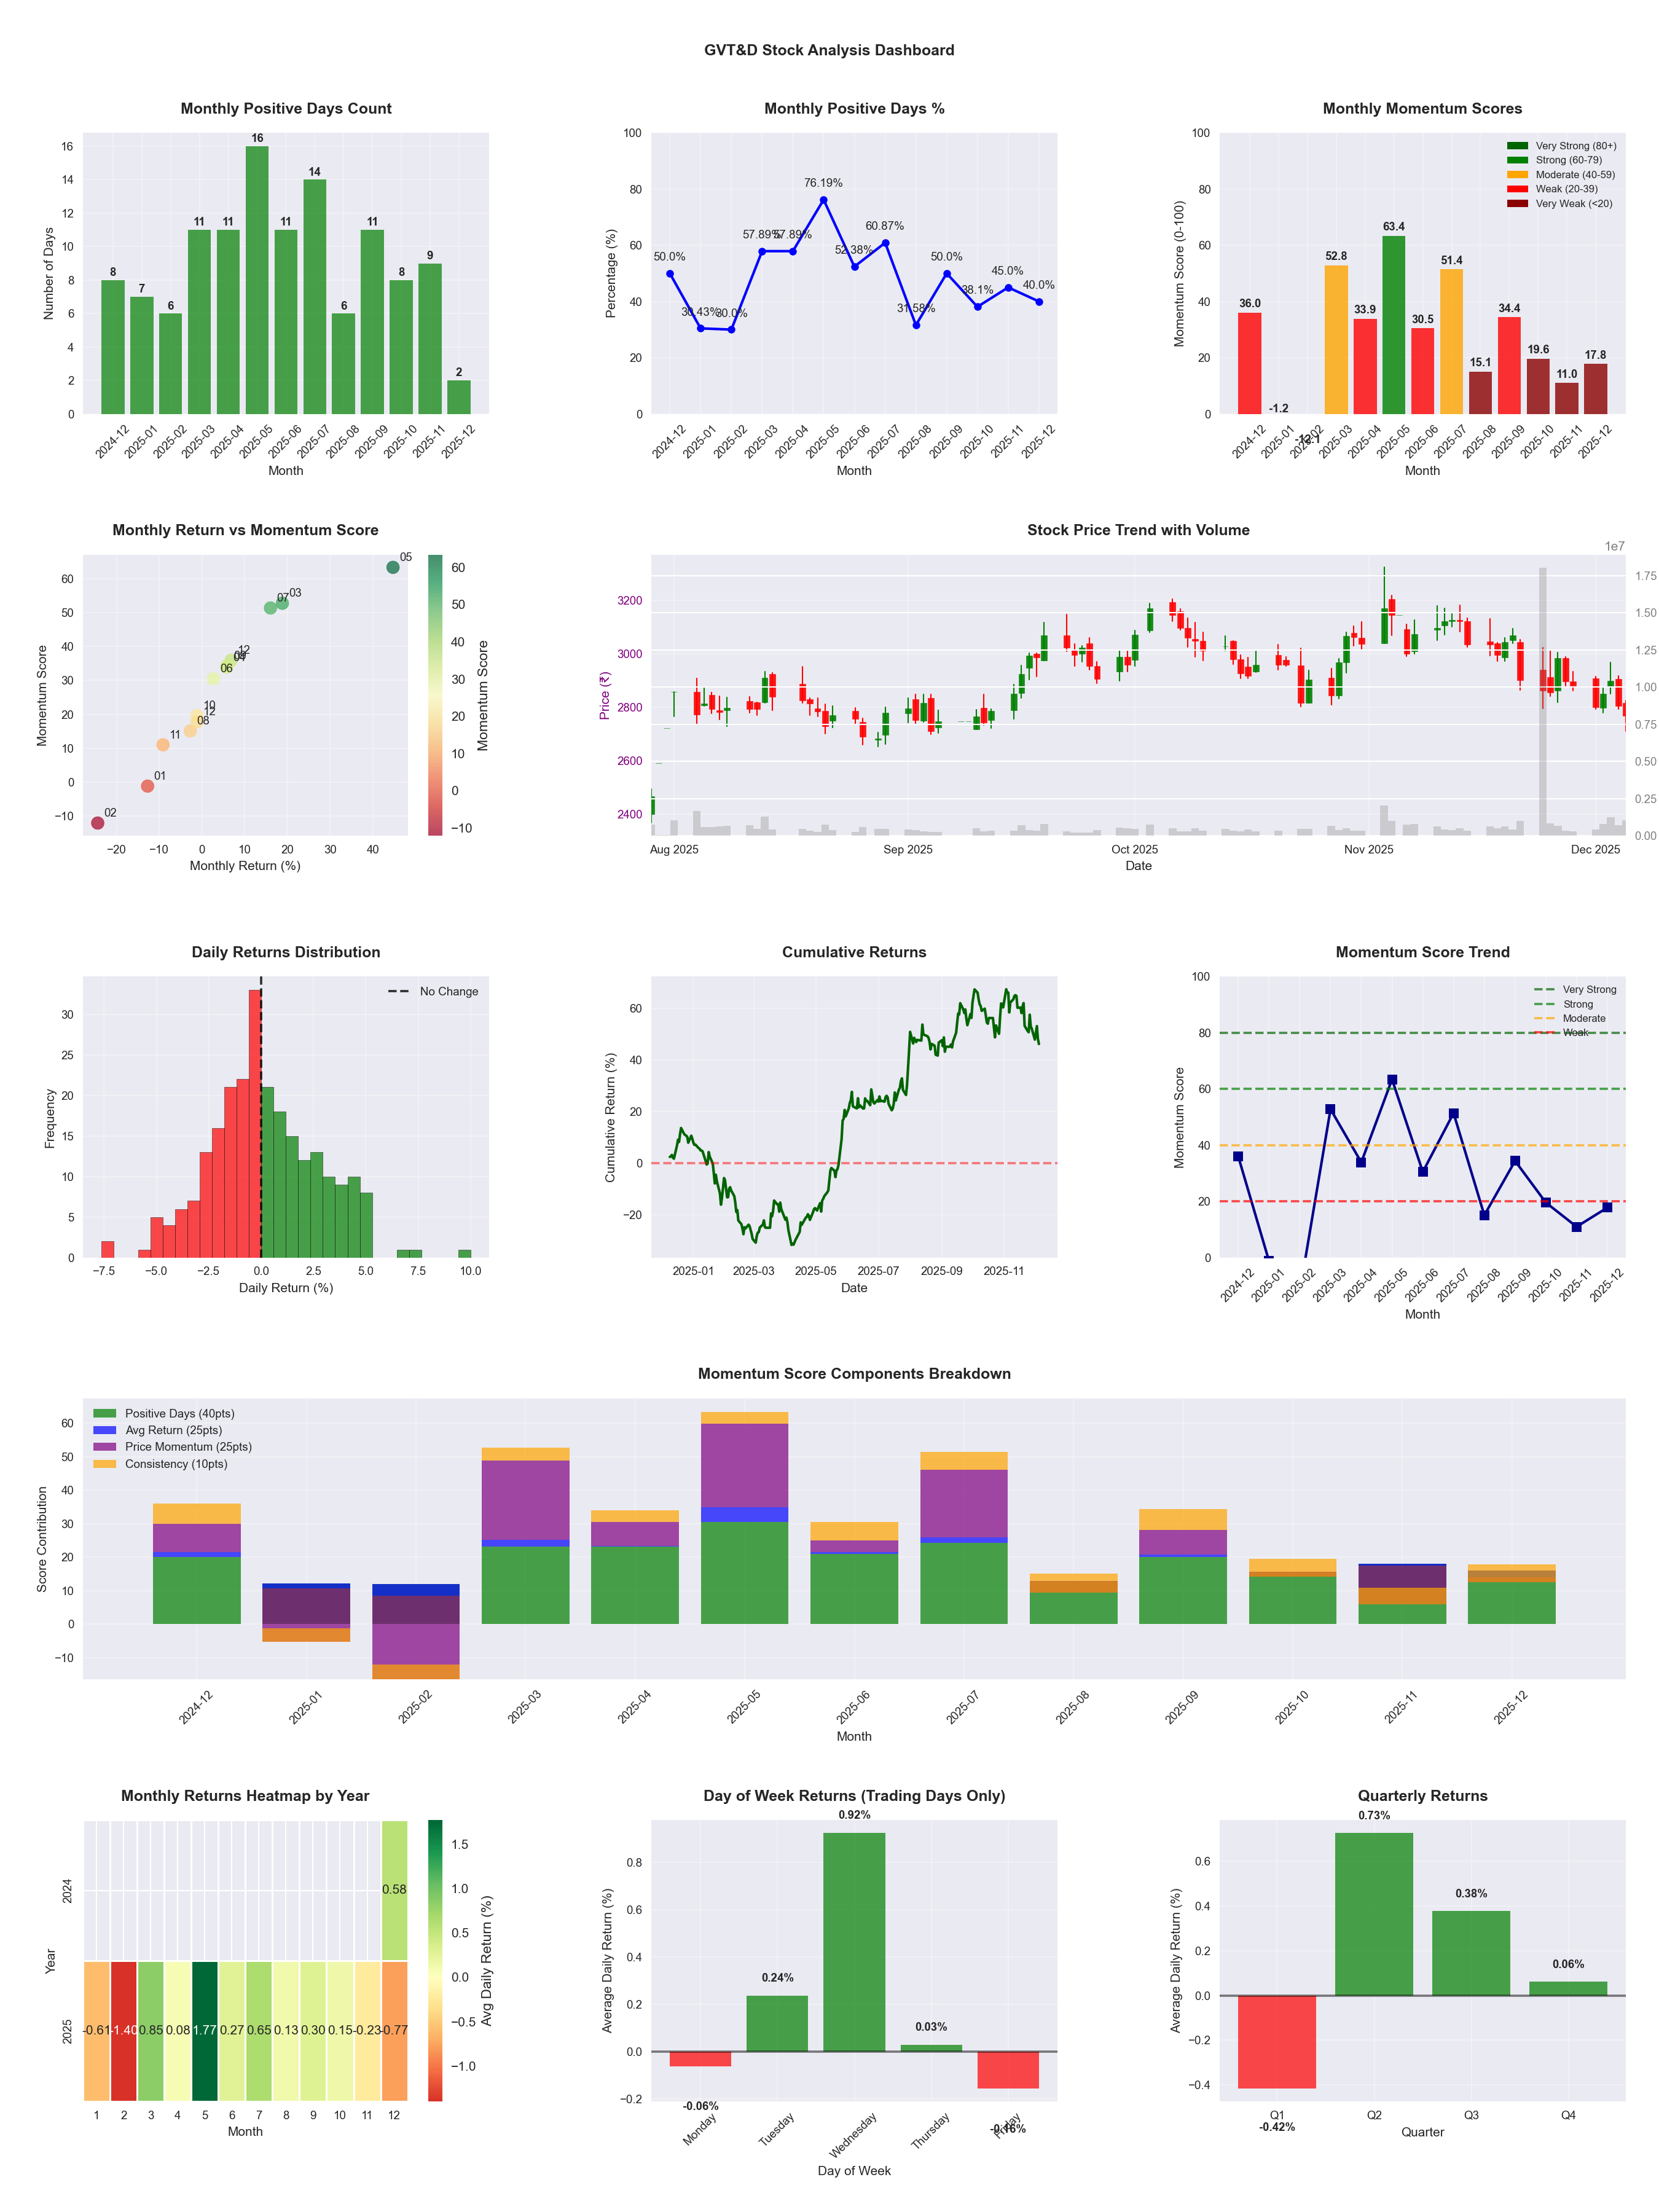
📊 Key Insights & Metrics
Symbol
📈 GVT
Date
📅 2026-04-11
Volatility
🟡 2.65%
Risk Profile
⚠️ suitable for aggressive investors
Win Rate
⚠️ 53.7%
Avg Daily Return
📈 +0.49%
Max Drawdown
📉 -19.34%
Best Month
🏆 2025-05
Worst Month
📉 2025-11
Best Months to Trade
📅 May, Apr, Feb
Best Days to Trade
📅 Wednesday, Tuesday
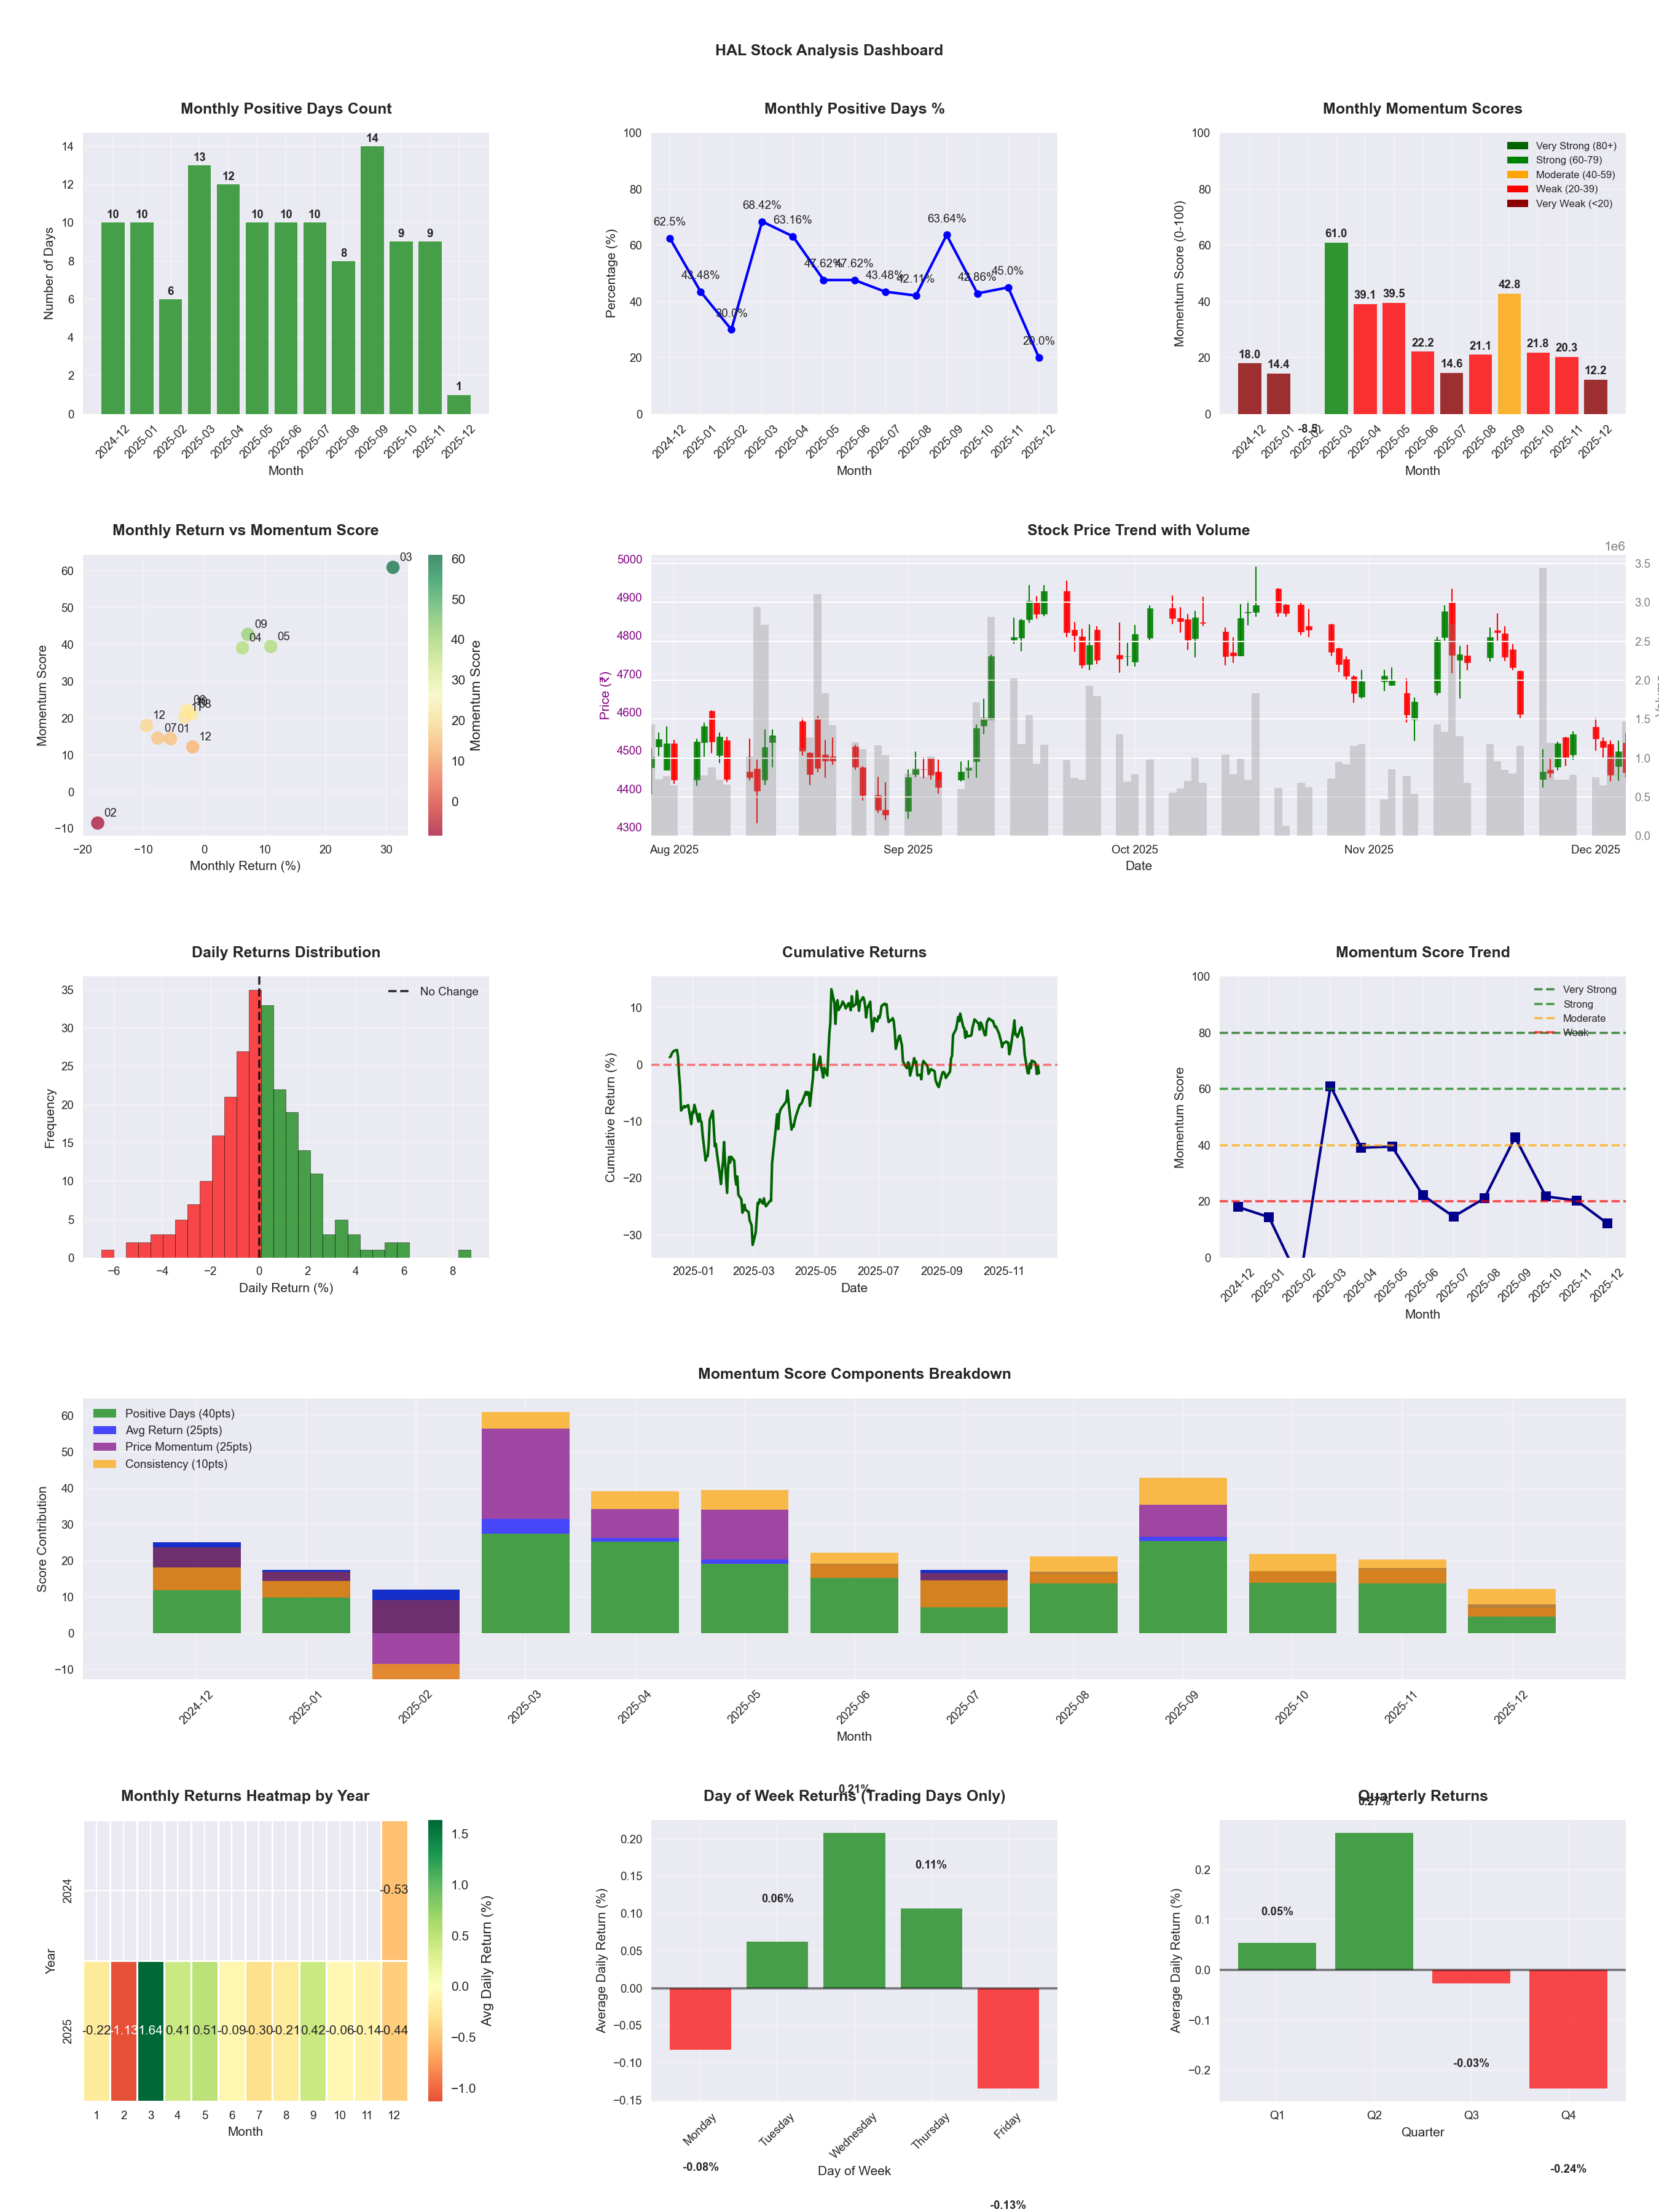
📊 Key Insights & Metrics
Symbol
📈 HAL
Date
📅 2026-04-11
Volatility
🟡 1.77%
Win Rate
⚠️ 50.8%
Avg Daily Return
📈 +0.02%
Max Drawdown
📉 -31.20%
IBD RS Score
📊 42.4
Weak
Market Rank
#284
Best Month
🏆 2026-04
Worst Month
📉 2026-03
Best Months to Trade
📅 Apr, May, Sep
Best Days to Trade
📅 Wednesday, Tuesday
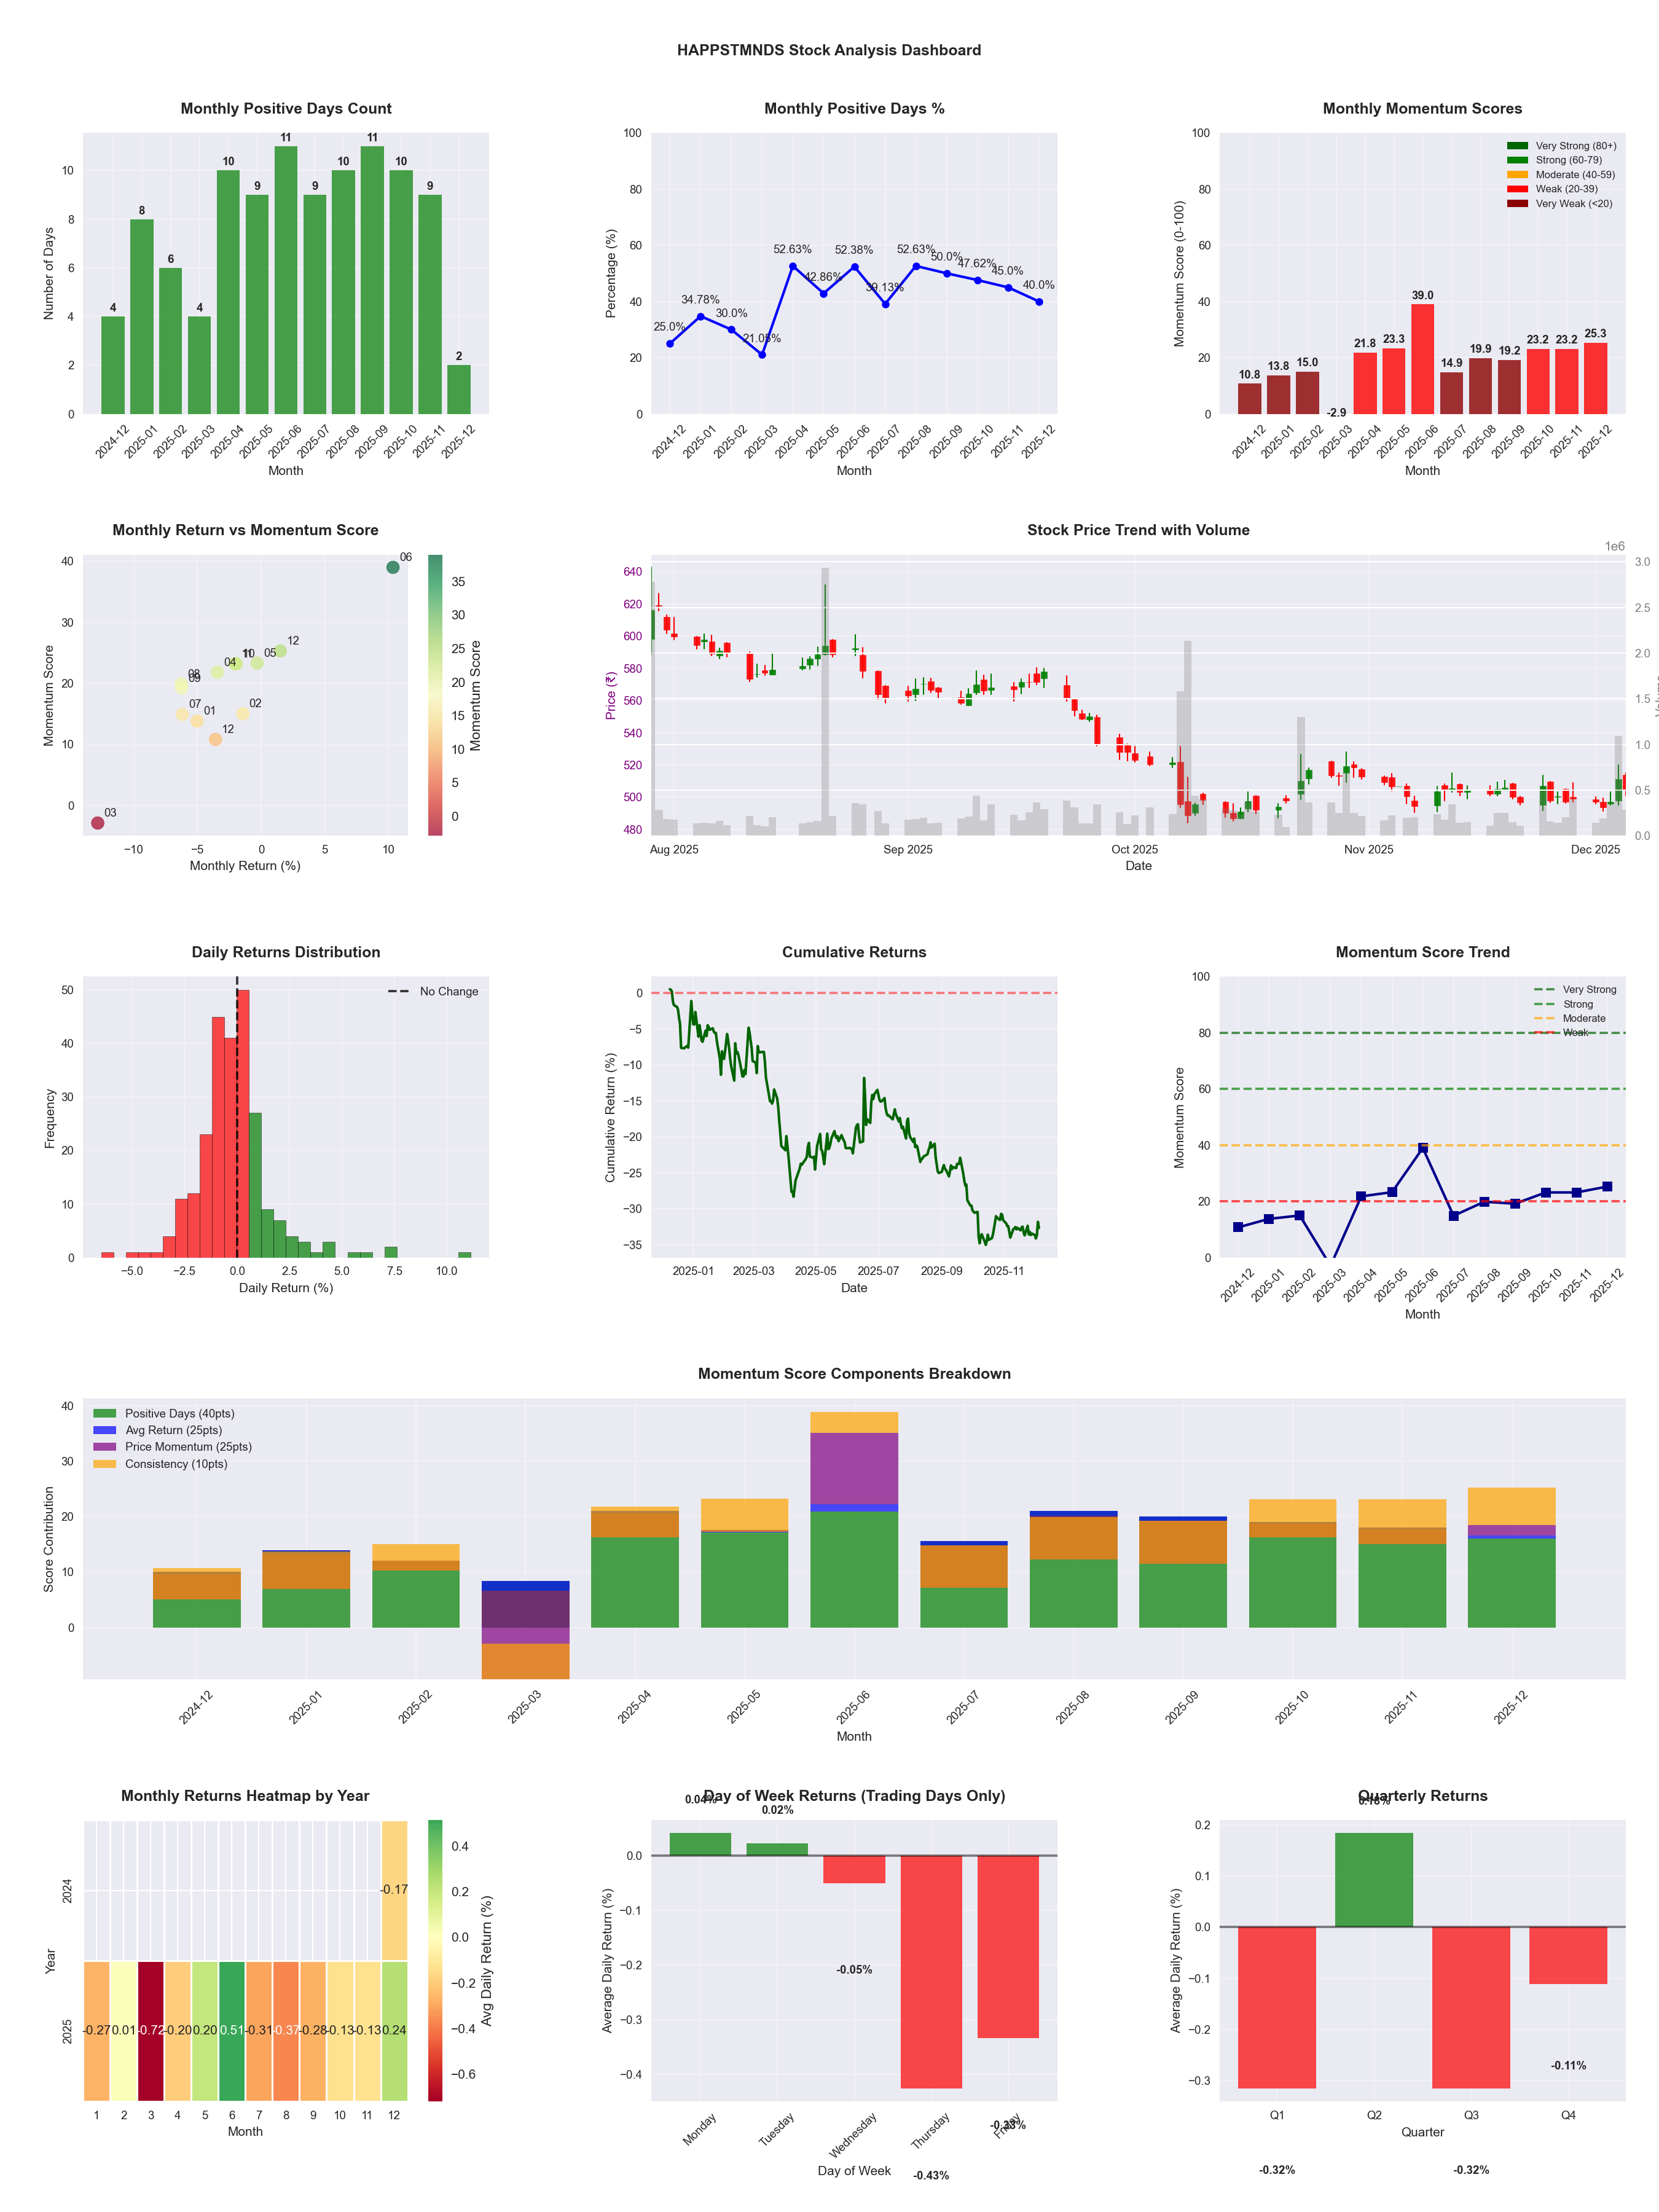
📊 Key Insights & Metrics
Symbol
📈 HAPPSTMNDS
Date
📅 2026-04-11
Volatility
🟡 2.31%
Risk Profile
⚠️ suitable for aggressive investors
Win Rate
⚠️ 42.7%
Avg Daily Return
📉 -0.13%
Max Drawdown
📉 -48.96%
IBD RS Score
📊 8.3
Weak
Market Rank
#452
Best Month
🏆 2025-06
Worst Month
📉 2026-02
Best Months to Trade
📅 Jun, Apr, May
Best Days to Trade
📅 Tuesday, Wednesday
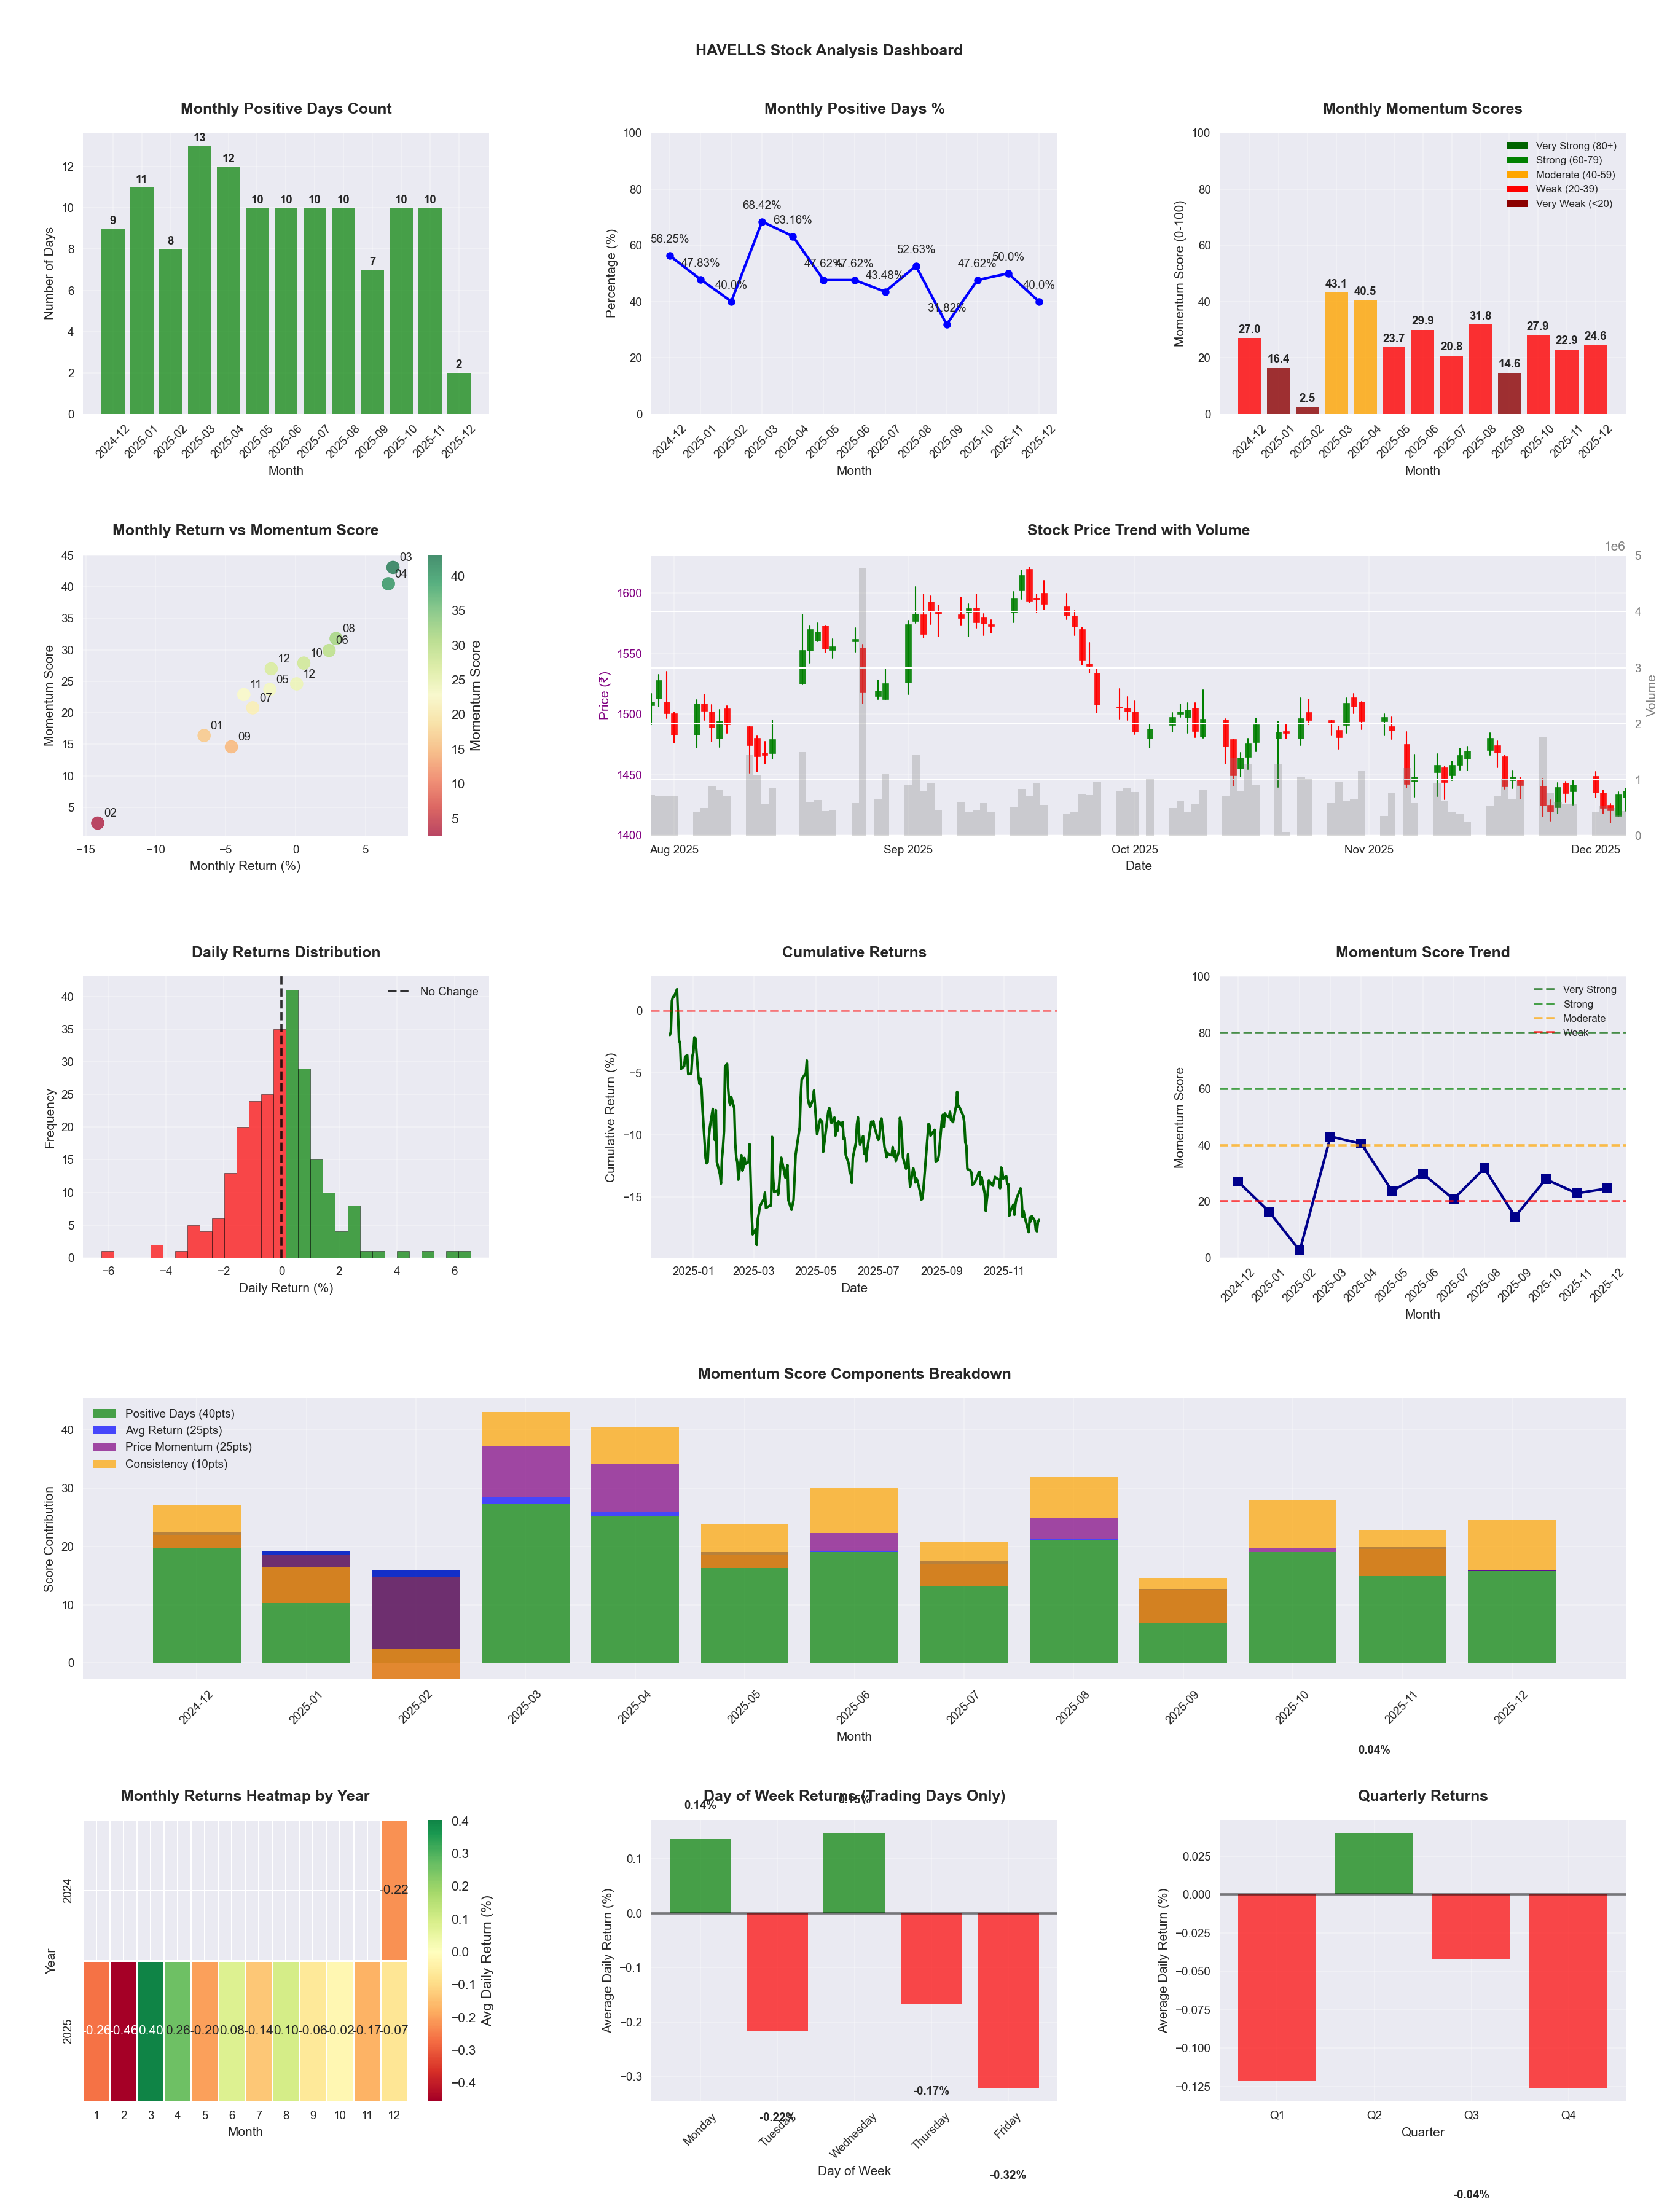
📊 Key Insights & Metrics
Symbol
📈 HAVELLS
Date
📅 2026-04-11
Volatility
🟢 1.40%
Win Rate
⚠️ 47.6%
Avg Daily Return
📉 -0.06%
Max Drawdown
📉 -28.59%
IBD RS Score
📊 26.4
Weak
Market Rank
#363
Best Month
🏆 2026-04
Worst Month
📉 2026-03
Best Months to Trade
📅 Apr, Feb, Aug
Best Days to Trade
📅 Tuesday, Monday
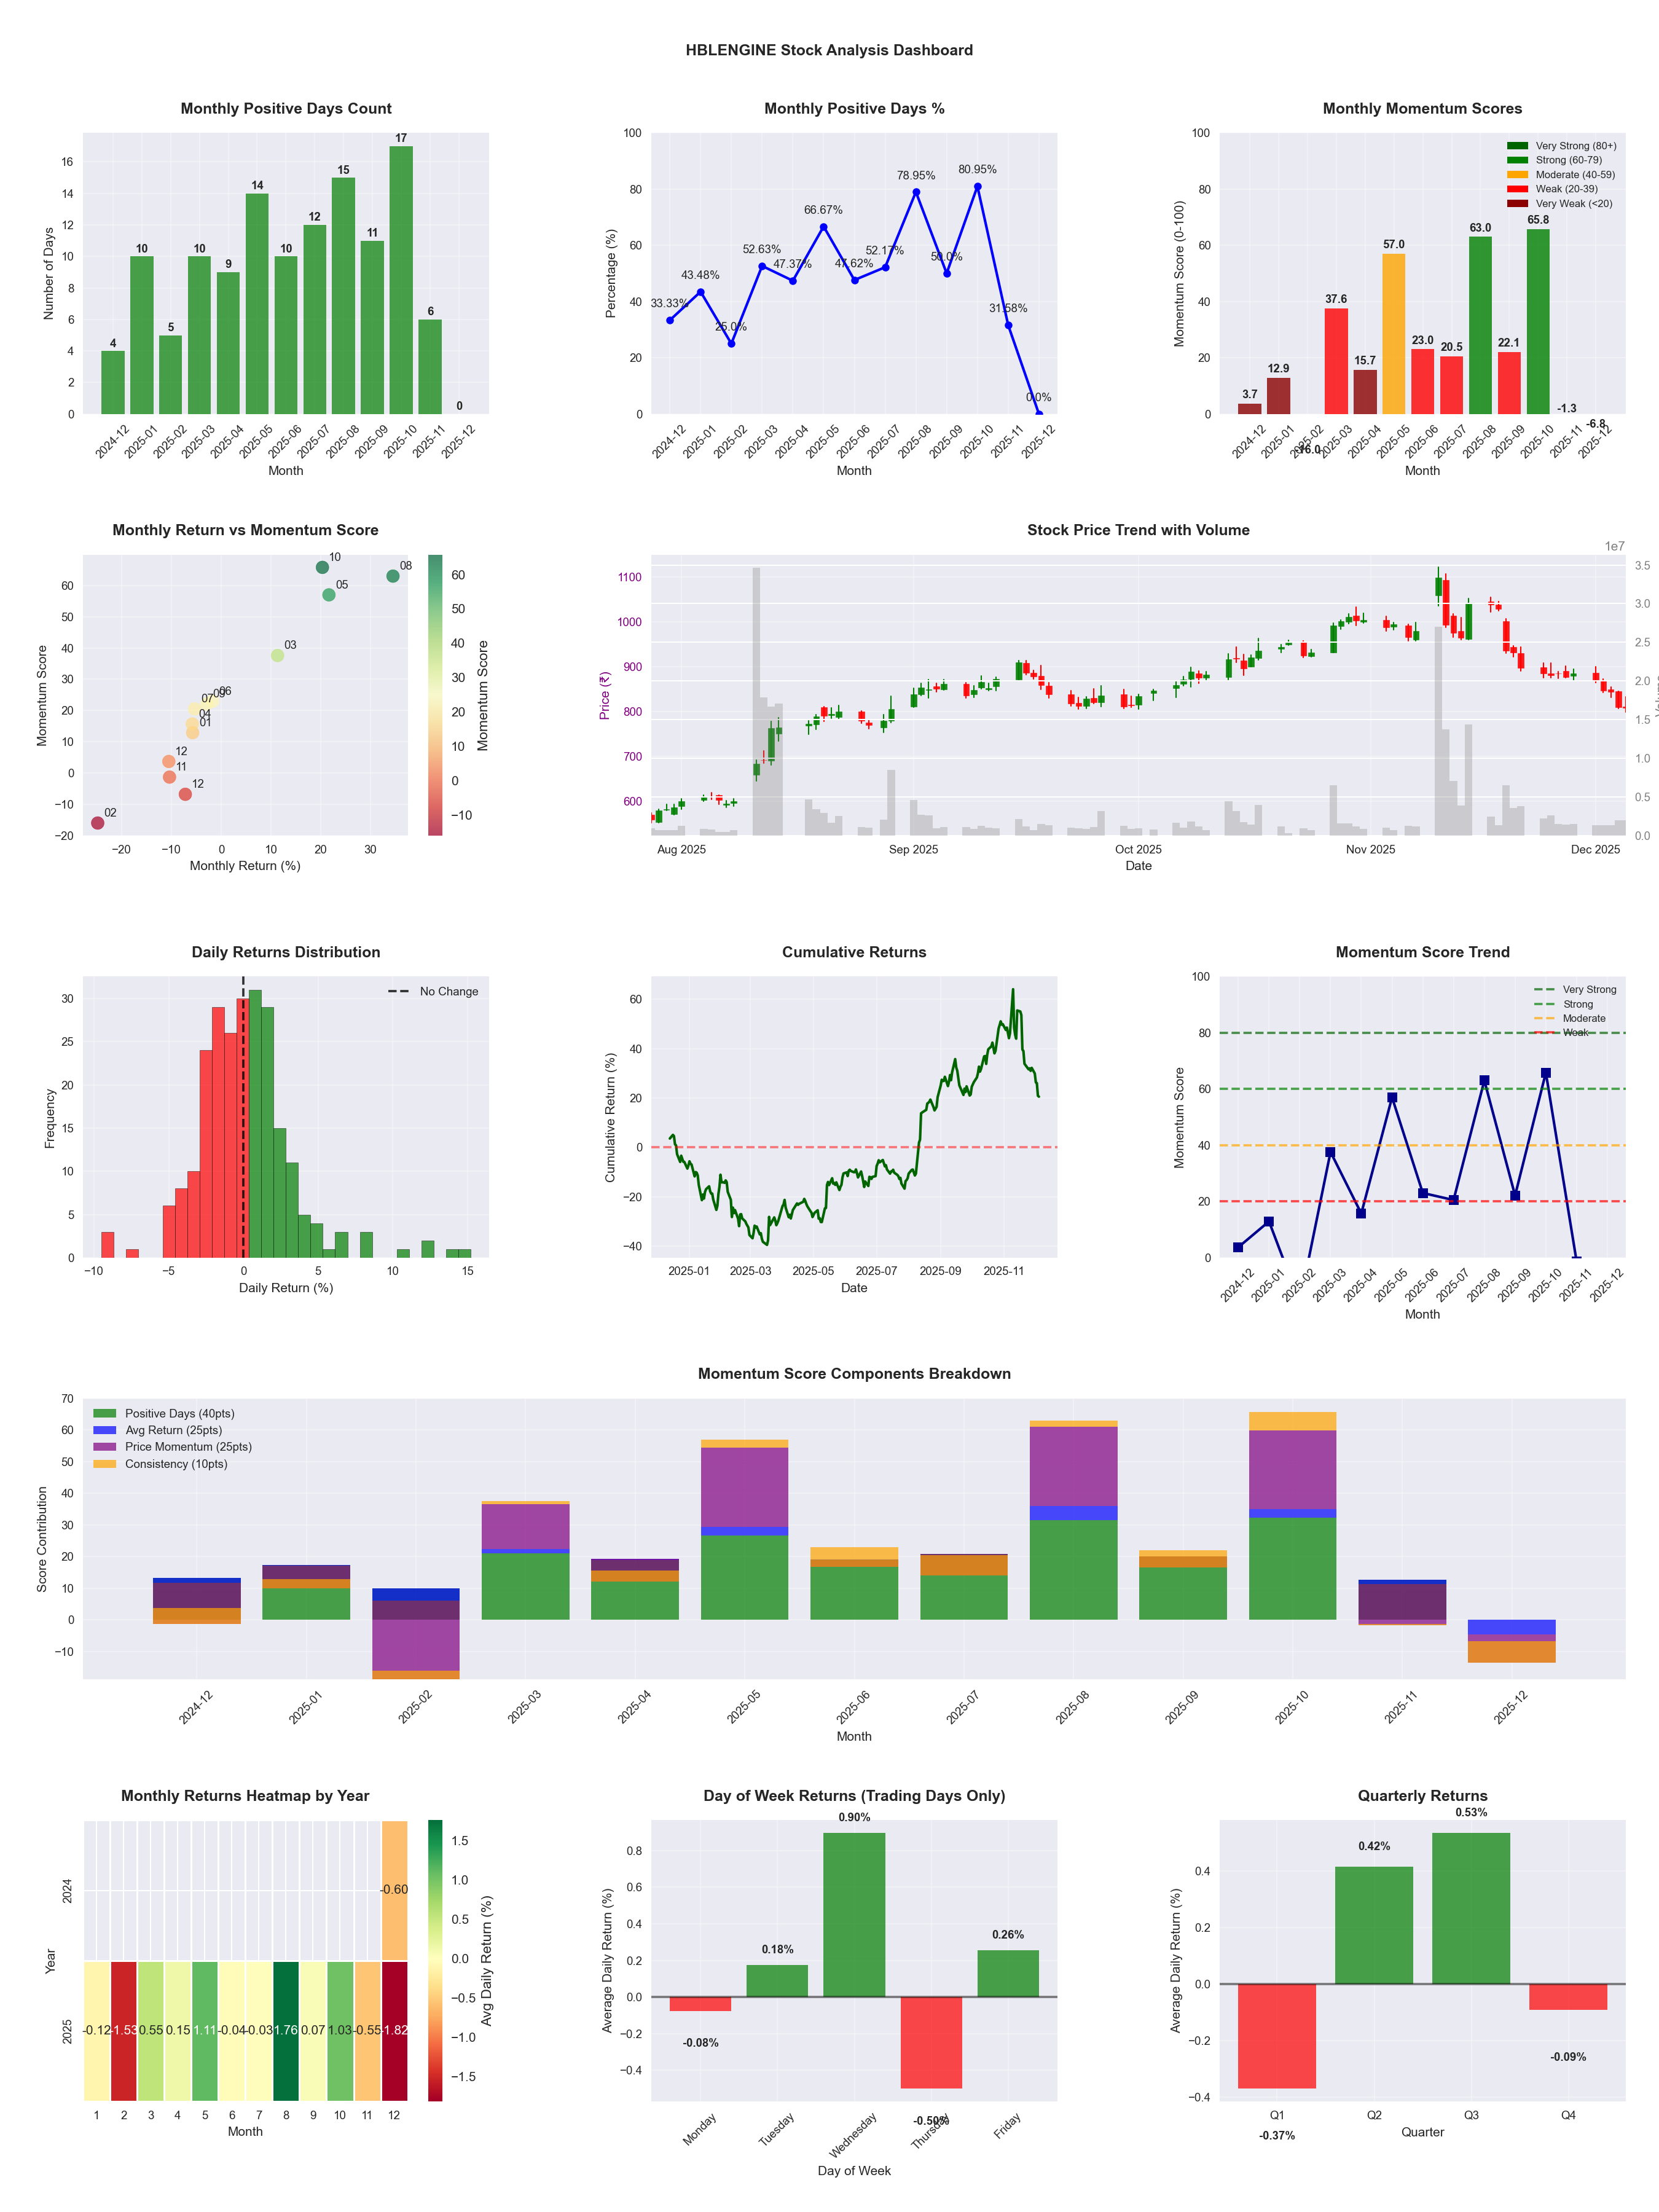
📊 Key Insights & Metrics
Symbol
📈 HBLENGINE
Date
📅 2026-04-11
Volatility
🔴 3.03%
Risk Profile
⚠️ suitable for aggressive investors
Win Rate
⚠️ 53.9%
Avg Daily Return
📈 +0.20%
Max Drawdown
📉 -43.90%
IBD RS Score
📊 65.7
Average
Market Rank
#169
Best Month
🏆 2025-10
Best Months to Trade
📅 Aug, May, Oct
Best Days to Trade
📅 Wednesday, Monday
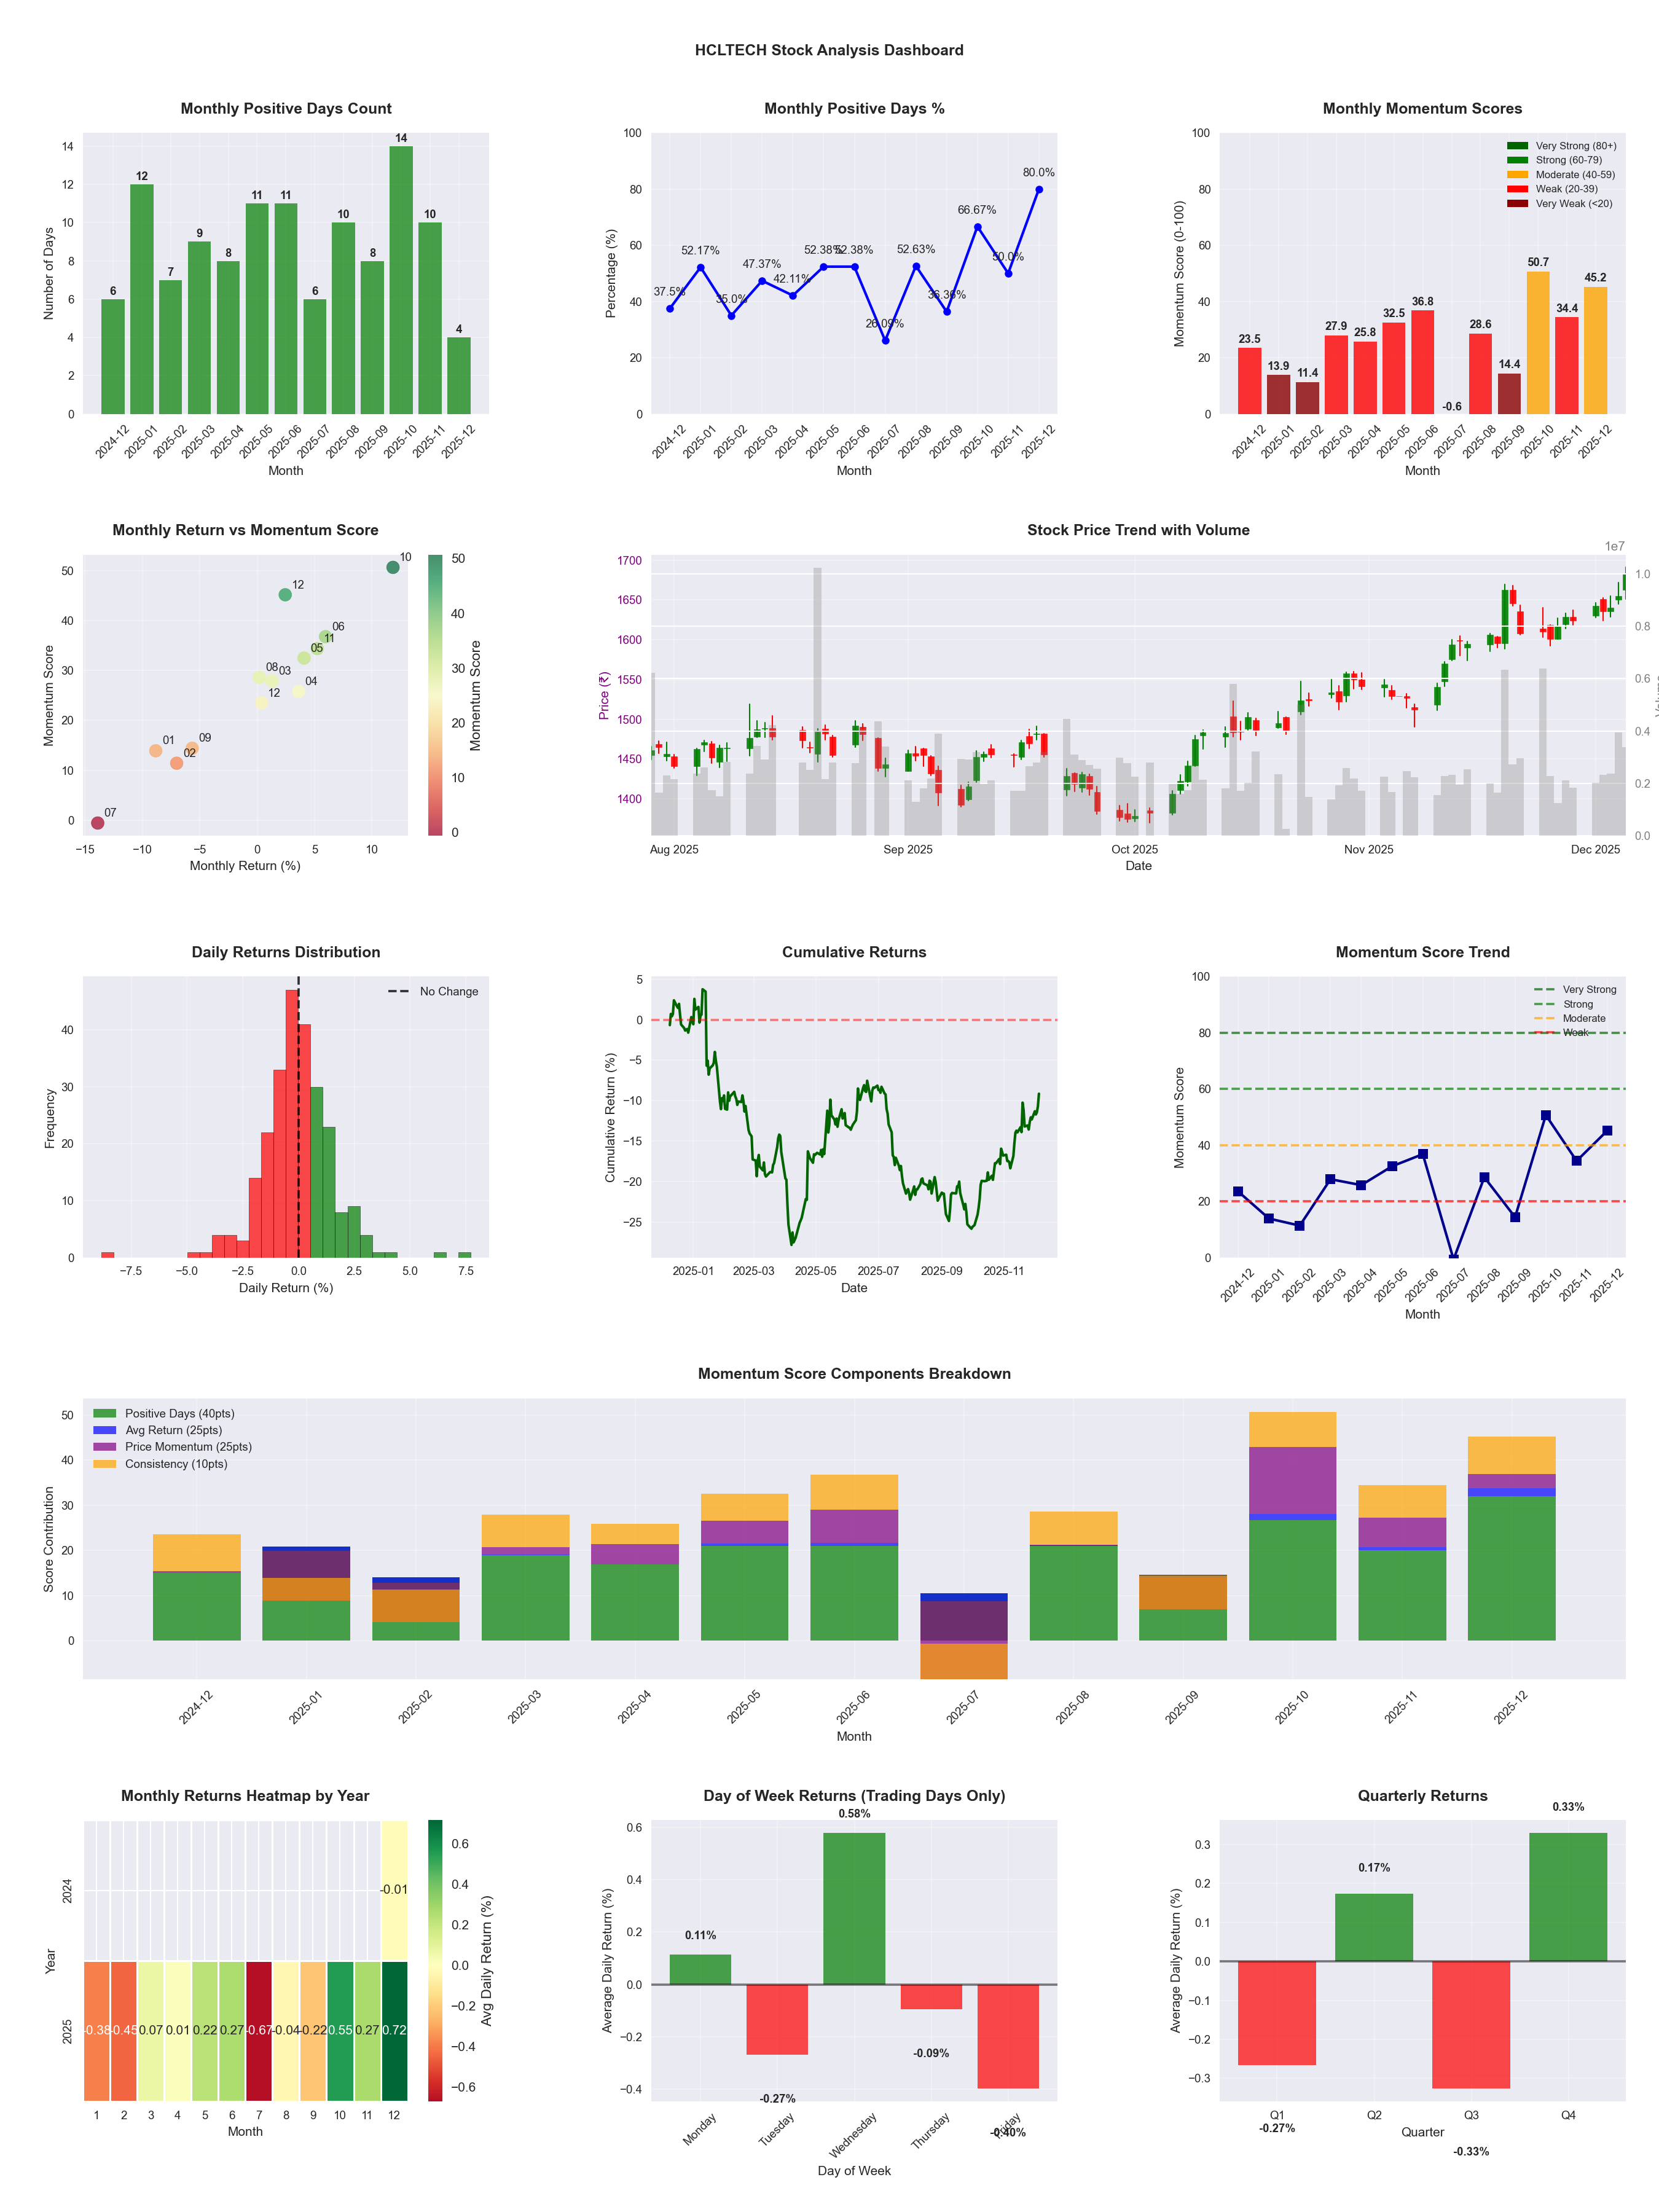
📊 Key Insights & Metrics
Symbol
📈 HCLTECH
Date
📅 2026-04-11
Volatility
🟡 1.53%
Win Rate
⚠️ 50.8%
Avg Daily Return
📈 +0.04%
Max Drawdown
📉 -24.16%
IBD RS Score
📊 50.9
Average
Market Rank
#242
Best Month
🏆 2026-04
Best Months to Trade
📅 Apr, Oct, Nov
Best Days to Trade
📅 Wednesday, Monday
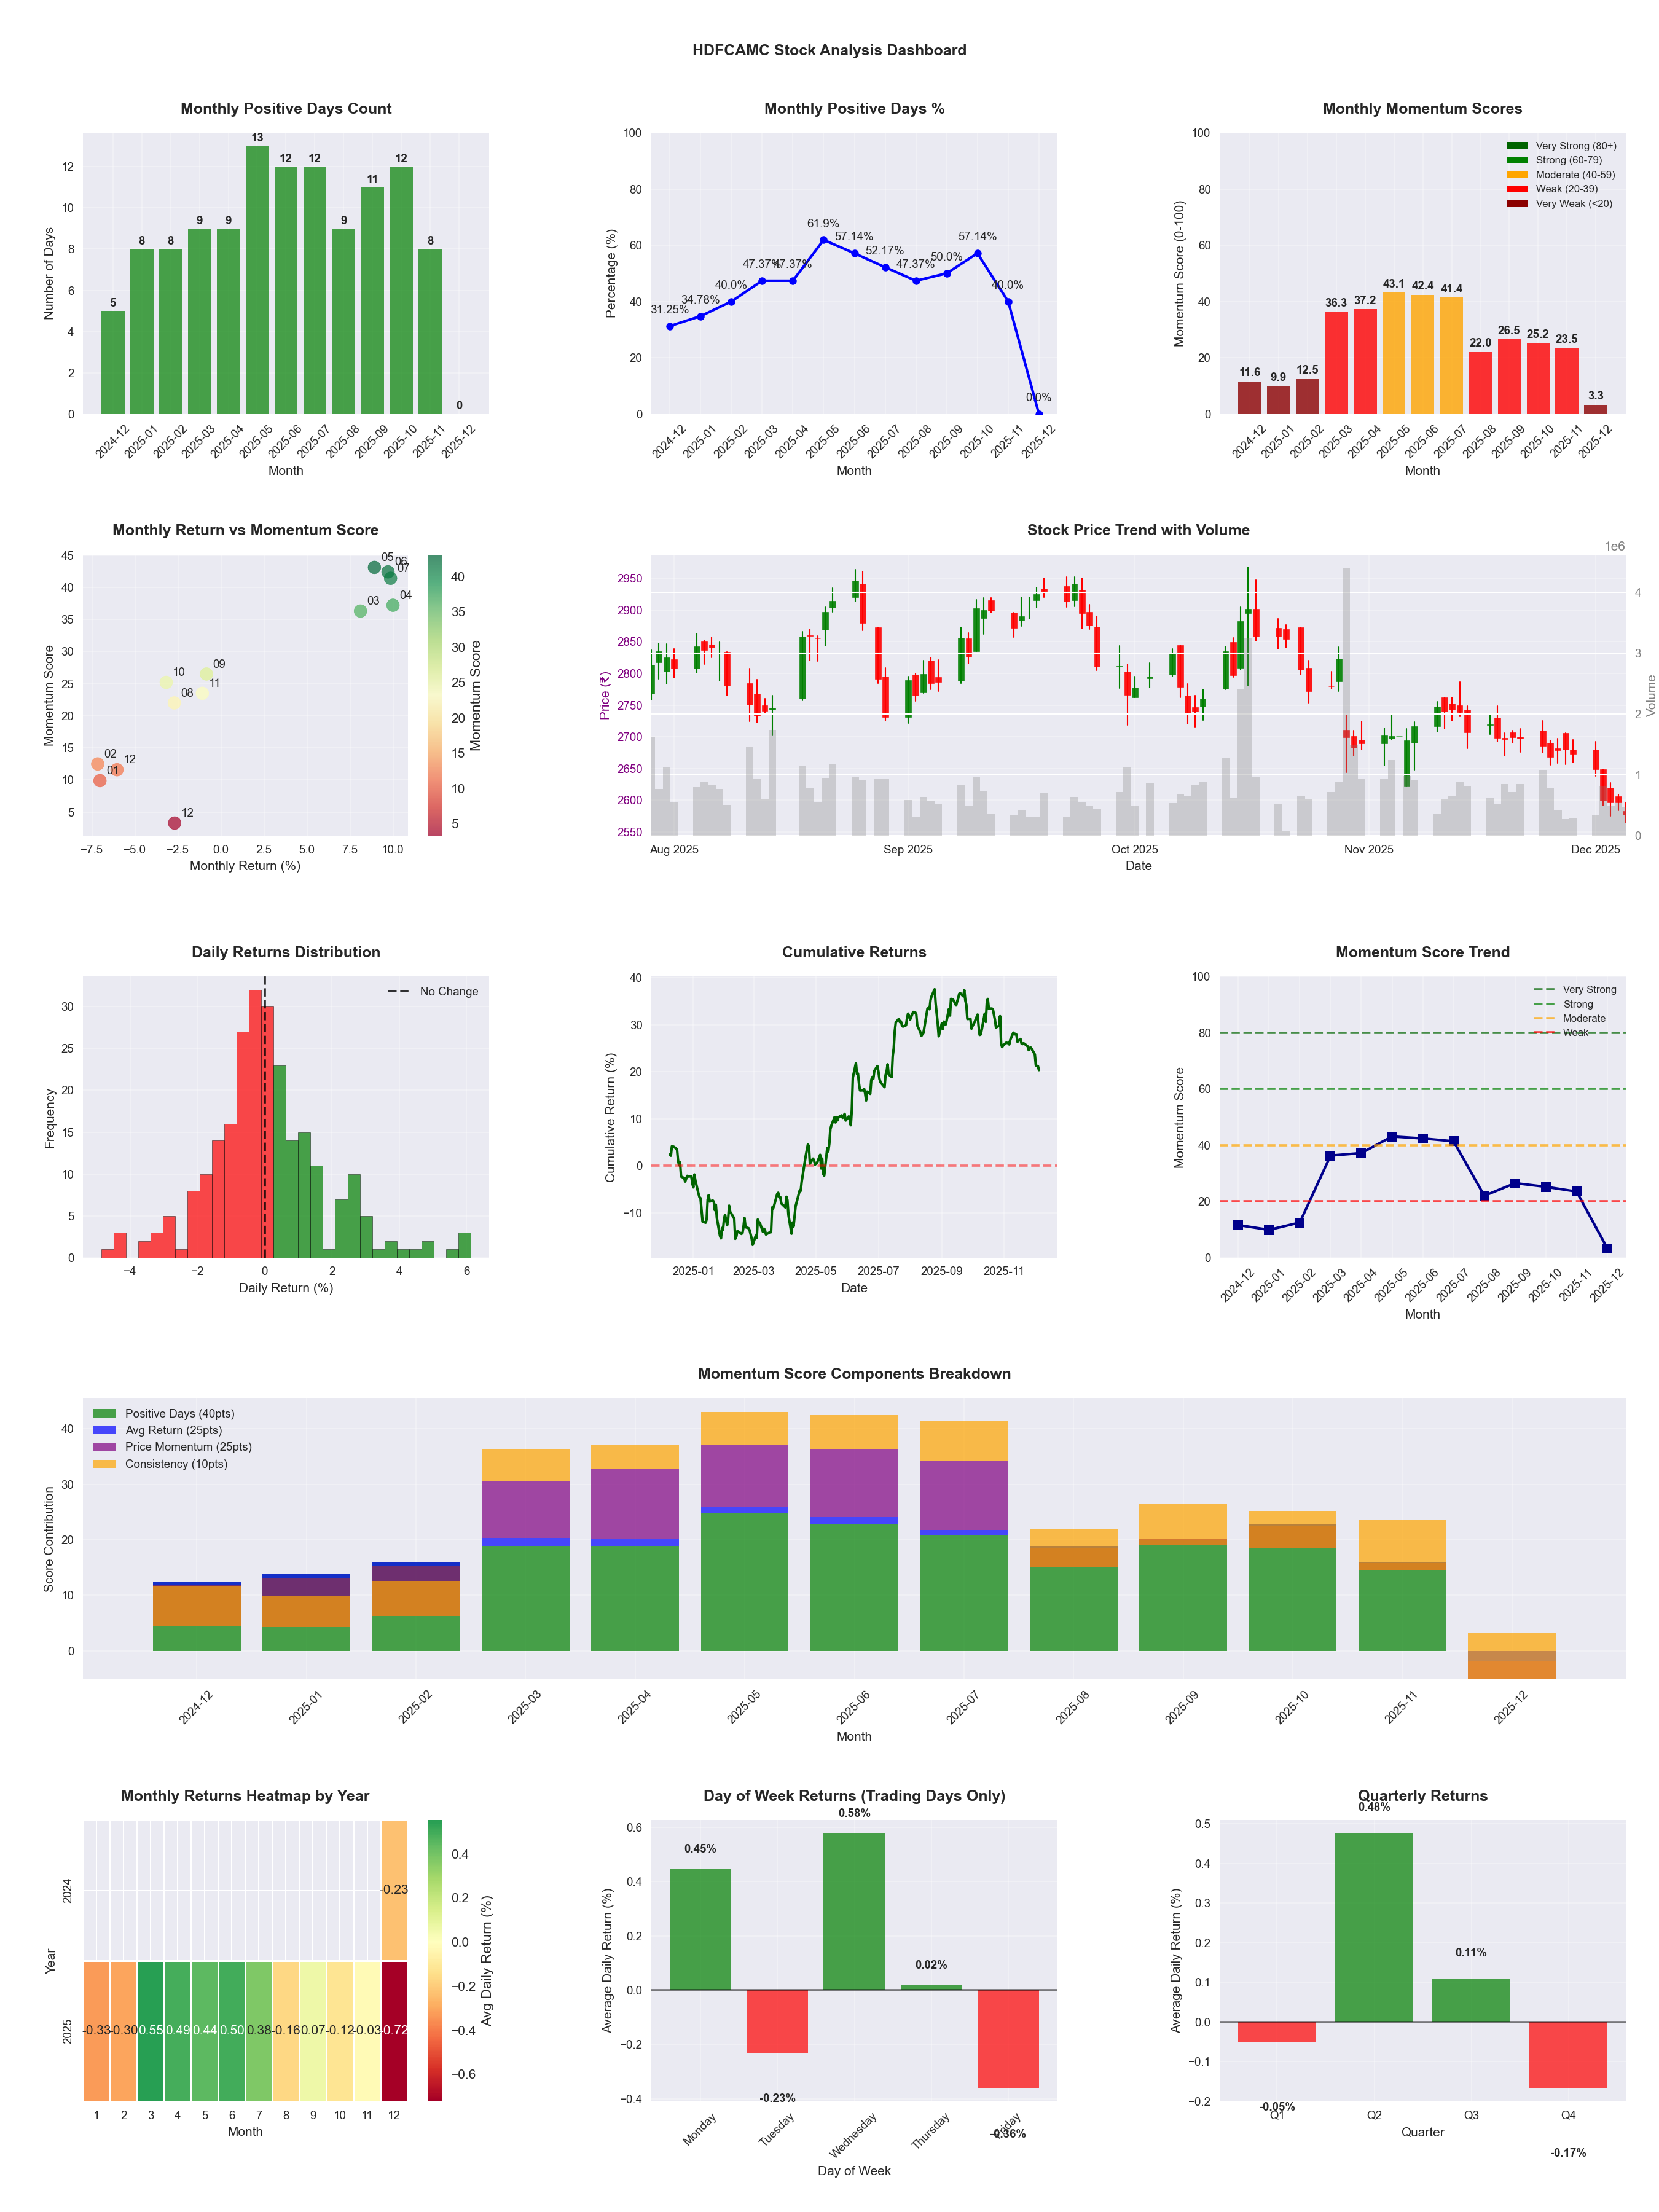
📊 Key Insights & Metrics
Symbol
📈 HDFCAMC
Date
📅 2026-04-11
Volatility
🟡 1.91%
Win Rate
⚠️ 50.0%
Avg Daily Return
📈 +0.14%
Max Drawdown
📉 -24.77%
IBD RS Score
📊 71.8
Strong
Market Rank
#139
Best Month
🏆 2026-04
Best Months to Trade
📅 Apr, Jun, May
Best Days to Trade
📅 Wednesday, Monday
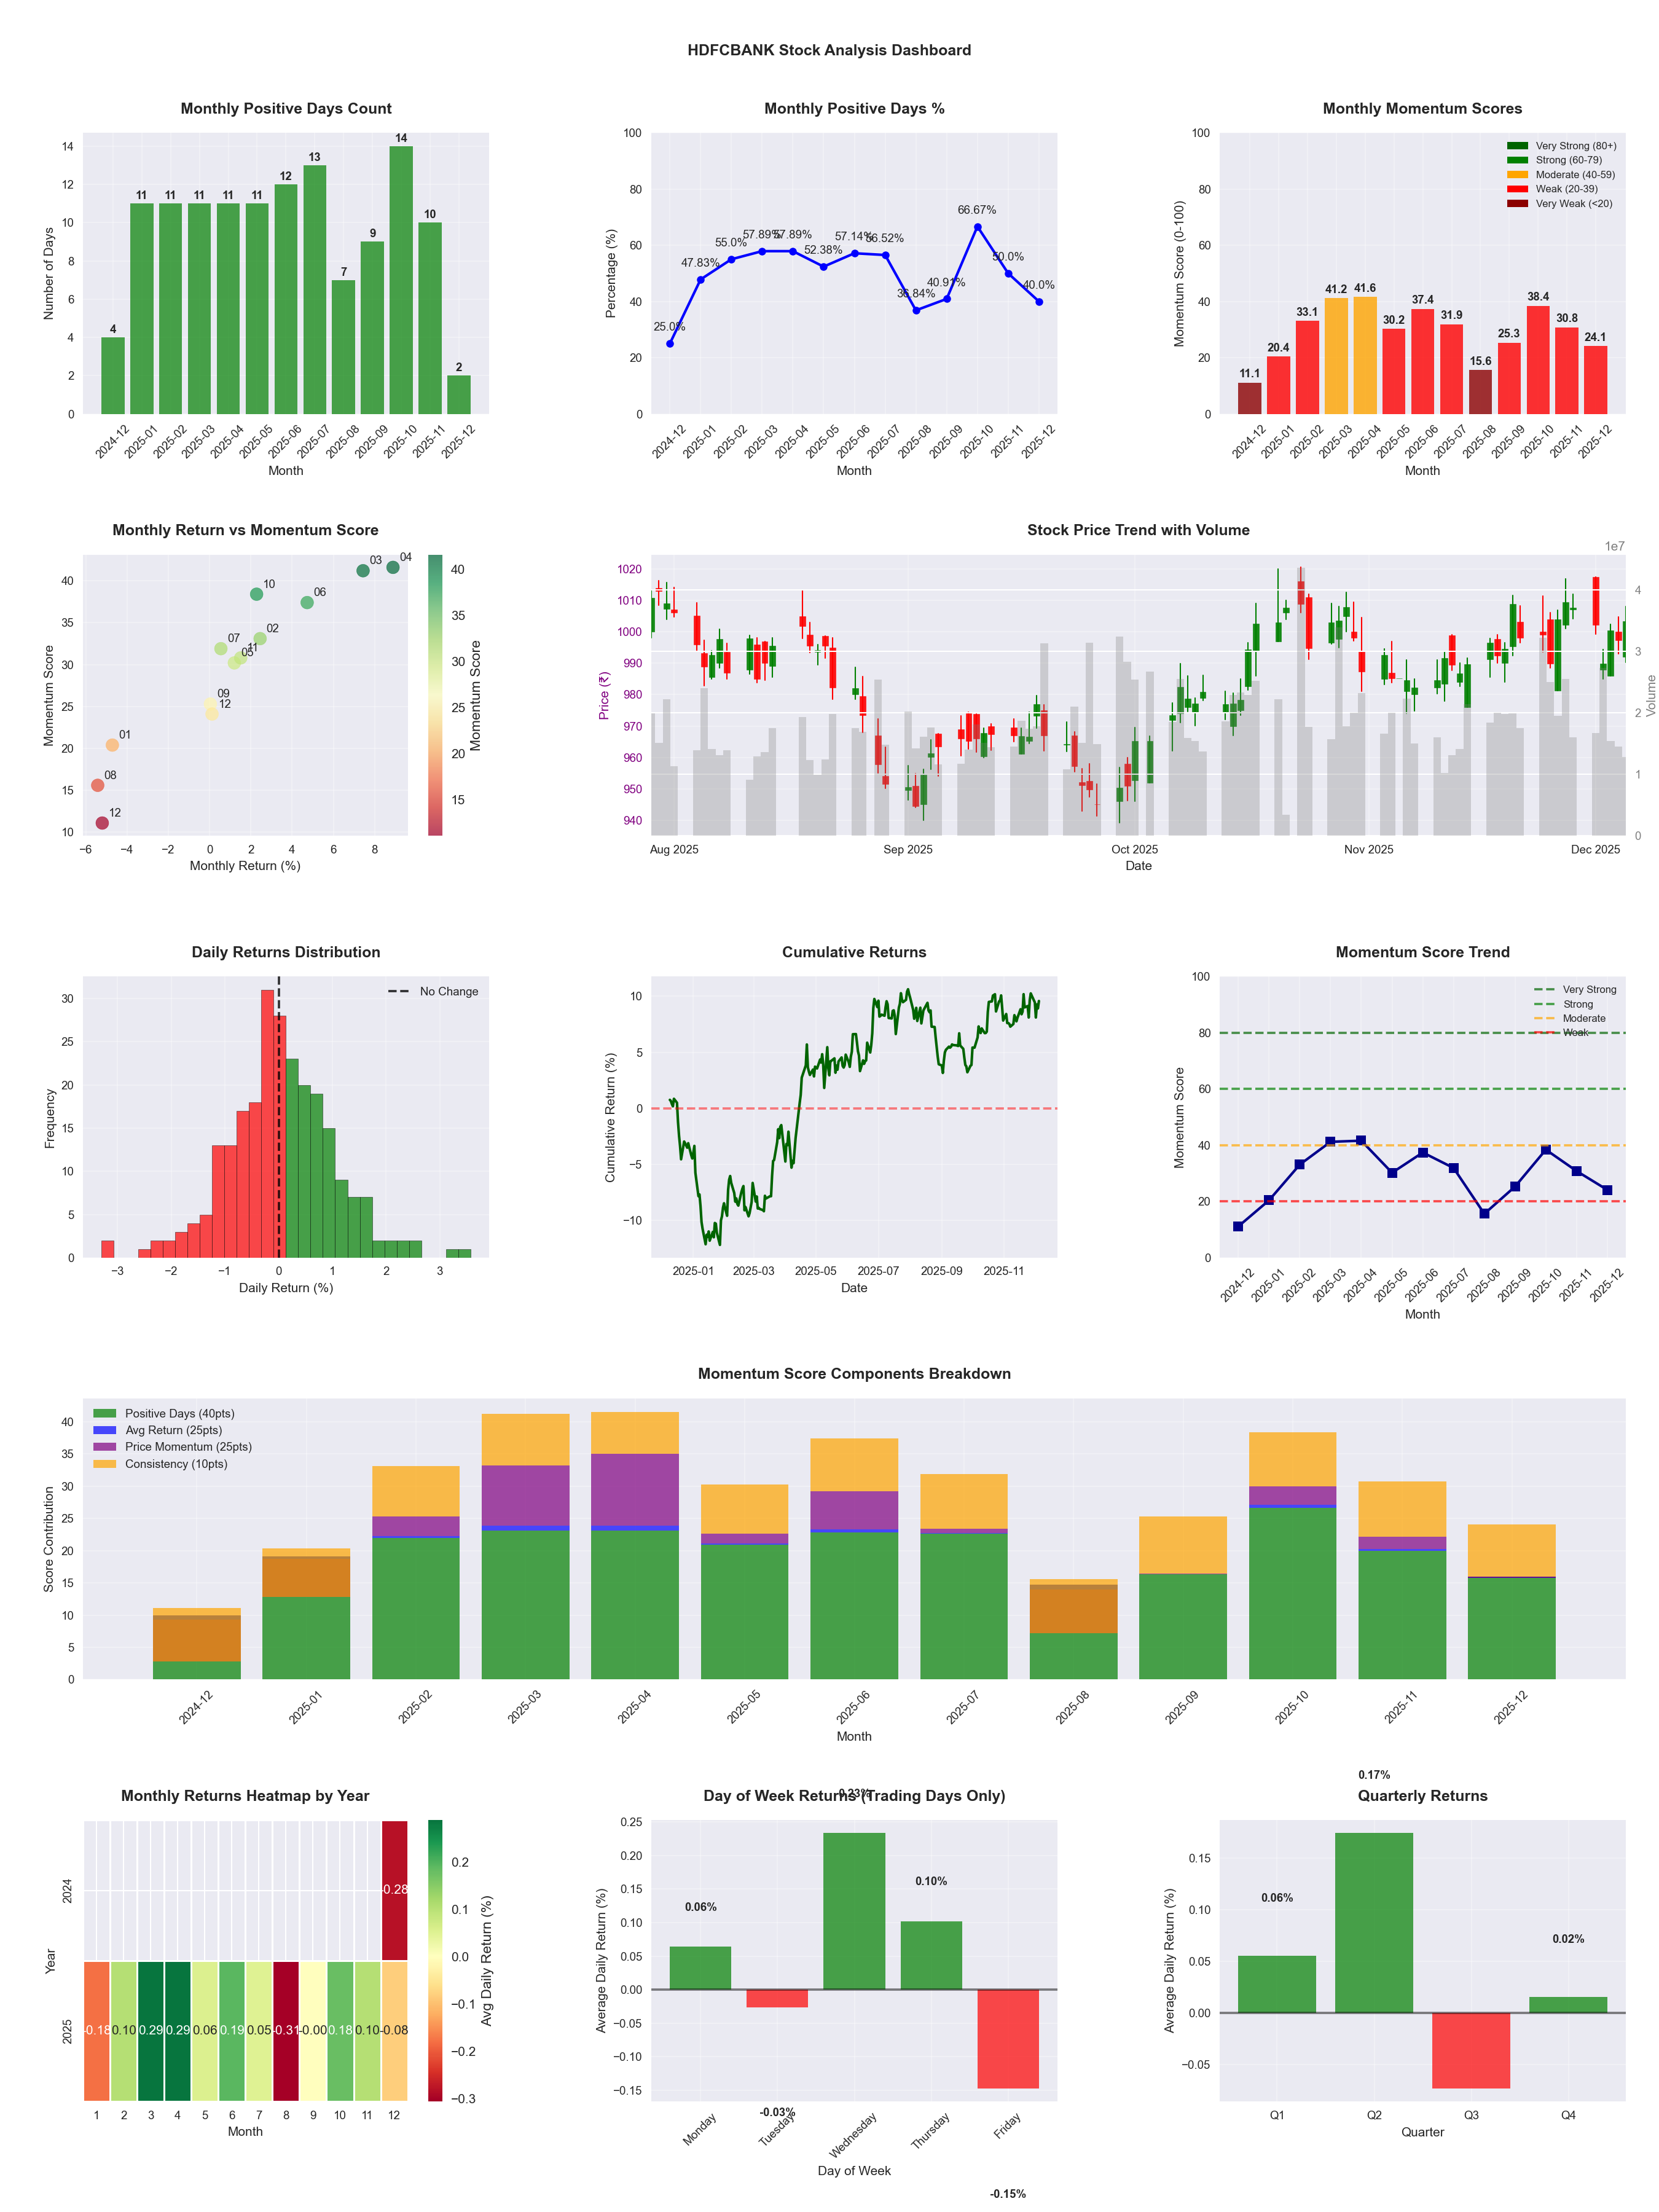
📊 Key Insights & Metrics
Symbol
📈 HDFCBANK
Date
📅 2026-04-11
Volatility
🟢 1.18%
Win Rate
⚠️ 46.8%
Avg Daily Return
📉 -0.03%
Max Drawdown
📉 -27.78%
IBD RS Score
📊 24.9
Weak
Market Rank
#370
Best Month
🏆 2026-04
Best Months to Trade
📅 Apr, Jun, Oct
Best Days to Trade
📅 Wednesday, Monday
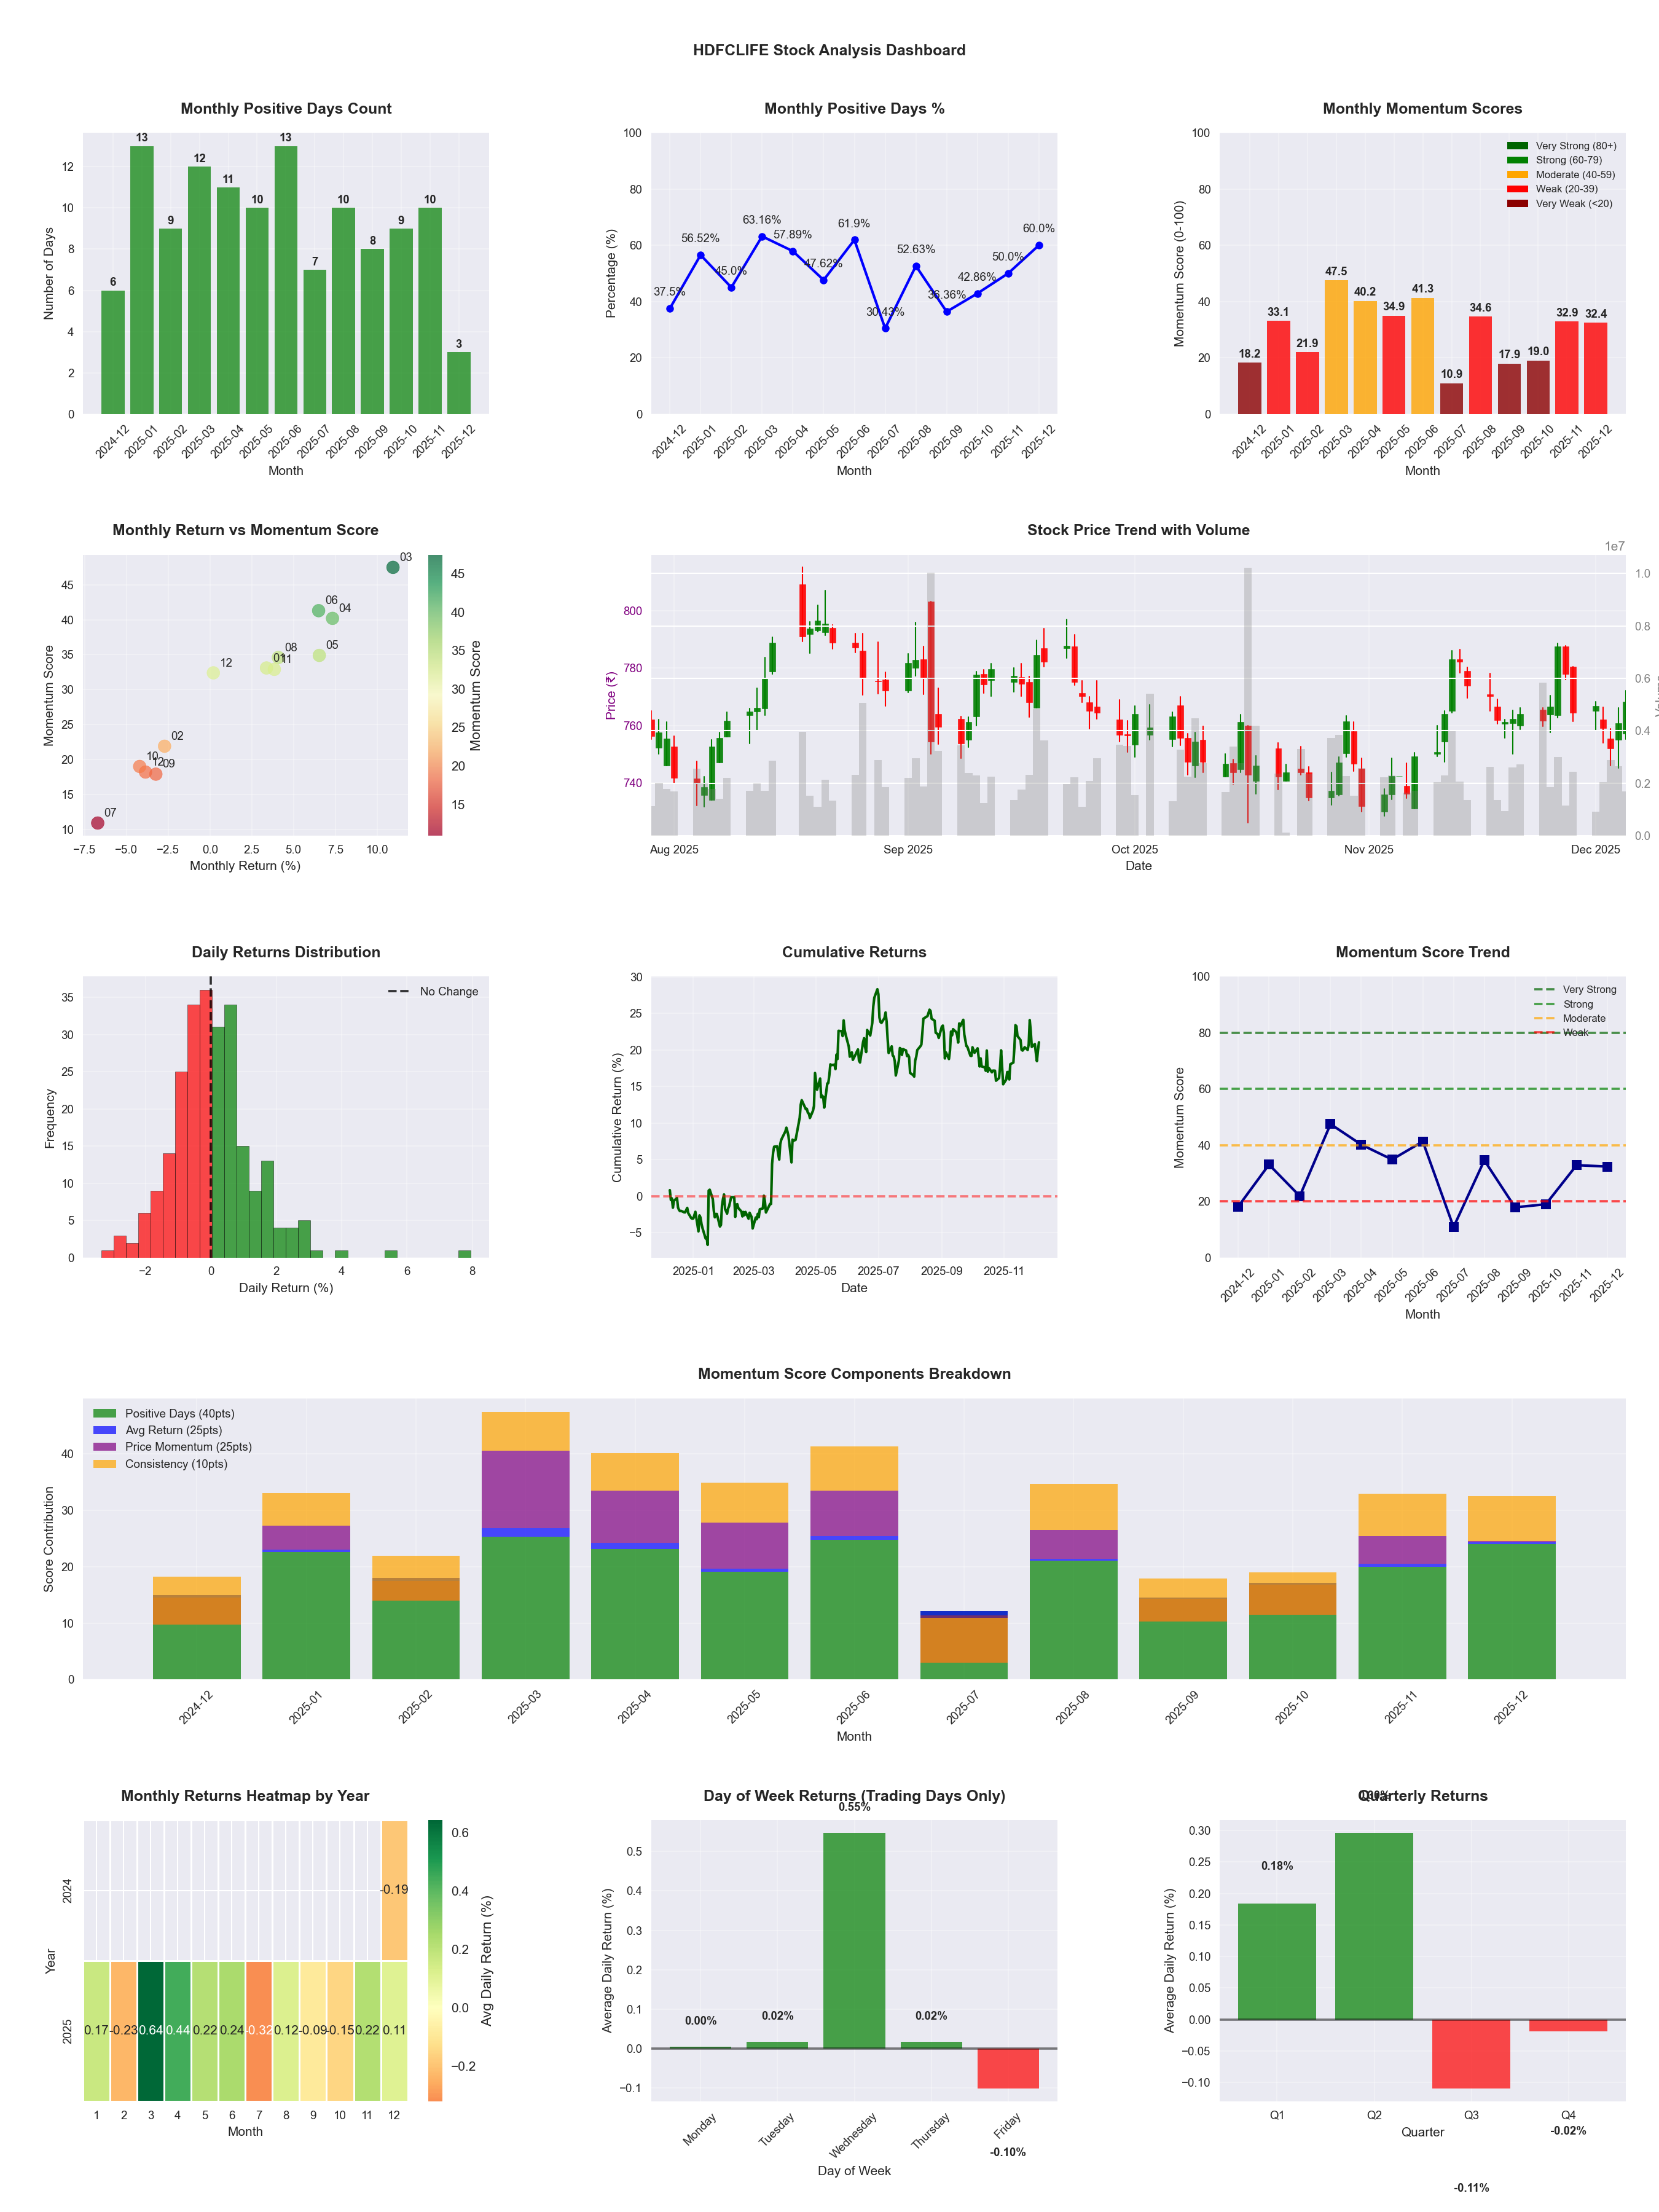
📊 Key Insights & Metrics
Symbol
📈 HDFCLIFE
Date
📅 2026-04-11
Volatility
🟢 1.31%
Win Rate
⚠️ 46.3%
Avg Daily Return
📉 -0.04%
Max Drawdown
📉 -30.48%
IBD RS Score
📊 16.6
Weak
Market Rank
#411
Best Month
🏆 2025-06
Best Months to Trade
📅 Apr, Jun, Nov
Best Days to Trade
📅 Wednesday, Tuesday
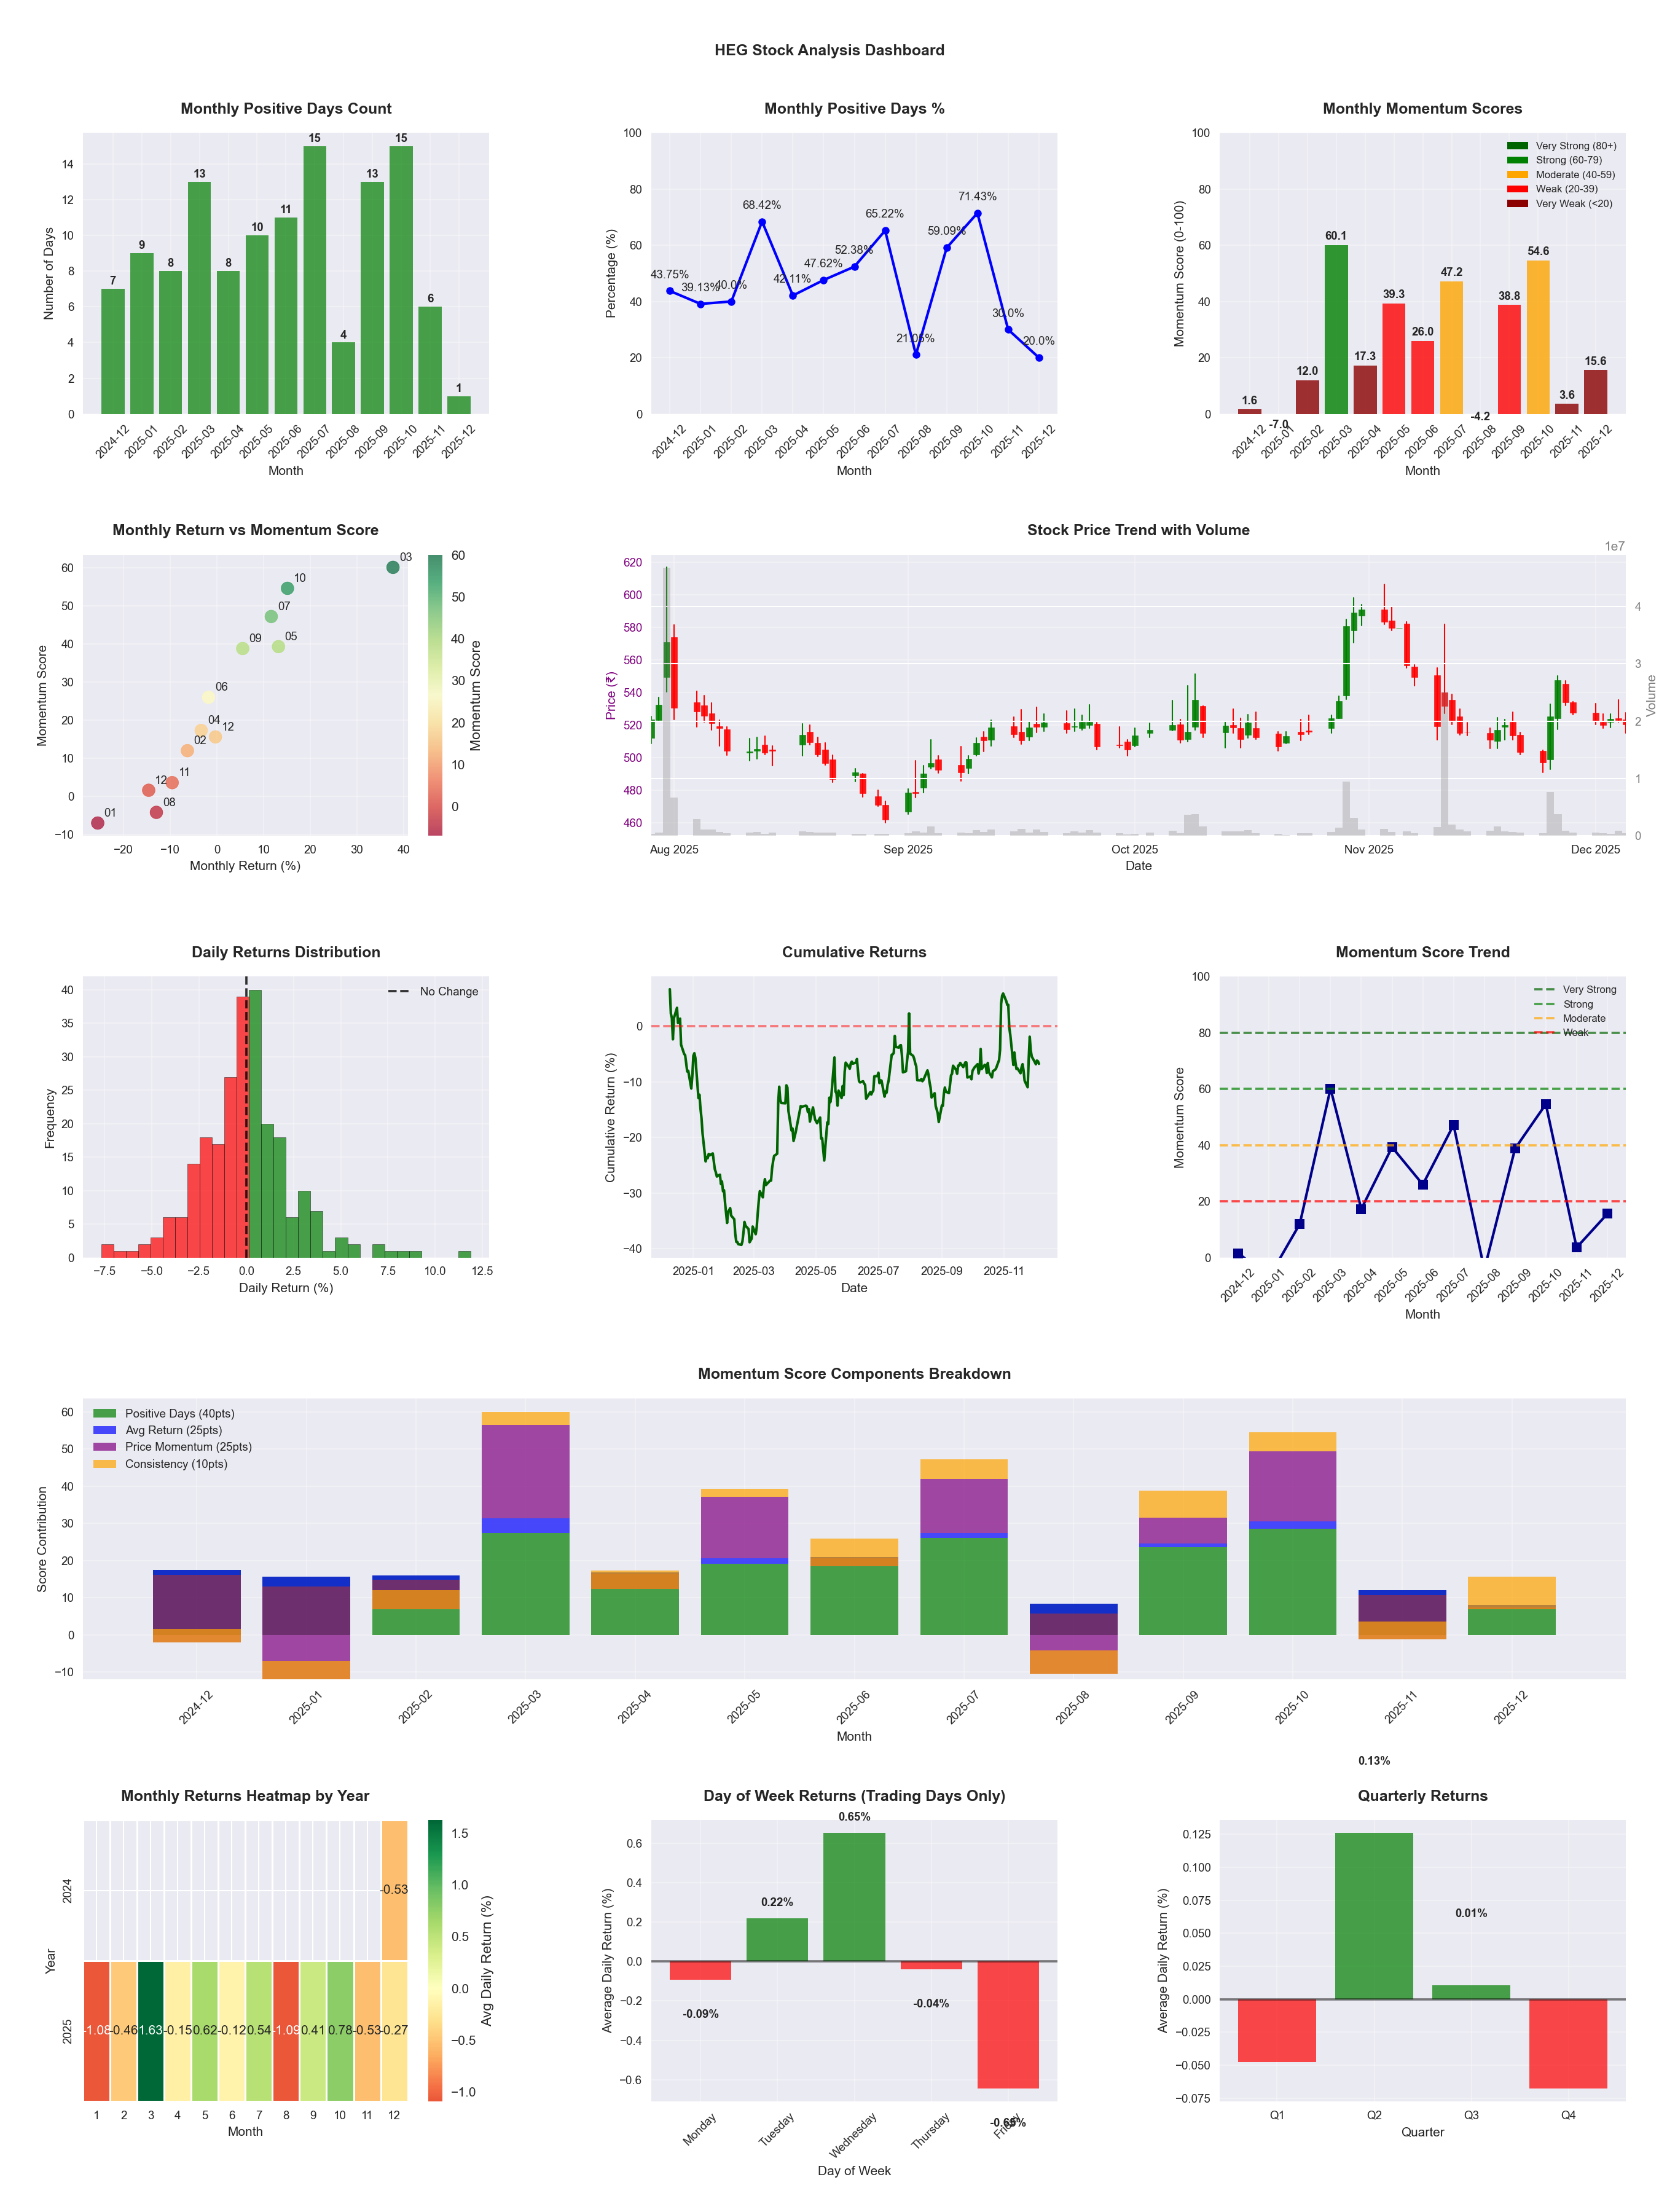
📊 Key Insights & Metrics
Symbol
📈 HEG
Date
📅 2026-04-11
Volatility
🟡 2.61%
Risk Profile
⚠️ suitable for aggressive investors
Win Rate
⚠️ 51.2%
Avg Daily Return
📈 +0.12%
Max Drawdown
📉 -25.14%
IBD RS Score
📊 72.0
Strong
Market Rank
#138
Best Month
🏆 2025-12
Best Months to Trade
📅 Dec, Oct, May
Best Days to Trade
📅 Wednesday, Tuesday
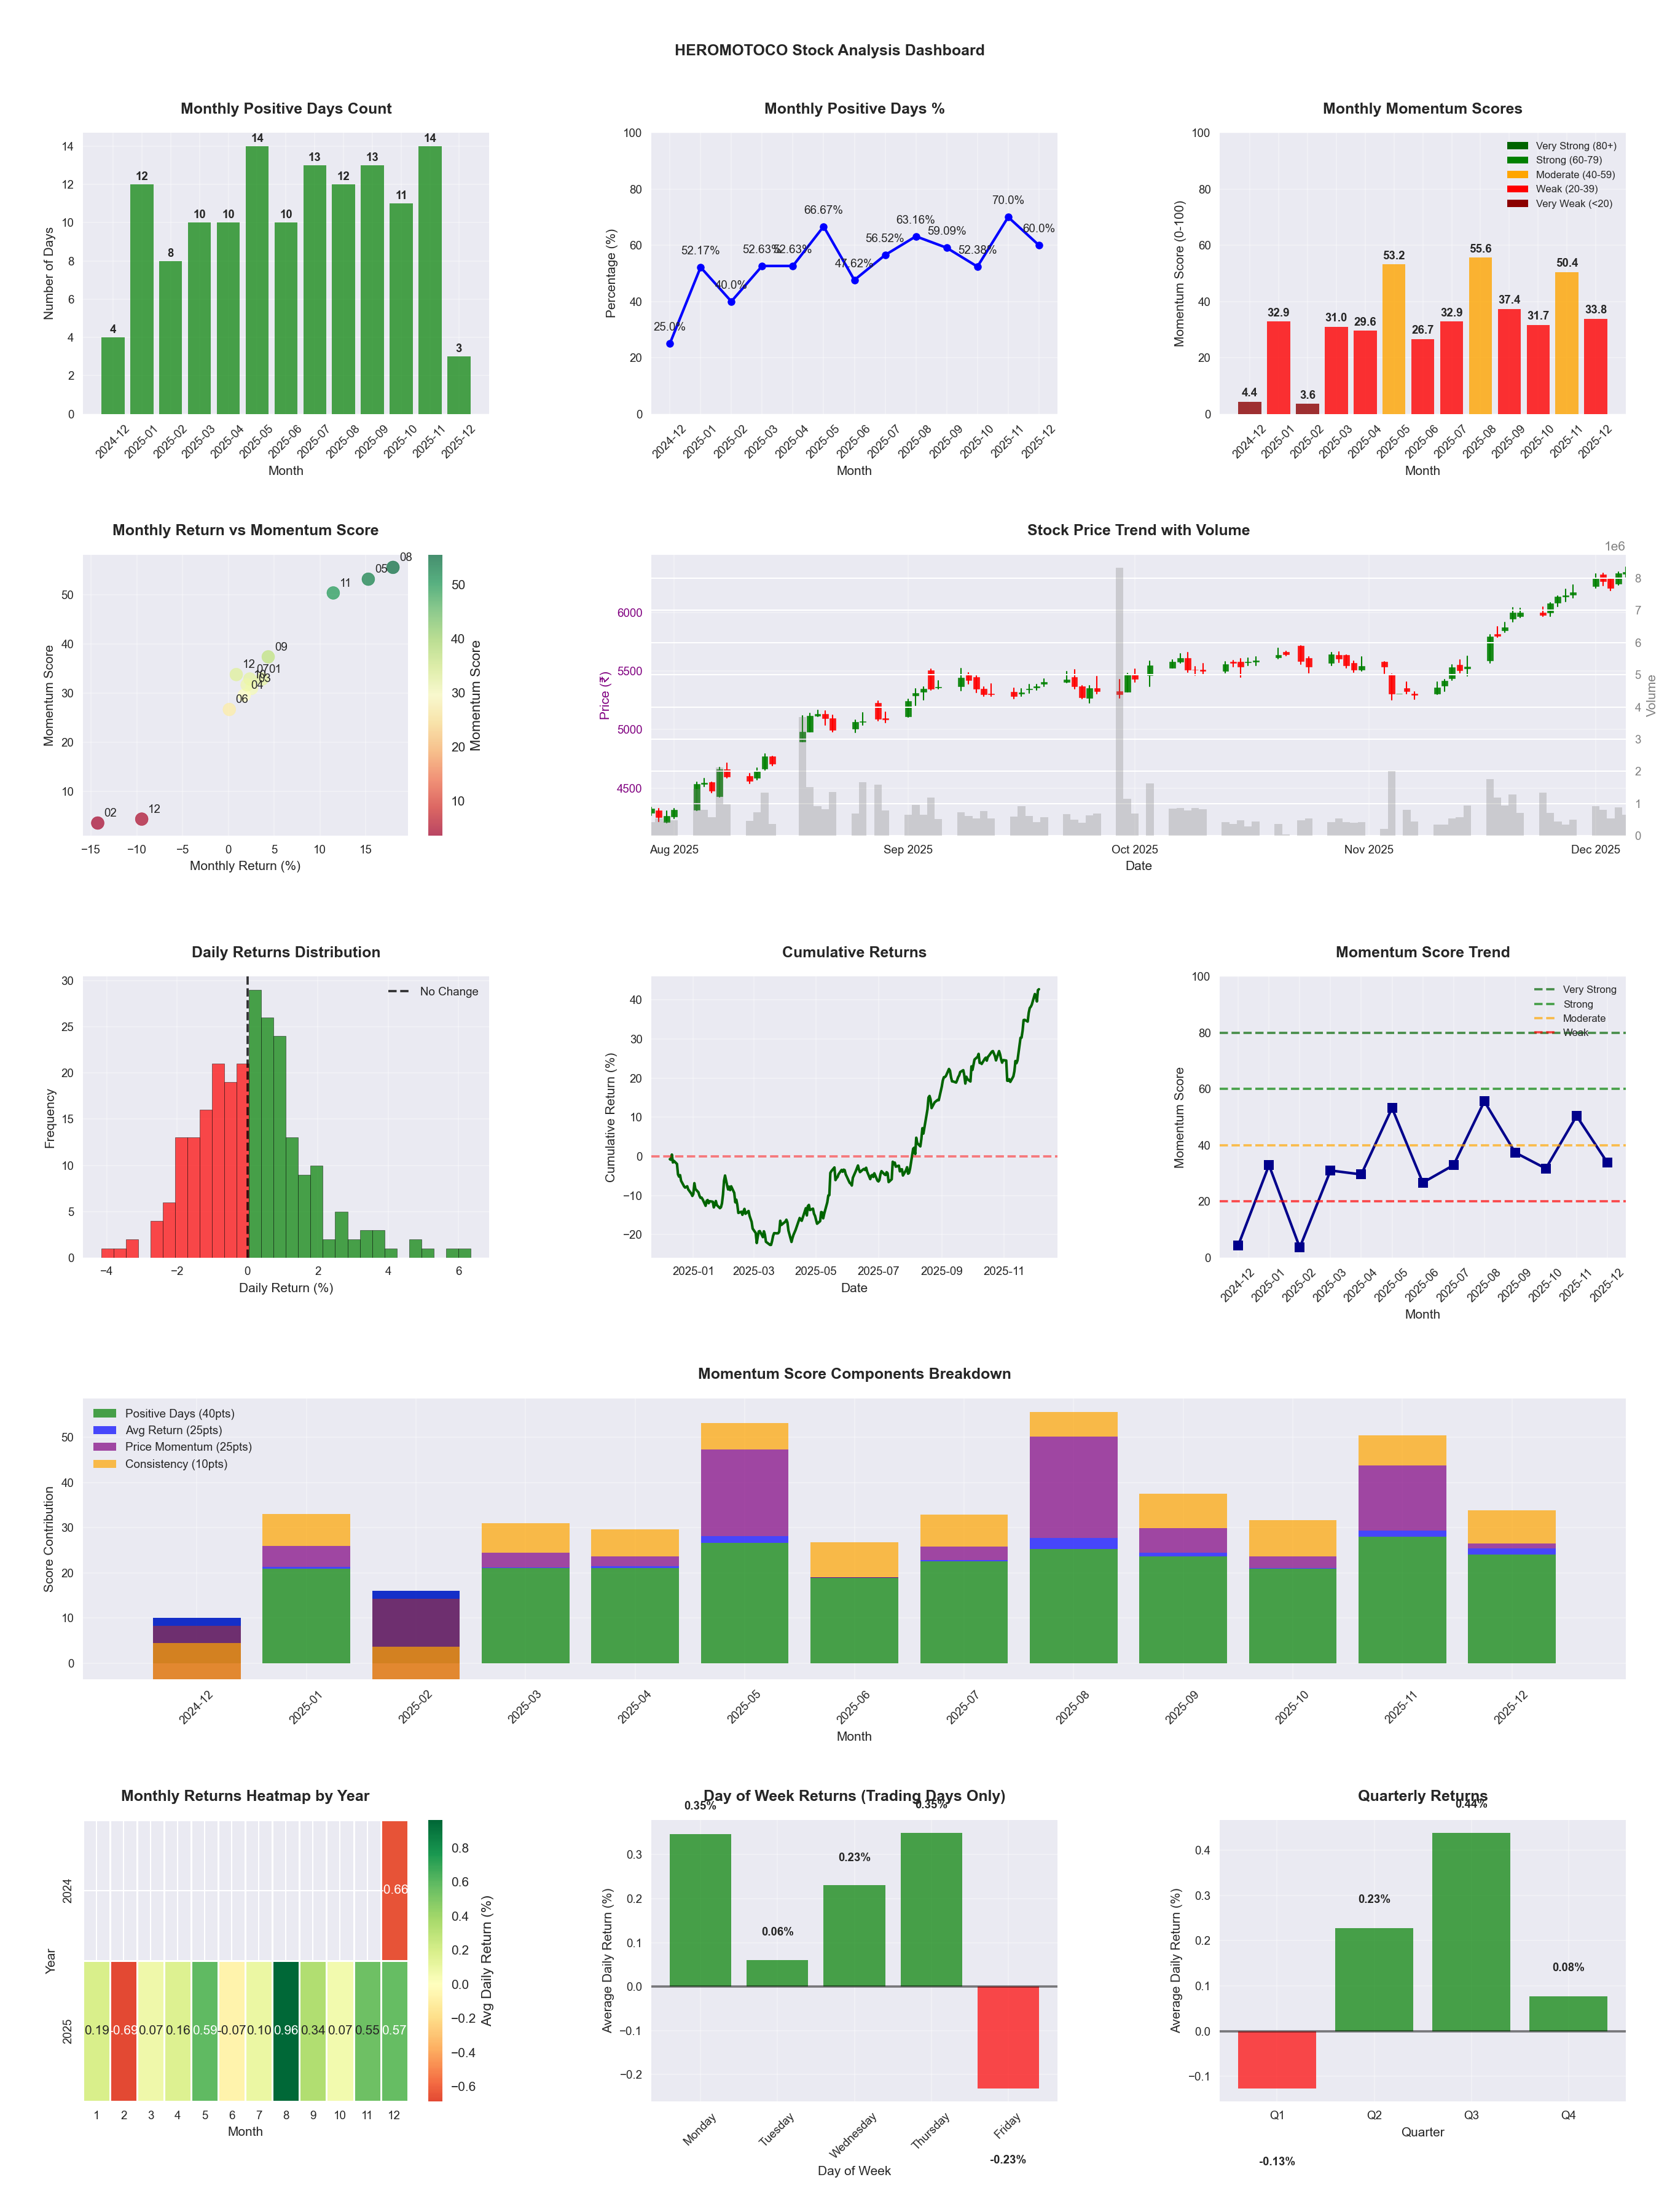
📊 Key Insights & Metrics
Symbol
📈 HEROMOTOCO
Date
📅 2026-04-11
Volatility
🟡 1.74%
Win Rate
⚠️ 54.1%
Avg Daily Return
📈 +0.19%
Max Drawdown
📉 -19.55%
IBD RS Score
📊 82.2
Strong
Market Rank
#88
Best Month
🏆 2025-08
Worst Month
📉 2026-03
Best Months to Trade
📅 Aug, Apr, May
Best Days to Trade
📅 Monday, Tuesday
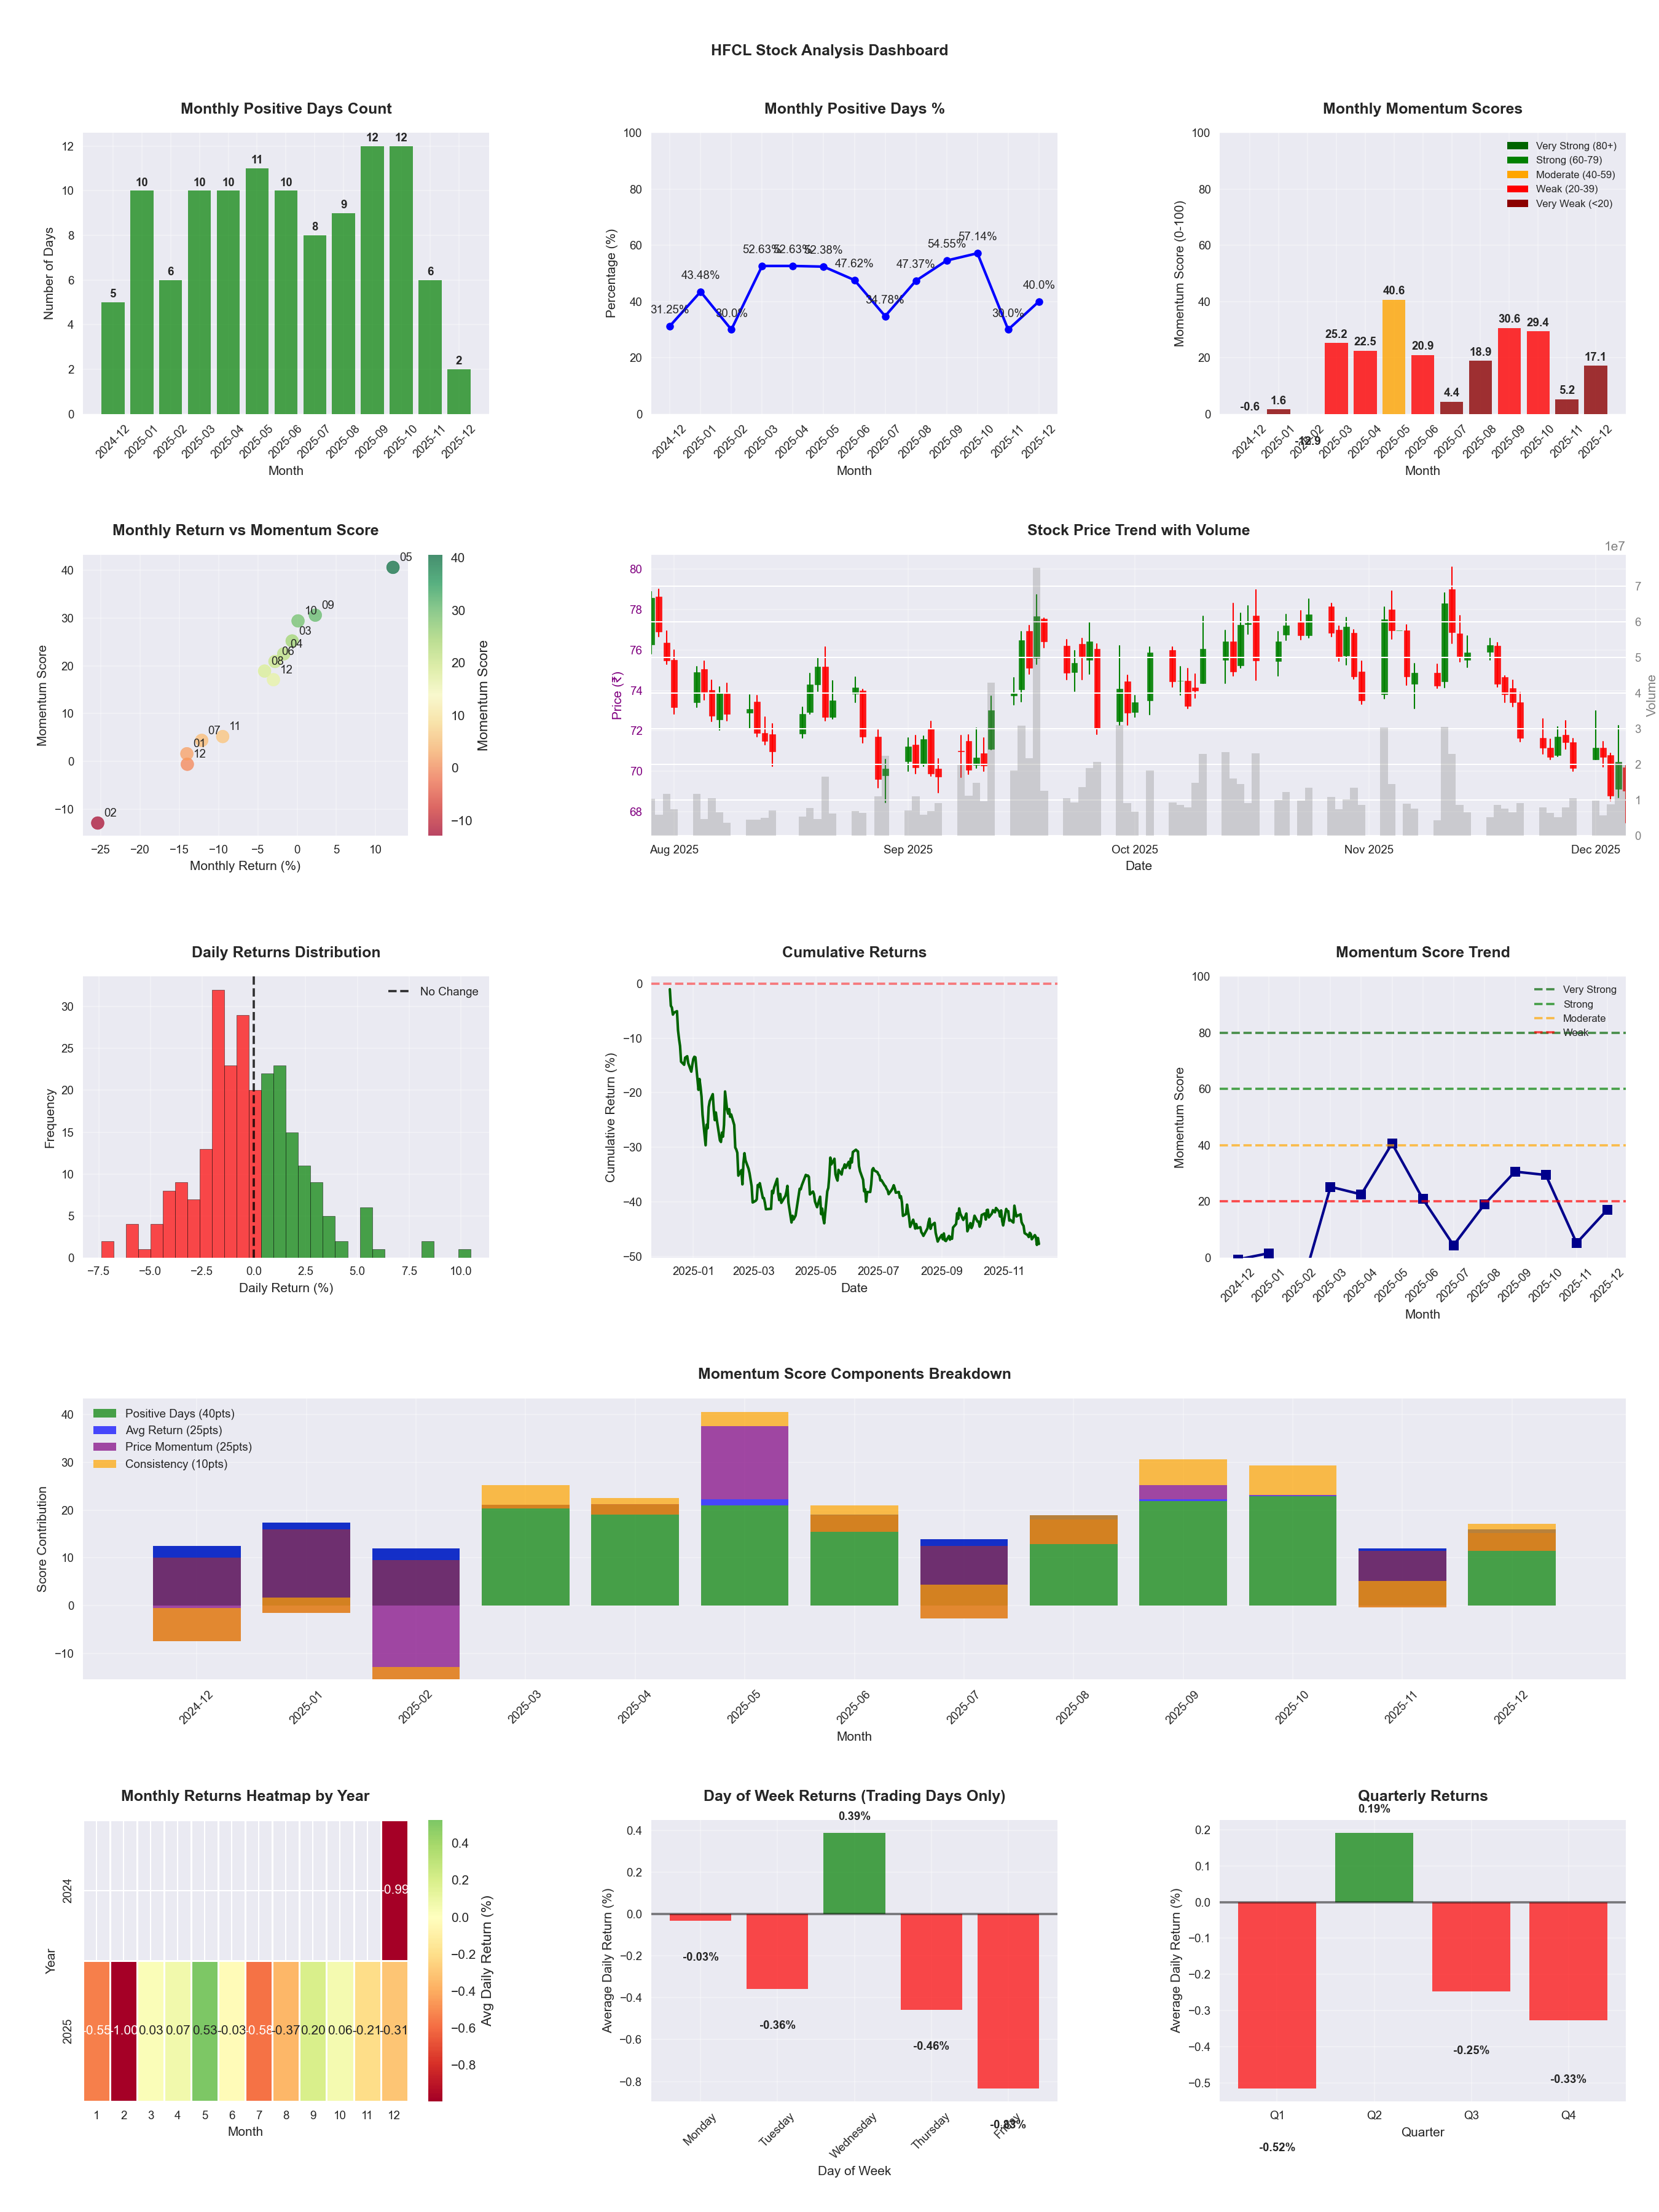
📊 Key Insights & Metrics
Symbol
📈 HFCL
Date
📅 2026-04-11
Volatility
🟡 2.56%
Risk Profile
⚠️ suitable for aggressive investors
Win Rate
⚠️ 45.5%
Avg Daily Return
📈 +0.08%
Max Drawdown
📉 -33.65%
IBD RS Score
📊 84.2
Strong
Market Rank
#78
Best Month
🏆 2026-04
Worst Month
📉 2025-07
Best Months to Trade
📅 Apr, May, Sep
Best Days to Trade
📅 Wednesday, Monday
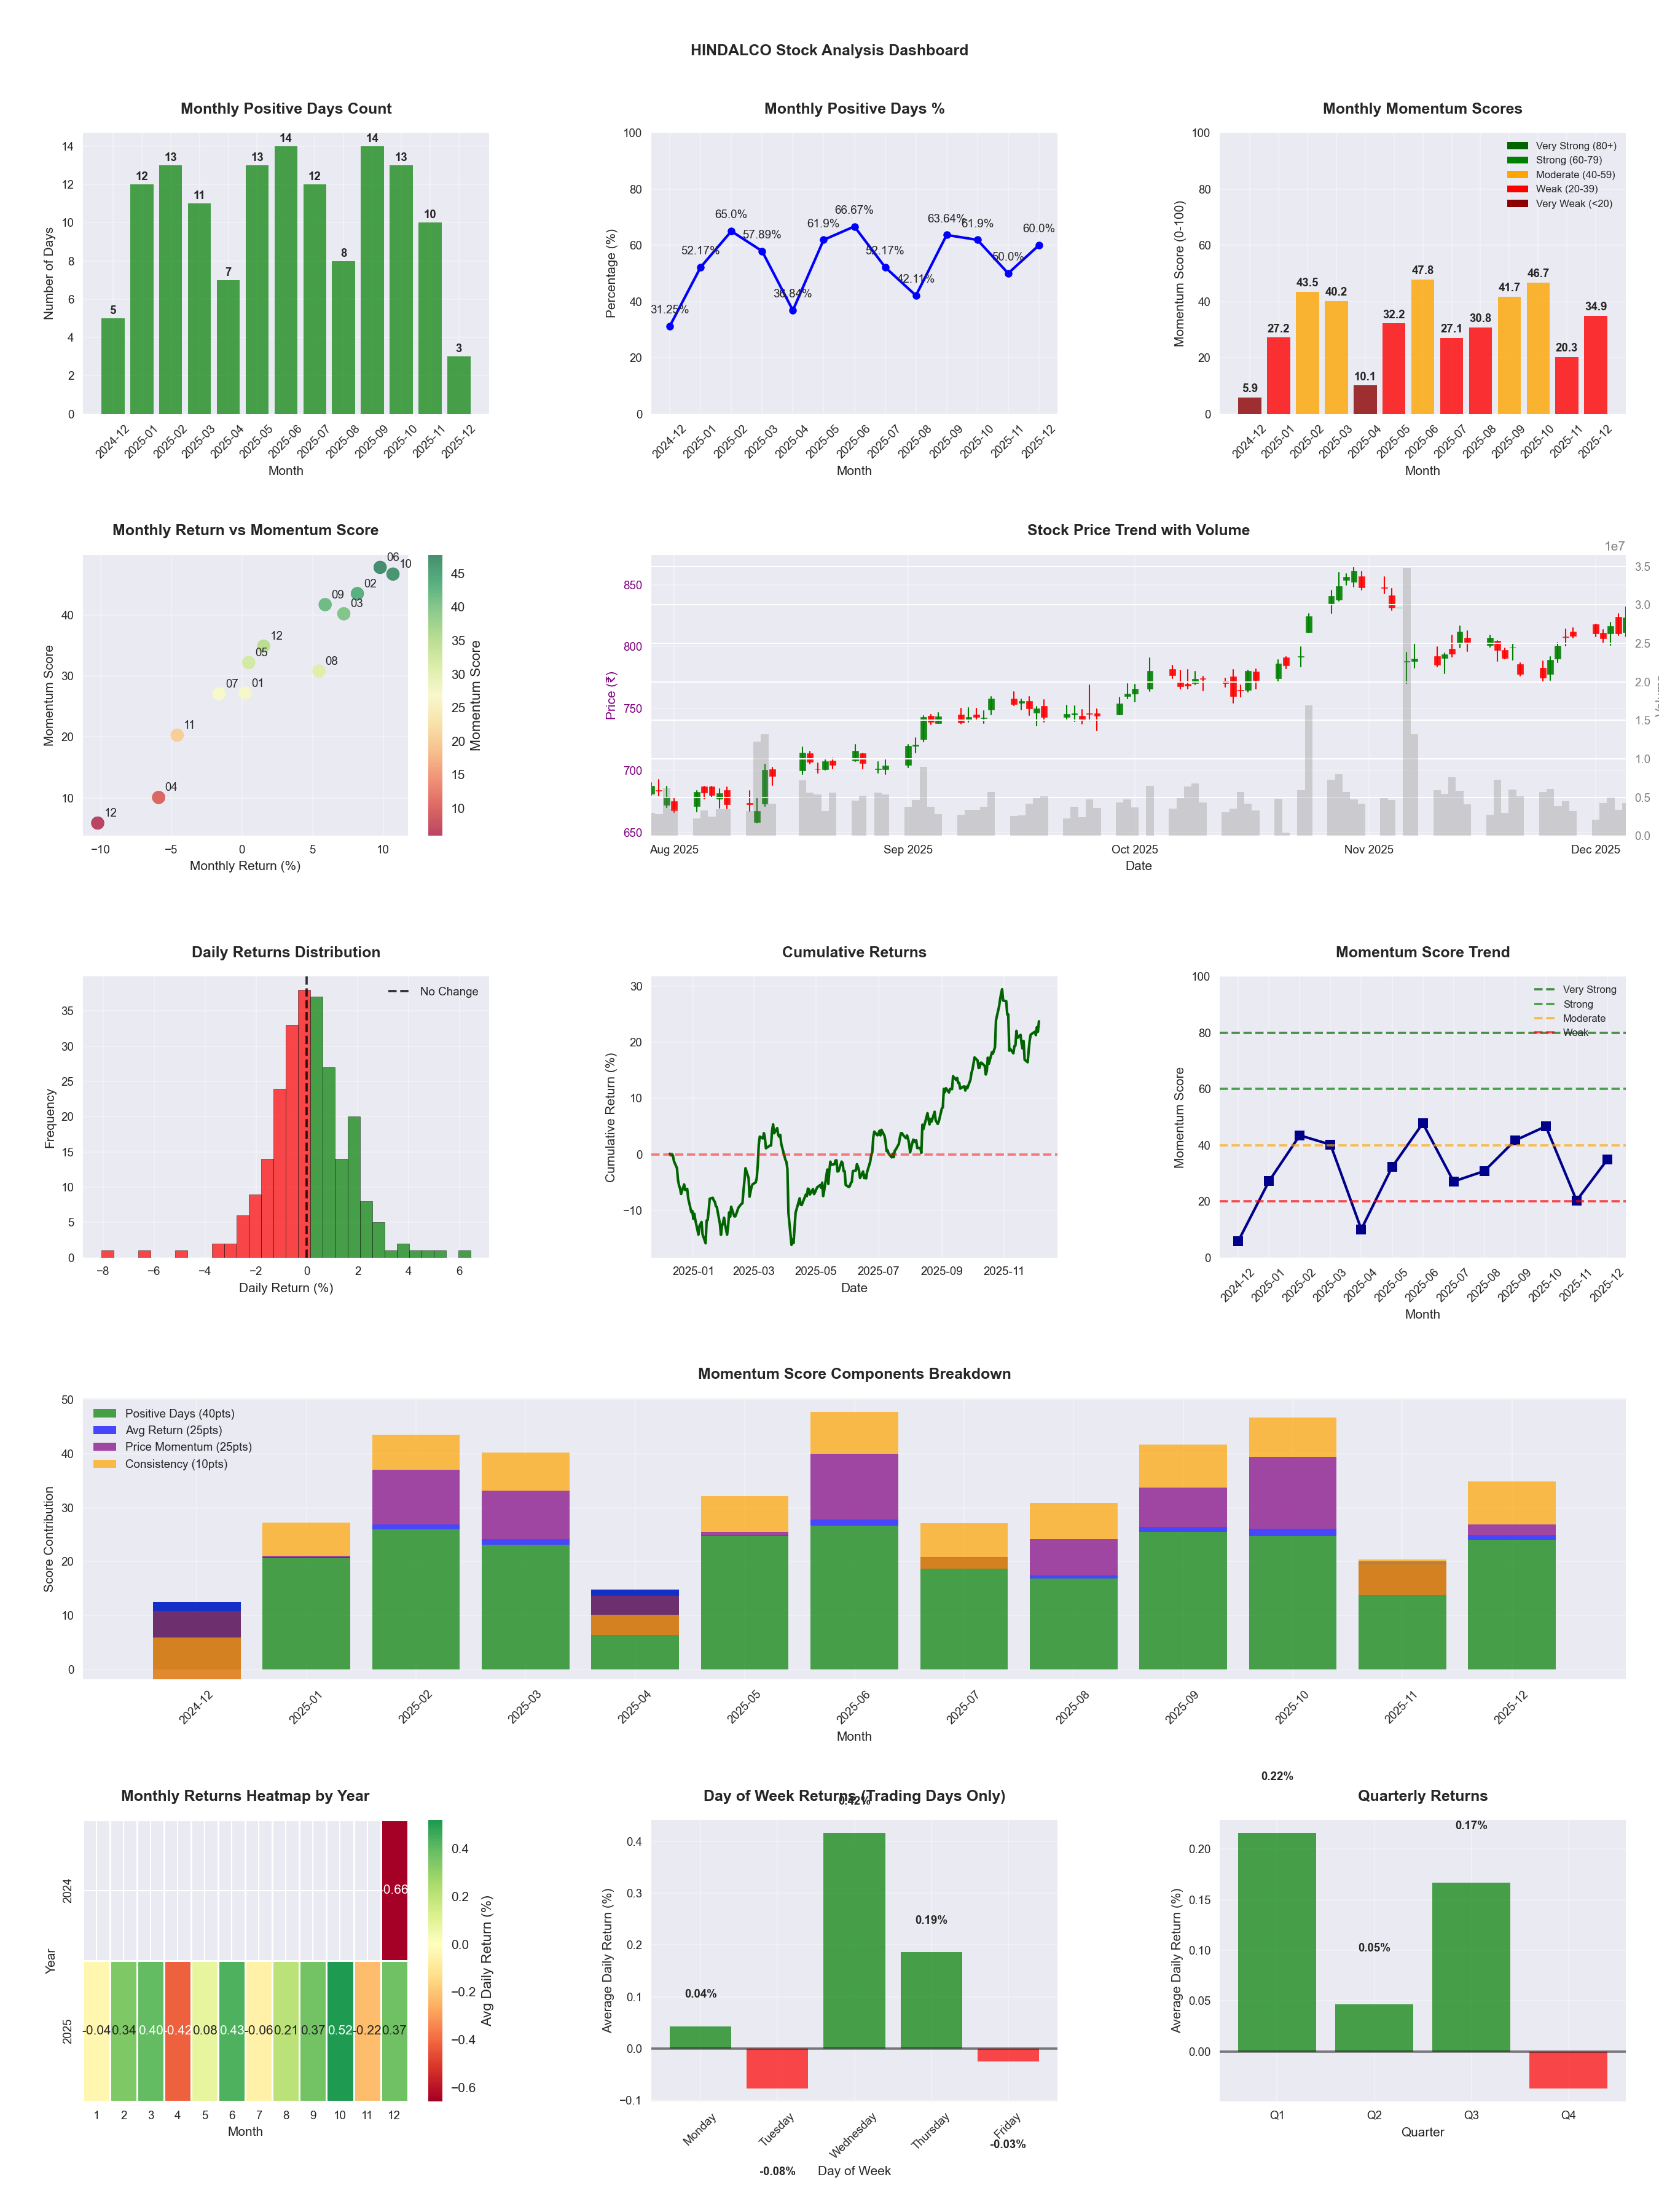
📊 Key Insights & Metrics
Symbol
📈 HINDALCO
Date
📅 2026-04-11
Volatility
🟡 1.64%
Win Rate
⚠️ 58.5%
Avg Daily Return
📈 +0.22%
Max Drawdown
📉 -17.95%
IBD RS Score
📊 95.5
Leader
Market Rank
#22
Best Month
🏆 2026-04
Worst Month
📉 2026-03
Best Months to Trade
📅 Apr, Oct, Jun
Best Days to Trade
📅 Wednesday, Monday
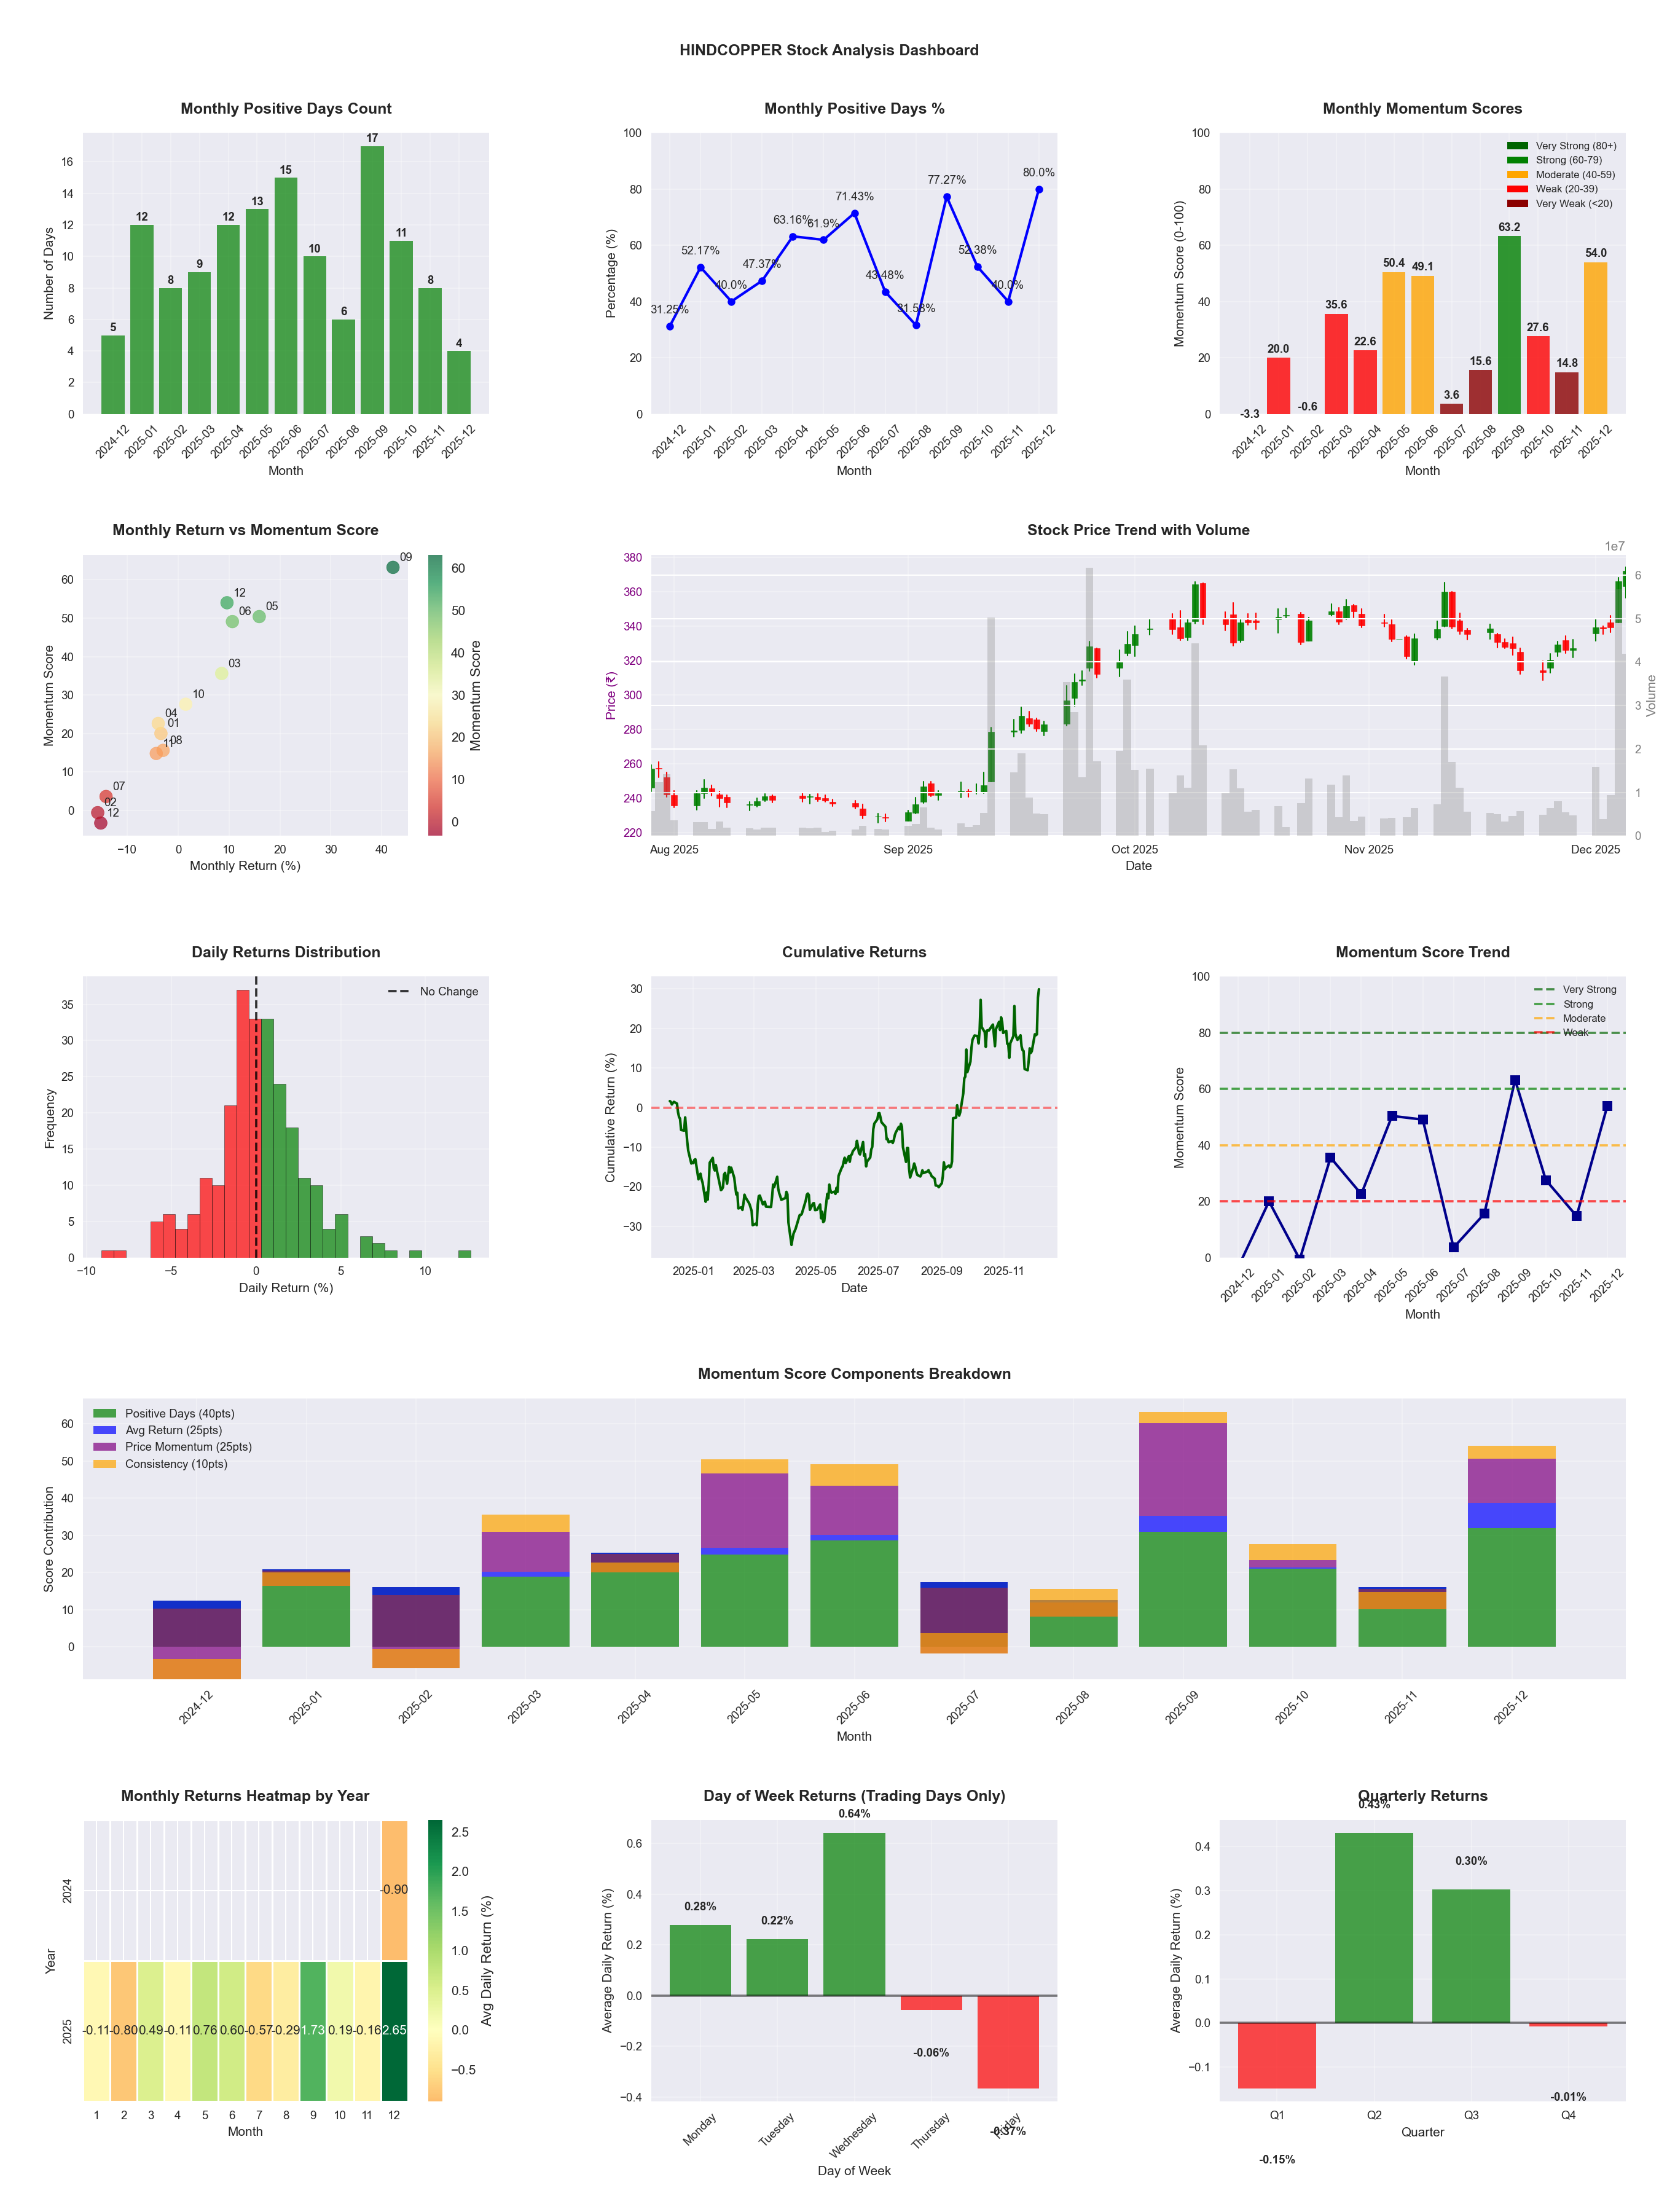
📊 Key Insights & Metrics
Symbol
📈 HINDCOPPER
Date
📅 2026-04-11
Volatility
🔴 3.55%
Risk Profile
⚠️ suitable for aggressive investors
Win Rate
⚠️ 54.5%
Avg Daily Return
📈 +0.46%
Max Drawdown
📉 -40.81%
IBD RS Score
📊 99.2
Leader
Market Rank
#4
Best Month
🏆 2025-09
Best Months to Trade
📅 Dec, Sep, Jan
Best Days to Trade
📅 Wednesday, Tuesday
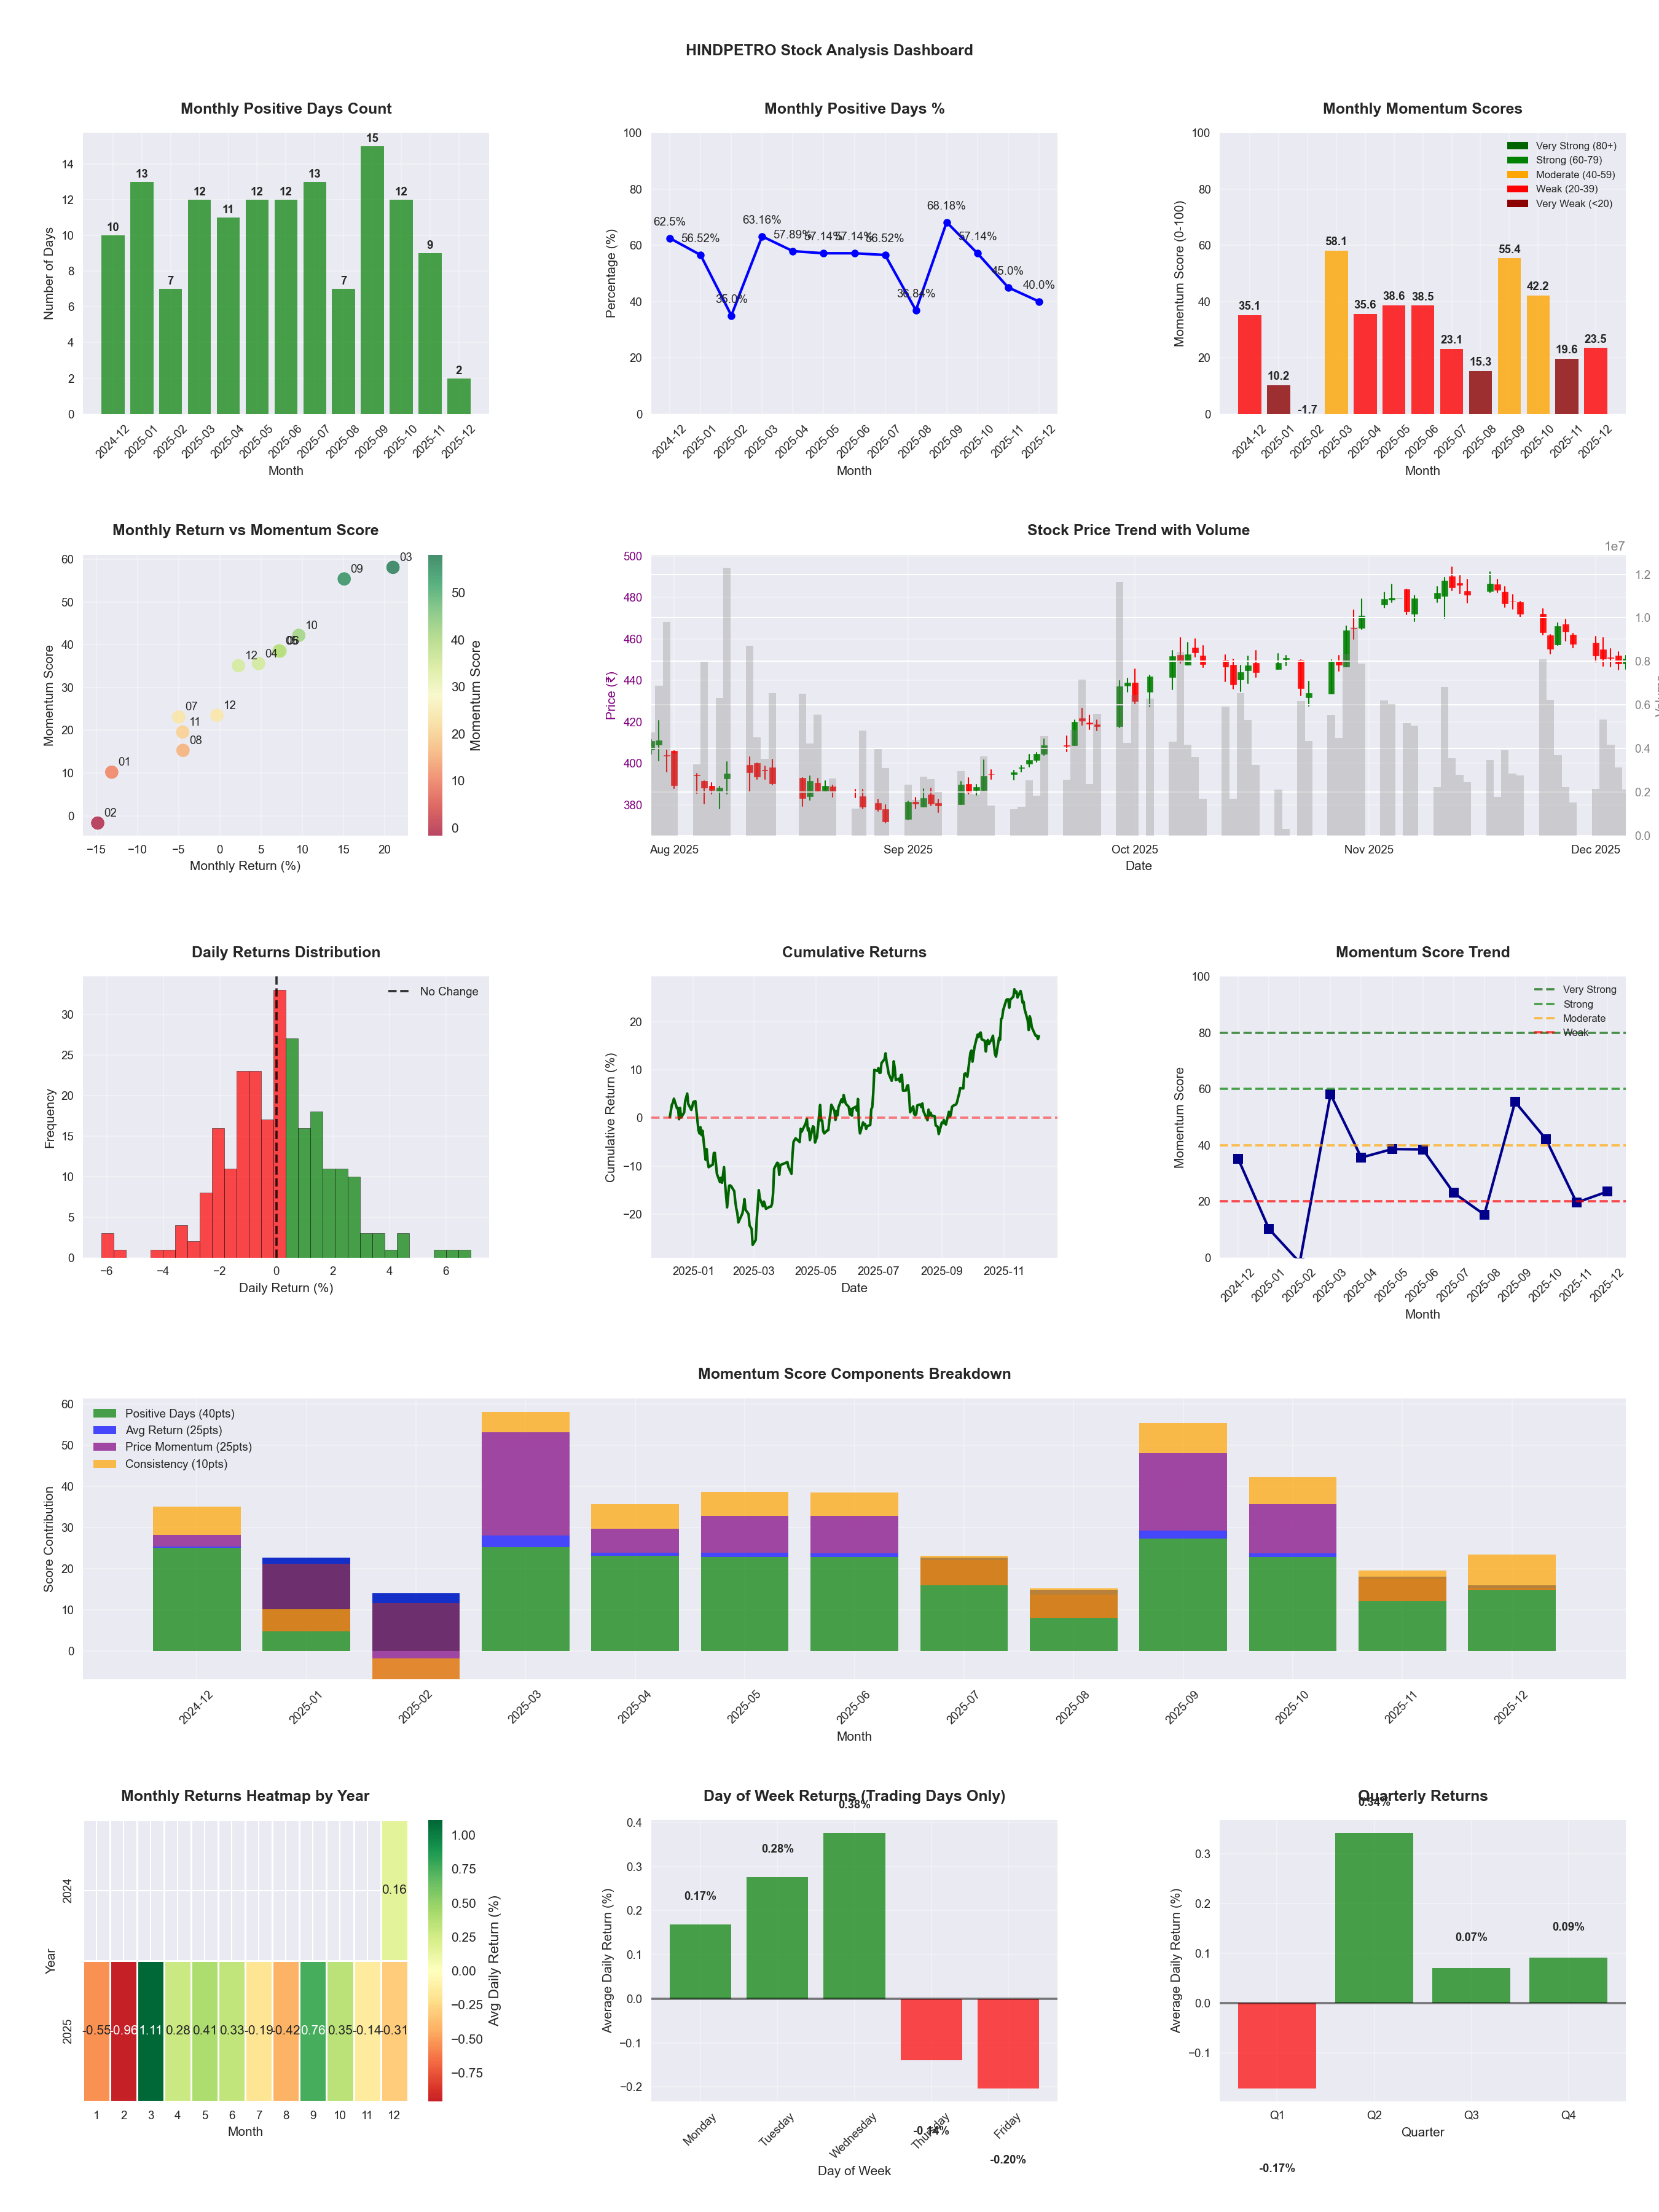
📊 Key Insights & Metrics
Symbol
📈 HINDPETRO
Date
📅 2026-04-11
Volatility
🟡 2.09%
Risk Profile
⚠️ suitable for aggressive investors
Win Rate
⚠️ 50.0%
Avg Daily Return
📈 +0.01%
Max Drawdown
📉 -36.05%
IBD RS Score
📊 25.4
Weak
Market Rank
#368
Best Month
🏆 2025-09
Best Months to Trade
📅 Sep, May, Dec
Best Days to Trade
📅 Wednesday, Monday
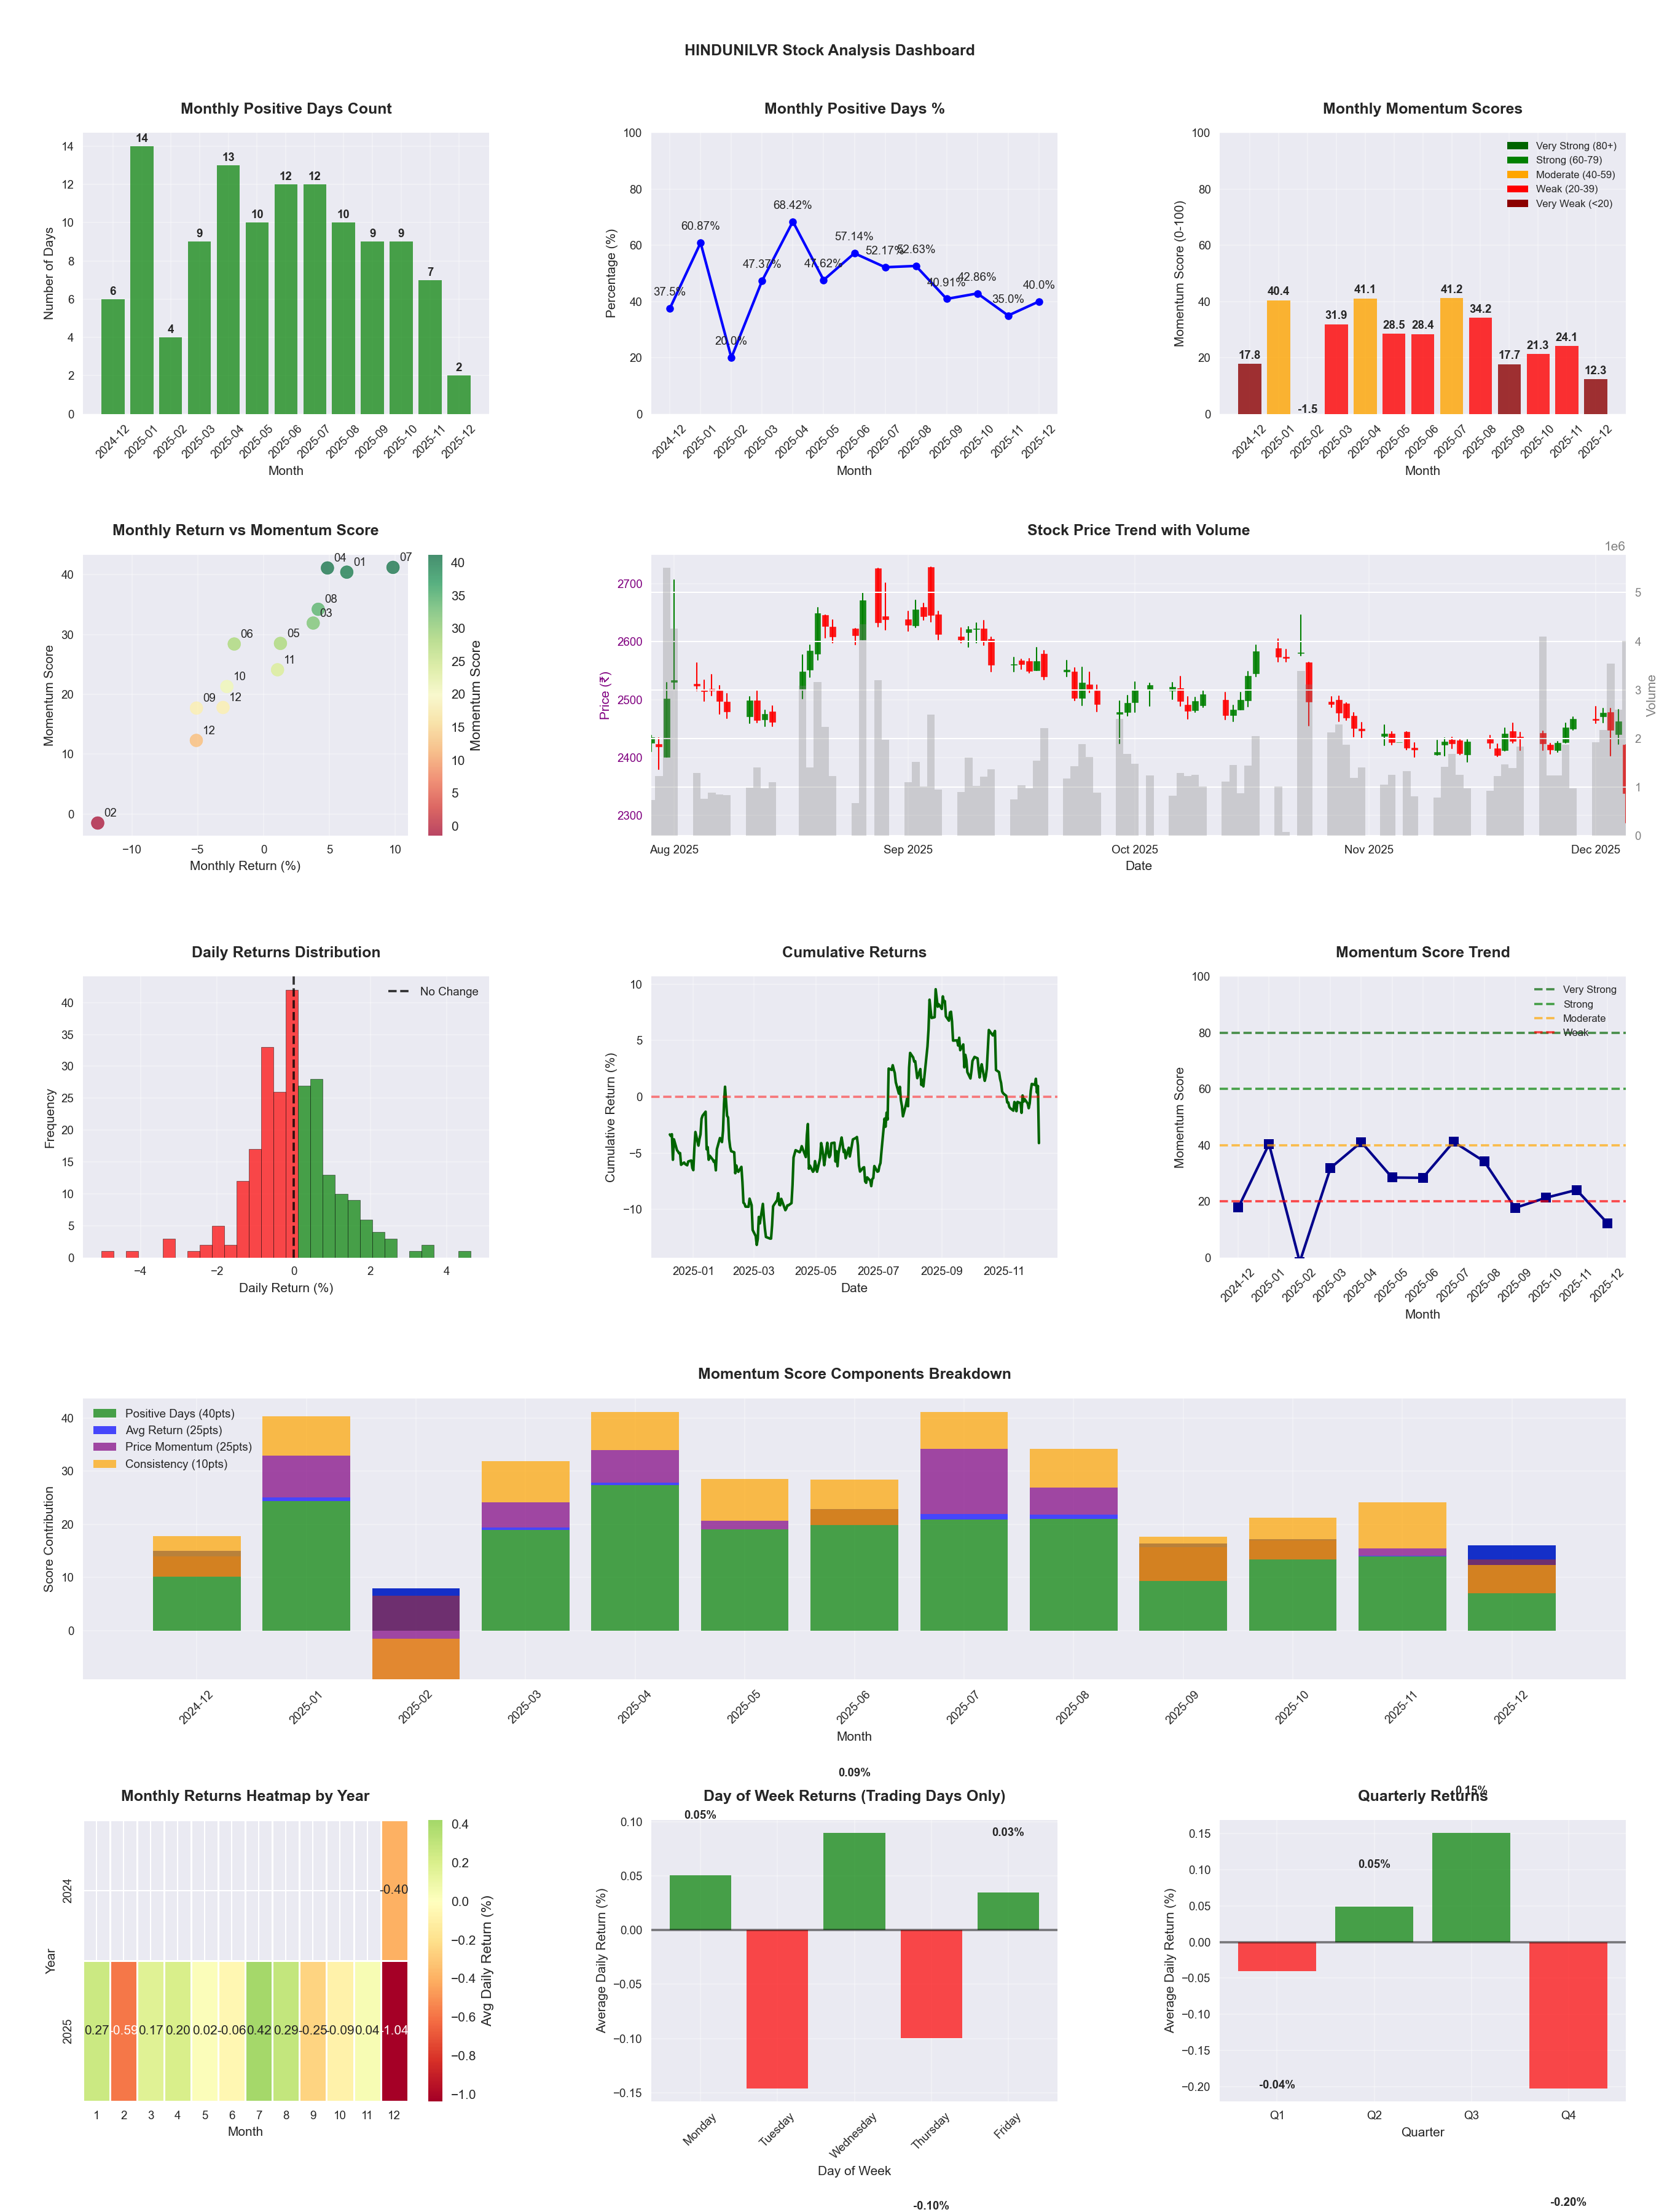
📊 Key Insights & Metrics
Symbol
📈 HINDUNILVR
Date
📅 2026-04-11
Volatility
🟢 1.21%
Win Rate
⚠️ 48.8%
Avg Daily Return
📉 -0.02%
Max Drawdown
📉 -23.18%
IBD RS Score
📊 36.1
Weak
Market Rank
#315
Best Month
🏆 2026-04
Worst Month
📉 2026-03
Best Months to Trade
📅 Jul, Aug, Apr
Best Days to Trade
📅 Monday, Tuesday
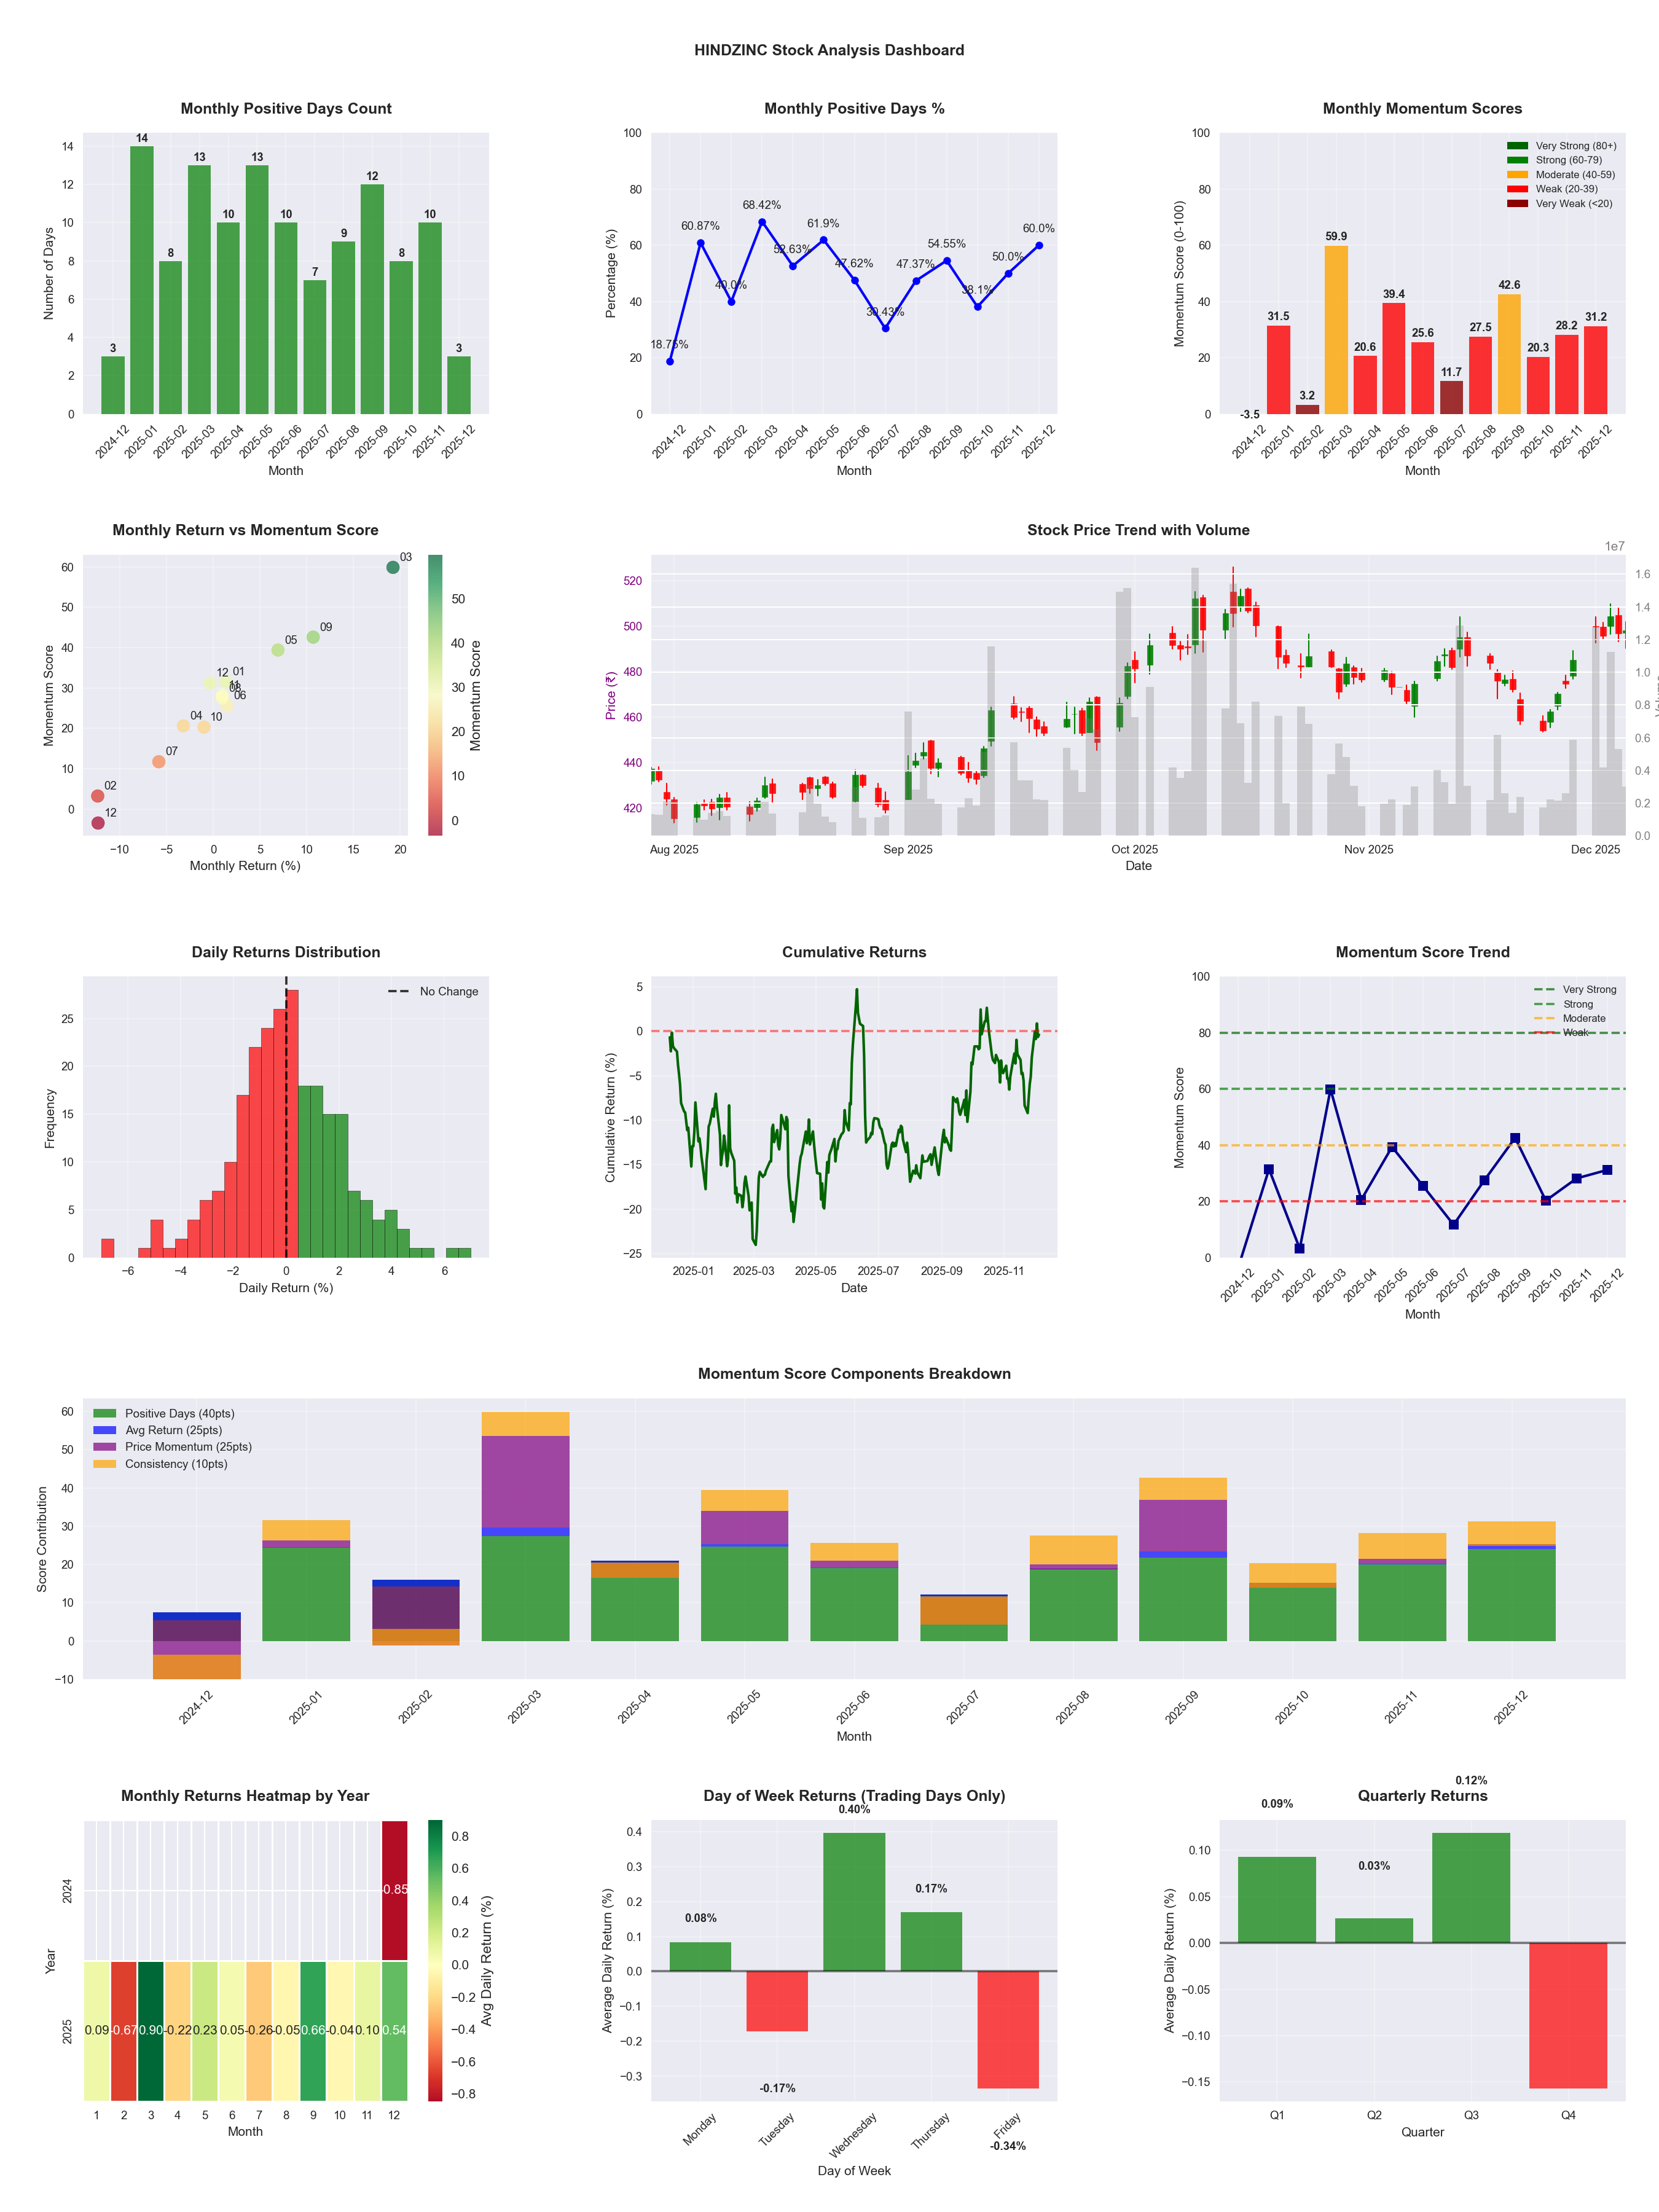
📊 Key Insights & Metrics
Symbol
📈 HINDZINC
Date
📅 2026-04-11
Volatility
🟡 2.39%
Risk Profile
⚠️ suitable for aggressive investors
Win Rate
⚠️ 50.8%
Avg Daily Return
📈 +0.17%
Max Drawdown
📉 -32.94%
IBD RS Score
📊 79.1
Strong
Market Rank
#103
Best Month
🏆 2025-12
Best Months to Trade
📅 Dec, Apr, Sep
Best Days to Trade
📅 Monday, Wednesday
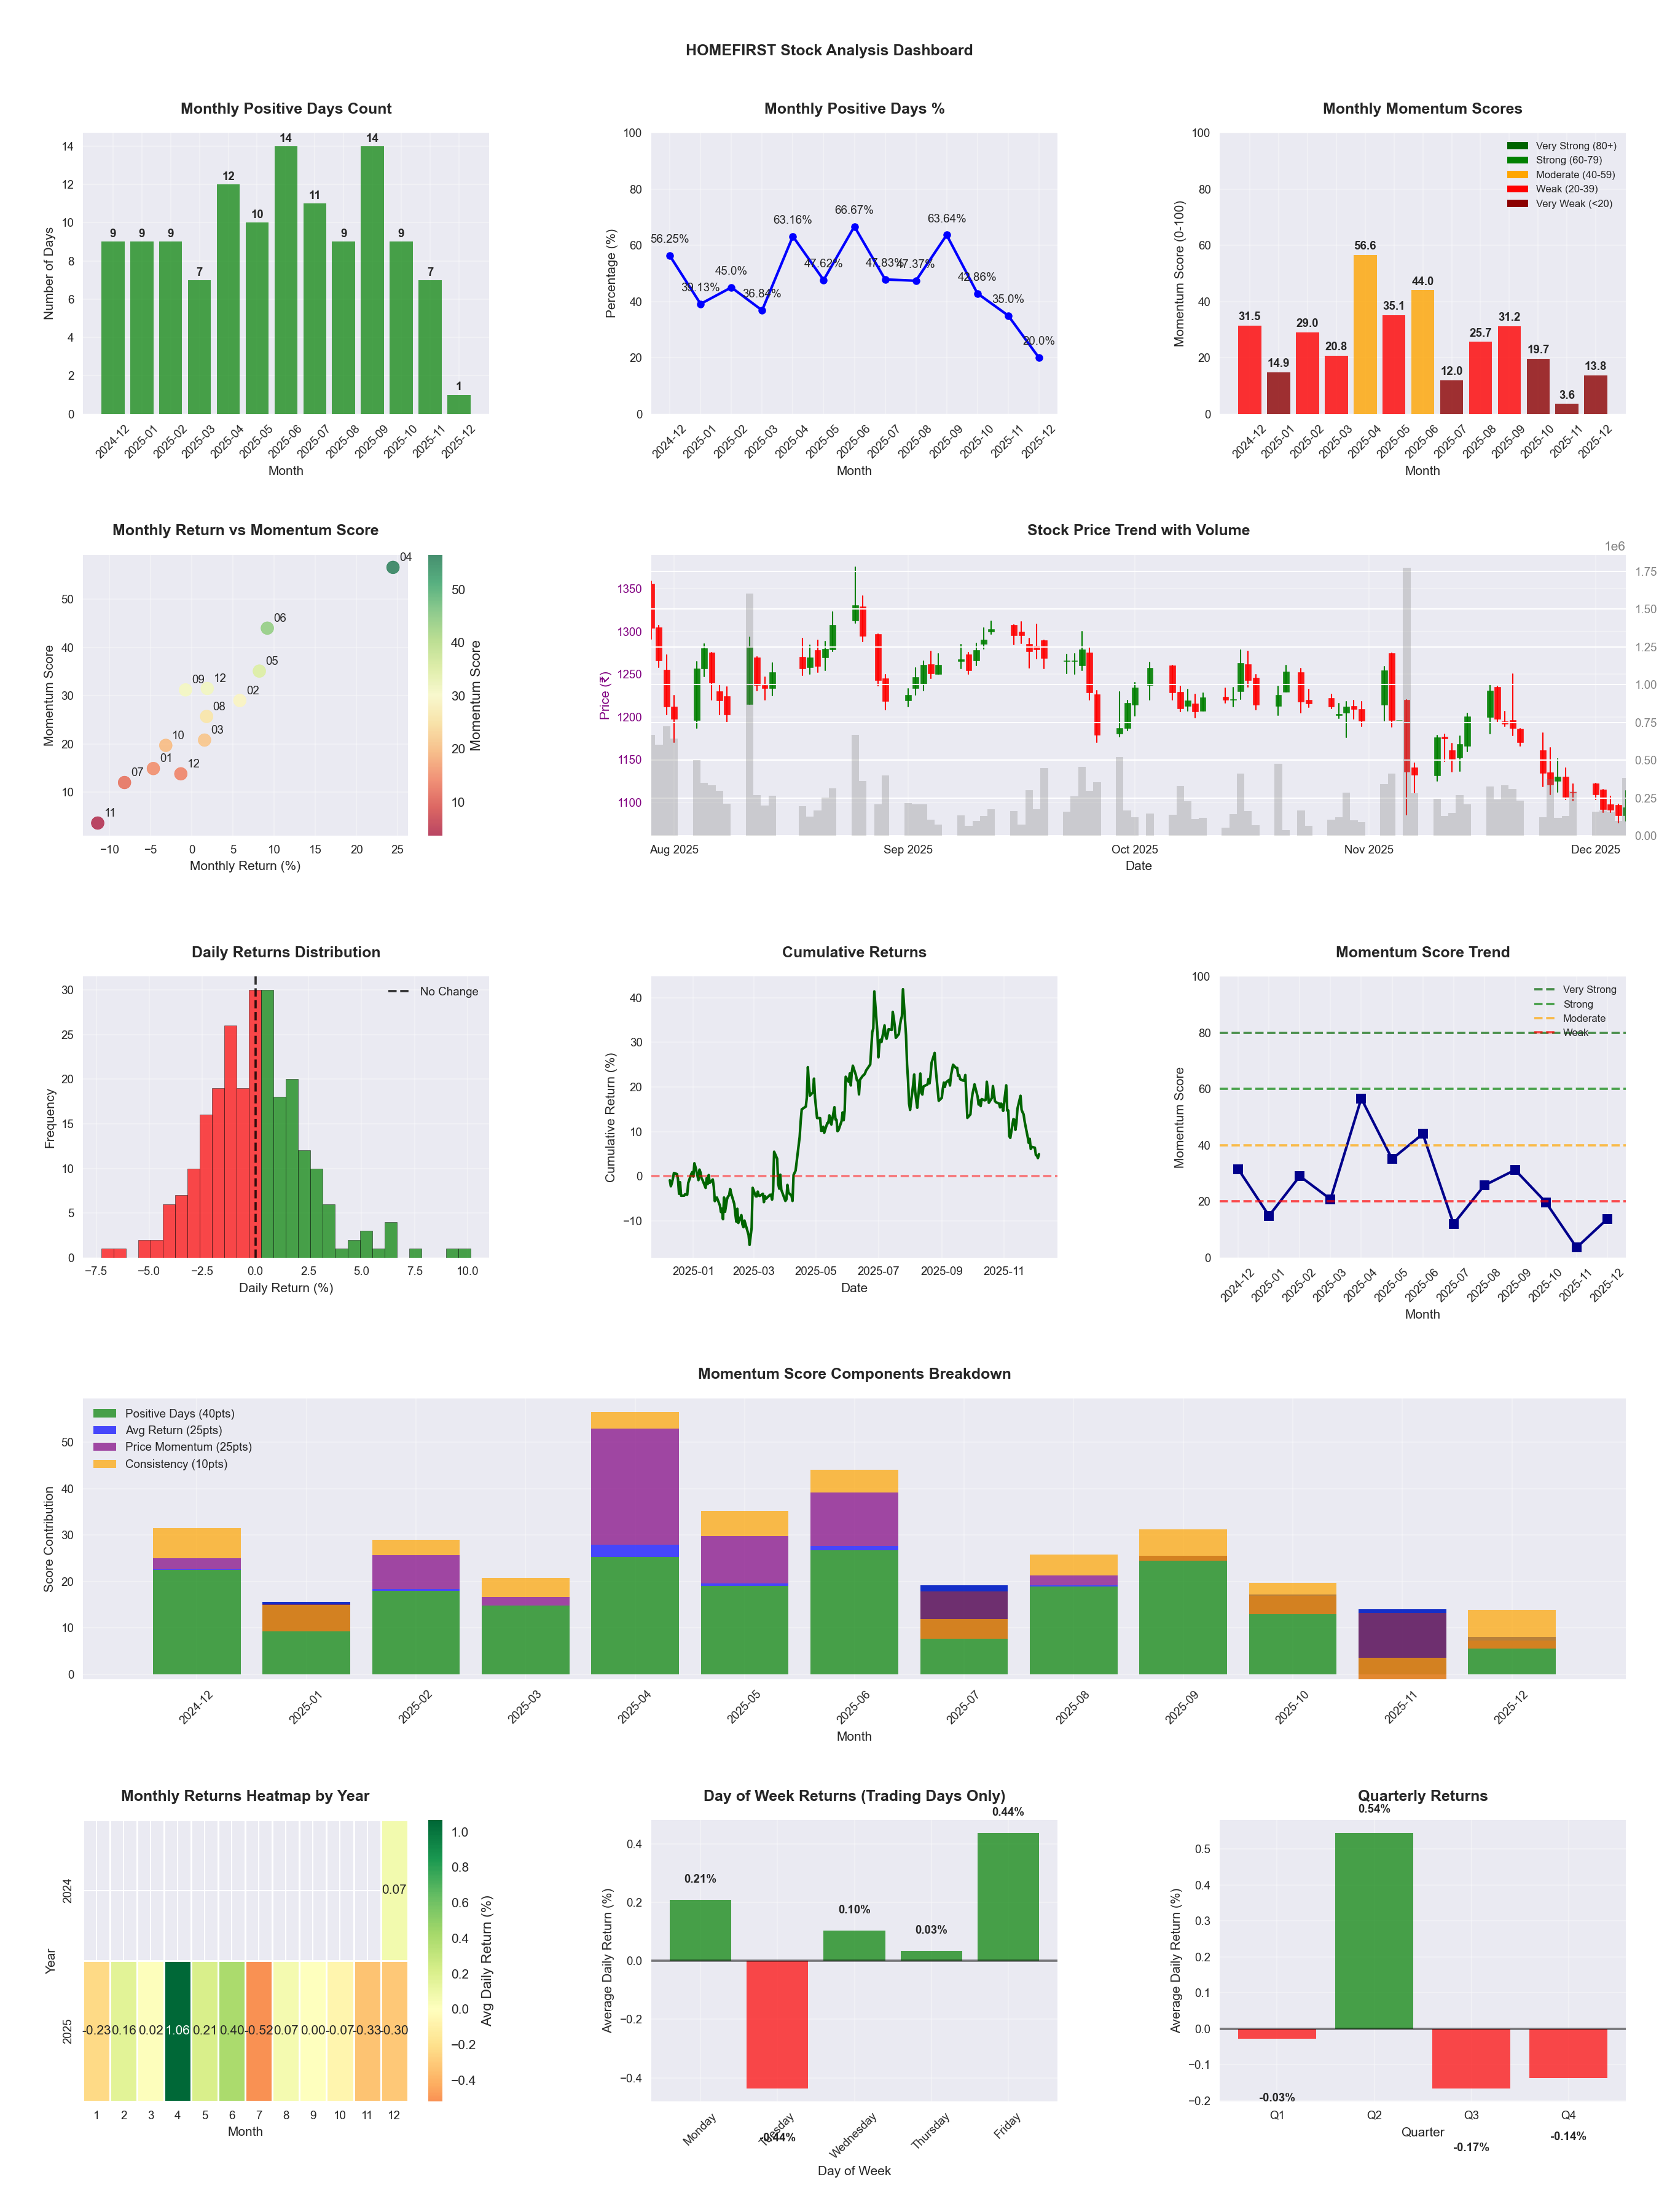
📊 Key Insights & Metrics
Symbol
📈 HOMEFIRST
Date
📅 2026-04-11
Volatility
🟡 2.58%
Risk Profile
⚠️ suitable for aggressive investors
Win Rate
⚠️ 48.8%
Avg Daily Return
📈 +0.05%
Max Drawdown
📉 -38.82%
IBD RS Score
📊 47.7
Weak
Market Rank
#258
Best Month
🏆 2026-04
Best Months to Trade
📅 Apr, Jun, Jan
Best Days to Trade
📅 Tuesday, Wednesday
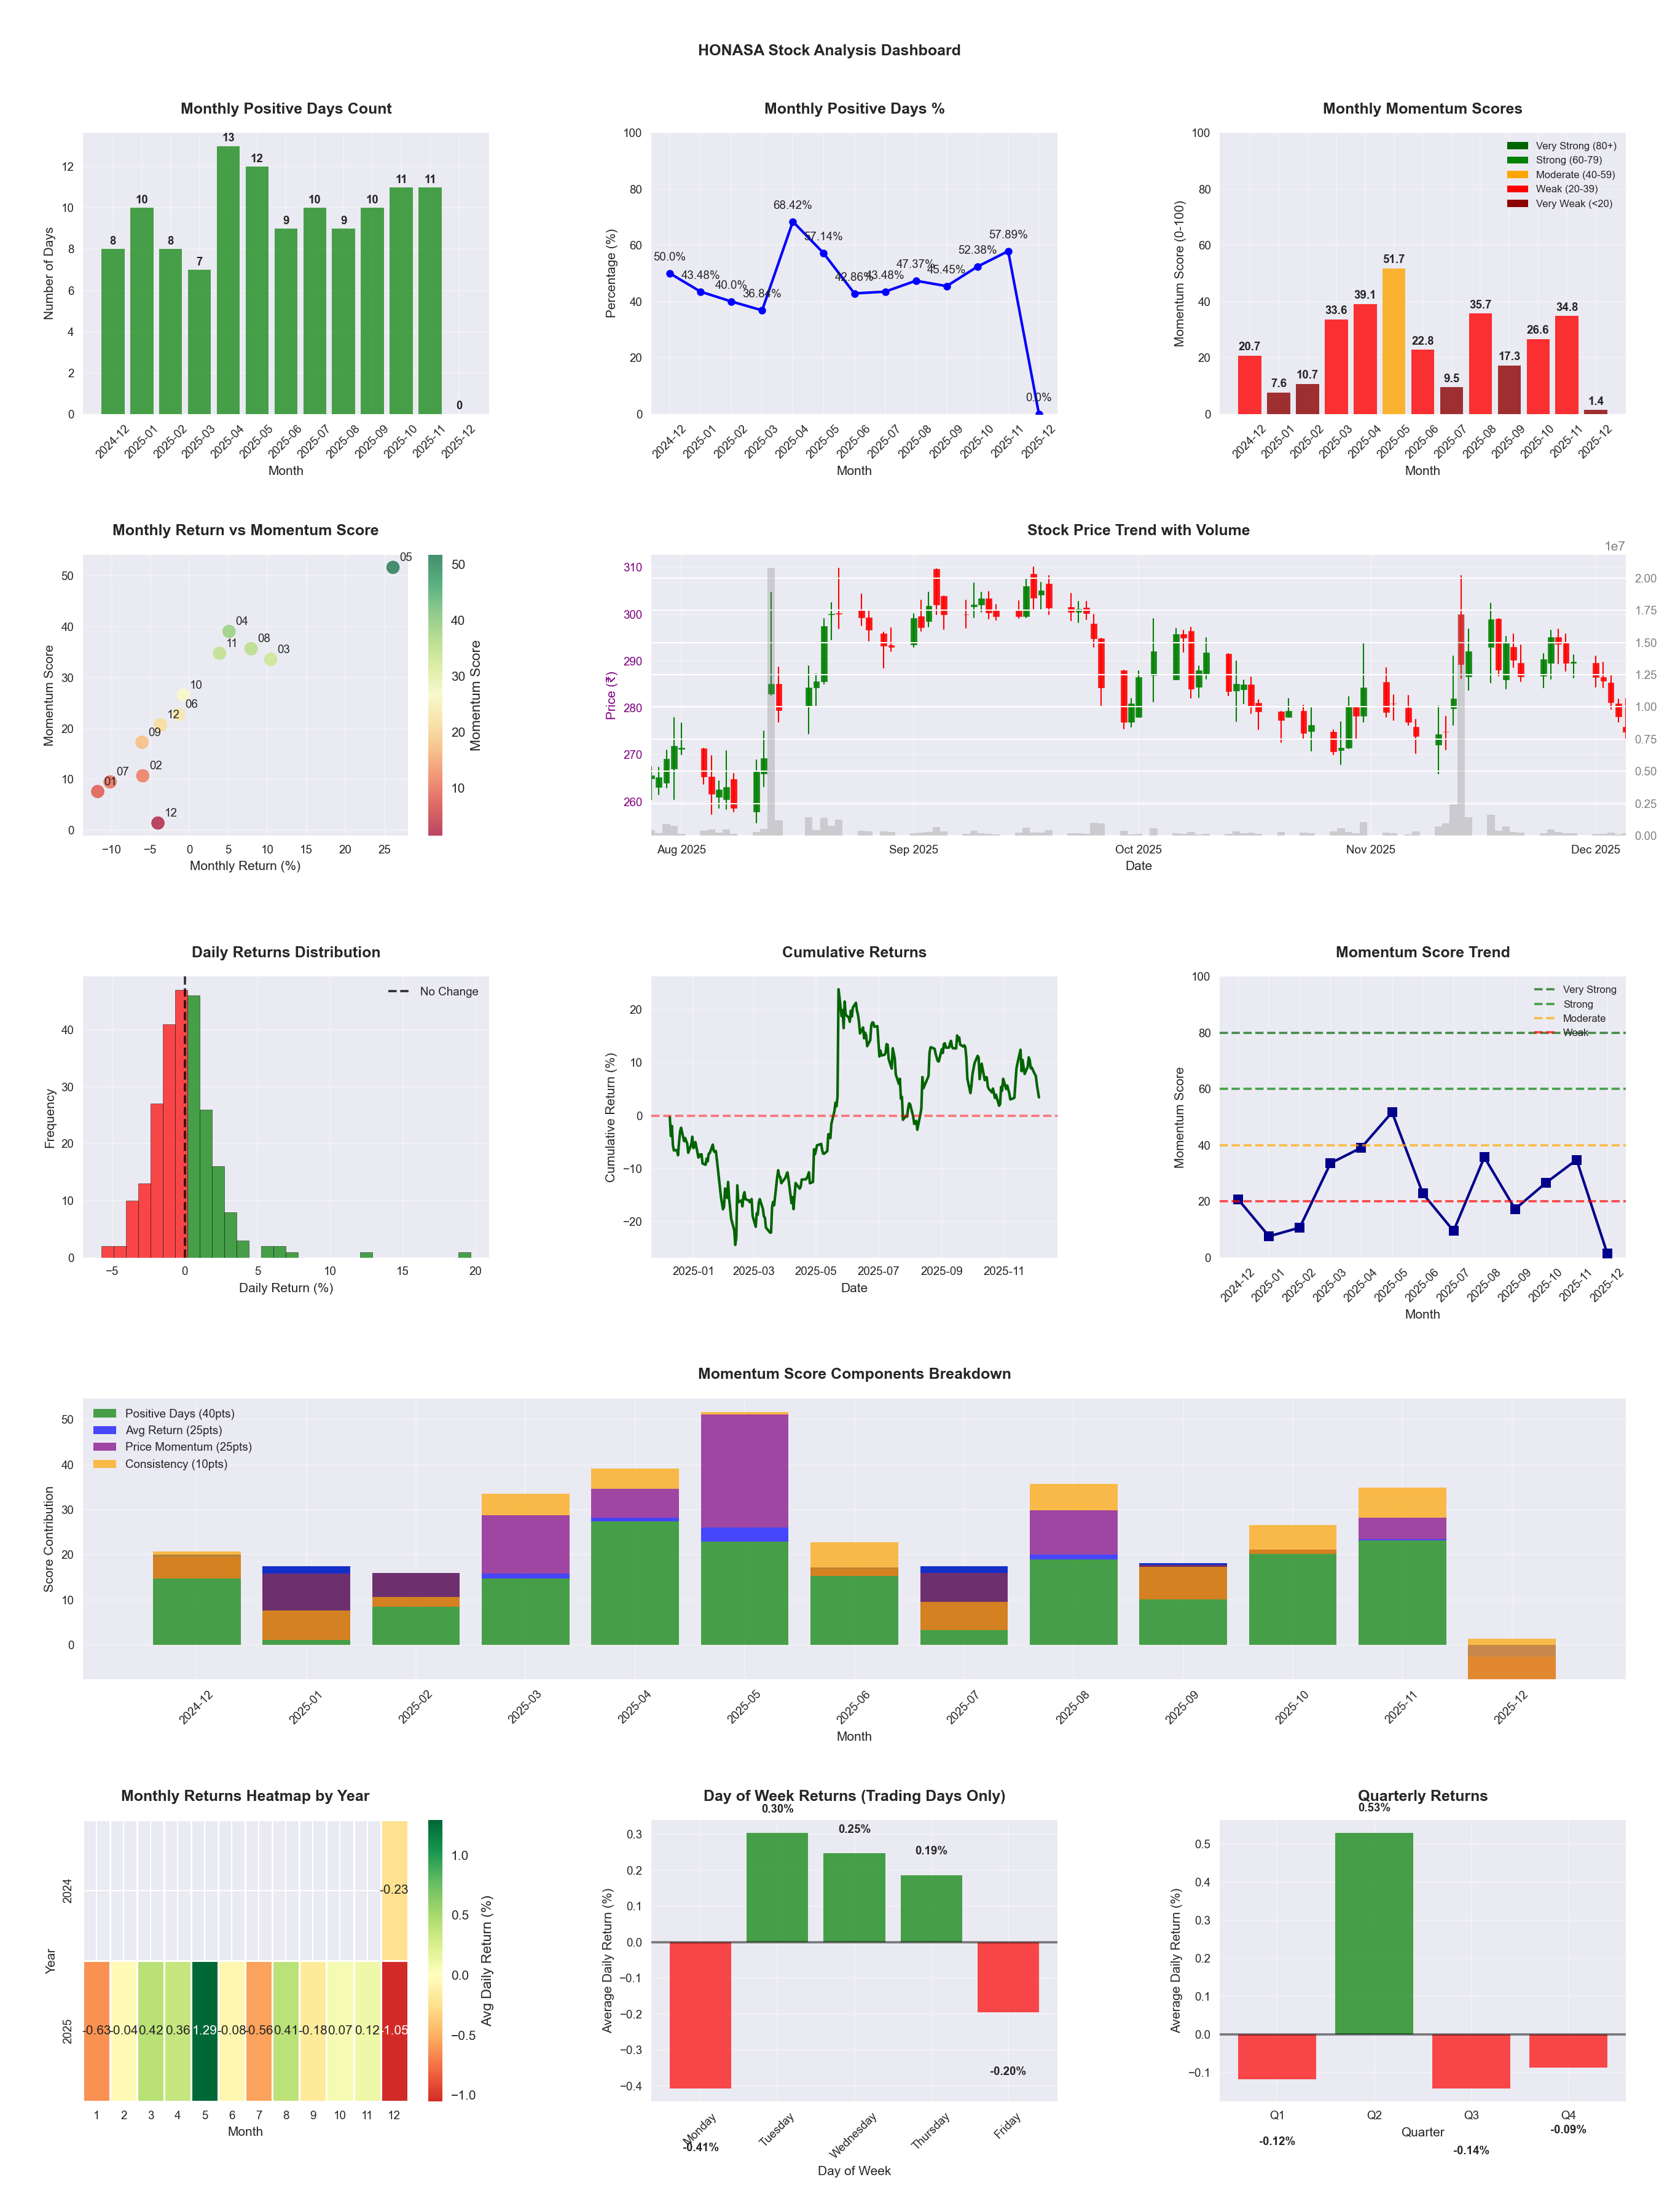
📊 Key Insights & Metrics
Symbol
📈 HONASA
Date
📅 2026-04-11
Volatility
🟡 2.34%
Risk Profile
⚠️ suitable for aggressive investors
Win Rate
⚠️ 48.6%
Avg Daily Return
📈 +0.19%
Max Drawdown
📉 -22.16%
IBD RS Score
📊 91.7
Leader
Market Rank
#41
Best Month
🏆 2026-04
Worst Month
📉 2025-07
Best Months to Trade
📅 May, Apr, Feb
Best Days to Trade
📅 Tuesday, Wednesday
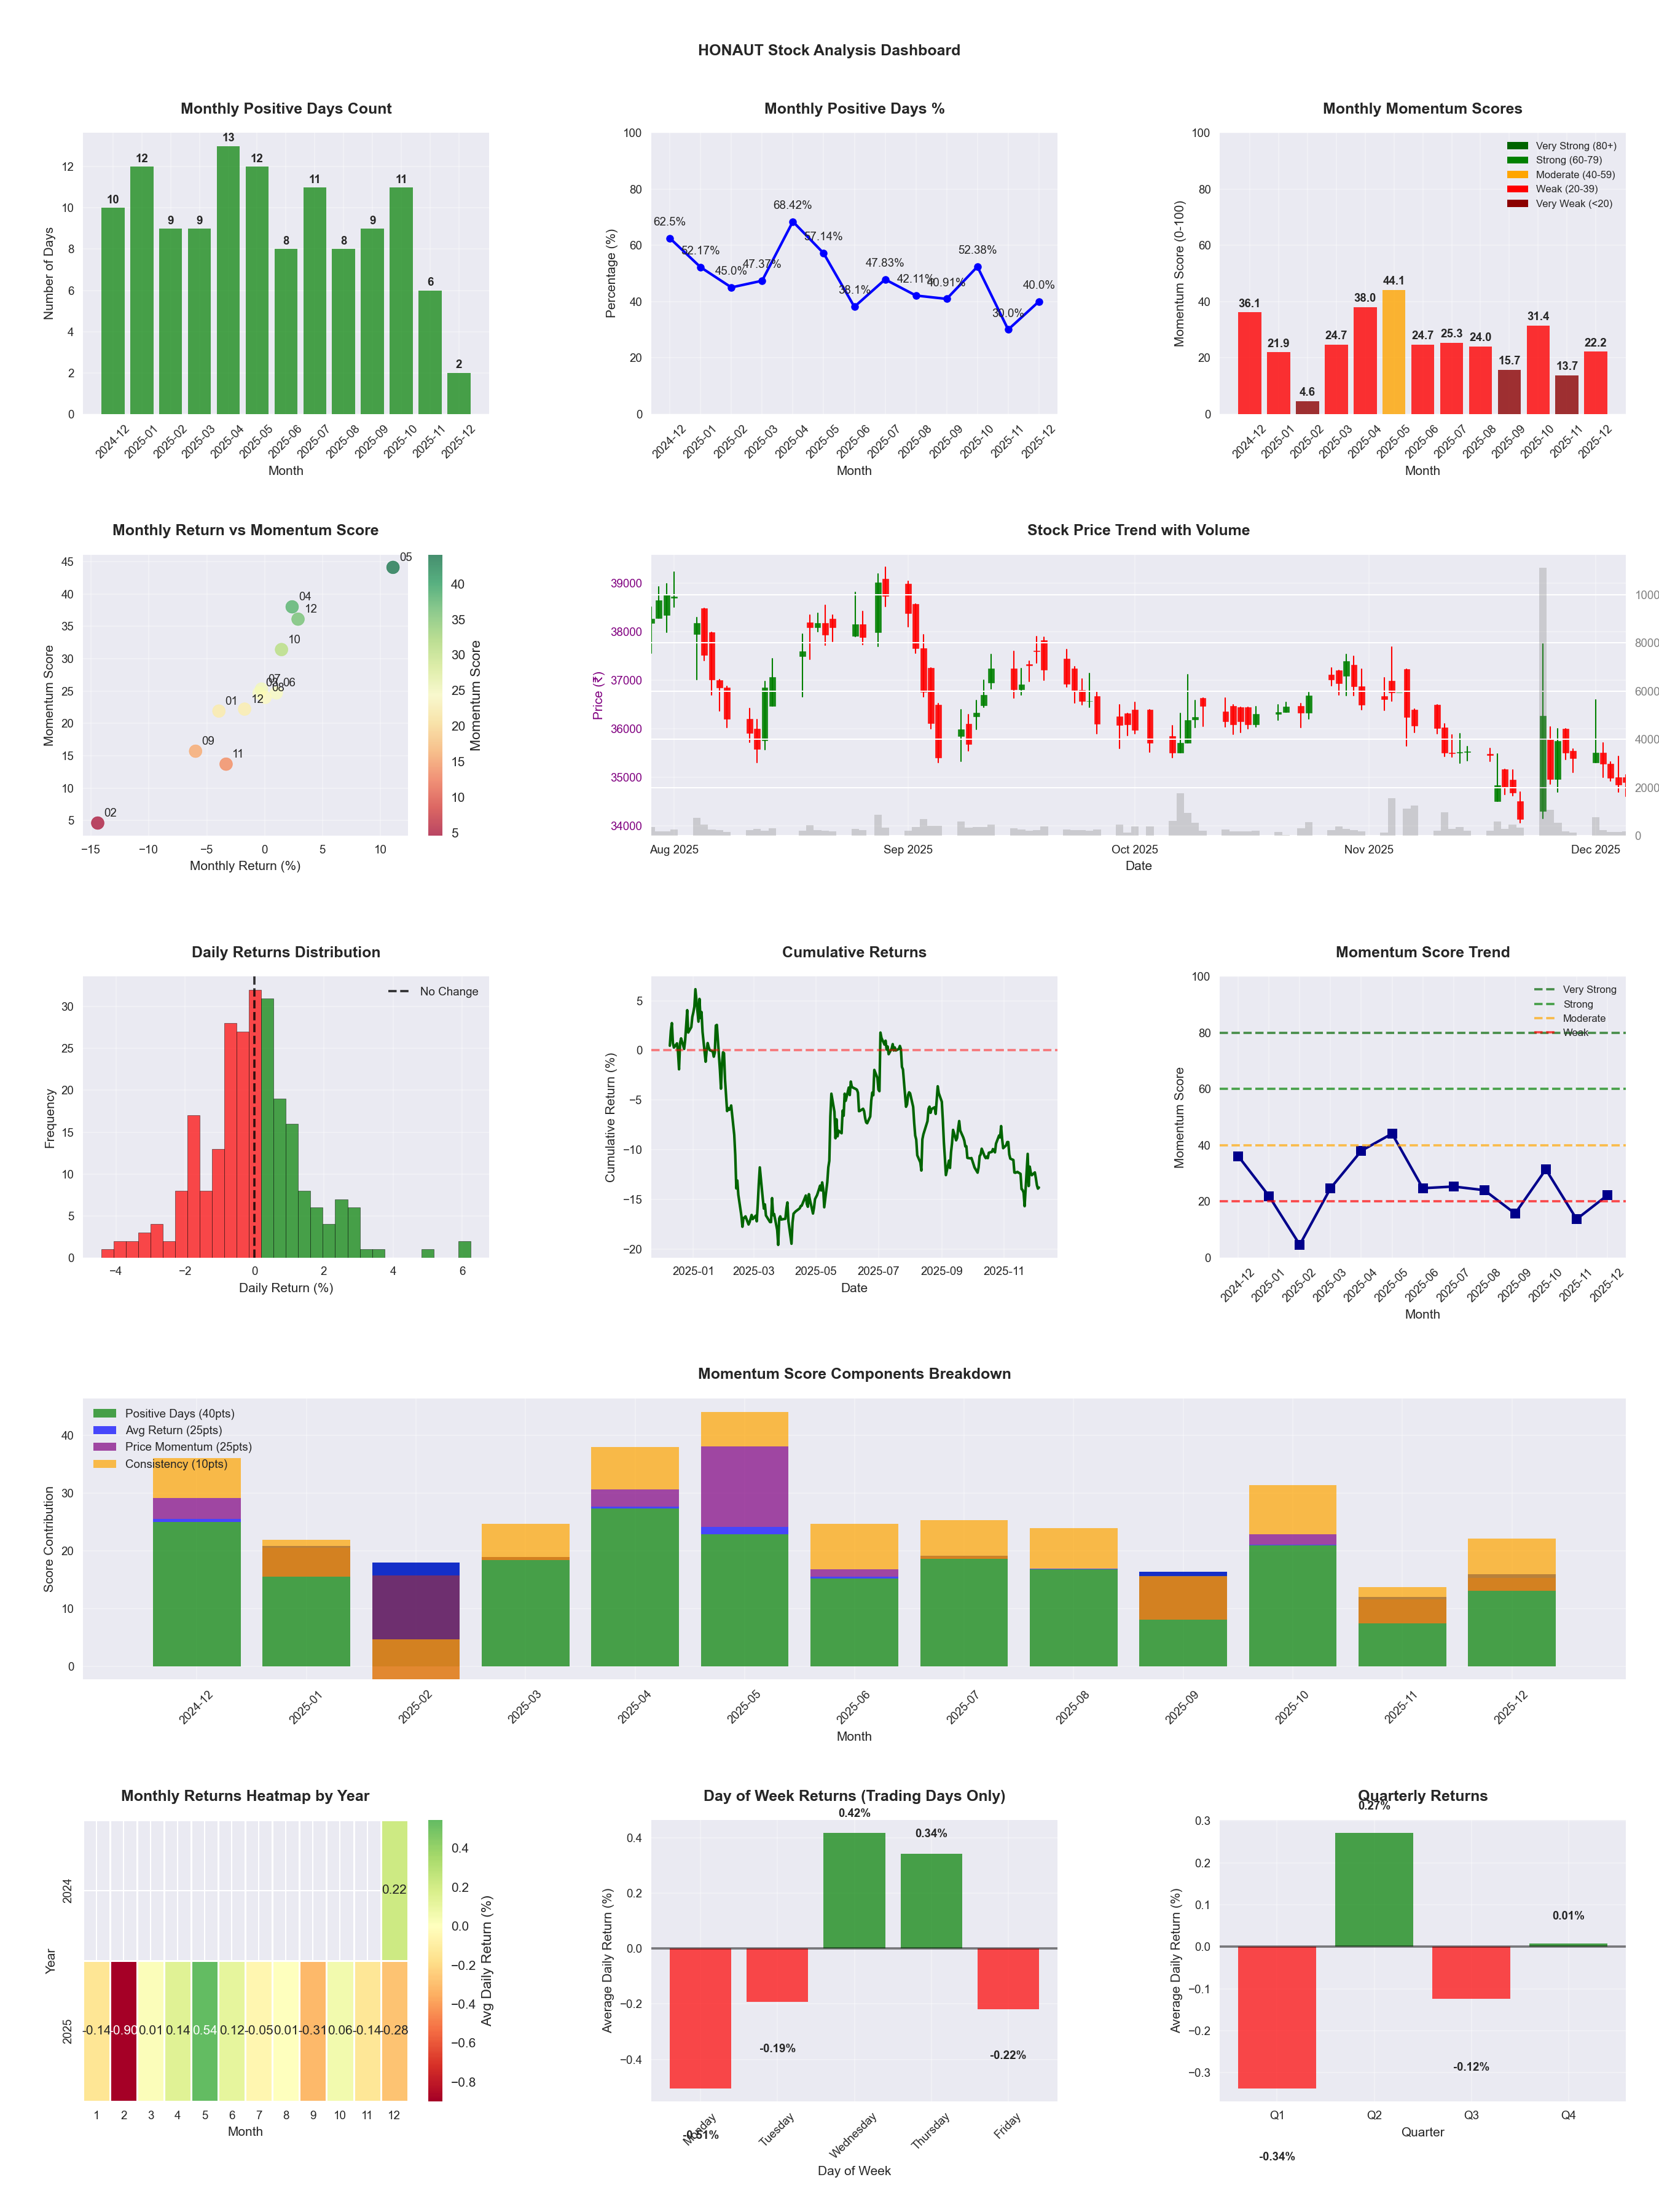
📊 Key Insights & Metrics
Symbol
📈 HONAUT
Date
📅 2026-04-11
Volatility
🟢 1.49%
Win Rate
⚠️ 42.0%
Avg Daily Return
📉 -0.06%
Max Drawdown
📉 -36.10%
IBD RS Score
📊 14.4
Weak
Market Rank
#422
Best Month
🏆 2025-05
Best Months to Trade
📅 Apr, May, Jun
Best Days to Trade
📅 Wednesday, Thursday
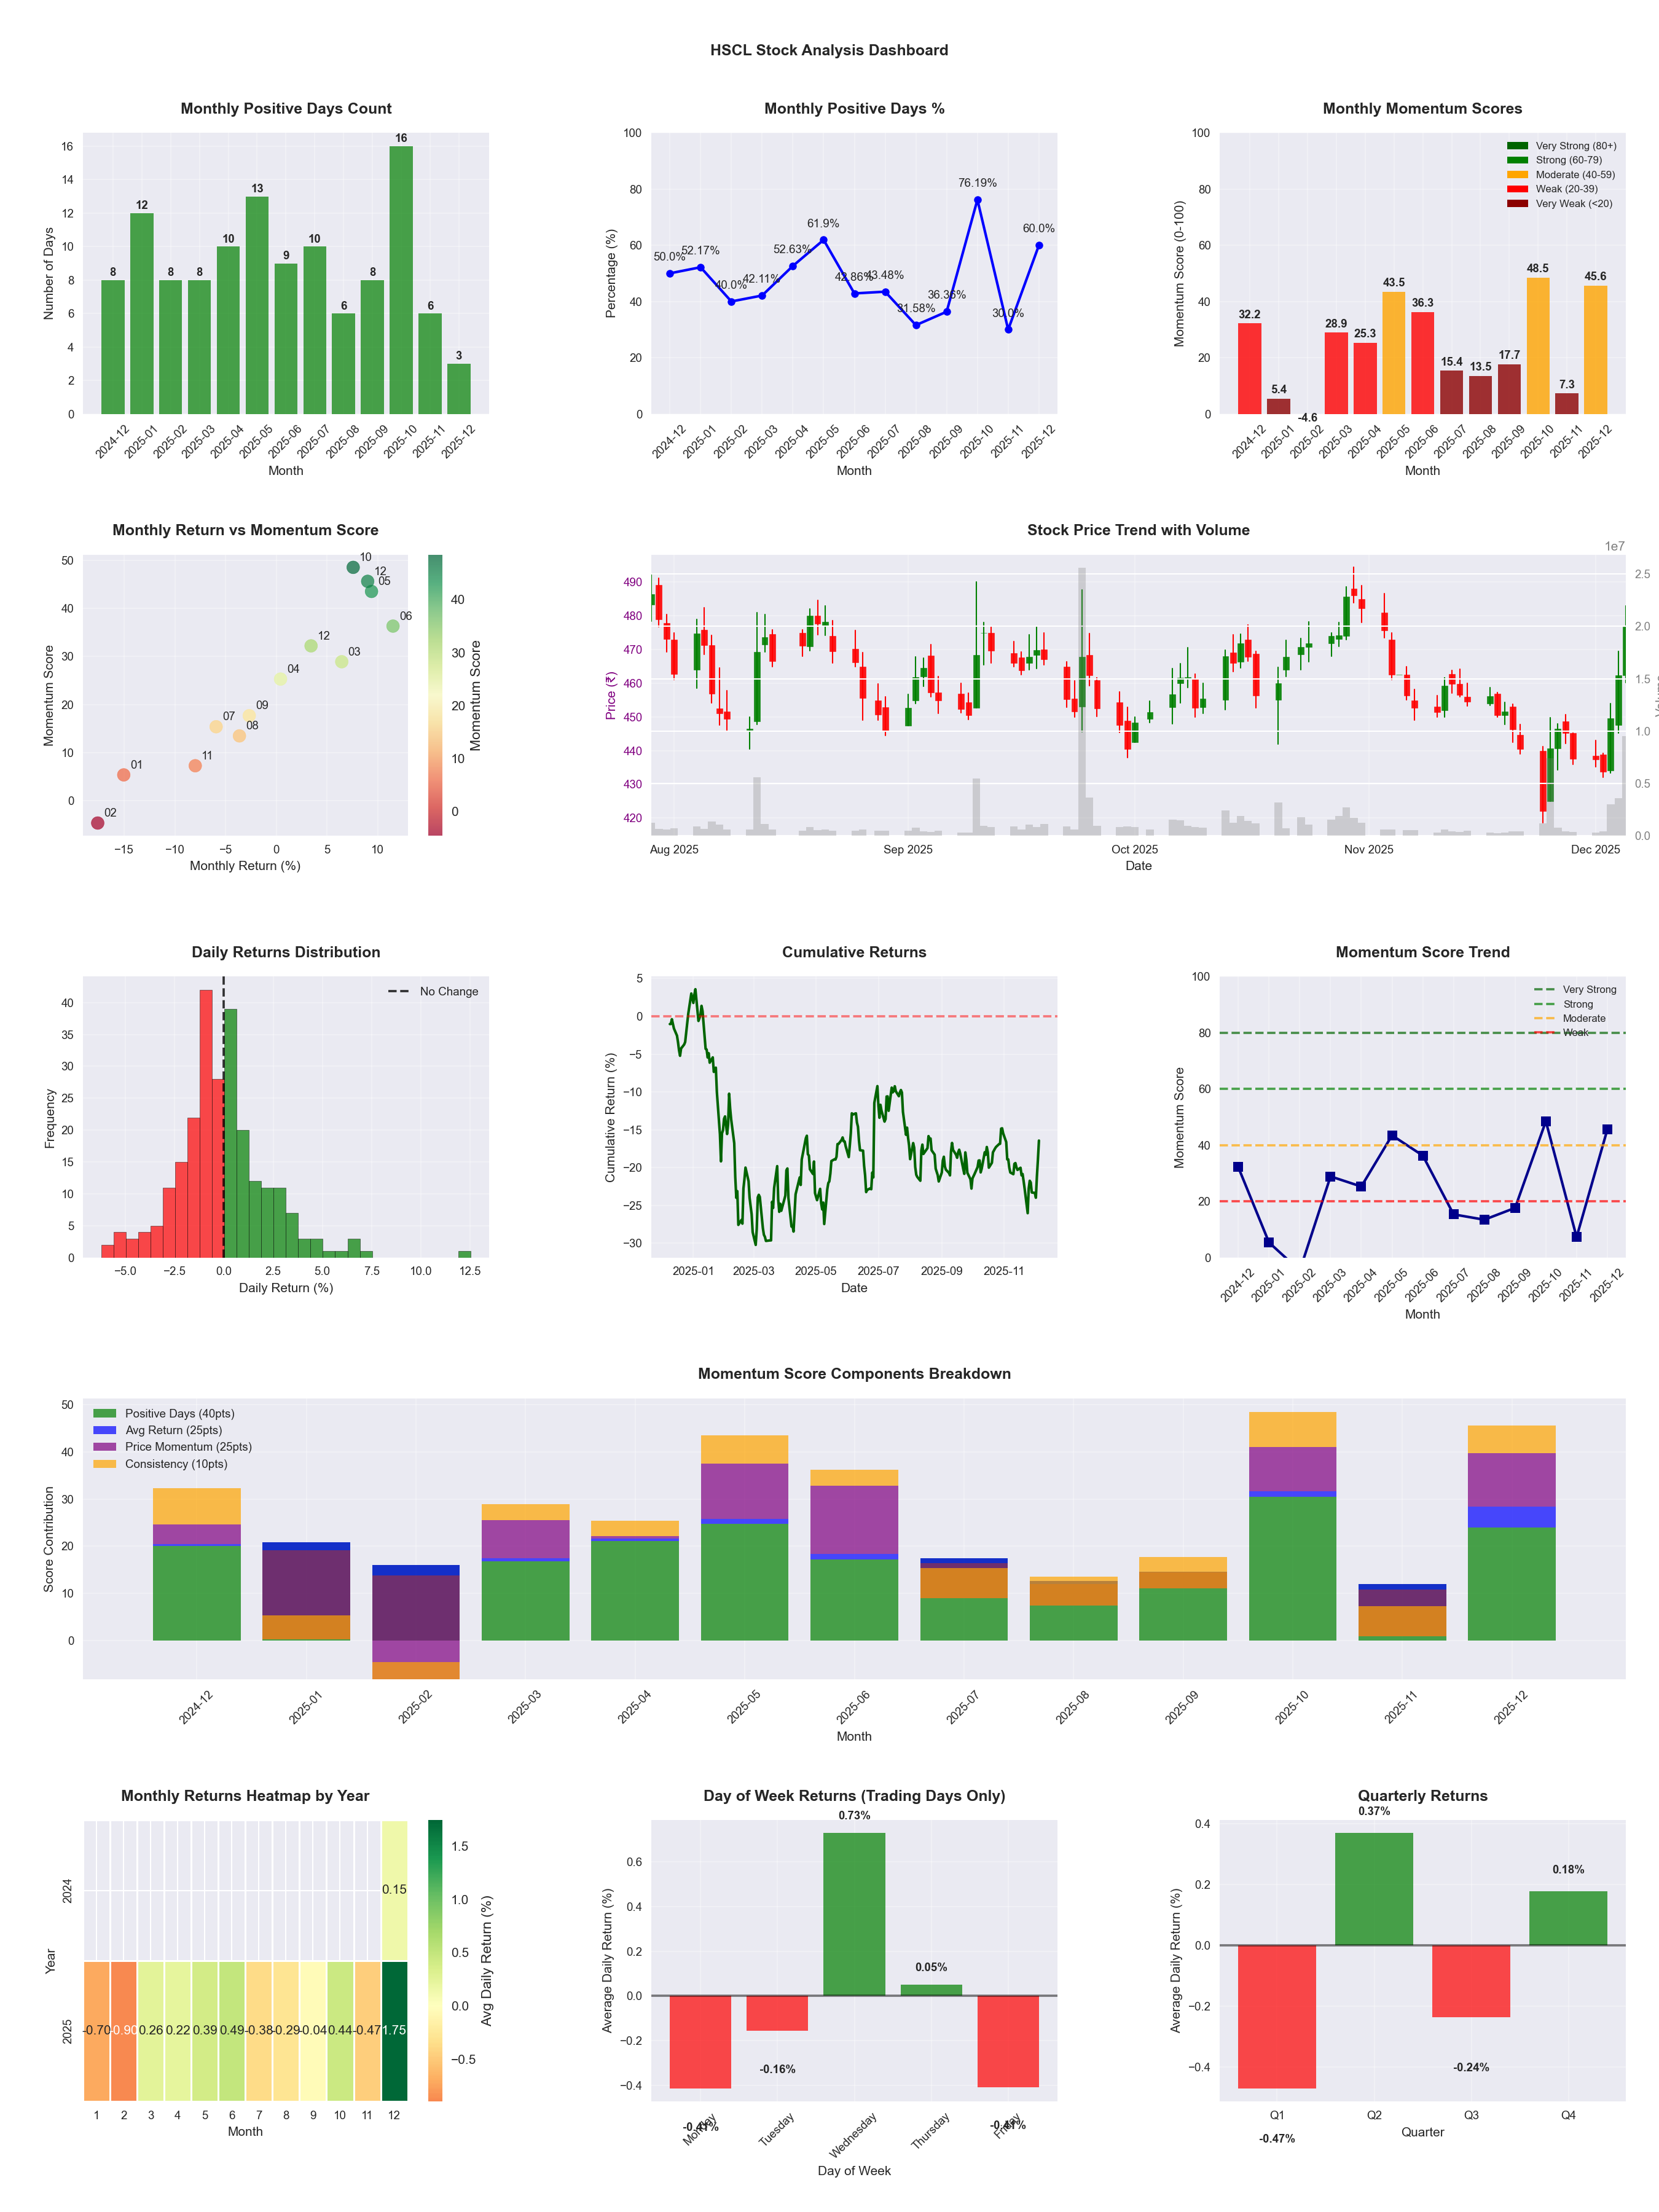
📊 Key Insights & Metrics
Symbol
📈 HSCL
Date
📅 2026-04-11
Volatility
🟡 2.00%
Risk Profile
⚠️ suitable for aggressive investors
Win Rate
⚠️ 47.6%
Avg Daily Return
📈 +0.05%
Max Drawdown
📉 -18.50%
IBD RS Score
📊 61.9
Average
Market Rank
#188
Best Month
🏆 2026-04
Worst Month
📉 2025-11
Best Months to Trade
📅 Dec, Jun, Oct
Best Days to Trade
📅 Wednesday, Tuesday
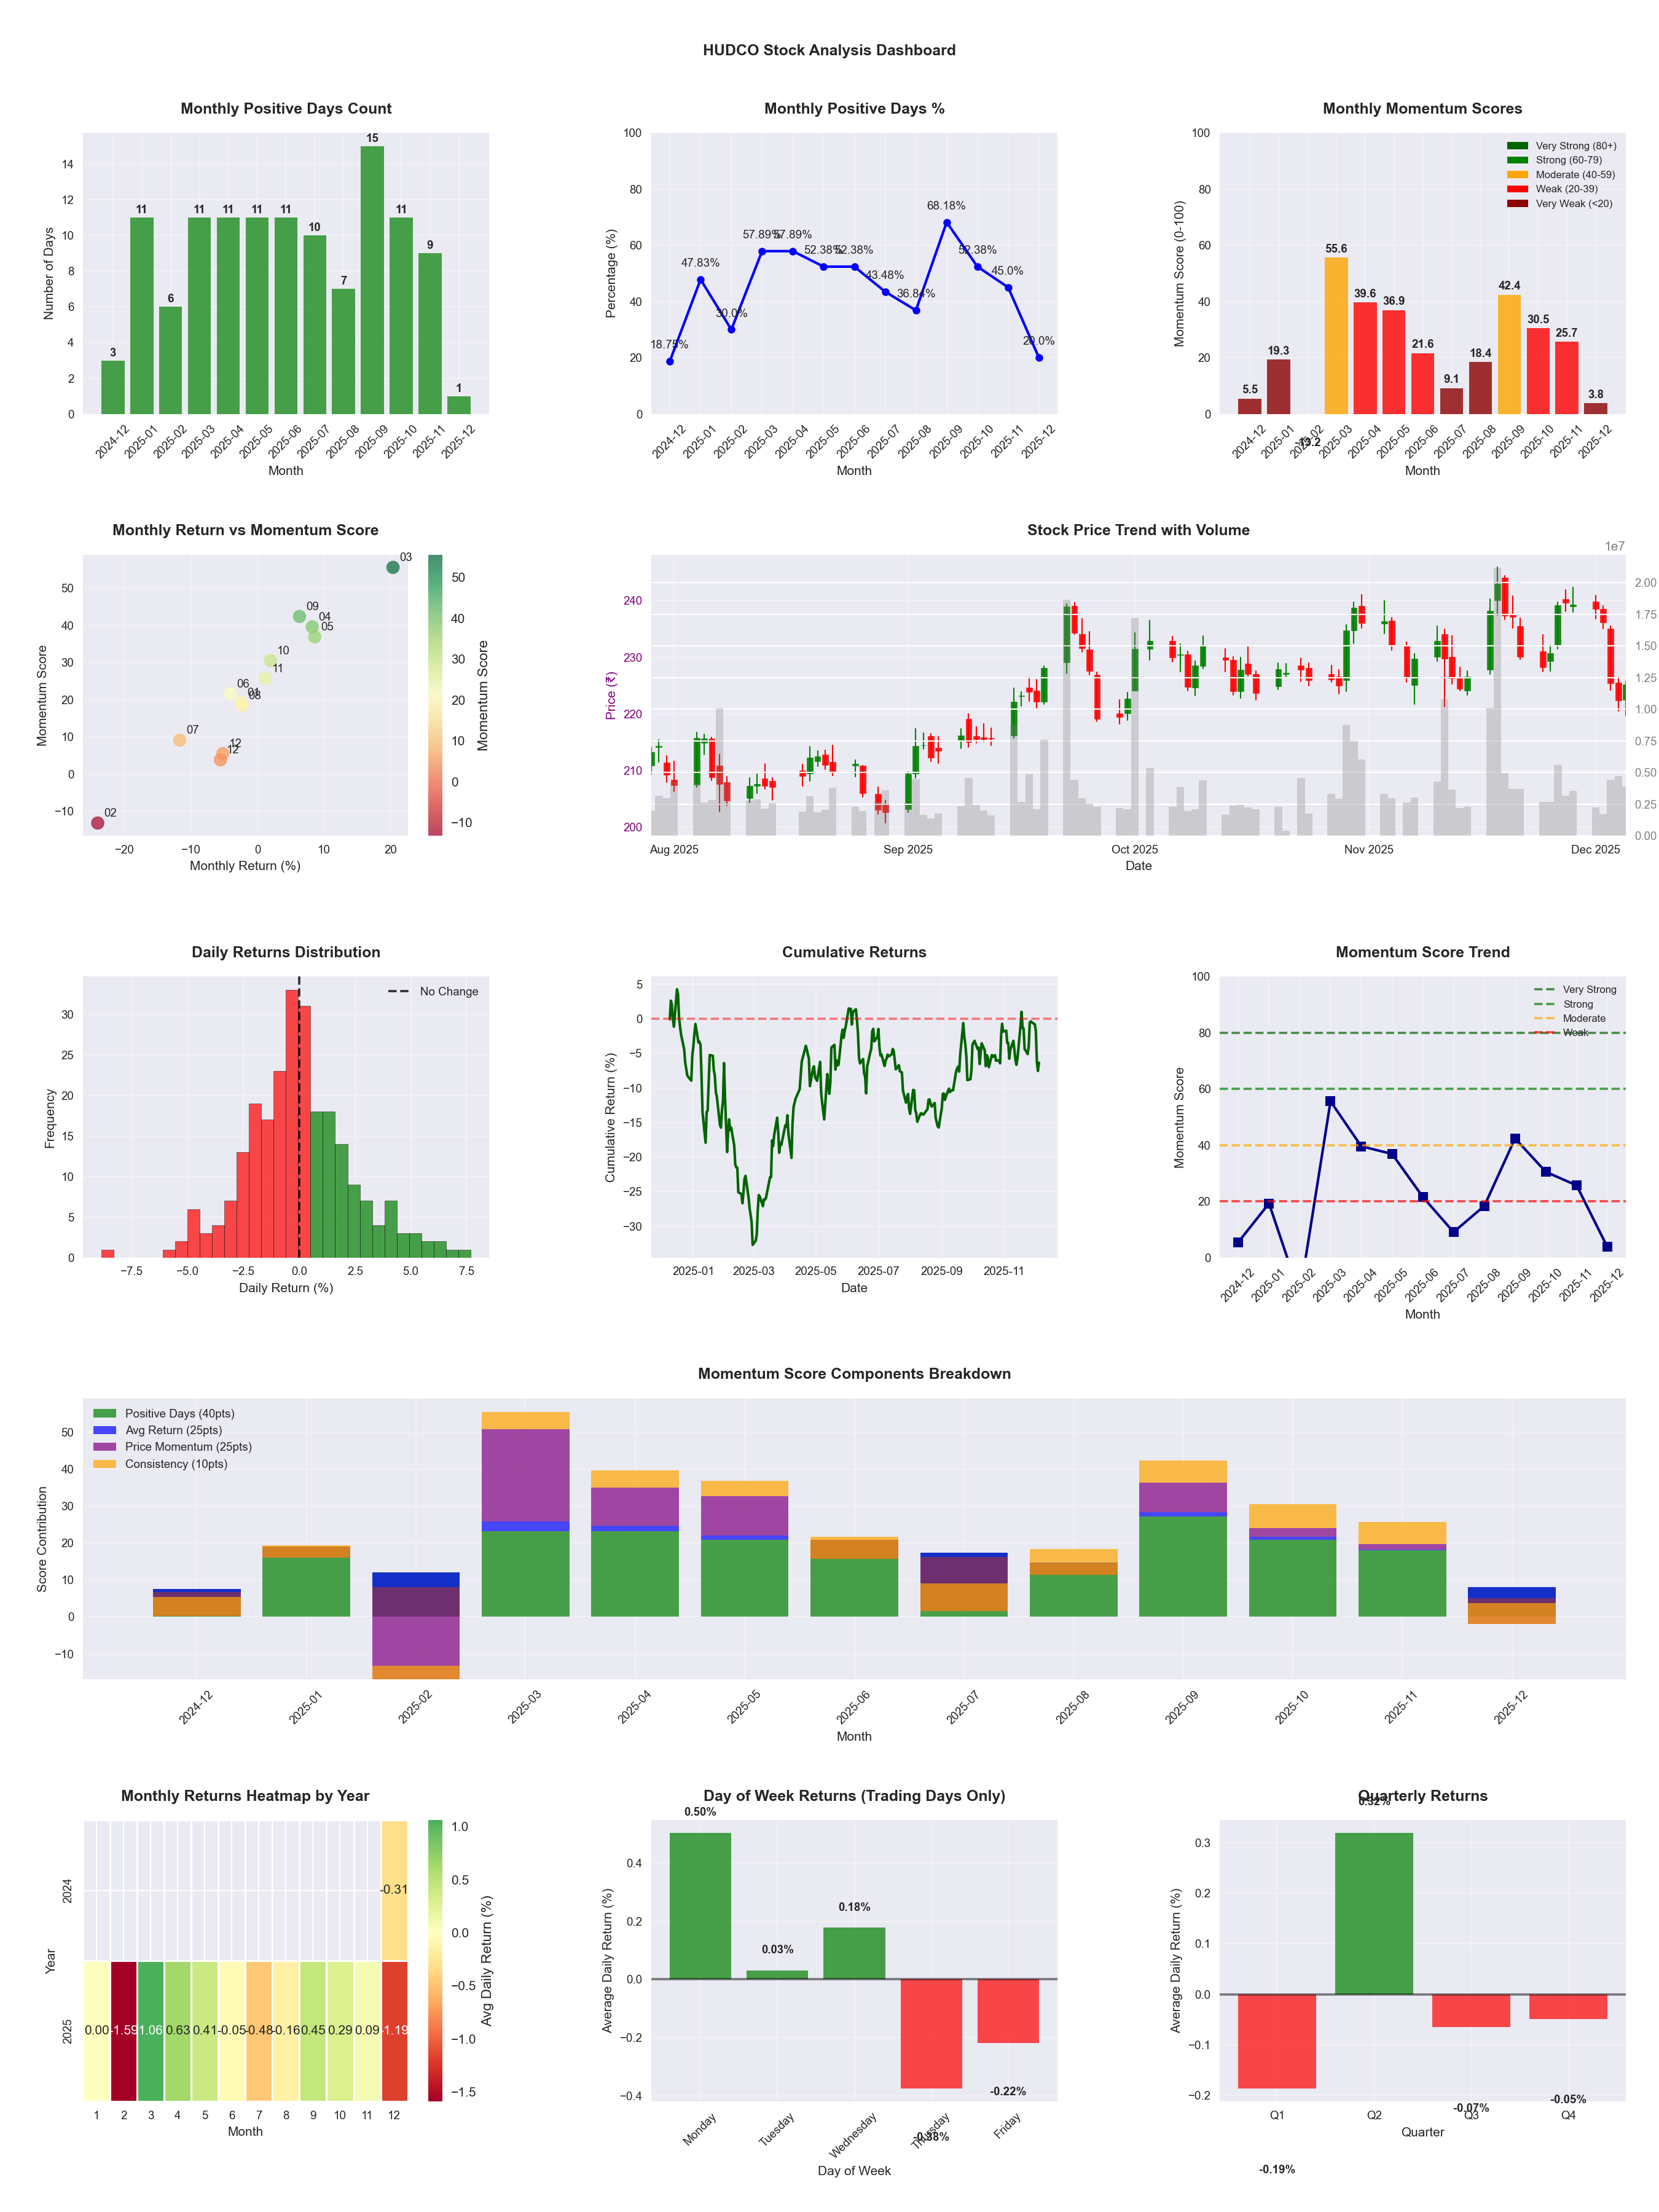
📊 Key Insights & Metrics
Symbol
📈 HUDCO
Date
📅 2026-04-11
Volatility
🟡 2.15%
Risk Profile
⚠️ suitable for aggressive investors
Win Rate
⚠️ 48.4%
Avg Daily Return
📉 -0.03%
Max Drawdown
📉 -33.77%
IBD RS Score
📊 21.9
Weak
Market Rank
#385
Best Month
🏆 2026-04
Best Months to Trade
📅 Apr, Sep, May
Best Days to Trade
📅 Monday, Wednesday
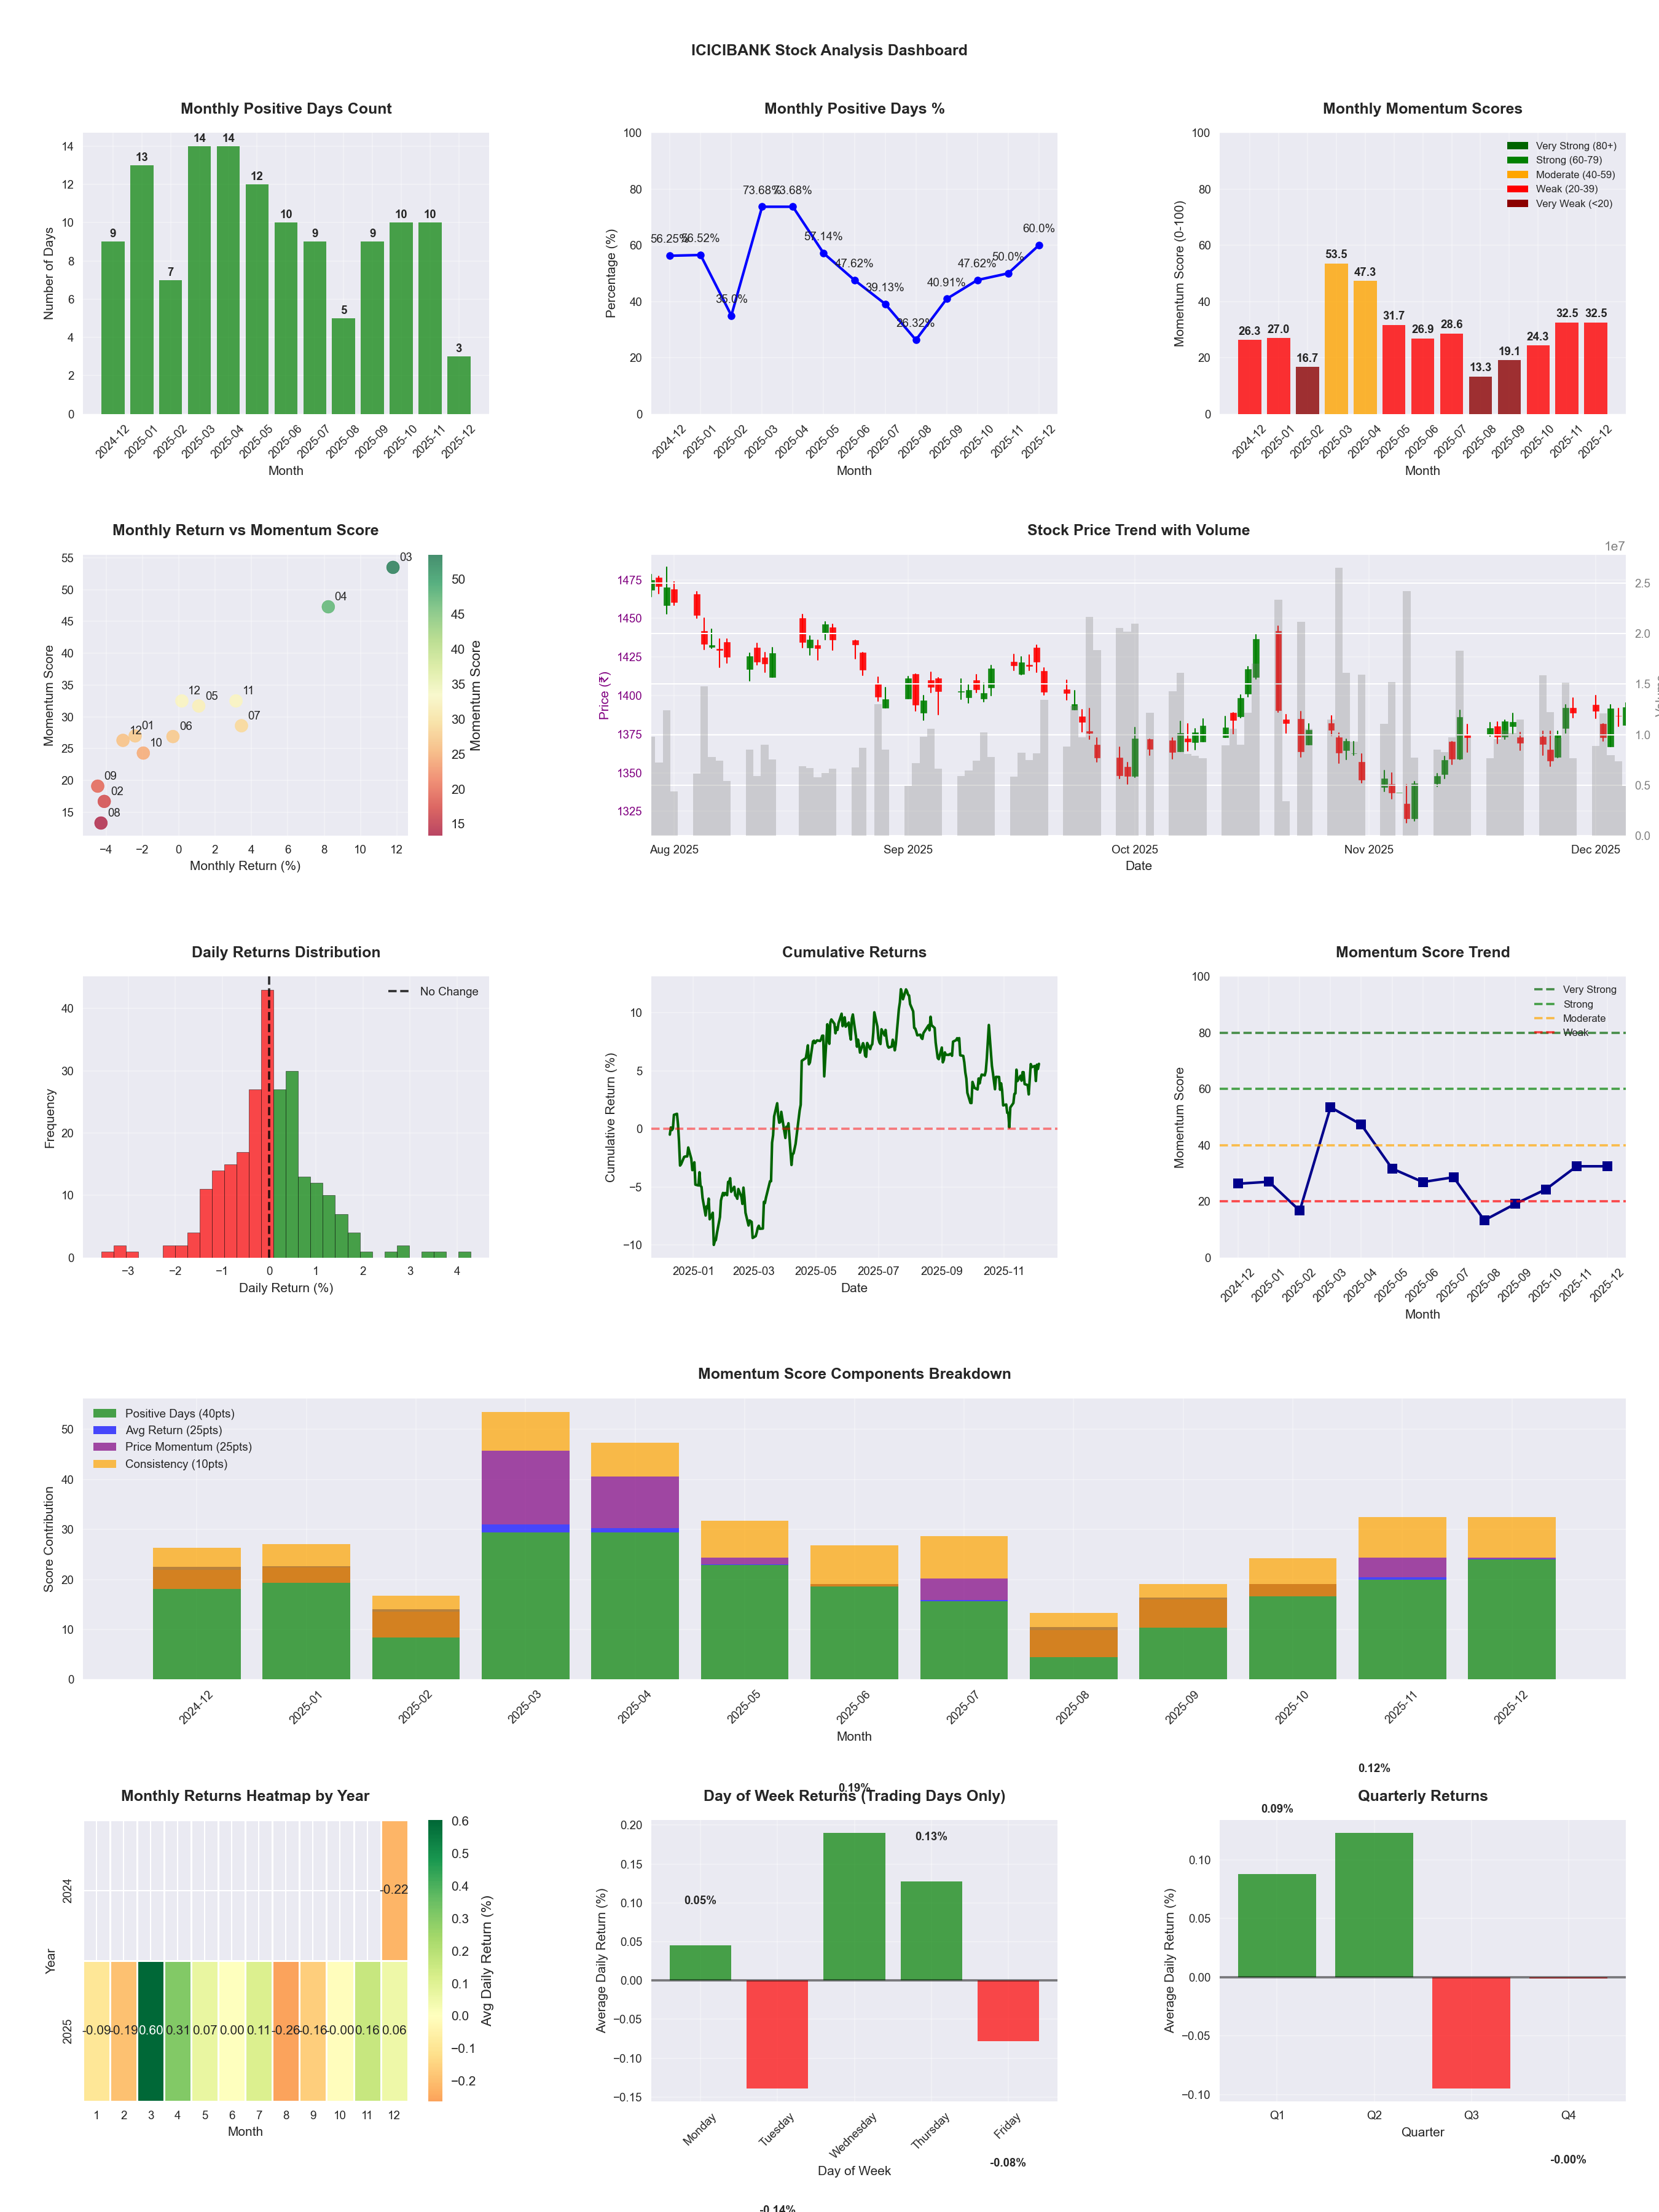
📊 Key Insights & Metrics
Symbol
📈 ICICIBANK
Date
📅 2026-04-11
Volatility
🟢 1.17%
Win Rate
⚠️ 46.3%
Avg Daily Return
📈 +0.01%
Max Drawdown
📉 -18.37%
IBD RS Score
📊 50.1
Average
Market Rank
#246
Best Month
🏆 2026-04
Worst Month
📉 2026-03
Best Months to Trade
📅 Apr, Nov, Jul
Best Days to Trade
📅 Wednesday, Tuesday
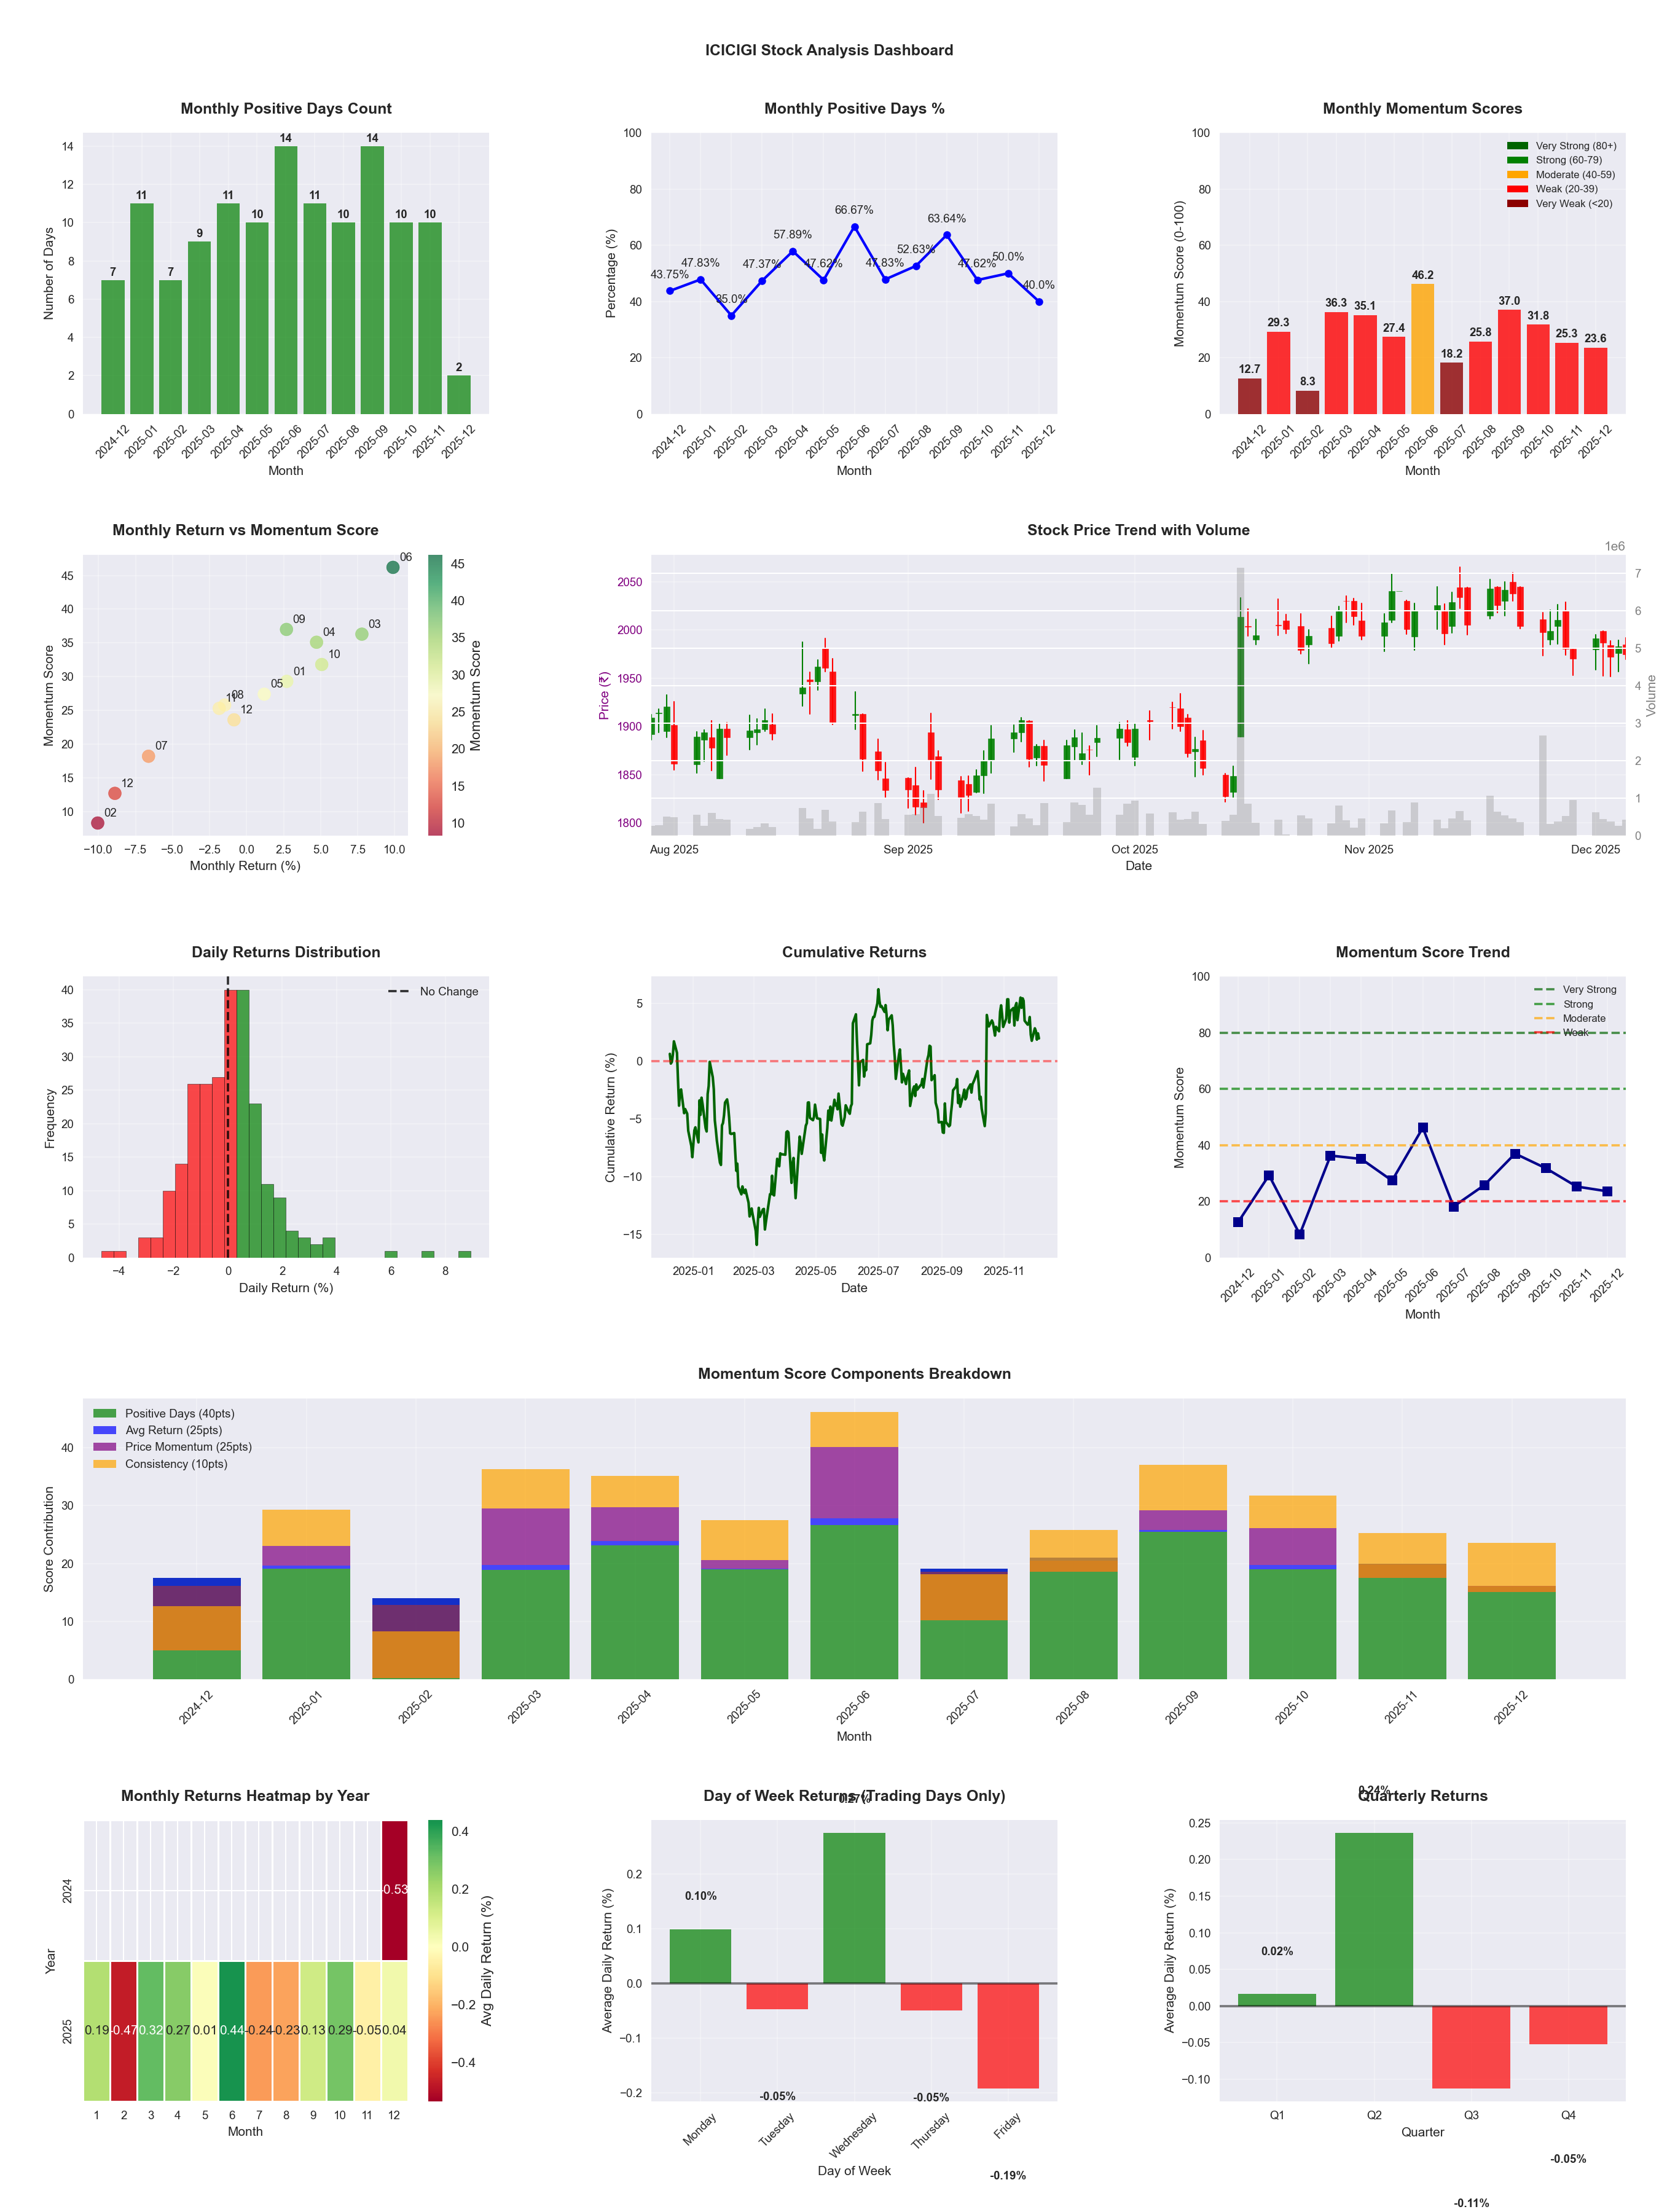
📊 Key Insights & Metrics
Symbol
📈 ICICIGI
Date
📅 2026-04-11
Volatility
🟢 1.43%
Win Rate
⚠️ 52.0%
Avg Daily Return
📈 +0.03%
Max Drawdown
📉 -17.88%
IBD RS Score
📊 51.9
Average
Market Rank
#237
Best Month
🏆 2025-06
Worst Month
📉 2026-03
Best Months to Trade
📅 Apr, Jun, Oct
Best Days to Trade
📅 Monday, Wednesday
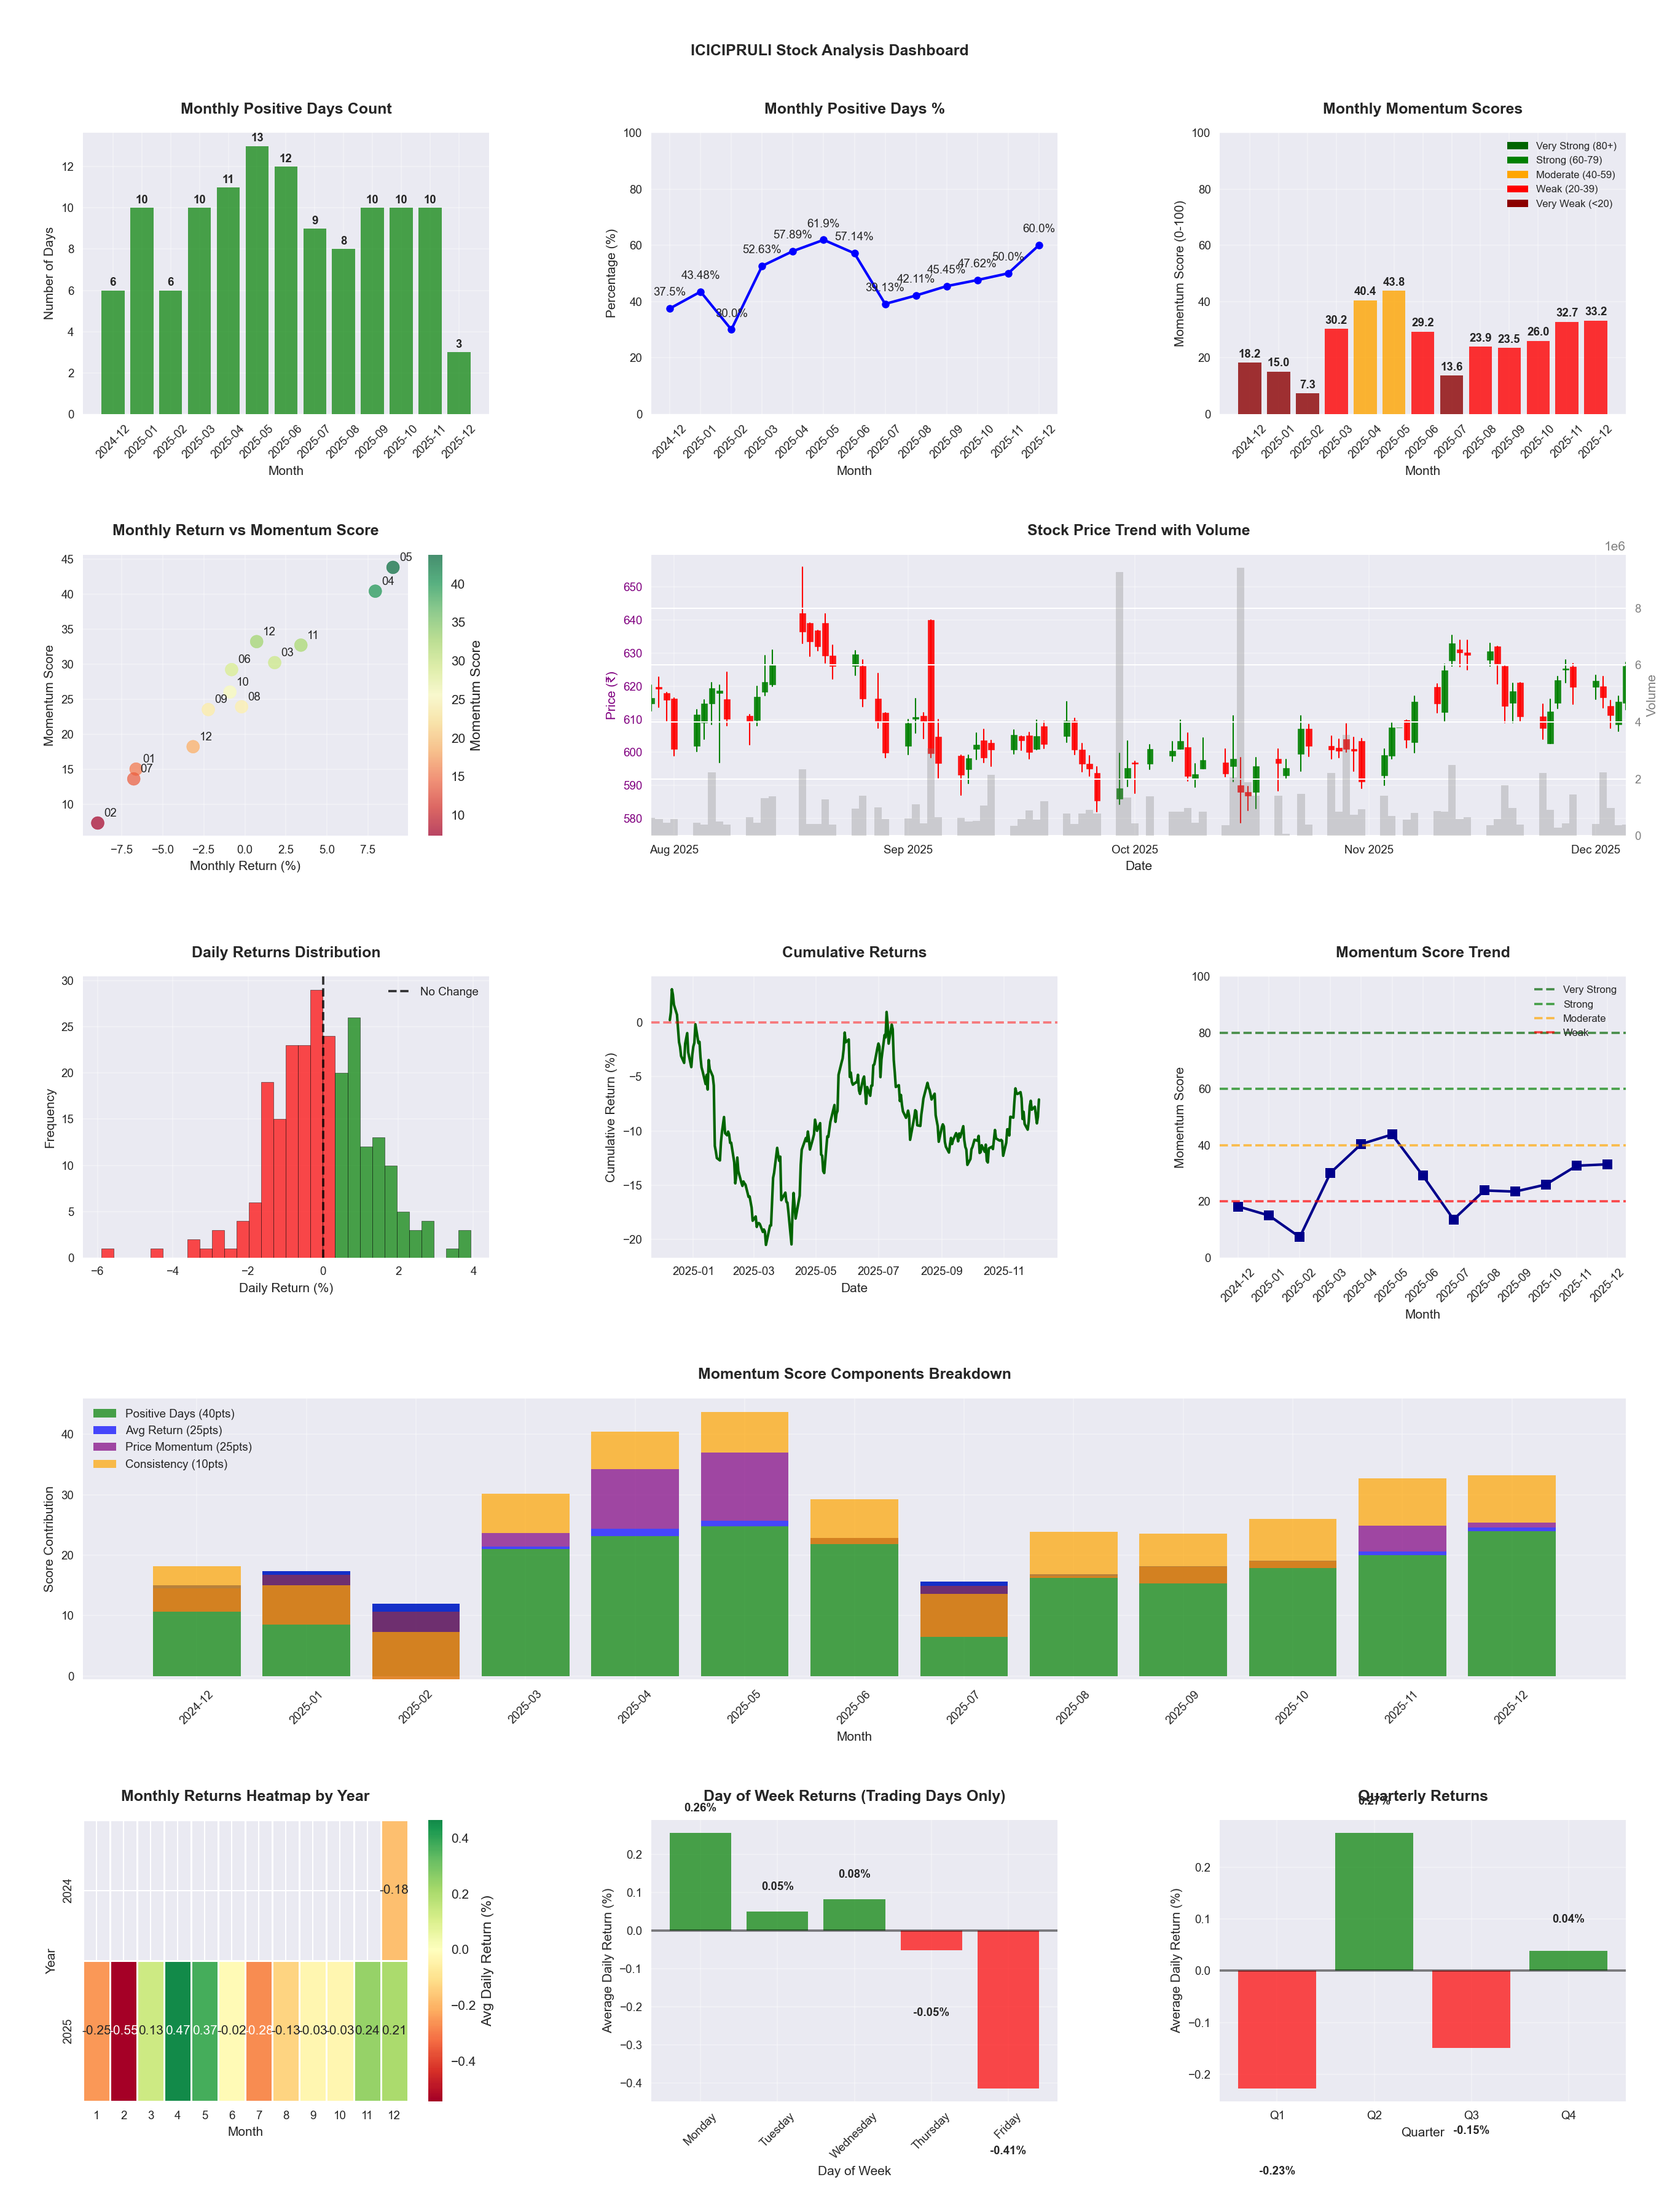
📊 Key Insights & Metrics
Symbol
📈 ICICIPRULI
Date
📅 2026-04-11
Volatility
🟢 1.39%
Win Rate
⚠️ 51.2%
Avg Daily Return
📈 +0.01%
Max Drawdown
📉 -26.88%
IBD RS Score
📊 26.6
Weak
Market Rank
#362
Best Month
🏆 2026-04
Best Months to Trade
📅 Apr, May, Dec
Best Days to Trade
📅 Monday, Wednesday
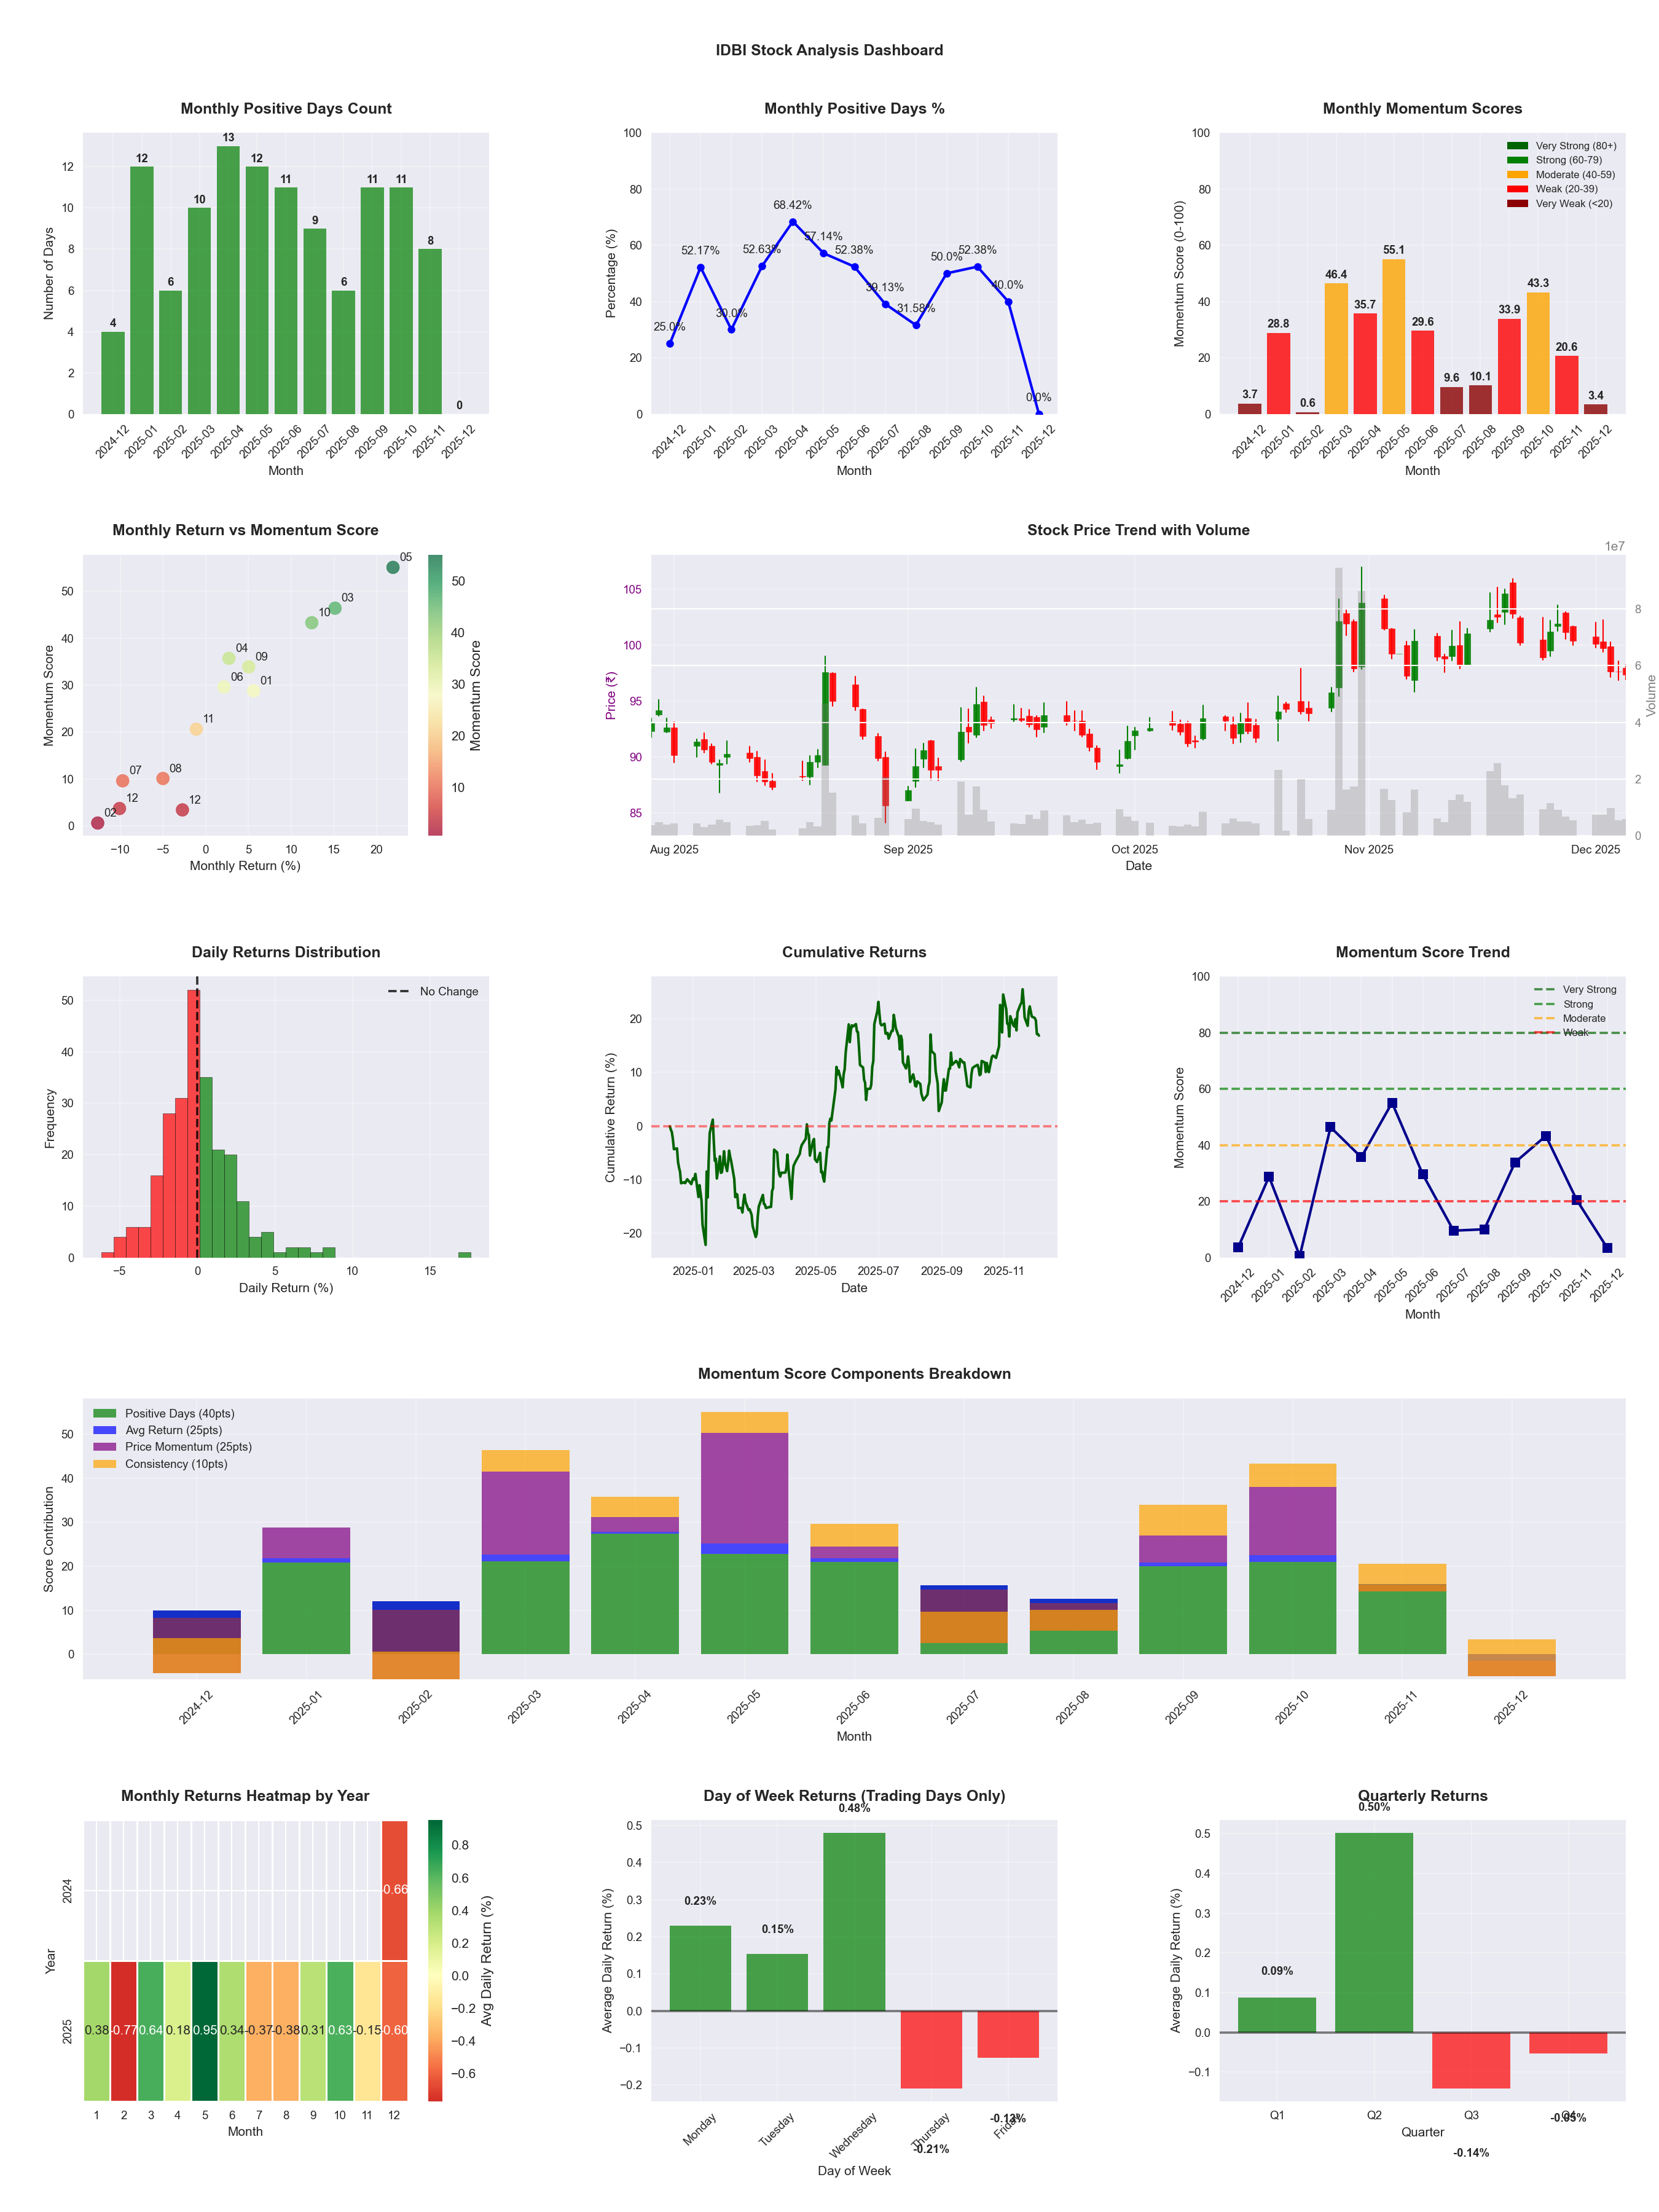
📊 Key Insights & Metrics
Symbol
📈 IDBI
Date
📅 2026-04-11
Volatility
🟡 2.81%
Risk Profile
⚠️ suitable for aggressive investors
Win Rate
⚠️ 47.6%
Avg Daily Return
📈 +0.02%
Max Drawdown
📉 -46.99%
IBD RS Score
📊 12.0
Weak
Market Rank
#434
Best Month
🏆 2026-02
Best Months to Trade
📅 Apr, May, Feb
Best Days to Trade
📅 Wednesday, Friday
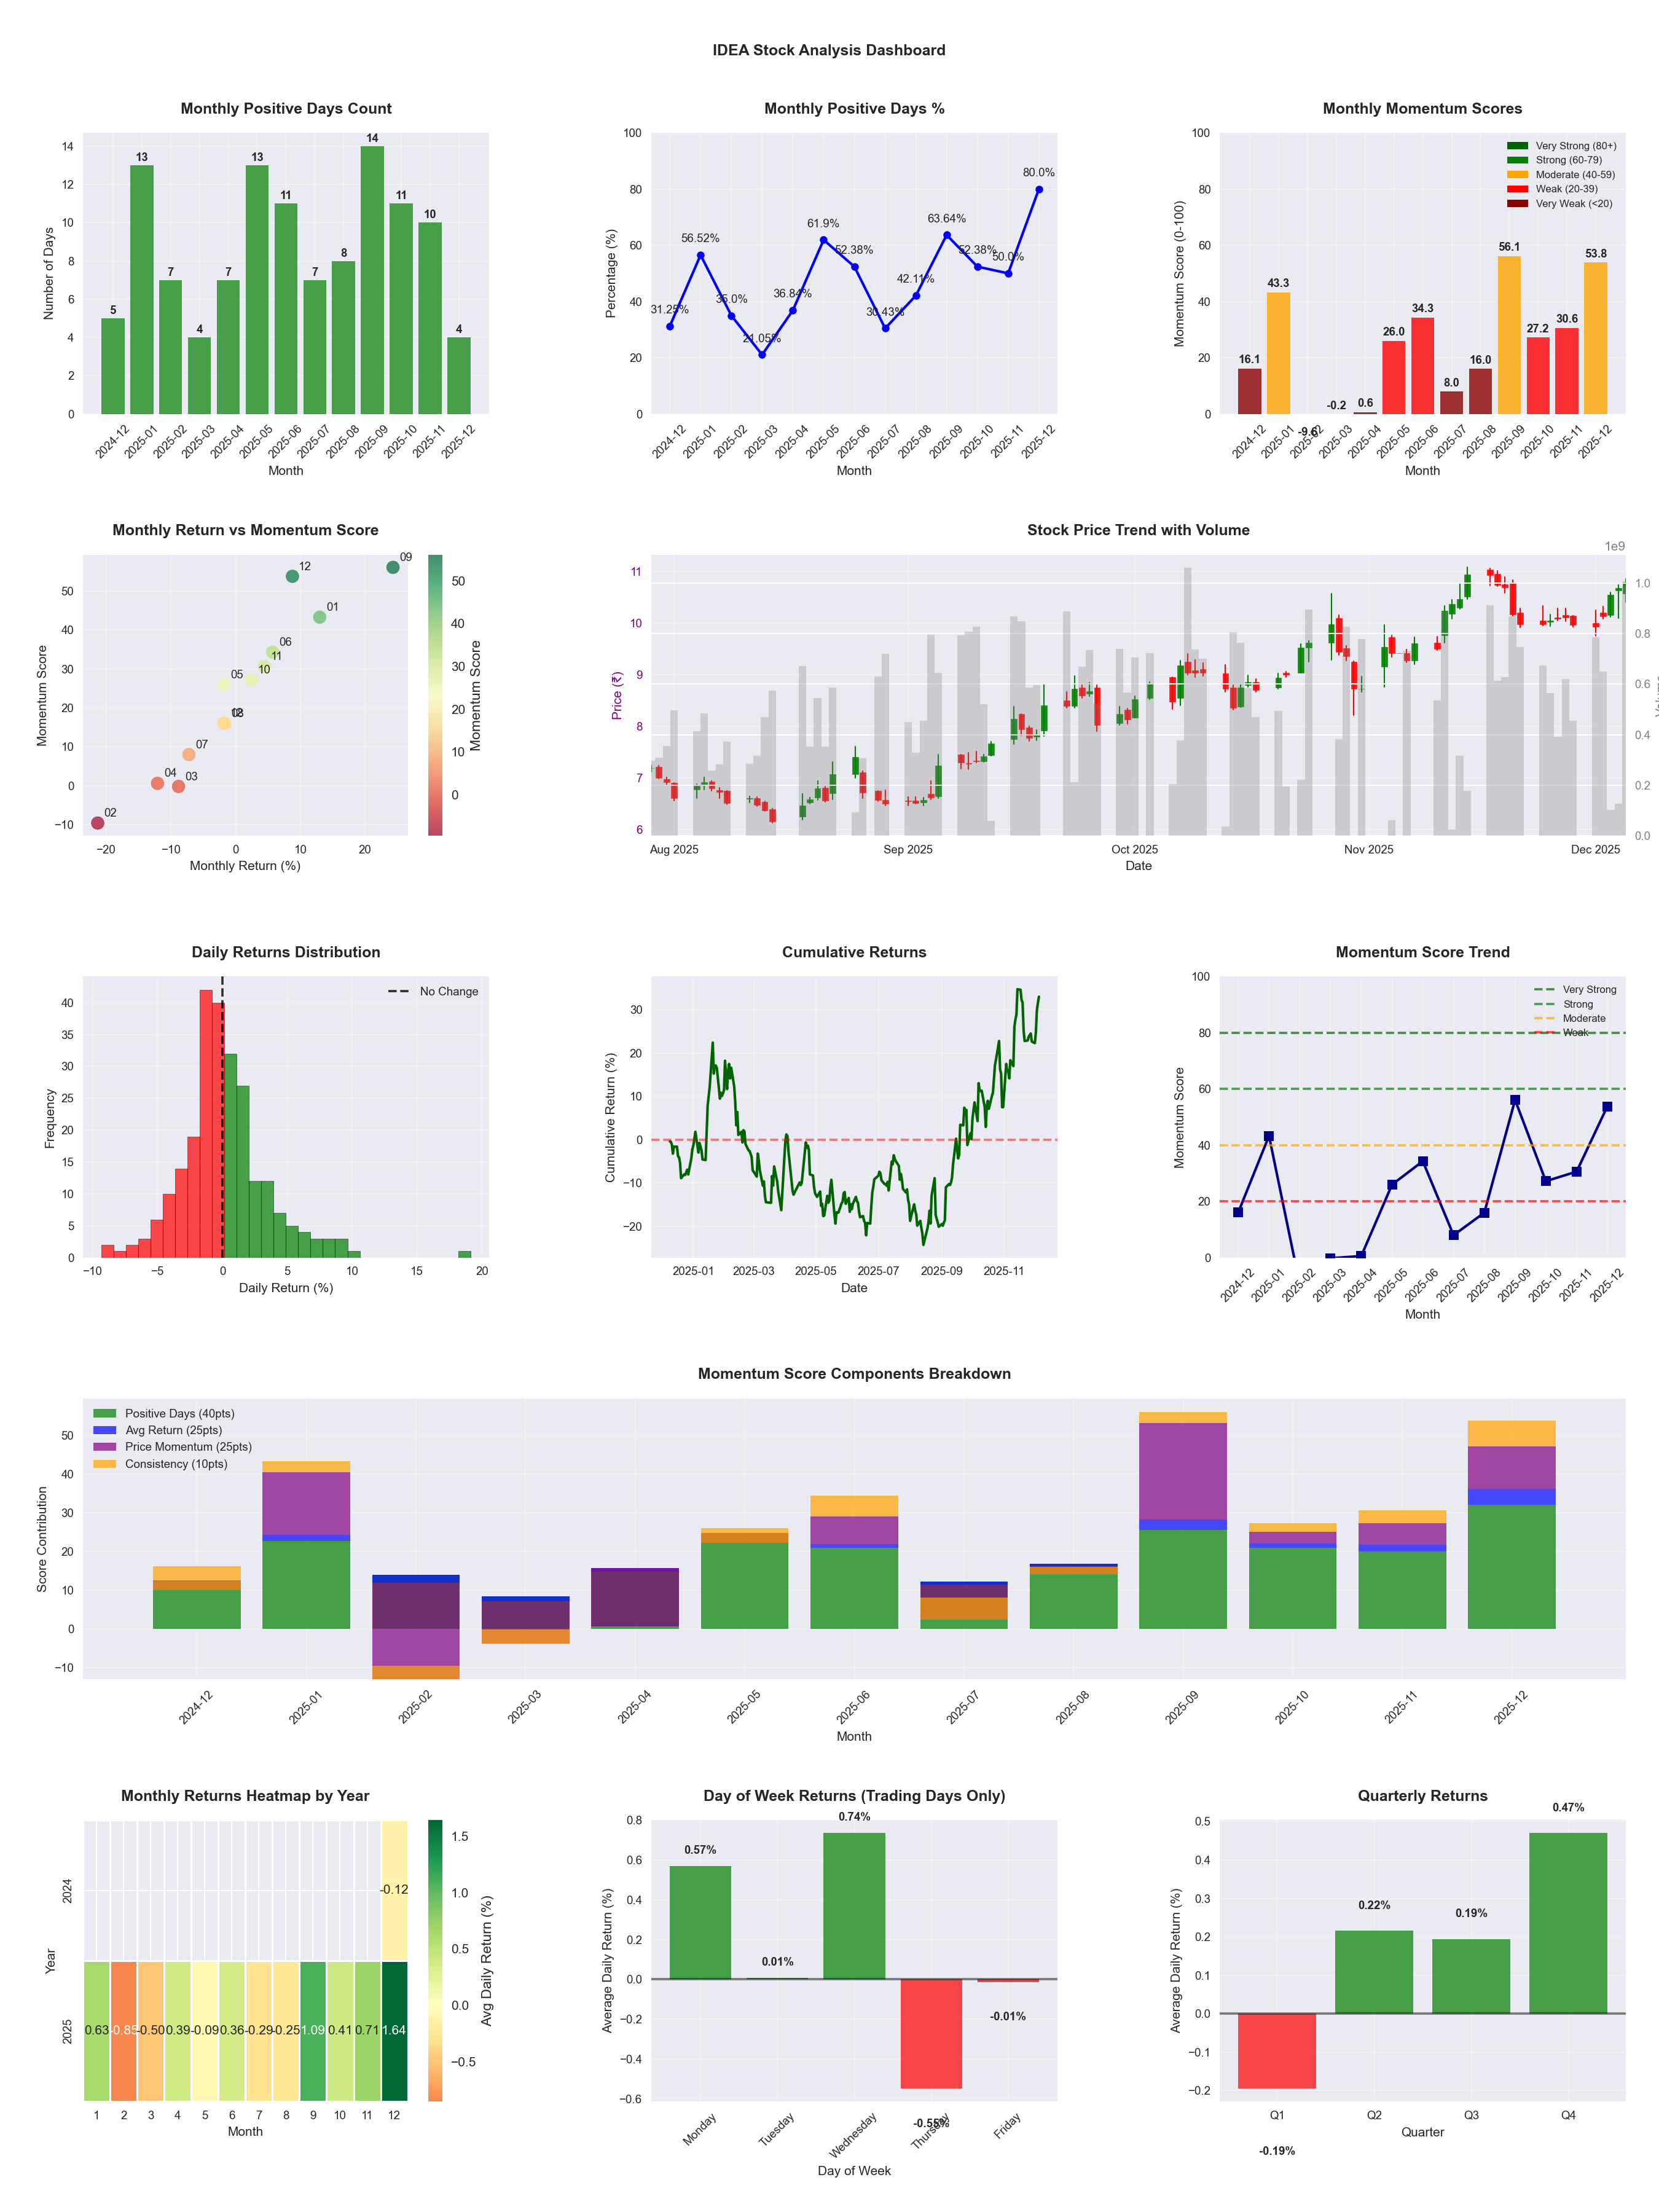
📊 Key Insights & Metrics
Symbol
📈 IDEA
Date
📅 2026-04-11
Volatility
🔴 3.23%
Risk Profile
⚠️ suitable for aggressive investors
Win Rate
⚠️ 47.6%
Avg Daily Return
📈 +0.16%
Max Drawdown
📉 -29.27%
IBD RS Score
📊 69.4
Average
Market Rank
#151
Best Month
🏆 2025-09
Best Months to Trade
📅 Sep, Nov, Apr
Best Days to Trade
📅 Monday, Wednesday
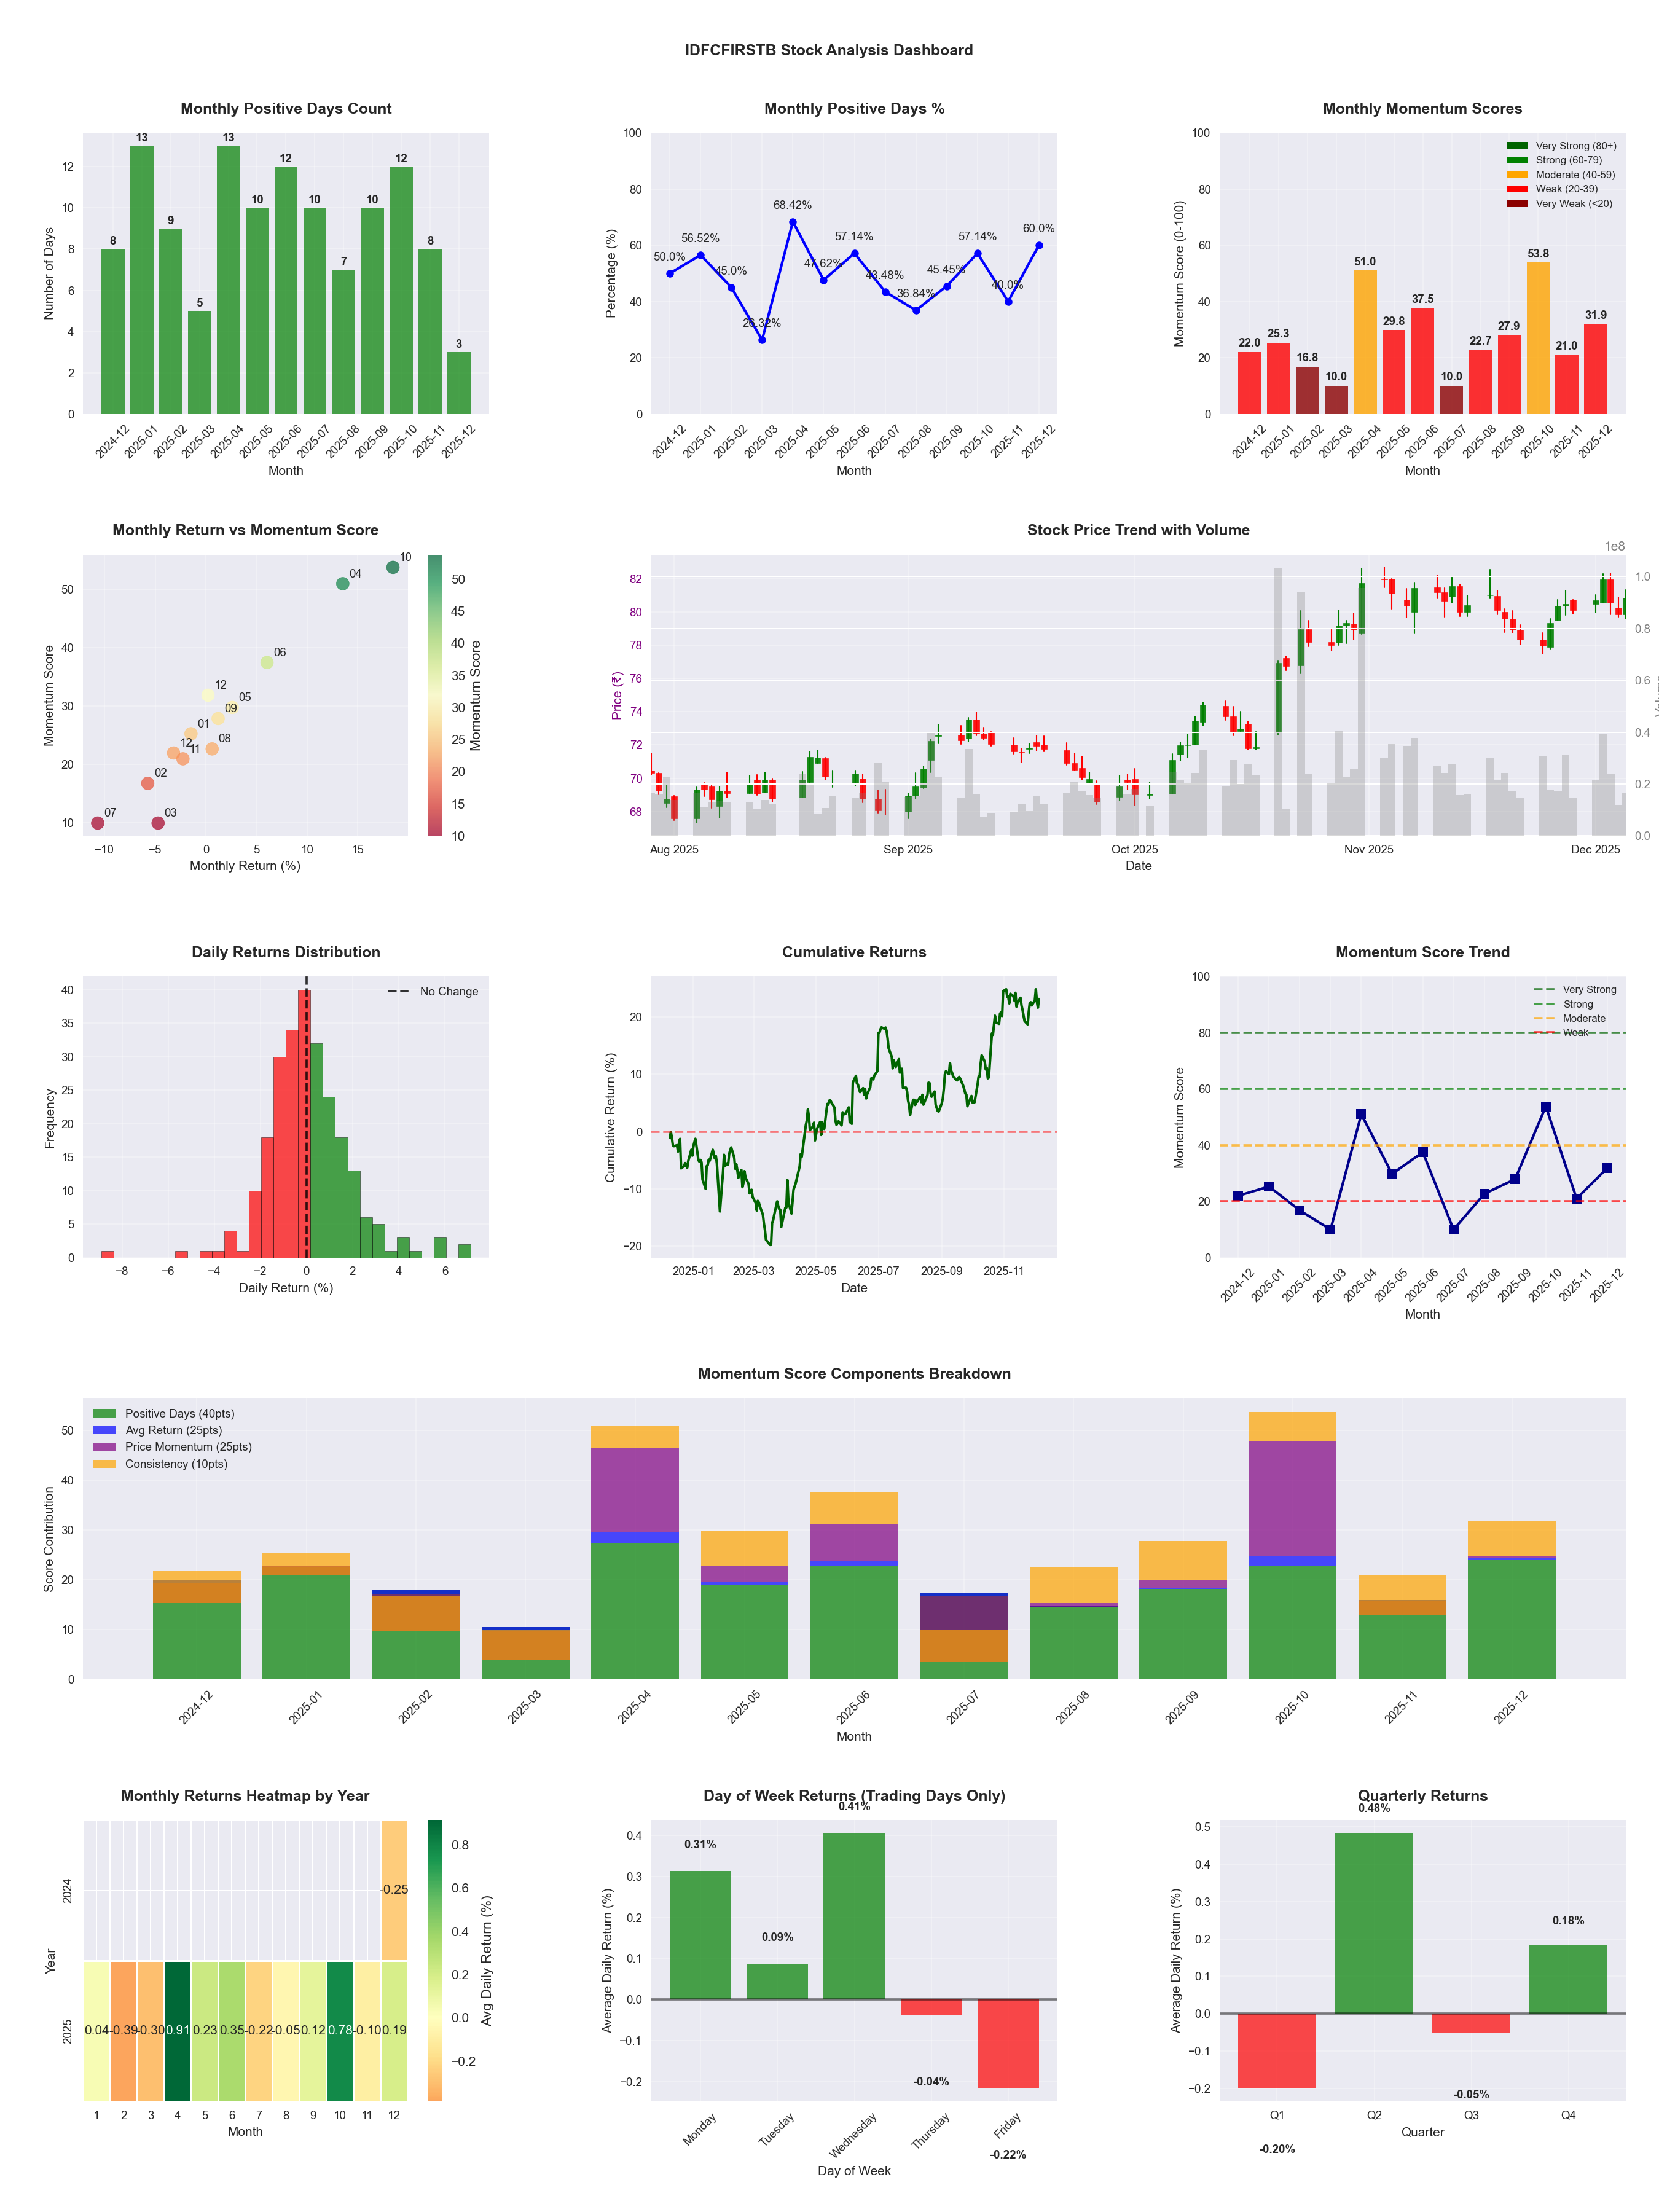
📊 Key Insights & Metrics
Symbol
📈 IDFCFIRSTB
Date
📅 2026-04-11
Volatility
🟡 2.04%
Risk Profile
⚠️ suitable for aggressive investors
Win Rate
⚠️ 49.2%
Avg Daily Return
📈 +0.06%
Max Drawdown
📉 -31.63%
IBD RS Score
📊 32.7
Weak
Market Rank
#332
Best Month
🏆 2026-04
Best Months to Trade
📅 Apr, Oct, Jun
Best Days to Trade
📅 Tuesday, Wednesday
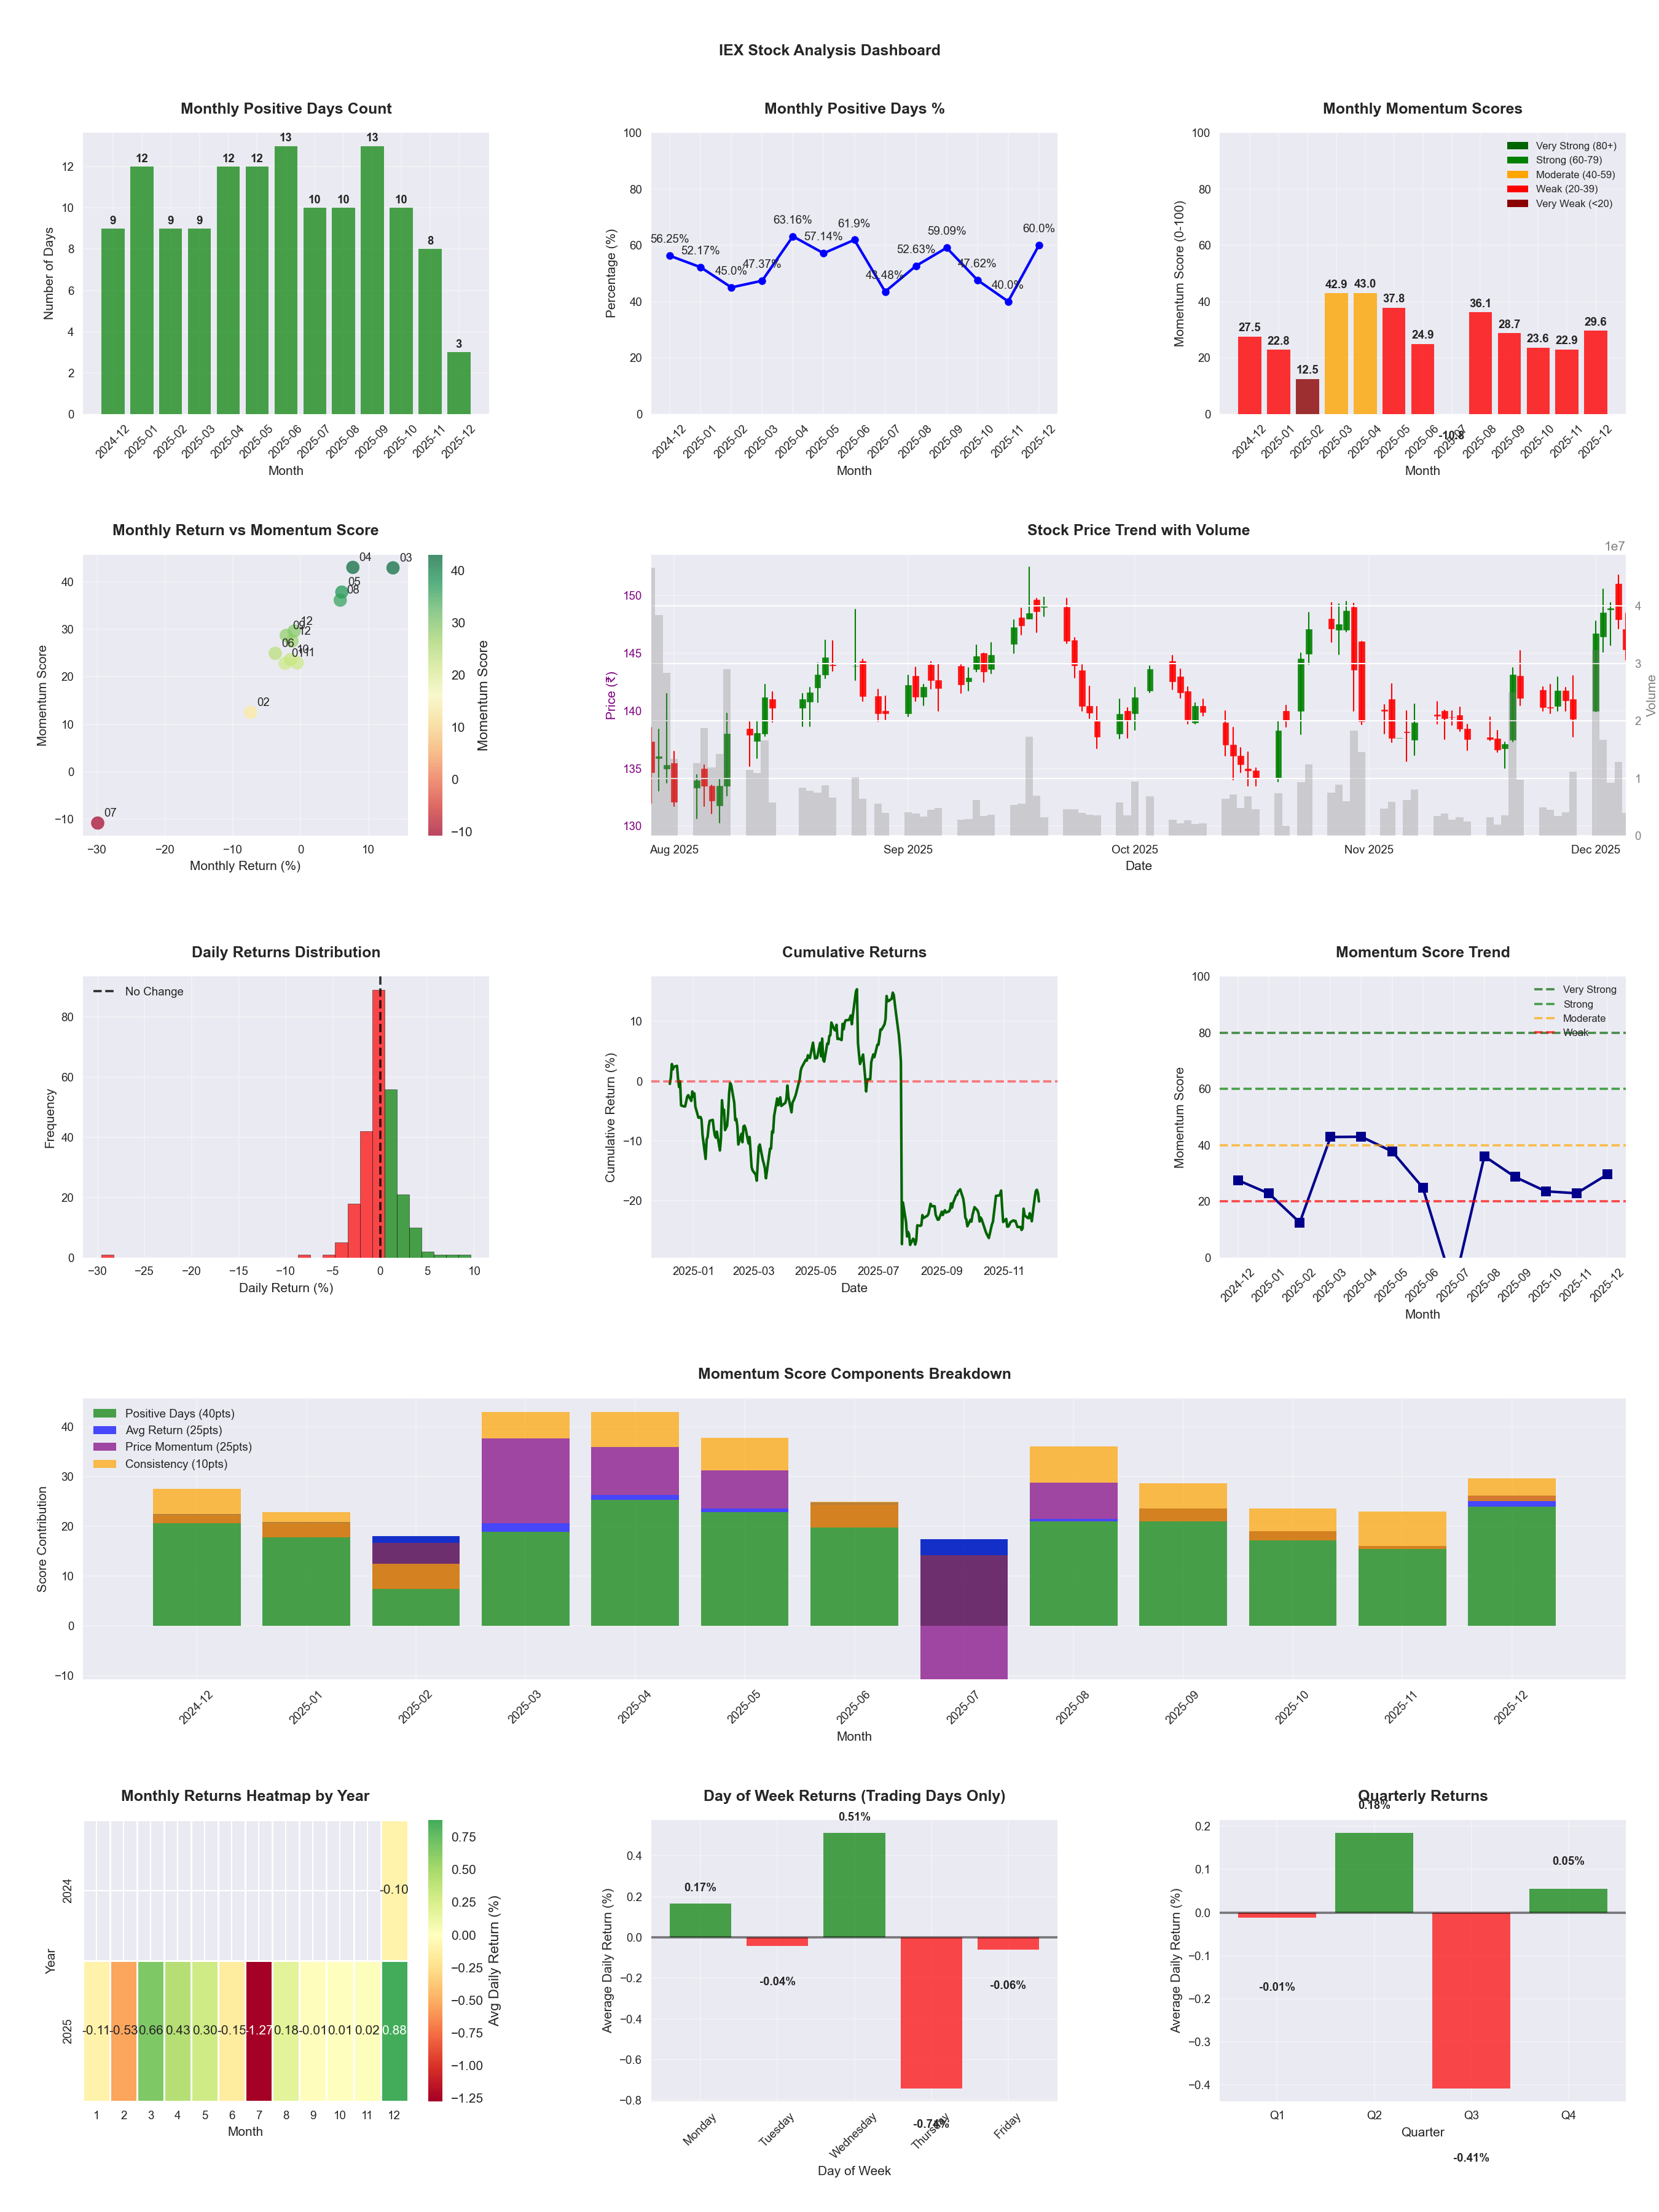
📊 Key Insights & Metrics
Symbol
📈 IEX
Date
📅 2026-04-11
Volatility
🟡 2.82%
Risk Profile
⚠️ suitable for aggressive investors
Win Rate
⚠️ 50.0%
Avg Daily Return
📉 -0.08%
Max Drawdown
📉 -44.70%
IBD RS Score
📊 22.5
Weak
Market Rank
#382
Best Month
🏆 2026-04
Best Months to Trade
📅 Apr, May, Aug
Best Days to Trade
📅 Wednesday, Monday
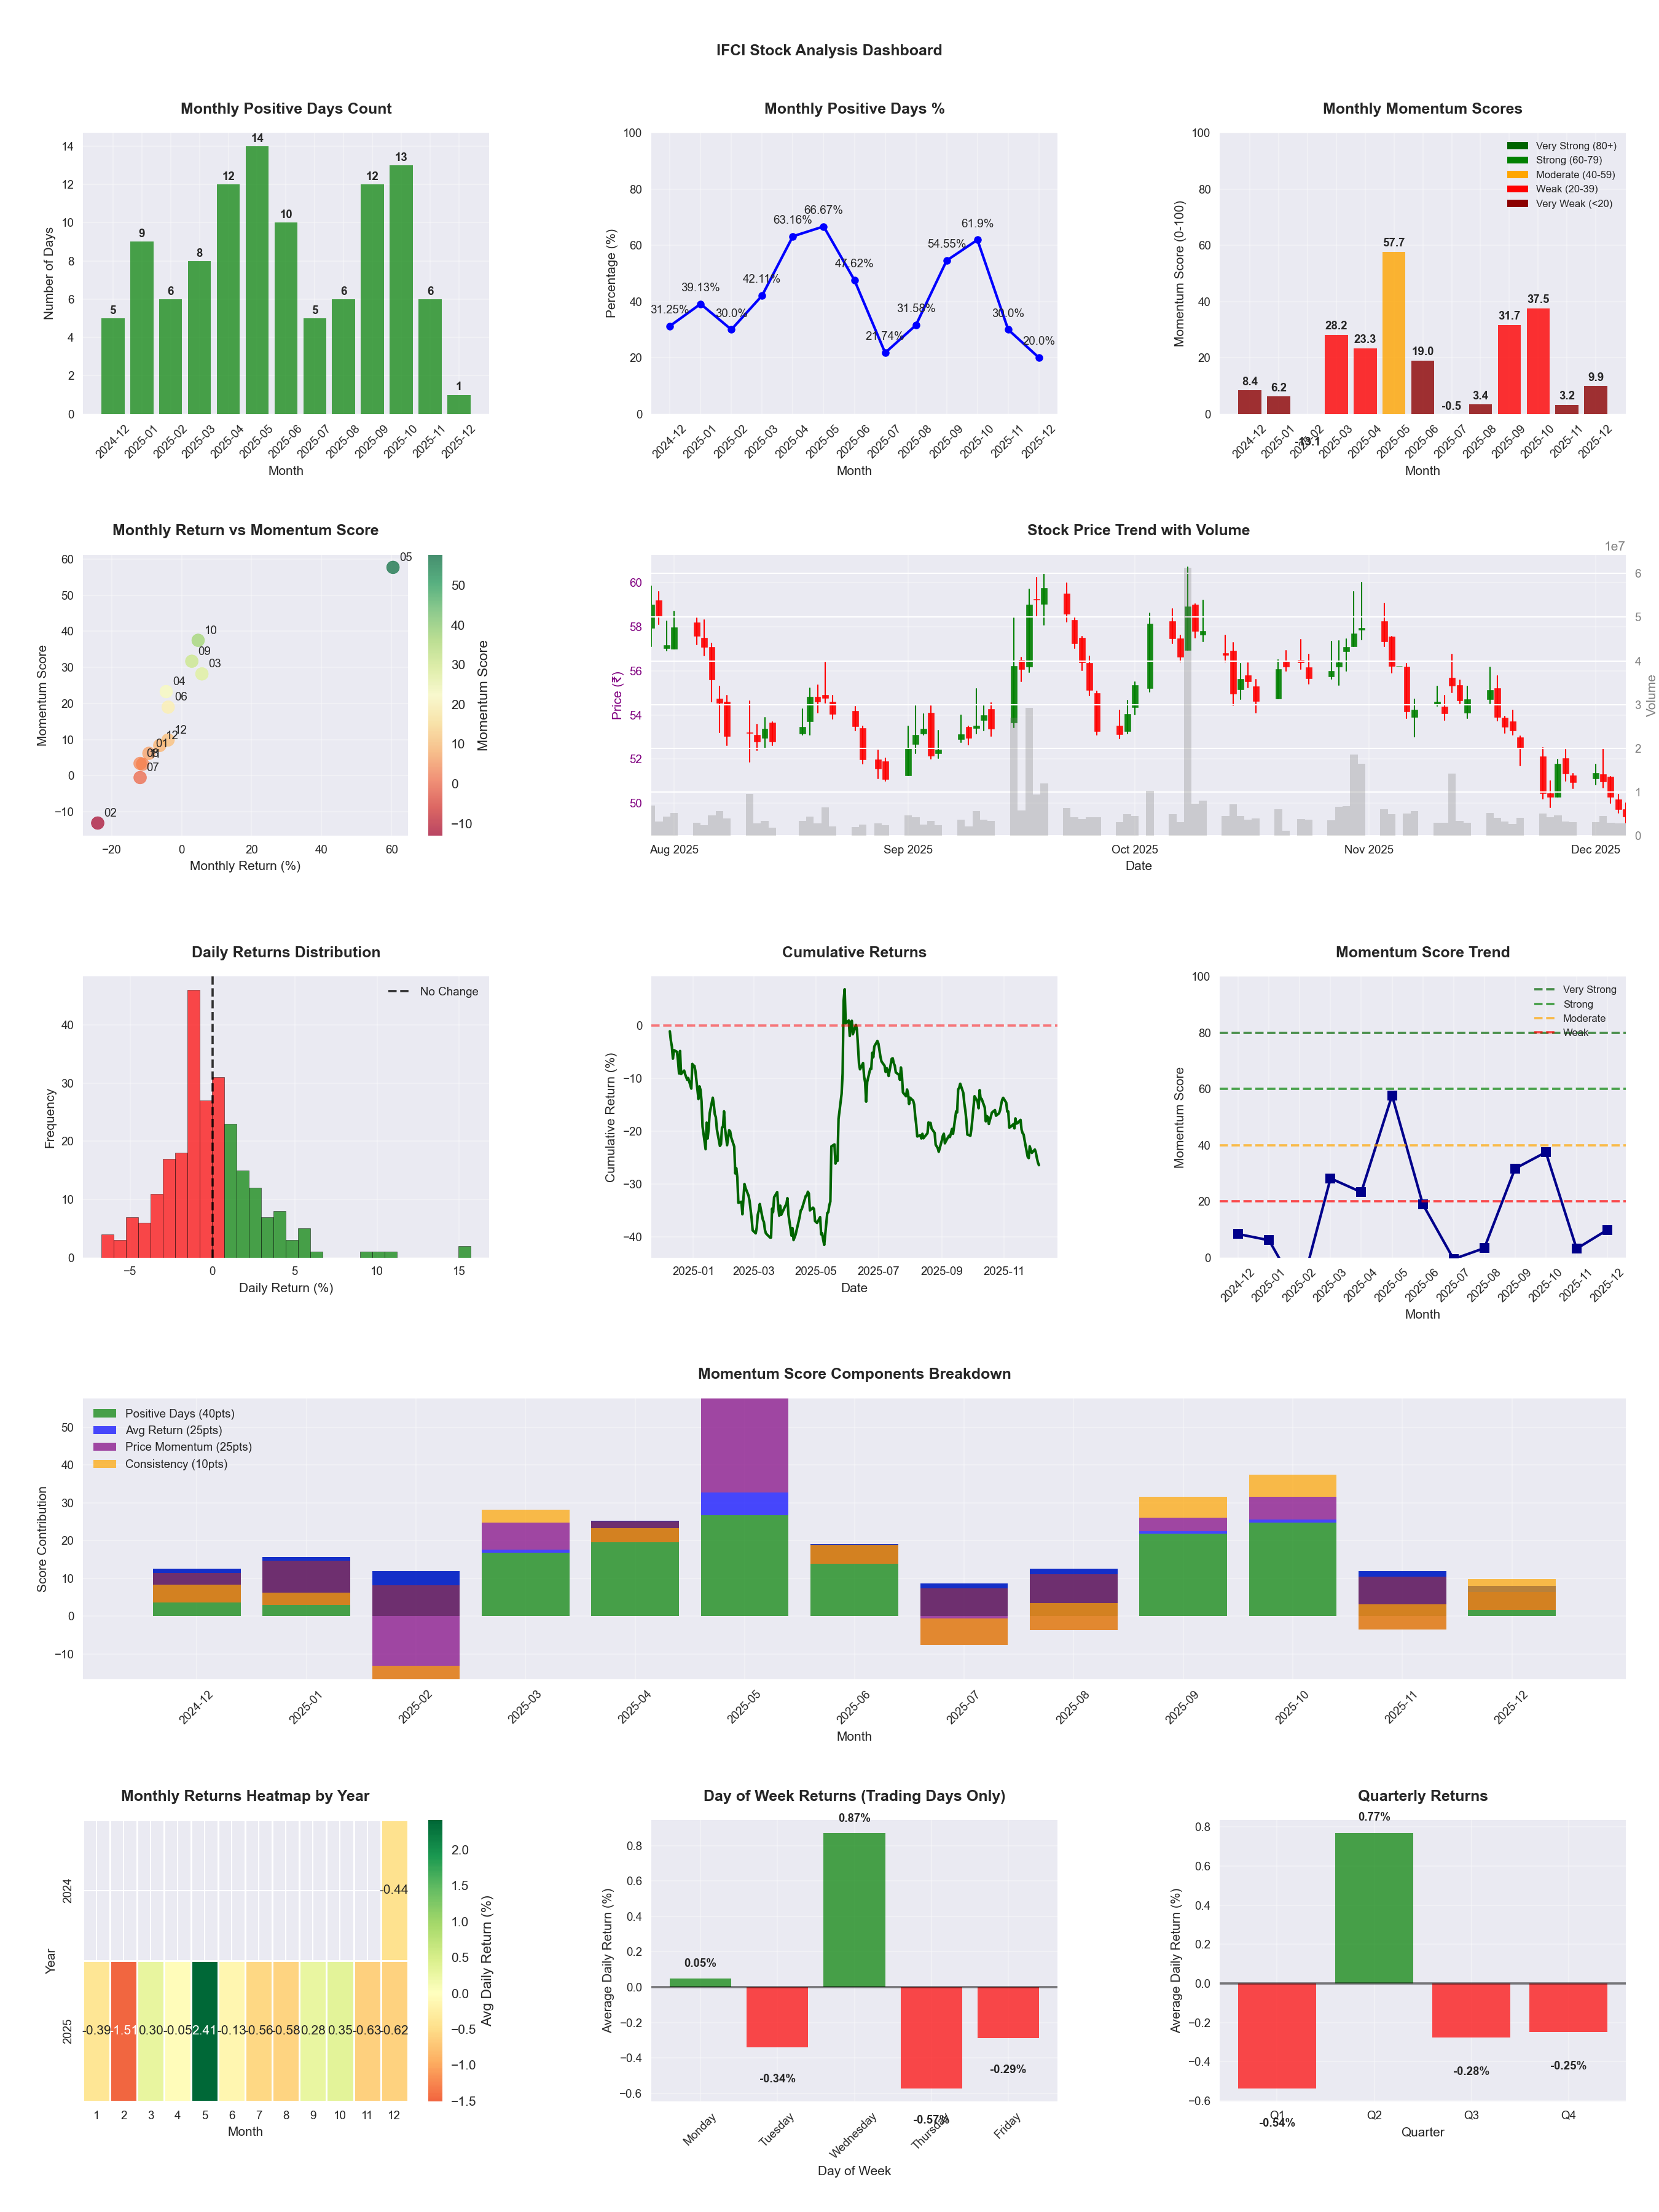
📊 Key Insights & Metrics
Symbol
📈 IFCI
Date
📅 2026-04-11
Volatility
🔴 3.17%
Risk Profile
⚠️ suitable for aggressive investors
Win Rate
⚠️ 47.1%
Avg Daily Return
📈 +0.19%
Max Drawdown
📉 -34.77%
IBD RS Score
📊 78.5
Strong
Market Rank
#106
Best Month
🏆 2025-05
Best Months to Trade
📅 May, Apr, Feb
Best Days to Trade
📅 Wednesday, Monday
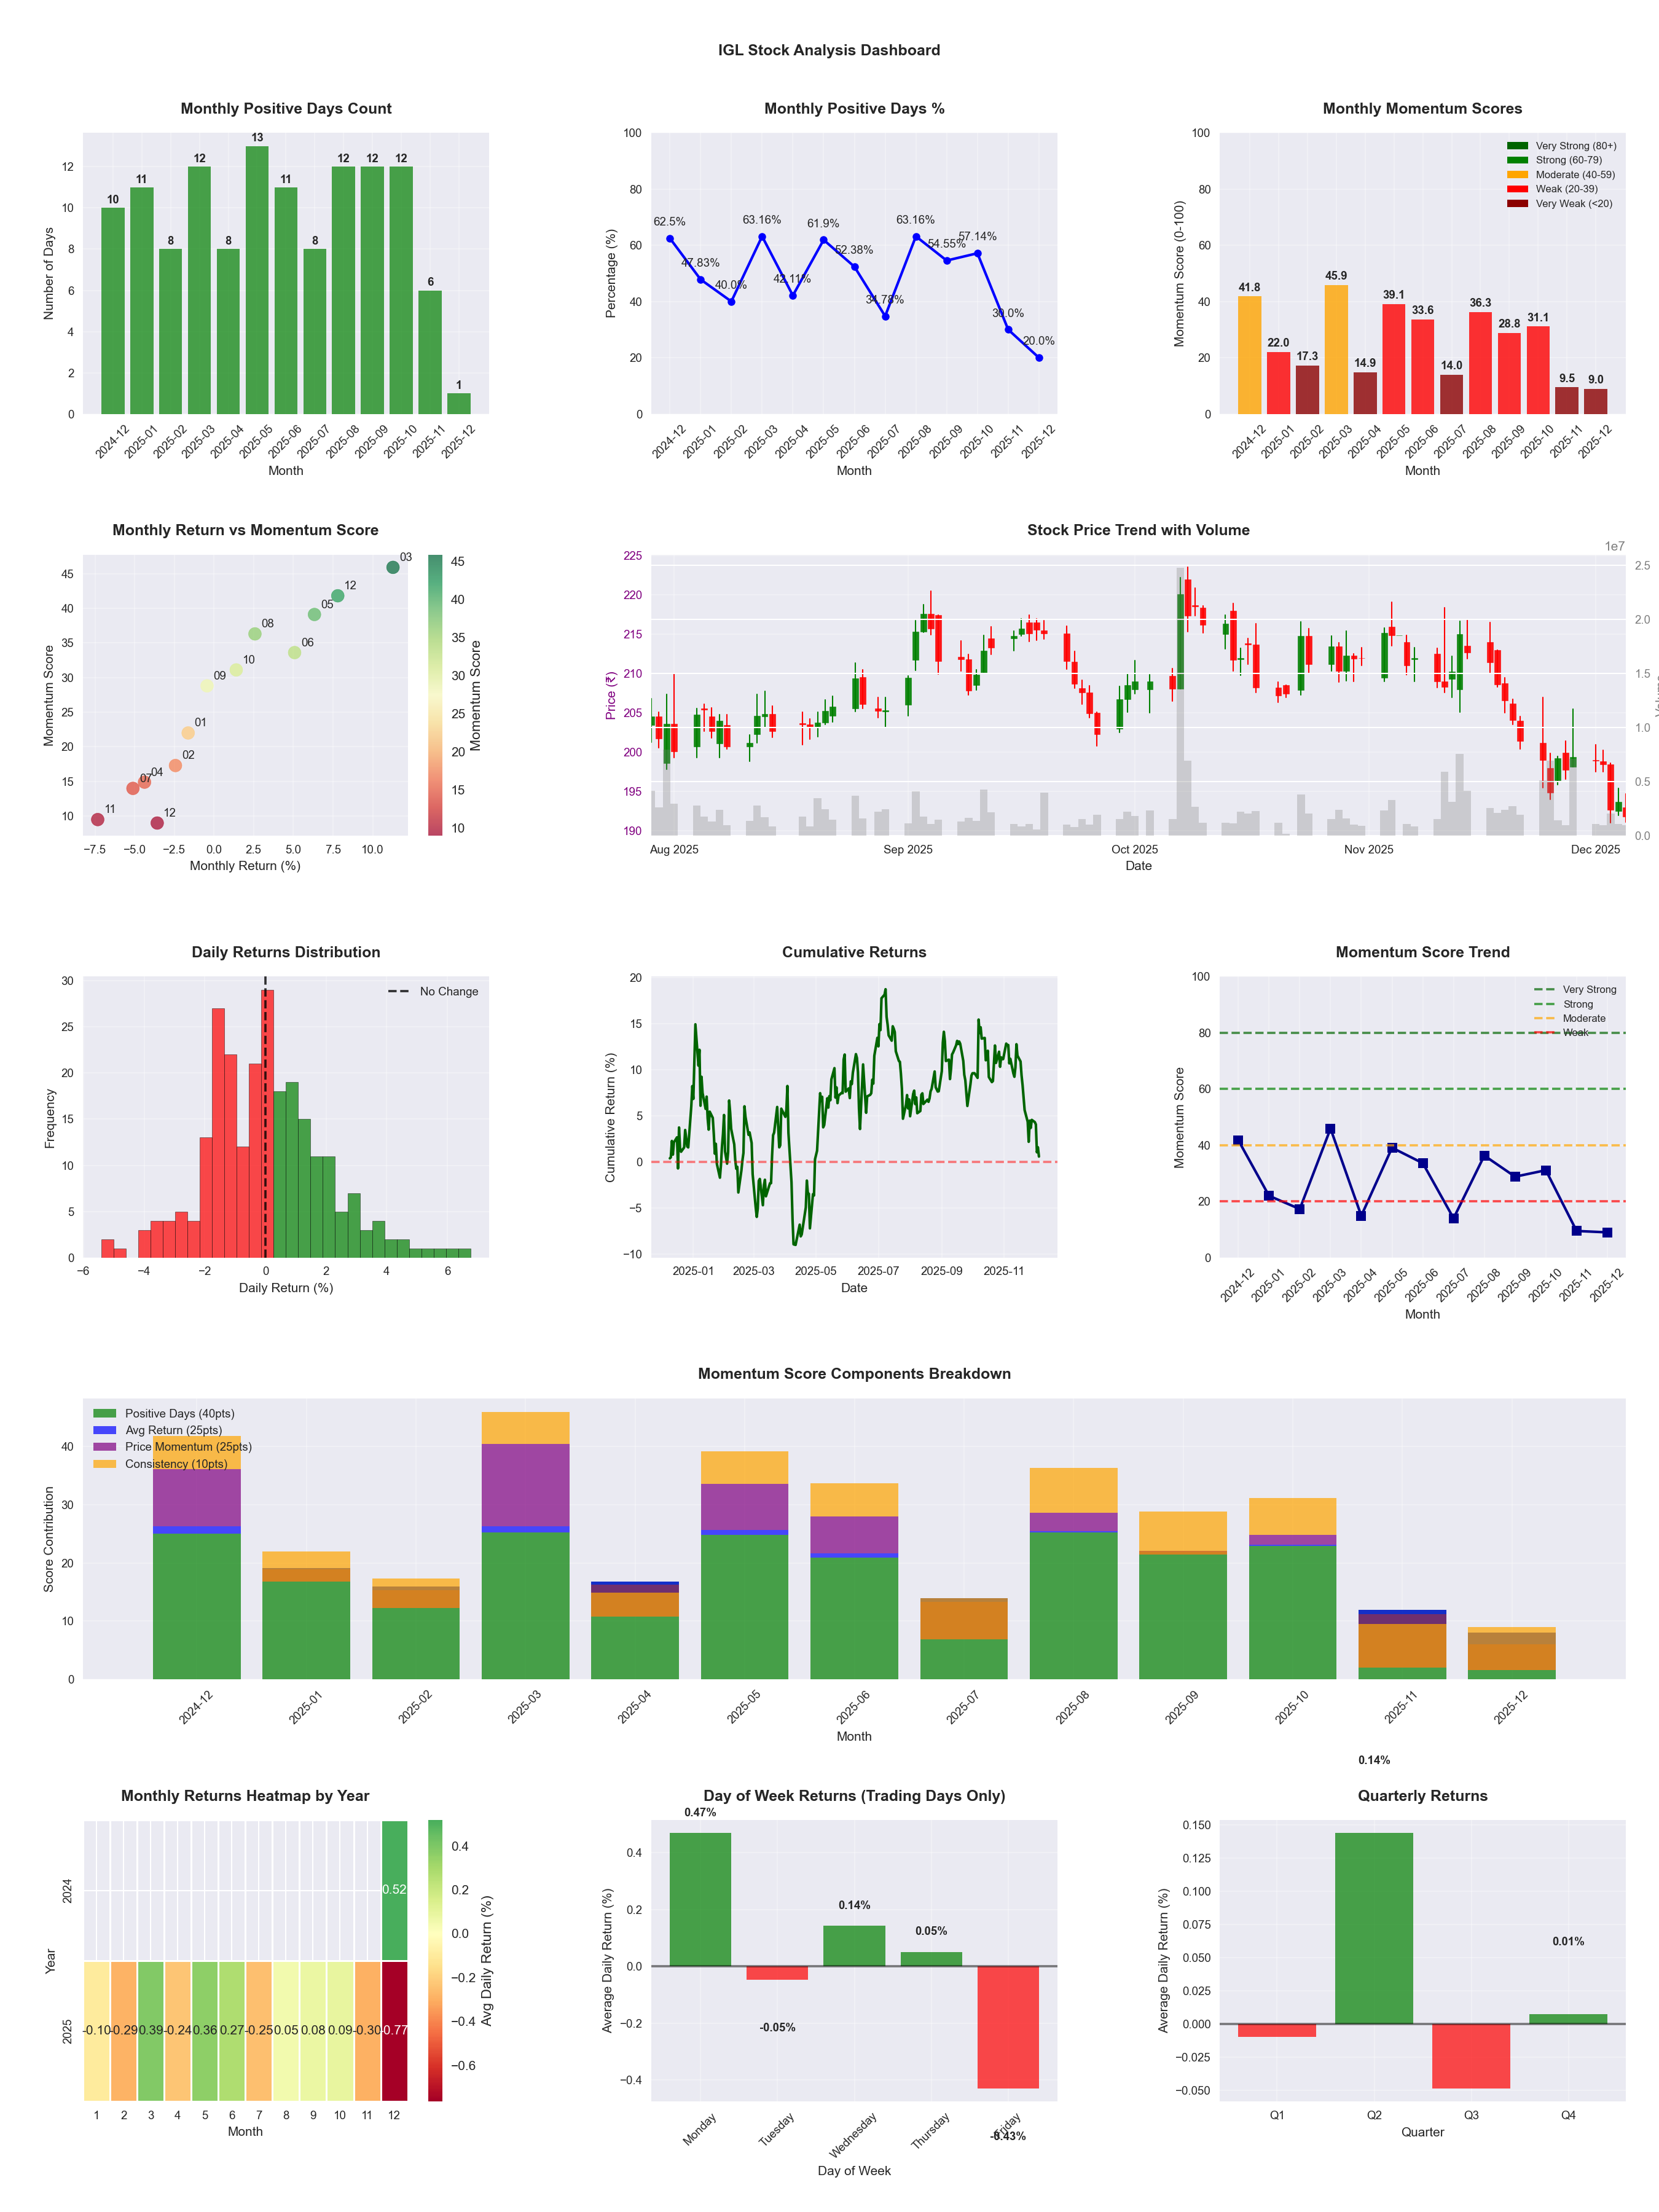
📊 Key Insights & Metrics
Symbol
📈 IGL
Date
📅 2026-04-11
Volatility
🟡 1.81%
Win Rate
⚠️ 46.8%
Avg Daily Return
📉 -0.01%
Max Drawdown
📉 -34.44%
IBD RS Score
📊 23.7
Weak
Market Rank
#376
Best Month
🏆 2026-04
Worst Month
📉 2026-03
Best Months to Trade
📅 Apr, May, Jun
Best Days to Trade
📅 Monday, Wednesday
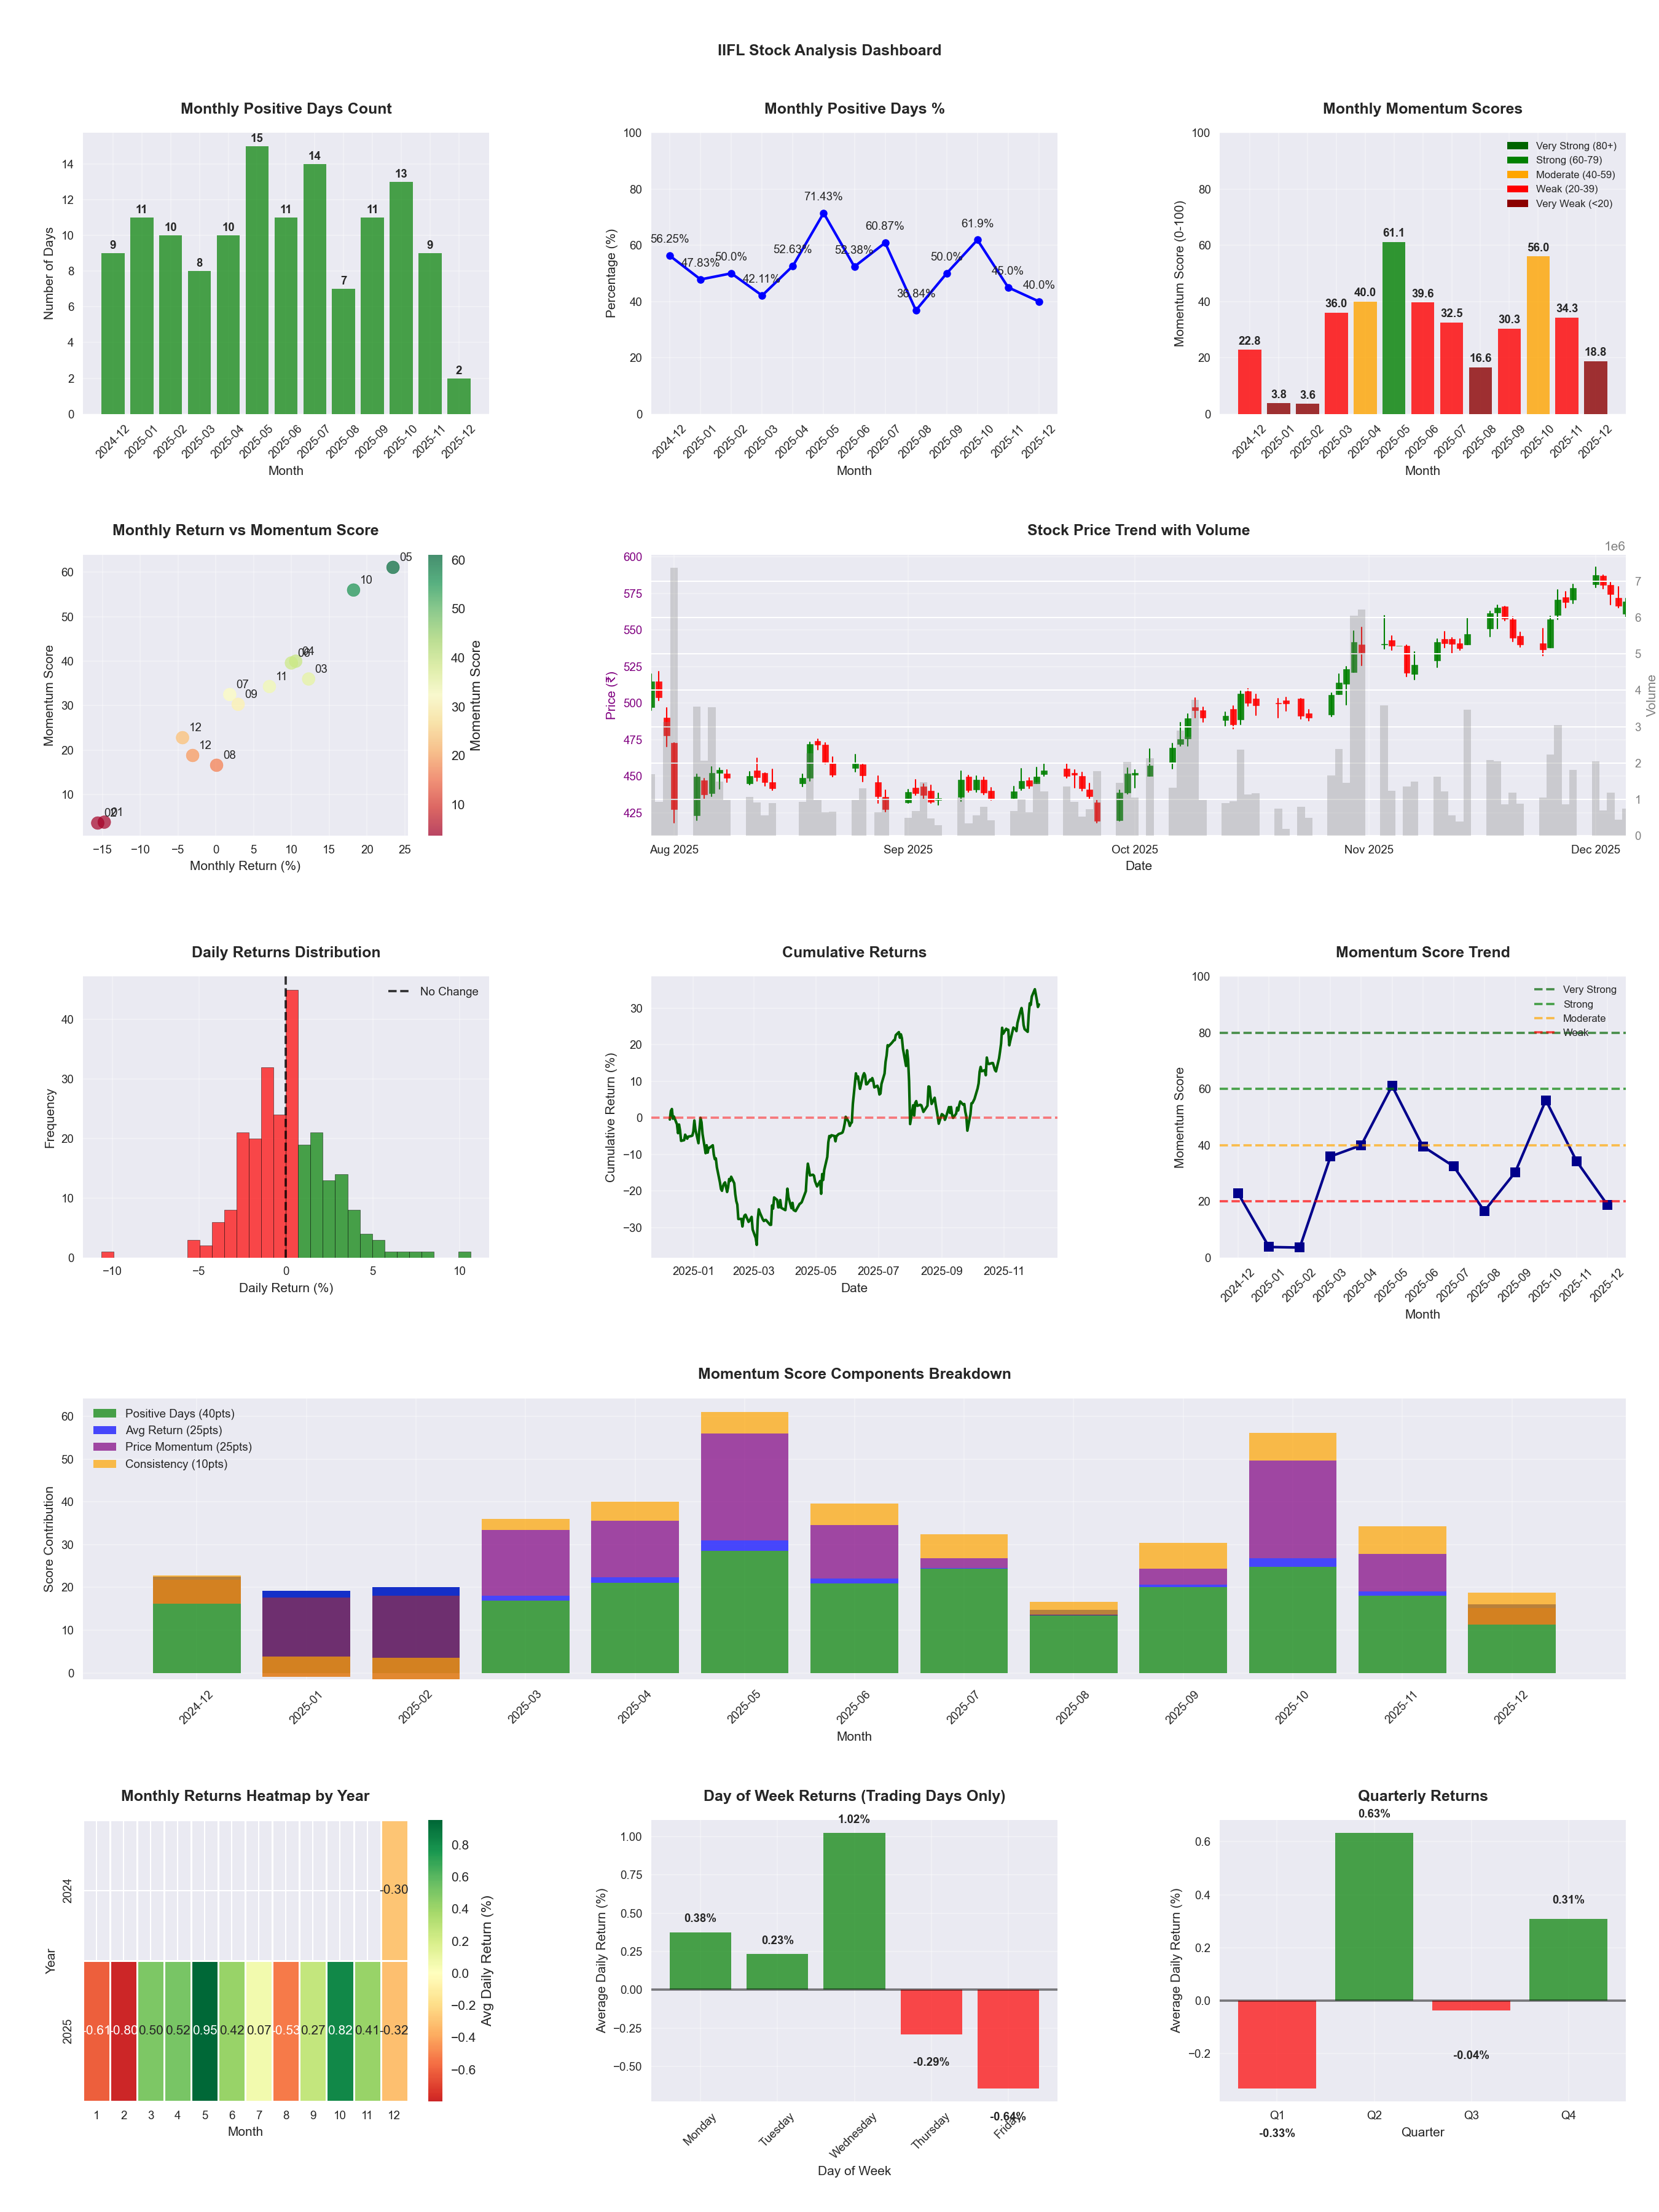
📊 Key Insights & Metrics
Symbol
📈 IIFL
Date
📅 2026-04-11
Volatility
🟡 2.46%
Risk Profile
⚠️ suitable for aggressive investors
Win Rate
⚠️ 51.6%
Avg Daily Return
📈 +0.17%
Max Drawdown
📉 -35.12%
IBD RS Score
📊 44.0
Weak
Market Rank
#276
Best Month
🏆 2025-05
Worst Month
📉 2026-03
Best Months to Trade
📅 May, Apr, Oct
Best Days to Trade
📅 Monday, Wednesday
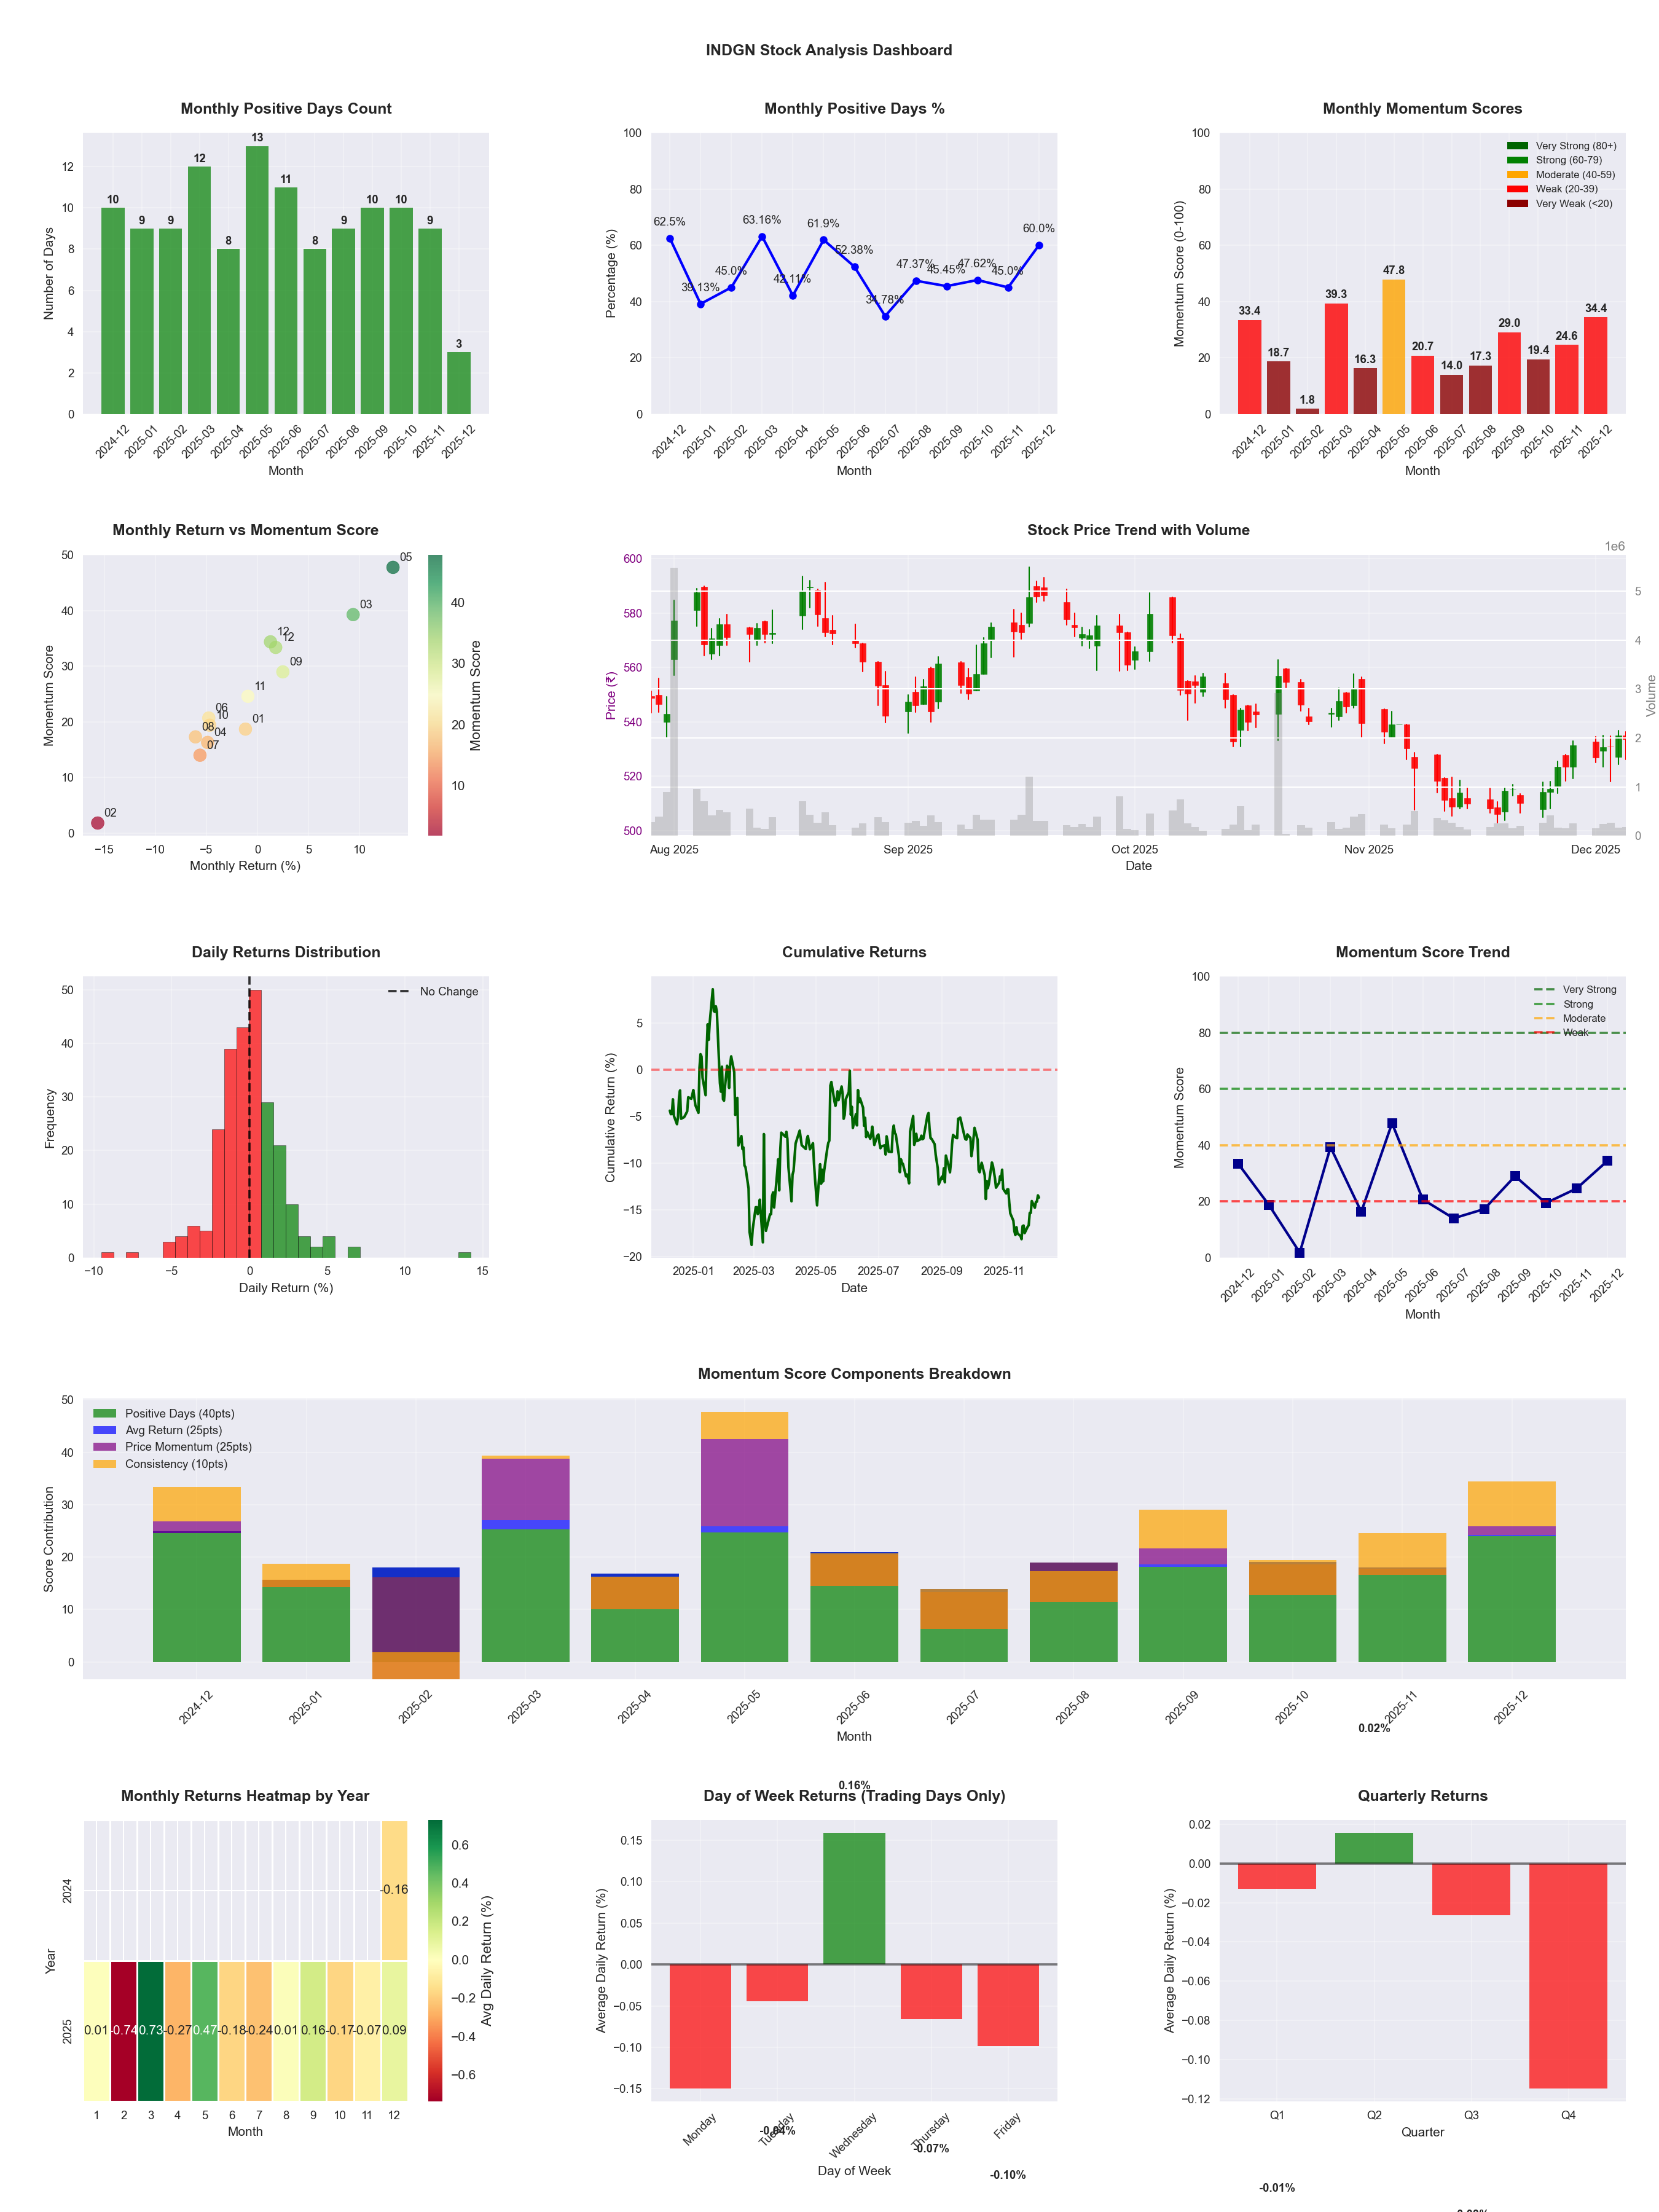
📊 Key Insights & Metrics
Symbol
📈 INDGN
Date
📅 2026-04-11
Volatility
🟡 1.76%
Win Rate
⚠️ 45.5%
Avg Daily Return
📉 -0.05%
Max Drawdown
📉 -31.43%
IBD RS Score
📊 40.6
Weak
Market Rank
#293
Best Month
🏆 2025-05
Worst Month
📉 2026-03
Best Months to Trade
📅 May, Apr, Sep
Best Days to Trade
📅 Wednesday, Thursday
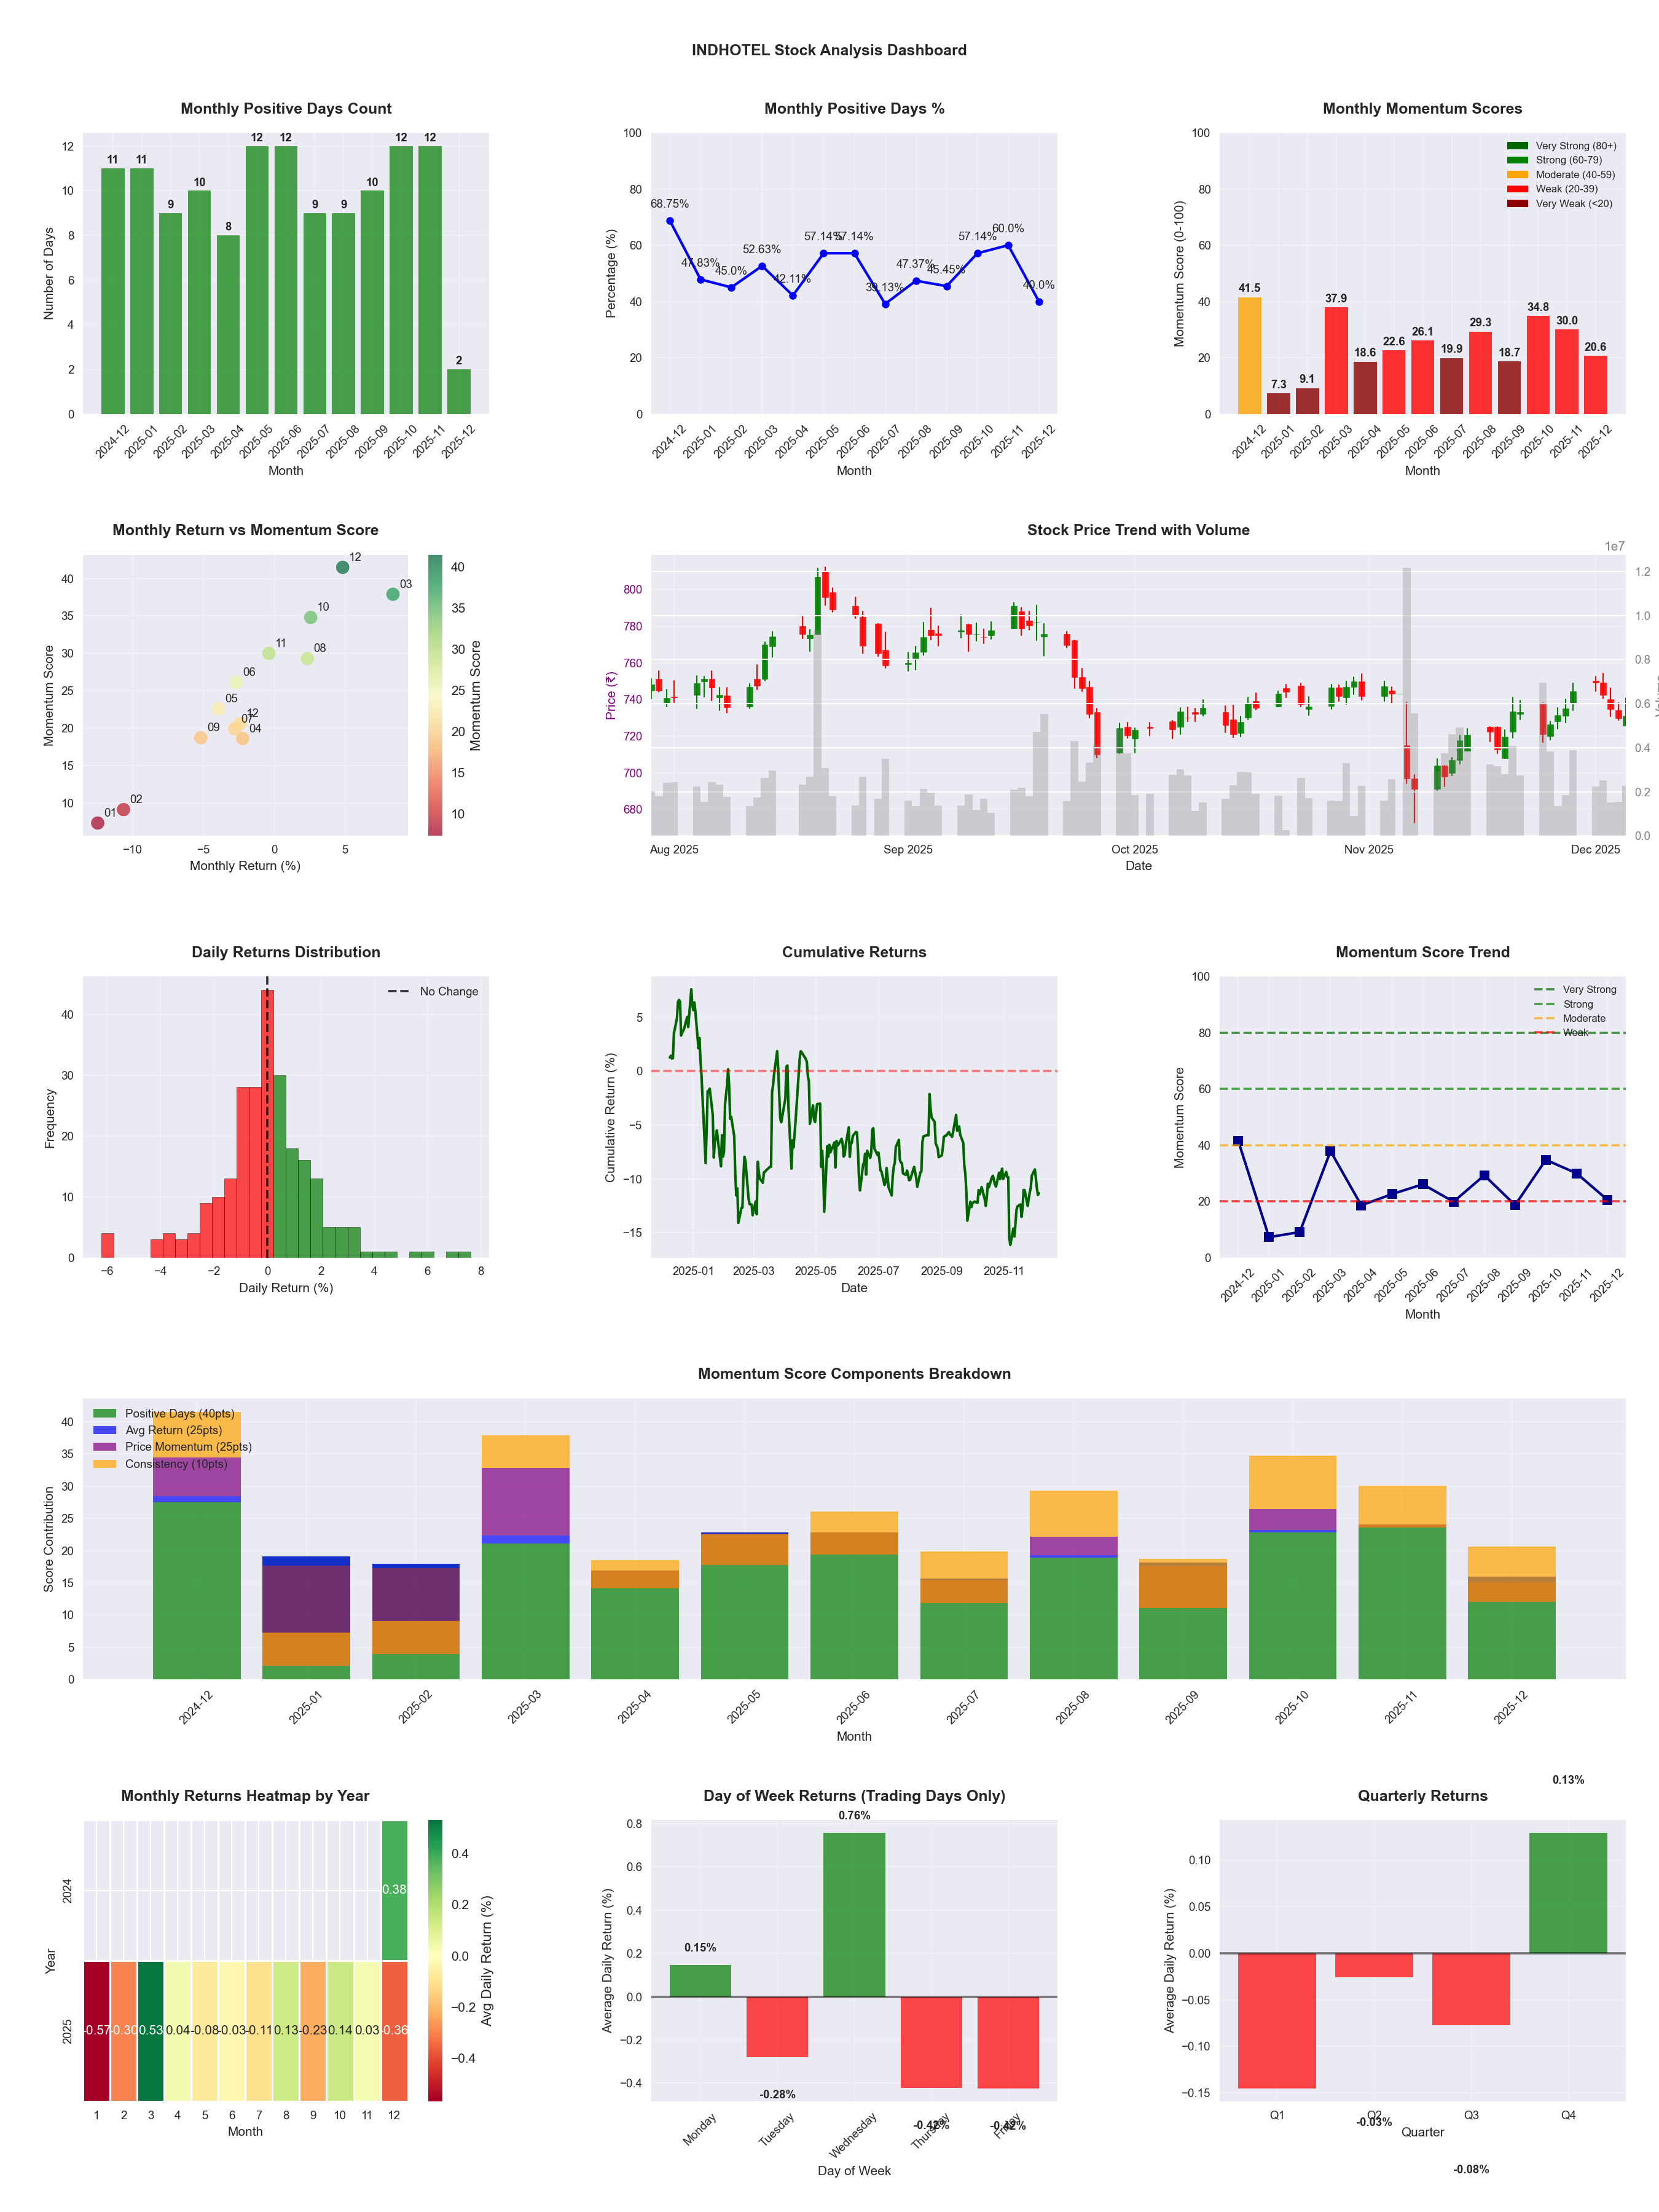
📊 Key Insights & Metrics
Symbol
📈 INDHOTEL
Date
📅 2026-04-11
Volatility
🟡 1.70%
Win Rate
⚠️ 50.4%
Avg Daily Return
📉 -0.07%
Max Drawdown
📉 -32.00%
IBD RS Score
📊 31.6
Weak
Market Rank
#337
Best Month
🏆 2026-04
Worst Month
📉 2026-03
Best Months to Trade
📅 Apr, Oct, Aug
Best Days to Trade
📅 Wednesday, Monday
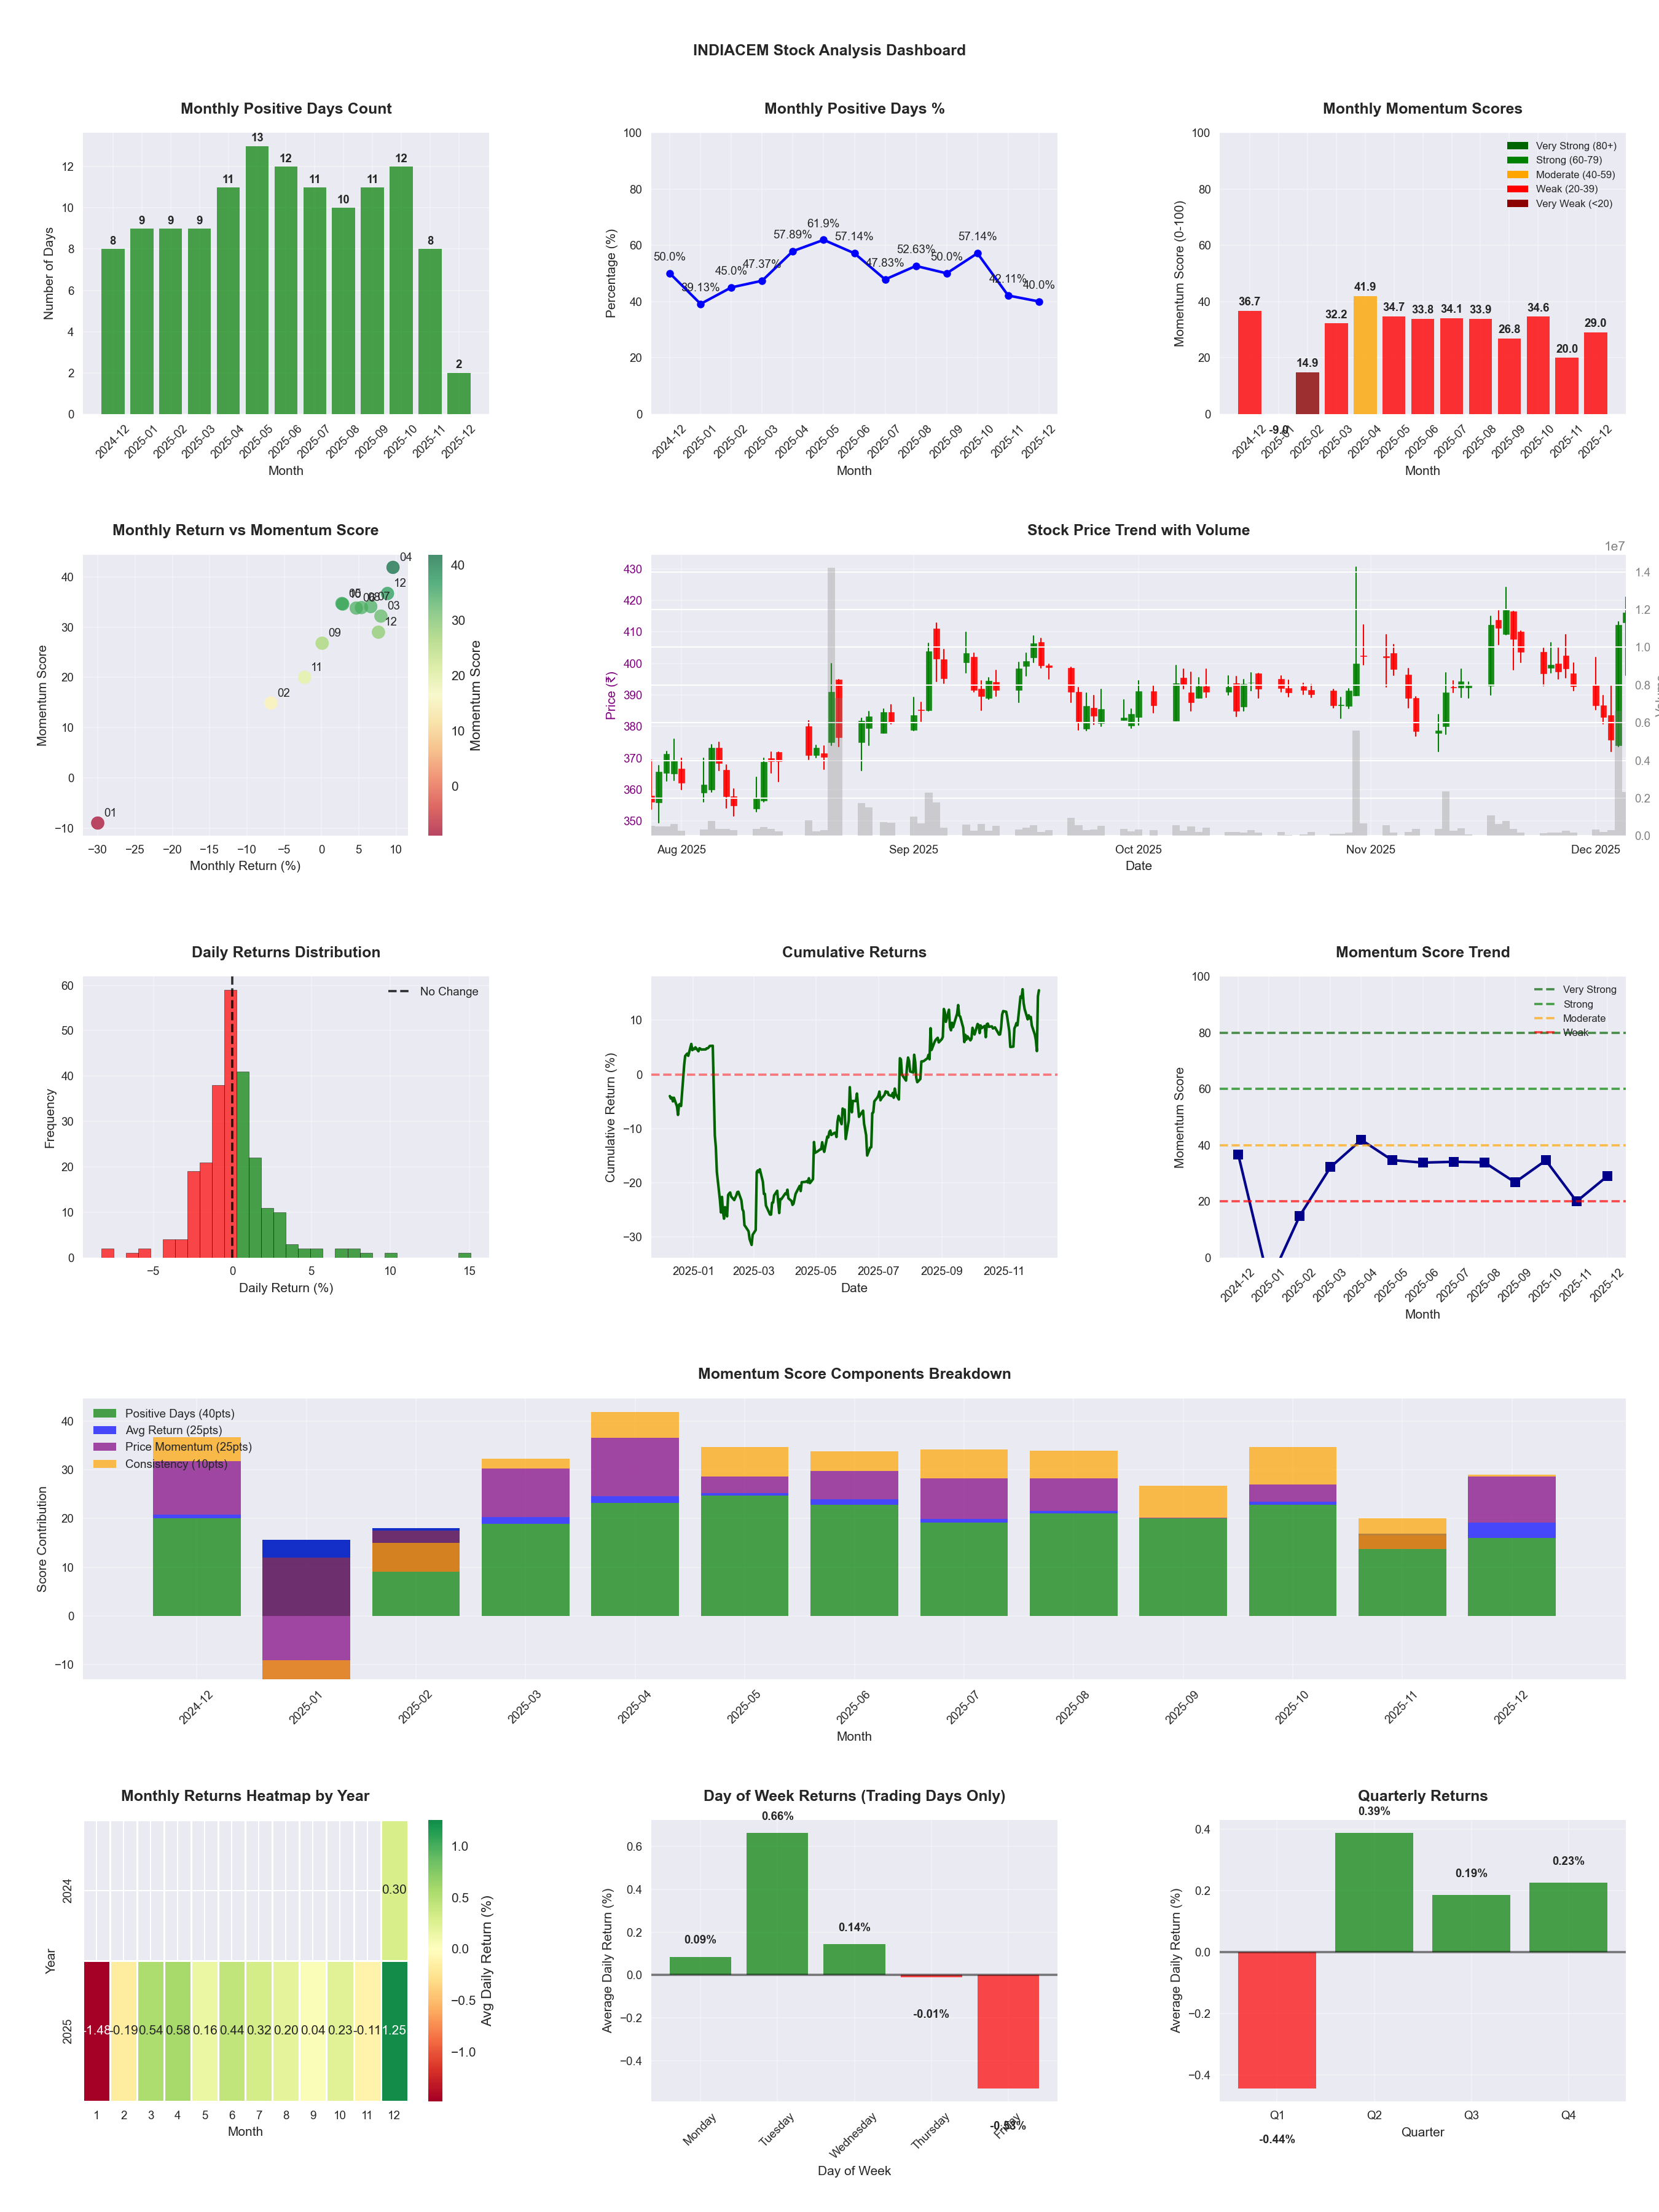
📊 Key Insights & Metrics
Symbol
📈 INDIACEM
Date
📅 2026-04-11
Volatility
🟡 2.20%
Risk Profile
⚠️ suitable for aggressive investors
Win Rate
⚠️ 53.2%
Avg Daily Return
📈 +0.15%
Max Drawdown
📉 -28.16%
IBD RS Score
📊 66.1
Average
Market Rank
#167
Best Month
🏆 2026-04
Worst Month
📉 2026-03
Best Months to Trade
📅 Apr, Dec, Jun
Best Days to Trade
📅 Tuesday, Wednesday
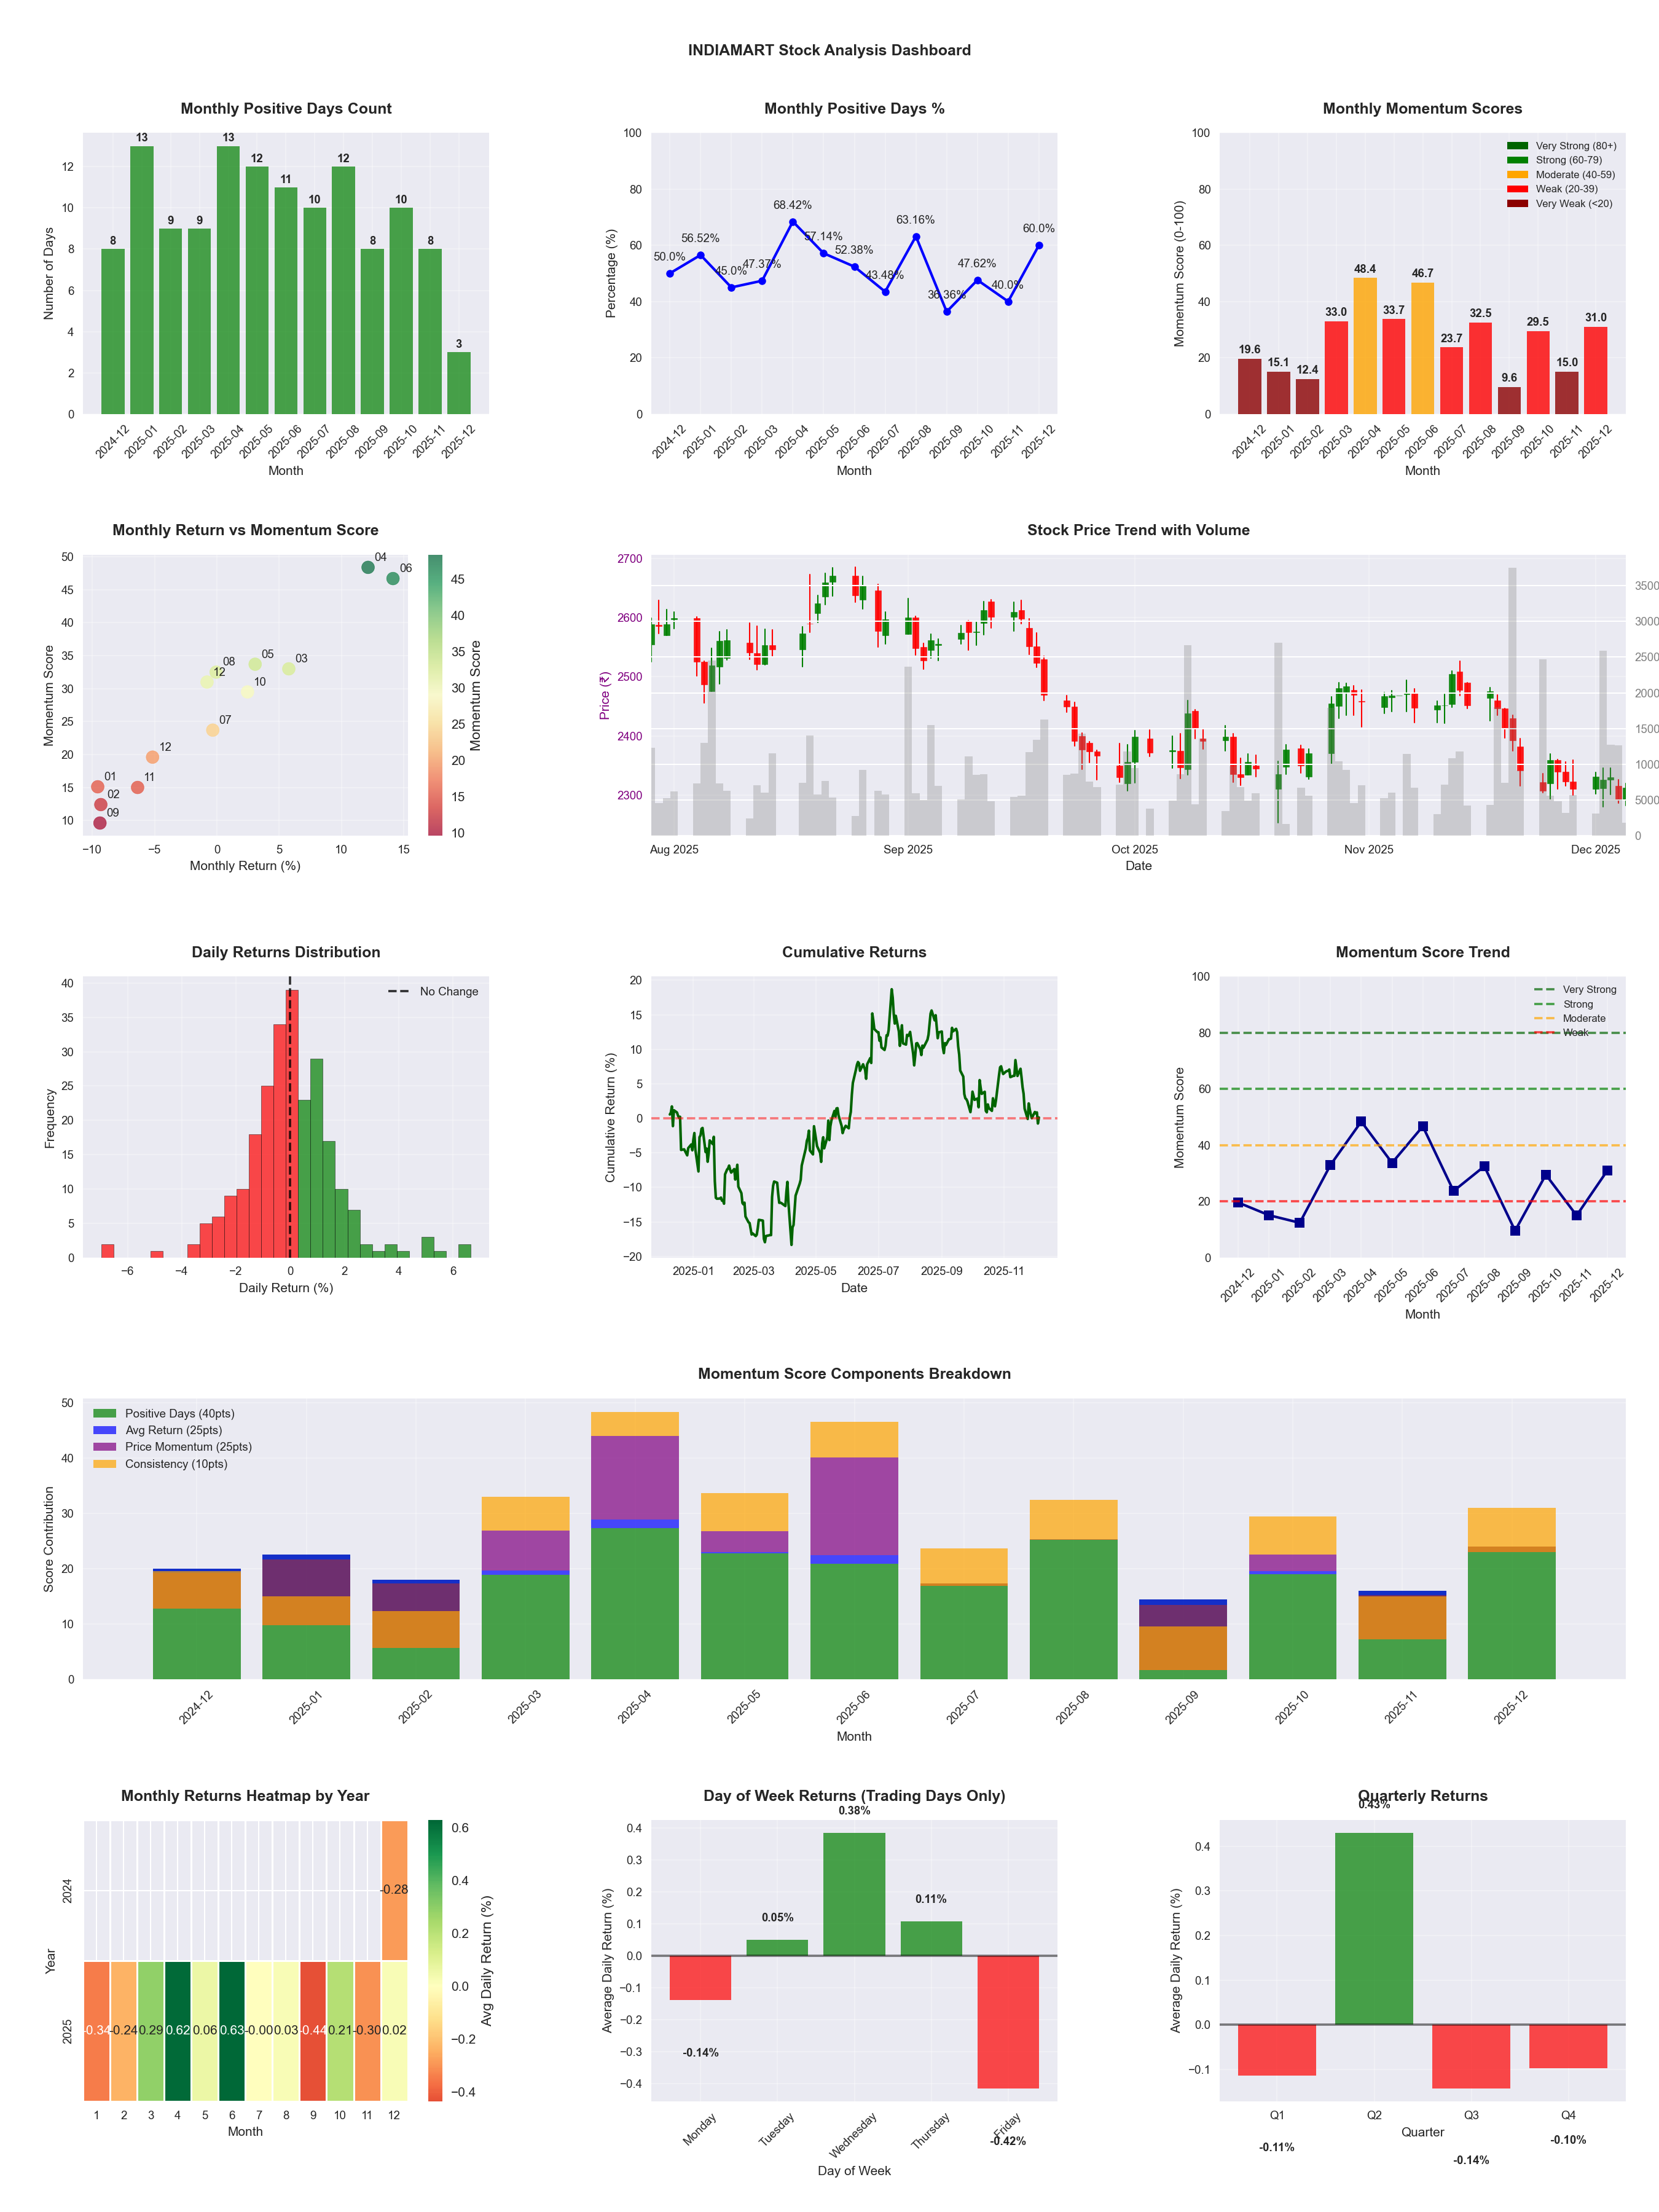
📊 Key Insights & Metrics
Symbol
📈 INDIAMART
Date
📅 2026-04-11
Volatility
🟡 1.63%
Win Rate
⚠️ 47.6%
Avg Daily Return
📈 +0.02%
Max Drawdown
📉 -28.37%
IBD RS Score
📊 43.6
Weak
Market Rank
#278
Best Month
🏆 2025-04
Worst Month
📉 2025-09
Best Months to Trade
📅 Apr, Jun, Oct
Best Days to Trade
📅 Wednesday, Monday
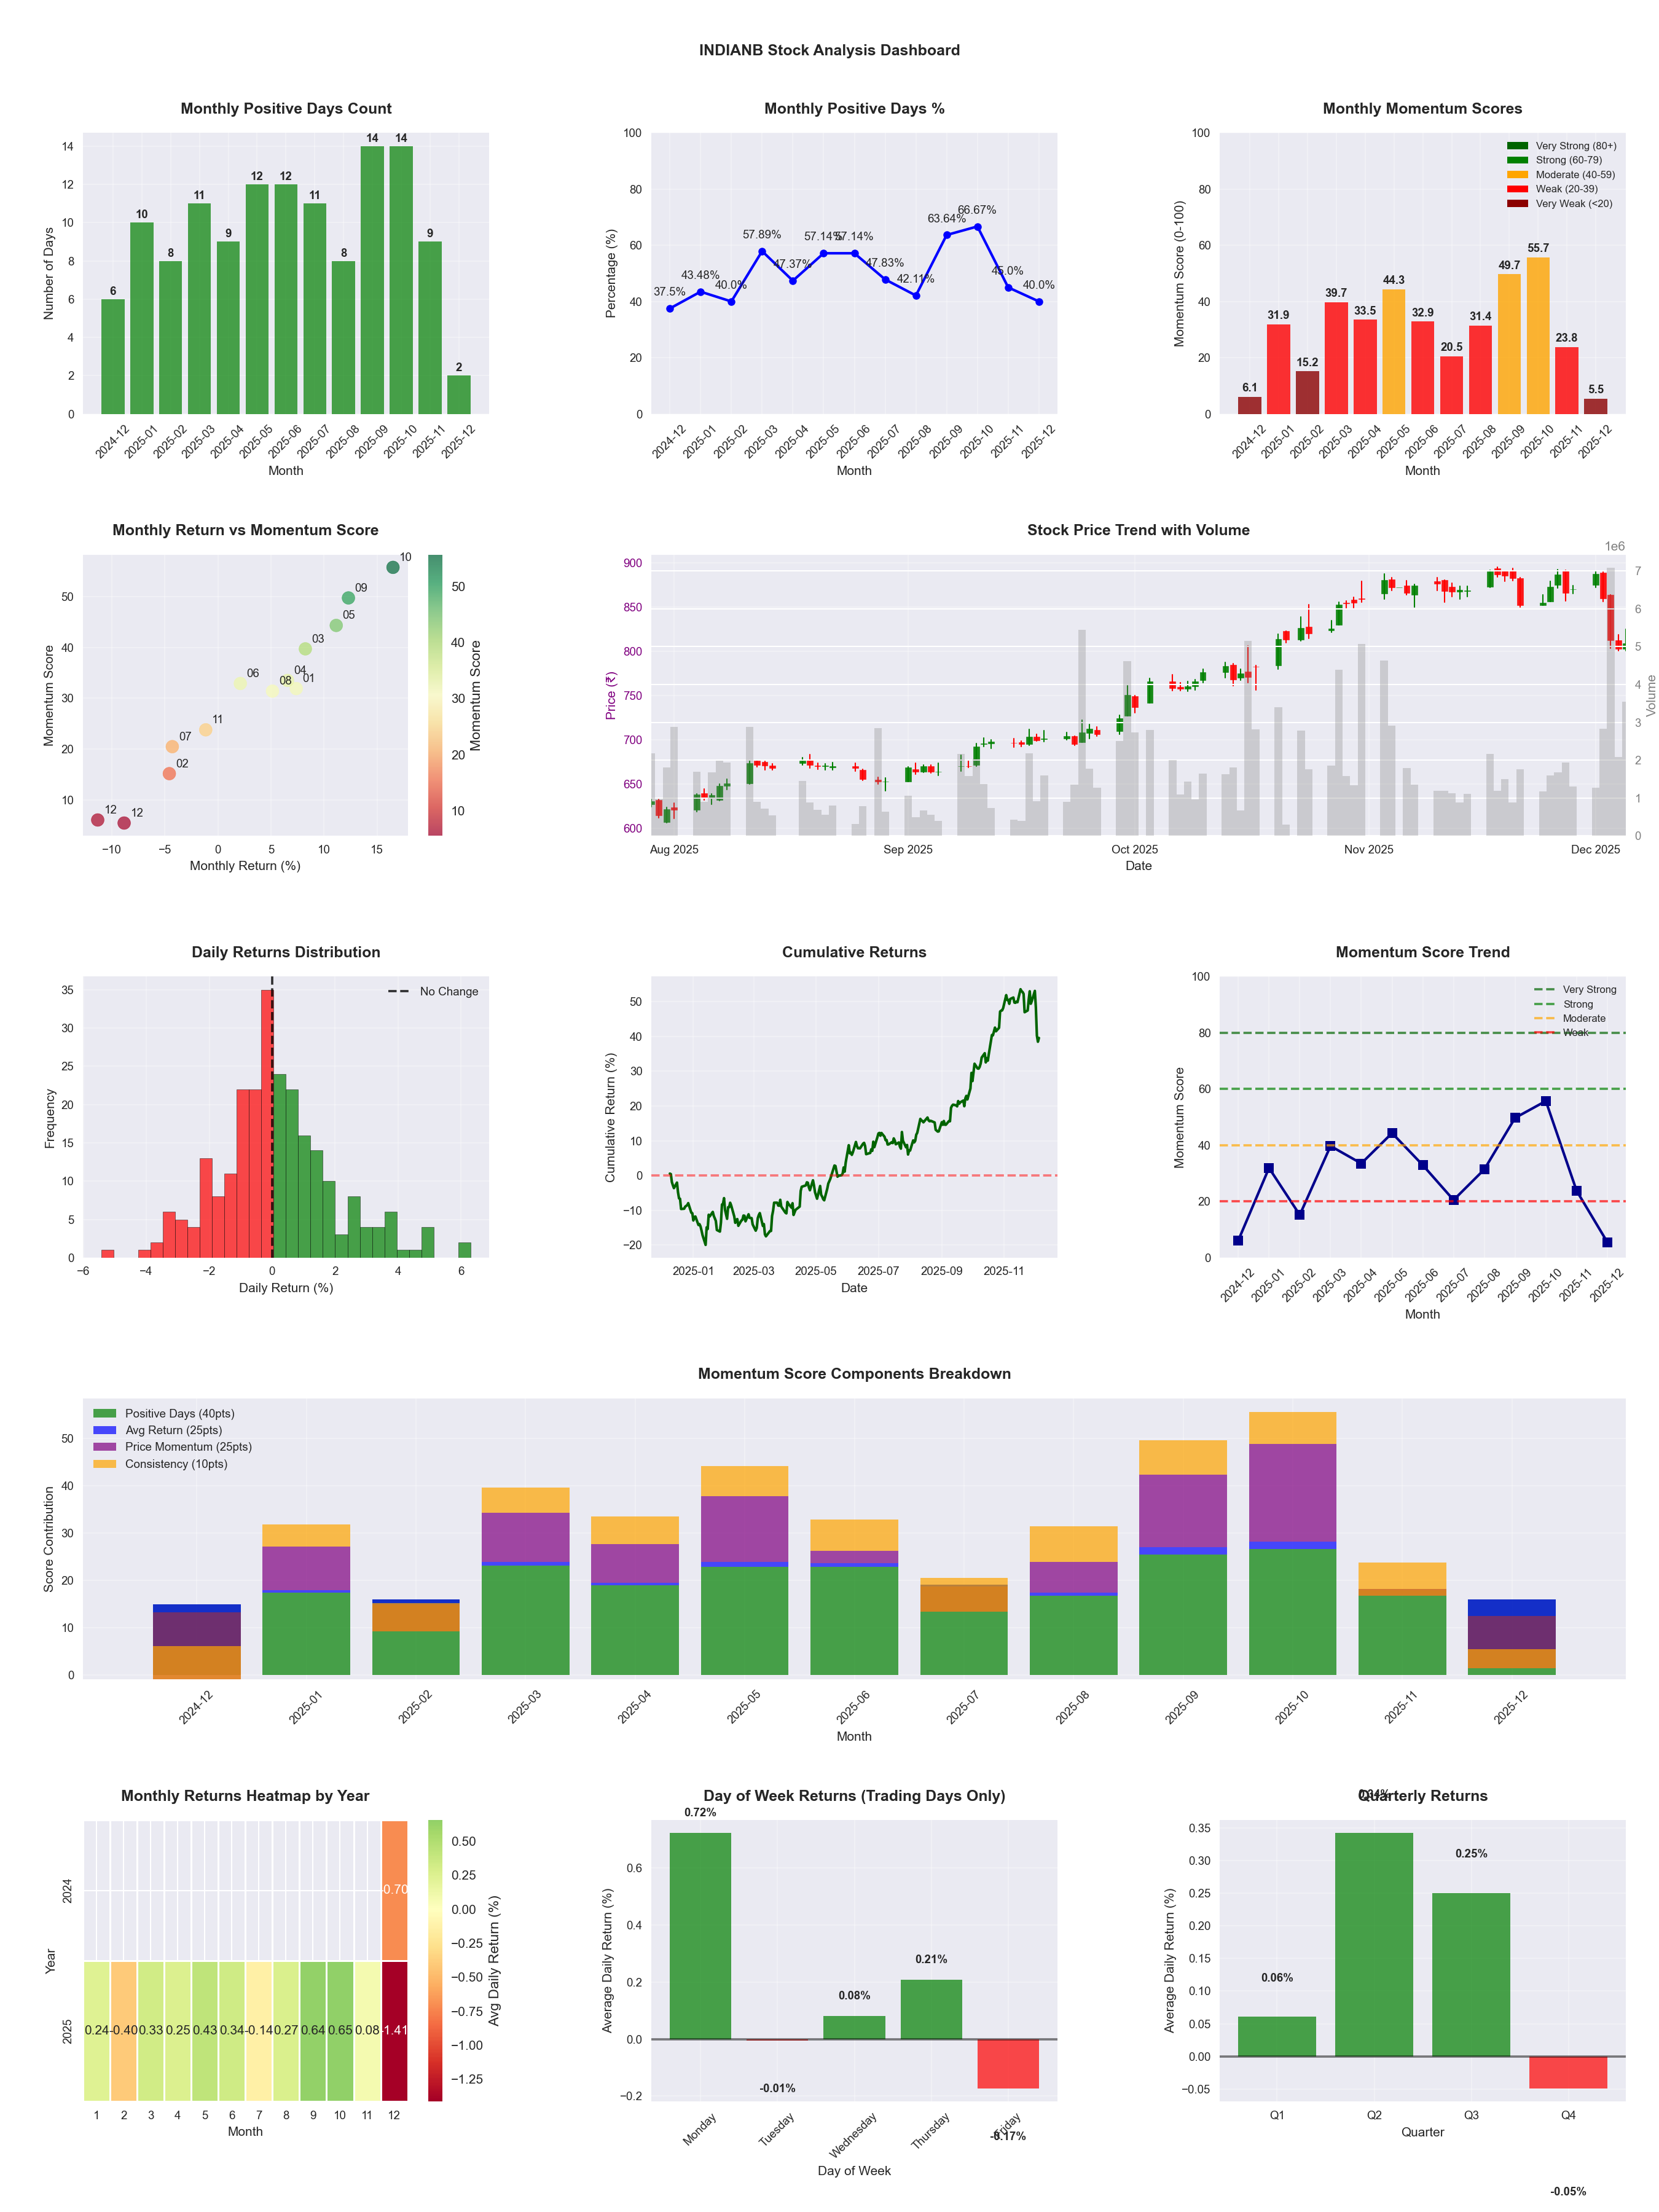
📊 Key Insights & Metrics
Symbol
📈 INDIANB
Date
📅 2026-04-11
Volatility
🟡 1.99%
Win Rate
⚠️ 54.9%
Avg Daily Return
📈 +0.27%
Max Drawdown
📉 -15.47%
IBD RS Score
📊 96.8
Leader
Market Rank
#16
Best Month
🏆 2025-10
Worst Month
📉 2026-03
Best Months to Trade
📅 Apr, Oct, Sep
Best Days to Trade
📅 Monday, Wednesday
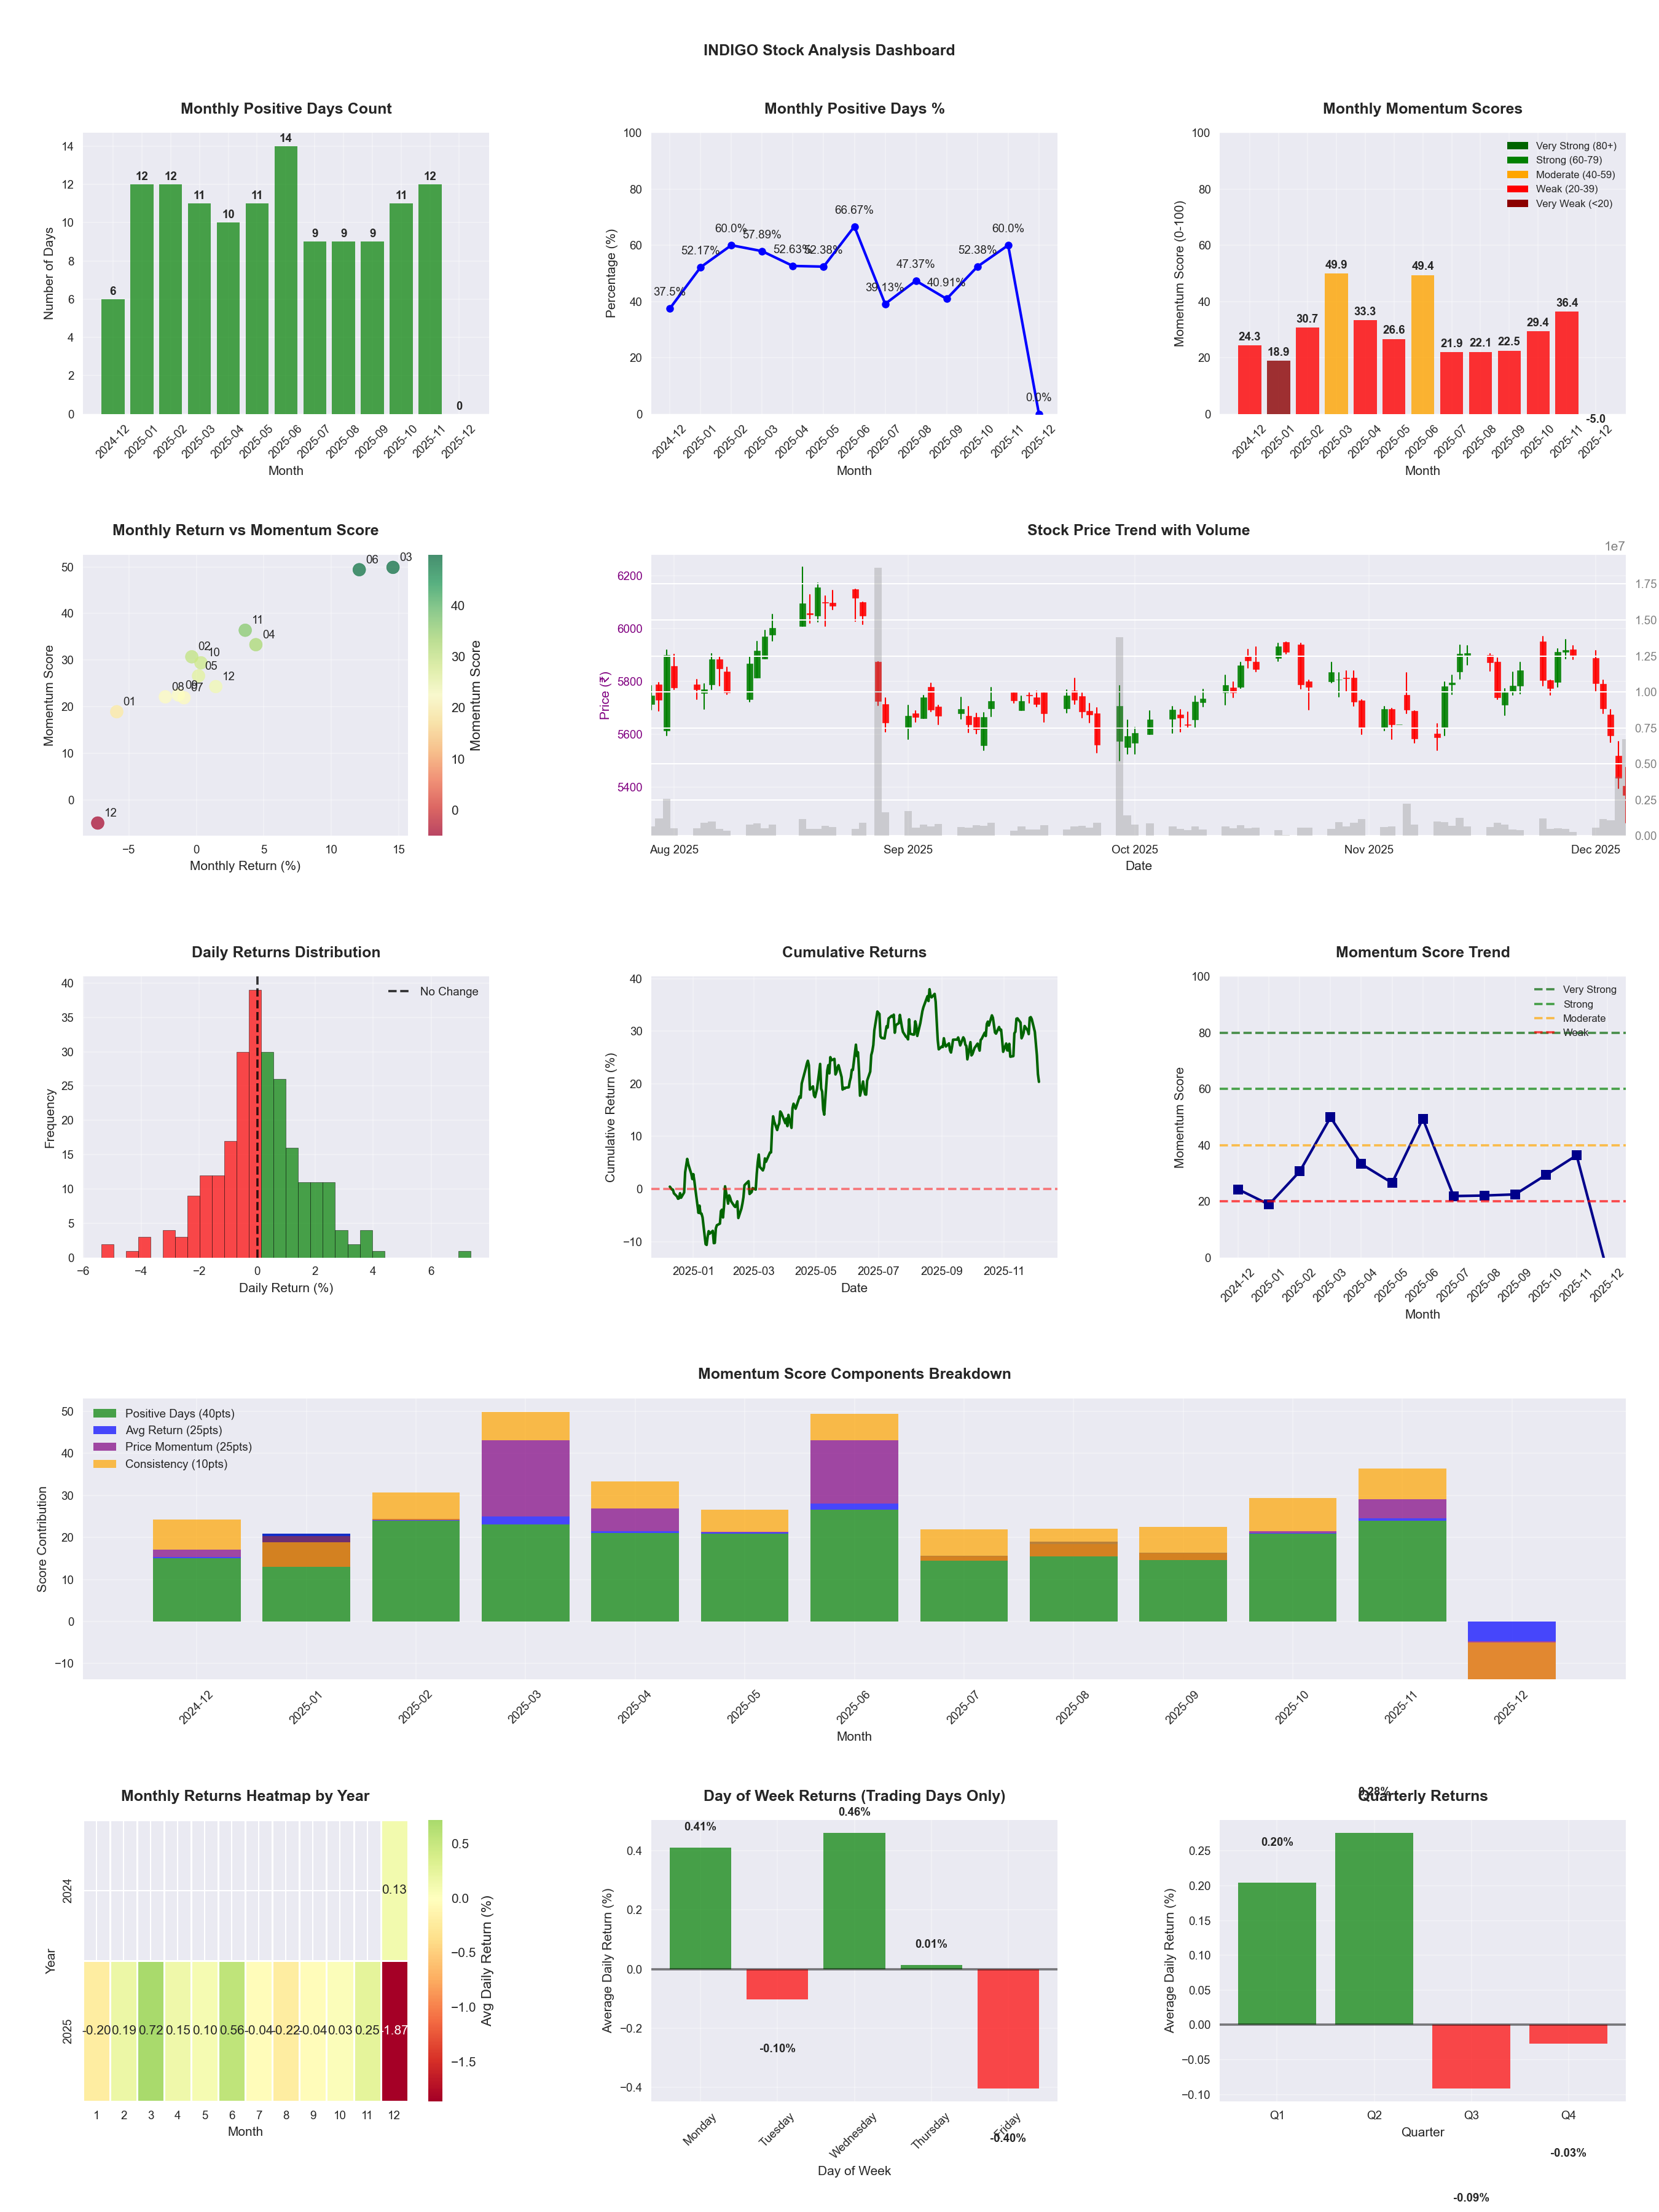
📊 Key Insights & Metrics
Symbol
📈 INDIGO
Date
📅 2026-04-11
Volatility
🟡 2.03%
Risk Profile
⚠️ suitable for aggressive investors
Win Rate
⚠️ 49.6%
Avg Daily Return
📉 -0.03%
Max Drawdown
📉 -35.94%
IBD RS Score
📊 27.8
Weak
Market Rank
#356
Best Month
🏆 2025-06
Best Months to Trade
📅 Apr, Jun, Nov
Best Days to Trade
📅 Wednesday, Monday
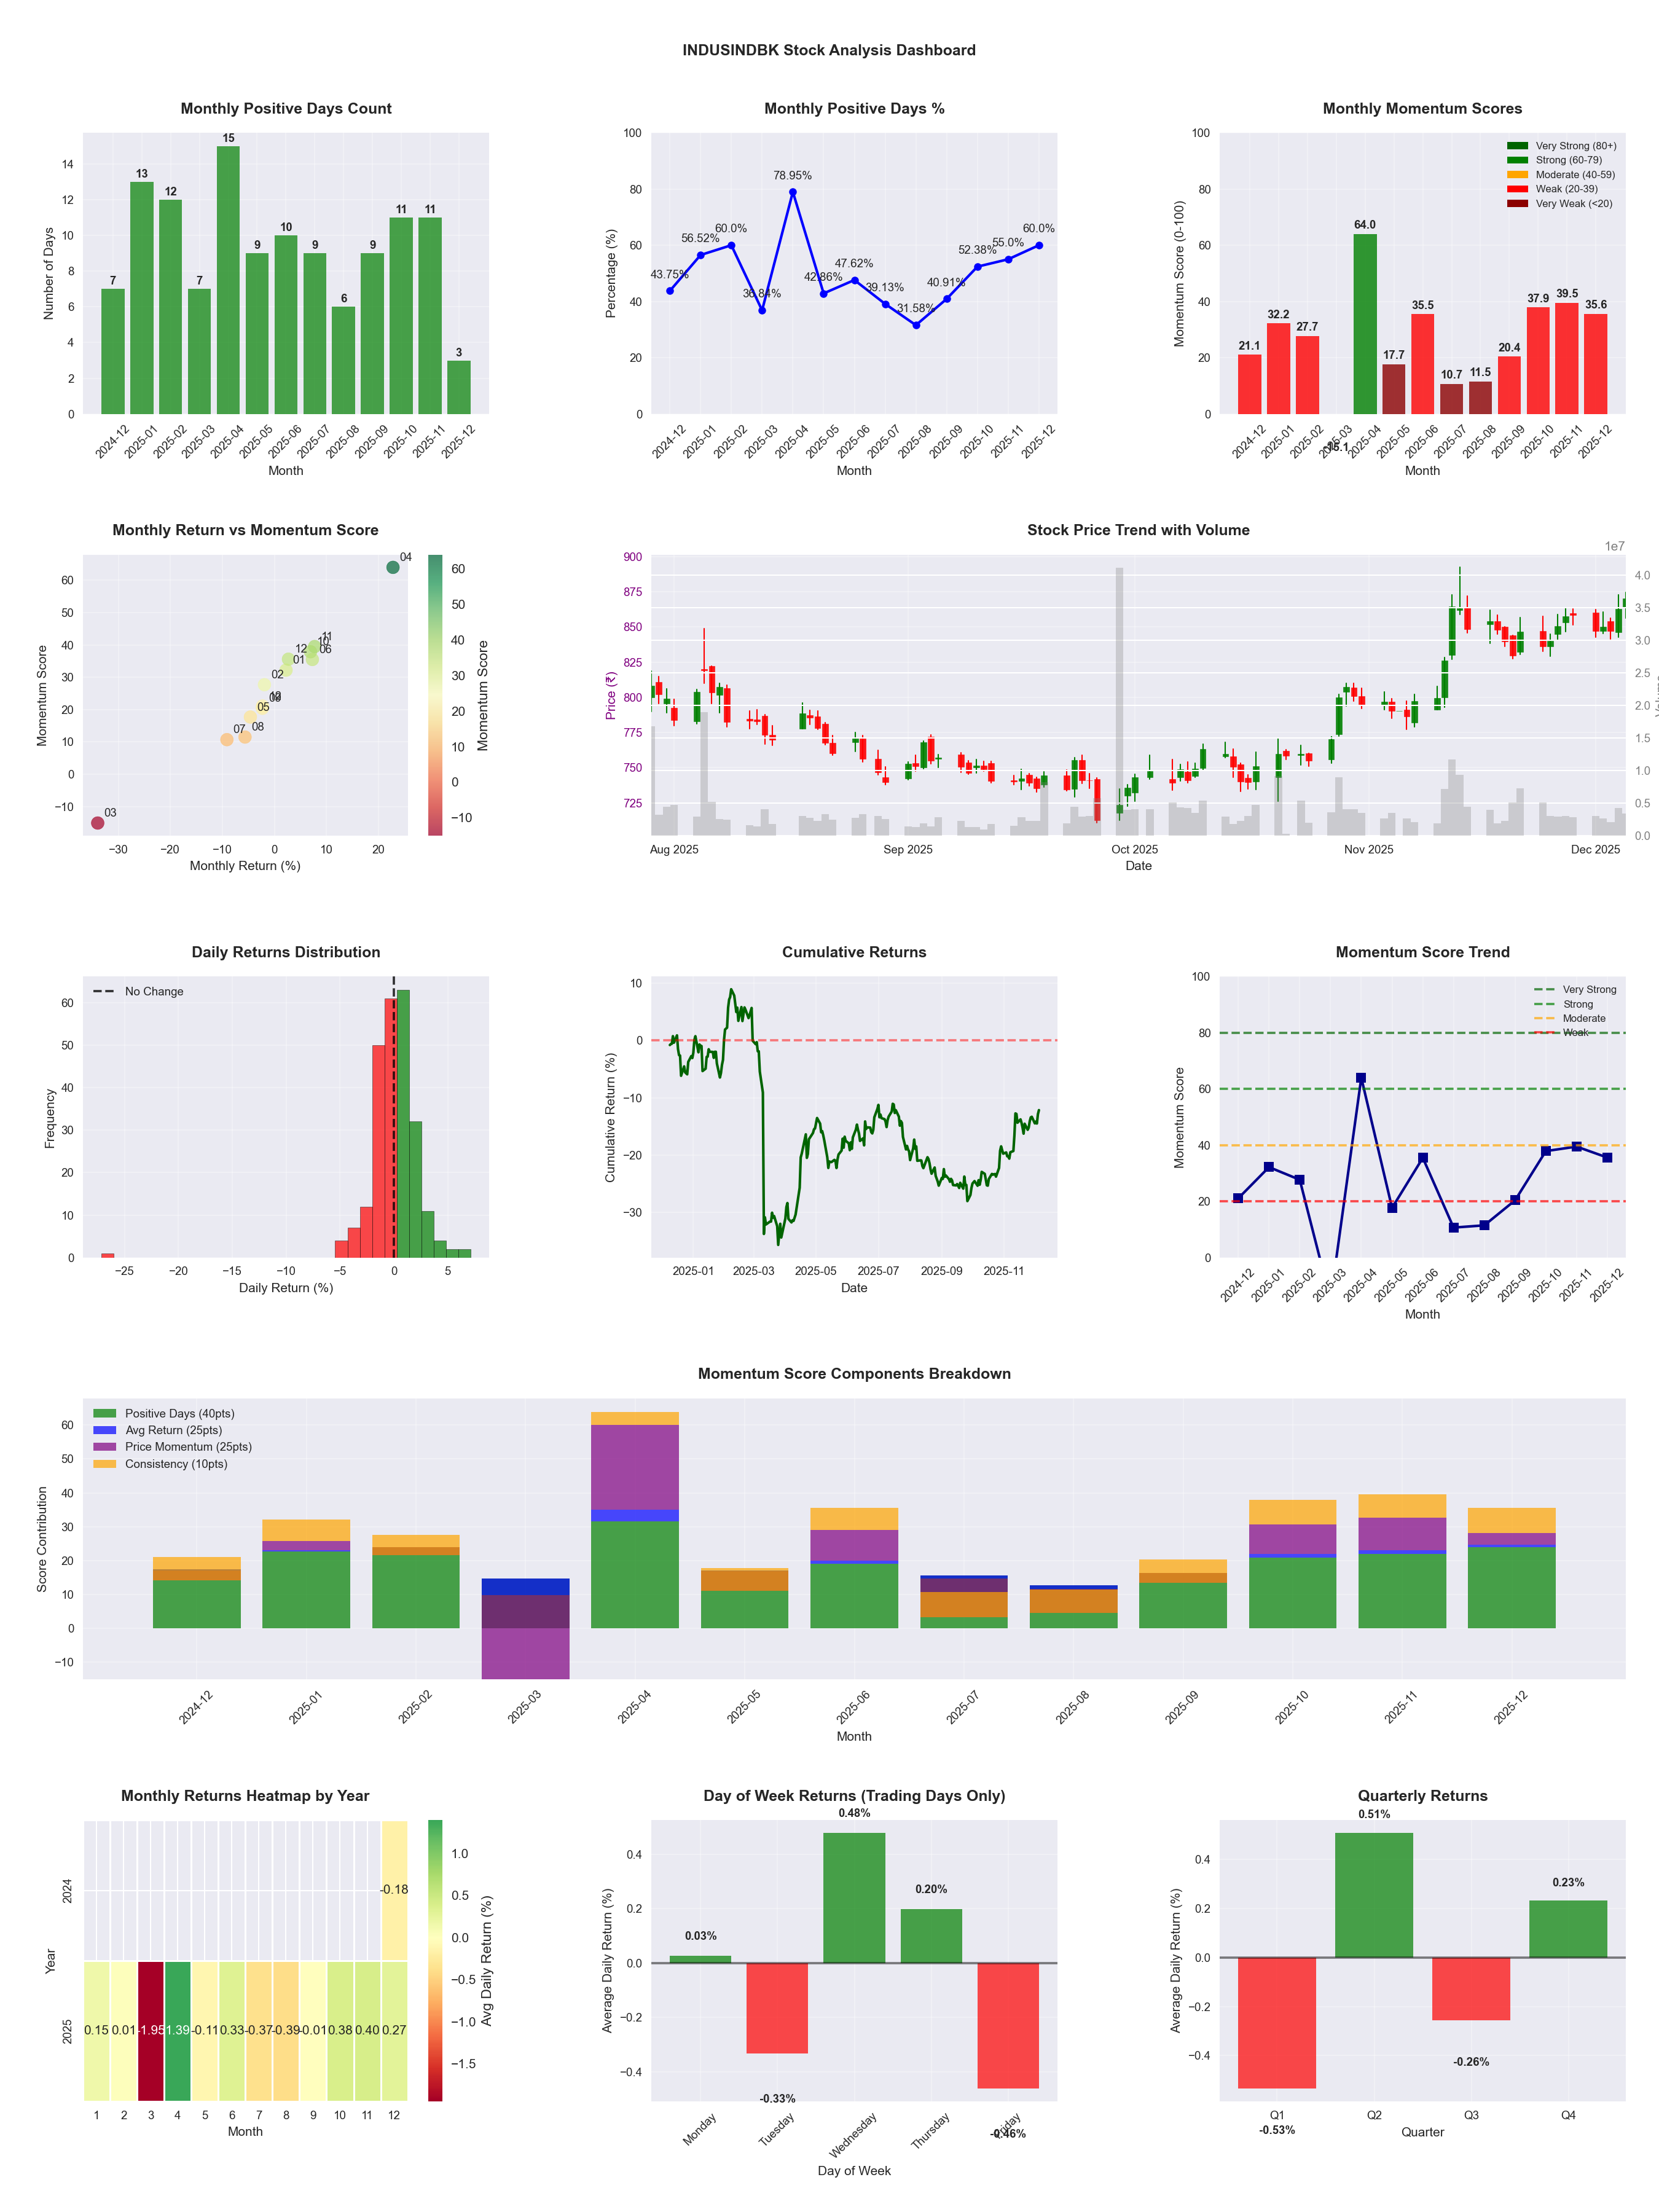
📊 Key Insights & Metrics
Symbol
📈 INDUSINDBK
Date
📅 2026-04-11
Volatility
🟡 1.87%
Win Rate
⚠️ 48.4%
Avg Daily Return
📈 +0.09%
Max Drawdown
📉 -21.99%
IBD RS Score
📊 62.7
Average
Market Rank
#184
Best Month
🏆 2025-04
Best Months to Trade
📅 Apr, Nov, Oct
Best Days to Trade
📅 Wednesday, Tuesday
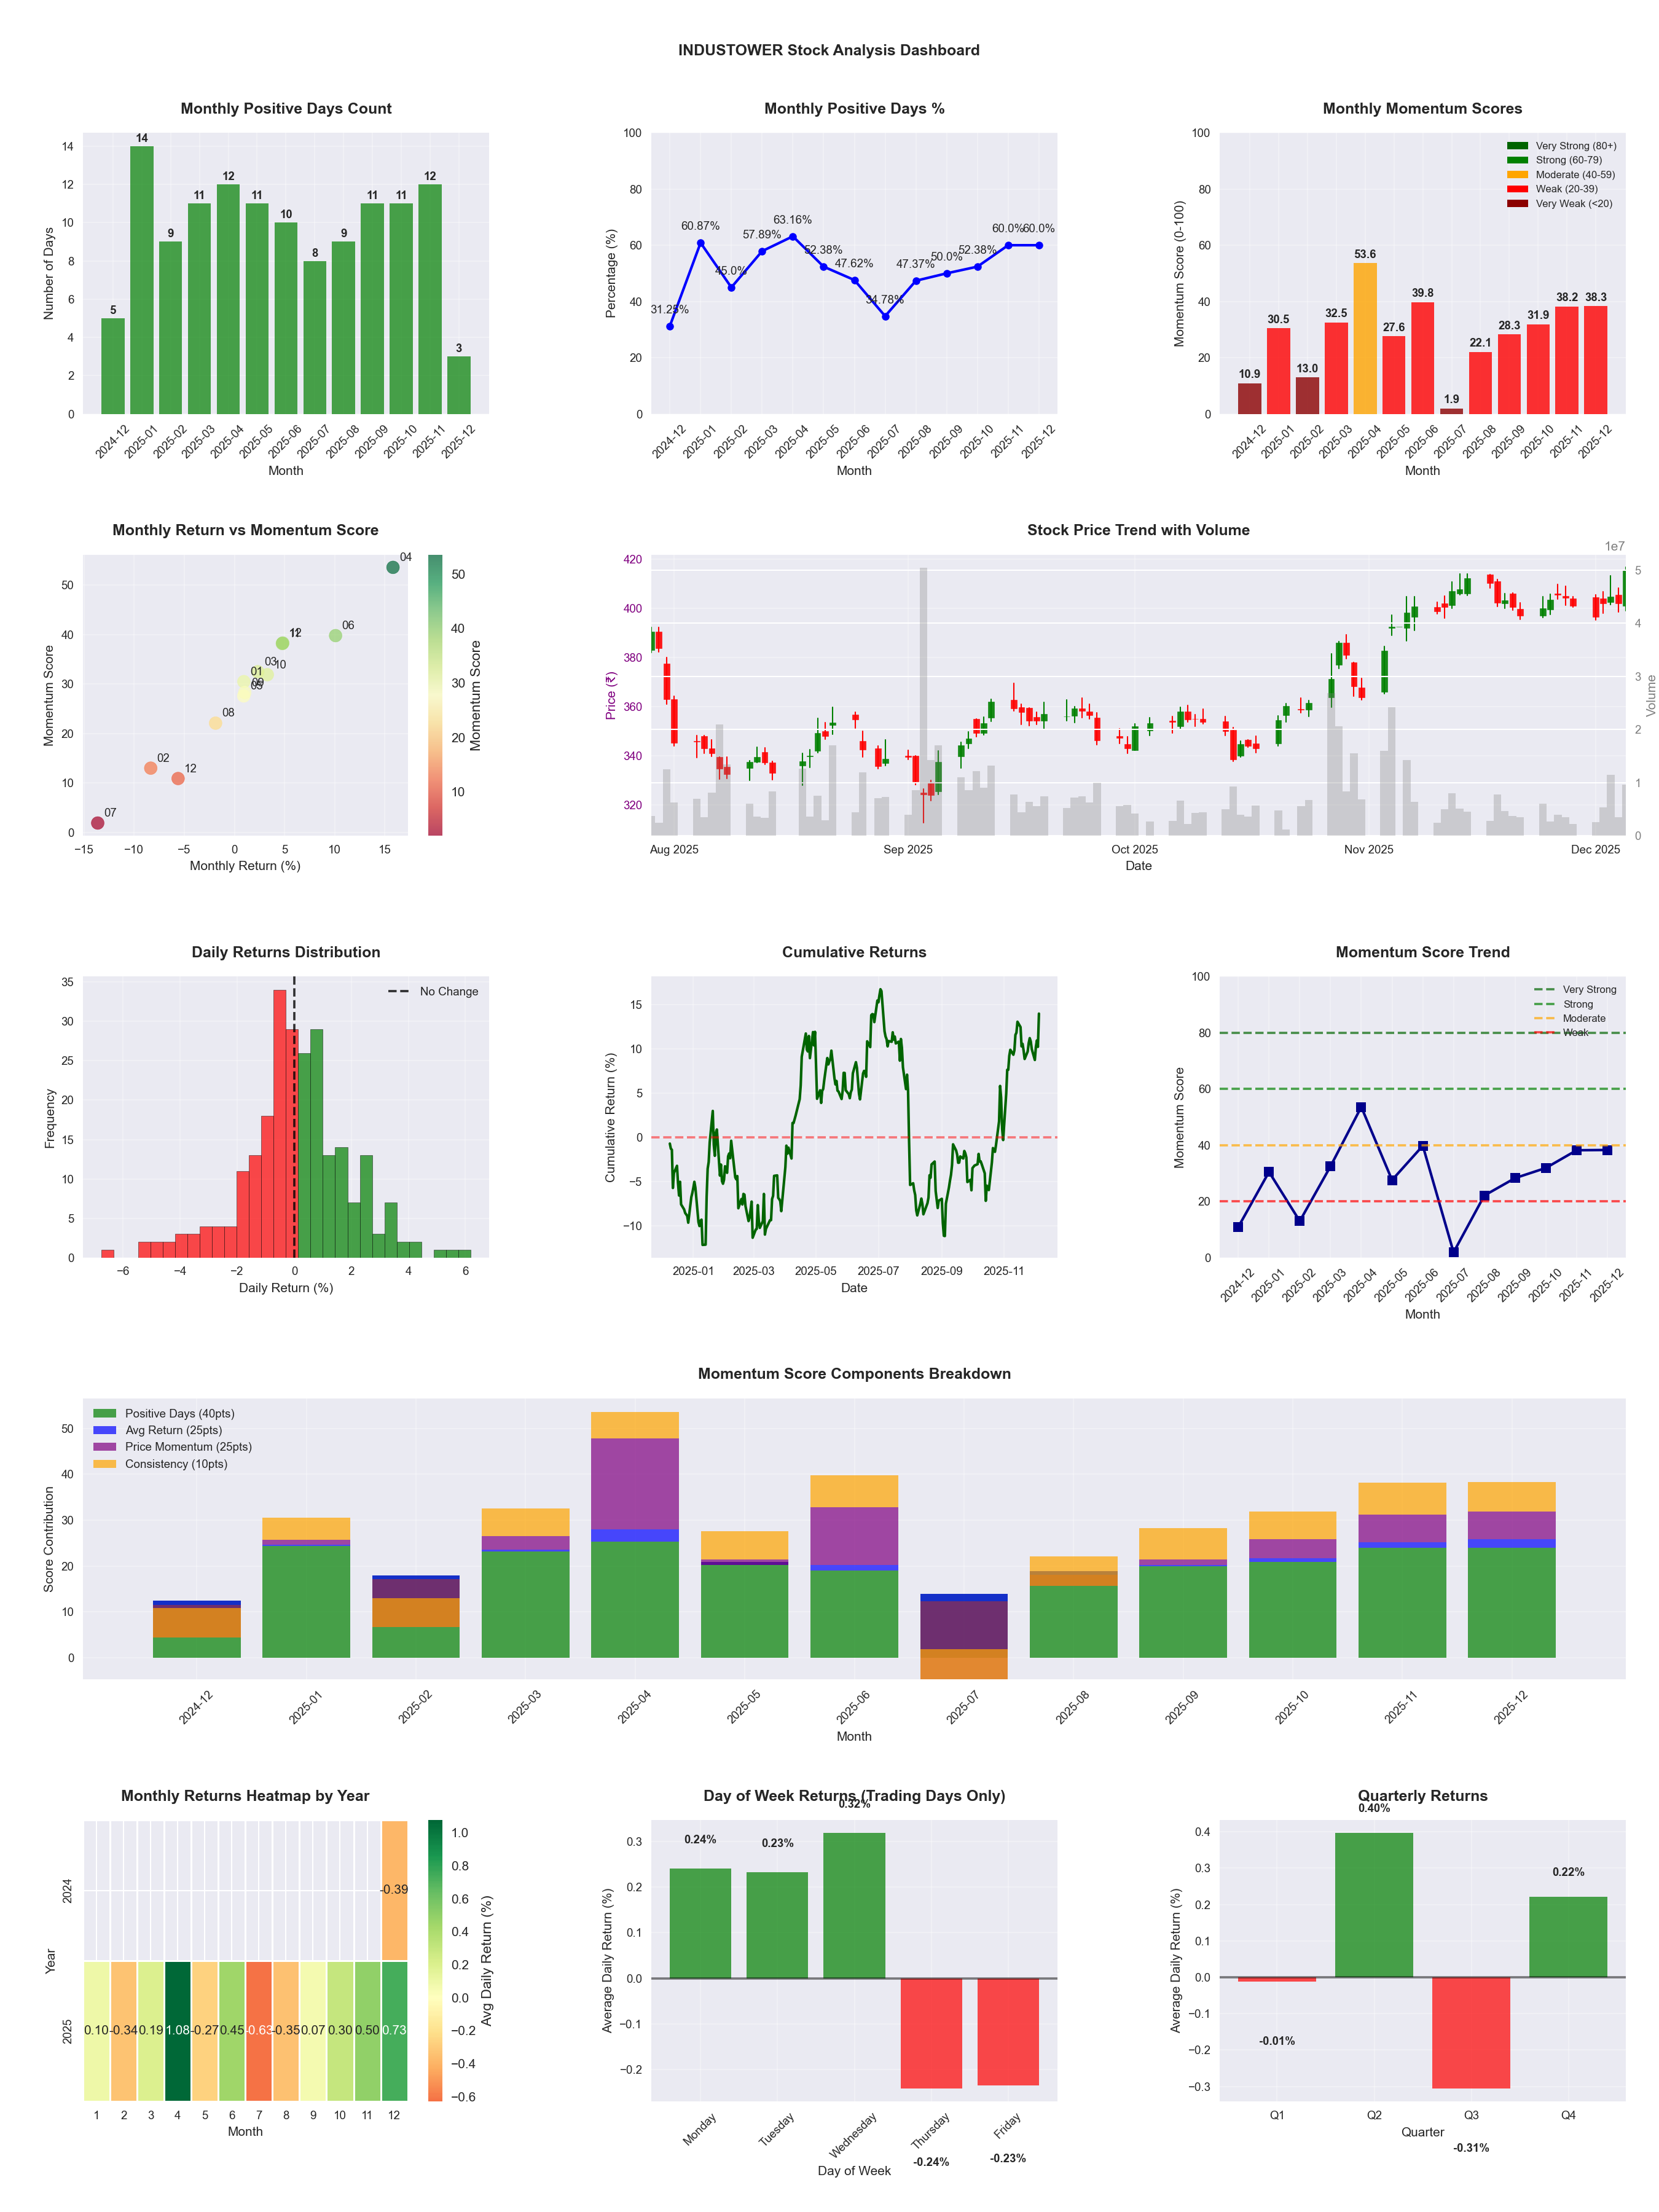
📊 Key Insights & Metrics
Symbol
📈 INDUSTOWER
Date
📅 2026-04-11
Volatility
🟡 1.75%
Win Rate
⚠️ 50.4%
Avg Daily Return
📈 +0.08%
Max Drawdown
📉 -23.89%
IBD RS Score
📊 75.5
Strong
Market Rank
#121
Best Month
🏆 2025-04
Worst Month
📉 2025-07
Best Months to Trade
📅 Apr, Nov, Jun
Best Days to Trade
📅 Wednesday, Tuesday
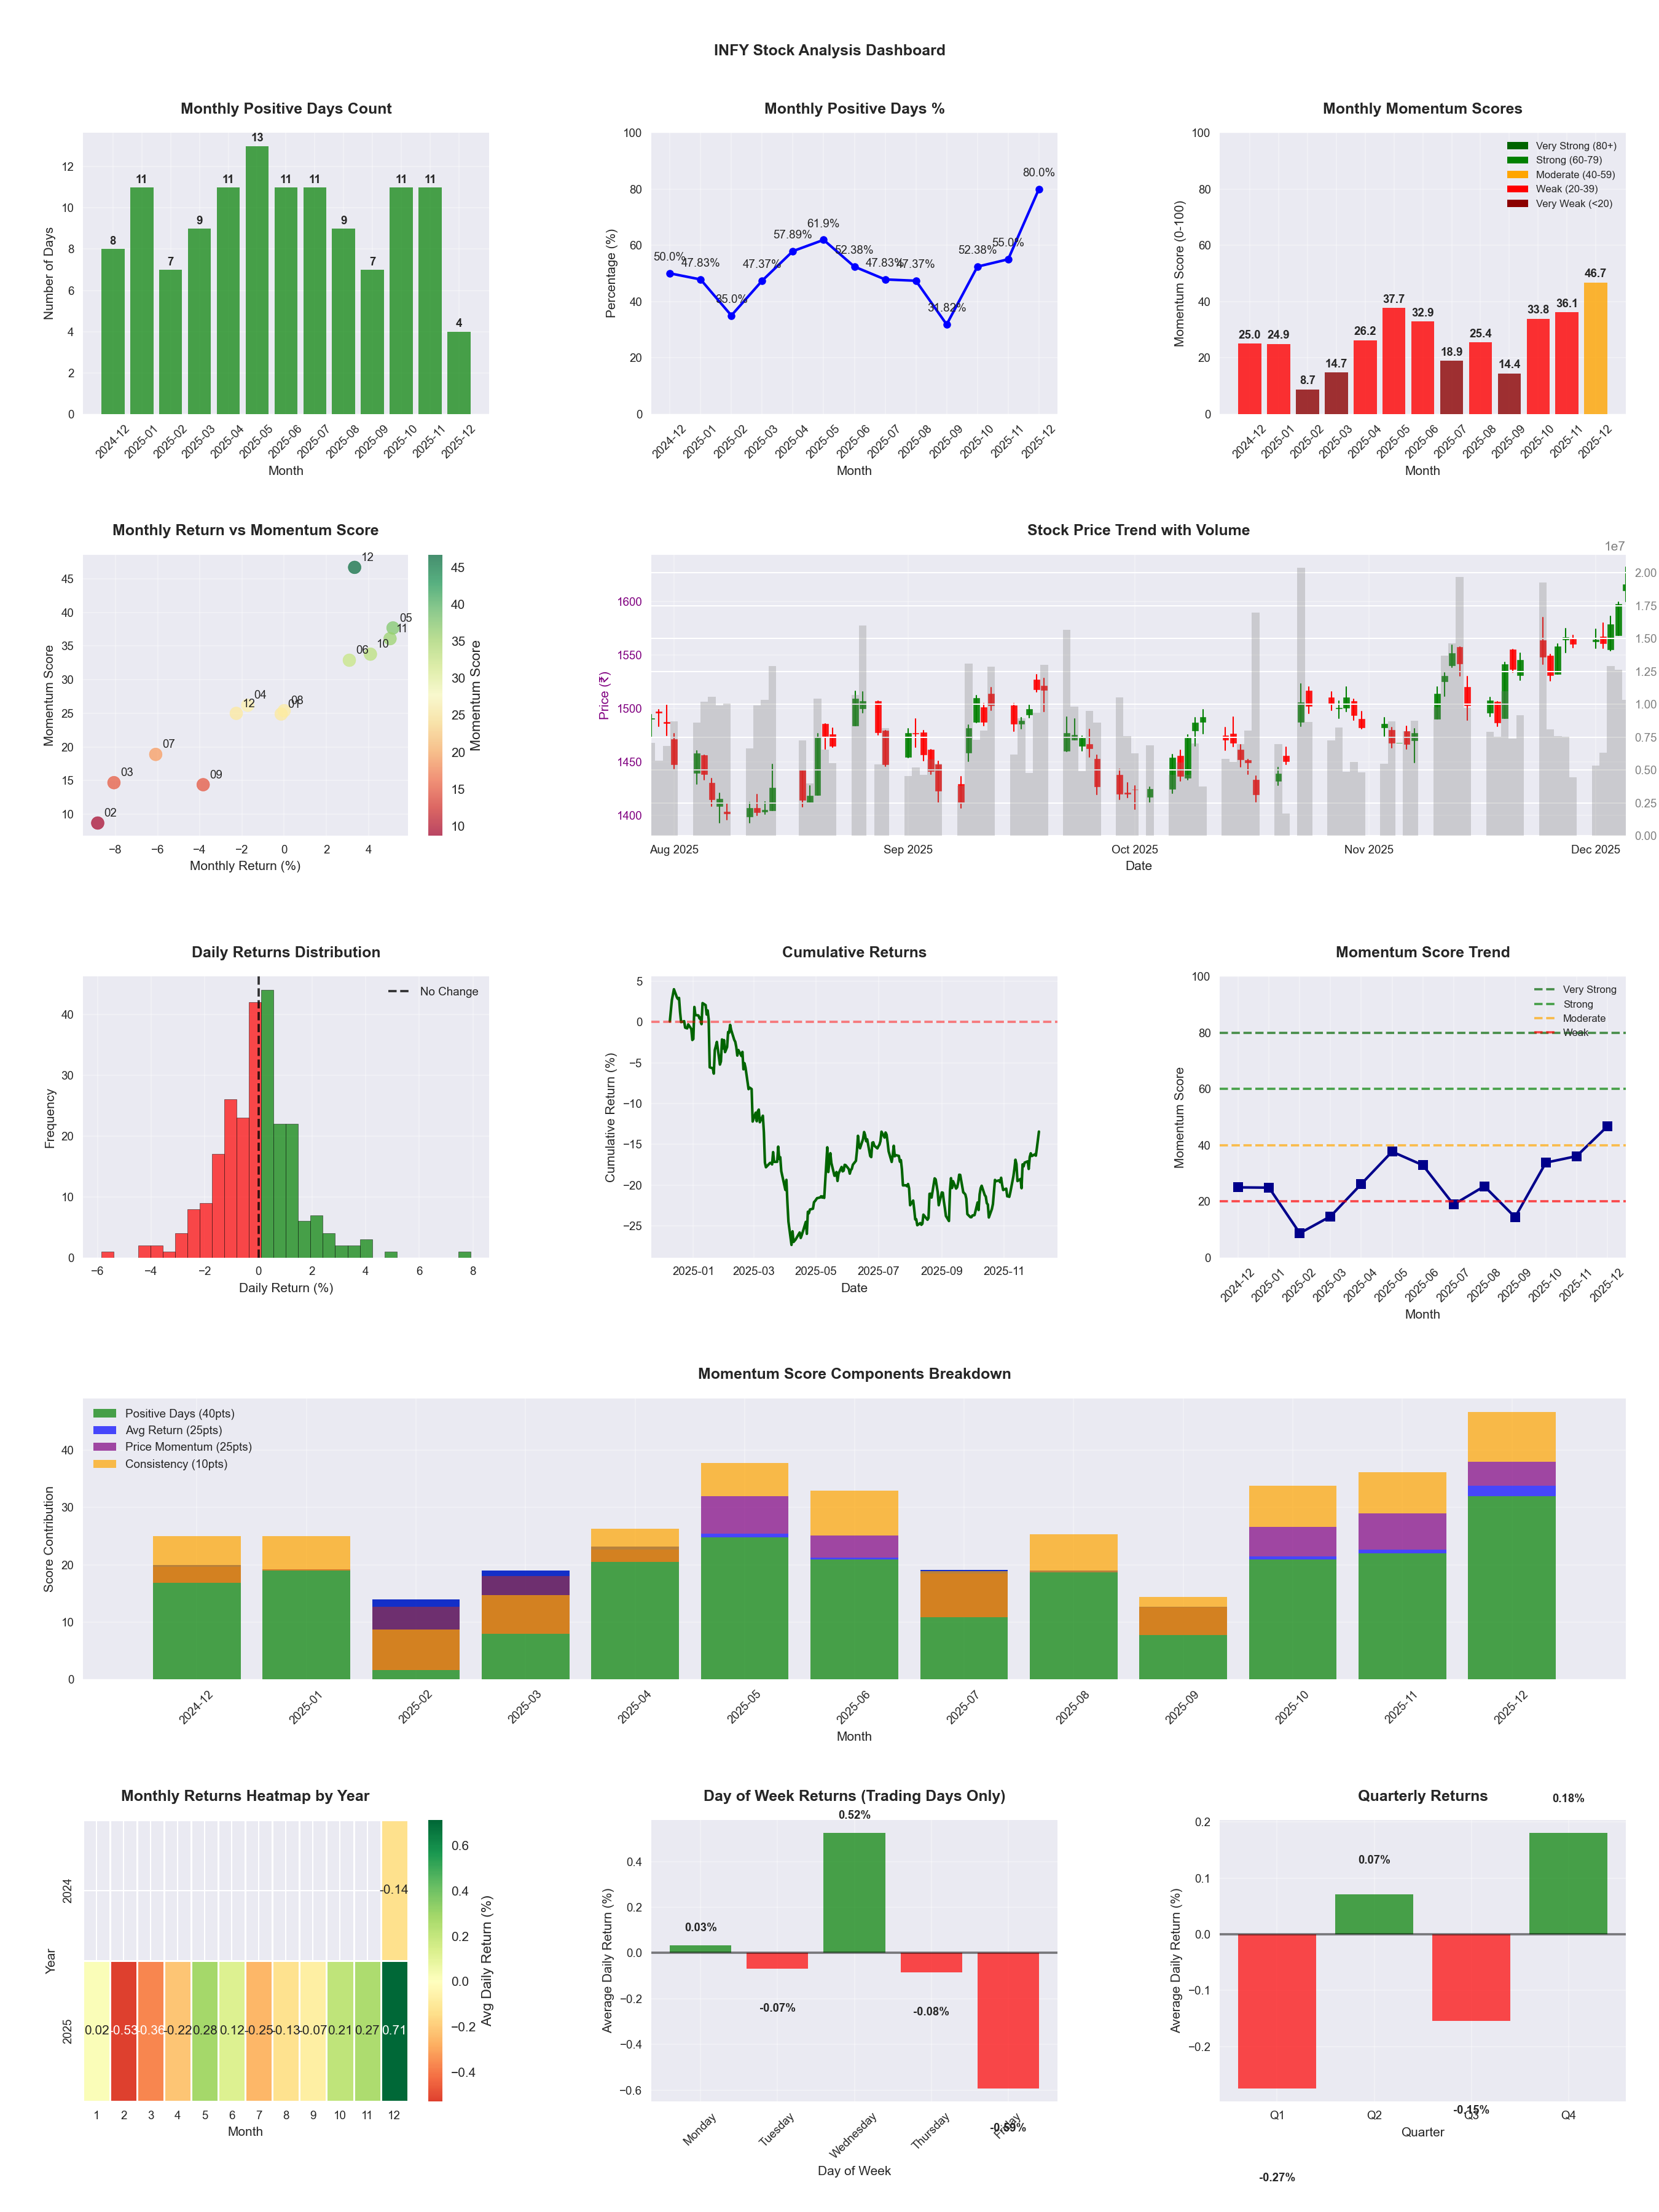
📊 Key Insights & Metrics
Symbol
📈 INFY
Date
📅 2026-04-11
Volatility
🟡 1.59%
Win Rate
⚠️ 49.6%
Avg Daily Return
📉 -0.01%
Max Drawdown
📉 -27.75%
IBD RS Score
📊 25.6
Weak
Market Rank
#367
Best Month
🏆 2025-04
Best Months to Trade
📅 Apr, May, Nov
Best Days to Trade
📅 Wednesday, Monday
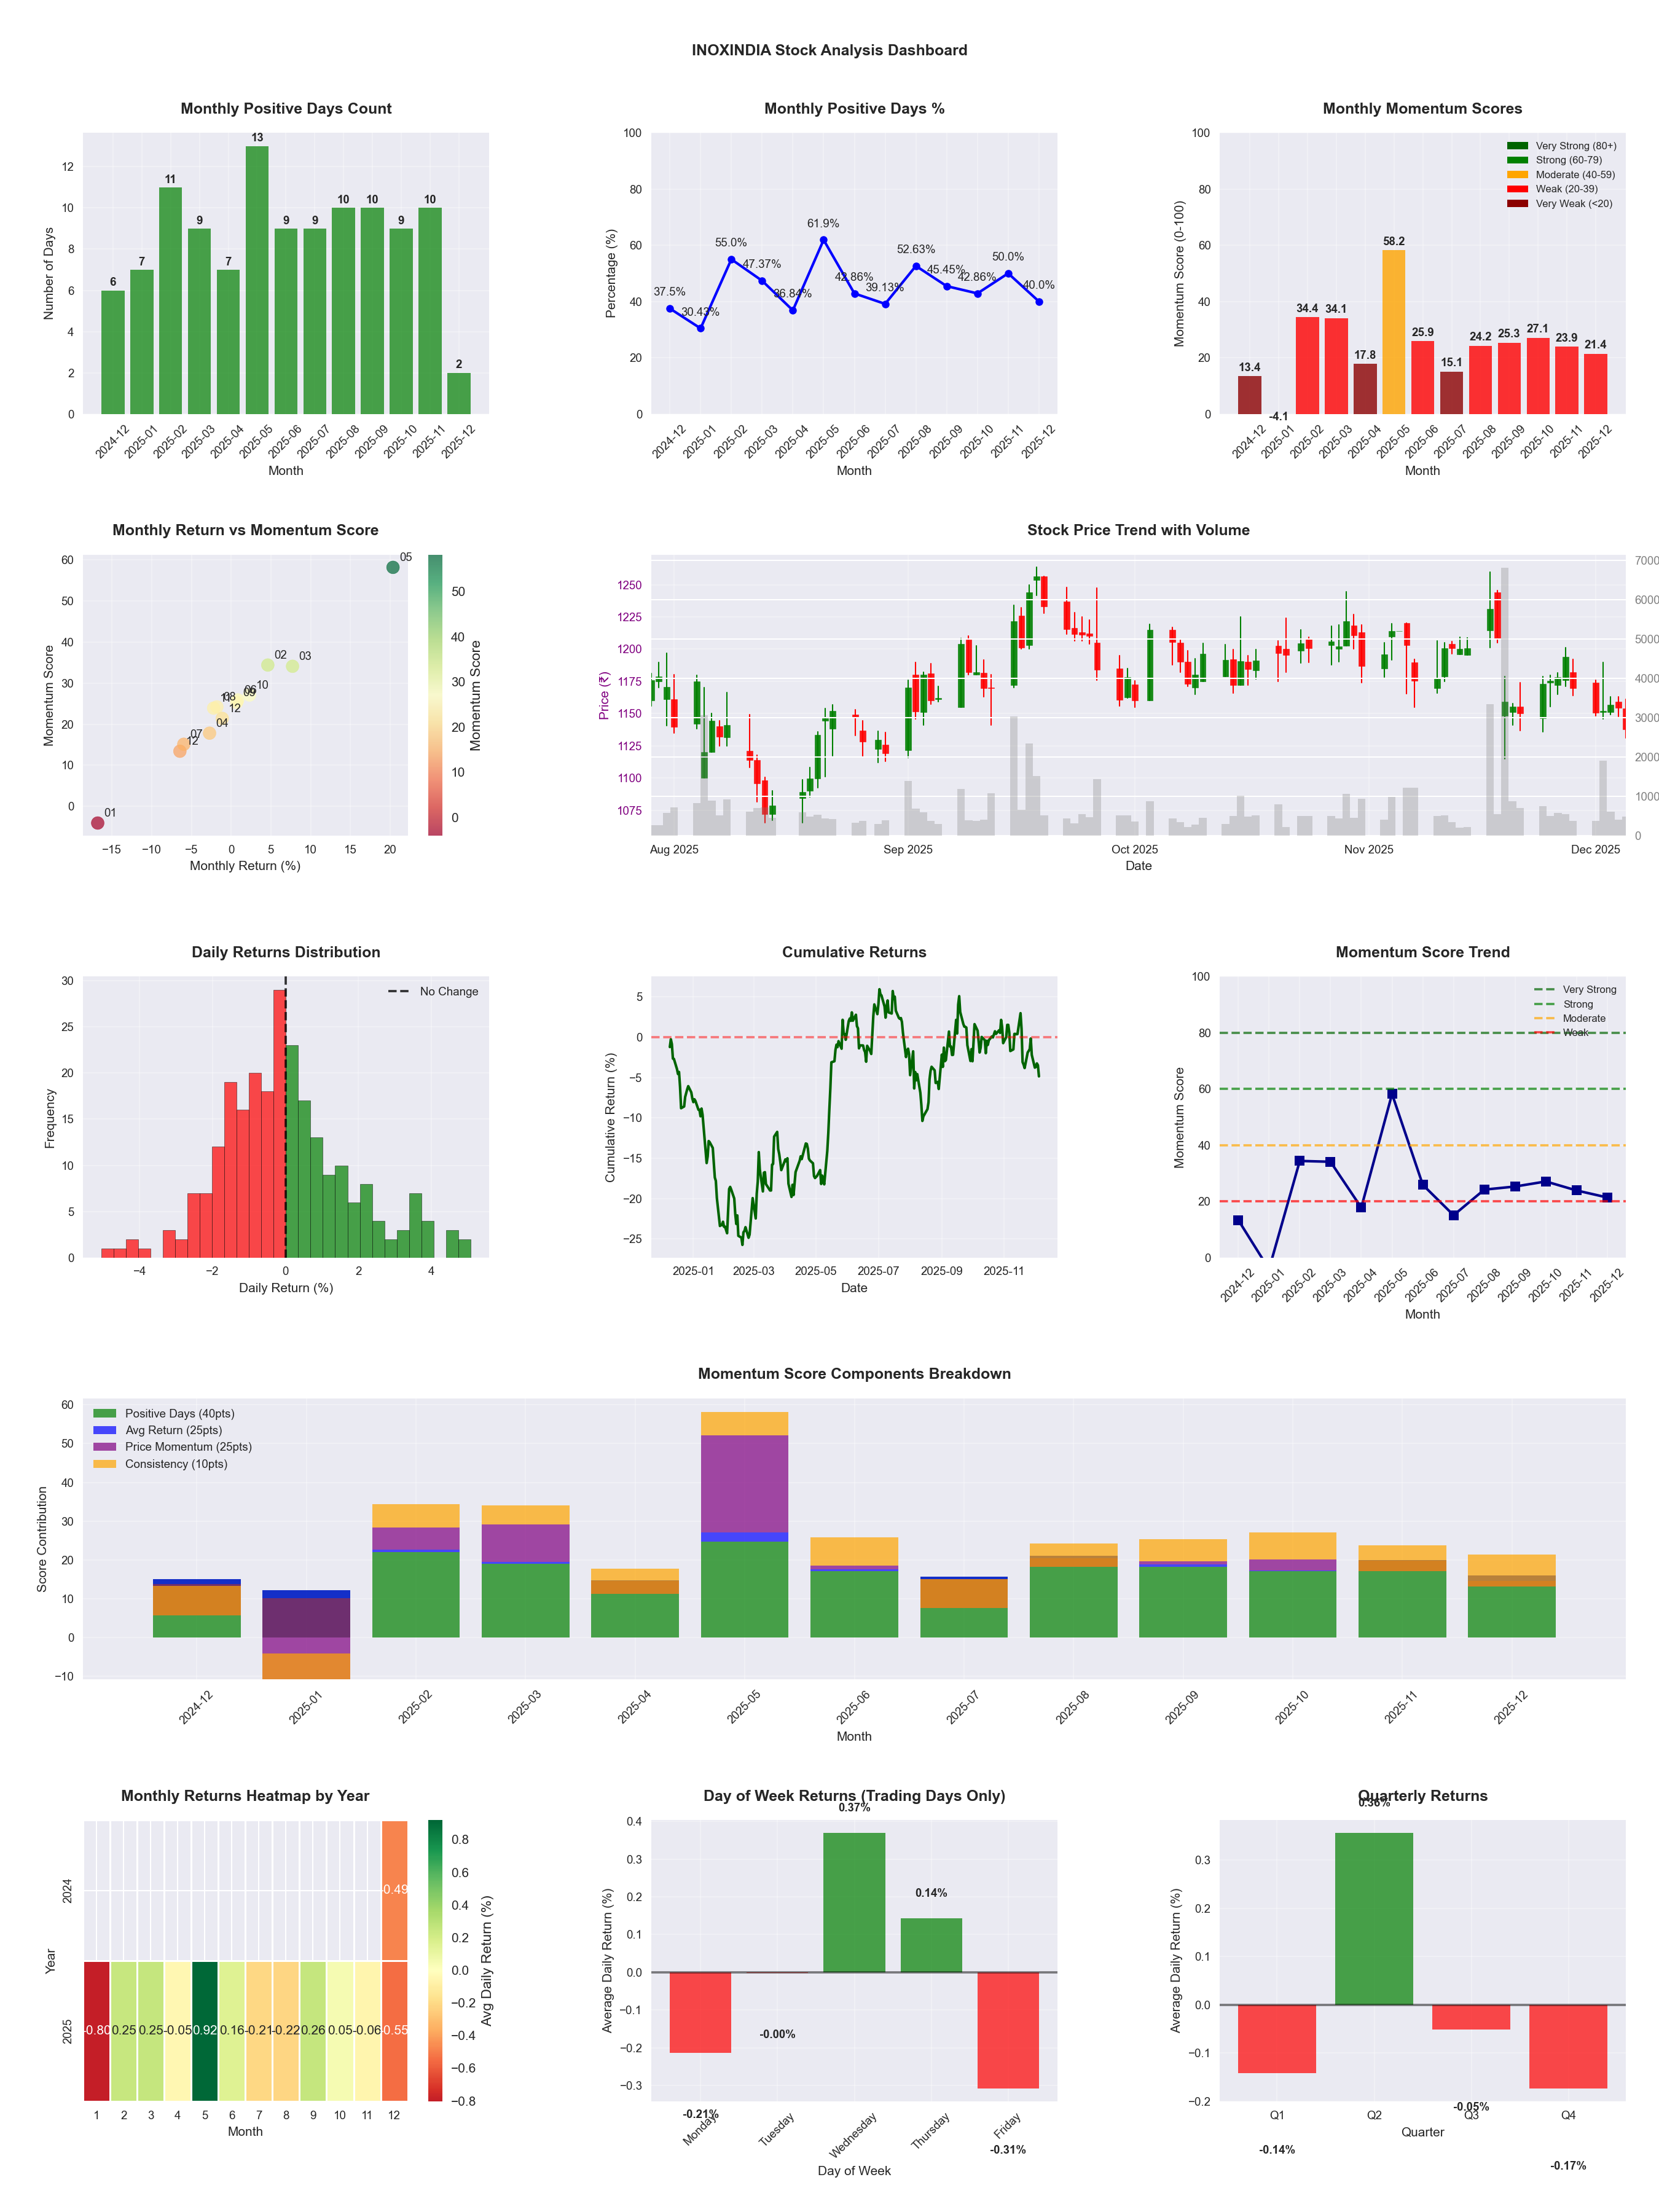
📊 Key Insights & Metrics
Symbol
📈 INOXINDIA
Date
📅 2026-04-11
Volatility
🟡 1.75%
Win Rate
⚠️ 49.4%
Avg Daily Return
📈 +0.13%
Max Drawdown
📉 -15.40%
IBD RS Score
📊 81.7
Strong
Market Rank
#90
Best Month
🏆 2025-05
Worst Month
📉 2025-04
Best Months to Trade
📅 May, Apr, Sep
Best Days to Trade
📅 Wednesday, Monday
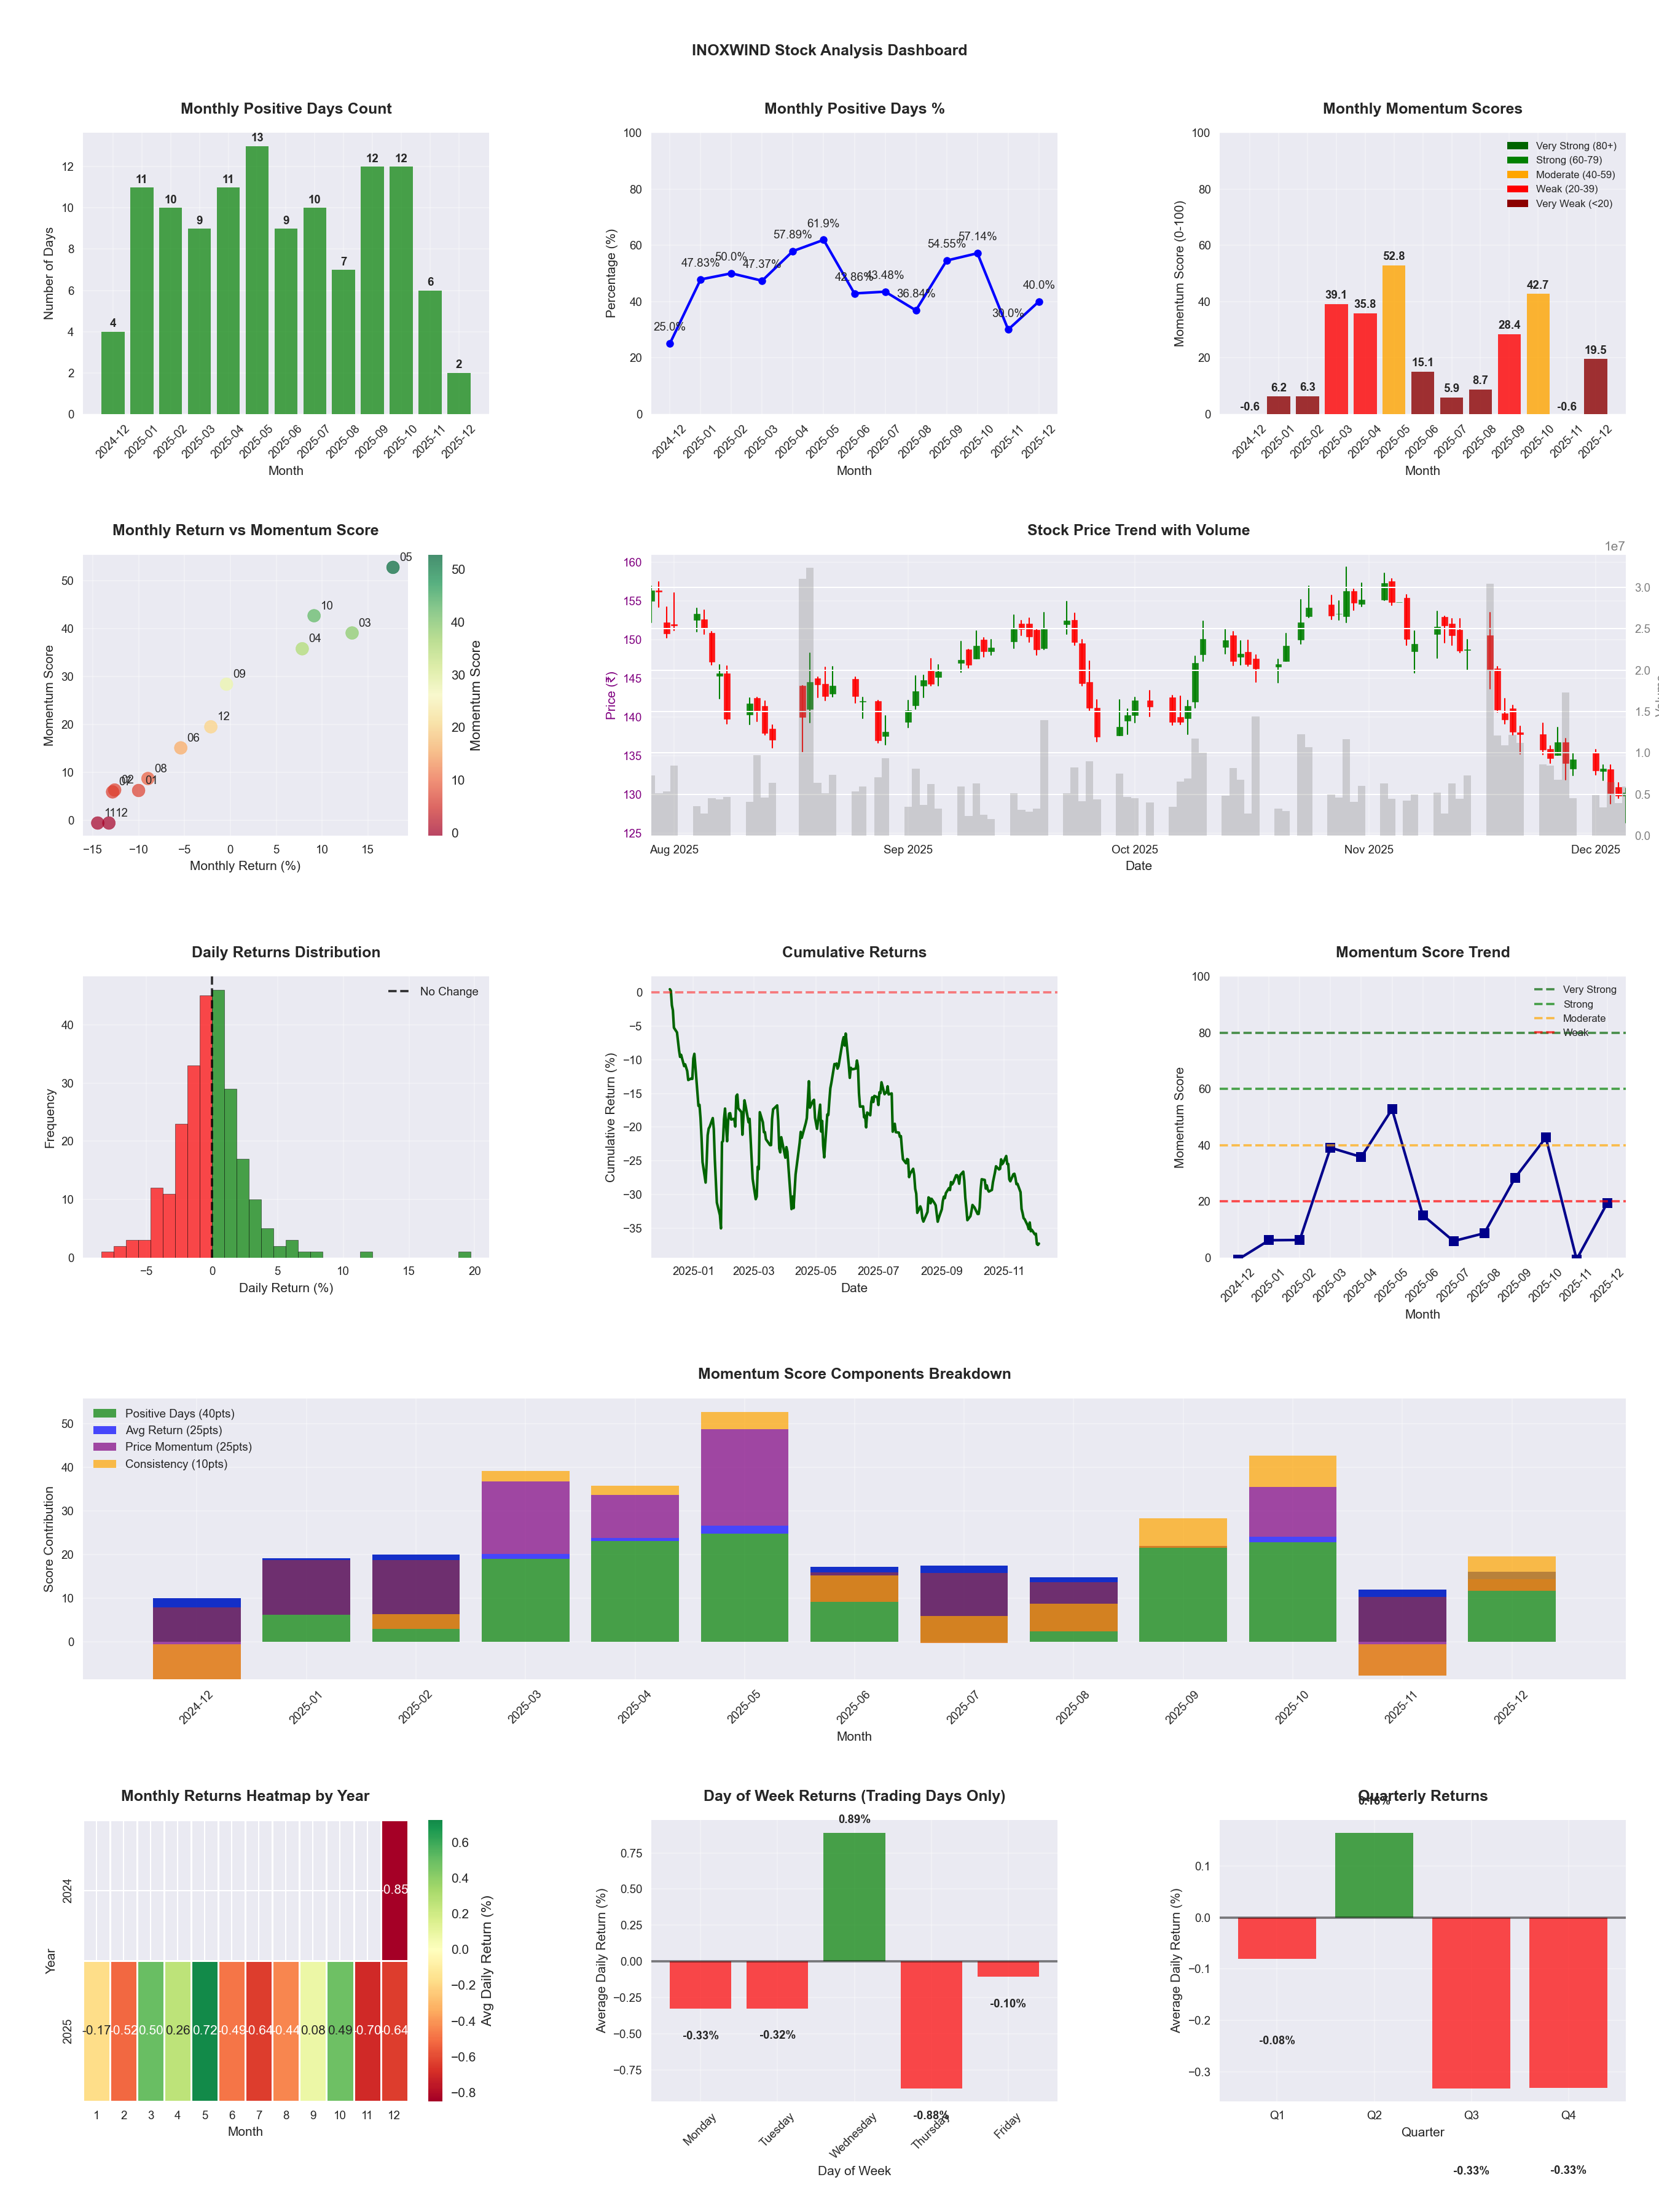
📊 Key Insights & Metrics
Symbol
📈 INOXWIND
Date
📅 2026-04-11
Volatility
🟡 2.32%
Risk Profile
⚠️ suitable for aggressive investors
Win Rate
⚠️ 45.1%
Avg Daily Return
📉 -0.20%
Max Drawdown
📉 -61.29%
IBD RS Score
📊 1.6
Weak
Market Rank
#485
Best Month
🏆 2025-05
Best Months to Trade
📅 Apr, May, Oct
Best Days to Trade
📅 Wednesday, Monday
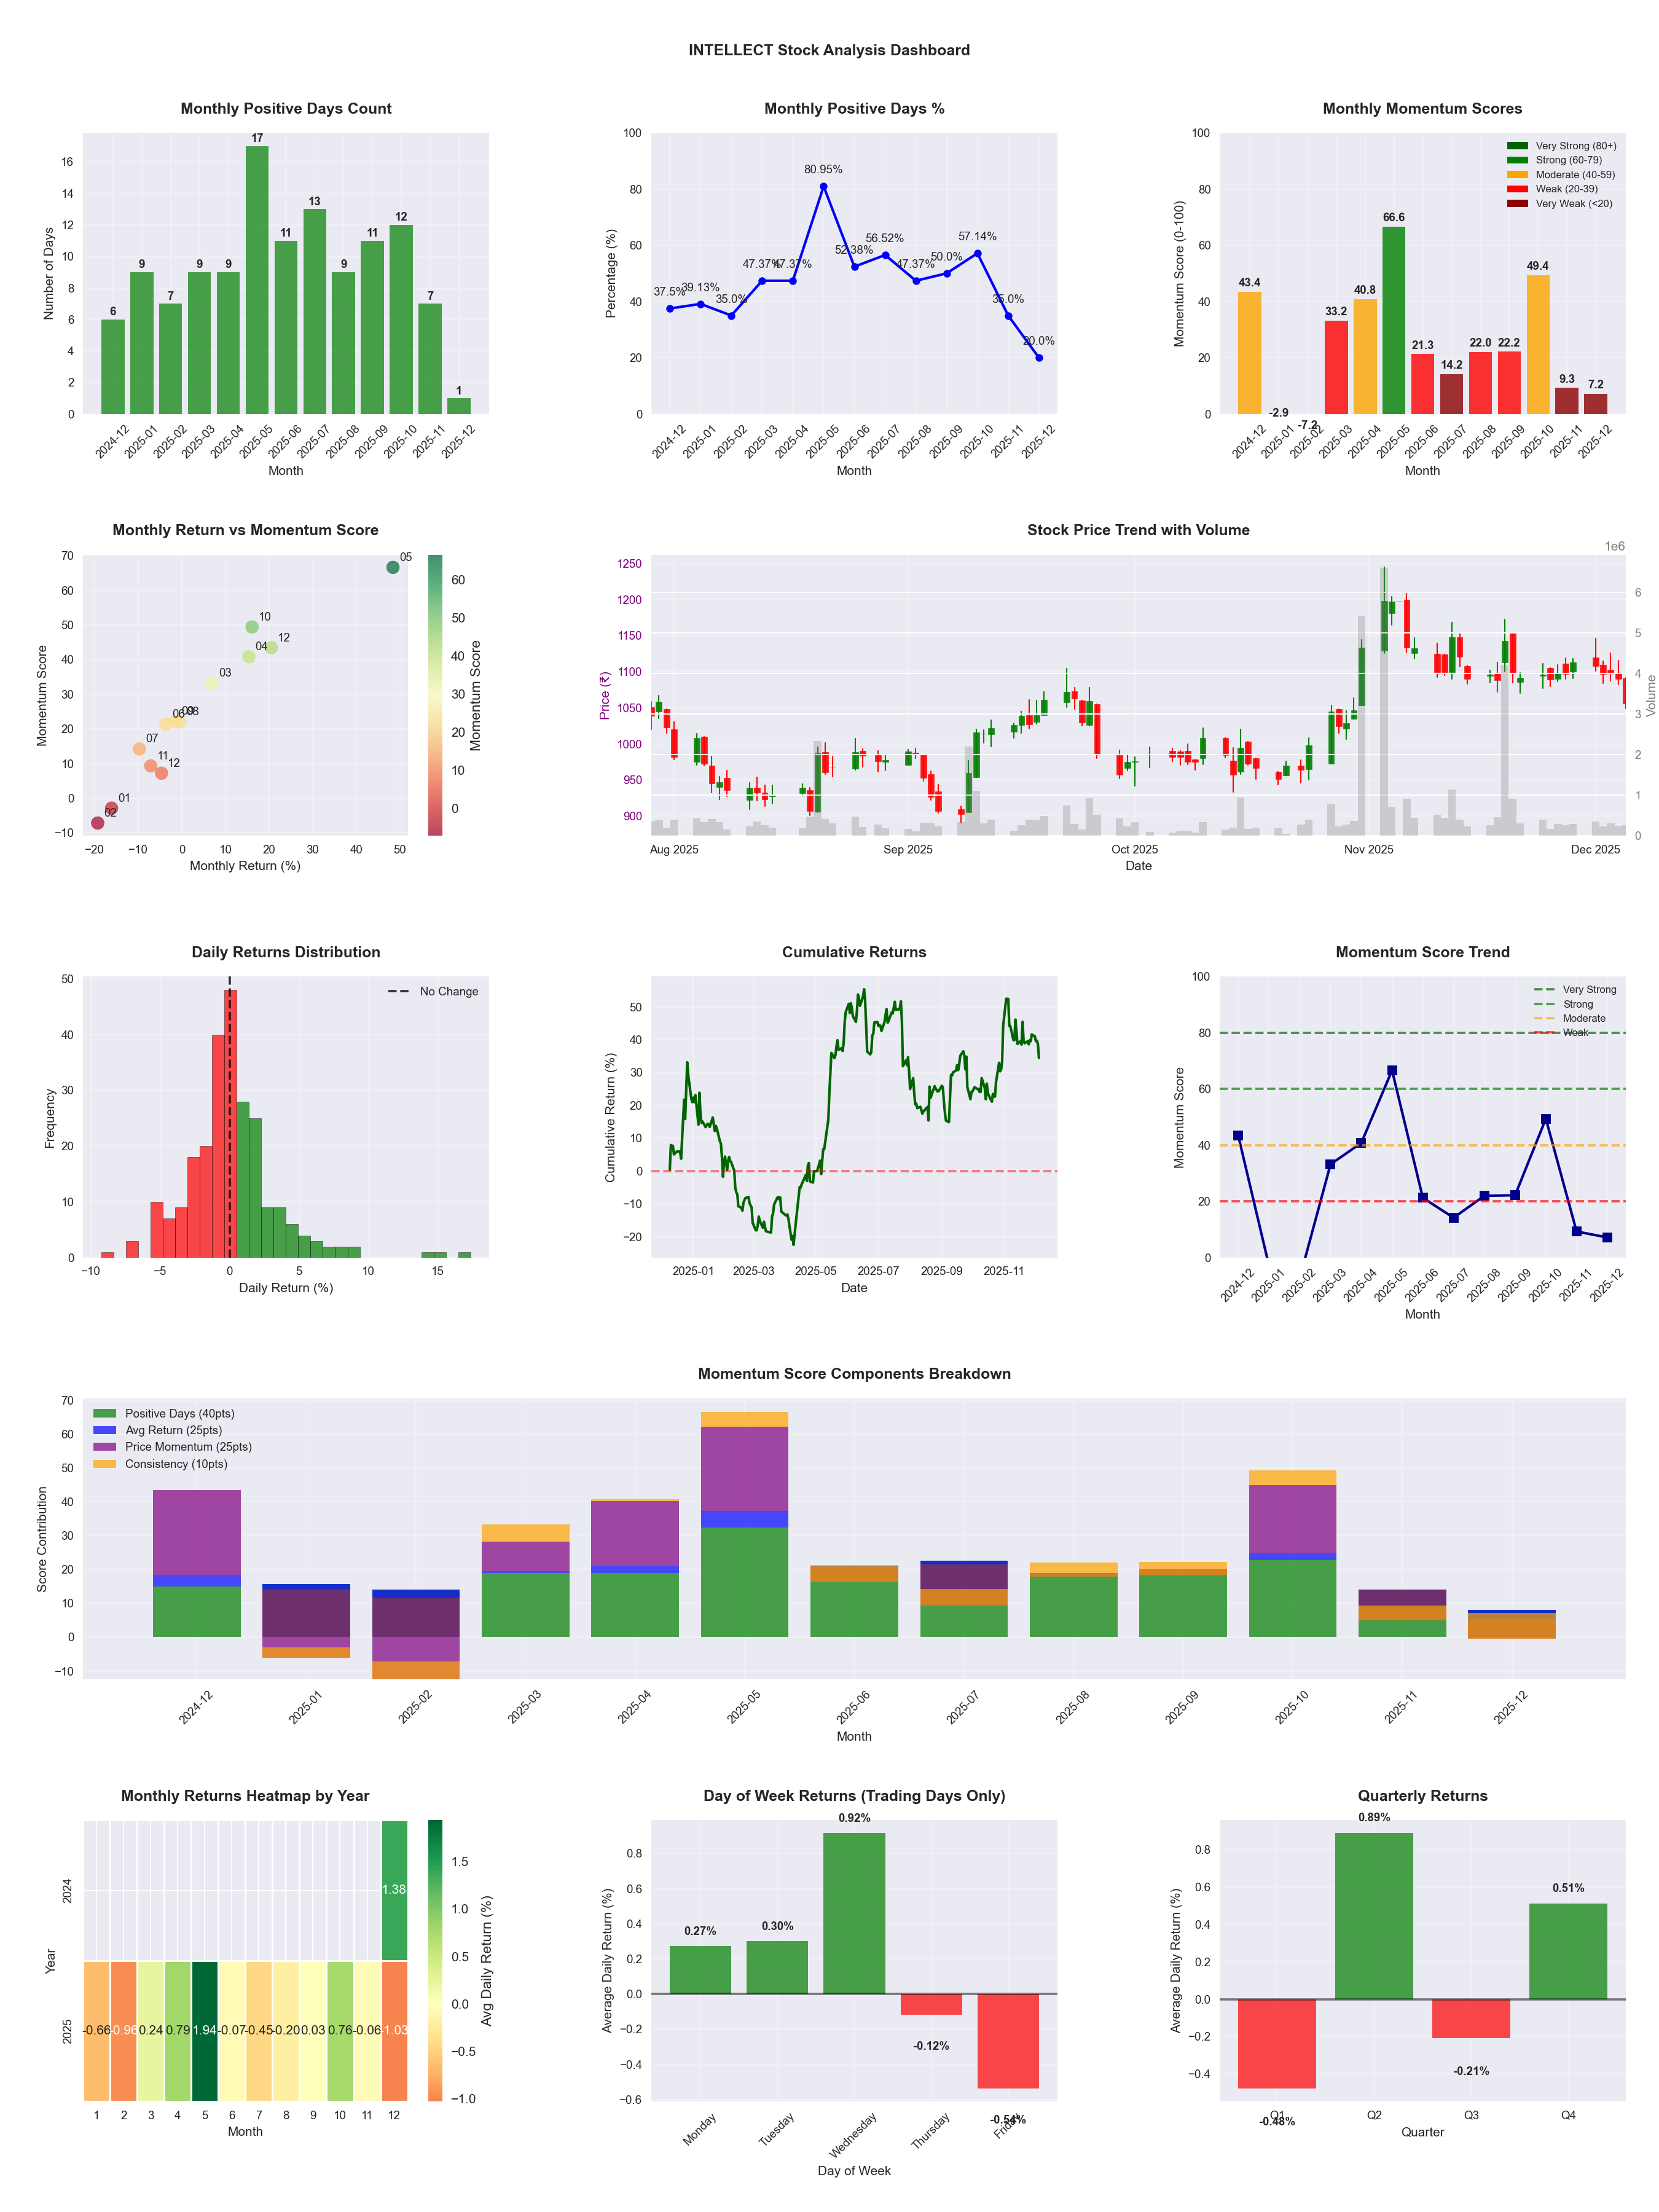
📊 Key Insights & Metrics
Symbol
📈 INTELLECT
Date
📅 2026-04-11
Volatility
🟡 2.85%
Risk Profile
⚠️ suitable for aggressive investors
Win Rate
⚠️ 49.6%
Avg Daily Return
📈 +0.05%
Max Drawdown
📉 -50.97%
IBD RS Score
📊 5.5
Weak
Market Rank
#466
Best Month
🏆 2025-05
Best Months to Trade
📅 May, Apr, Oct
Best Days to Trade
📅 Wednesday, Tuesday
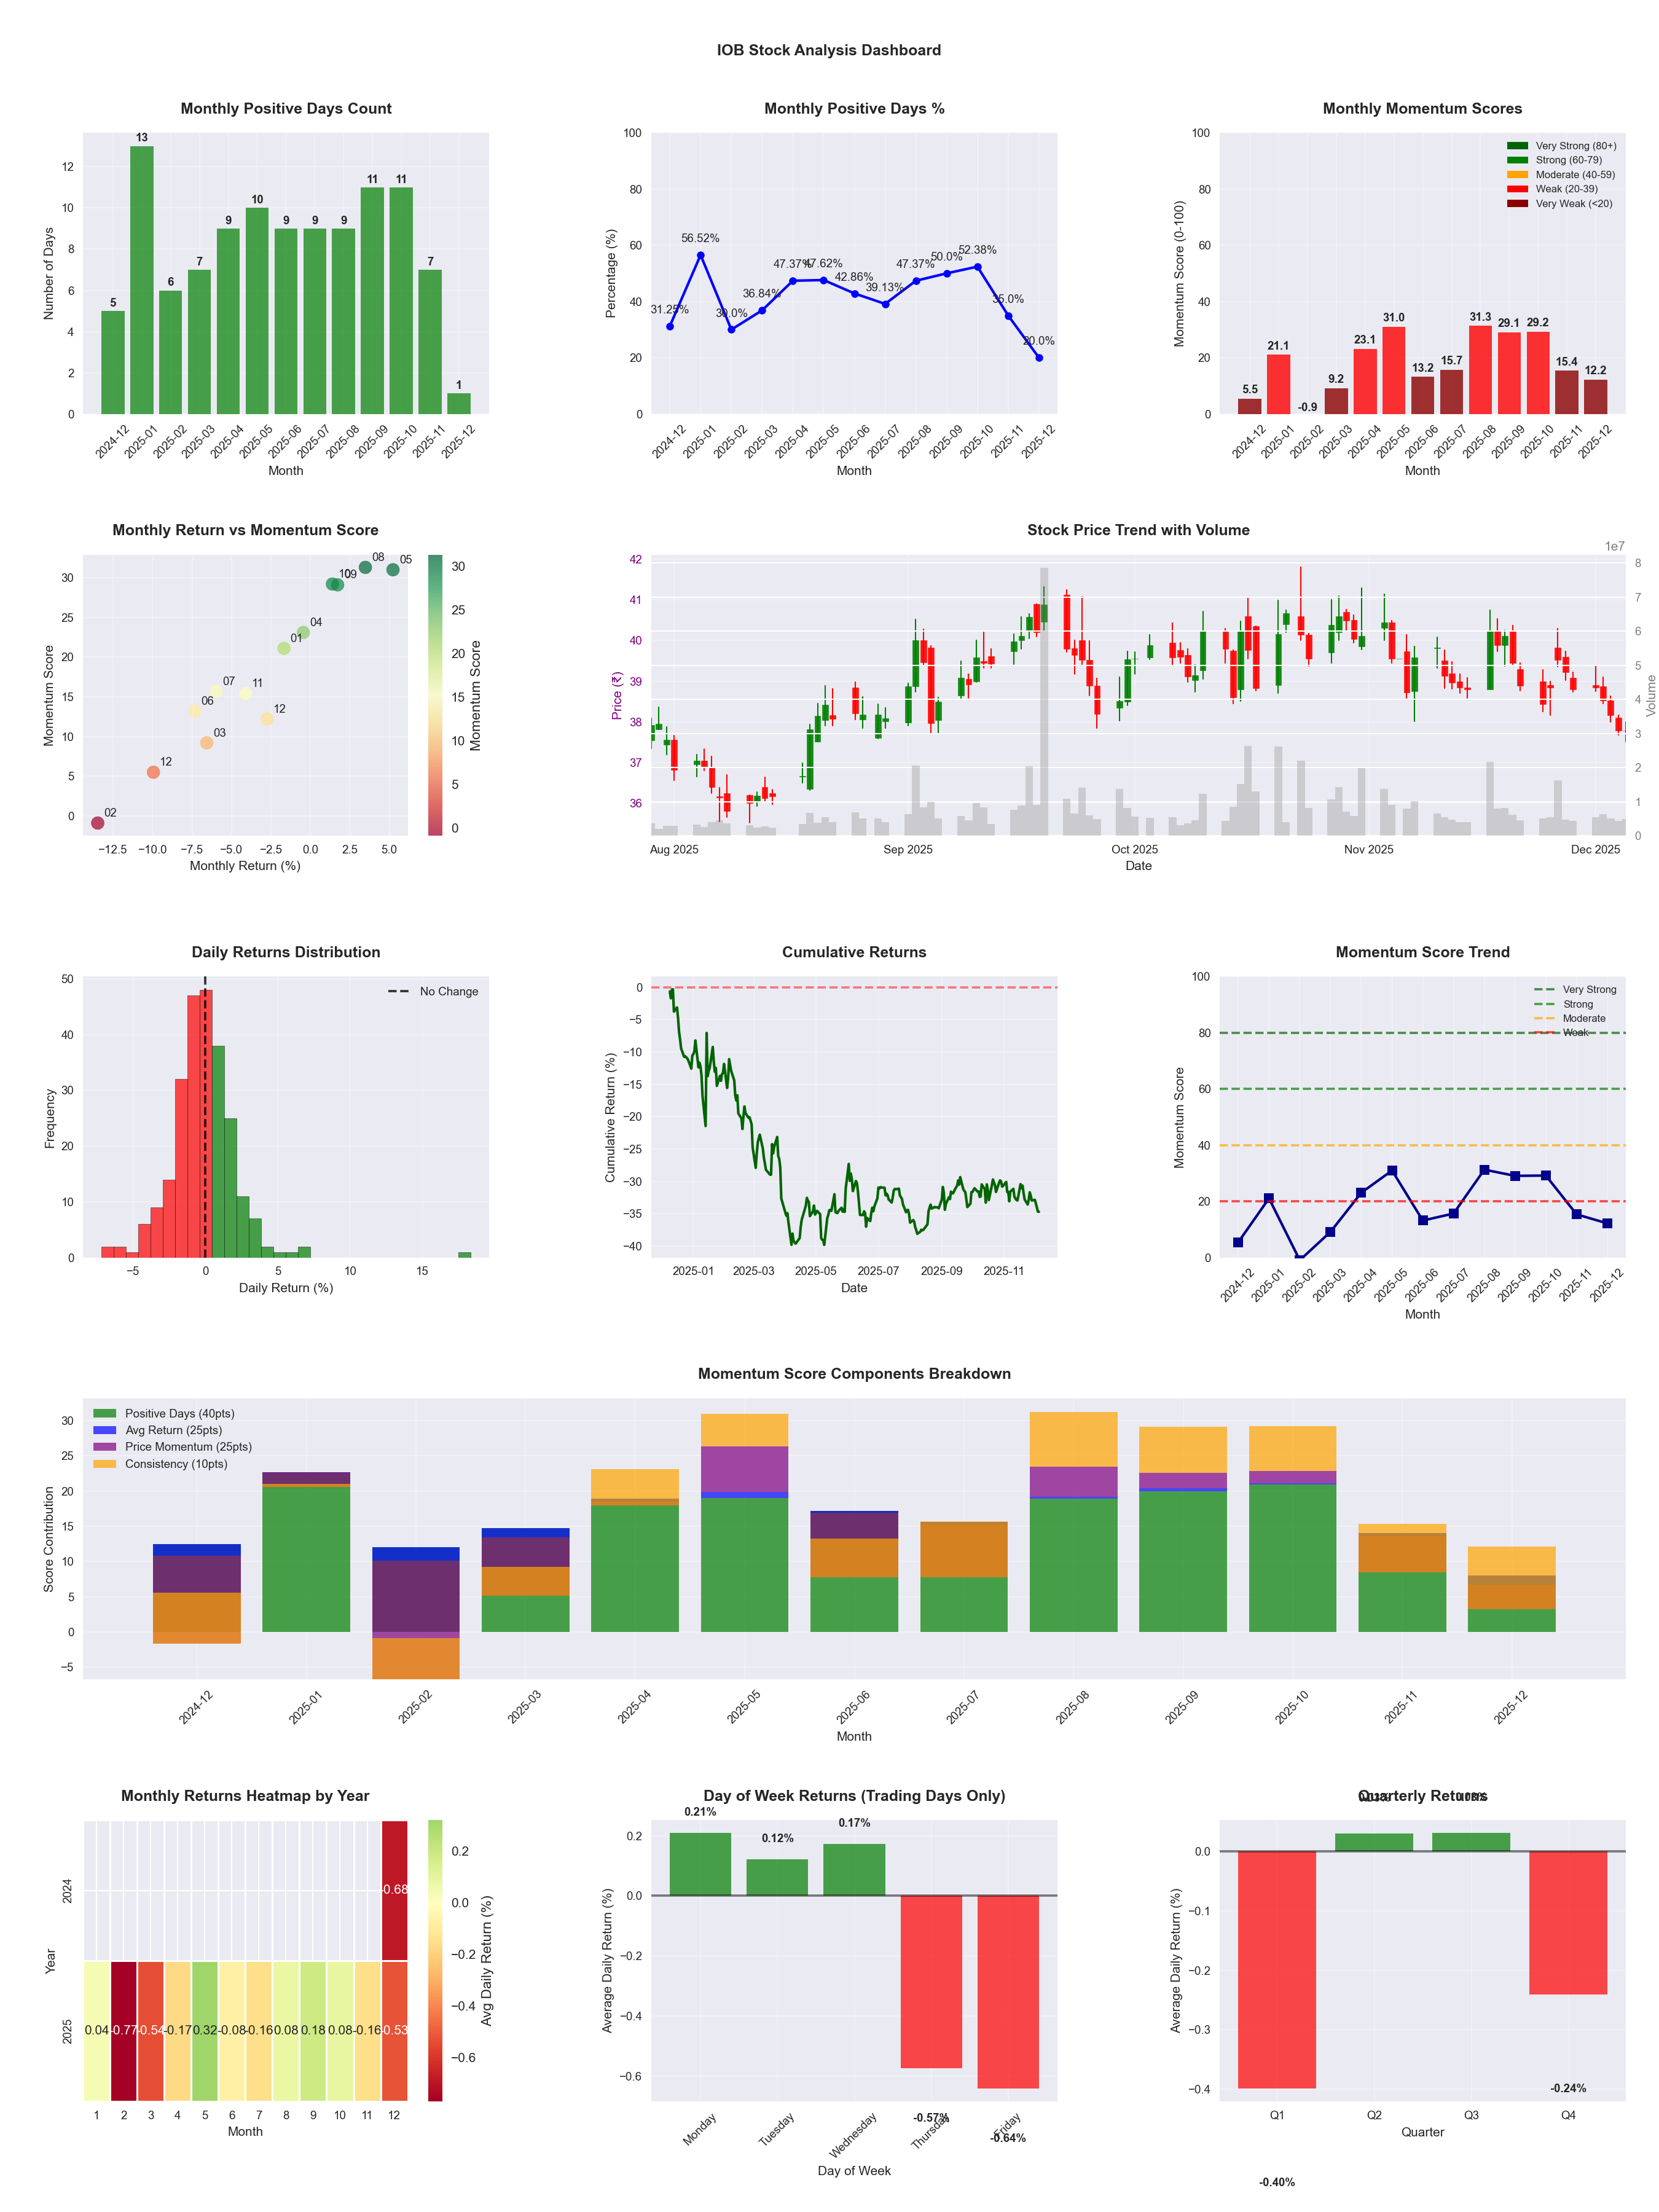
📊 Key Insights & Metrics
Symbol
📈 IOB
Date
📅 2026-04-11
Volatility
🟡 1.90%
Win Rate
⚠️ 45.1%
Avg Daily Return
📈 +0.02%
Max Drawdown
📉 -25.39%
IBD RS Score
📊 46.9
Weak
Market Rank
#262
Best Month
🏆 2026-04
Worst Month
📉 2026-03
Best Months to Trade
📅 Apr, May, Sep
Best Days to Trade
📅 Monday, Wednesday
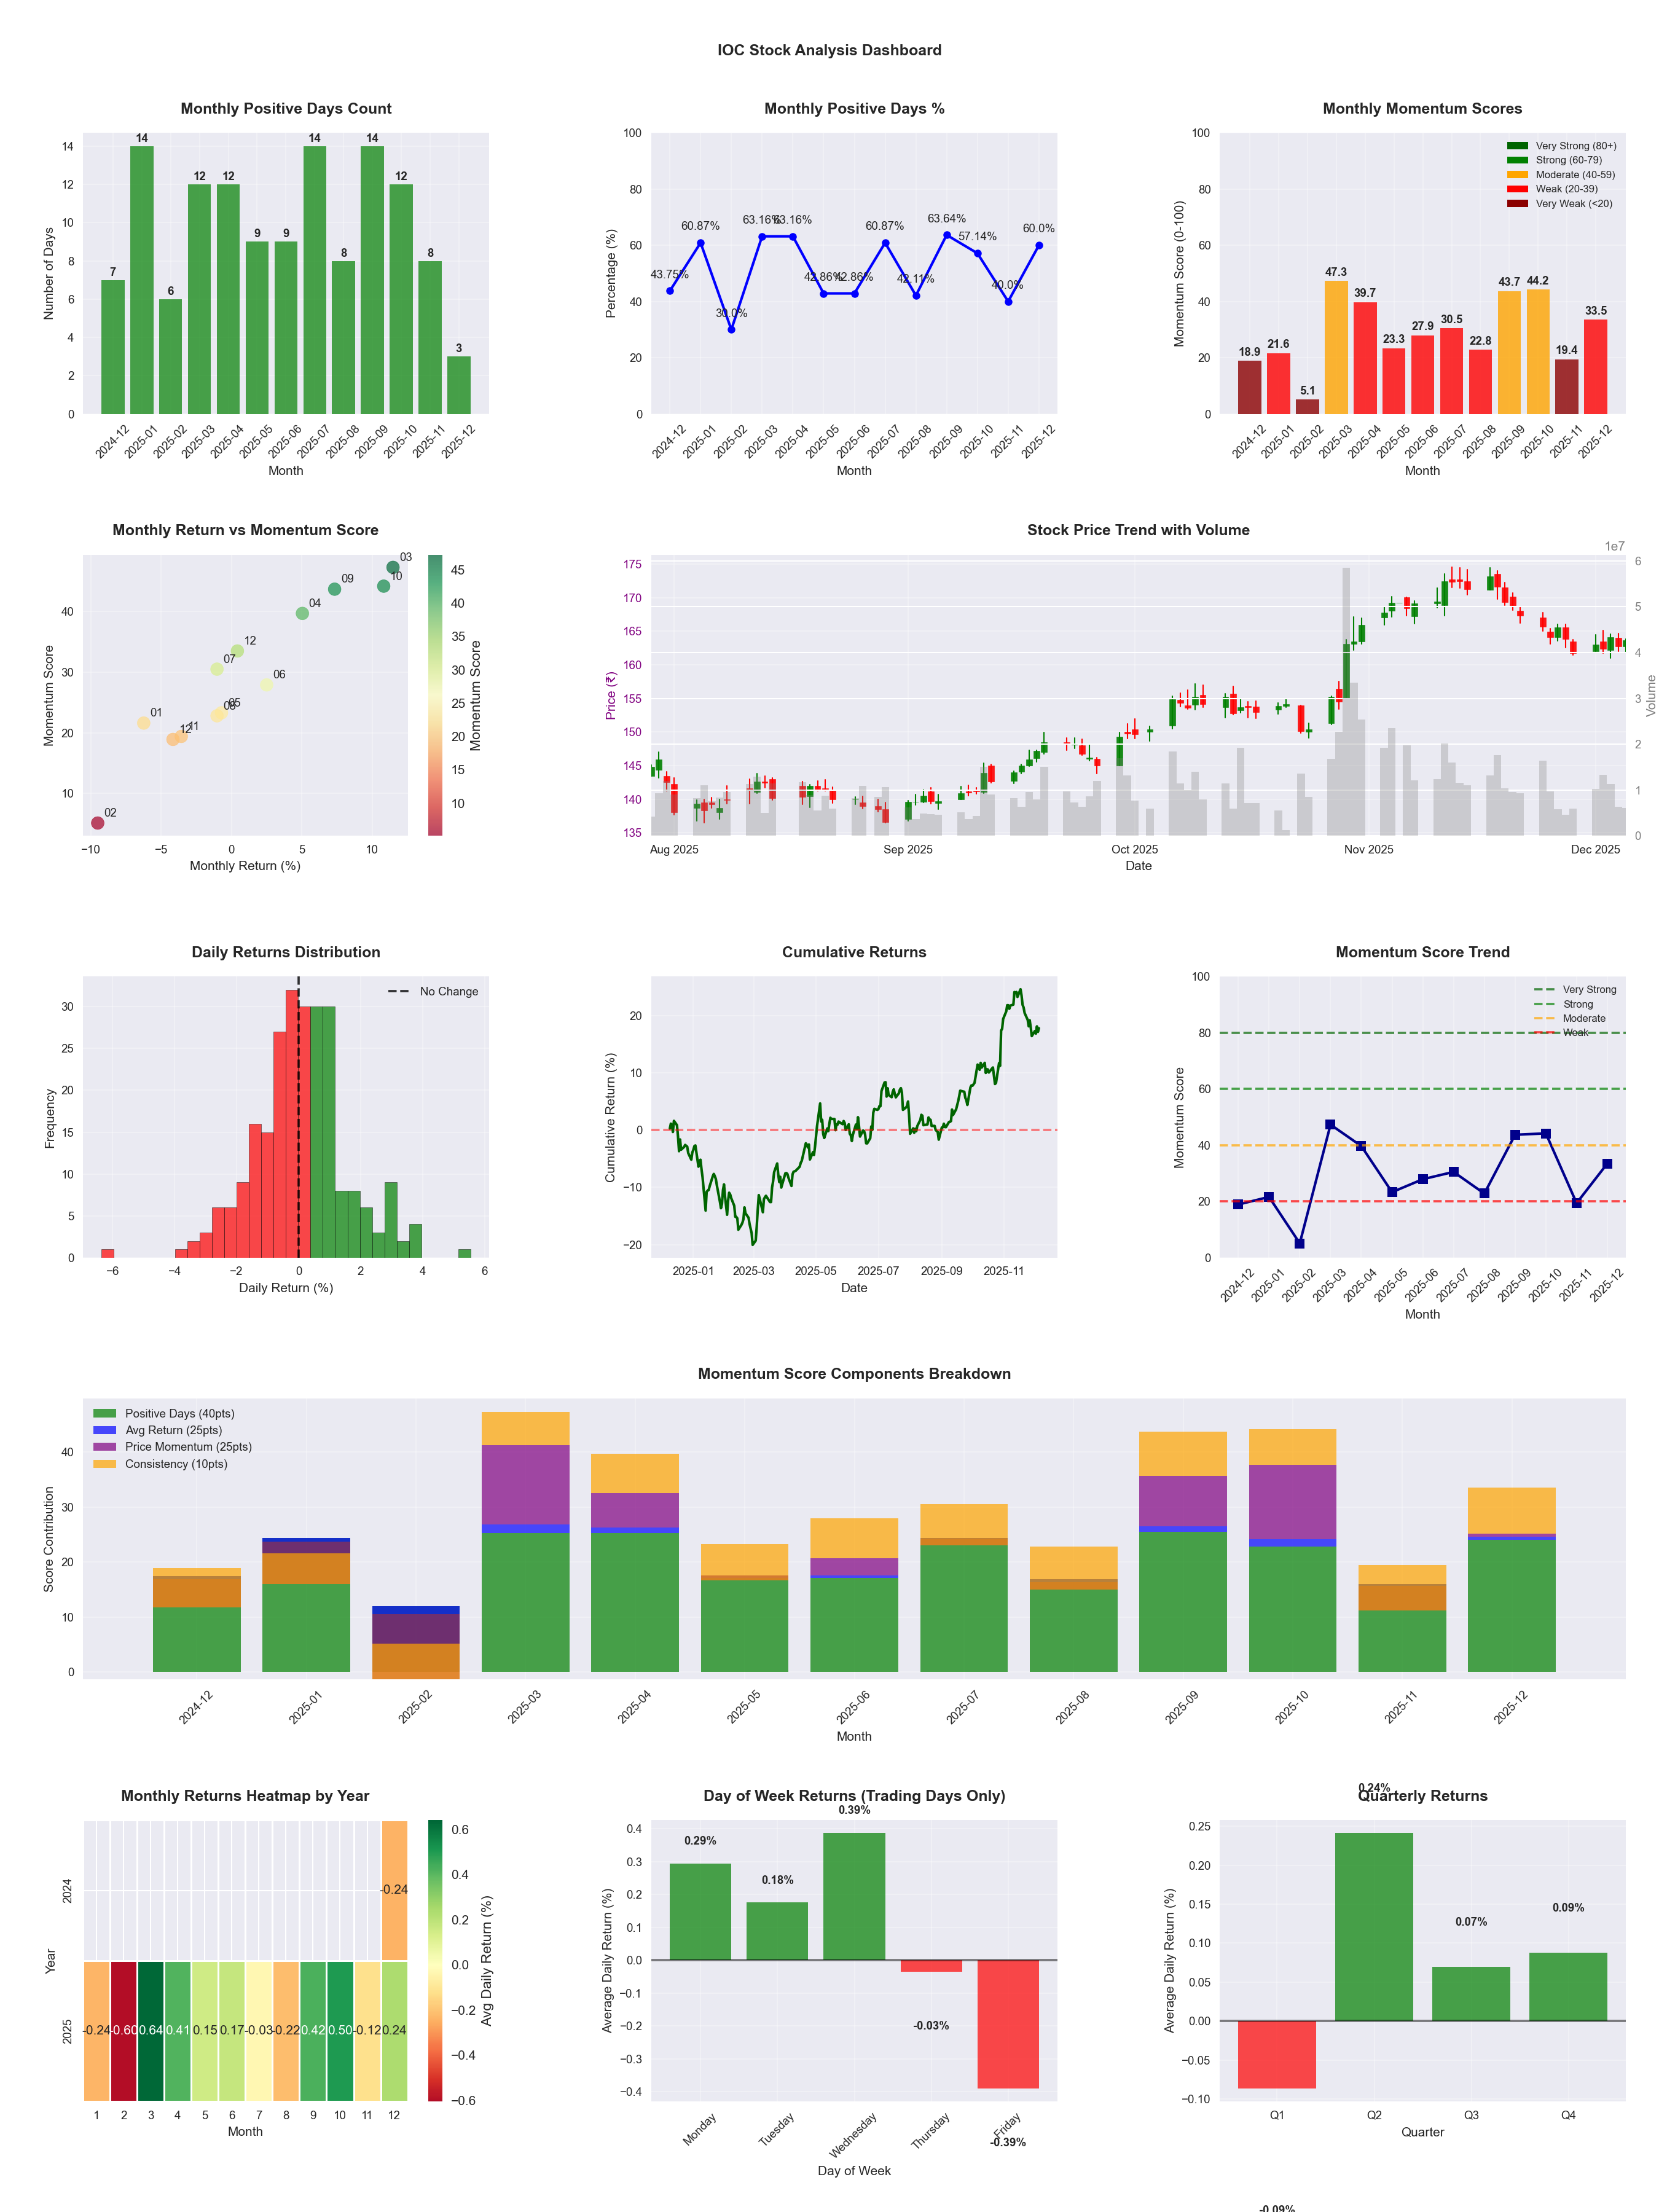
📊 Key Insights & Metrics
Symbol
📈 IOC
Date
📅 2026-04-11
Volatility
🟡 1.55%
Win Rate
⚠️ 52.4%
Avg Daily Return
📈 +0.07%
Max Drawdown
📉 -27.59%
IBD RS Score
📊 61.7
Average
Market Rank
#189
Best Month
🏆 2026-02
Best Months to Trade
📅 Feb, Apr, Oct
Best Days to Trade
📅 Wednesday, Monday
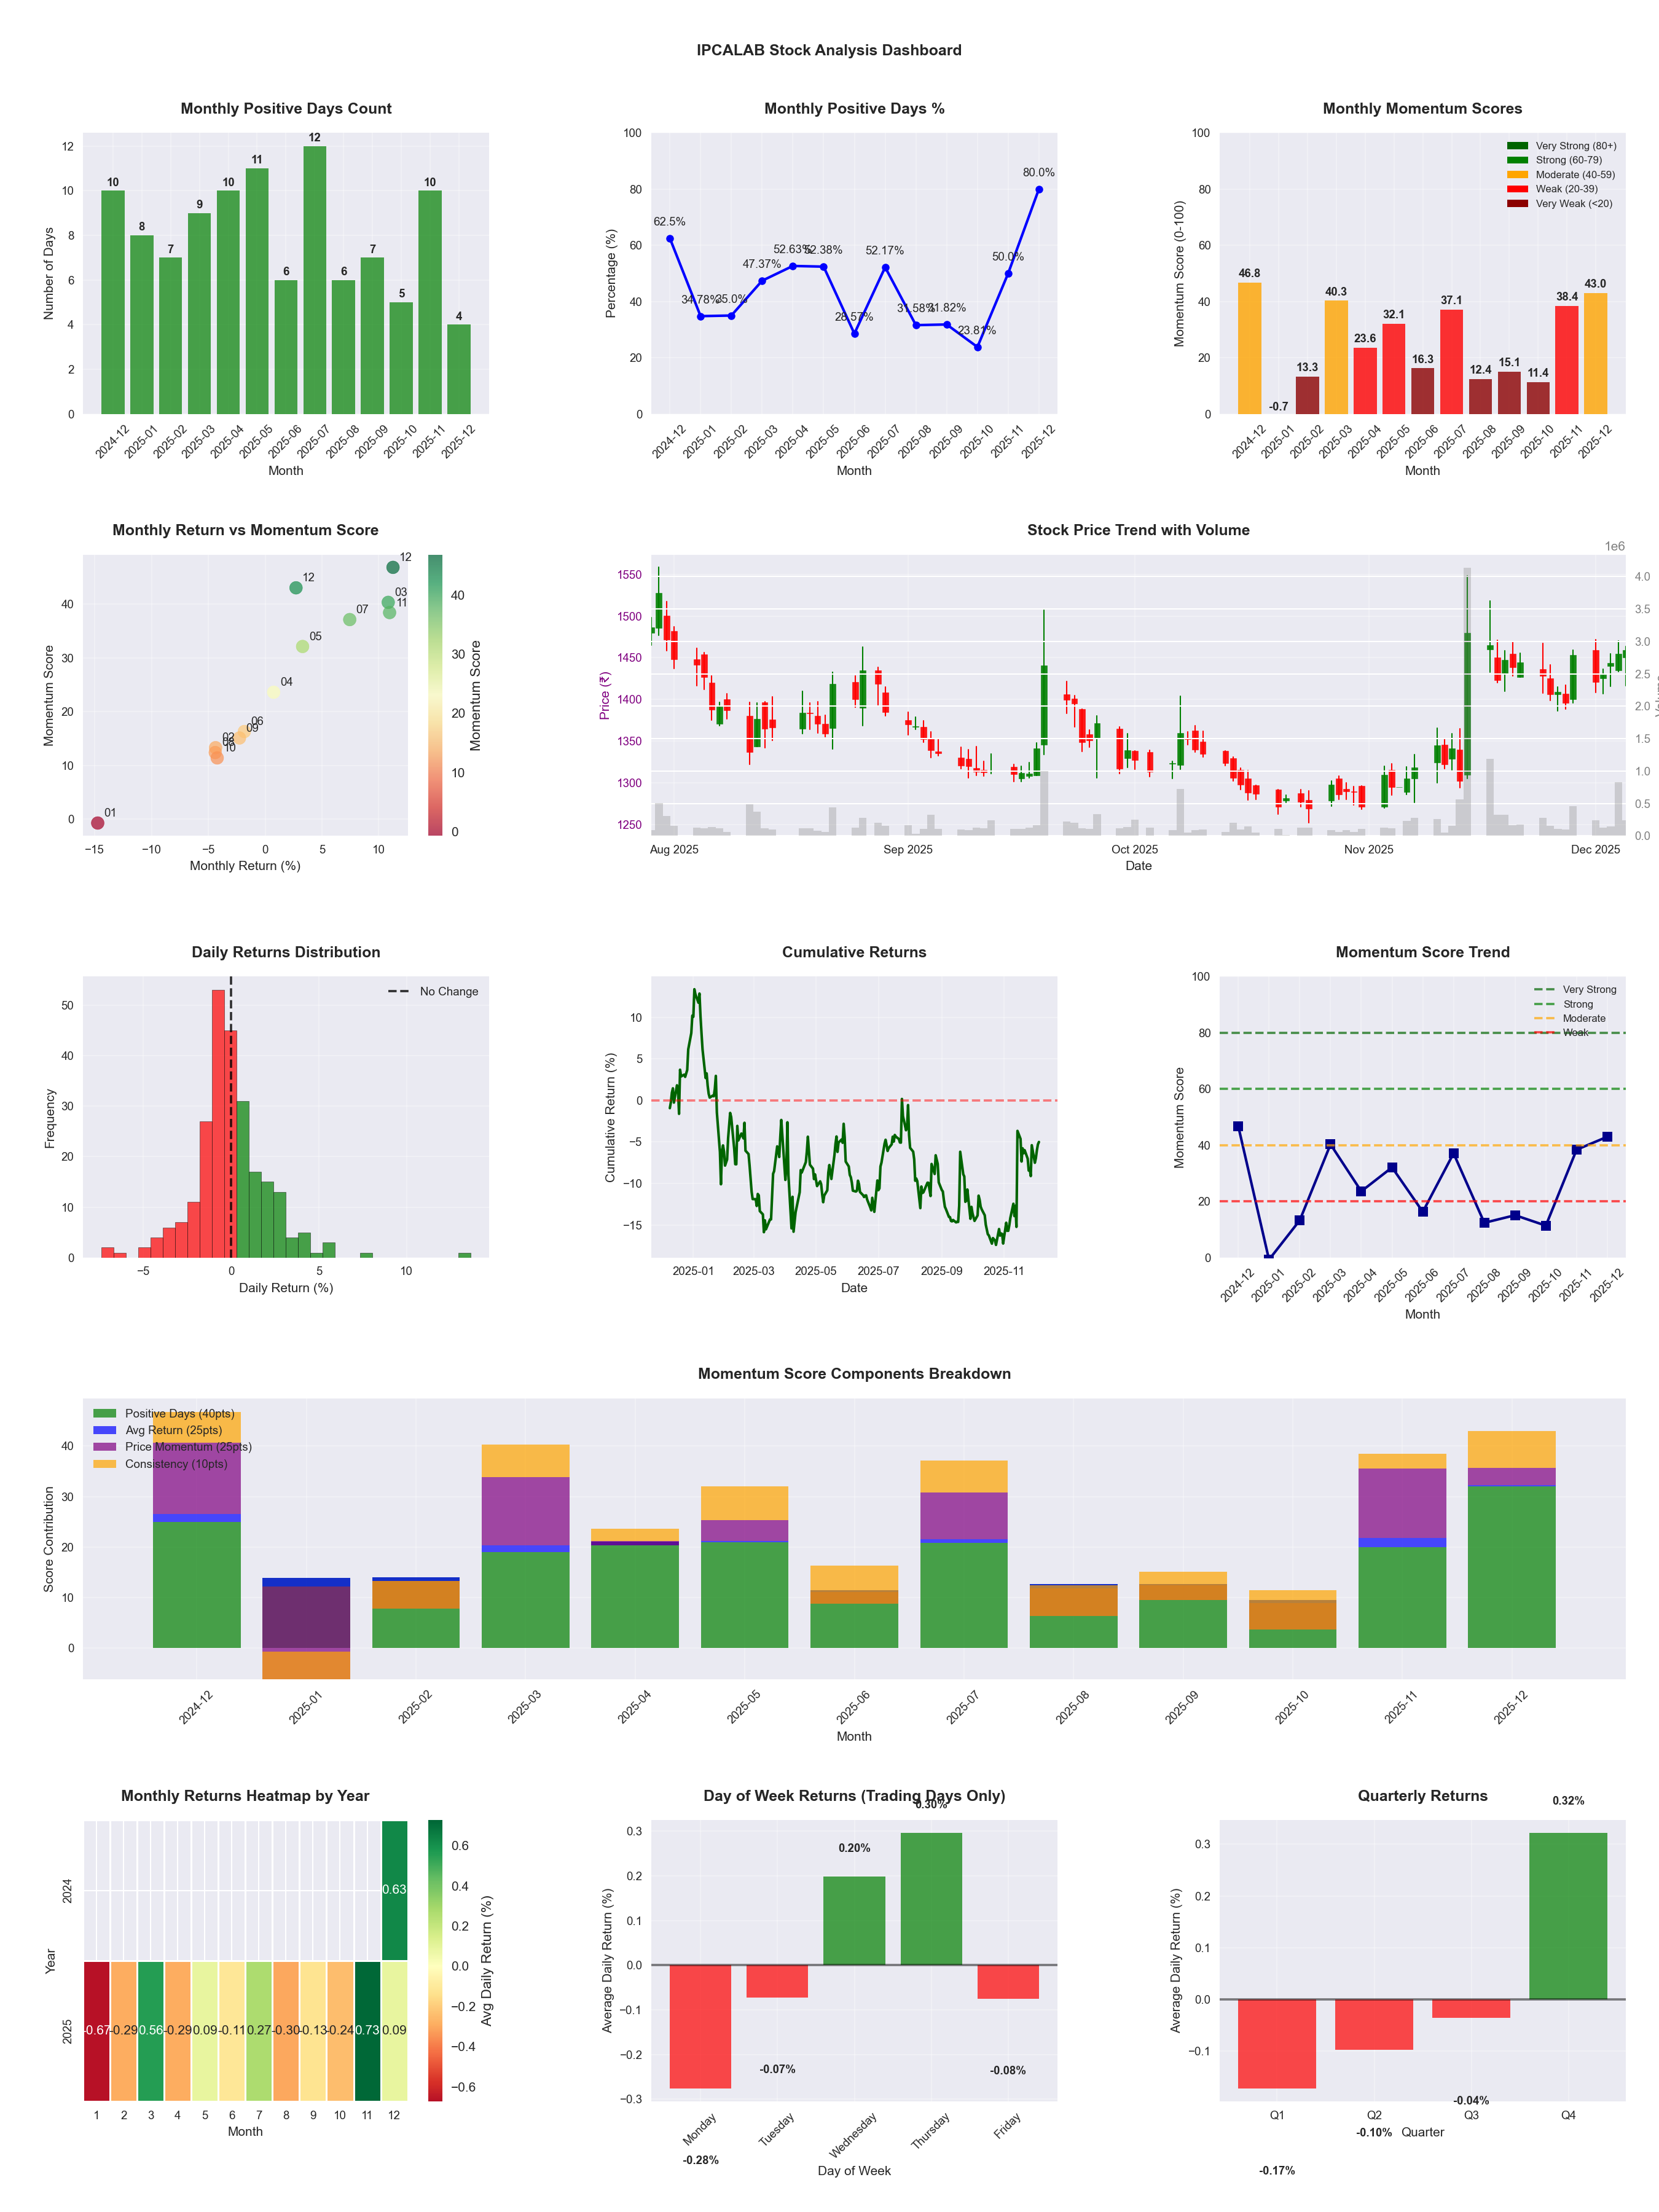
📊 Key Insights & Metrics
Symbol
📈 IPCALAB
Date
📅 2026-04-11
Volatility
🟡 1.90%
Win Rate
⚠️ 45.3%
Avg Daily Return
📈 +0.05%
Max Drawdown
📉 -17.55%
IBD RS Score
📊 64.1
Average
Market Rank
#177
Best Month
🏆 2026-03
Worst Month
📉 2025-10
Best Months to Trade
📅 Nov, Jul, Mar
Best Days to Trade
📅 Friday, Wednesday
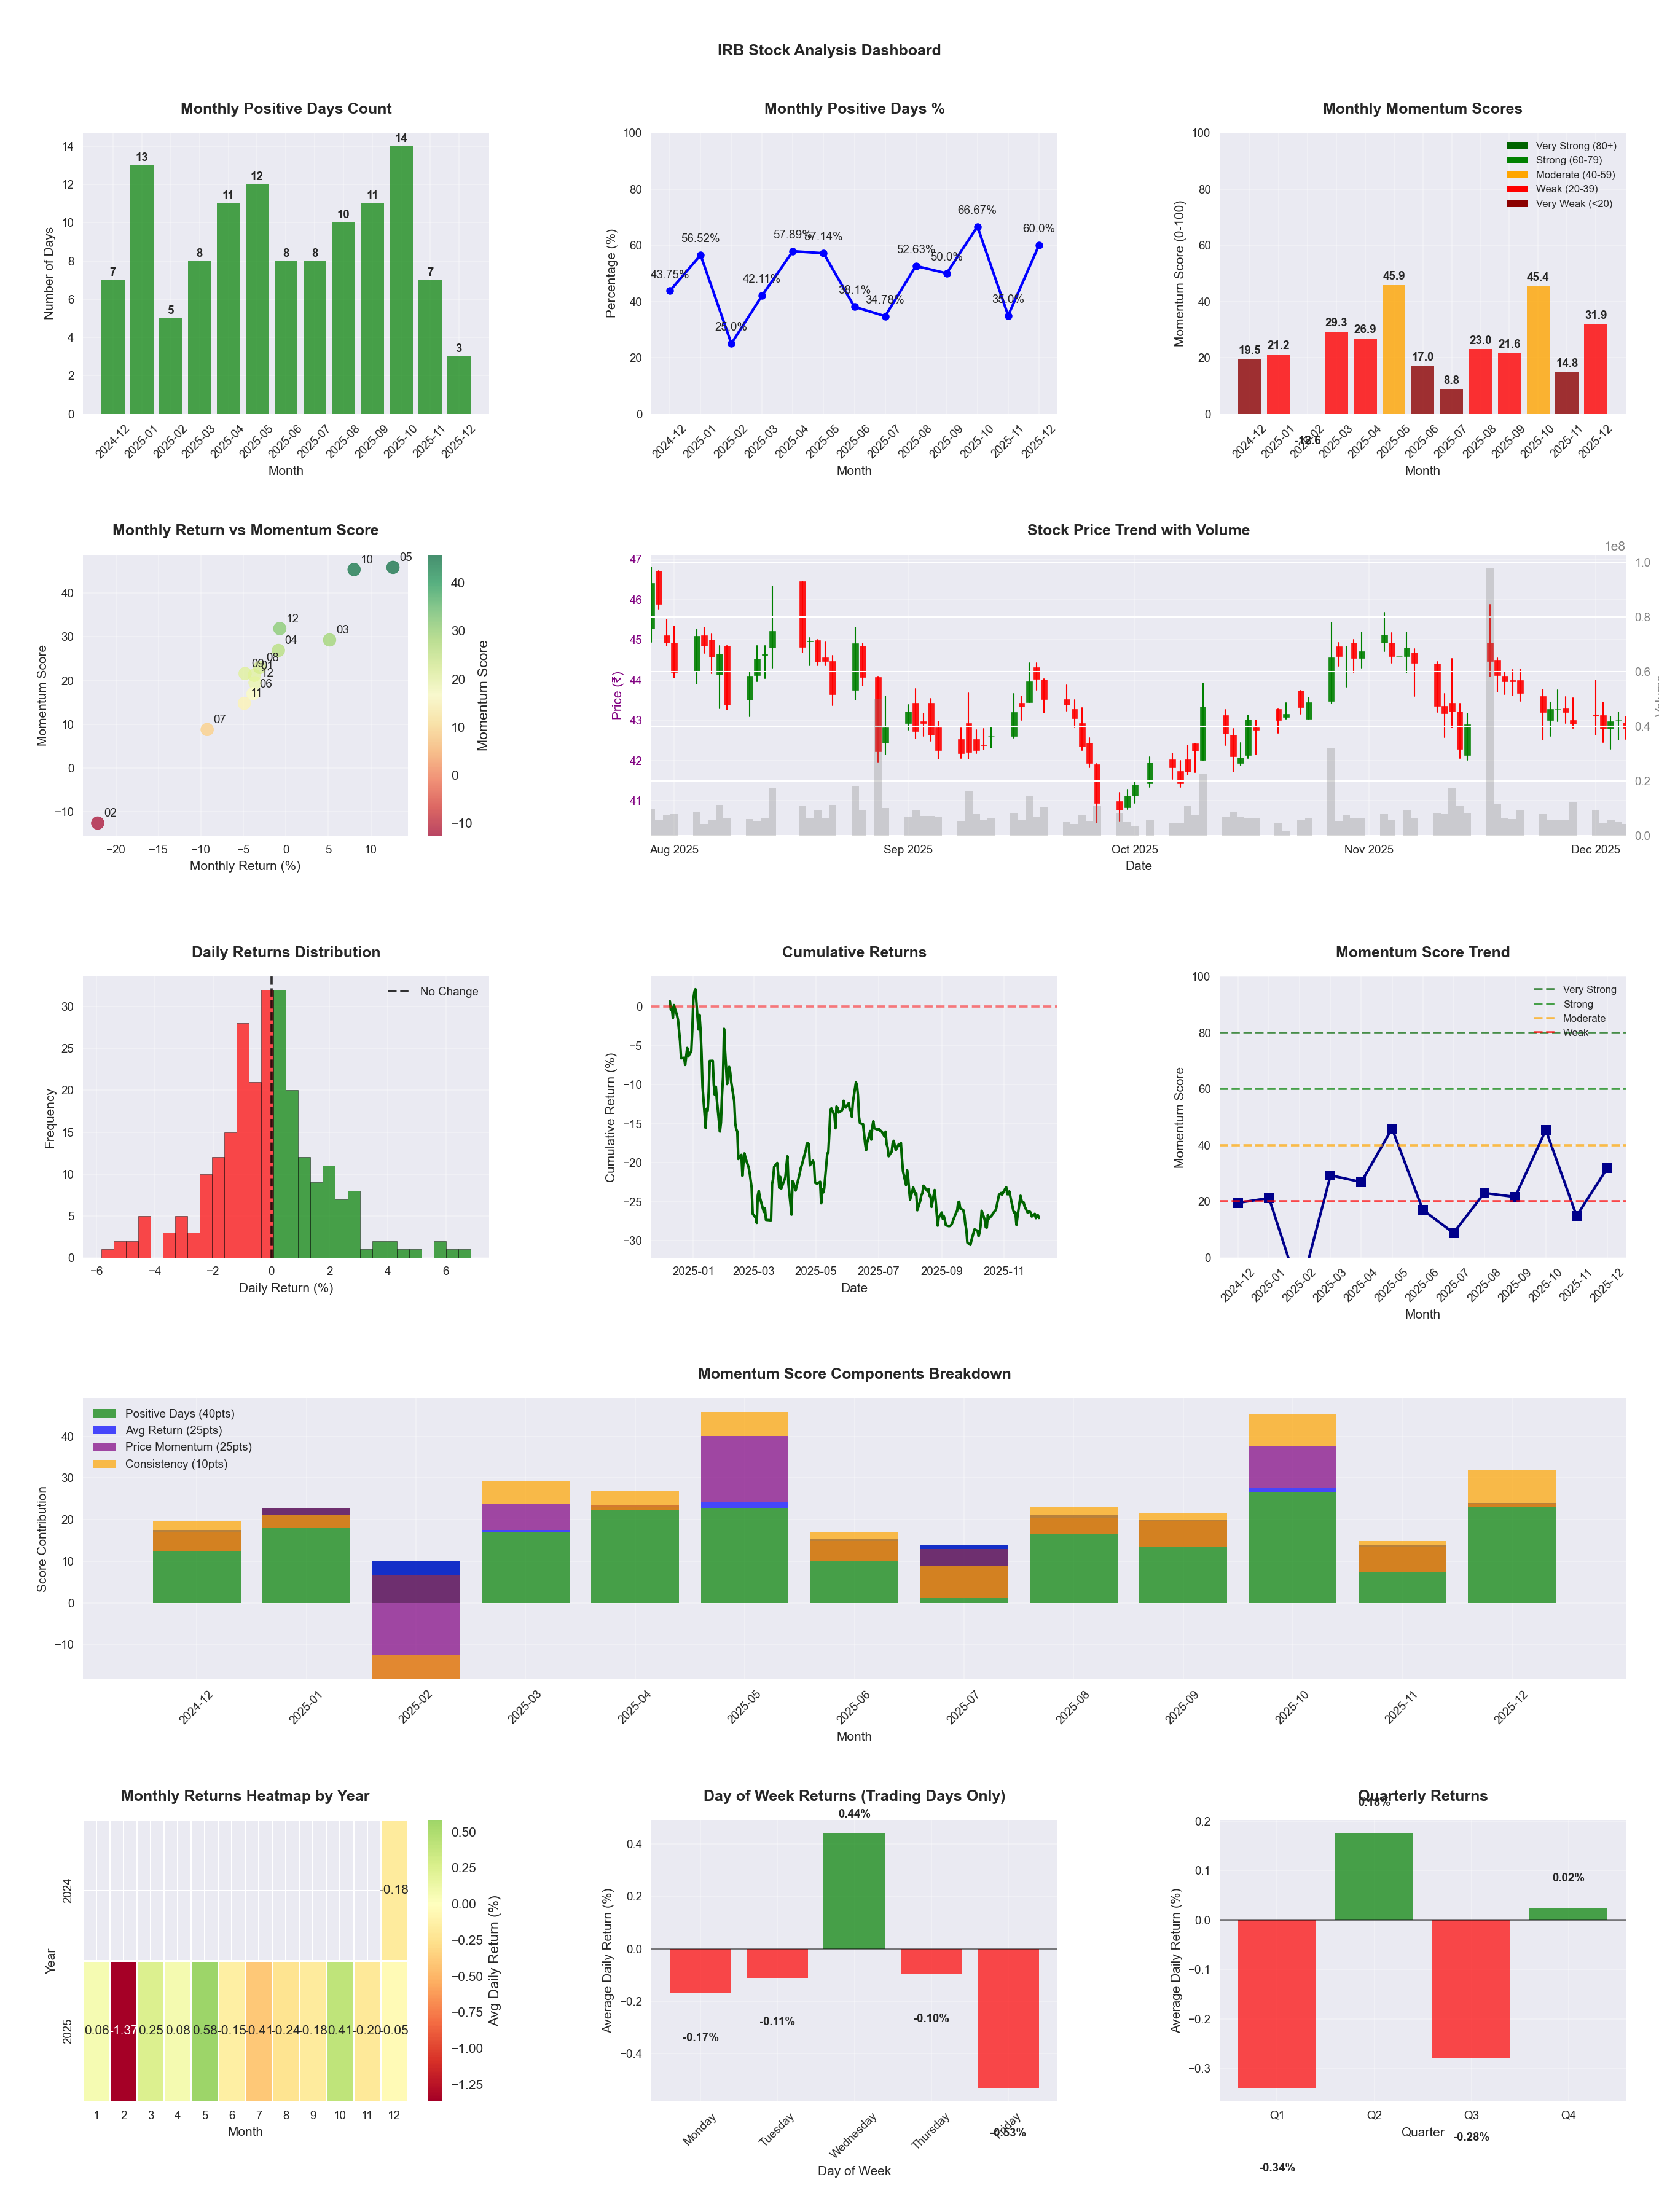
📊 Key Insights & Metrics
Symbol
📈 IRB
Date
📅 2026-04-11
Volatility
🟡 1.65%
Win Rate
⚠️ 48.4%
Avg Daily Return
📉 -0.00%
Max Drawdown
📉 -26.42%
IBD RS Score
📊 61.5
Average
Market Rank
#190
Best Month
🏆 2025-05
Worst Month
📉 2025-07
Best Months to Trade
📅 May, Oct, Mar
Best Days to Trade
📅 Wednesday, Monday
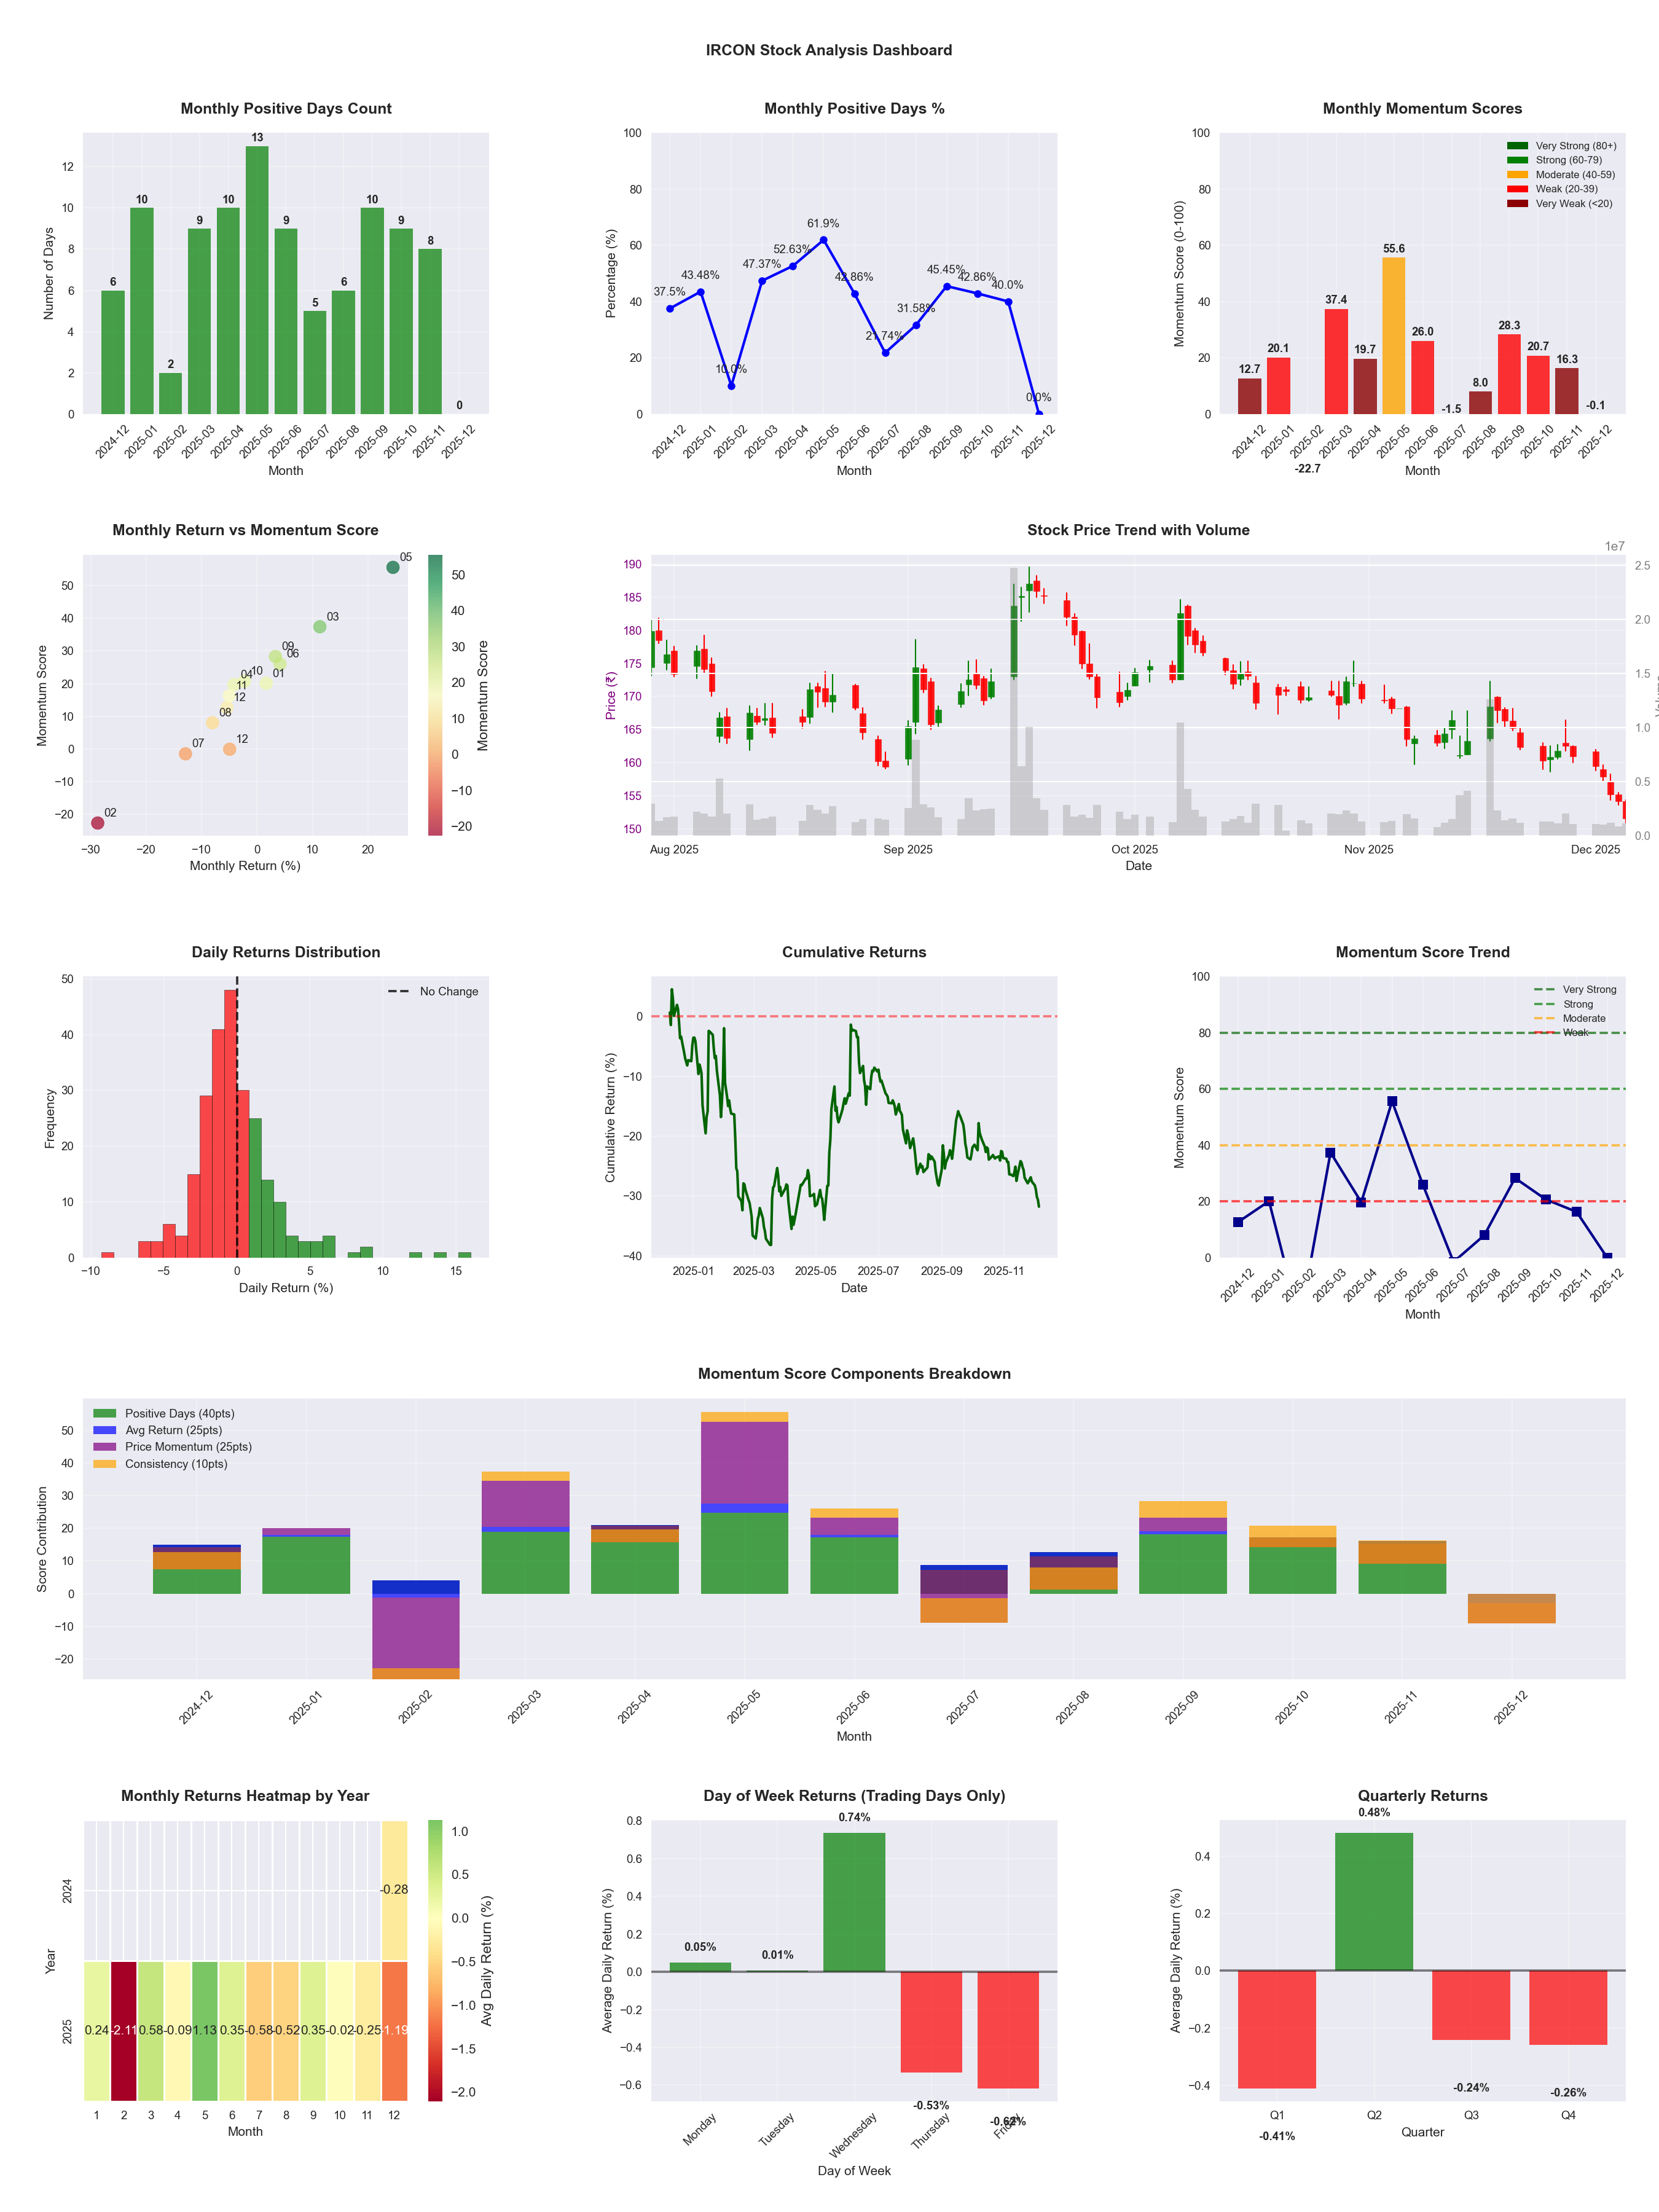
📊 Key Insights & Metrics
Symbol
📈 IRCON
Date
📅 2026-04-11
Volatility
🟡 2.69%
Risk Profile
⚠️ suitable for aggressive investors
Win Rate
⚠️ 41.5%
Avg Daily Return
📉 +0.00%
Max Drawdown
📉 -47.01%
IBD RS Score
📊 16.4
Weak
Market Rank
#412
Best Month
🏆 2025-05
Best Months to Trade
📅 May, Apr, Dec
Best Days to Trade
📅 Wednesday, Tuesday
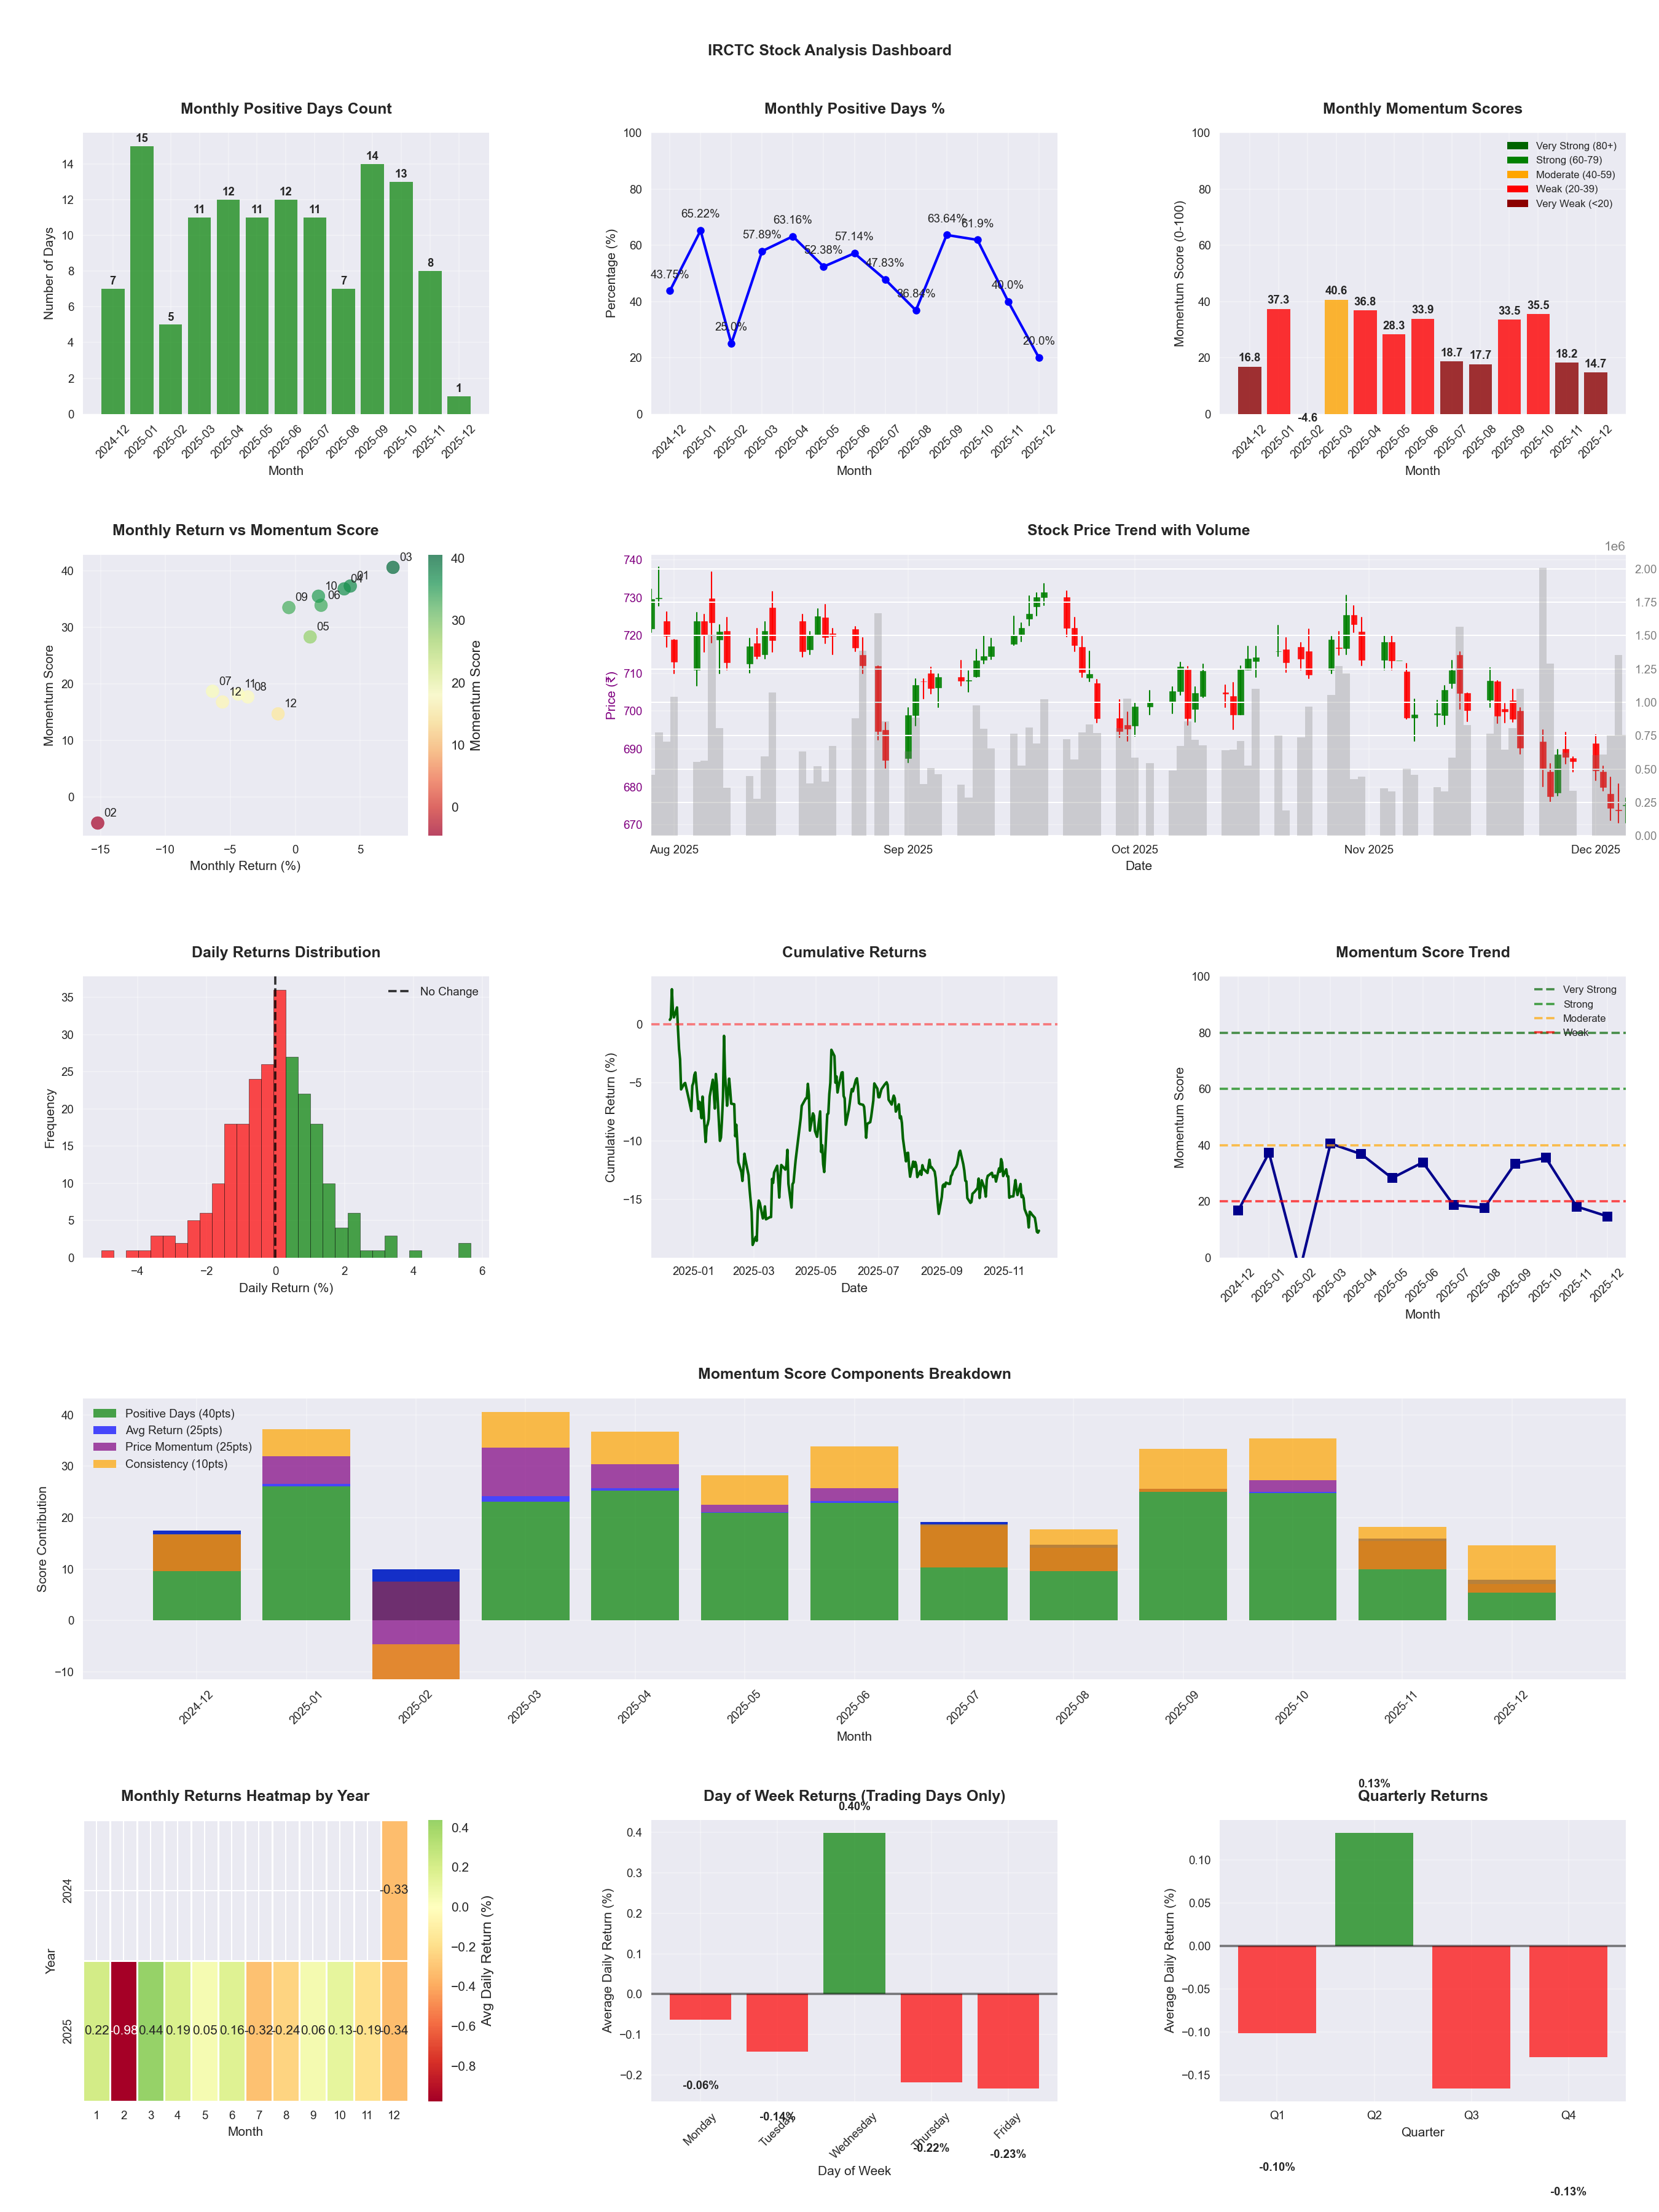
📊 Key Insights & Metrics
Symbol
📈 IRCTC
Date
📅 2026-04-11
Volatility
🟢 1.39%
Win Rate
⚠️ 49.2%
Avg Daily Return
📉 -0.11%
Max Drawdown
📉 -38.01%
IBD RS Score
📊 12.2
Weak
Market Rank
#433
Best Month
🏆 2026-04
Worst Month
📉 2026-03
Best Months to Trade
📅 Apr, Jun, Oct
Best Days to Trade
📅 Wednesday, Monday
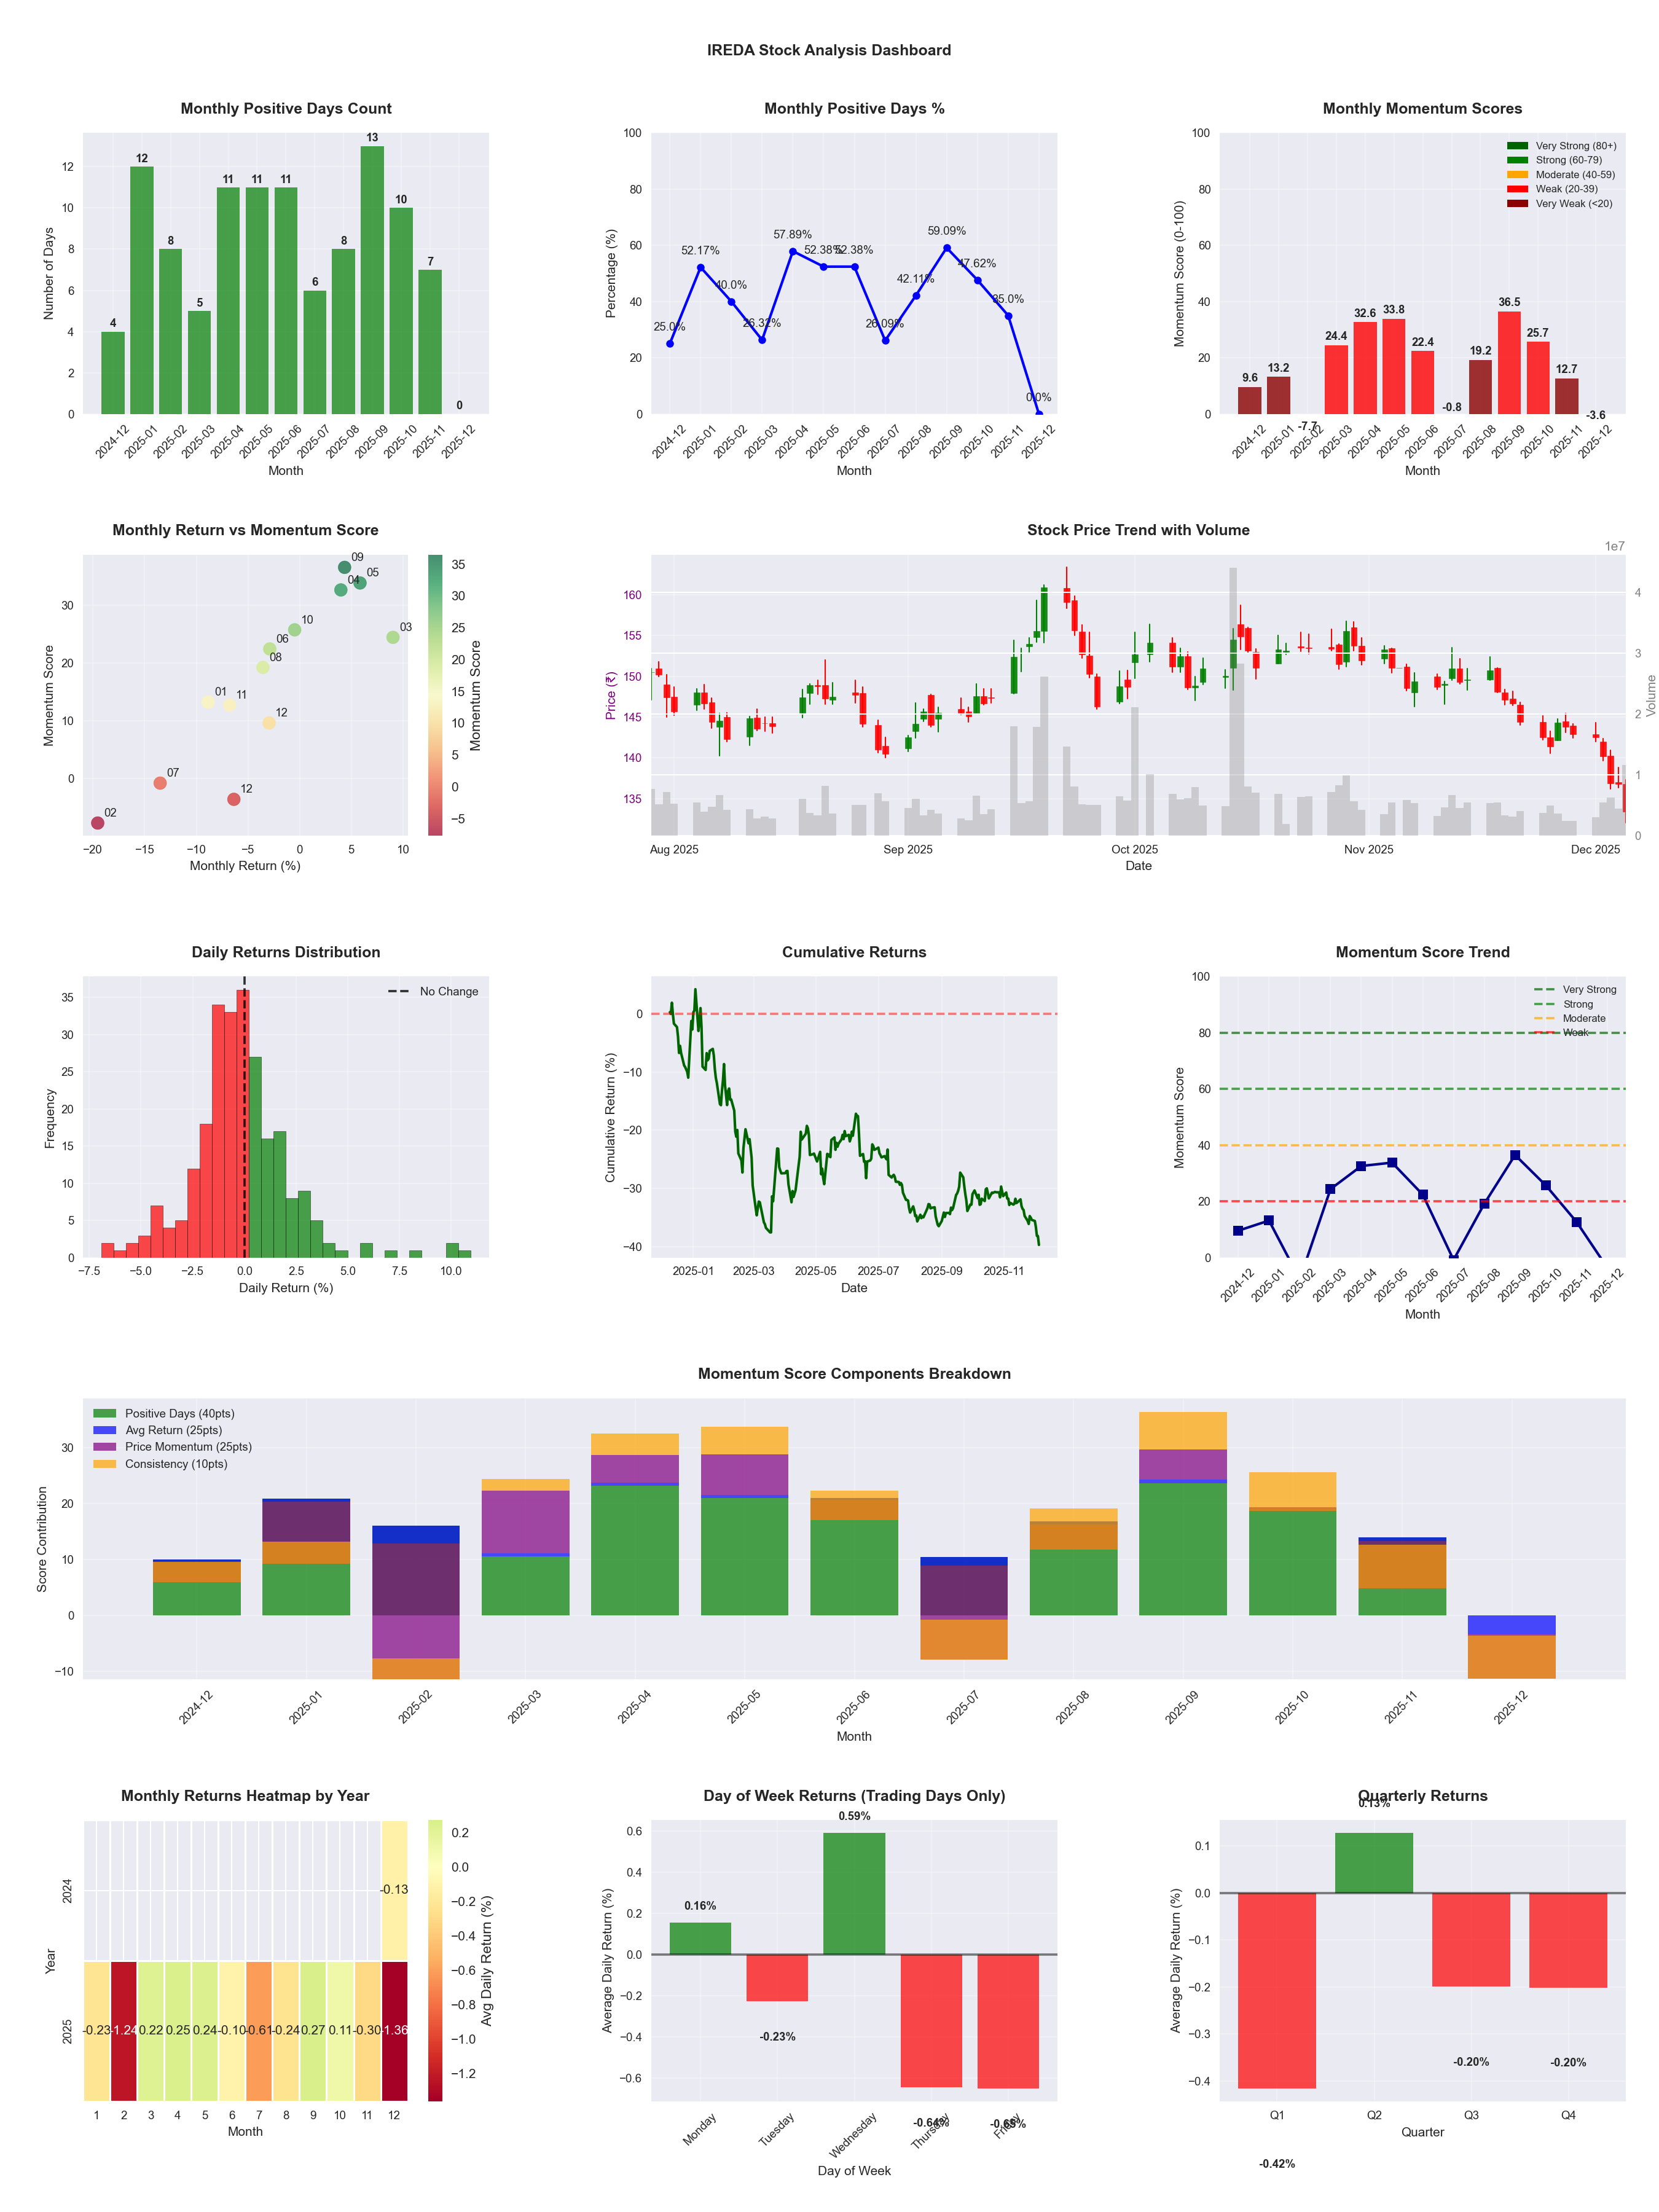
📊 Key Insights & Metrics
Symbol
📈 IREDA
Date
📅 2026-04-11
Volatility
🟡 2.03%
Risk Profile
⚠️ suitable for aggressive investors
Win Rate
⚠️ 44.7%
Avg Daily Return
📉 -0.07%
Max Drawdown
📉 -40.53%
IBD RS Score
📊 19.3
Weak
Market Rank
#398
Best Month
🏆 2026-04
Best Months to Trade
📅 Apr, Sep, May
Best Days to Trade
📅 Wednesday, Monday
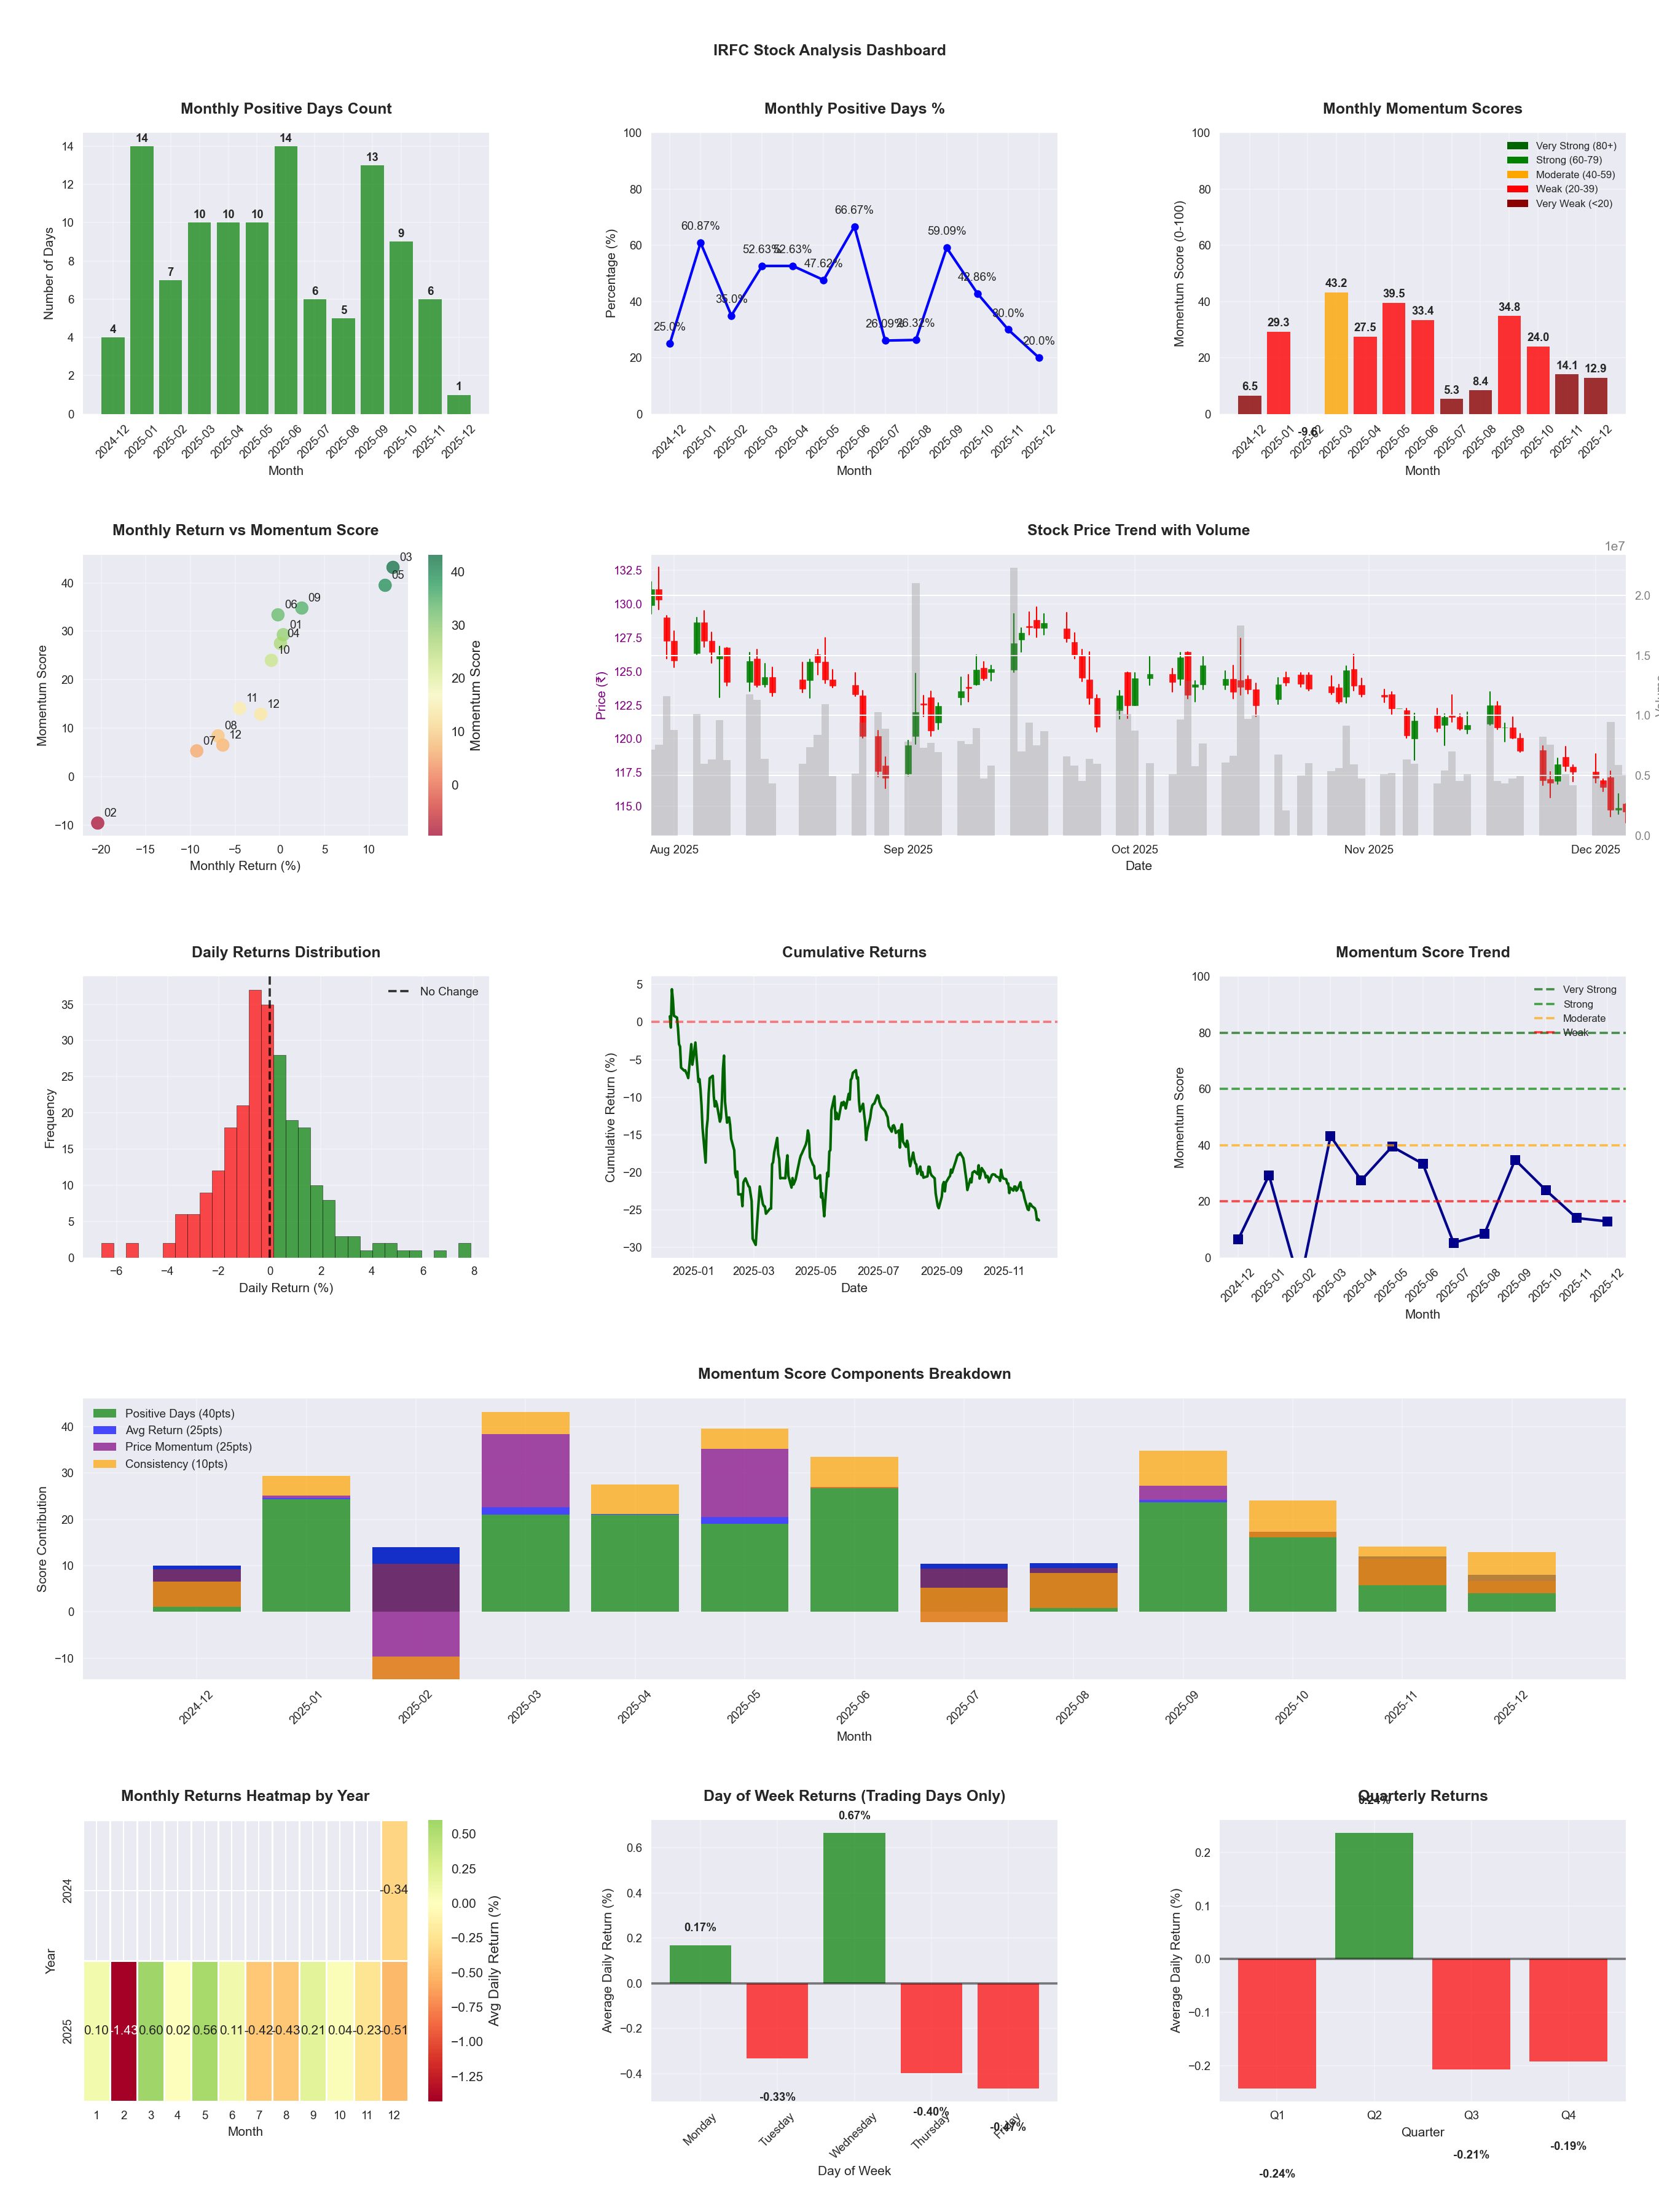
📊 Key Insights & Metrics
Symbol
📈 IRFC
Date
📅 2026-04-11
Volatility
🟡 1.94%
Win Rate
⚠️ 45.1%
Avg Daily Return
📉 -0.06%
Max Drawdown
📉 -39.51%
IBD RS Score
📊 14.8
Weak
Market Rank
#420
Best Month
🏆 2026-04
Worst Month
📉 2025-07
Best Months to Trade
📅 Apr, May, Dec
Best Days to Trade
📅 Wednesday, Monday
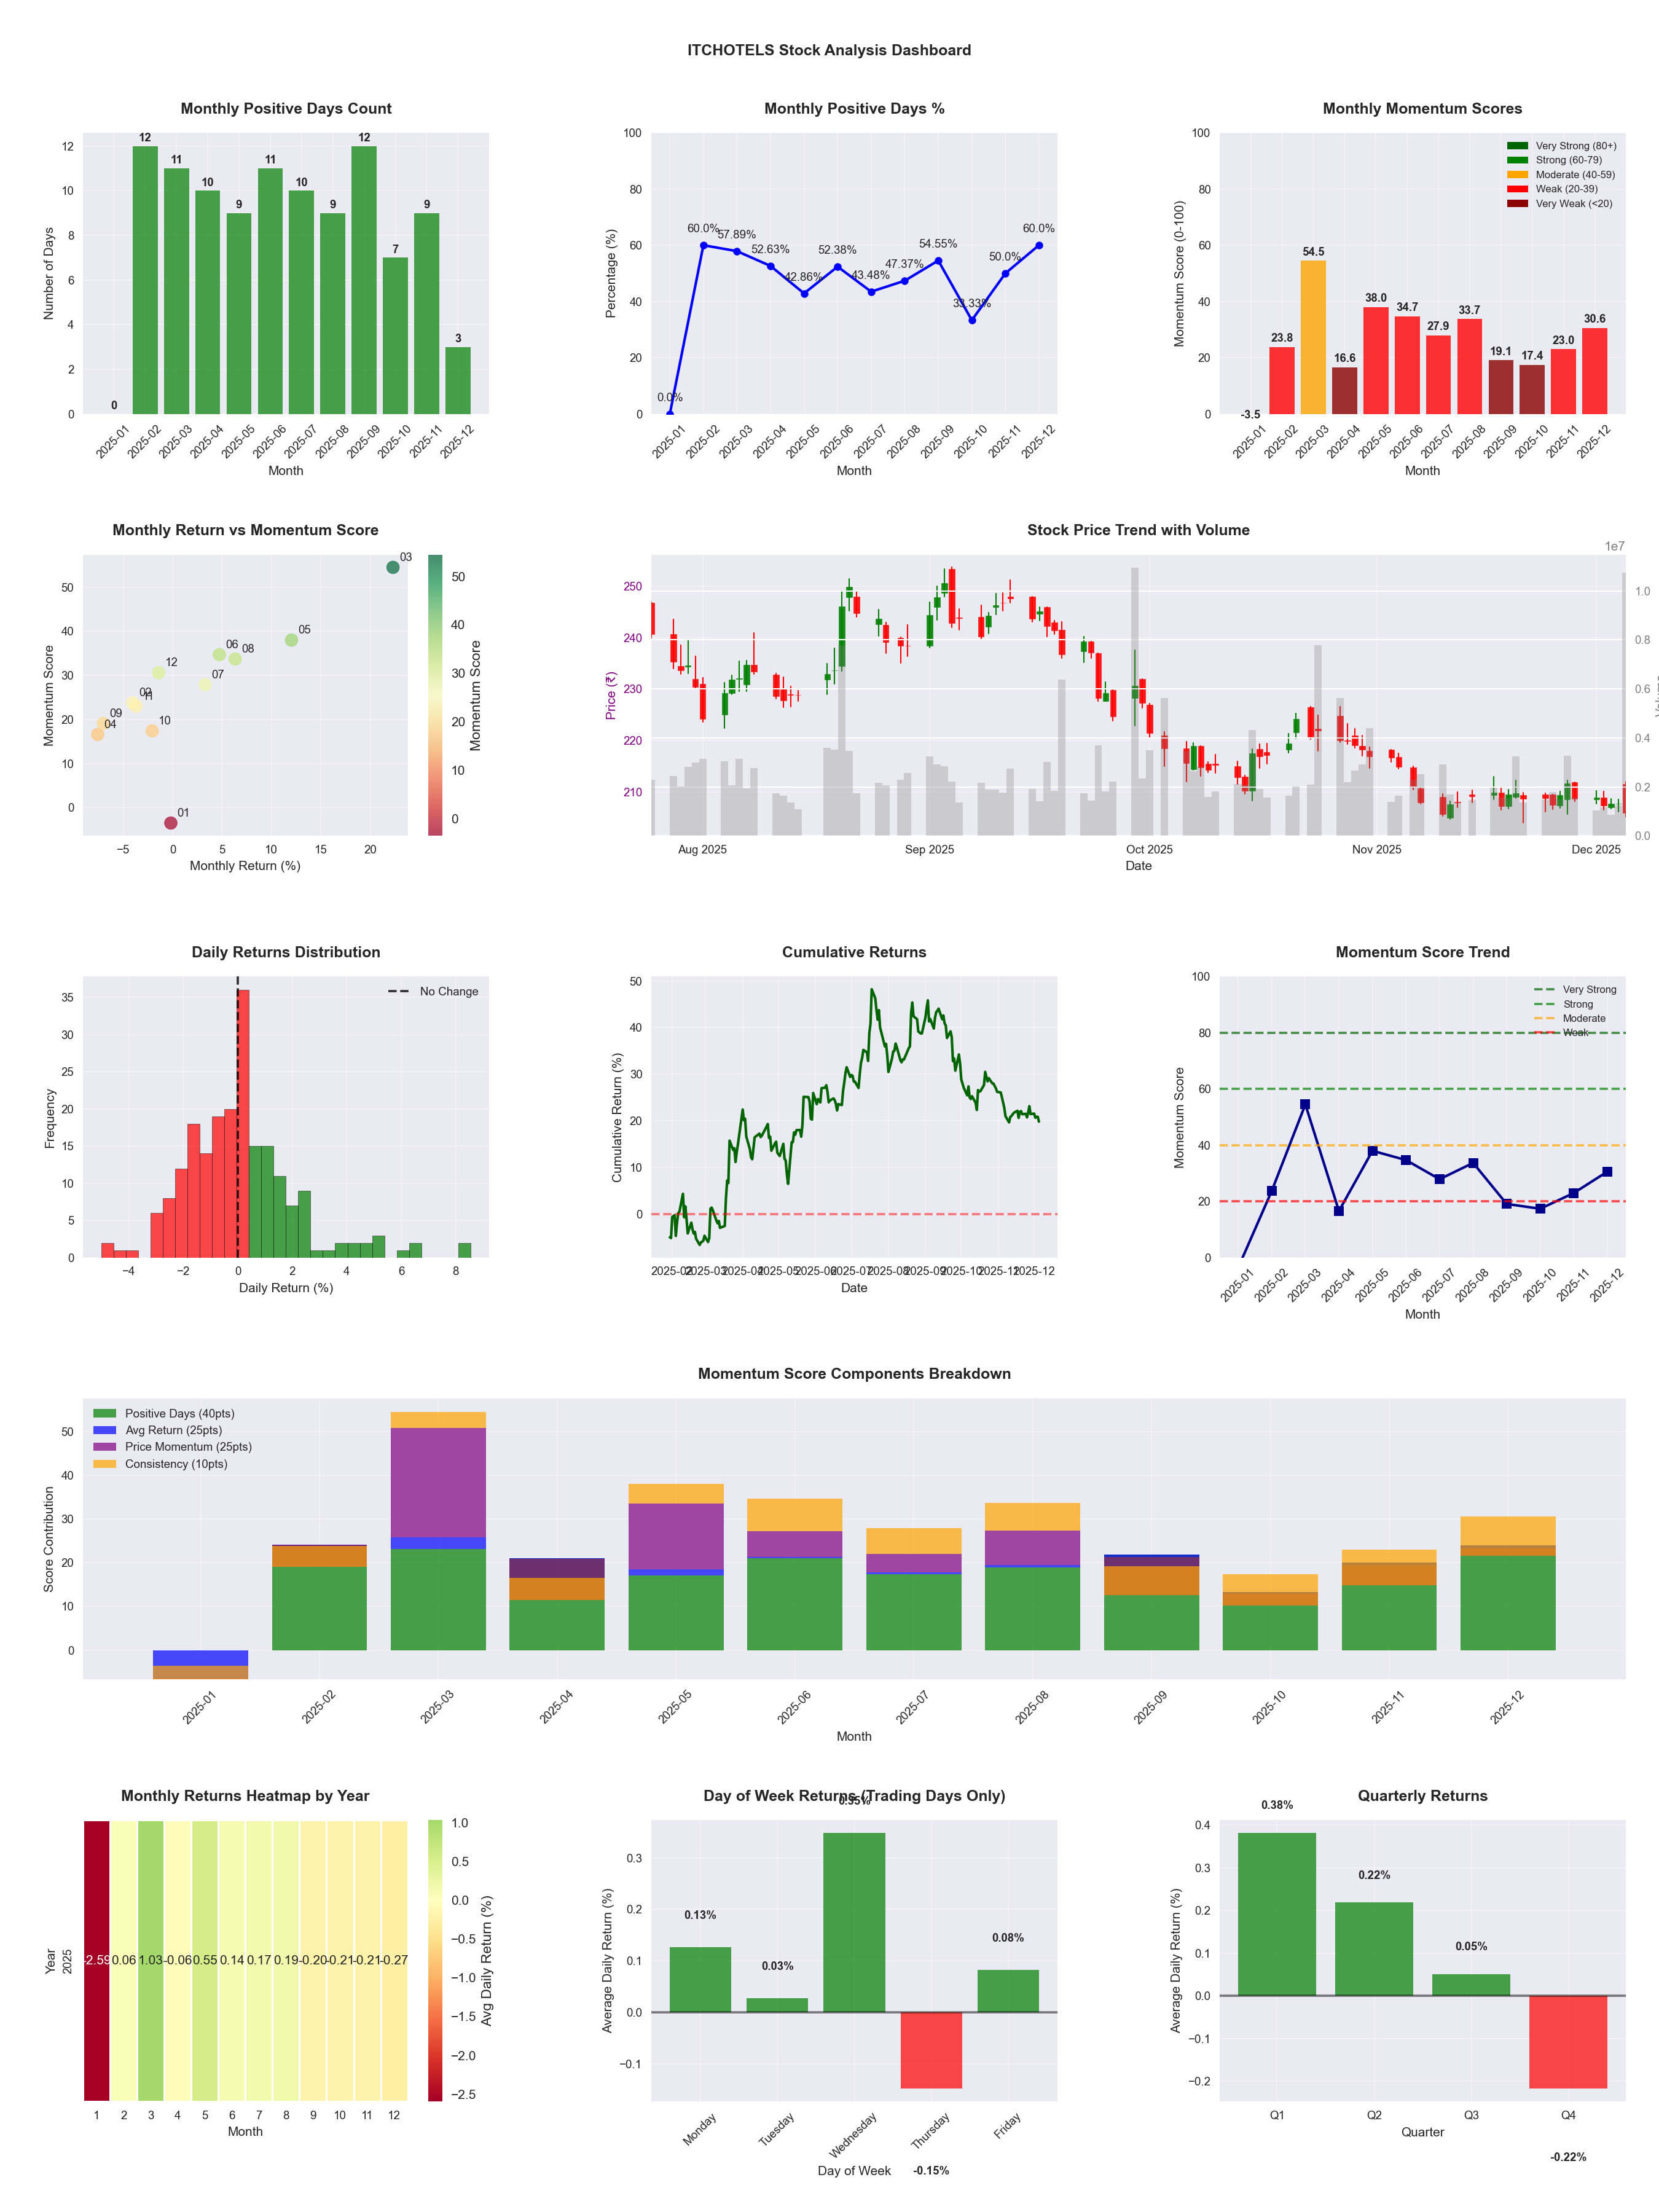
📊 Key Insights & Metrics
Symbol
📈 ITCHOTELS
Date
📅 2026-04-11
Volatility
🟡 1.93%
Win Rate
⚠️ 44.3%
Avg Daily Return
📉 -0.09%
Max Drawdown
📉 -45.88%
IBD RS Score
📊 7.9
Weak
Market Rank
#454
Best Month
🏆 2026-04
Best Months to Trade
📅 May, Apr, Aug
Best Days to Trade
📅 Wednesday, Monday
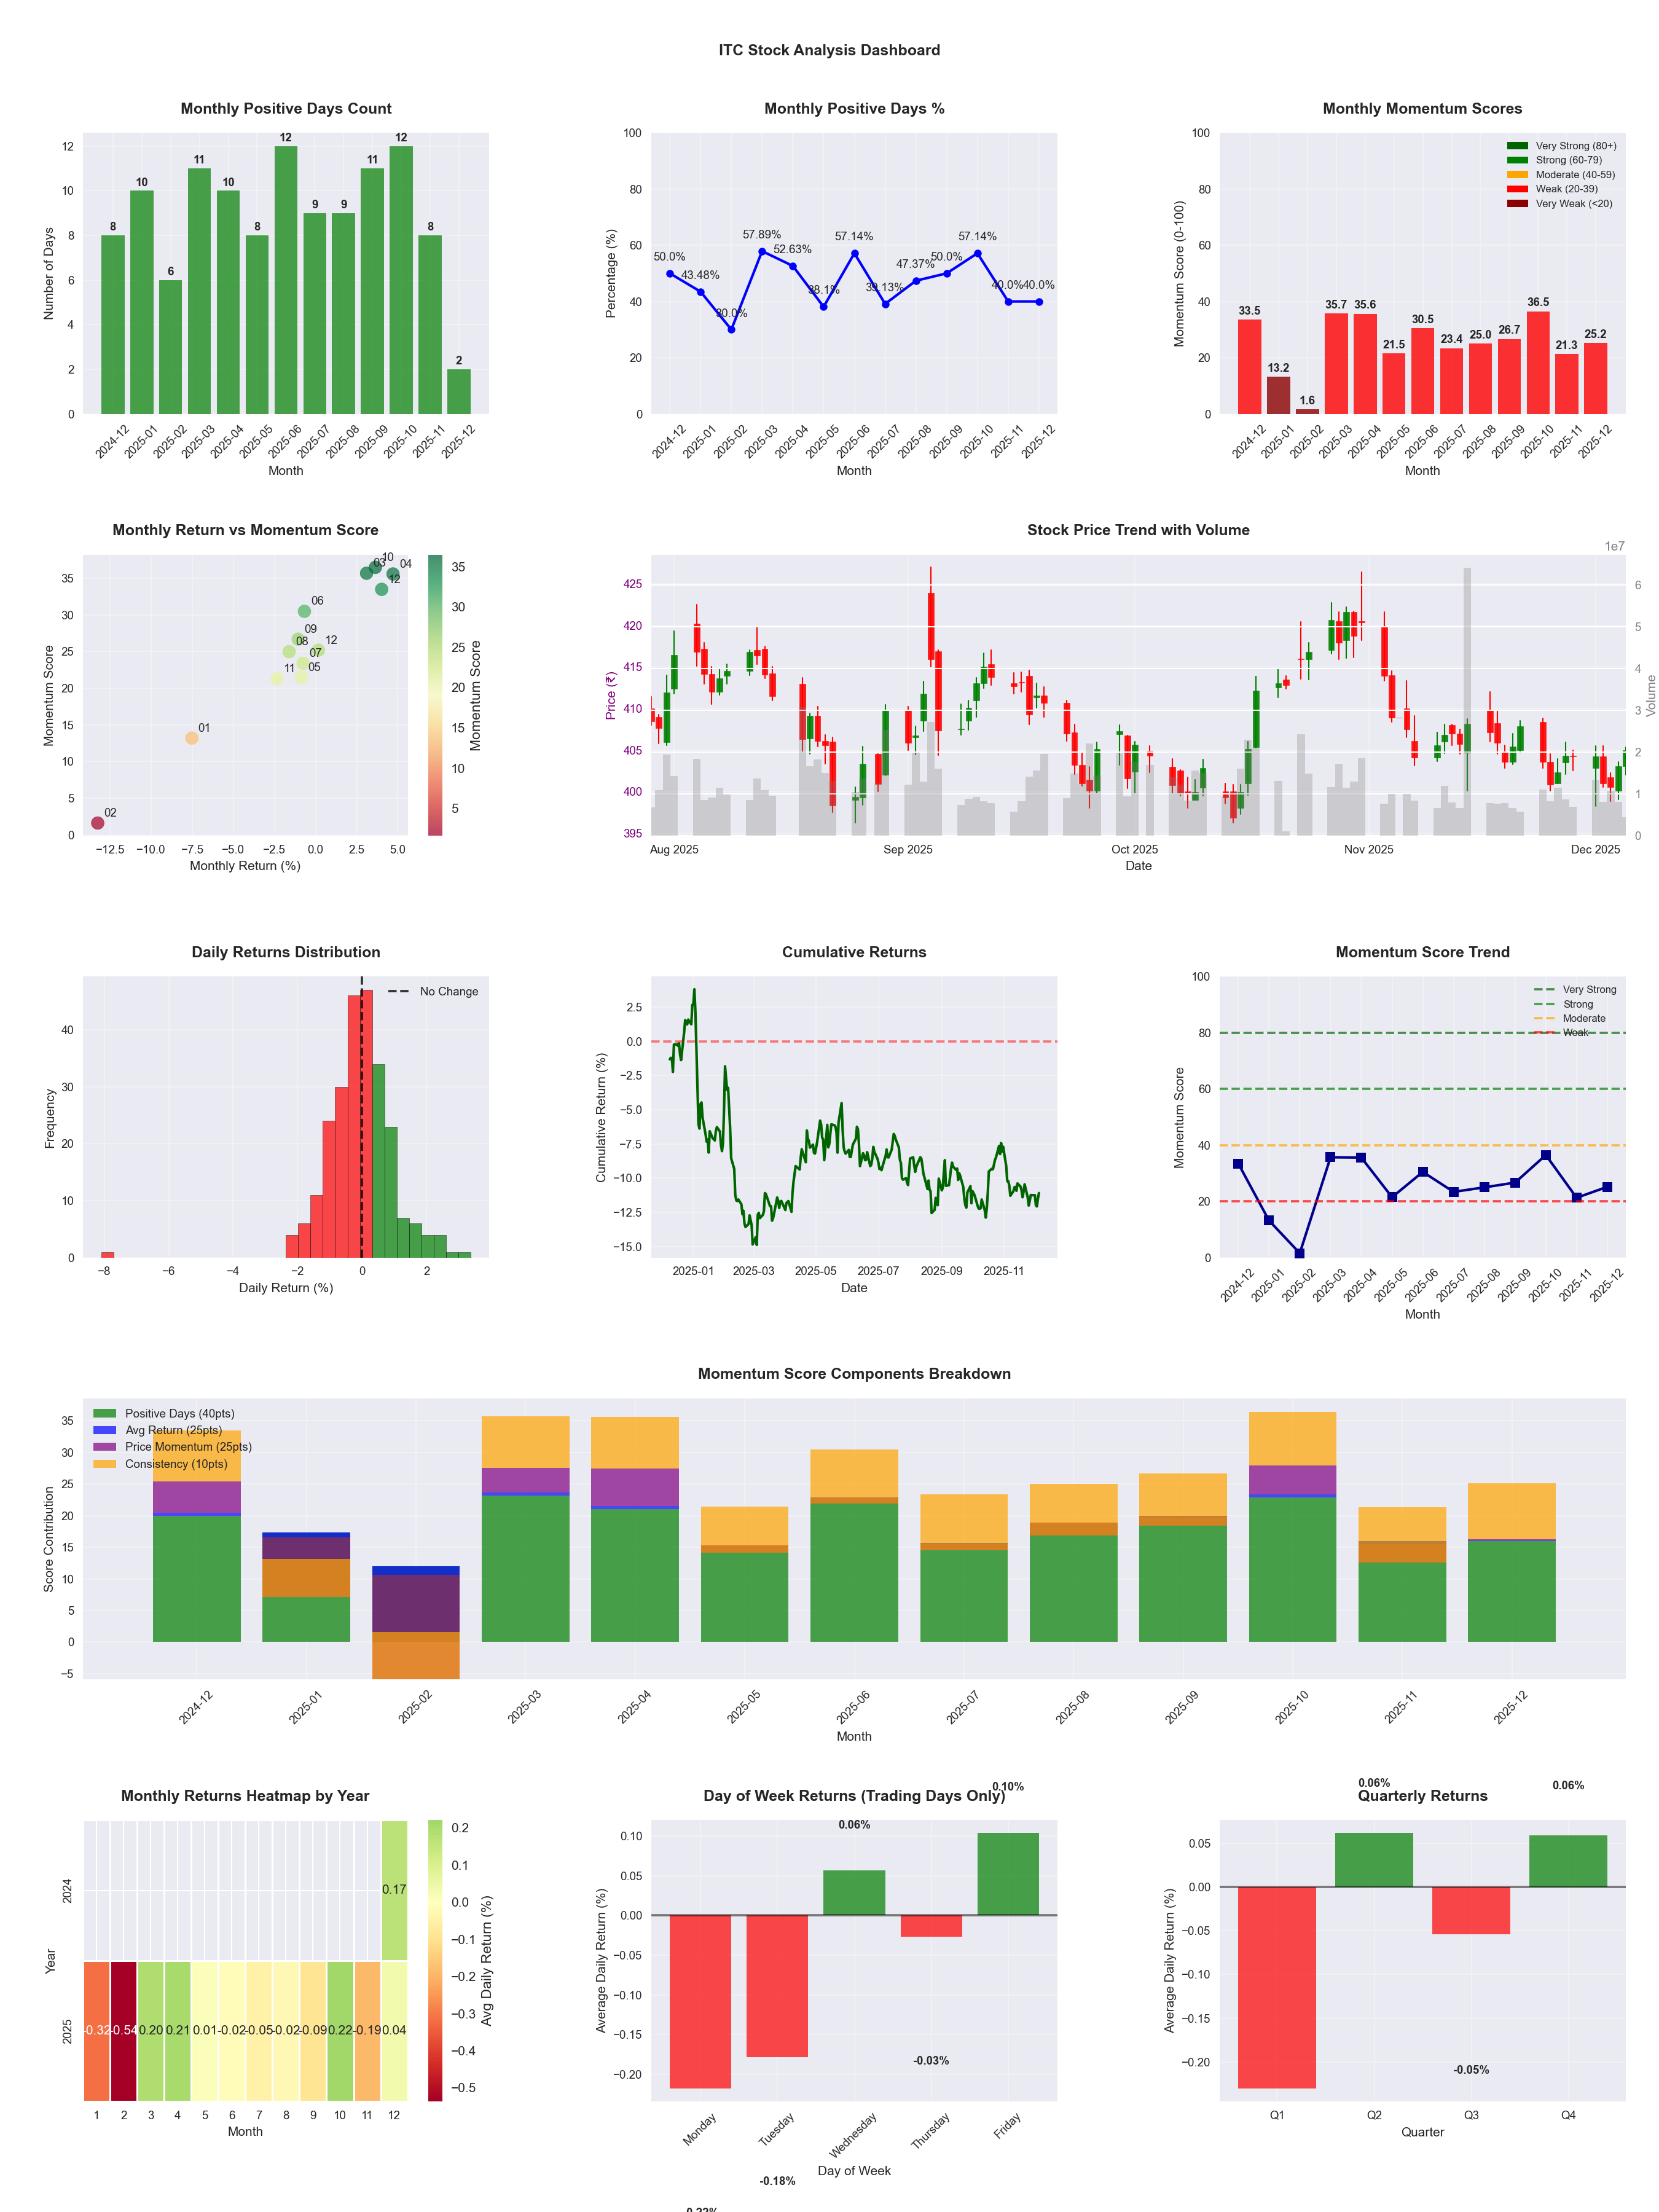
📊 Key Insights & Metrics
Symbol
📈 ITC
Date
📅 2026-04-11
Volatility
🟢 1.19%
Win Rate
⚠️ 43.9%
Avg Daily Return
📉 -0.11%
Max Drawdown
📉 -32.46%
IBD RS Score
📊 18.1
Weak
Market Rank
#404
Best Month
🏆 2026-04
Best Months to Trade
📅 Apr, Oct, May
Best Days to Trade
📅 Wednesday, Friday
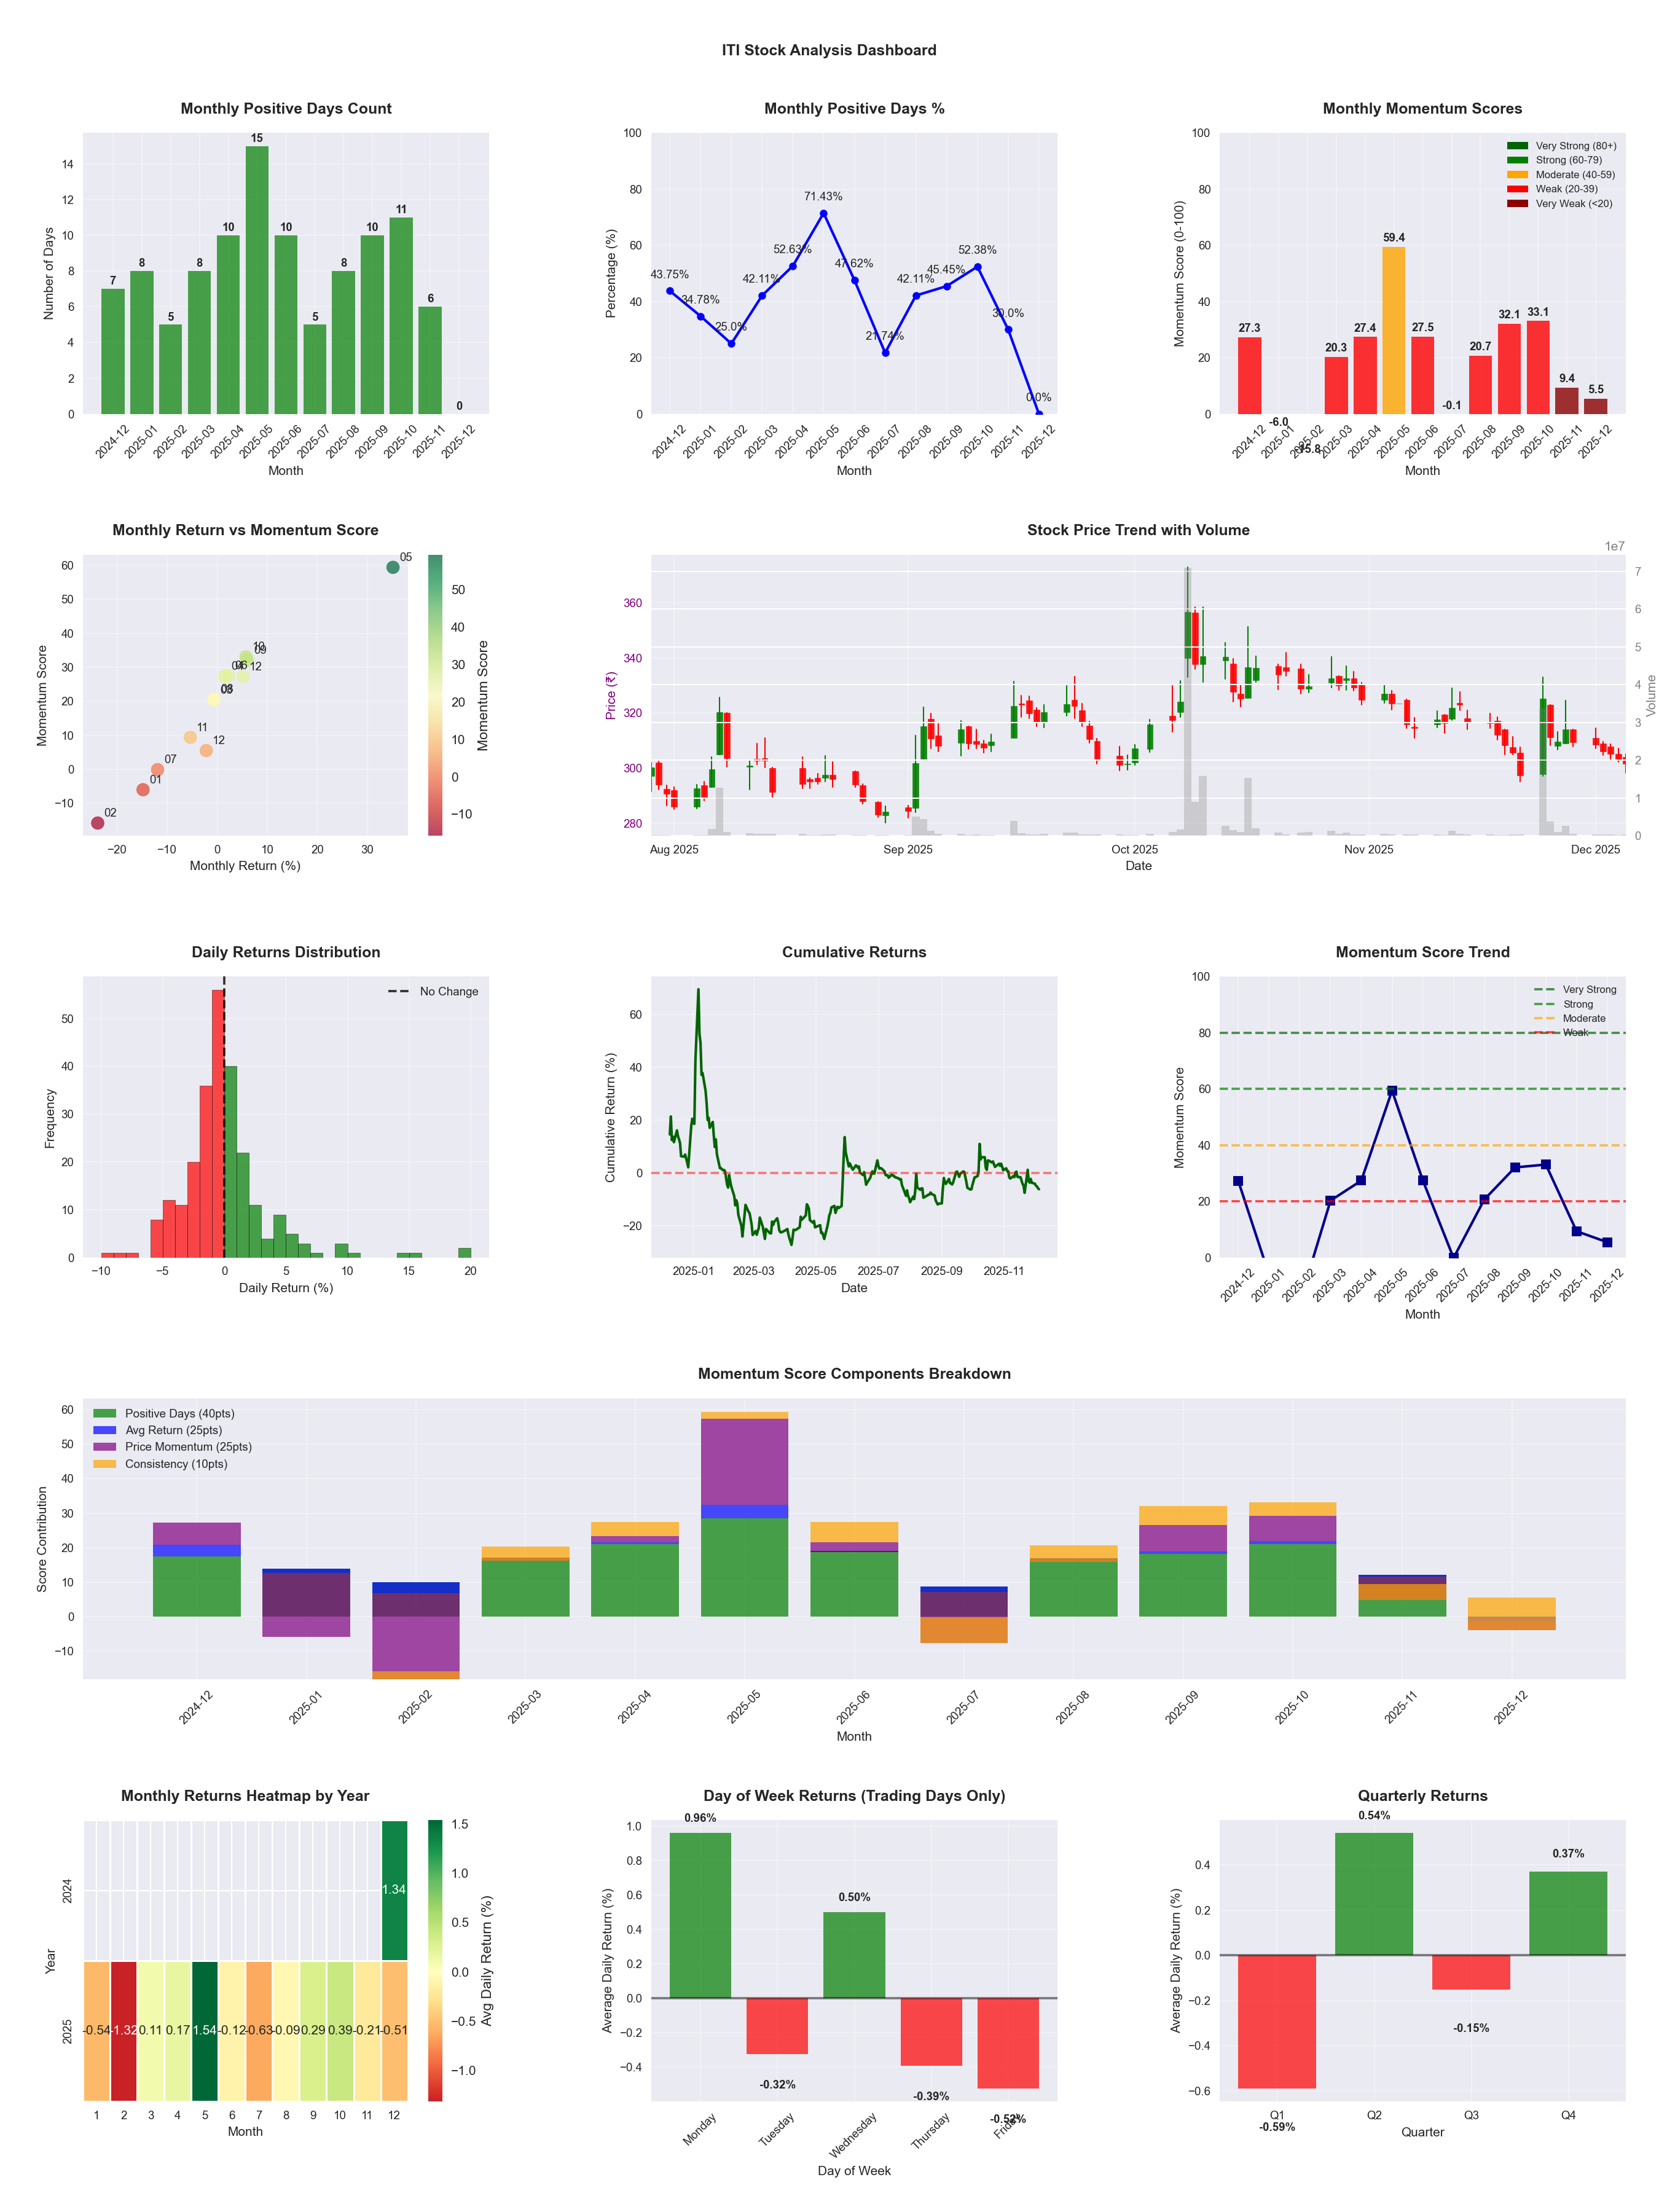
📊 Key Insights & Metrics
Symbol
📈 ITI
Date
📅 2026-04-11
Volatility
🟡 2.78%
Risk Profile
⚠️ suitable for aggressive investors
Win Rate
⚠️ 42.7%
Avg Daily Return
📈 +0.10%
Max Drawdown
📉 -34.48%
IBD RS Score
📊 57.6
Average
Market Rank
#209
Best Month
🏆 2025-05
Best Months to Trade
📅 May, Apr, Oct
Best Days to Trade
📅 Wednesday, Monday
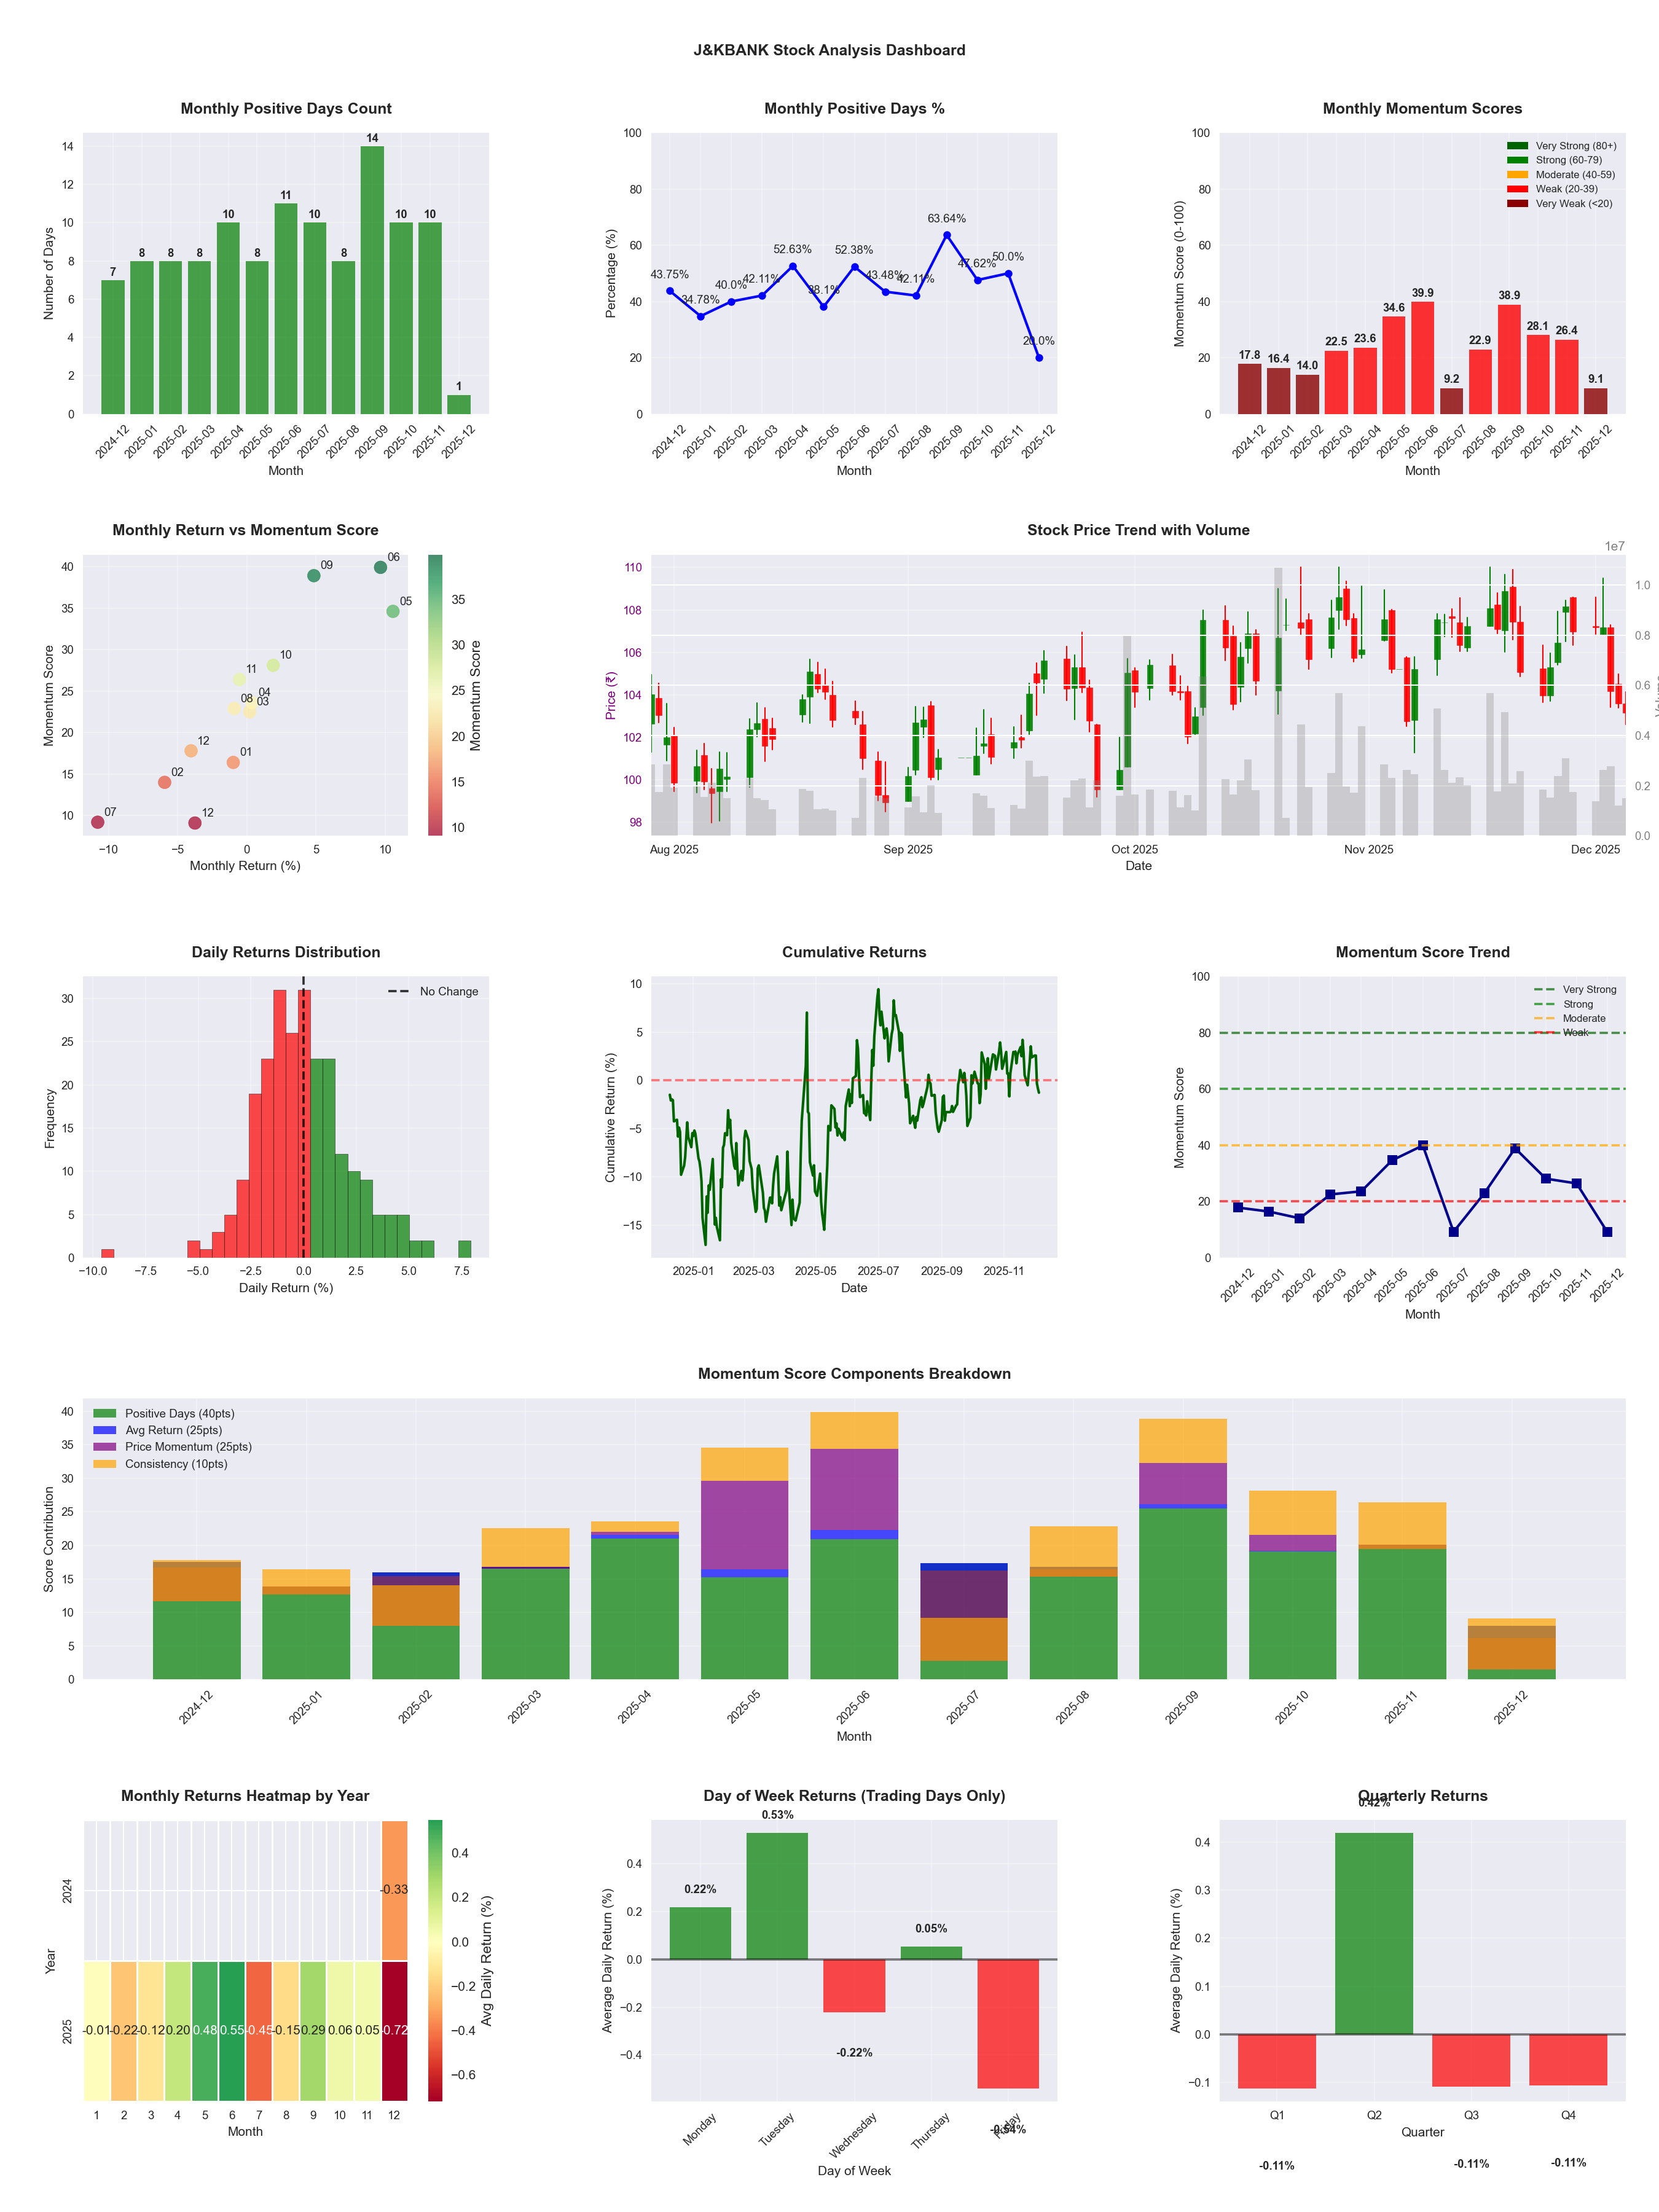
📊 Key Insights & Metrics
Symbol
📈 J
Date
📅 2026-04-11
Volatility
🟡 2.35%
Risk Profile
⚠️ suitable for aggressive investors
Win Rate
⚠️ 50.0%
Avg Daily Return
📈 +0.16%
Max Drawdown
📉 -21.03%
Best Month
🏆 2026-02
Worst Month
📉 2025-07
Best Months to Trade
📅 Apr, Feb, Jun
Best Days to Trade
📅 Tuesday, Wednesday
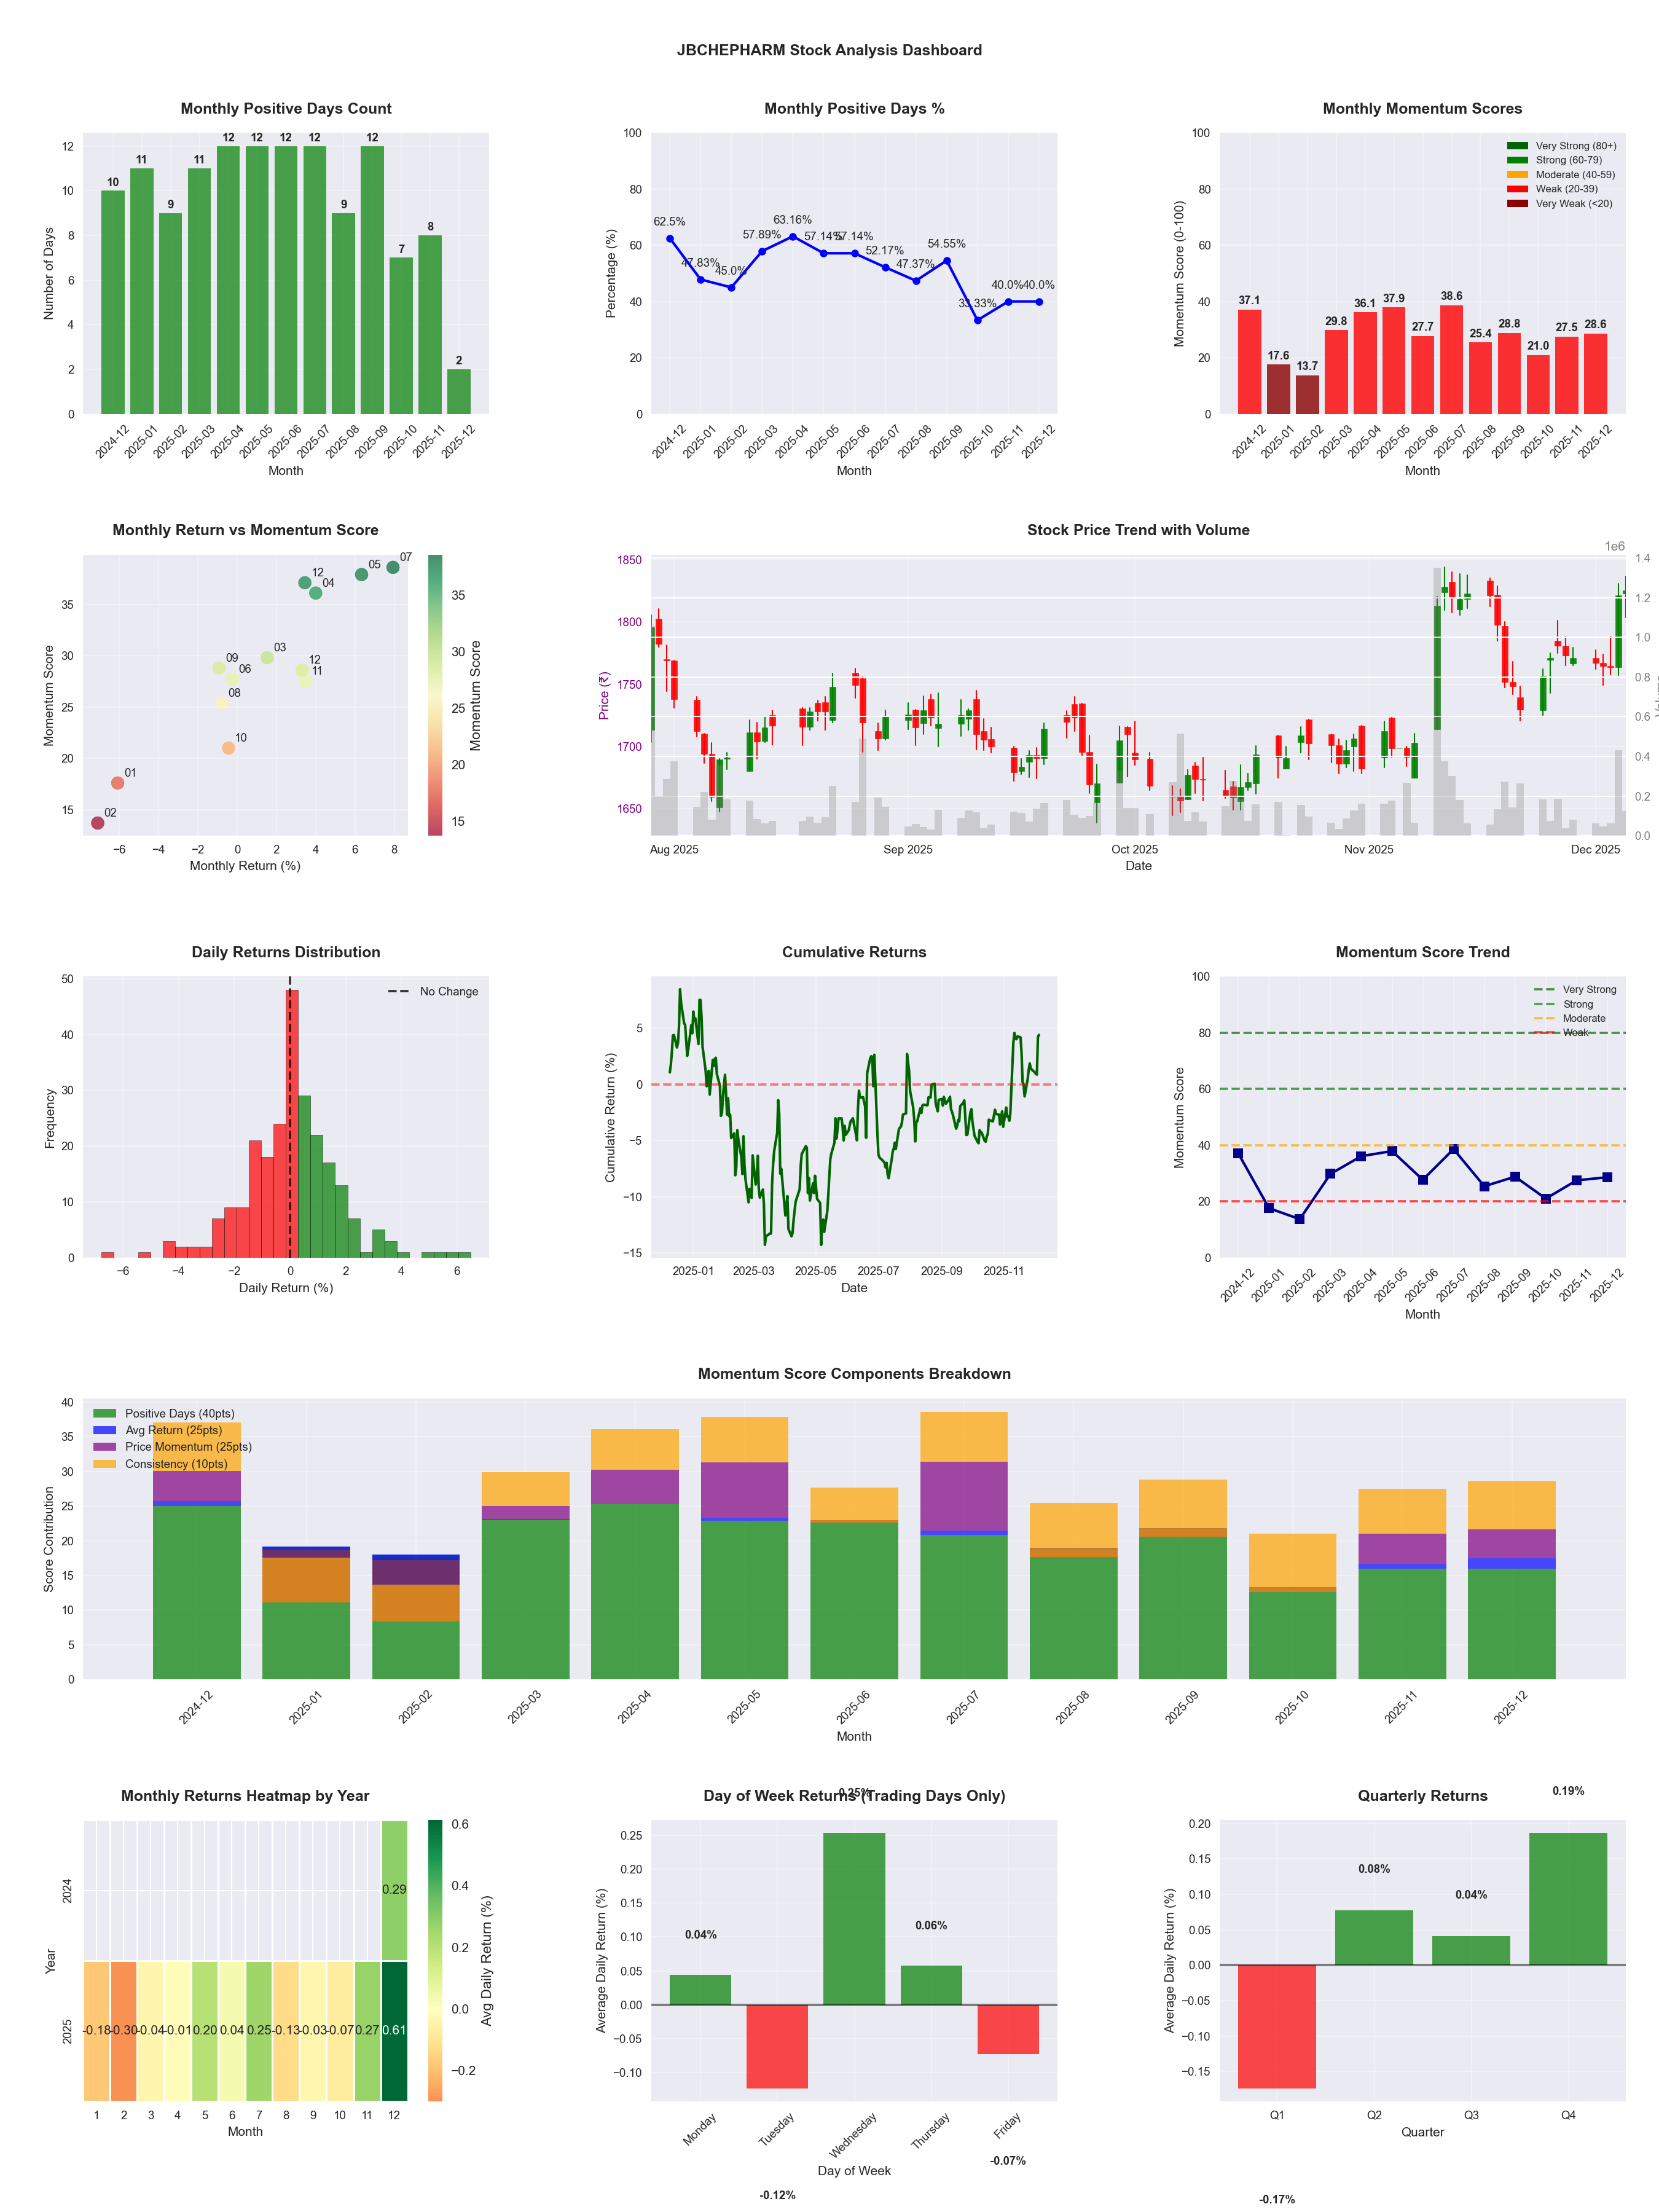
📊 Key Insights & Metrics
Symbol
📈 JBCHEPHARM
Date
📅 2026-04-11
Volatility
🟢 1.48%
Win Rate
⚠️ 51.2%
Avg Daily Return
📈 +0.11%
Max Drawdown
📉 -10.70%
IBD RS Score
📊 85.2
Strong
Market Rank
#73
Best Month
🏆 2026-02
Worst Month
📉 2025-10
Best Months to Trade
📅 Feb, Nov, Jul
Best Days to Trade
📅 Monday, Tuesday
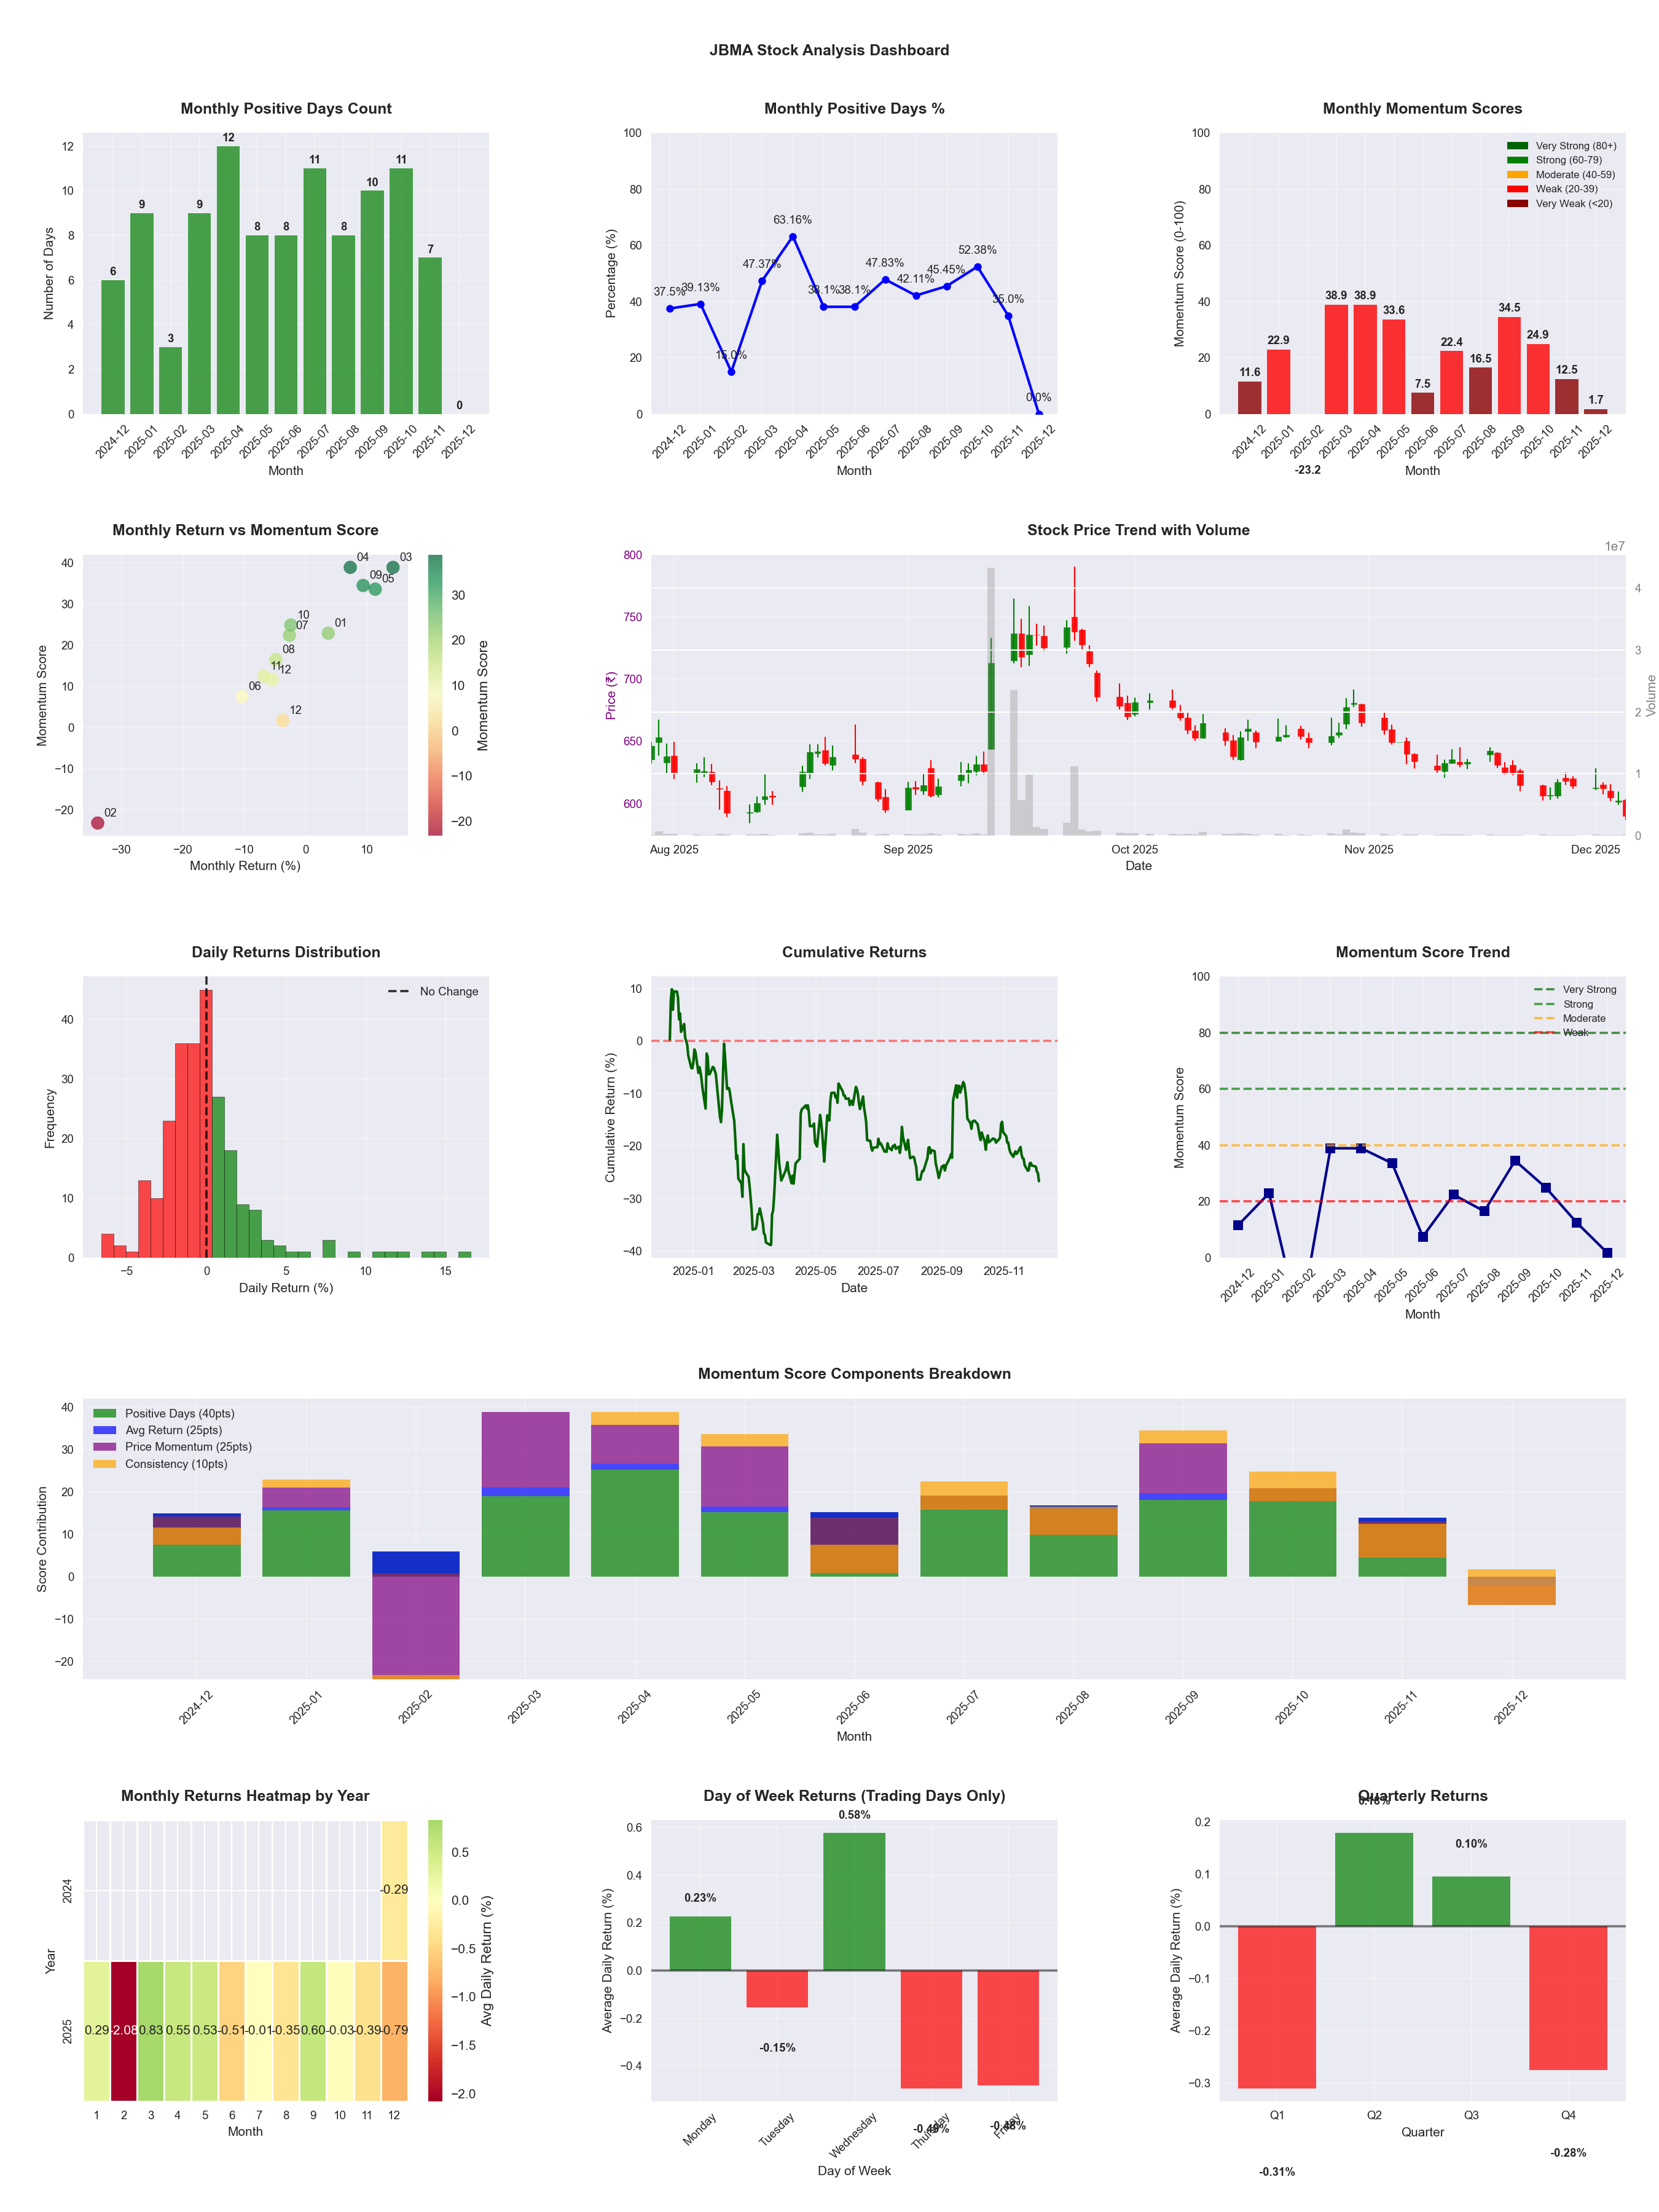
📊 Key Insights & Metrics
Symbol
📈 JBMA
Date
📅 2026-04-11
Volatility
🟡 2.92%
Risk Profile
⚠️ suitable for aggressive investors
Win Rate
⚠️ 43.1%
Avg Daily Return
📈 +0.04%
Max Drawdown
📉 -34.45%
IBD RS Score
📊 51.7
Average
Market Rank
#238
Best Month
🏆 2026-04
Worst Month
📉 2026-01
Best Months to Trade
📅 Apr, Sep, May
Best Days to Trade
📅 Wednesday, Monday
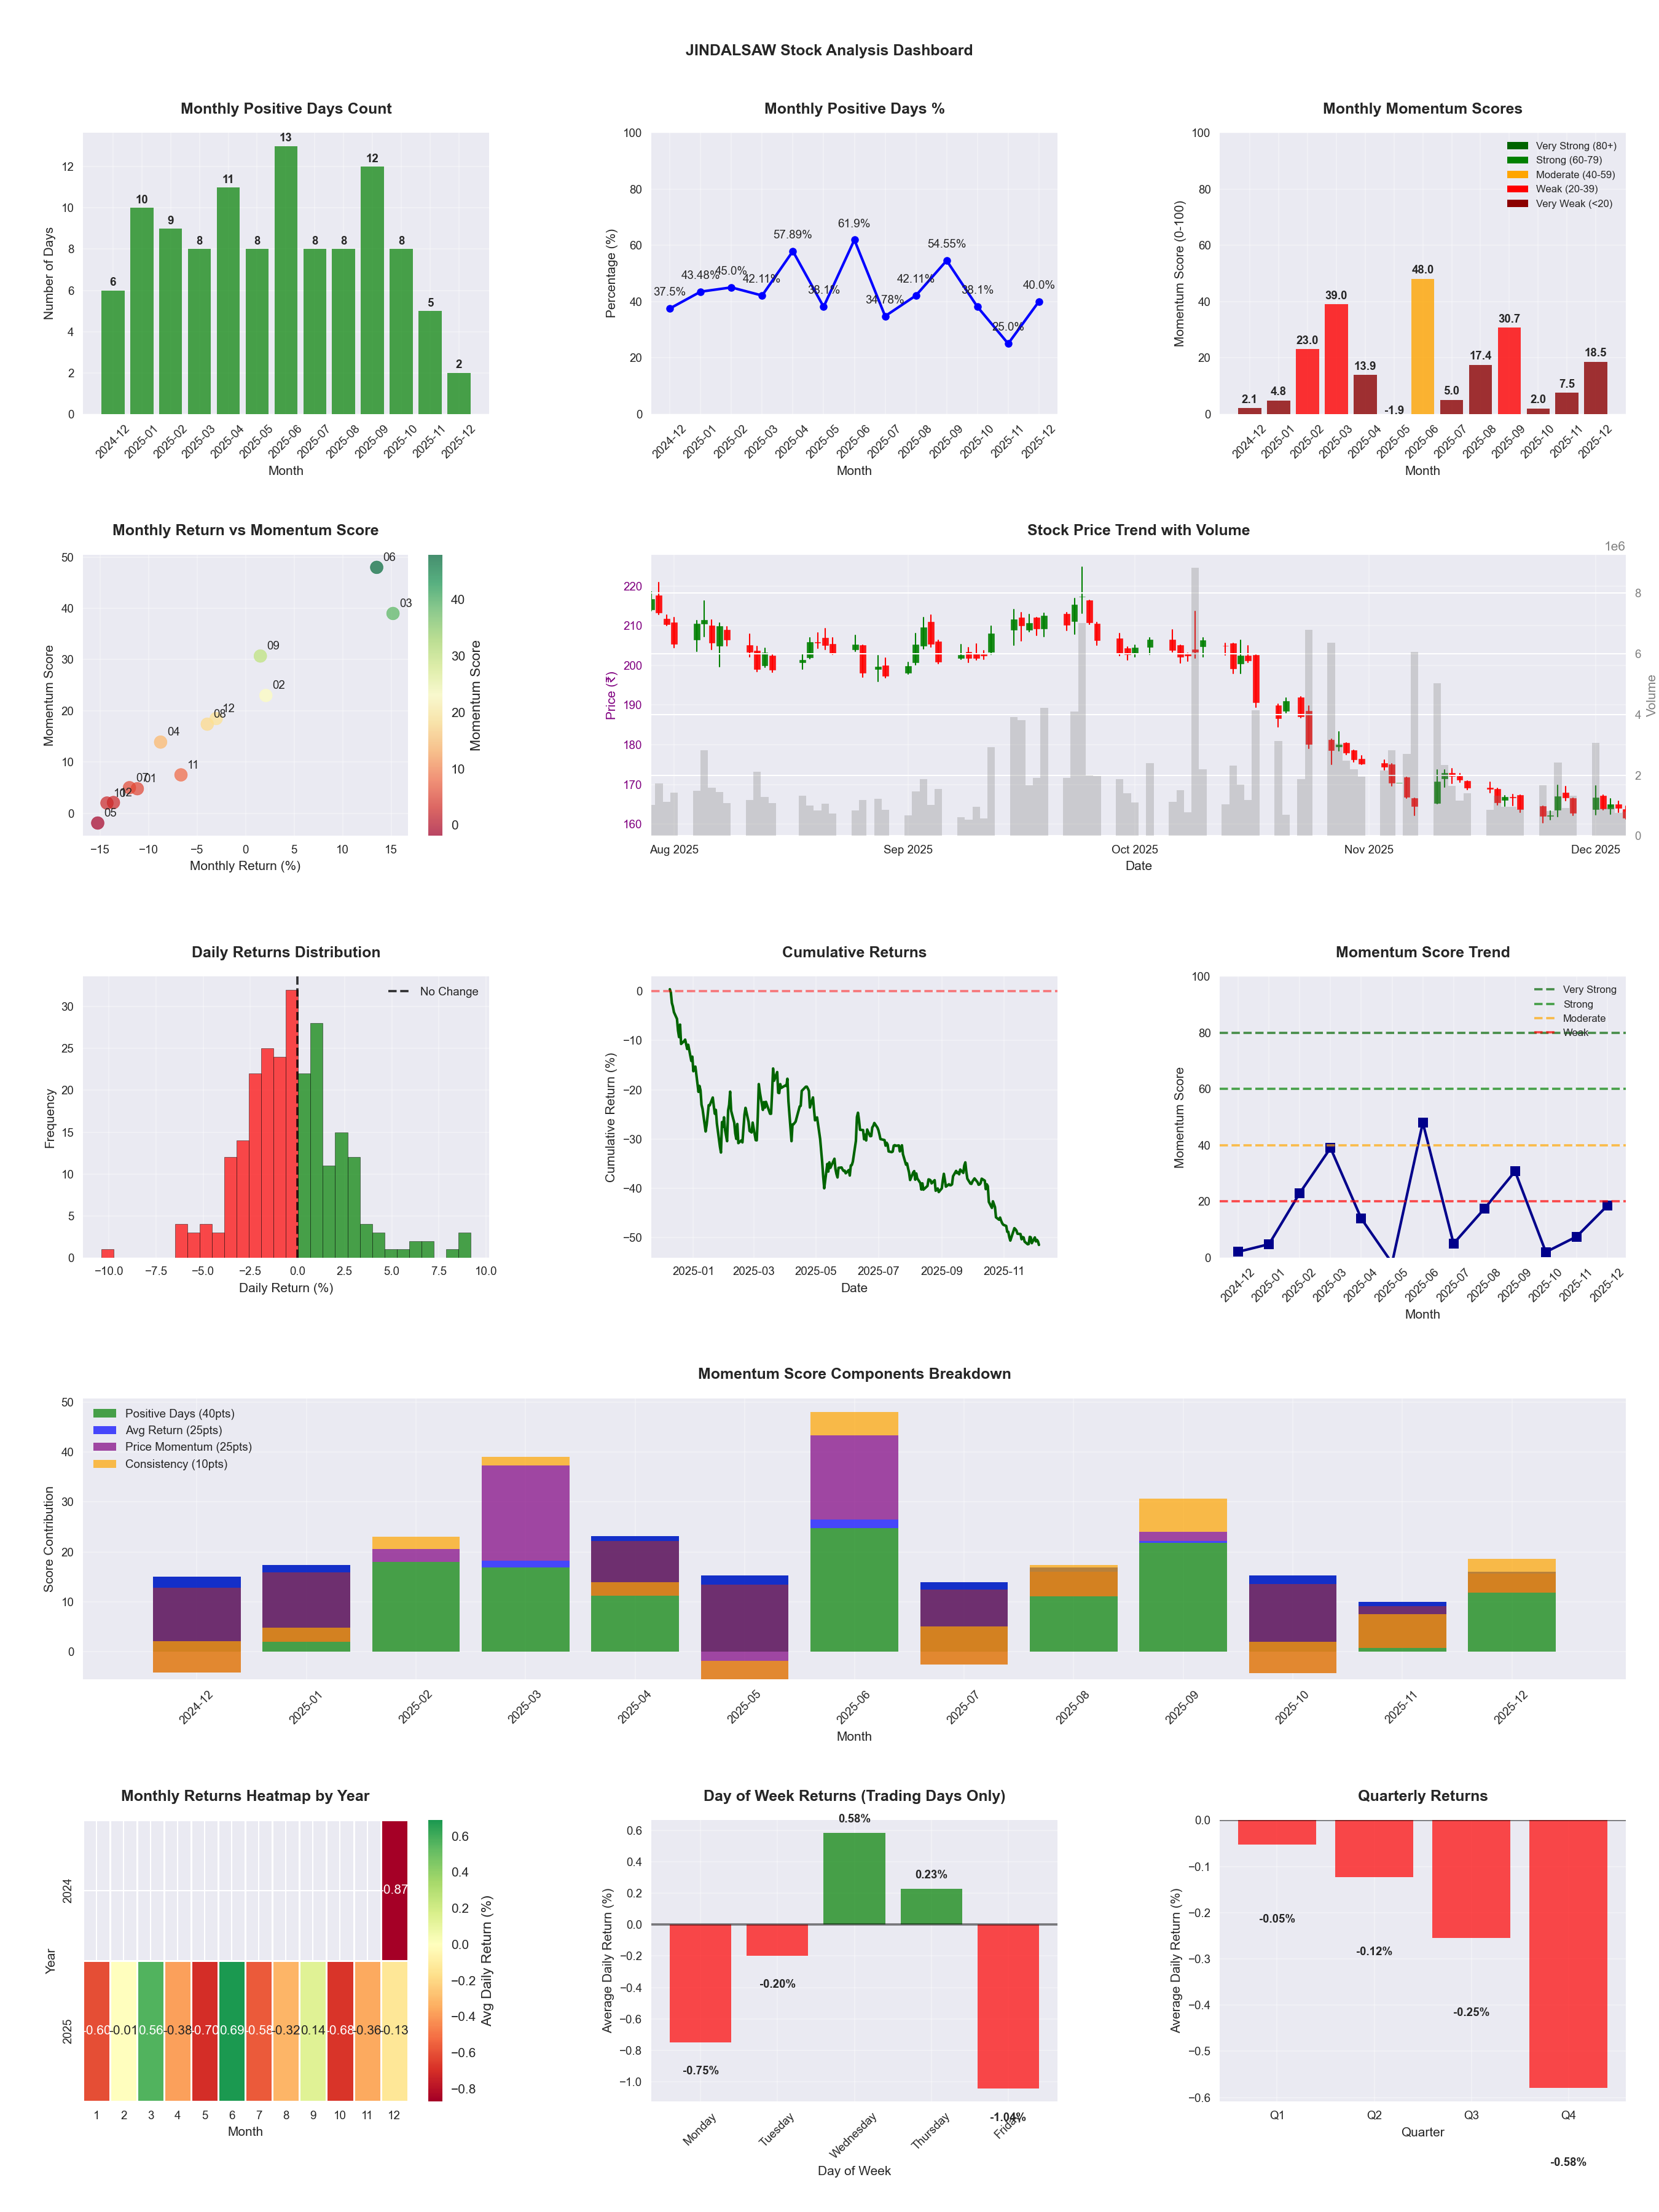
📊 Key Insights & Metrics
Symbol
📈 JINDALSAW
Date
📅 2026-04-11
Volatility
🟡 2.80%
Risk Profile
⚠️ suitable for aggressive investors
Win Rate
⚠️ 44.7%
Avg Daily Return
📉 -0.03%
Max Drawdown
📉 -42.40%
IBD RS Score
📊 71.2
Strong
Market Rank
#142
Best Month
🏆 2026-04
Best Months to Trade
📅 Jun, Apr, Feb
Best Days to Trade
📅 Wednesday, Monday
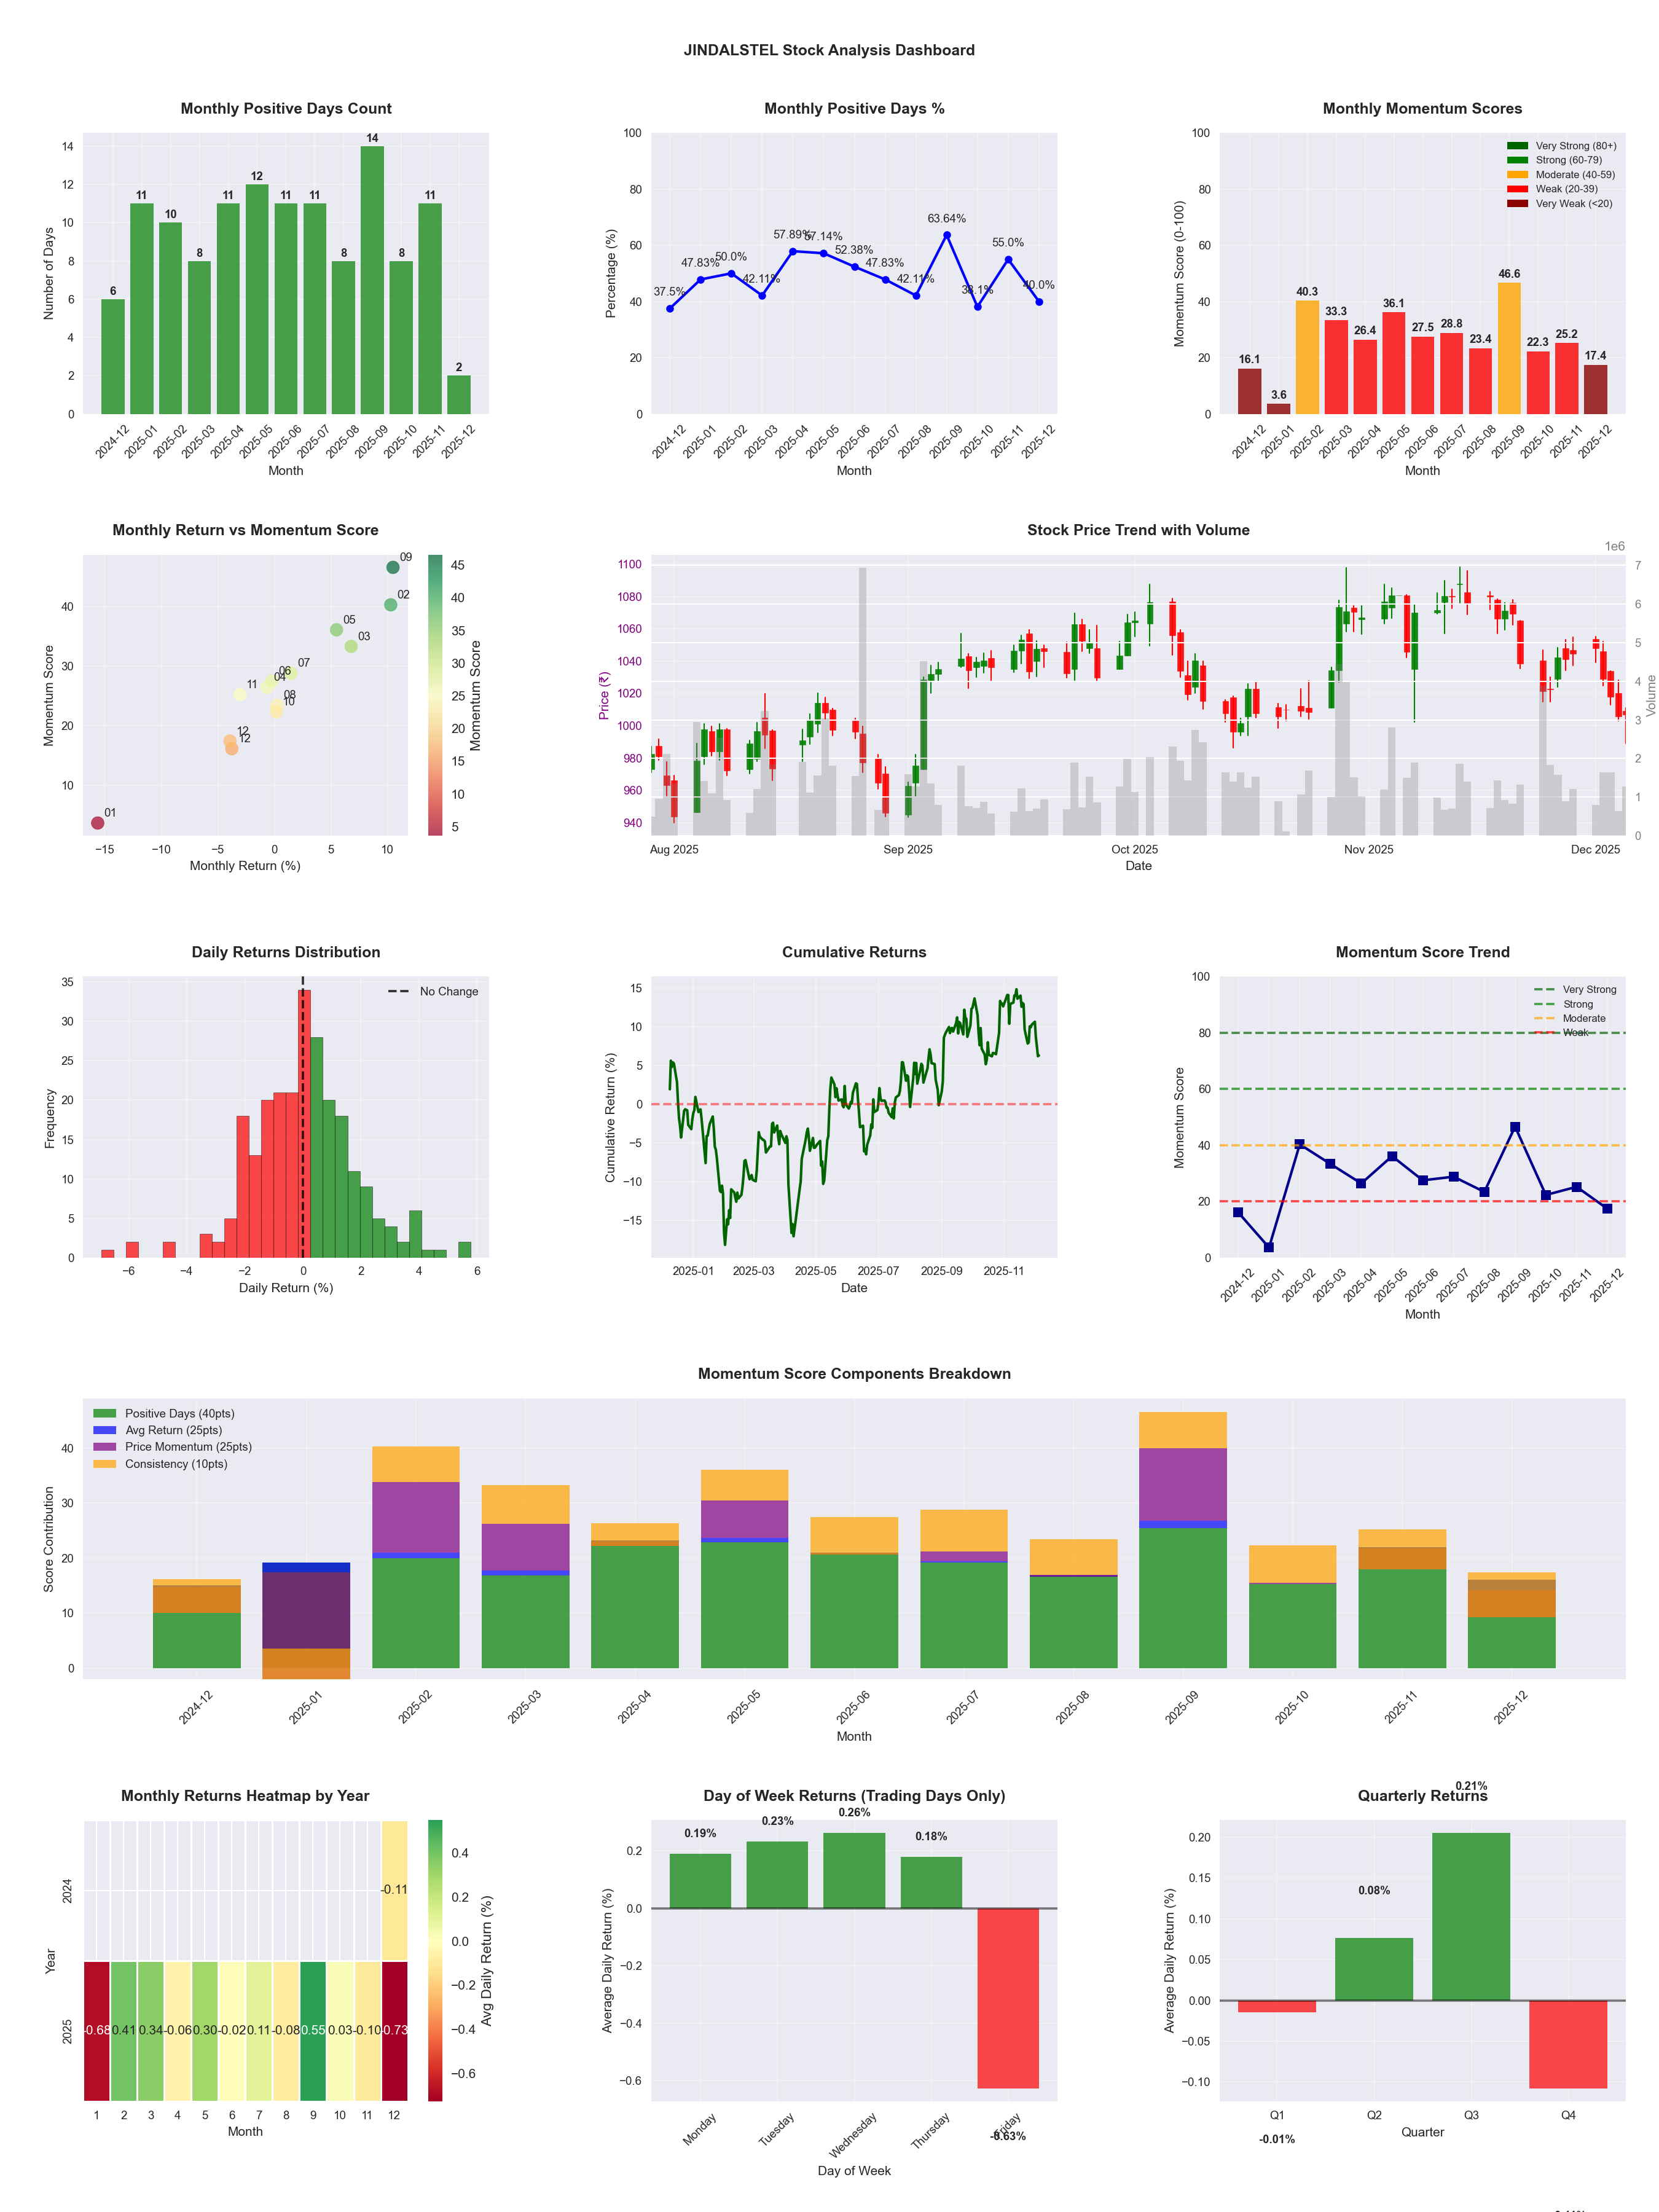
📊 Key Insights & Metrics
Symbol
📈 JINDALSTEL
Date
📅 2026-04-11
Volatility
🟡 1.86%
Win Rate
⚠️ 54.5%
Avg Daily Return
📈 +0.19%
Max Drawdown
📉 -12.66%
IBD RS Score
📊 92.7
Leader
Market Rank
#36
Best Month
🏆 2026-02
Worst Month
📉 2026-03
Best Months to Trade
📅 Apr, Sep, Feb
Best Days to Trade
📅 Wednesday, Tuesday
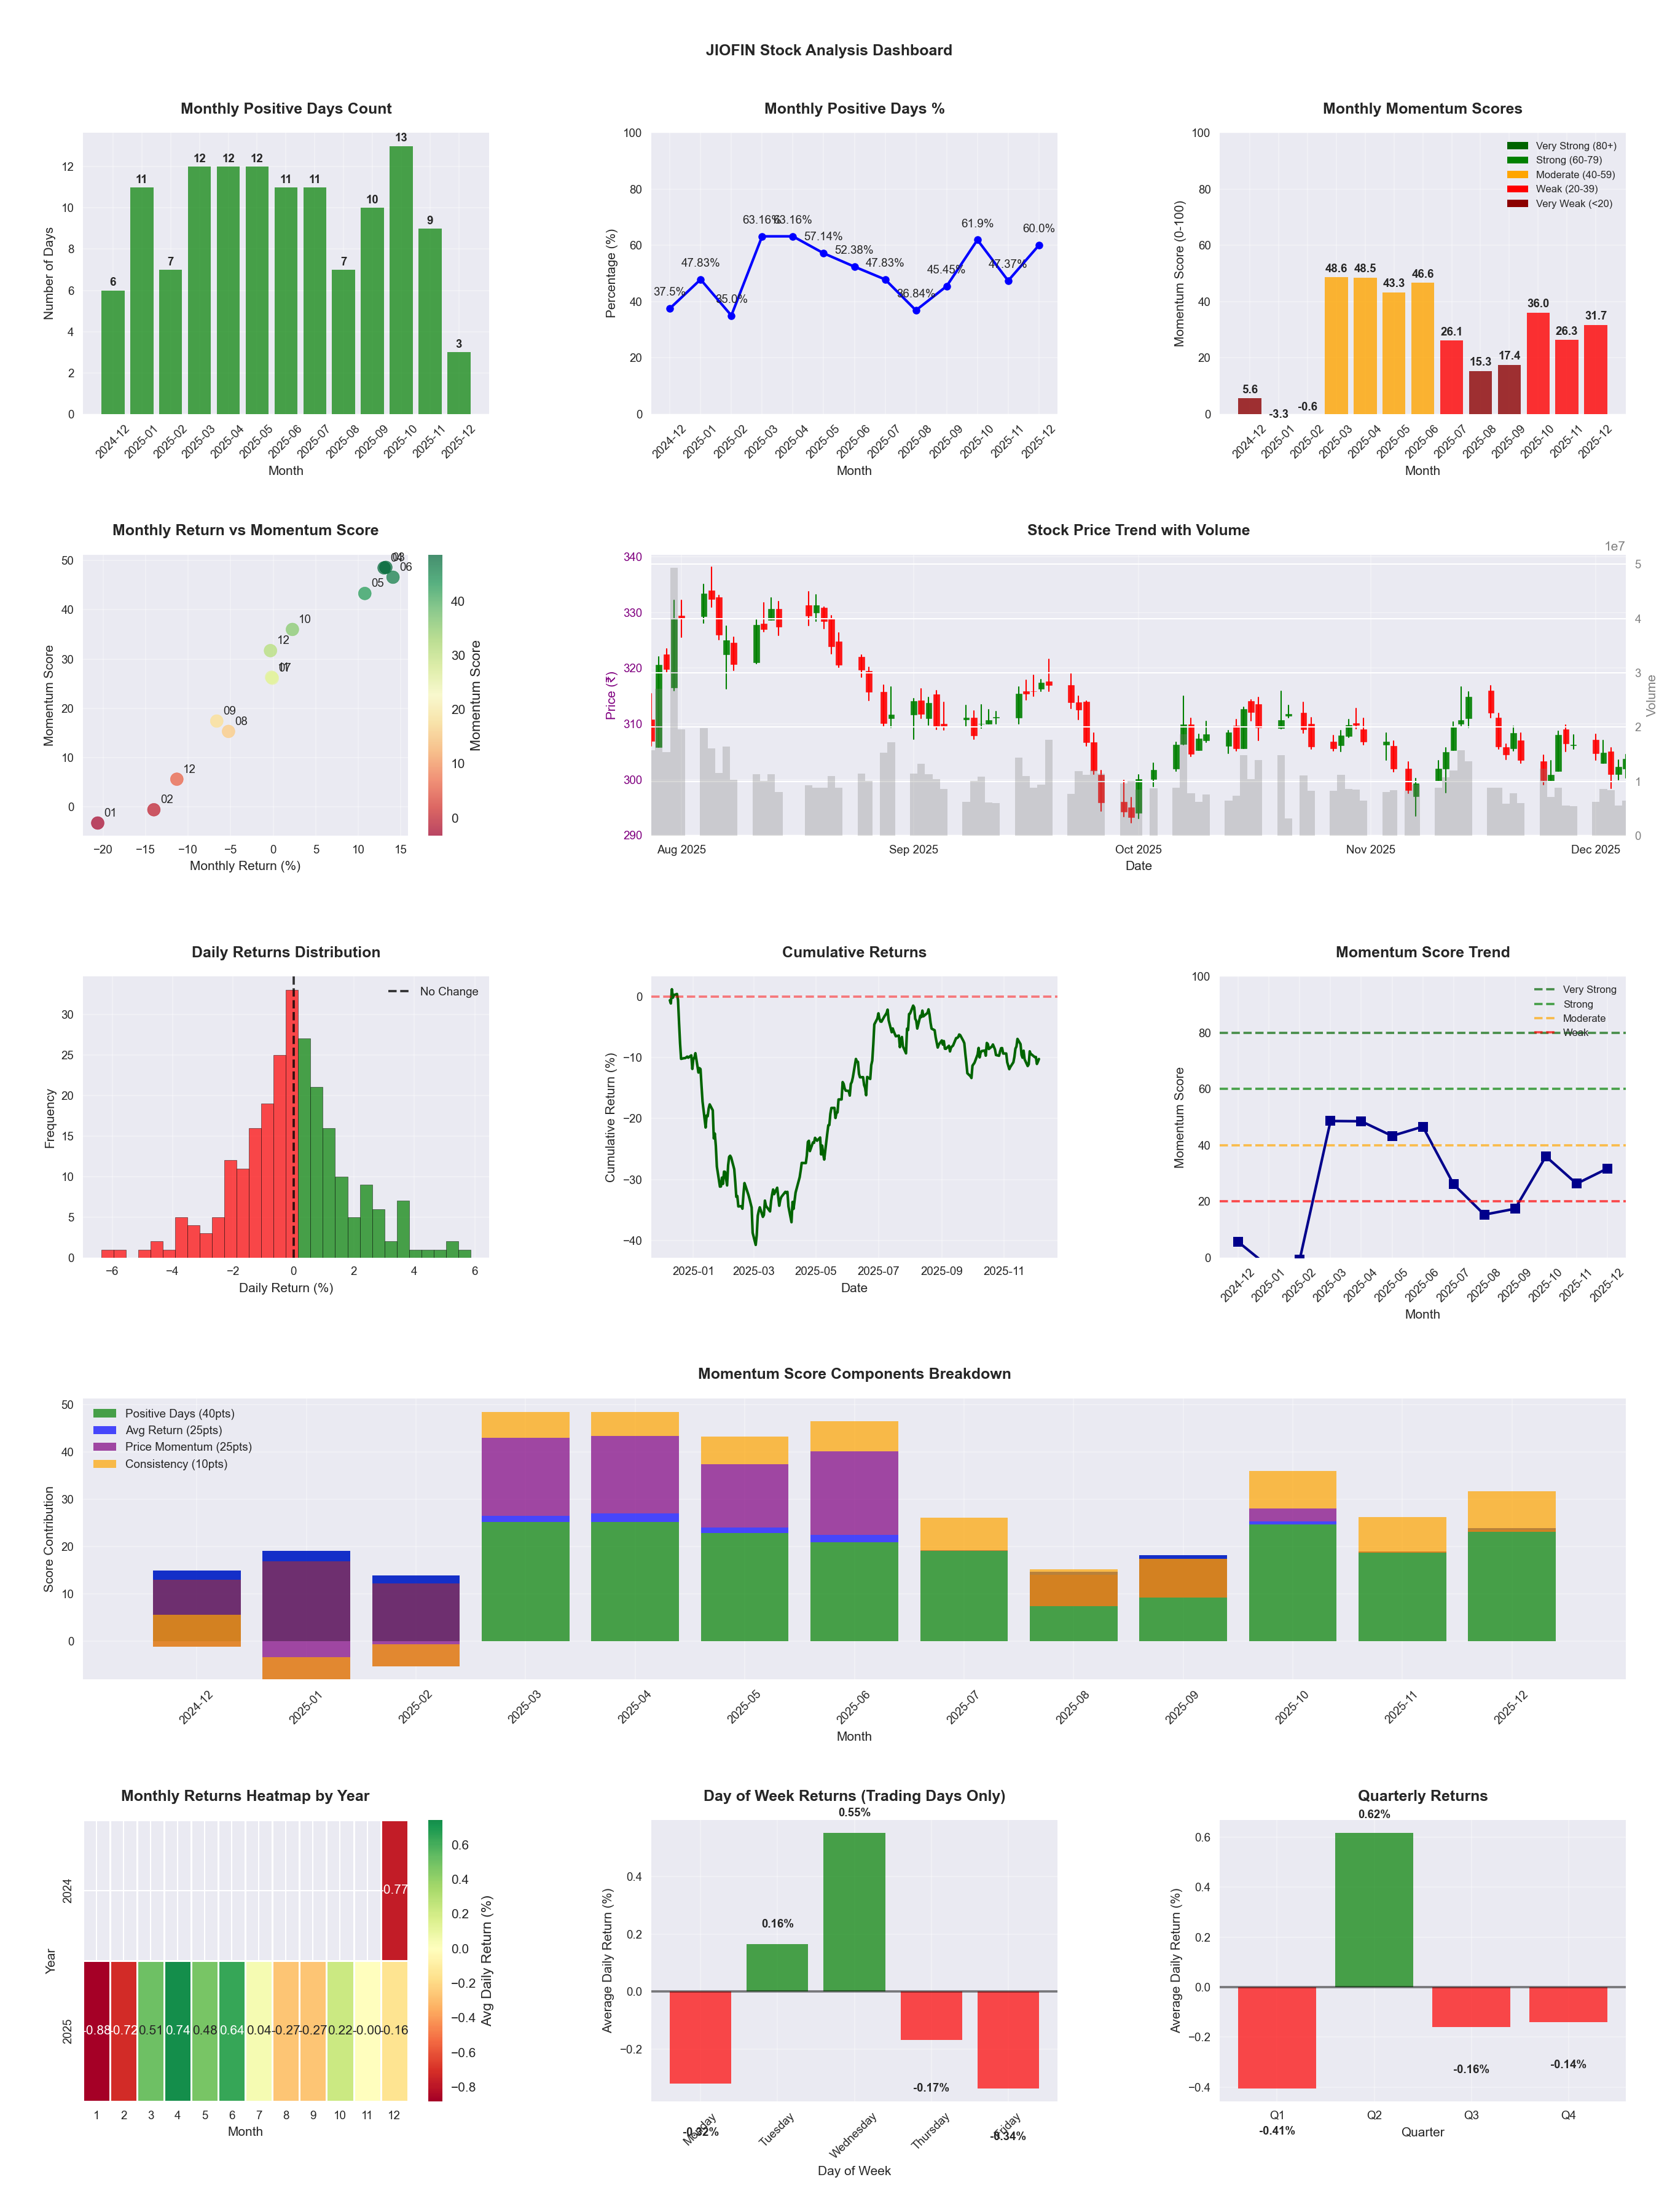
📊 Key Insights & Metrics
Symbol
📈 JIOFIN
Date
📅 2026-04-11
Volatility
🟡 1.73%
Win Rate
⚠️ 47.8%
Avg Daily Return
📈 +0.04%
Max Drawdown
📉 -32.78%
IBD RS Score
📊 24.3
Weak
Market Rank
#373
Best Month
🏆 2025-04
Best Months to Trade
📅 Apr, Jun, May
Best Days to Trade
📅 Wednesday, Tuesday
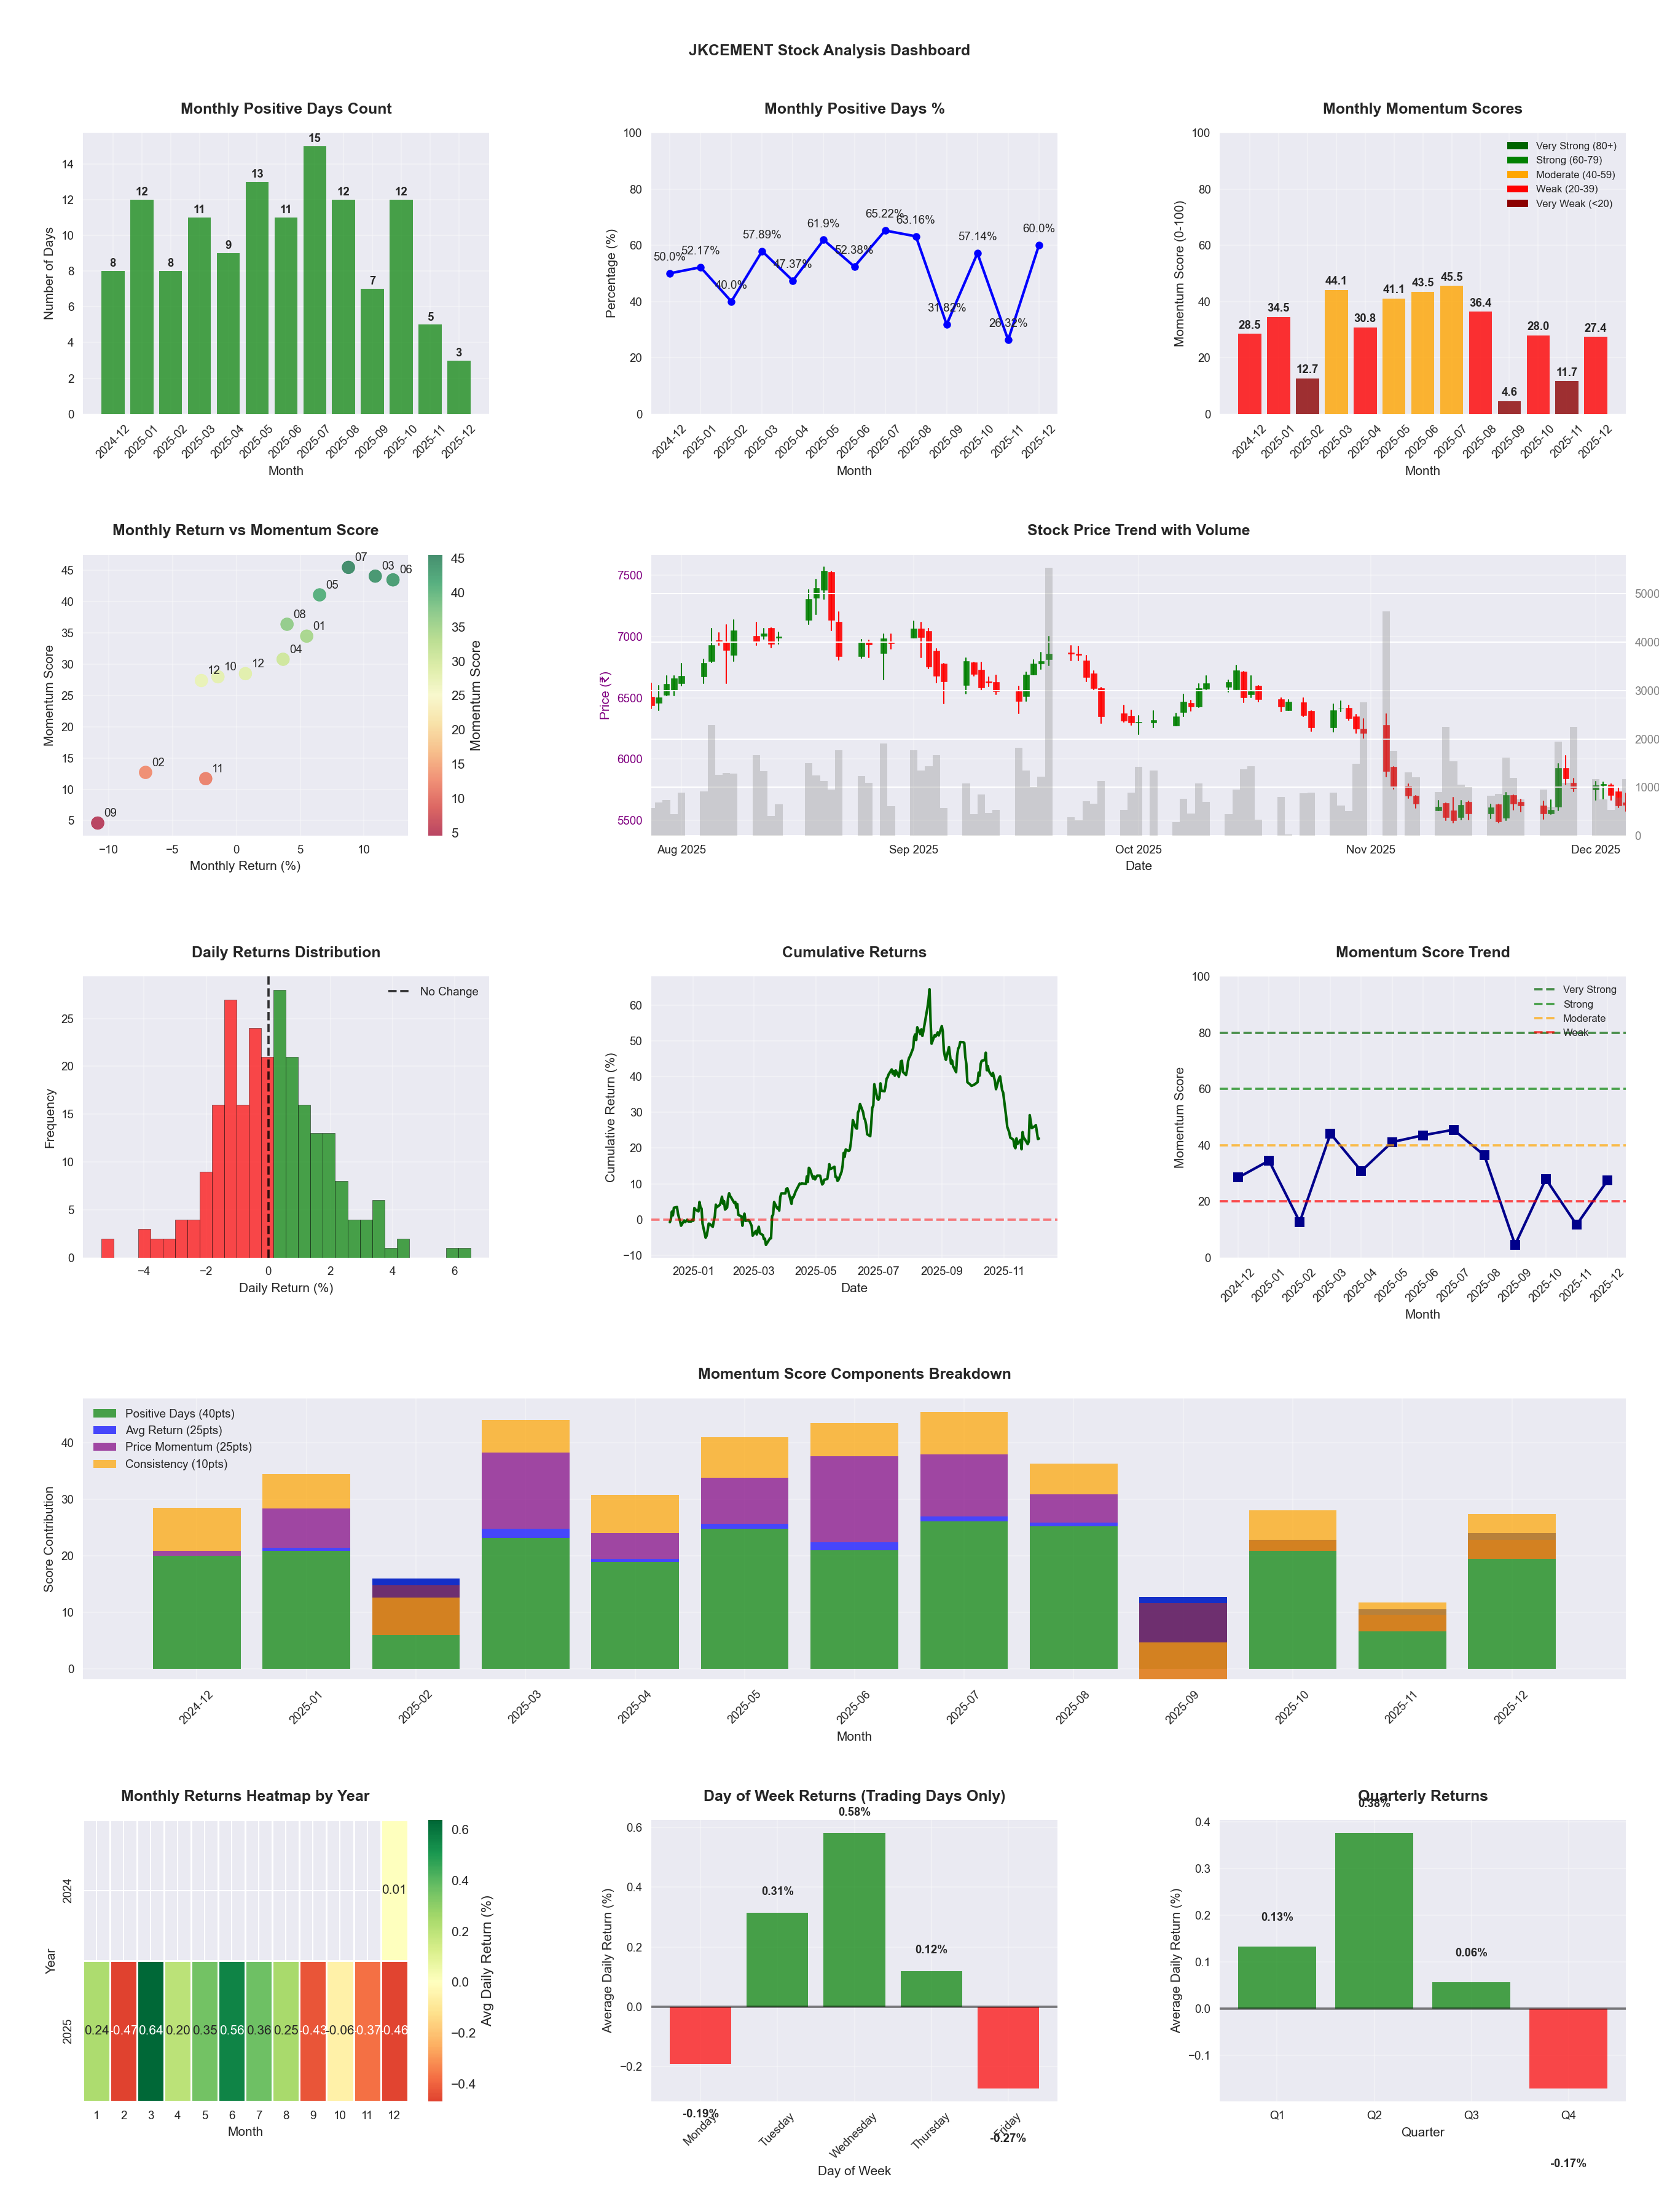
📊 Key Insights & Metrics
Symbol
📈 JKCEMENT
Date
📅 2026-04-11
Volatility
🟡 1.97%
Win Rate
⚠️ 48.8%
Avg Daily Return
📈 +0.08%
Max Drawdown
📉 -35.29%
IBD RS Score
📊 58.8
Average
Market Rank
#203
Best Month
🏆 2026-04
Worst Month
📉 2025-09
Best Months to Trade
📅 Apr, Jun, Jul
Best Days to Trade
📅 Wednesday, Tuesday
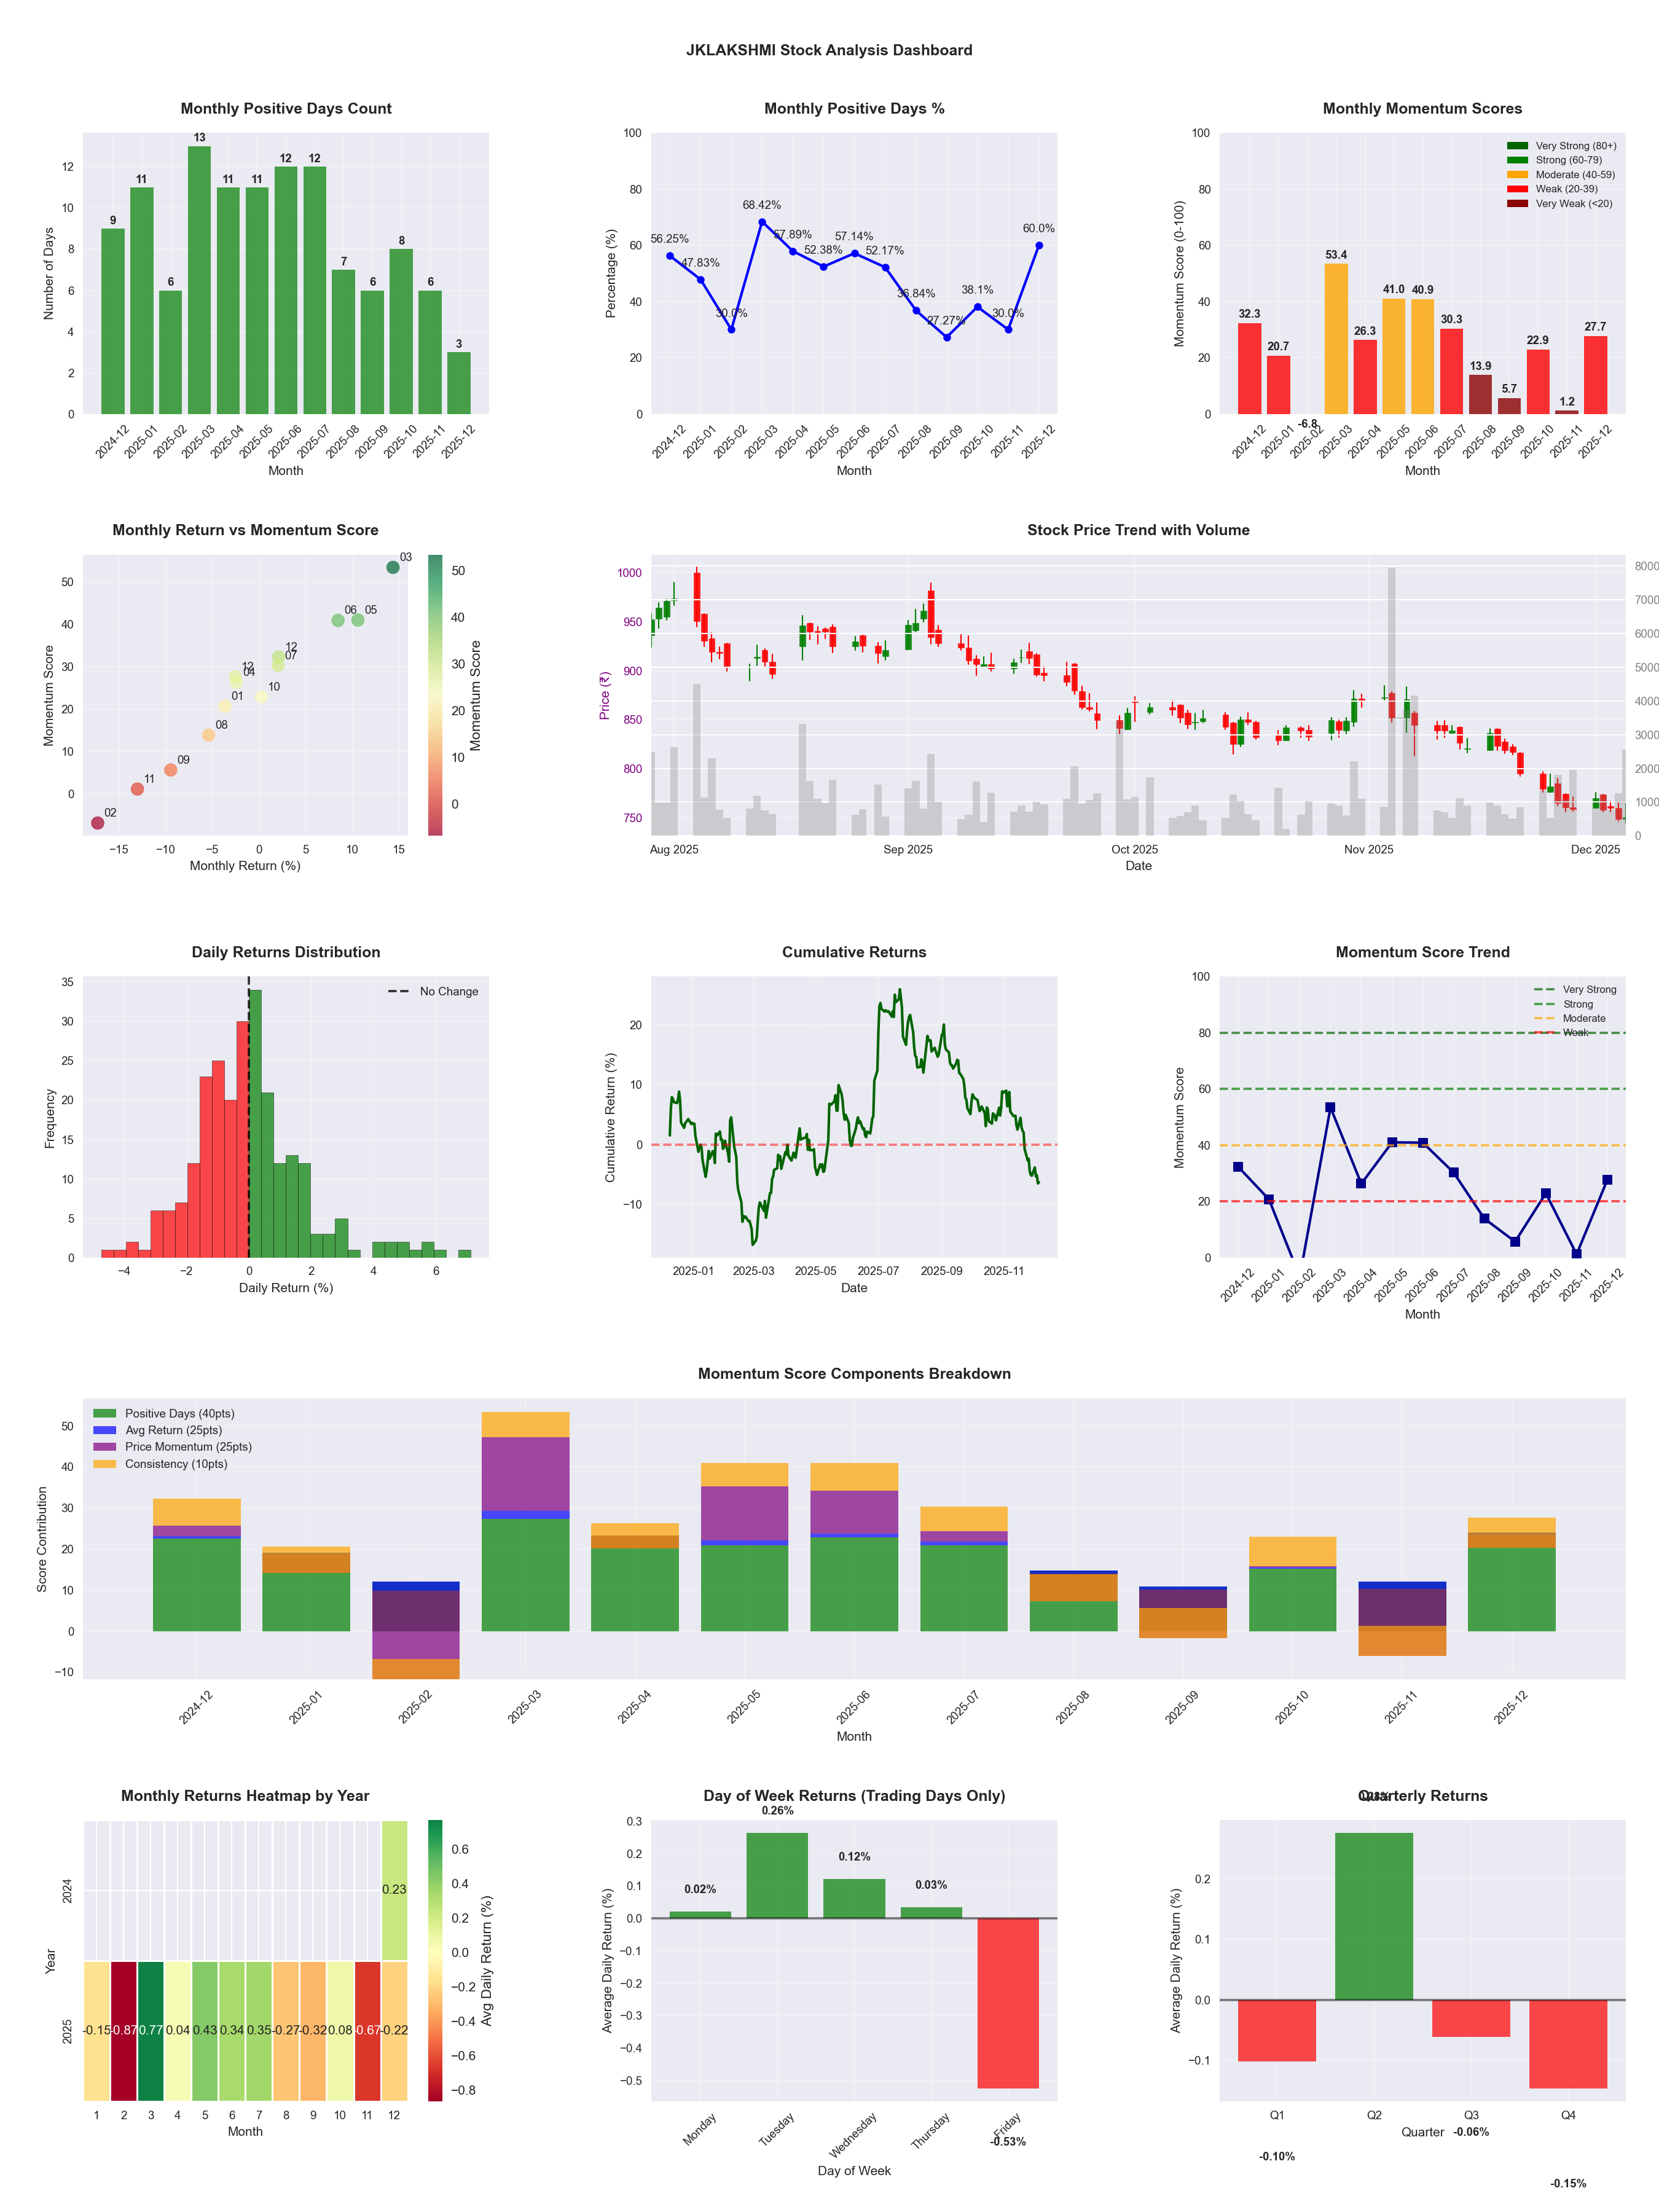
📊 Key Insights & Metrics
Symbol
📈 JKLAKSHMI
Date
📅 2026-03-21
Volatility
🟡 1.77%
Win Rate
⚠️ 44.9%
Avg Daily Return
📉 -0.09%
Max Drawdown
📉 -42.11%
Best Month
🏆 2025-05
Best Months to Trade
📅 May, Jul, Jun
Best Days to Trade
📅 Tuesday, Monday
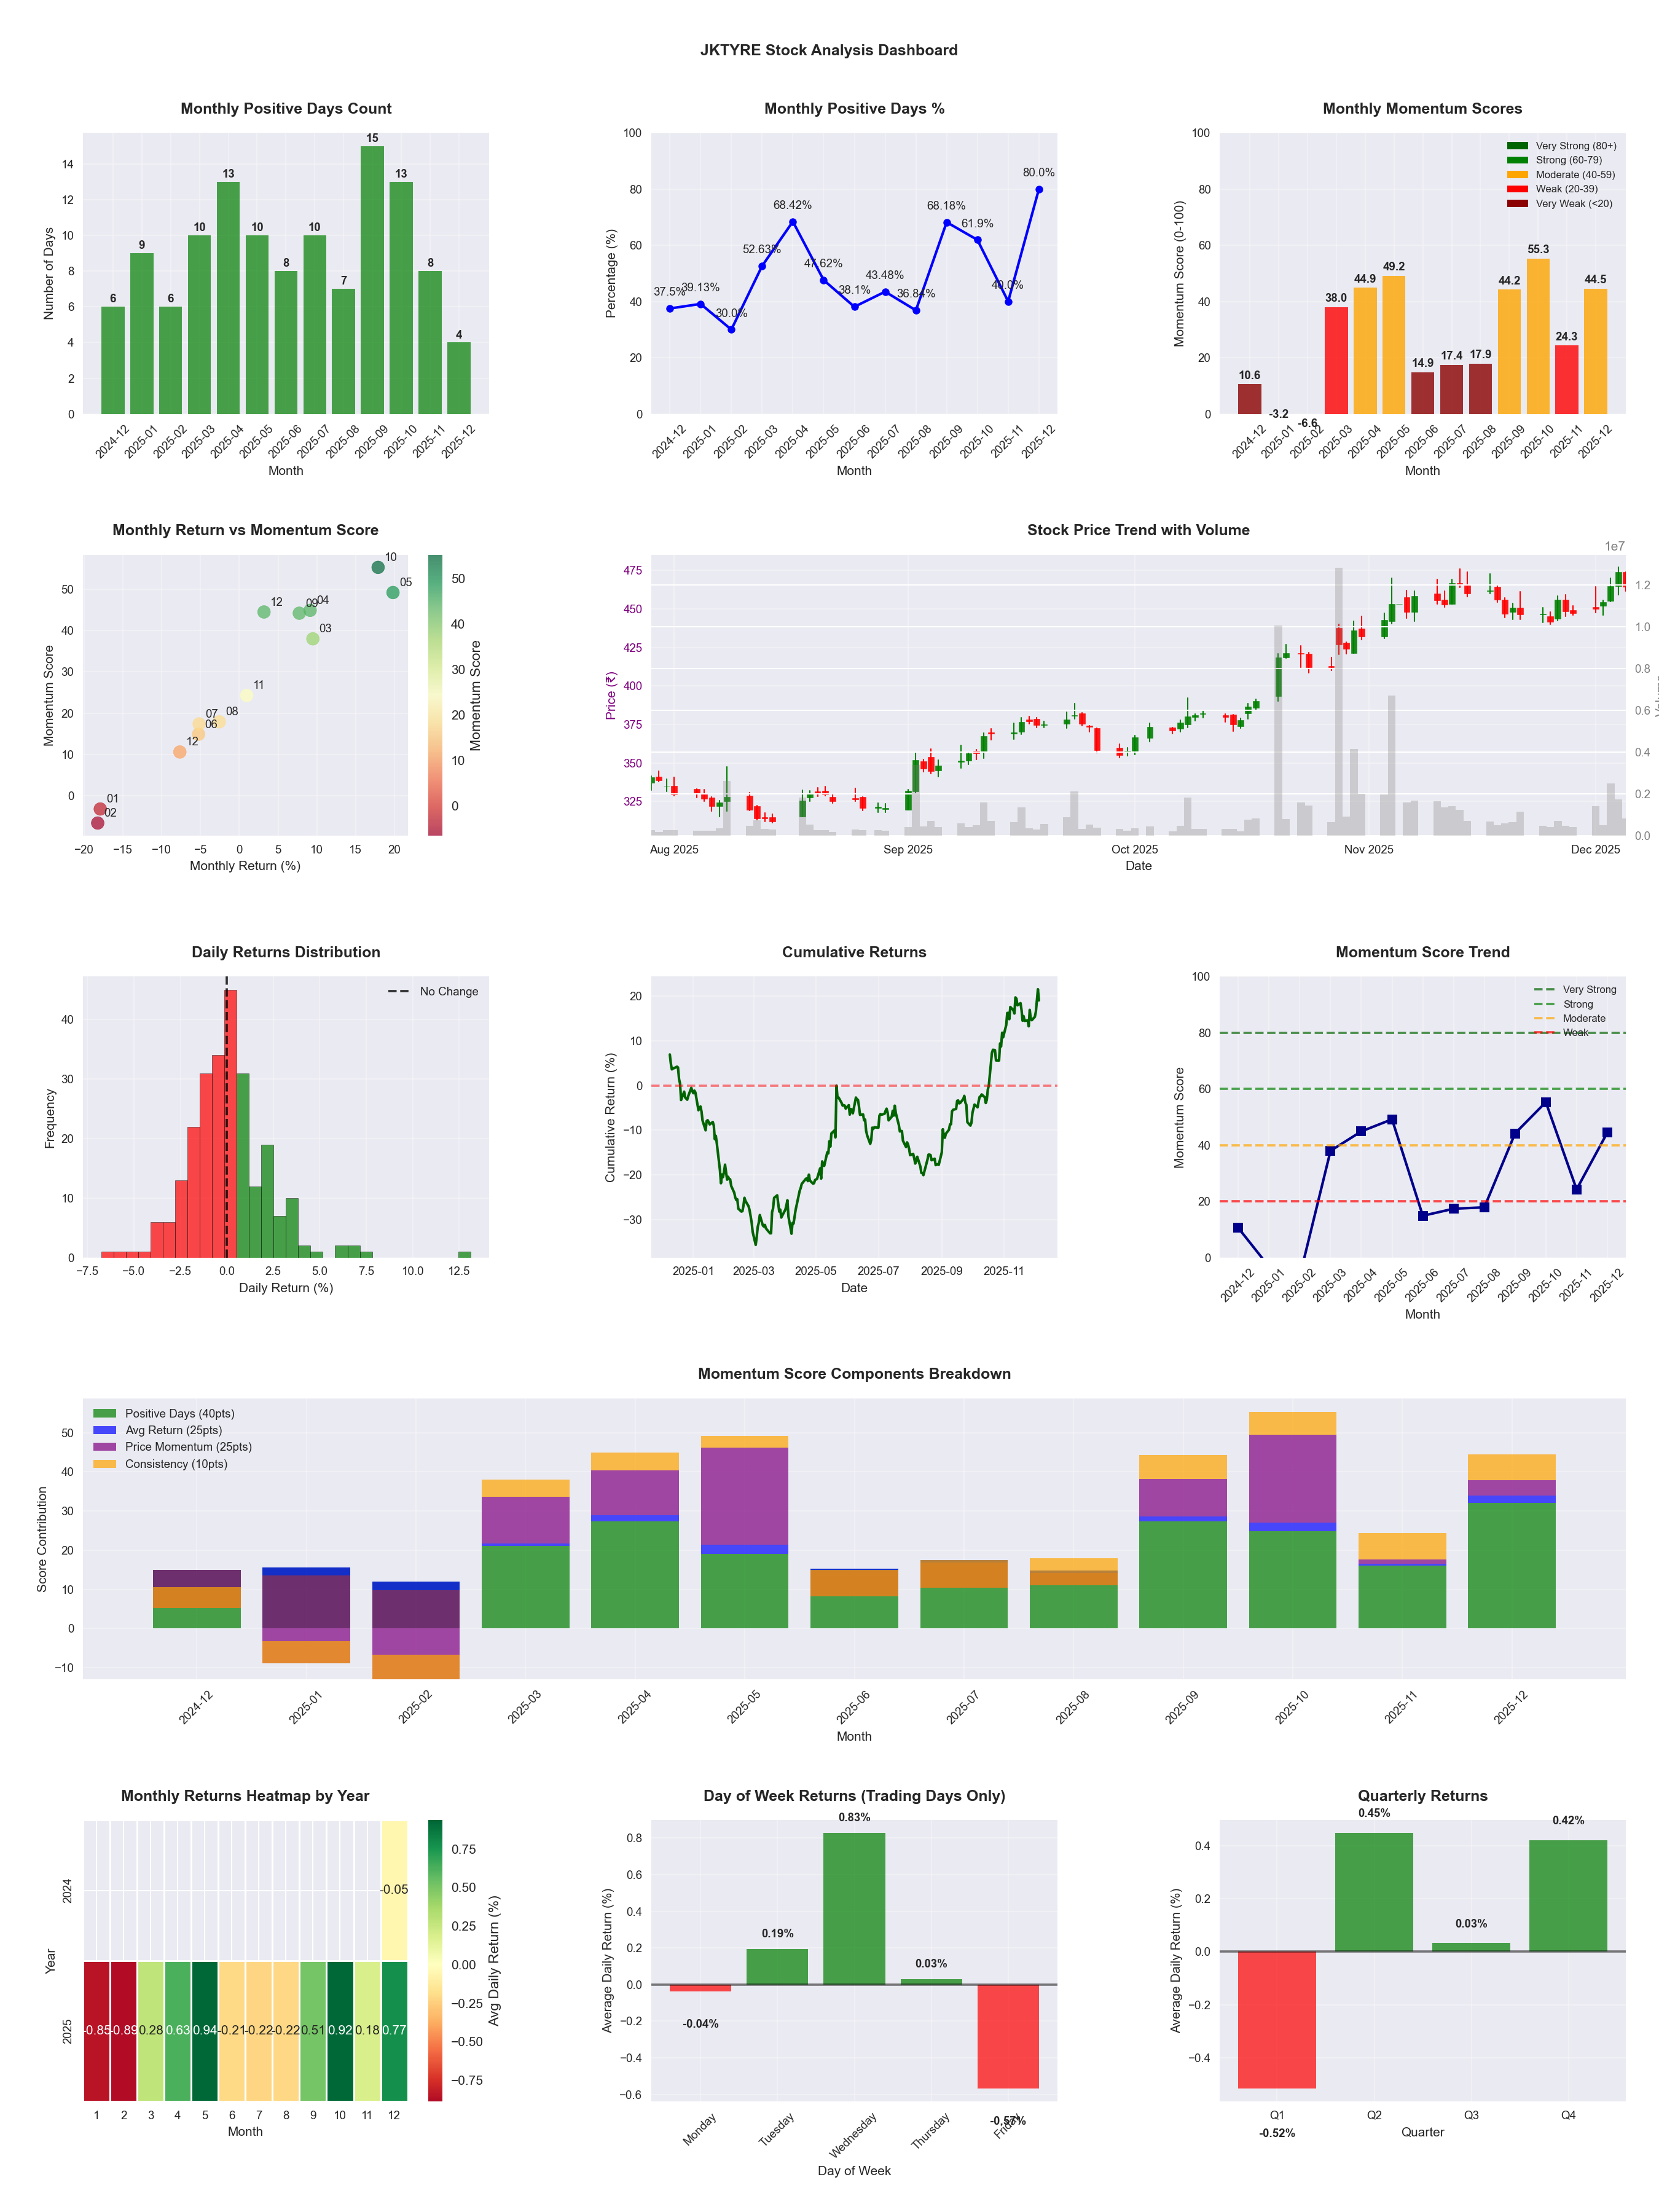
📊 Key Insights & Metrics
Symbol
📈 JKTYRE
Date
📅 2026-04-11
Volatility
🟡 2.34%
Risk Profile
⚠️ suitable for aggressive investors
Win Rate
⚠️ 50.8%
Avg Daily Return
📈 +0.20%
Max Drawdown
📉 -37.03%
IBD RS Score
📊 75.7
Strong
Market Rank
#120
Best Month
🏆 2025-10
Best Months to Trade
📅 Apr, May, Oct
Best Days to Trade
📅 Wednesday, Tuesday
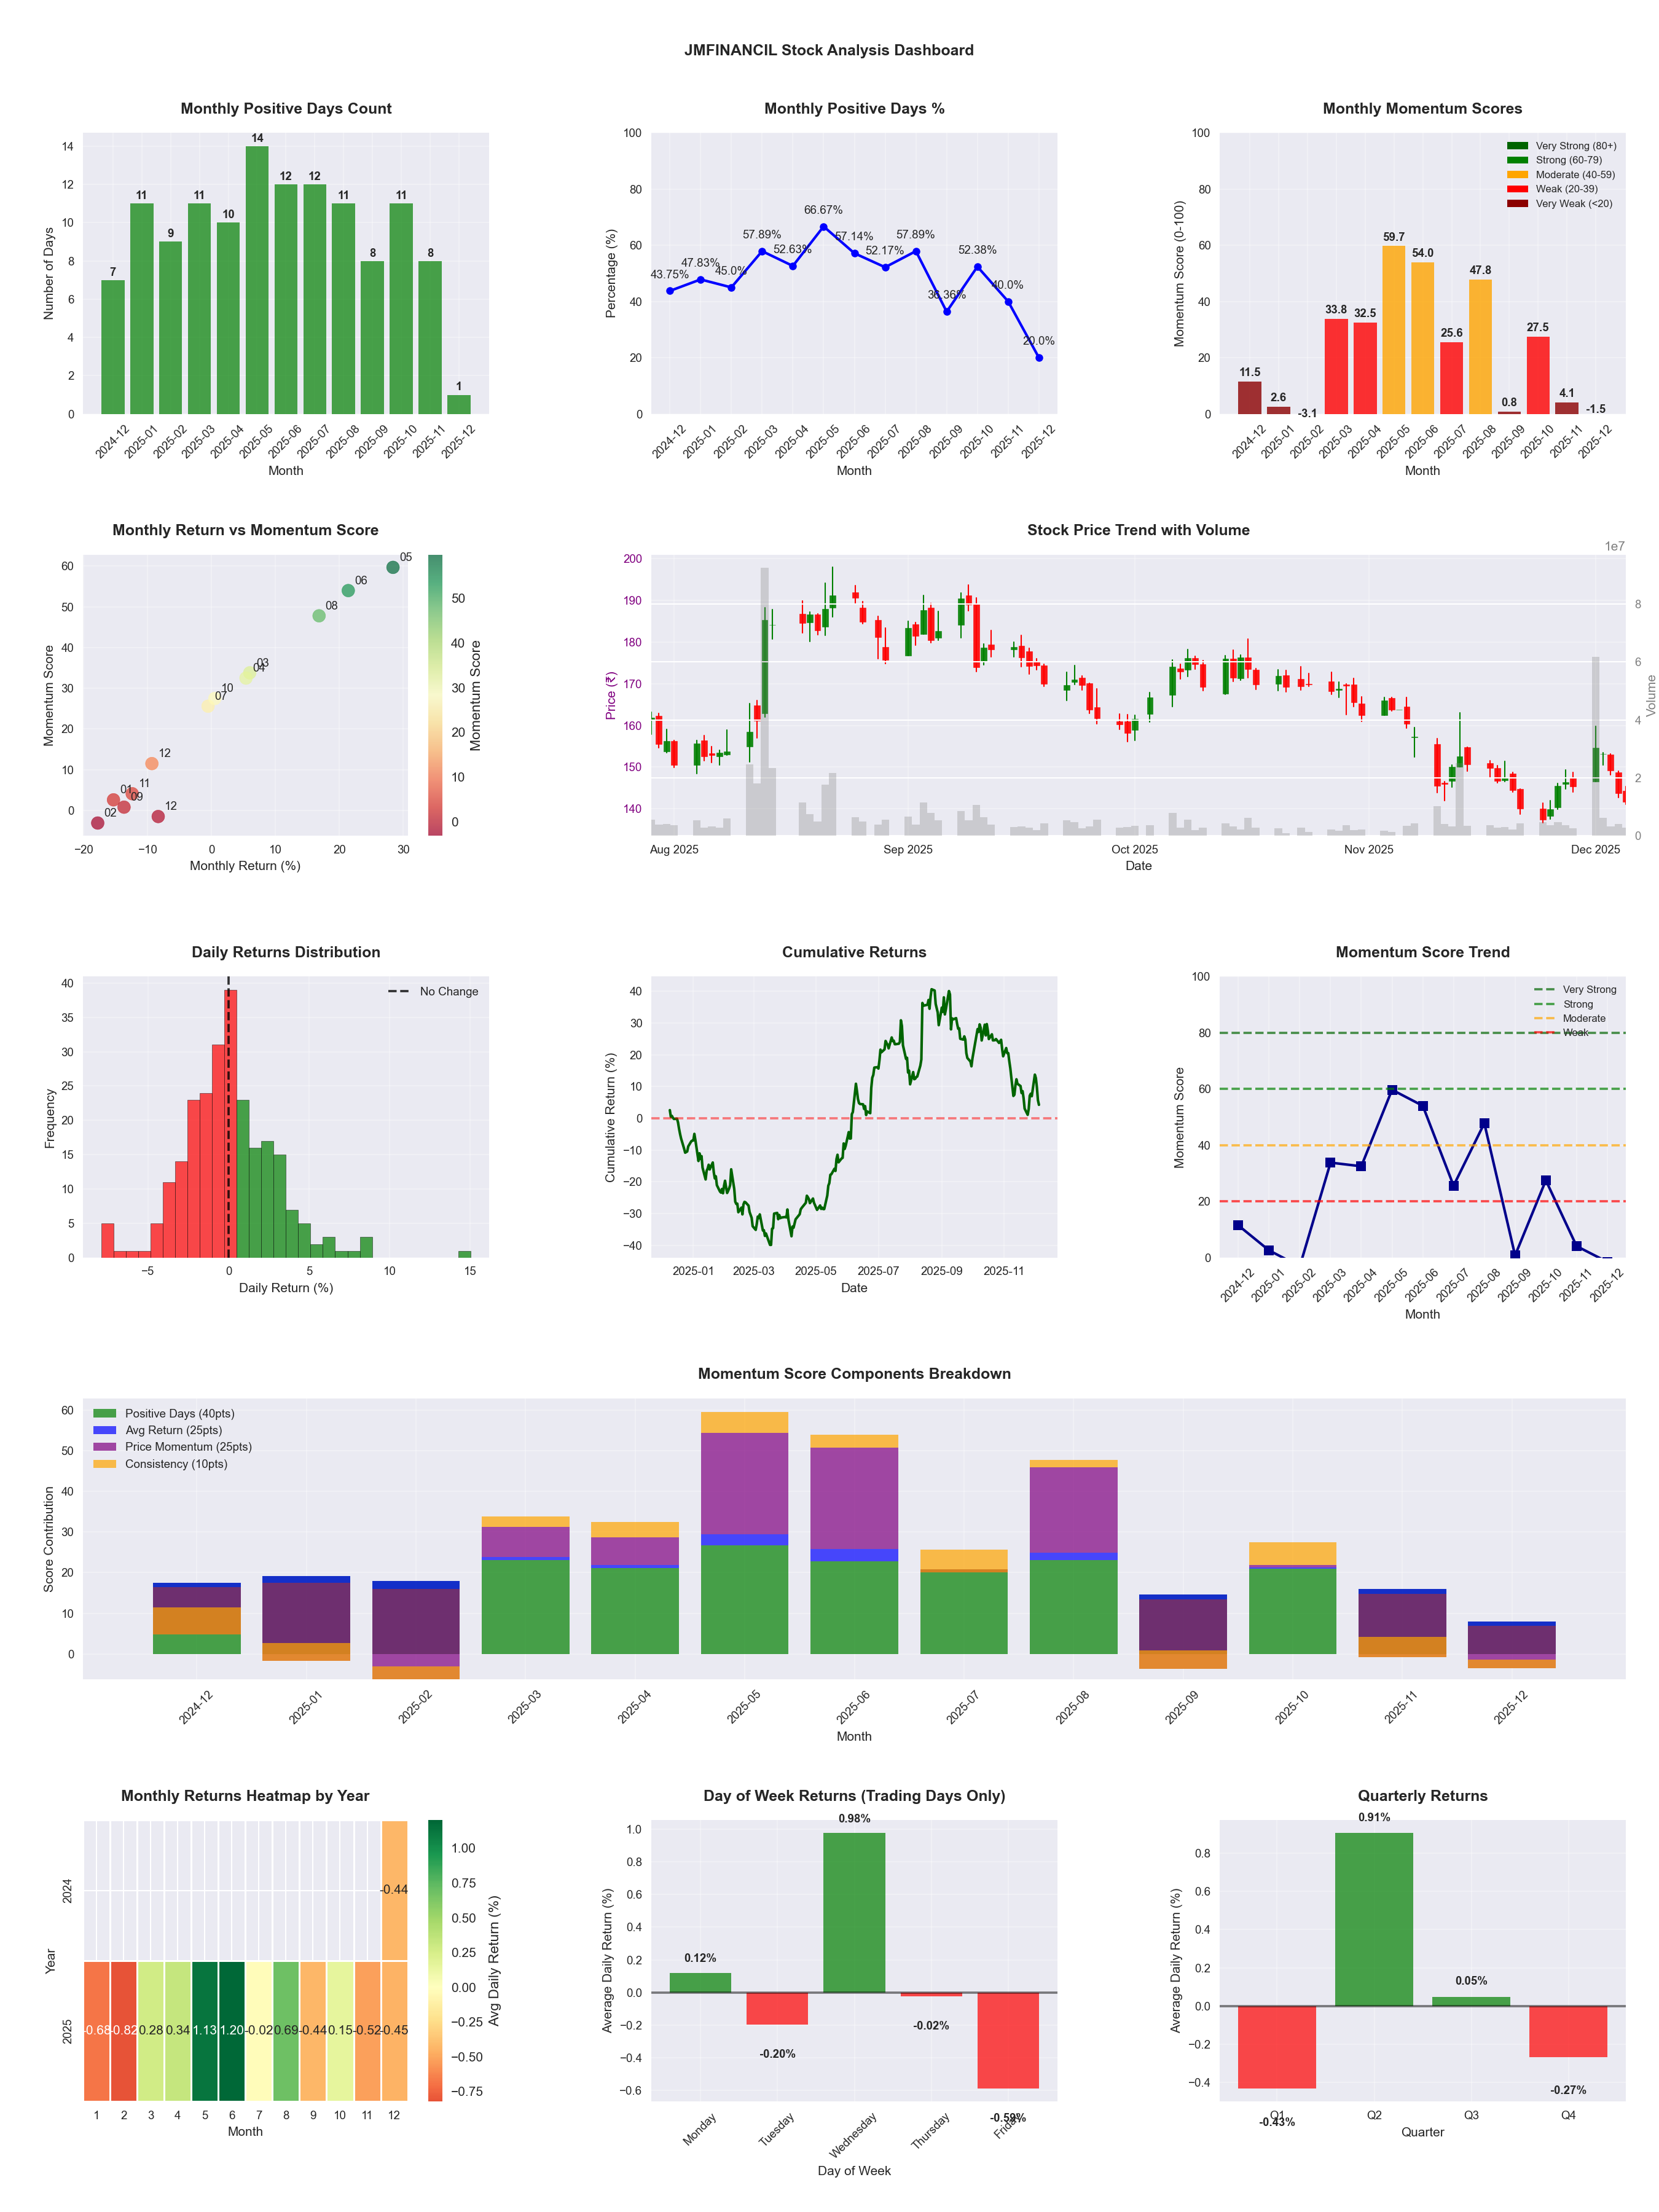
📊 Key Insights & Metrics
Symbol
📈 JMFINANCIL
Date
📅 2026-04-11
Volatility
🟡 2.86%
Risk Profile
⚠️ suitable for aggressive investors
Win Rate
⚠️ 49.6%
Avg Daily Return
📈 +0.19%
Max Drawdown
📉 -40.56%
IBD RS Score
📊 58.2
Average
Market Rank
#206
Best Month
🏆 2025-05
Best Months to Trade
📅 Apr, Jun, May
Best Days to Trade
📅 Wednesday, Monday
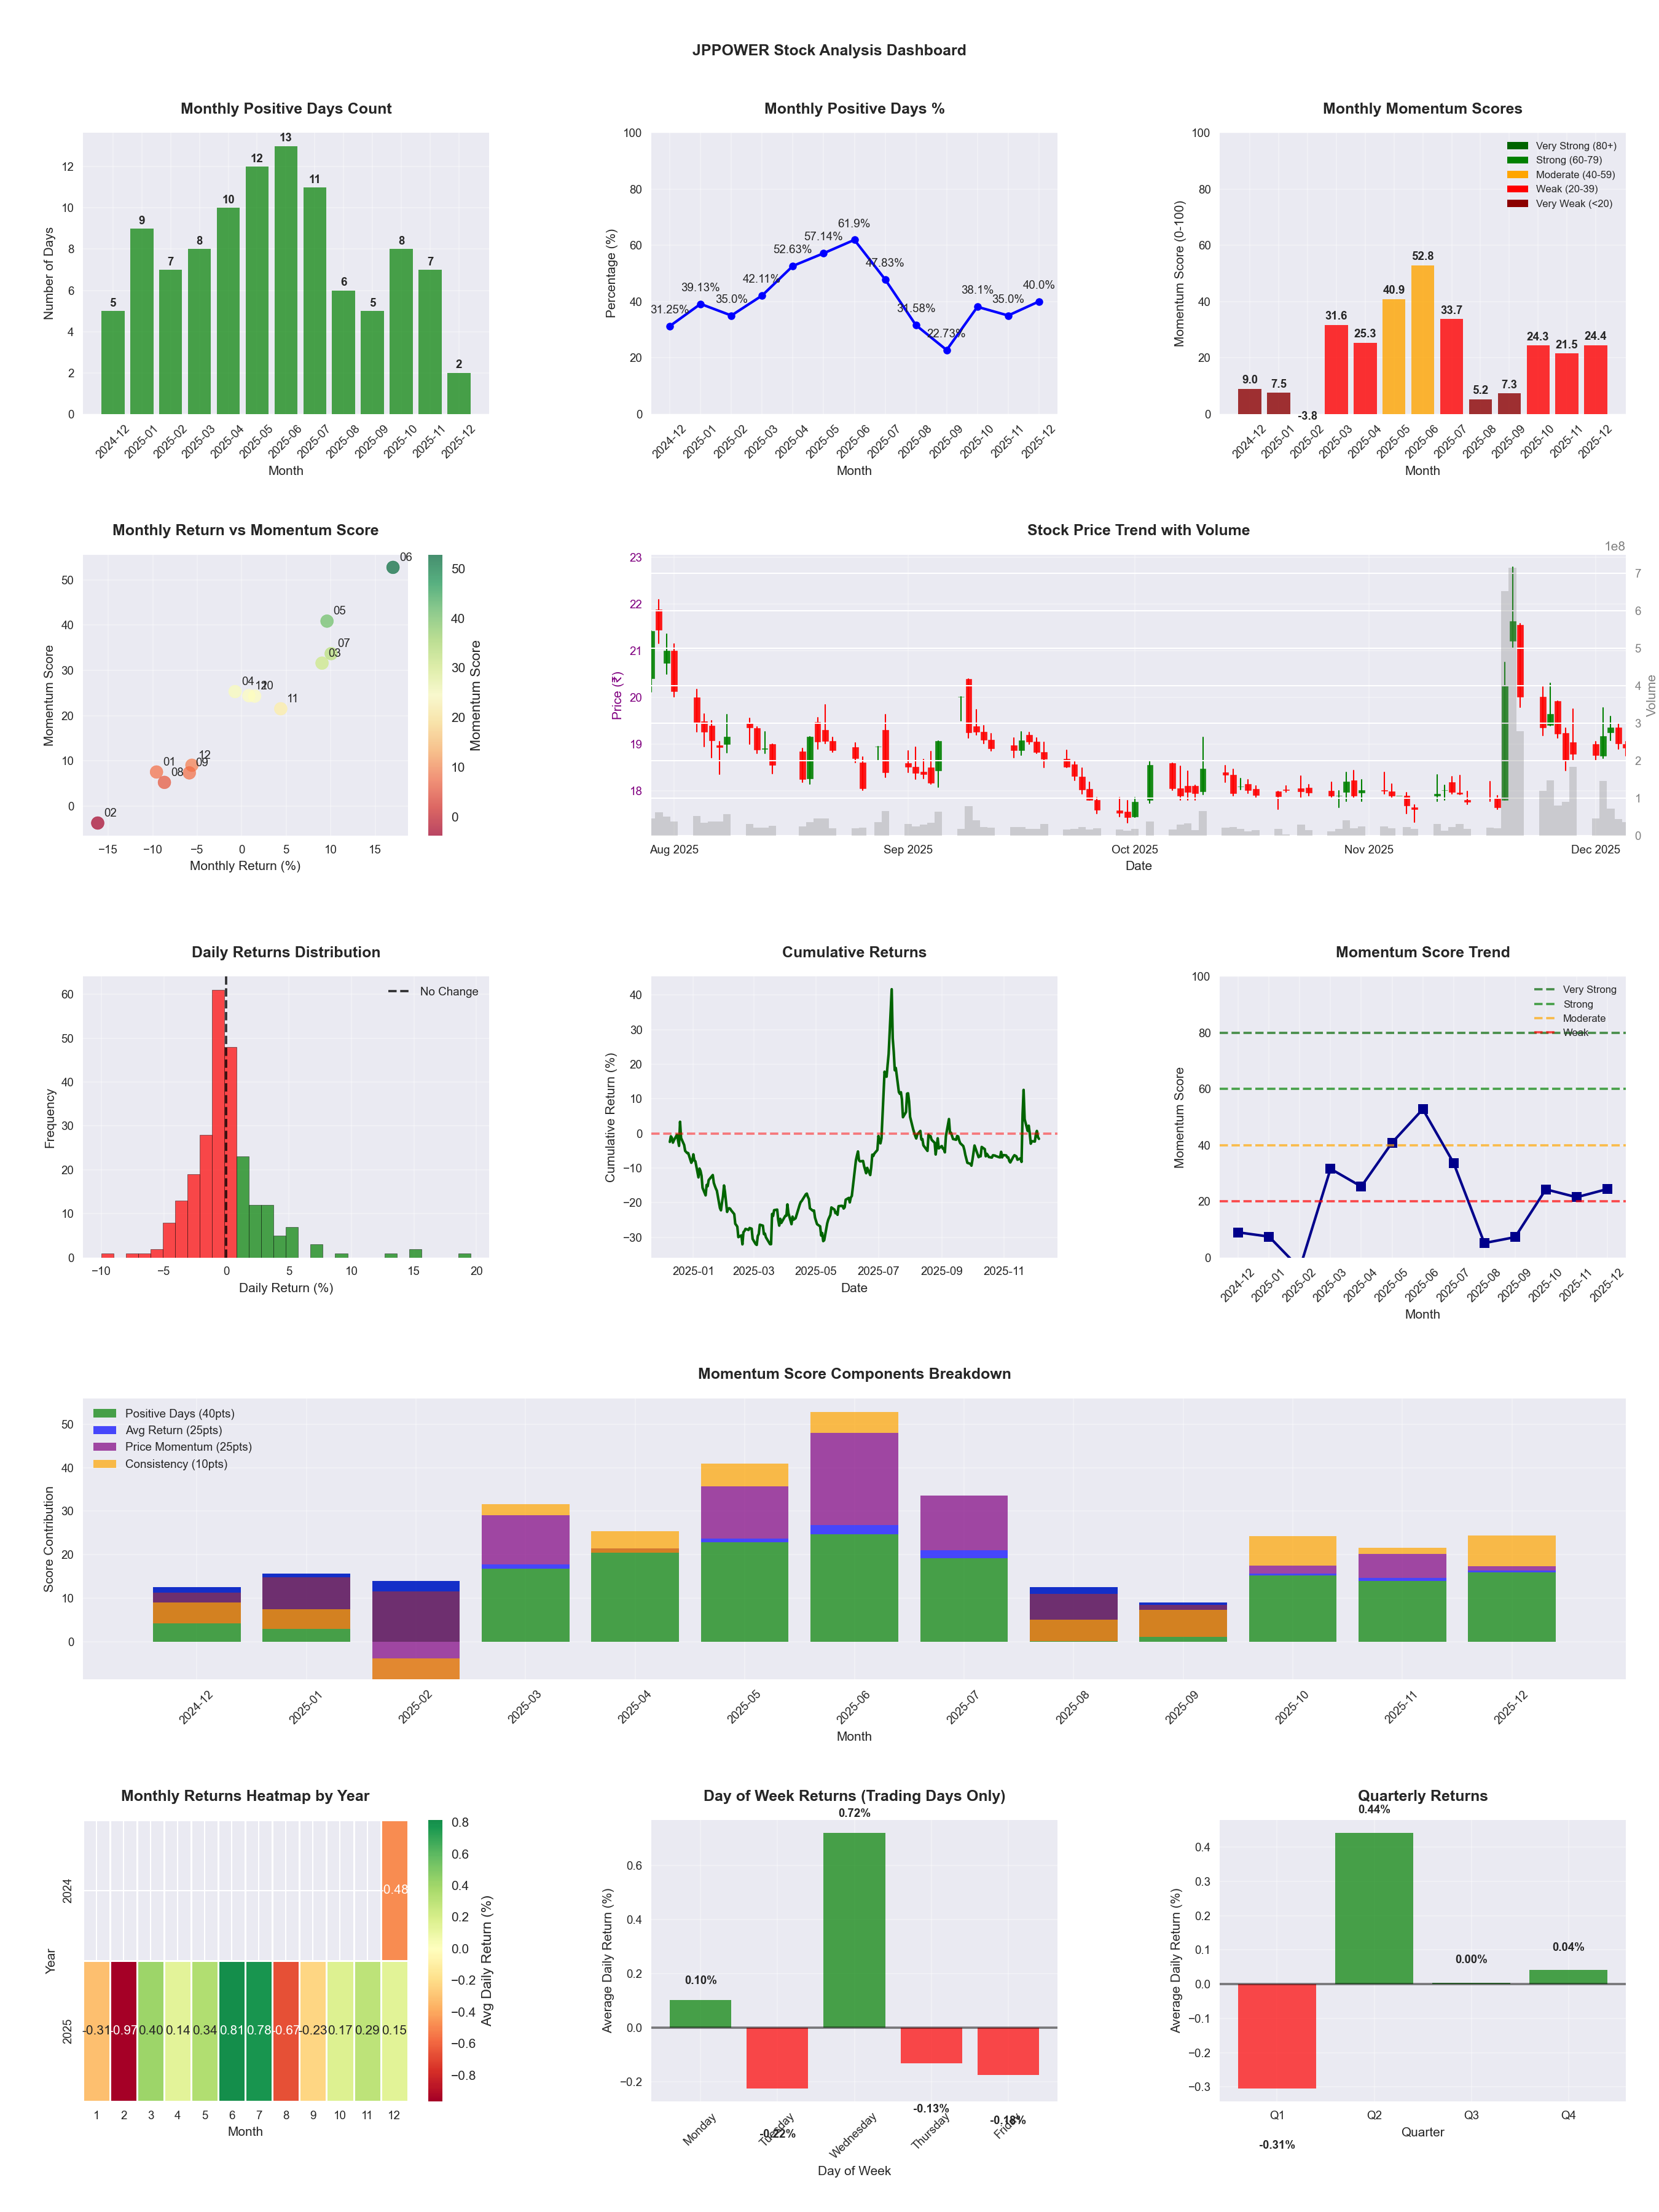
📊 Key Insights & Metrics
Symbol
📈 JPPOWER
Date
📅 2026-04-11
Volatility
🔴 3.30%
Risk Profile
⚠️ suitable for aggressive investors
Win Rate
⚠️ 43.5%
Avg Daily Return
📈 +0.12%
Max Drawdown
📉 -50.90%
IBD RS Score
📊 54.4
Average
Market Rank
#225
Best Month
🏆 2026-04
Worst Month
📉 2026-01
Best Months to Trade
📅 Apr, Jun, Jul
Best Days to Trade
📅 Wednesday, Monday
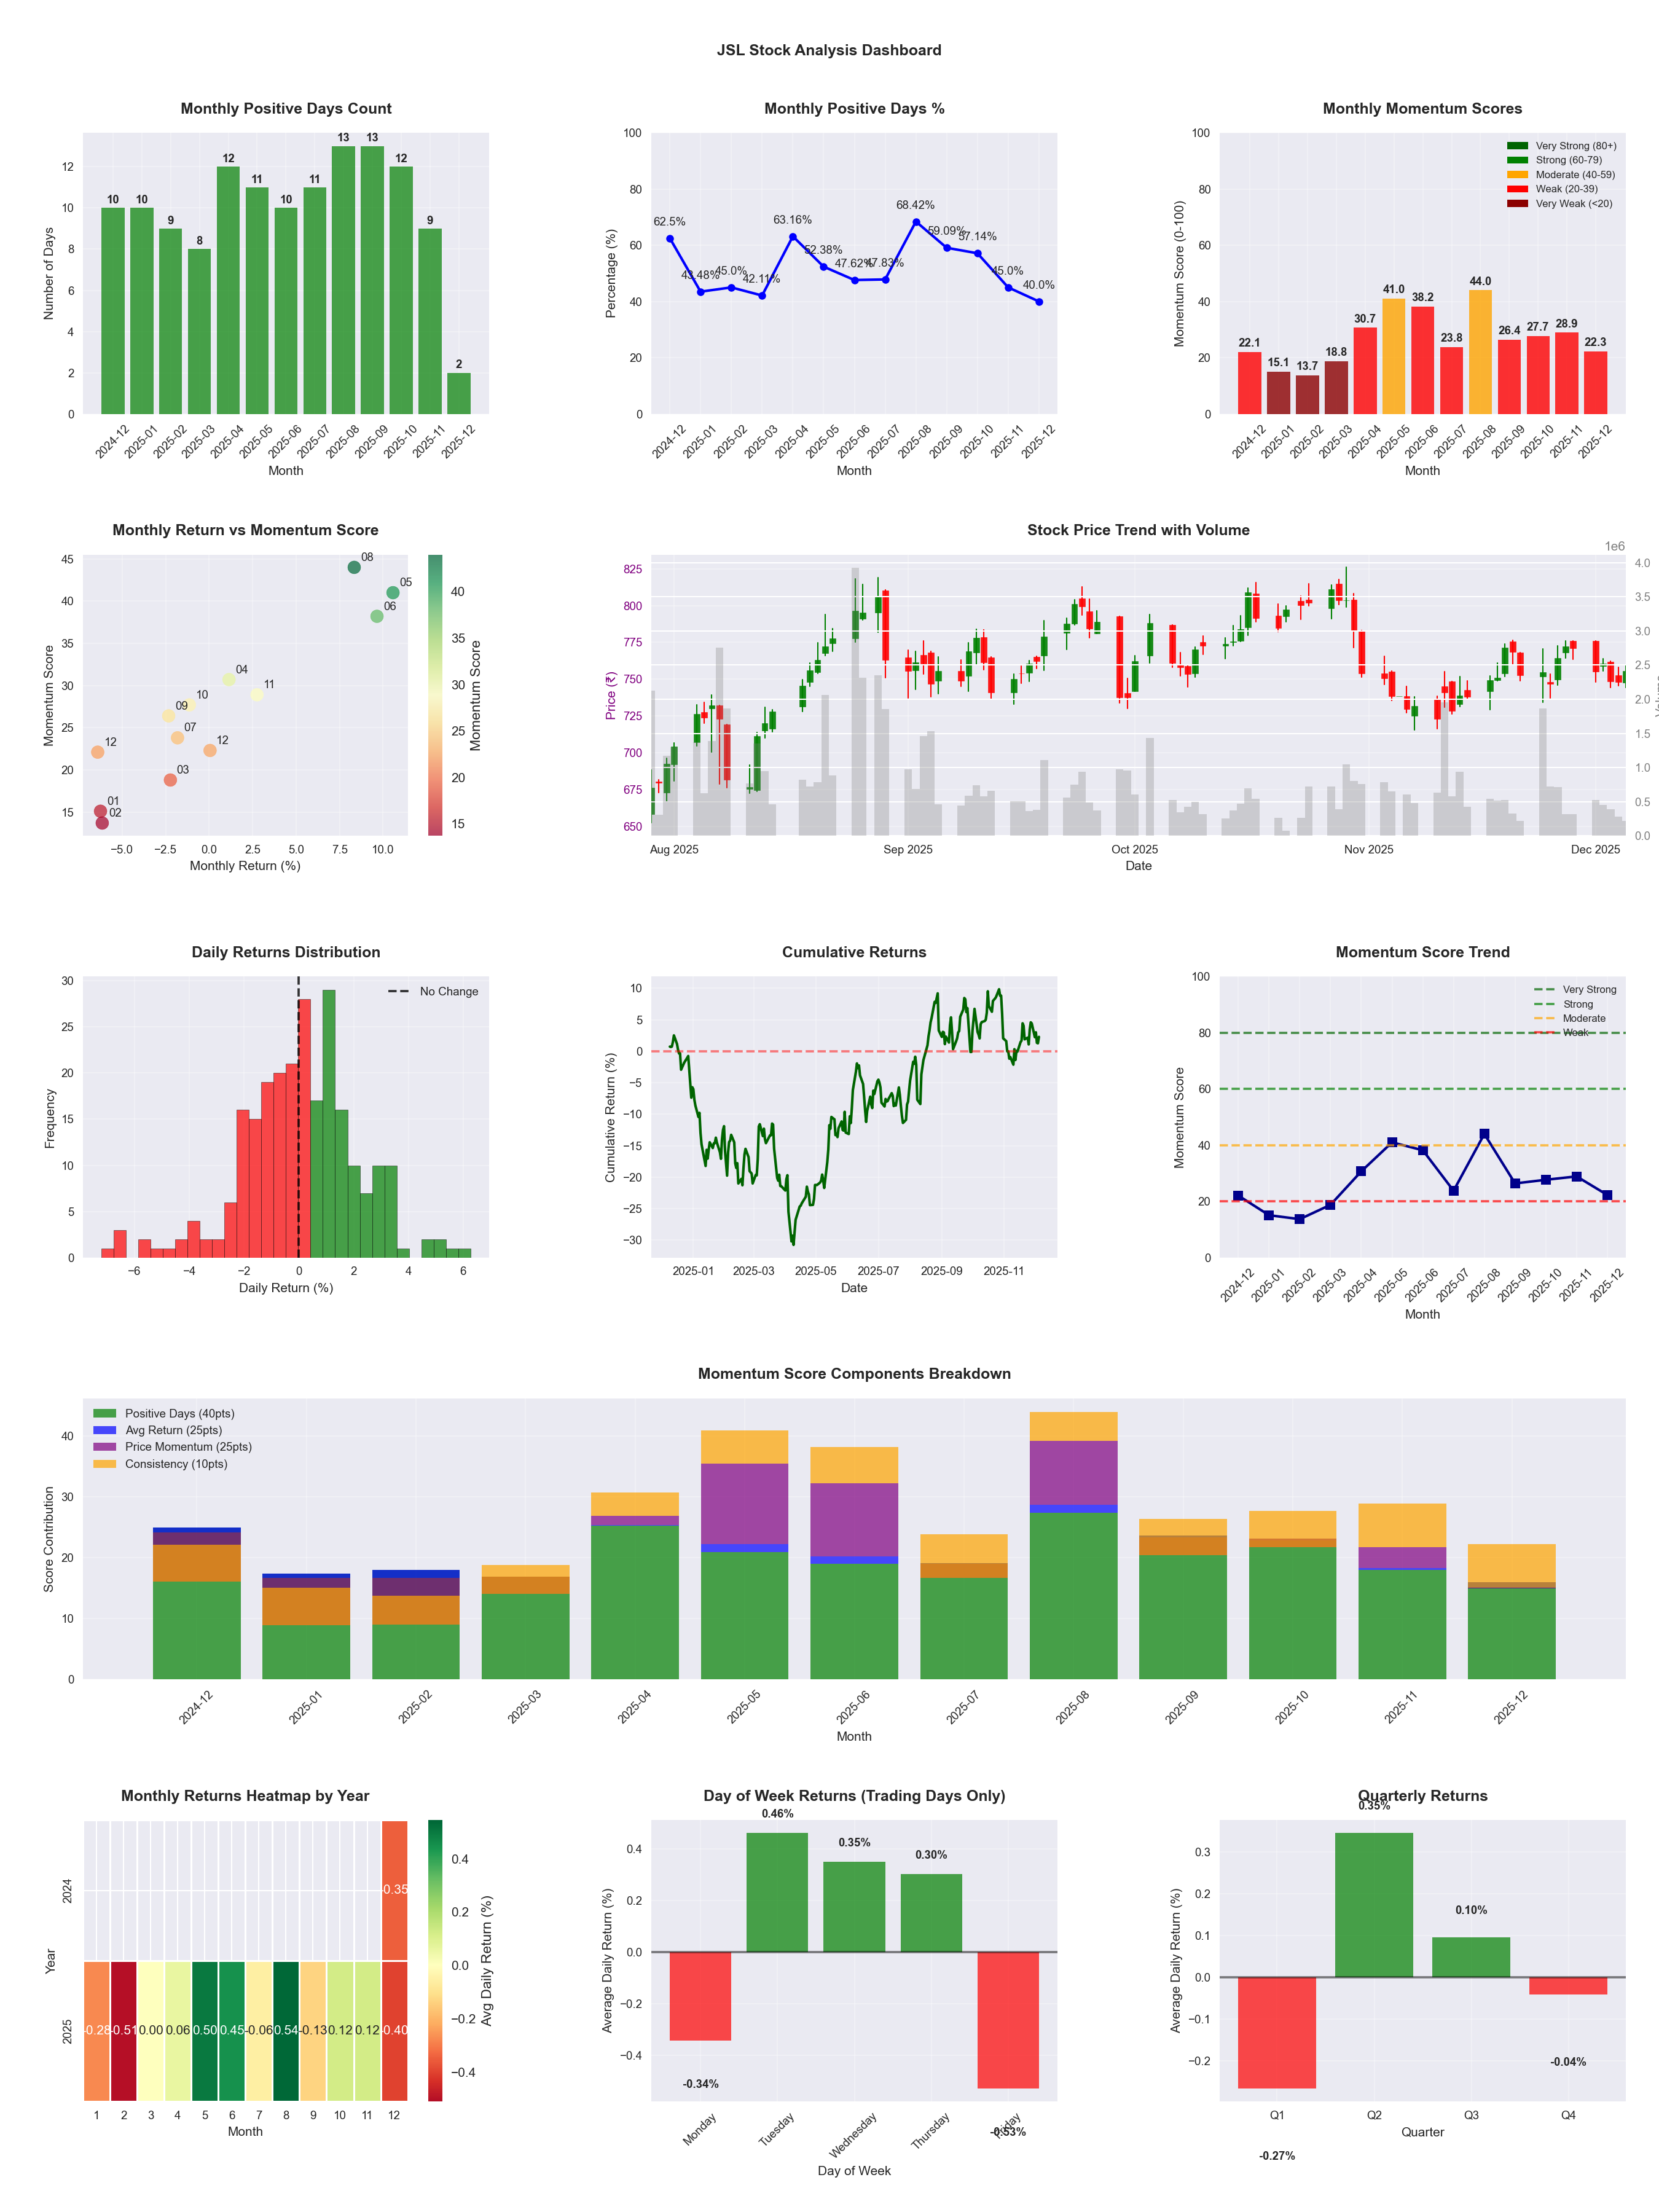
📊 Key Insights & Metrics
Symbol
📈 JSL
Date
📅 2026-04-11
Volatility
🟡 2.12%
Risk Profile
⚠️ suitable for aggressive investors
Win Rate
⚠️ 55.7%
Avg Daily Return
📈 +0.17%
Max Drawdown
📉 -19.53%
IBD RS Score
📊 78.7
Strong
Market Rank
#105
Best Month
🏆 2026-04
Worst Month
📉 2026-03
Best Months to Trade
📅 Apr, Aug, May
Best Days to Trade
📅 Tuesday, Wednesday
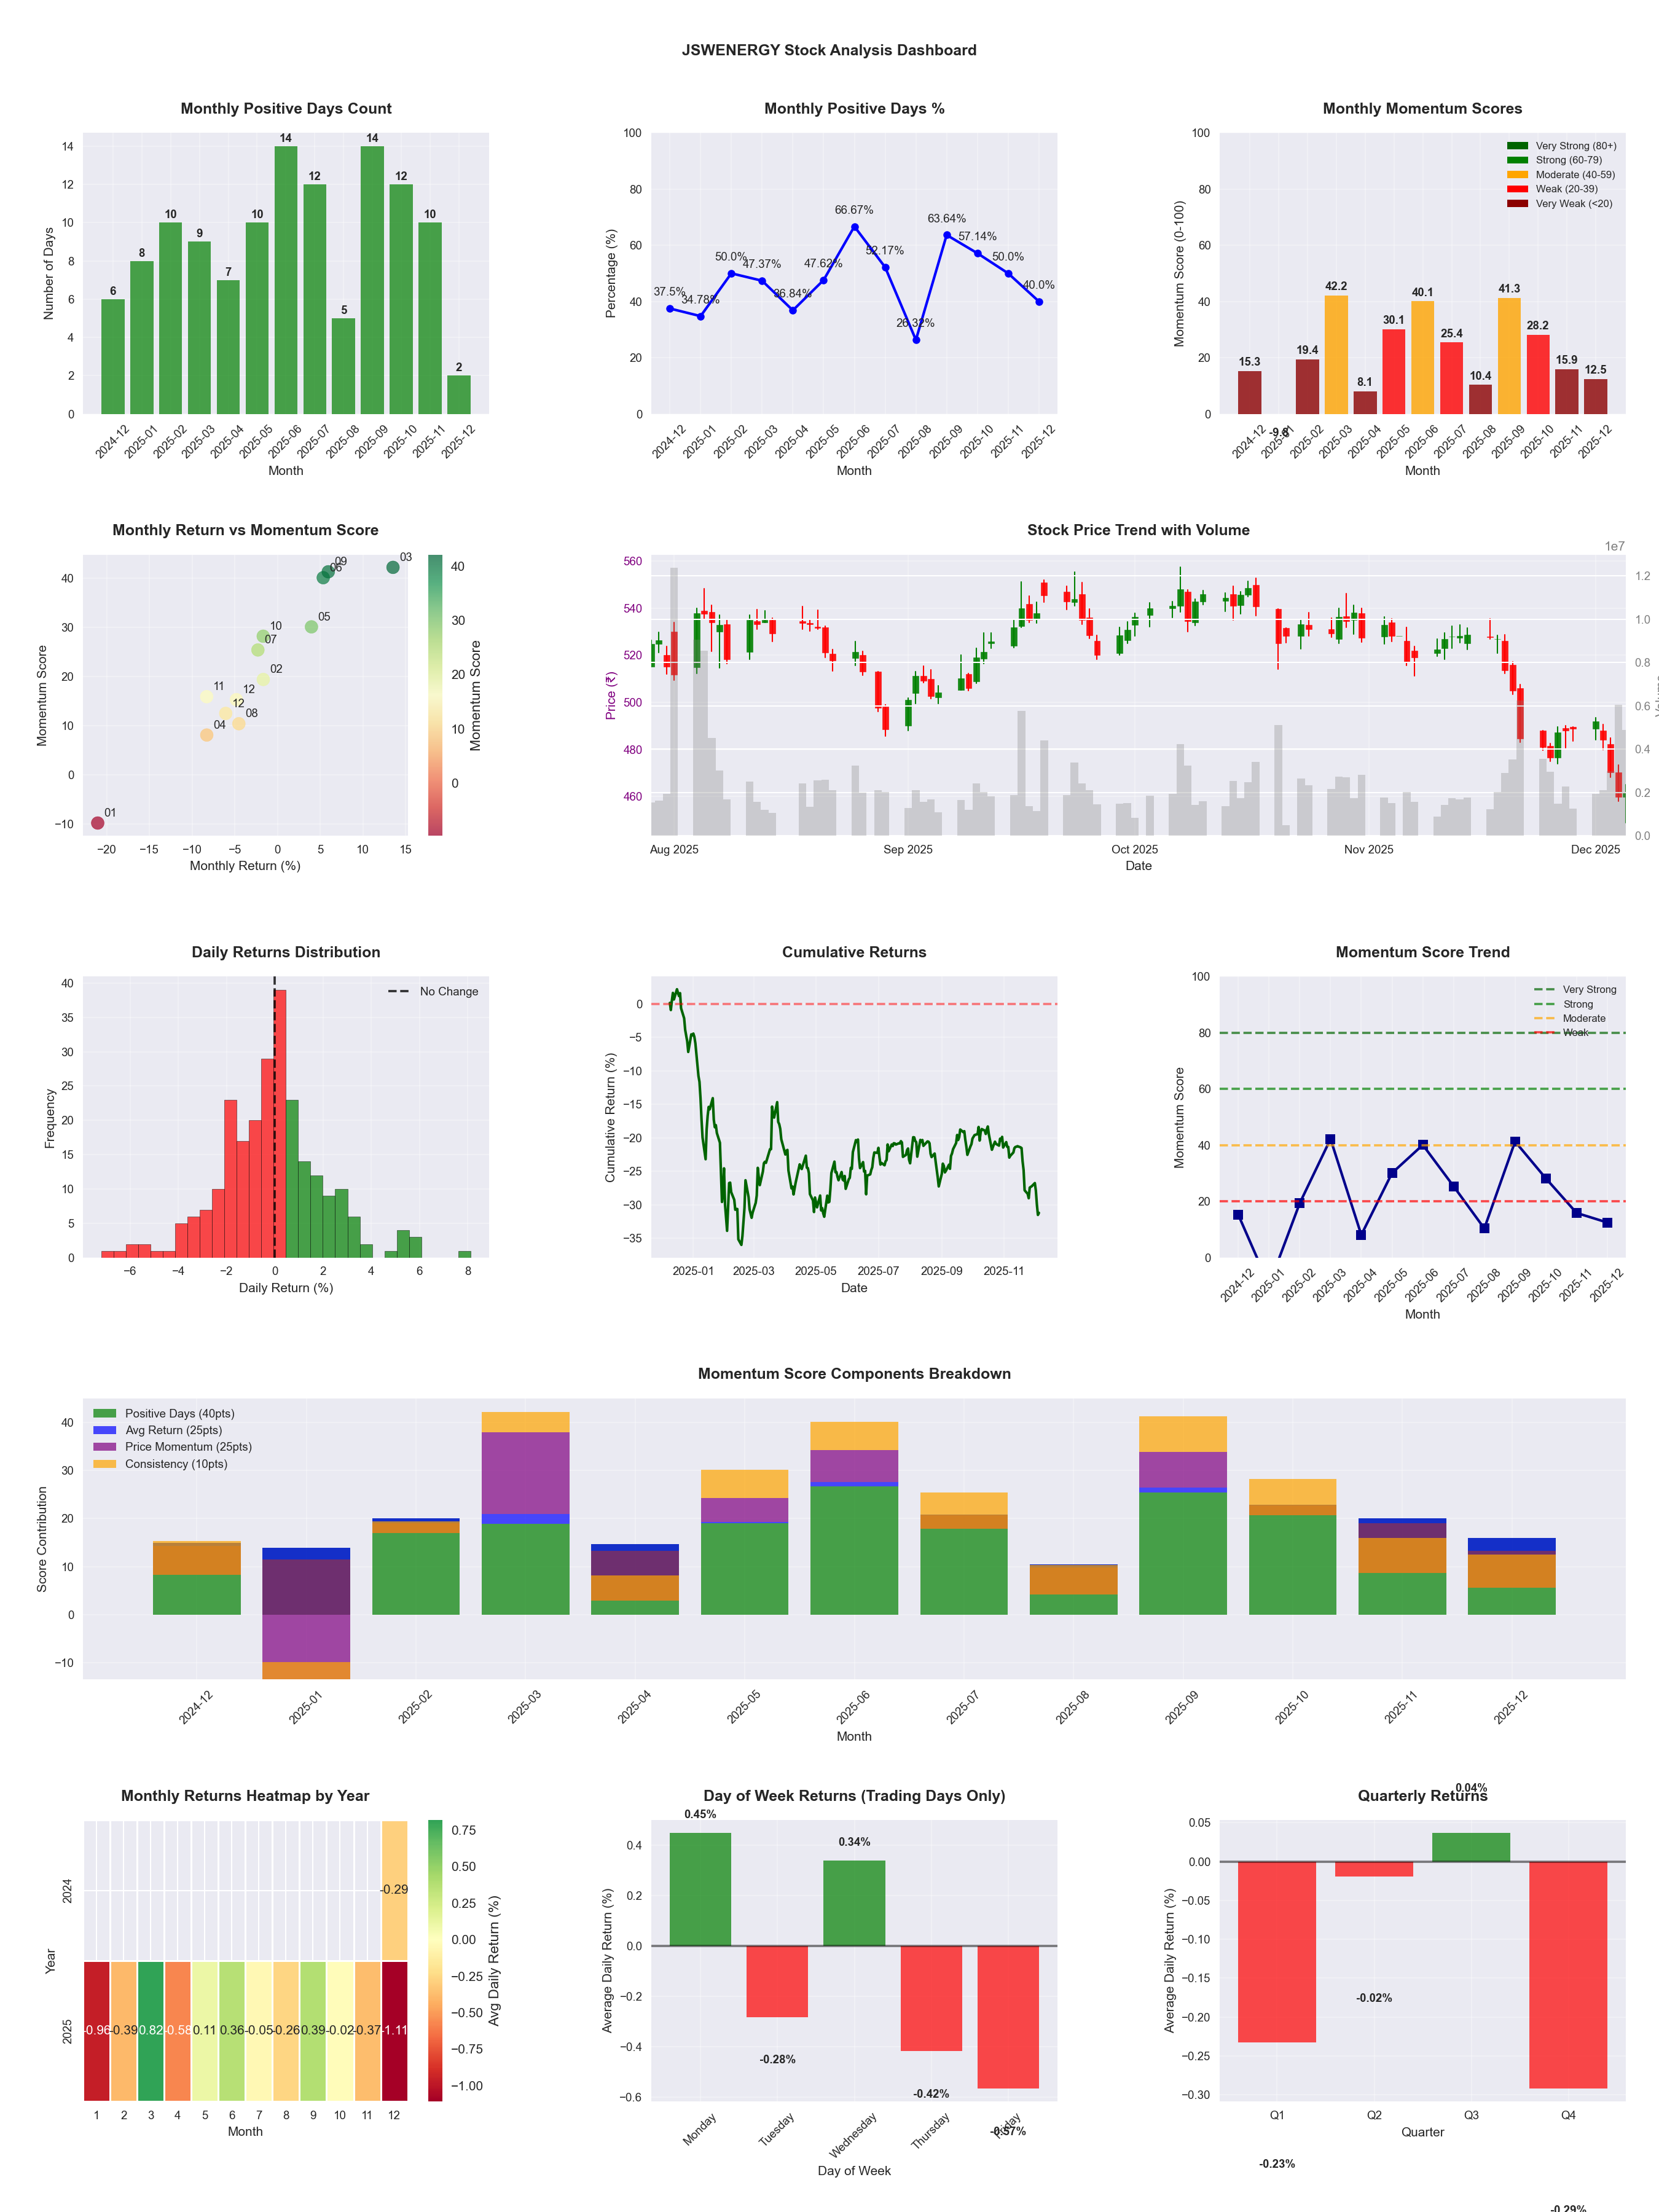
📊 Key Insights & Metrics
Symbol
📈 JSWENERGY
Date
📅 2026-04-11
Volatility
🟡 1.84%
Win Rate
⚠️ 48.8%
Avg Daily Return
📈 +0.01%
Max Drawdown
📉 -19.79%
IBD RS Score
📊 53.8
Average
Market Rank
#228
Best Month
🏆 2025-09
Worst Month
📉 2025-04
Best Months to Trade
📅 Sep, Jun, Feb
Best Days to Trade
📅 Monday, Wednesday
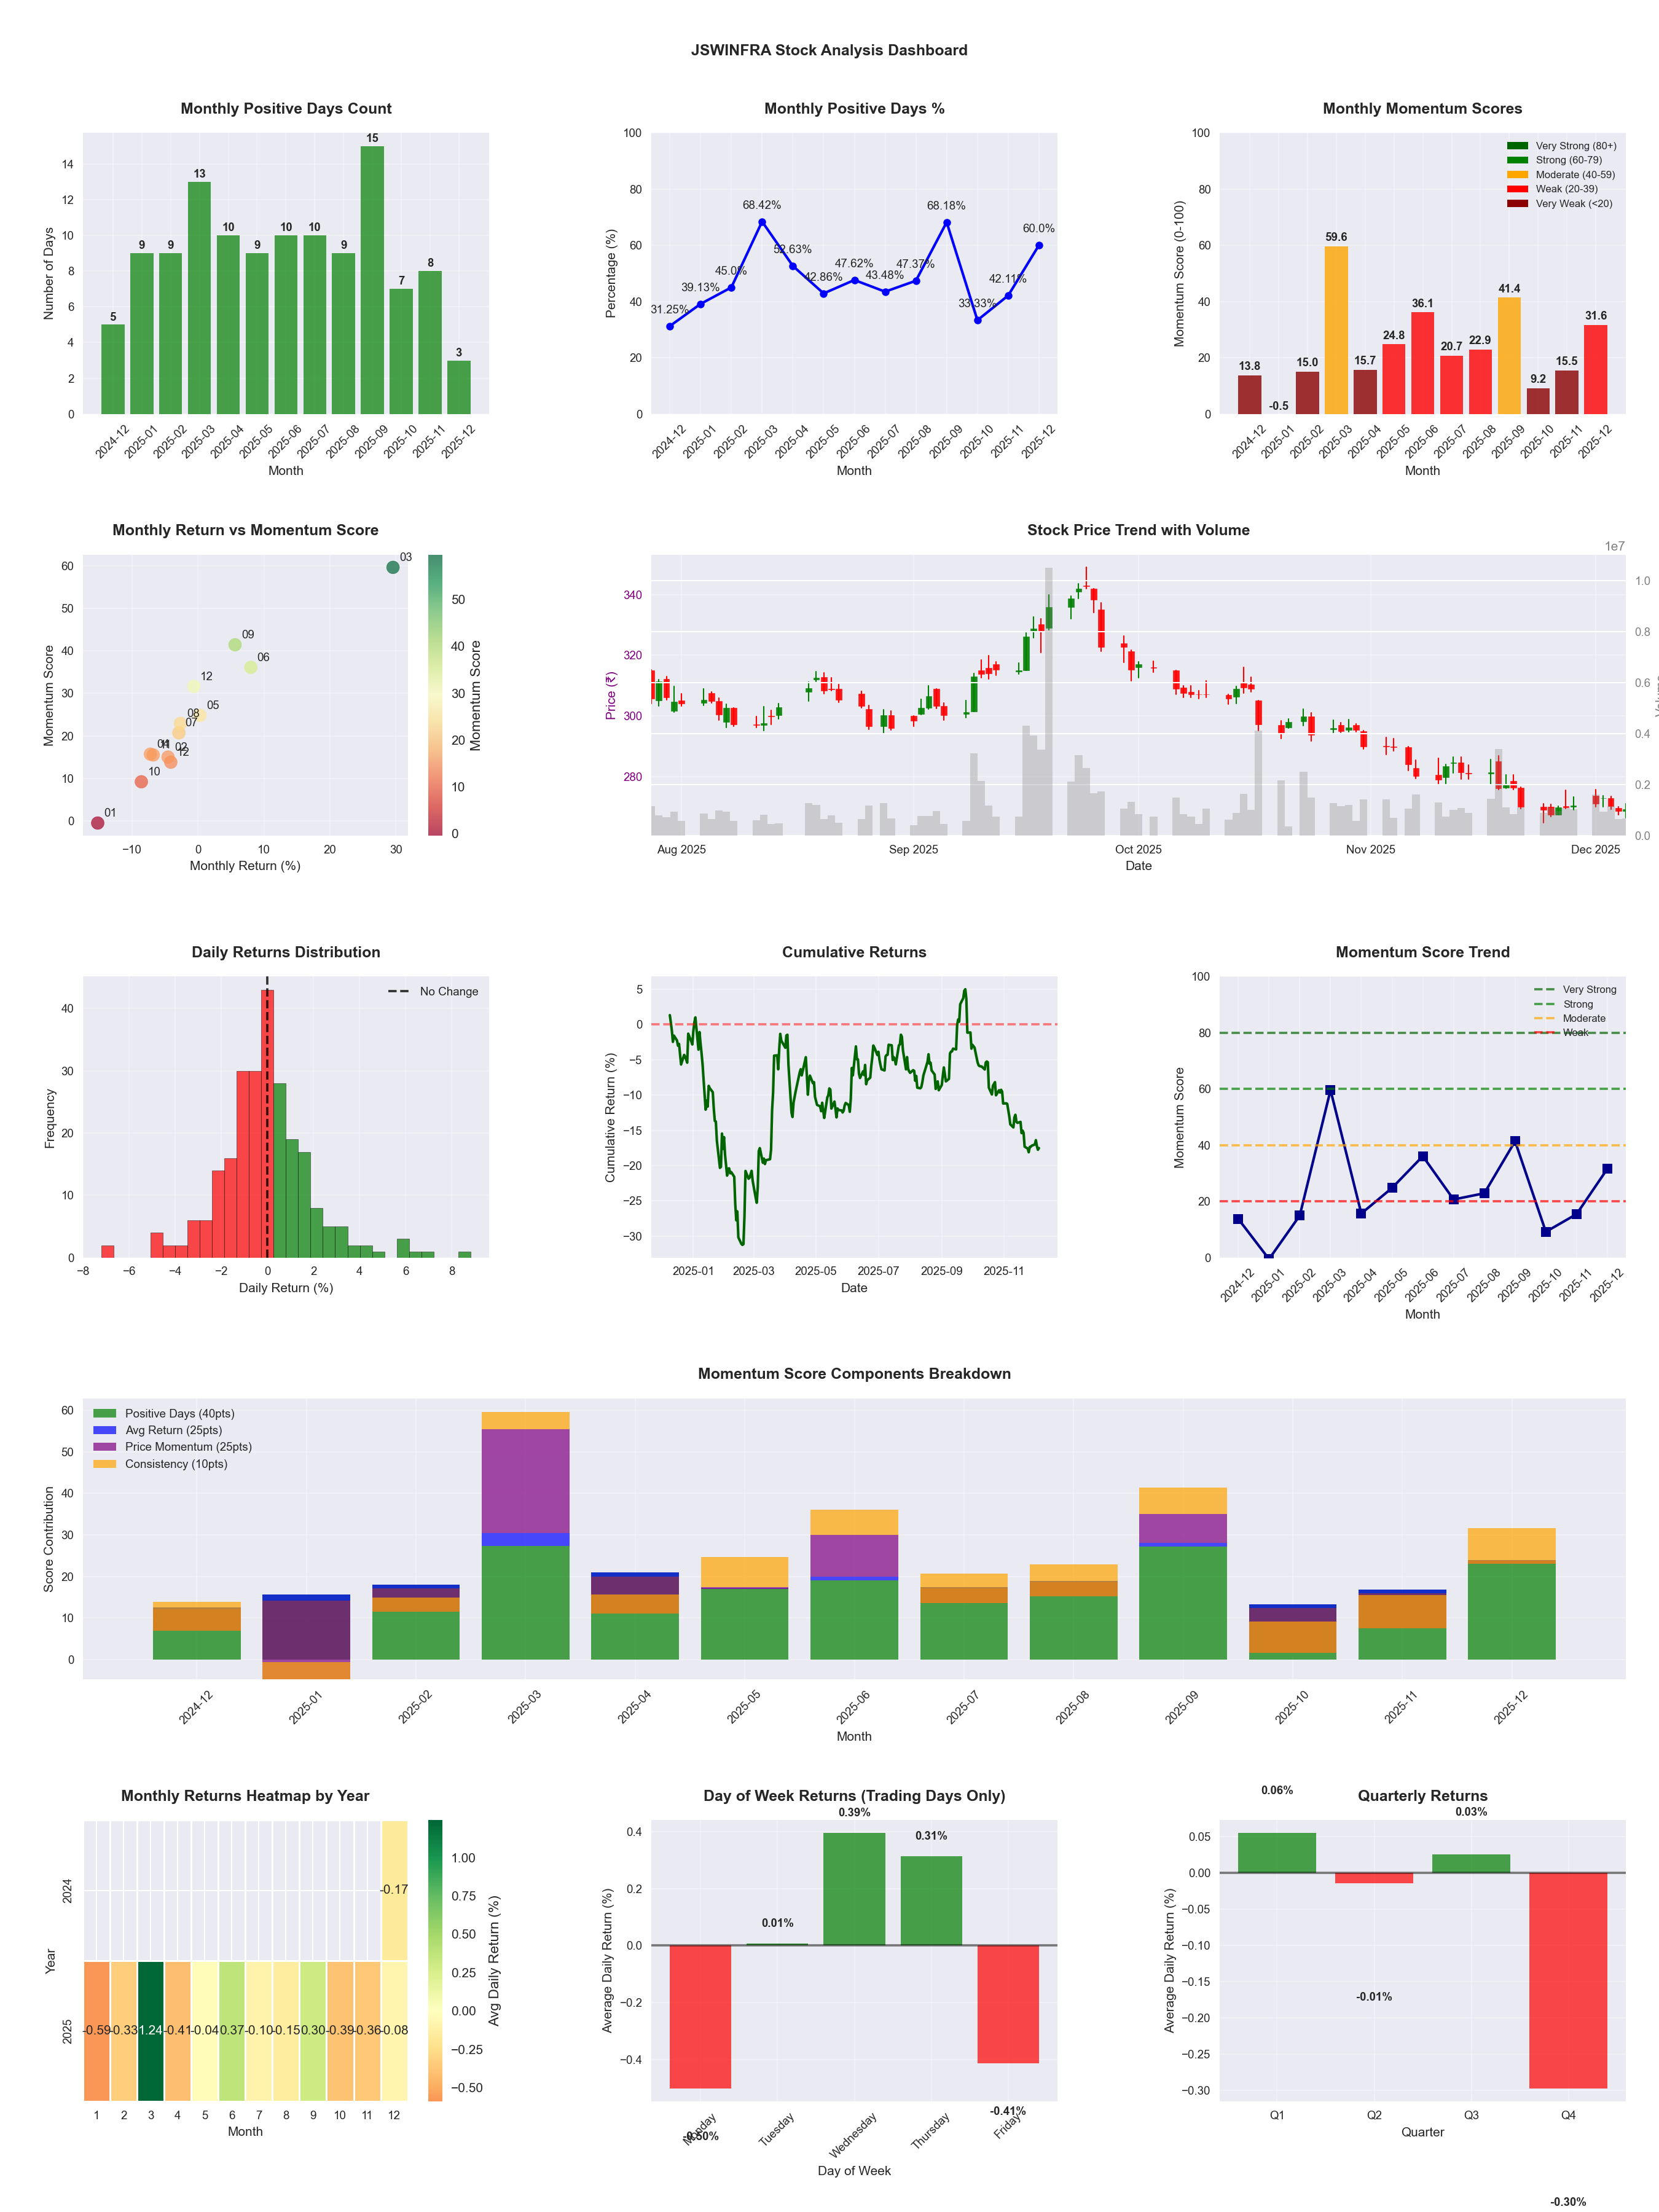
📊 Key Insights & Metrics
Symbol
📈 JSWINFRA
Date
📅 2026-04-11
Volatility
🟡 1.77%
Win Rate
⚠️ 45.3%
Avg Daily Return
📉 -0.03%
Max Drawdown
📉 -31.64%
IBD RS Score
📊 40.4
Weak
Market Rank
#294
Best Month
🏆 2025-09
Worst Month
📉 2026-01
Best Months to Trade
📅 Apr, Jun, Sep
Best Days to Trade
📅 Tuesday, Wednesday
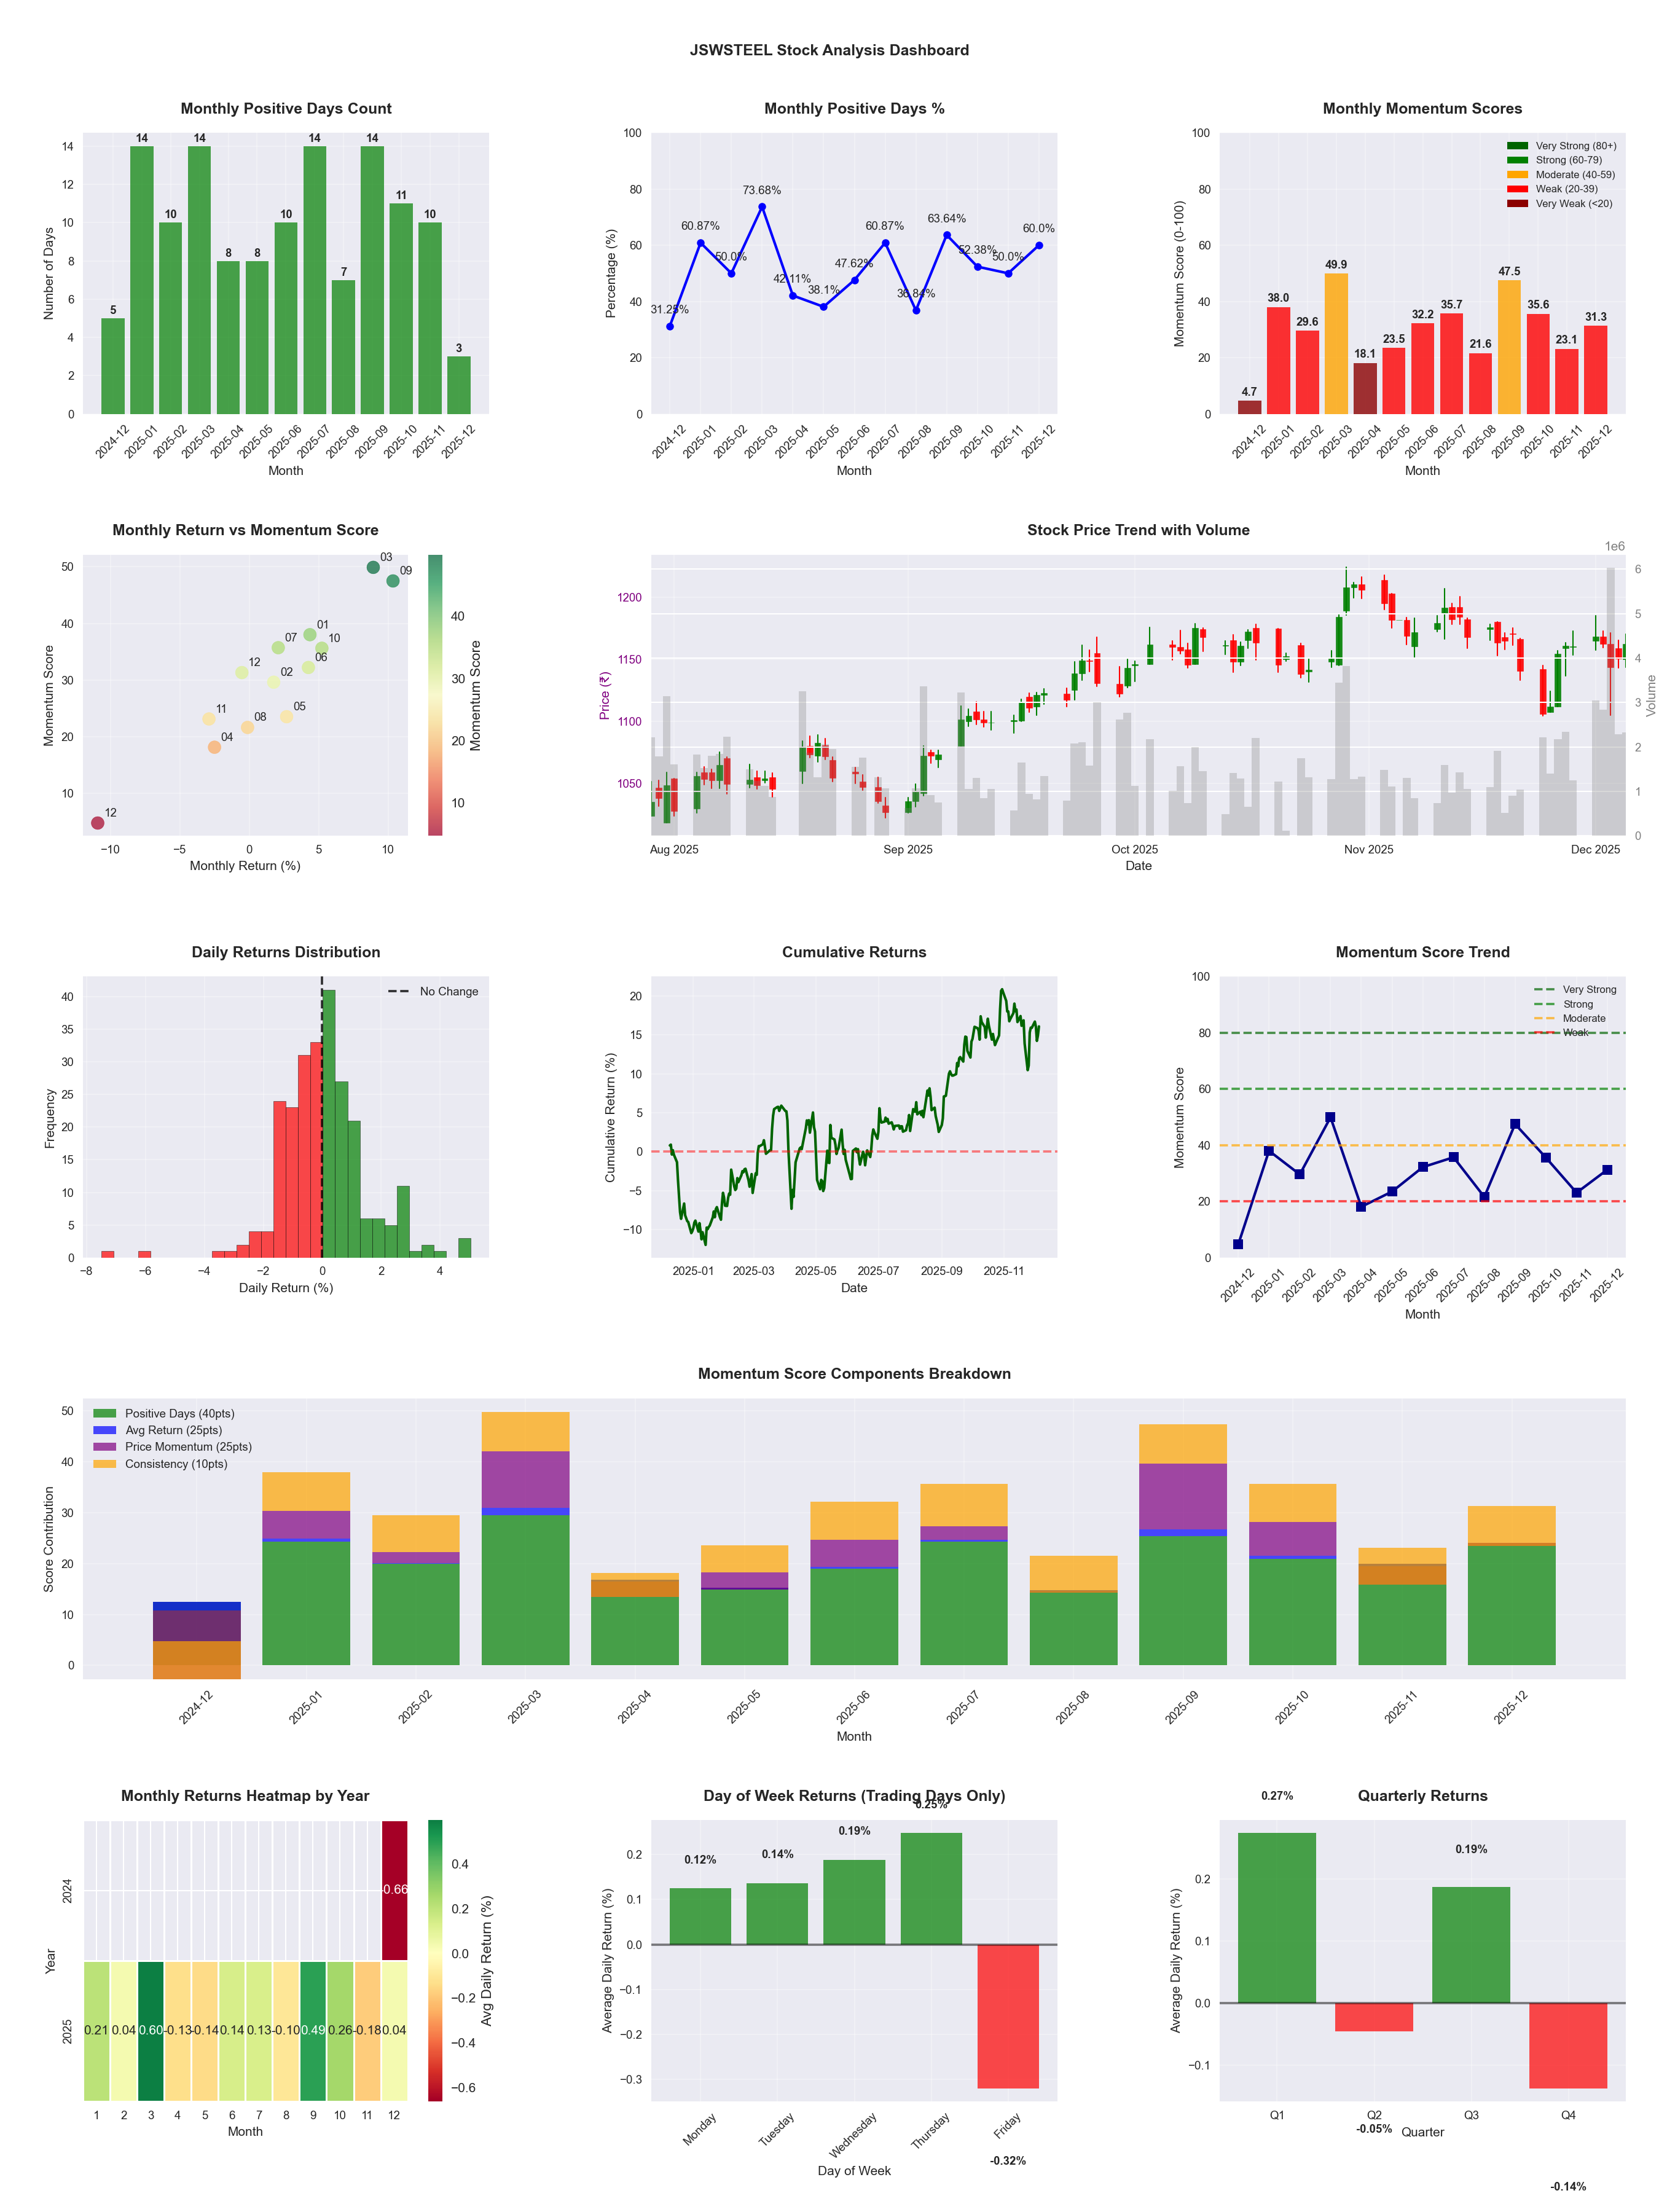
📊 Key Insights & Metrics
Symbol
📈 JSWSTEEL
Date
📅 2026-04-11
Volatility
🟡 1.60%
Win Rate
⚠️ 52.4%
Avg Daily Return
📈 +0.10%
Max Drawdown
📉 -13.35%
IBD RS Score
📊 77.9
Strong
Market Rank
#109
Best Month
🏆 2026-04
Worst Month
📉 2026-03
Best Months to Trade
📅 Apr, Sep, Oct
Best Days to Trade
📅 Wednesday, Tuesday
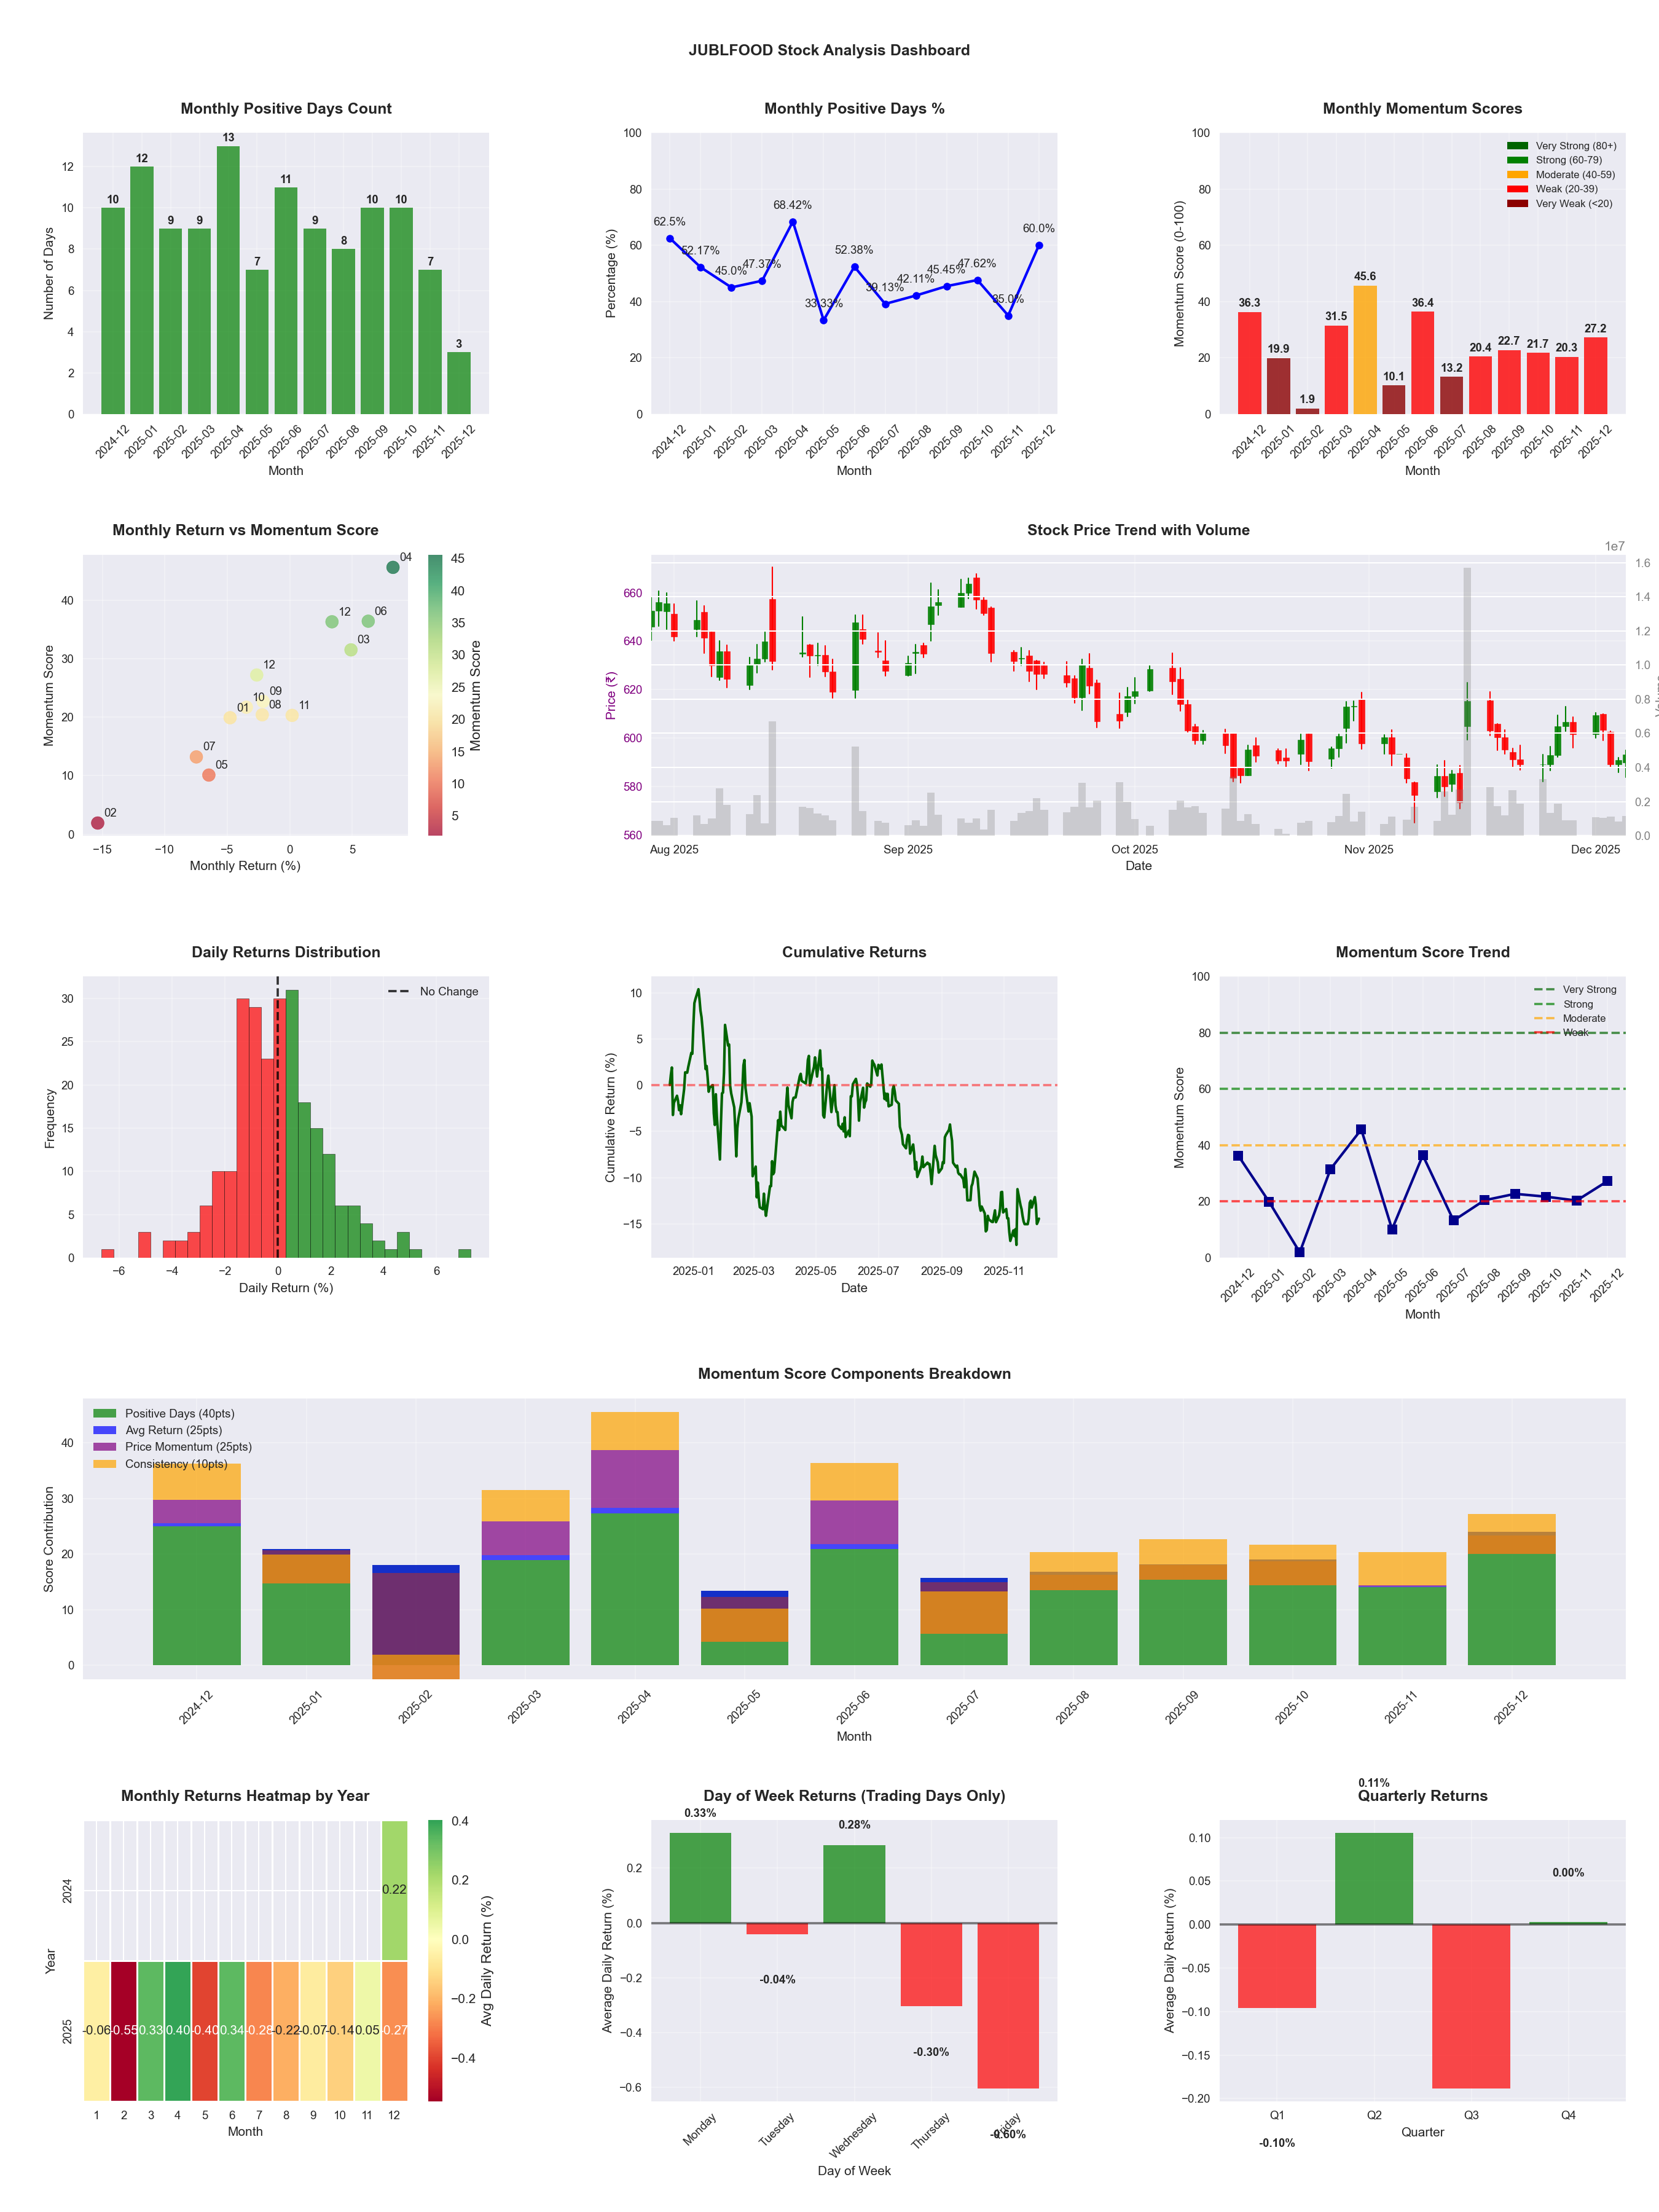
📊 Key Insights & Metrics
Symbol
📈 JUBLFOOD
Date
📅 2026-04-11
Volatility
🟡 1.81%
Win Rate
⚠️ 43.1%
Avg Daily Return
📉 -0.16%
Max Drawdown
📉 -42.57%
IBD RS Score
📊 6.7
Weak
Market Rank
#460
Best Month
🏆 2025-04
Best Months to Trade
📅 Apr, Jun, Feb
Best Days to Trade
📅 Wednesday, Monday
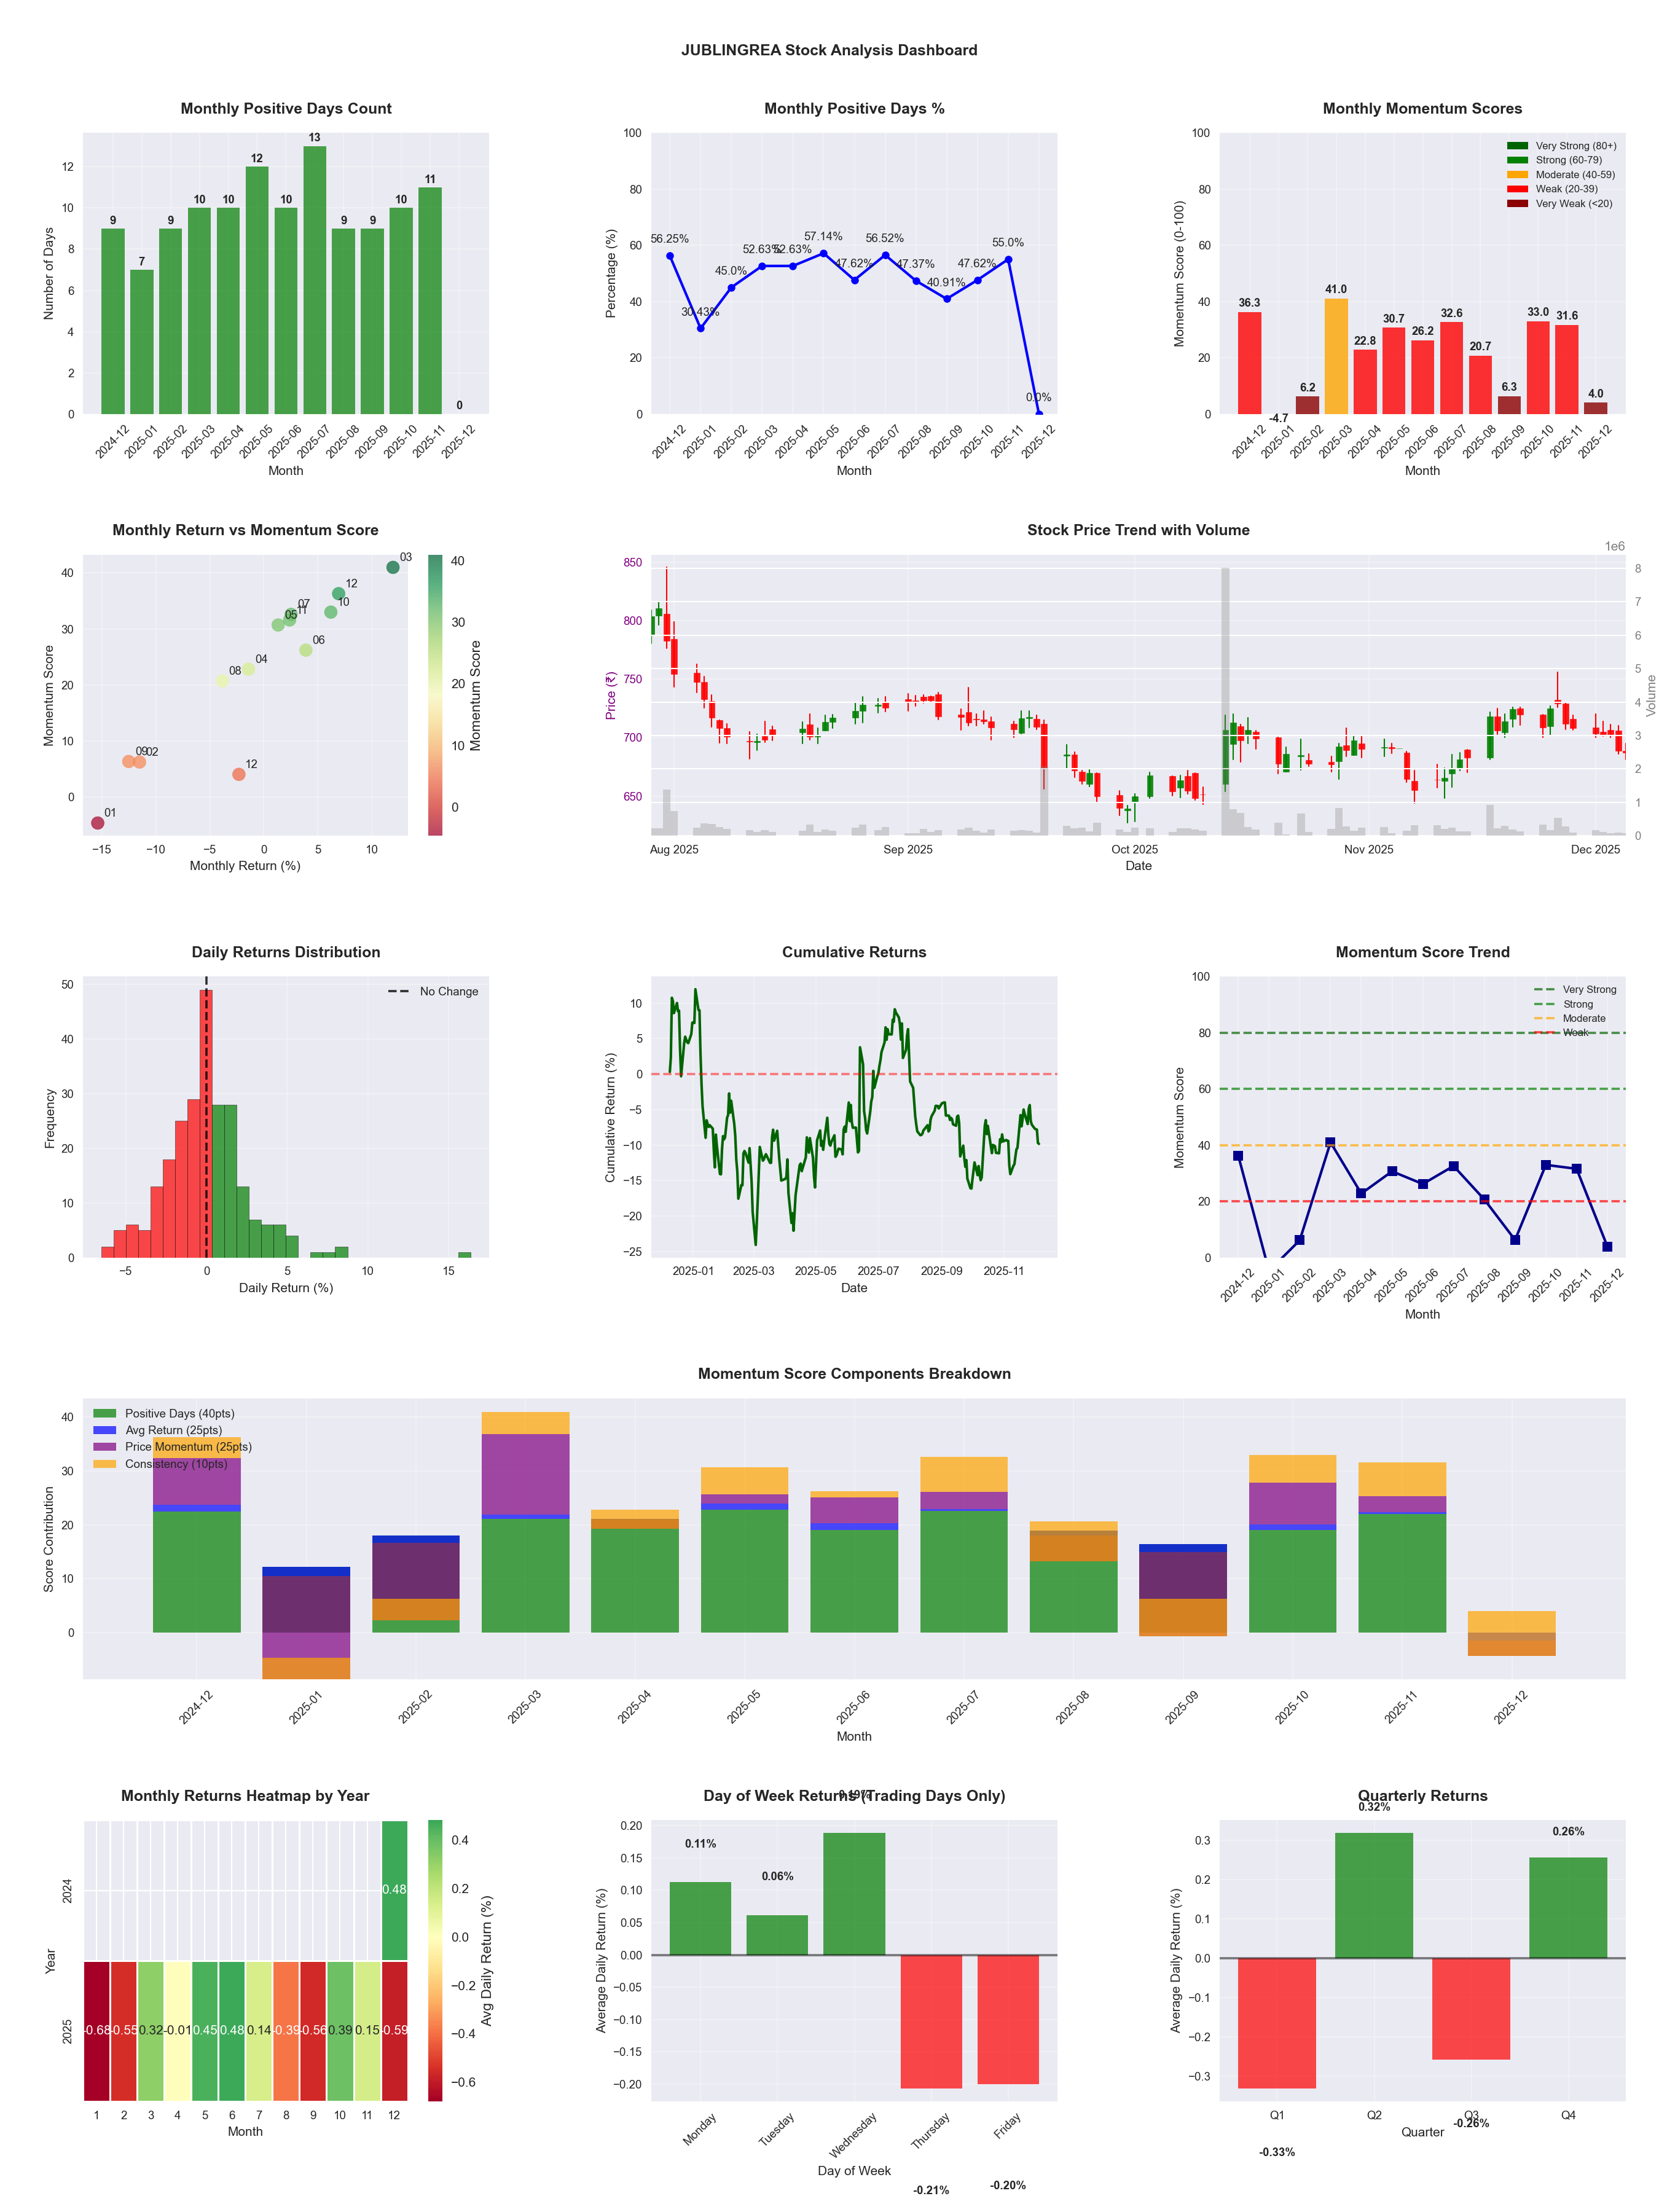
📊 Key Insights & Metrics
Symbol
📈 JUBLINGREA
Date
📅 2026-04-11
Volatility
🟡 2.51%
Risk Profile
⚠️ suitable for aggressive investors
Win Rate
⚠️ 48.4%
Avg Daily Return
📈 +0.04%
Max Drawdown
📉 -34.69%
IBD RS Score
📊 44.2
Weak
Market Rank
#275
Best Month
🏆 2026-04
Worst Month
📉 2025-09
Best Months to Trade
📅 Apr, Jun, May
Best Days to Trade
📅 Tuesday, Monday
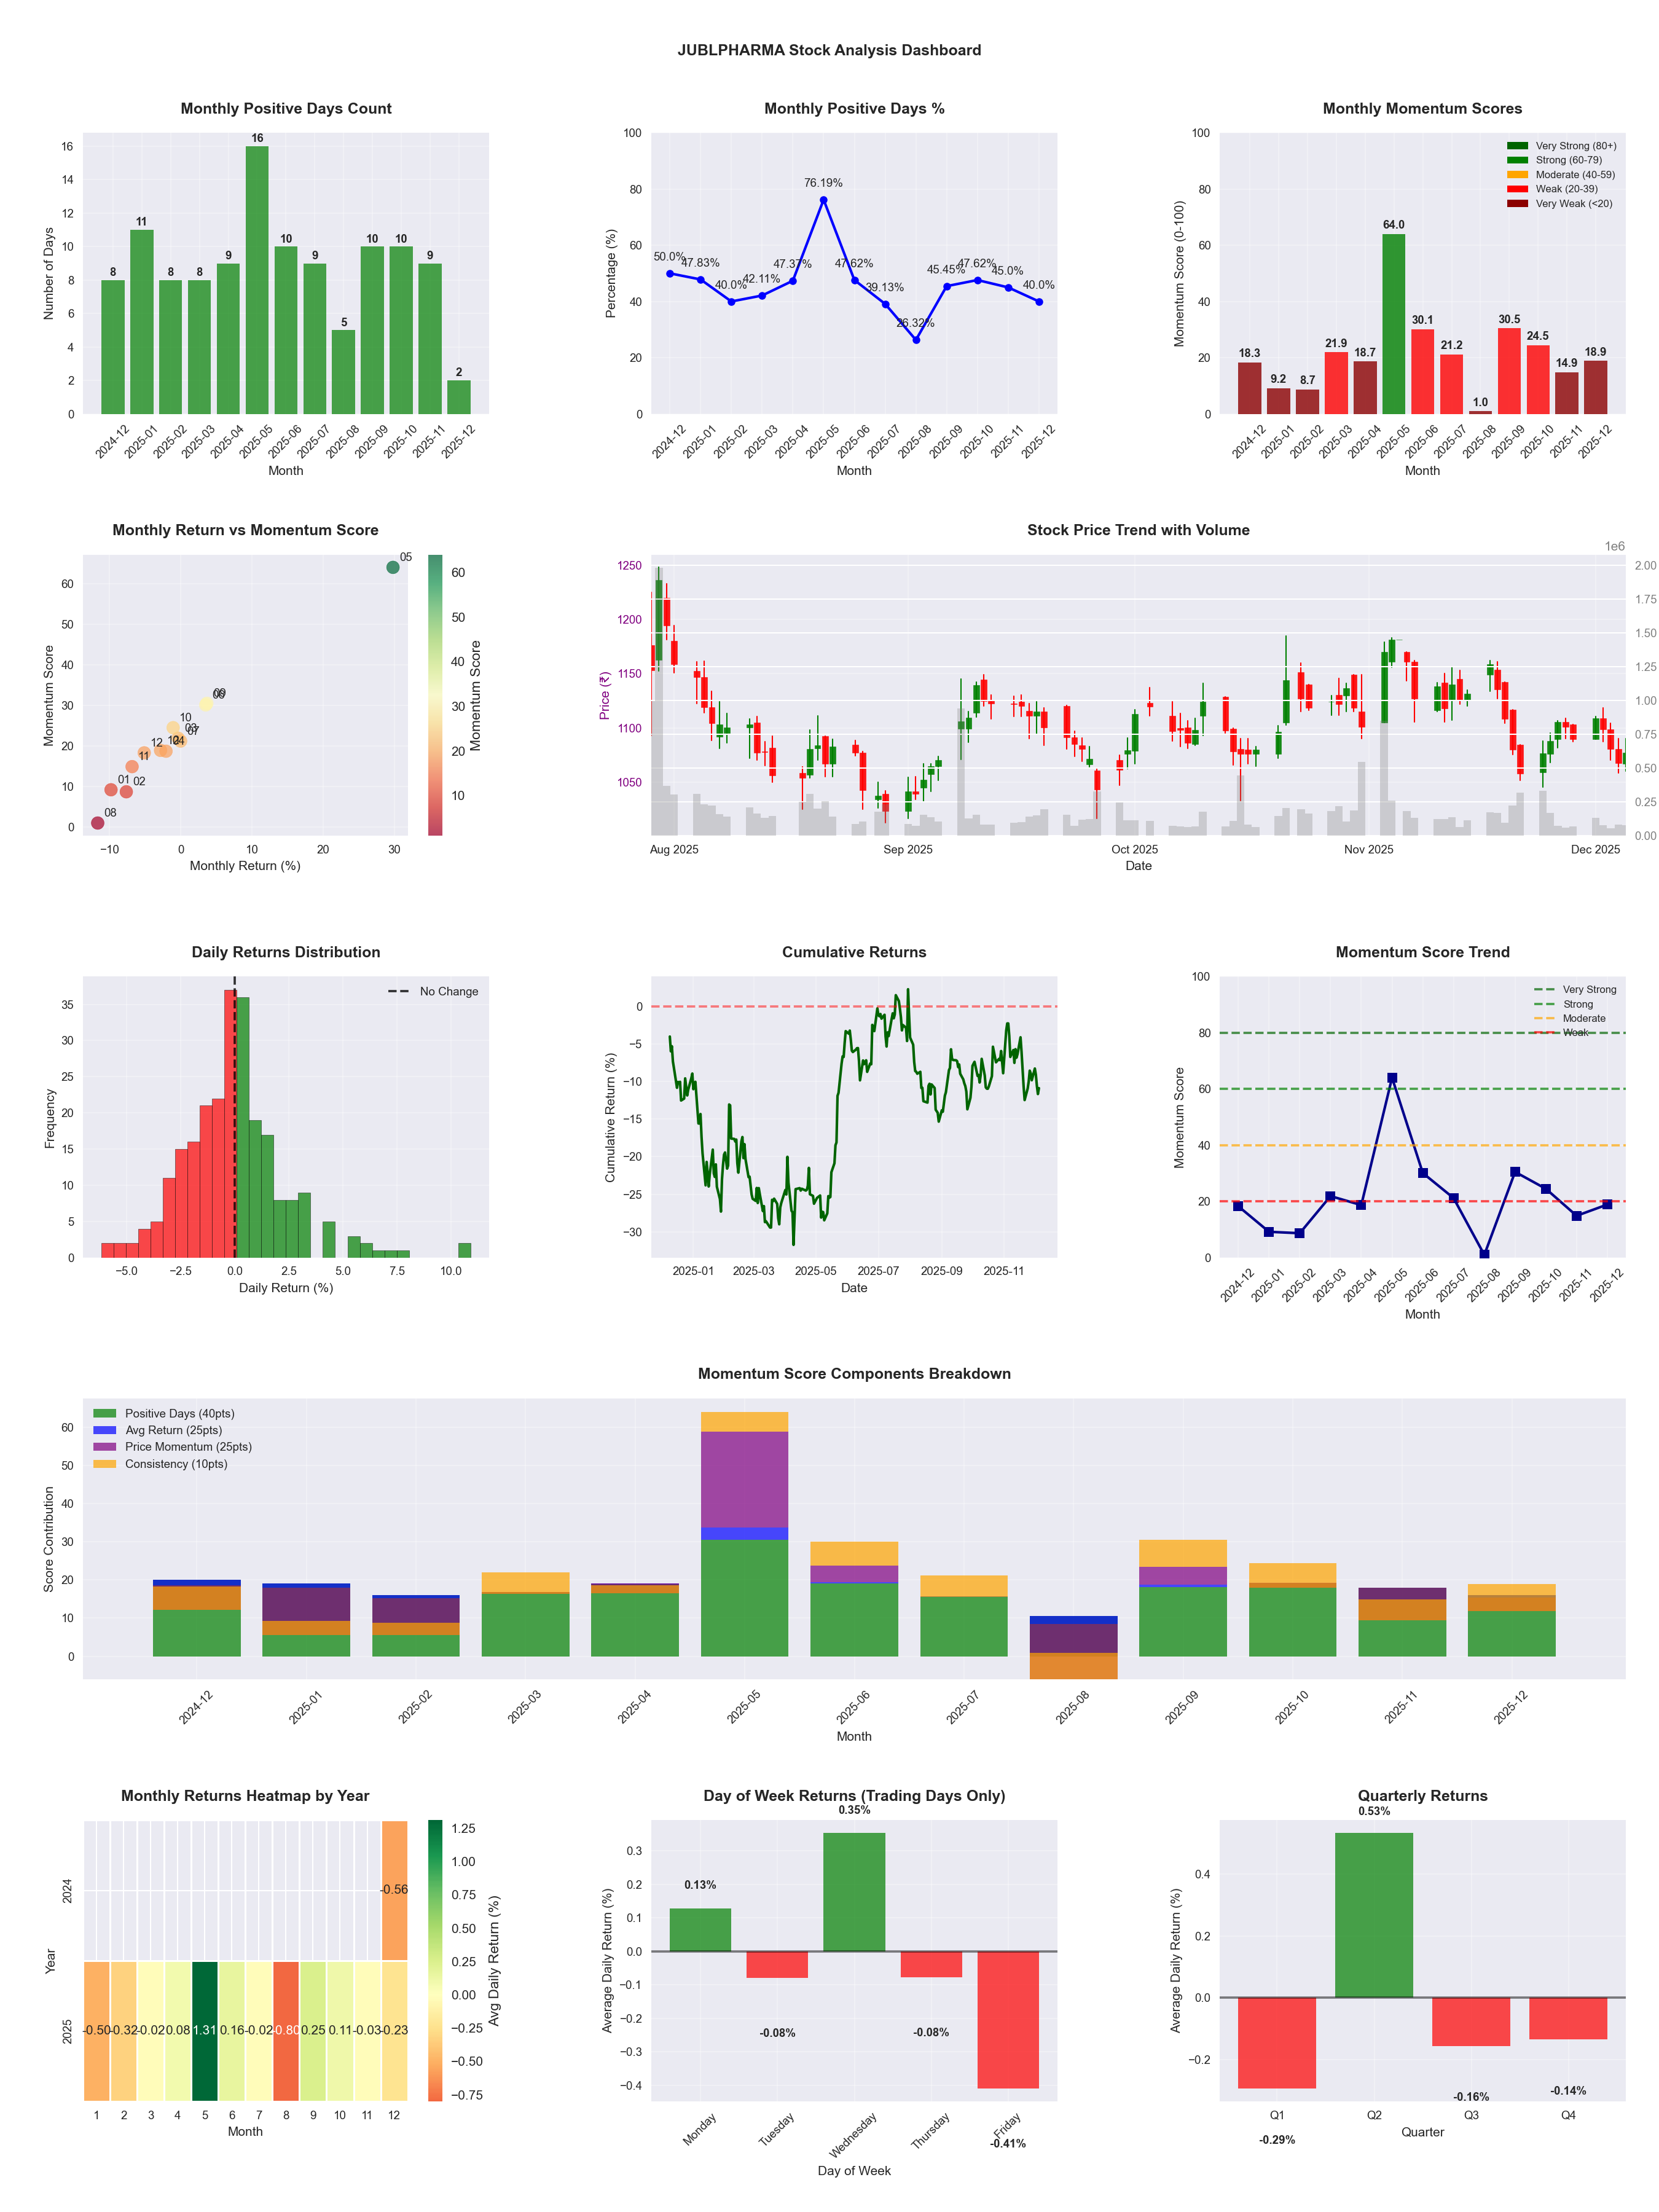
📊 Key Insights & Metrics
Symbol
📈 JUBLPHARMA
Date
📅 2026-04-11
Volatility
🟡 1.99%
Win Rate
⚠️ 45.5%
Avg Daily Return
📈 +0.01%
Max Drawdown
📉 -34.67%
IBD RS Score
📊 22.9
Weak
Market Rank
#380
Best Month
🏆 2025-05
Worst Month
📉 2025-08
Best Months to Trade
📅 May, Apr, Sep
Best Days to Trade
📅 Wednesday, Monday
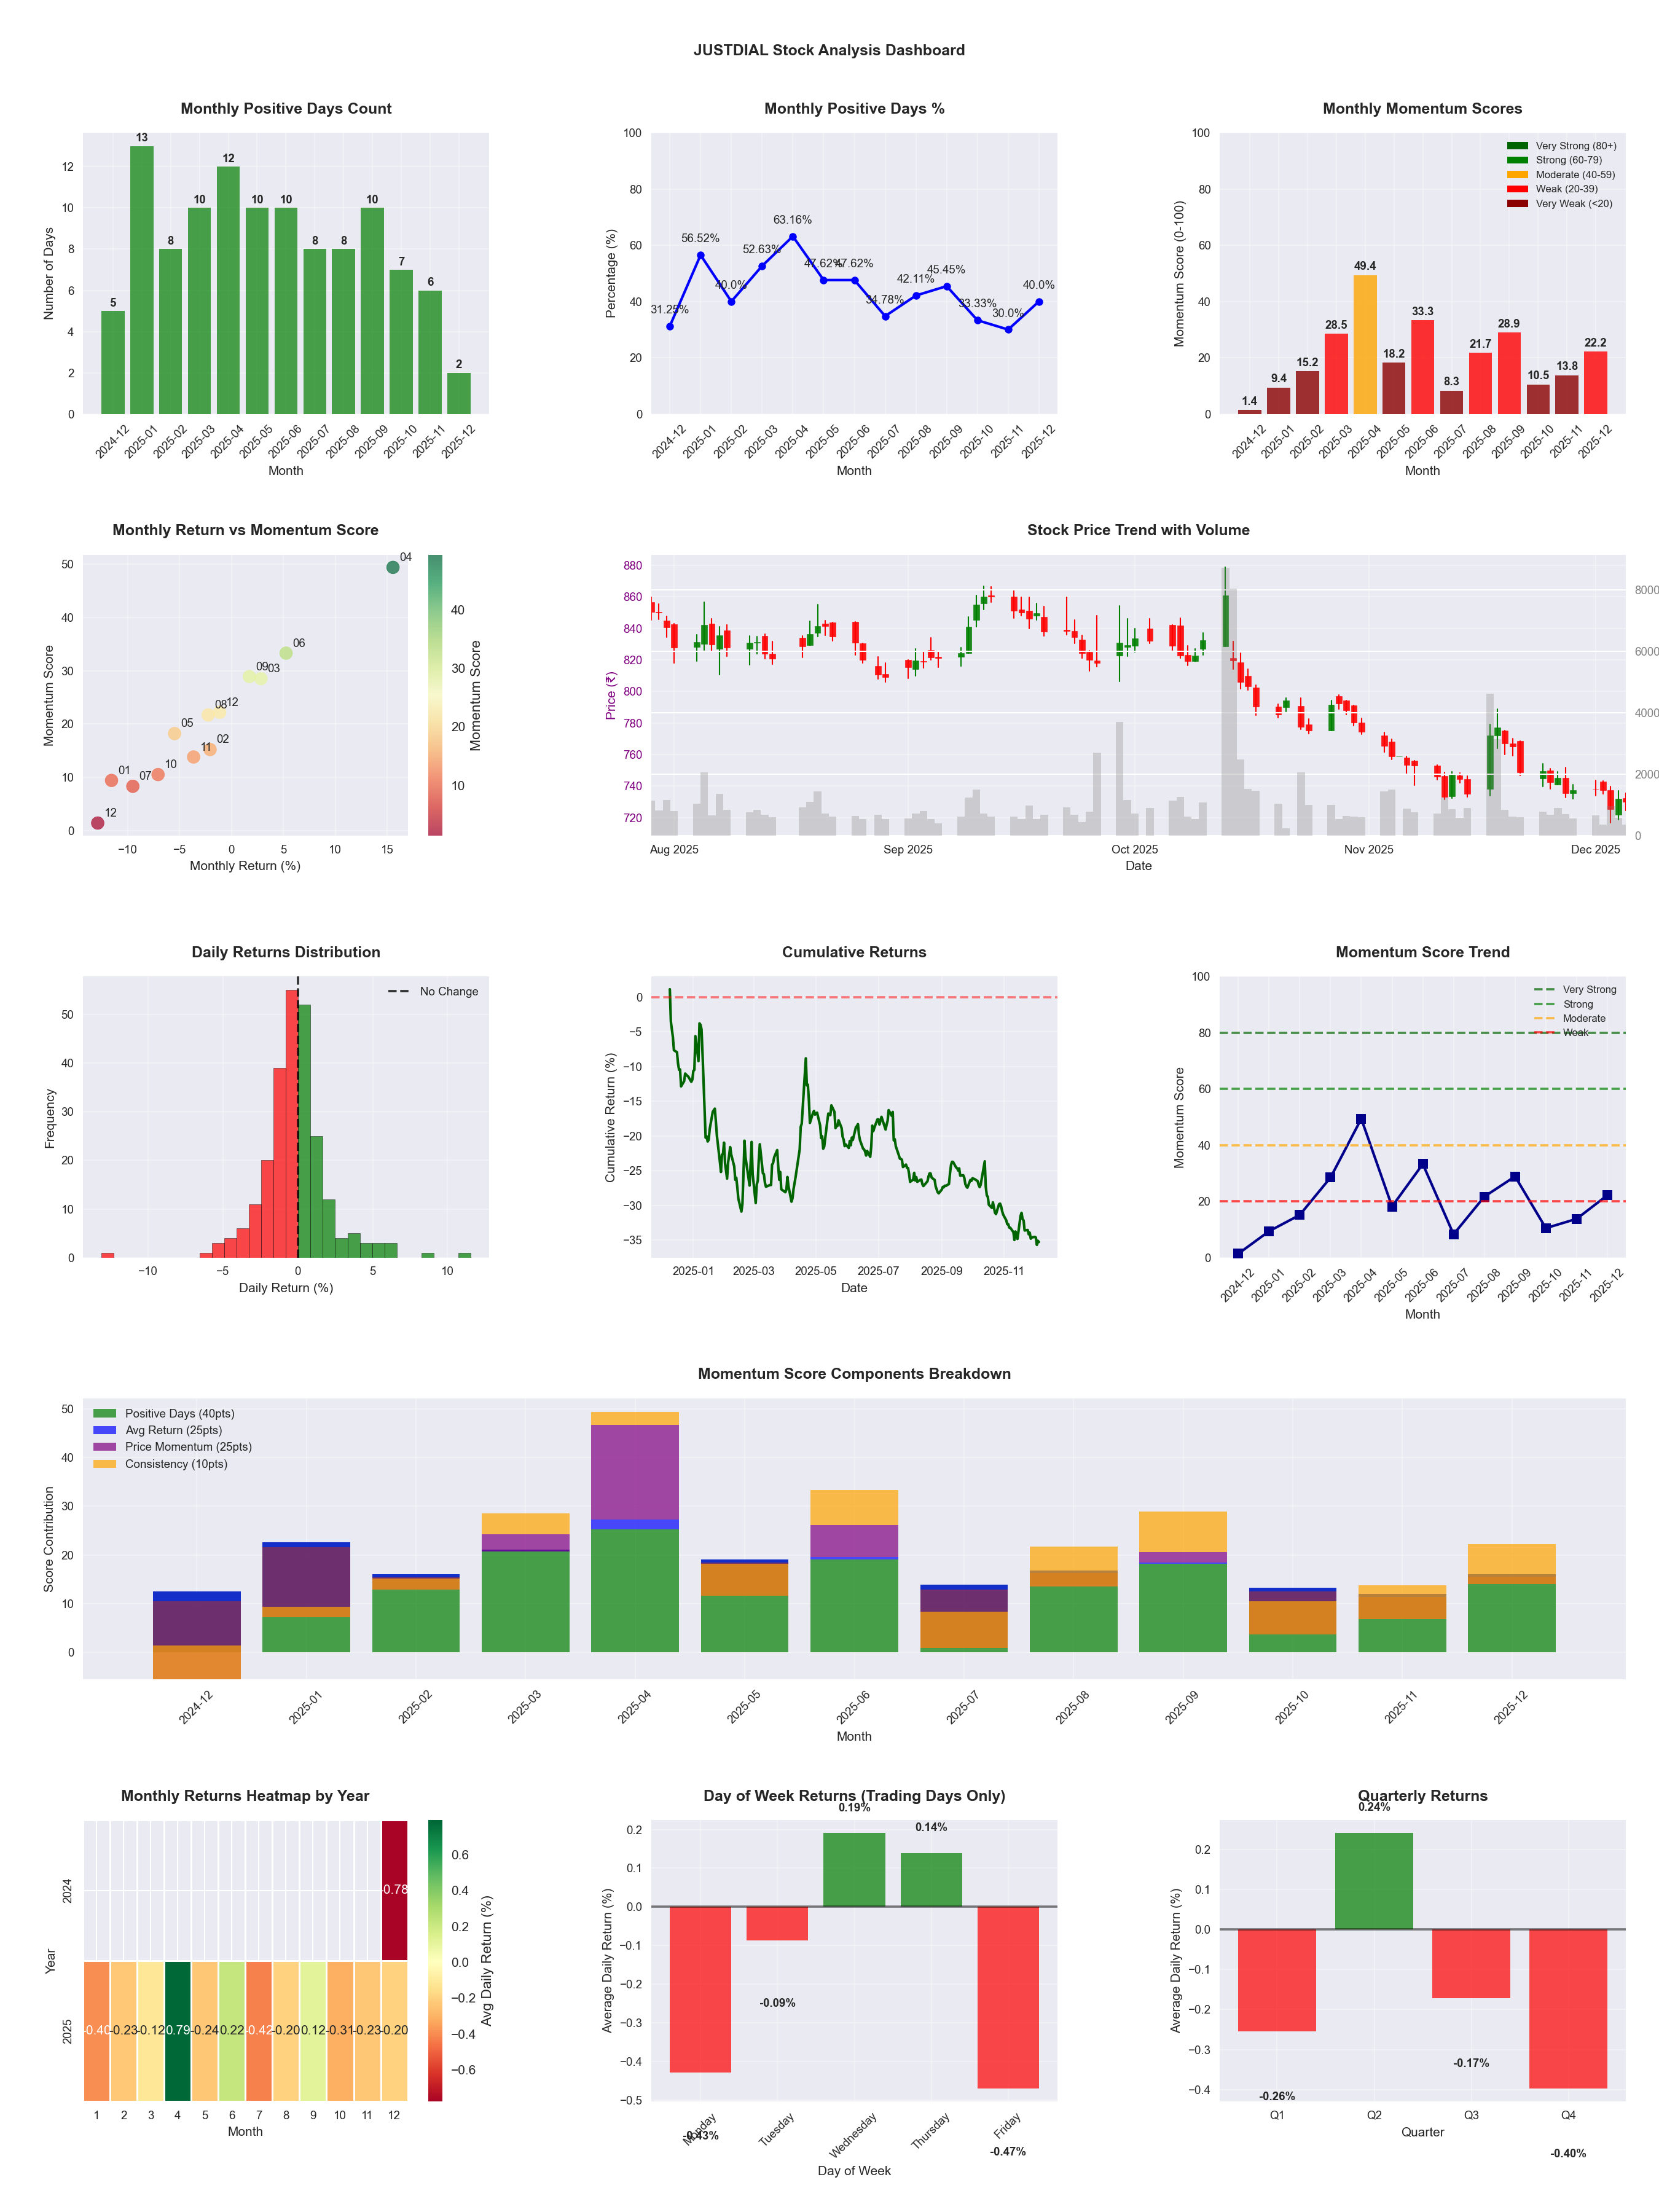
📊 Key Insights & Metrics
Symbol
📈 JUSTDIAL
Date
📅 2026-03-21
Volatility
🟡 1.85%
Win Rate
❌ 39.7%
Avg Daily Return
📉 -0.19%
Max Drawdown
📉 -50.16%
Best Month
🏆 2025-04
Best Months to Trade
📅 Apr, Jun, Sep
Best Days to Trade
📅 Monday, Wednesday
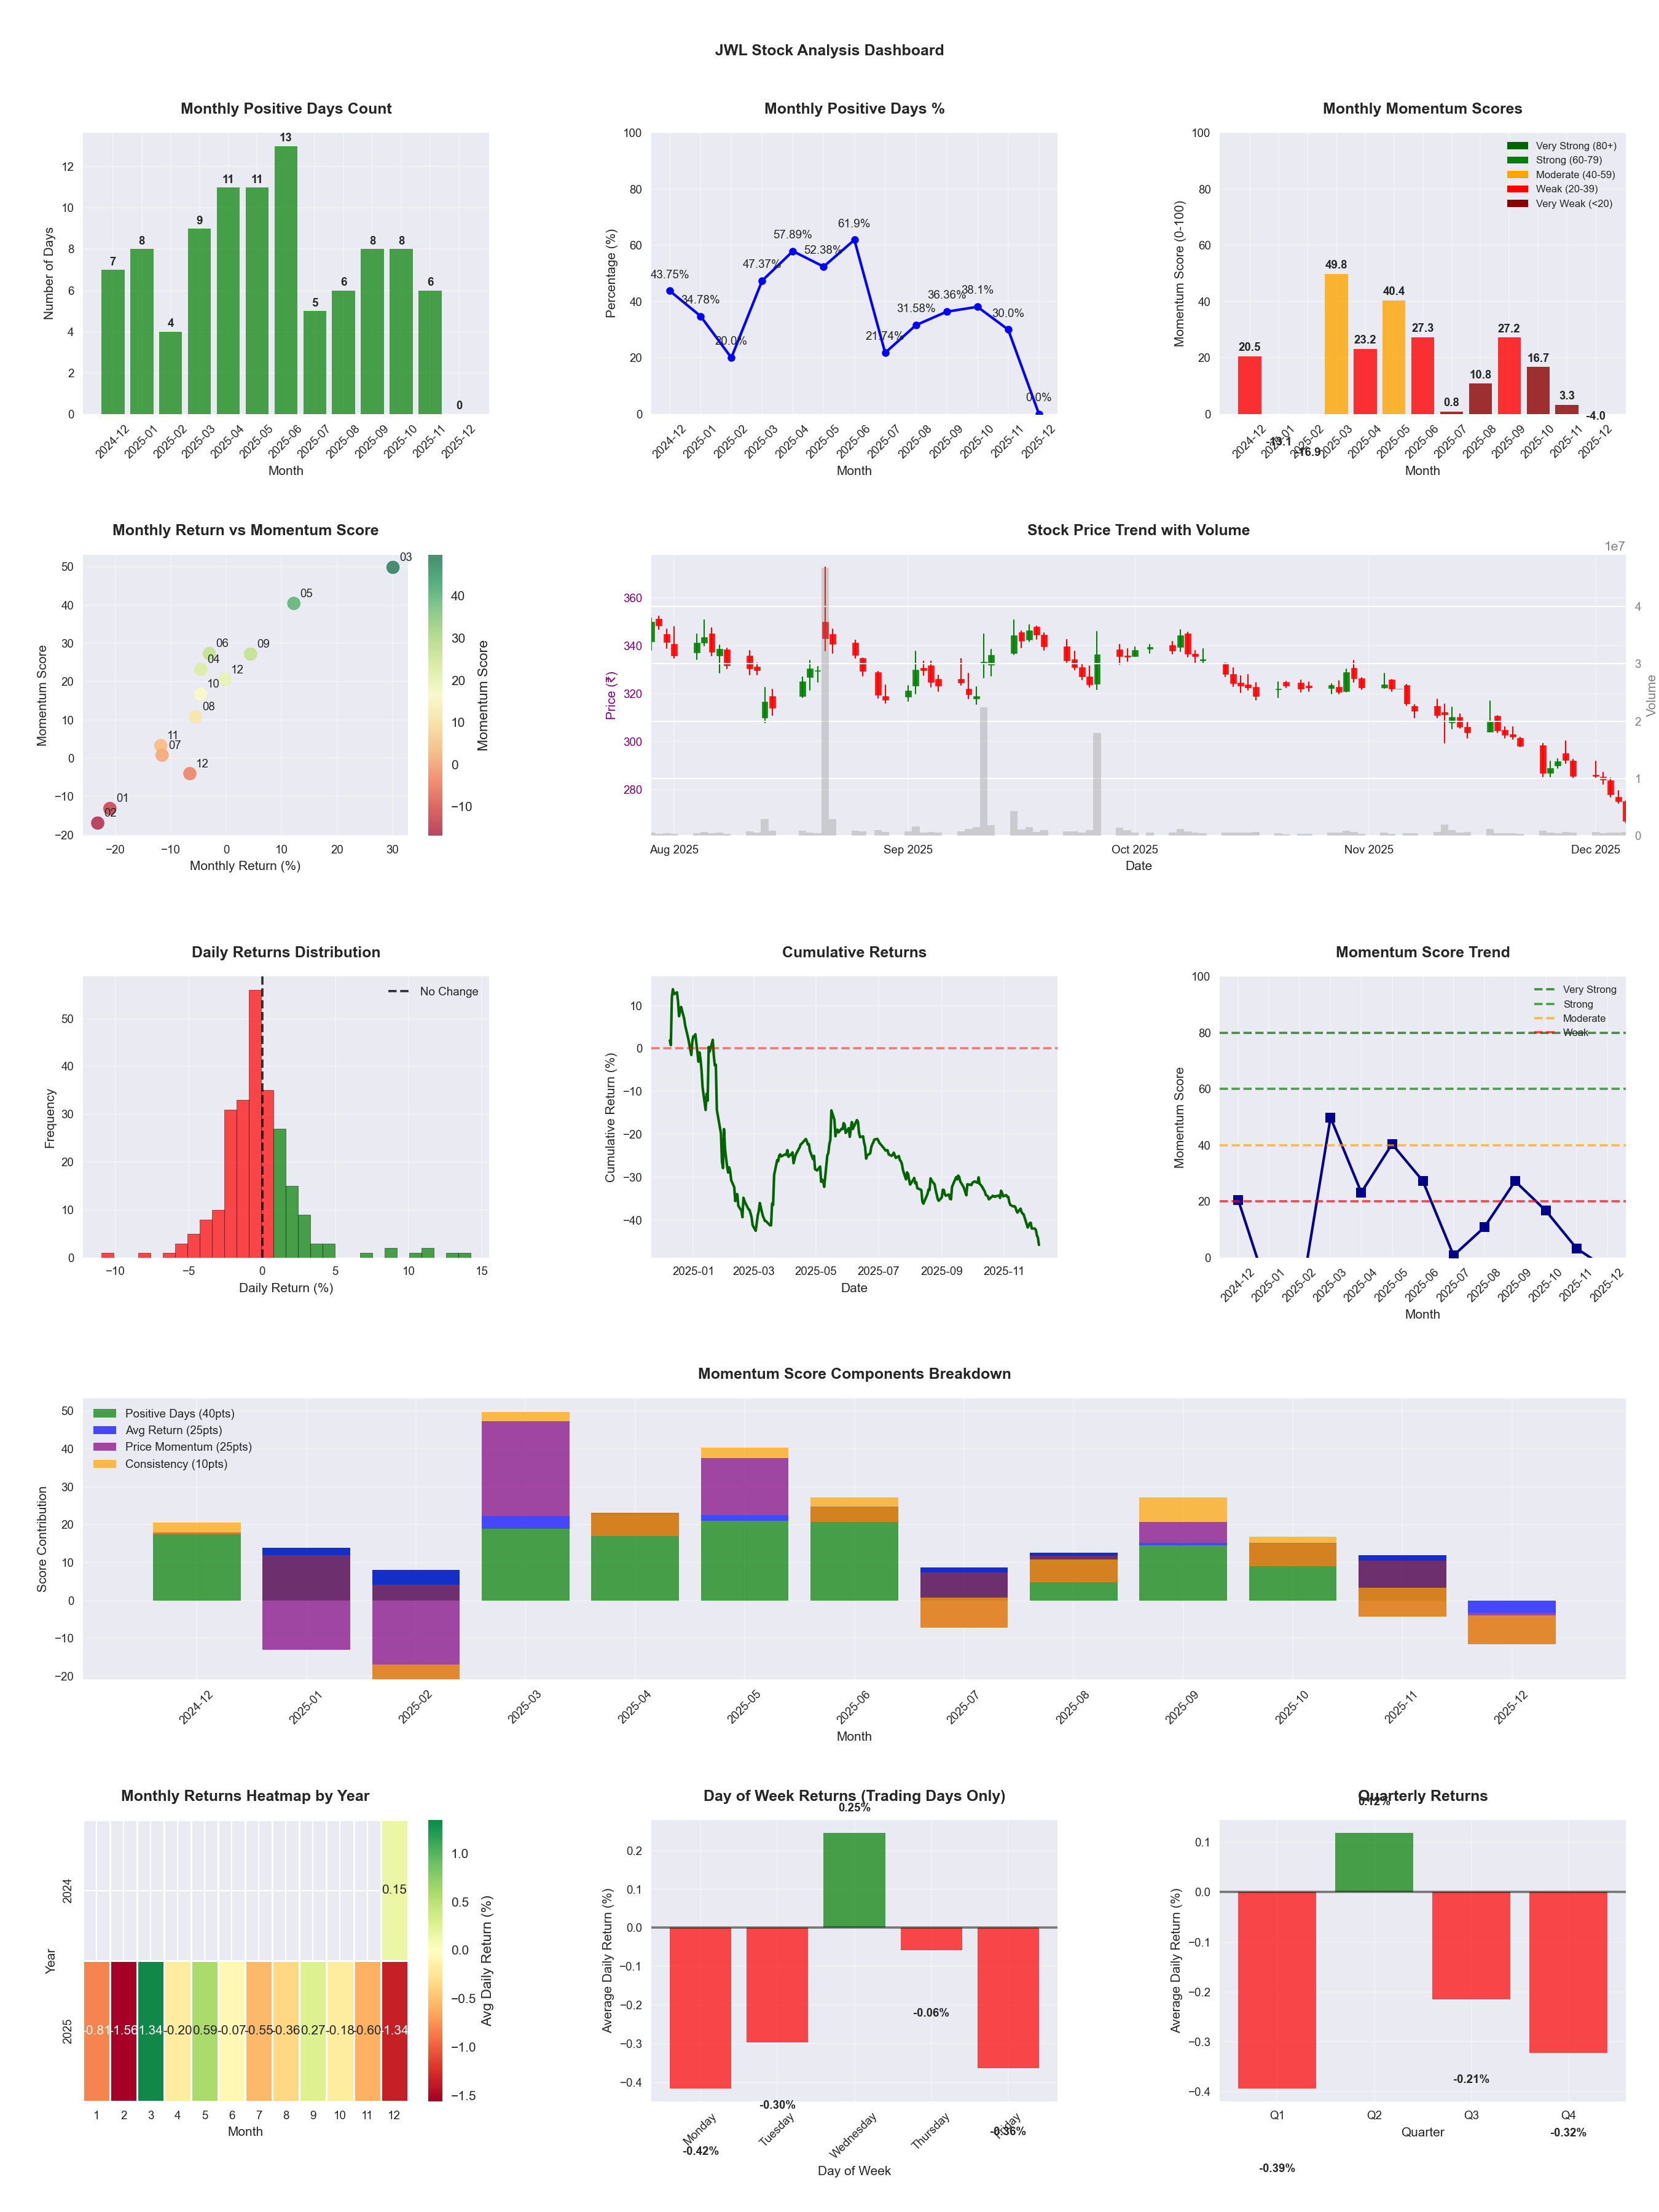
📊 Key Insights & Metrics
Symbol
📈 JWL
Date
📅 2026-04-11
Volatility
🟡 2.88%
Risk Profile
⚠️ suitable for aggressive investors
Win Rate
⚠️ 40.2%
Avg Daily Return
📉 -0.09%
Max Drawdown
📉 -43.45%
IBD RS Score
📊 17.0
Weak
Market Rank
#409
Best Month
🏆 2025-12
Best Months to Trade
📅 Dec, May, Apr
Best Days to Trade
📅 Wednesday, Monday
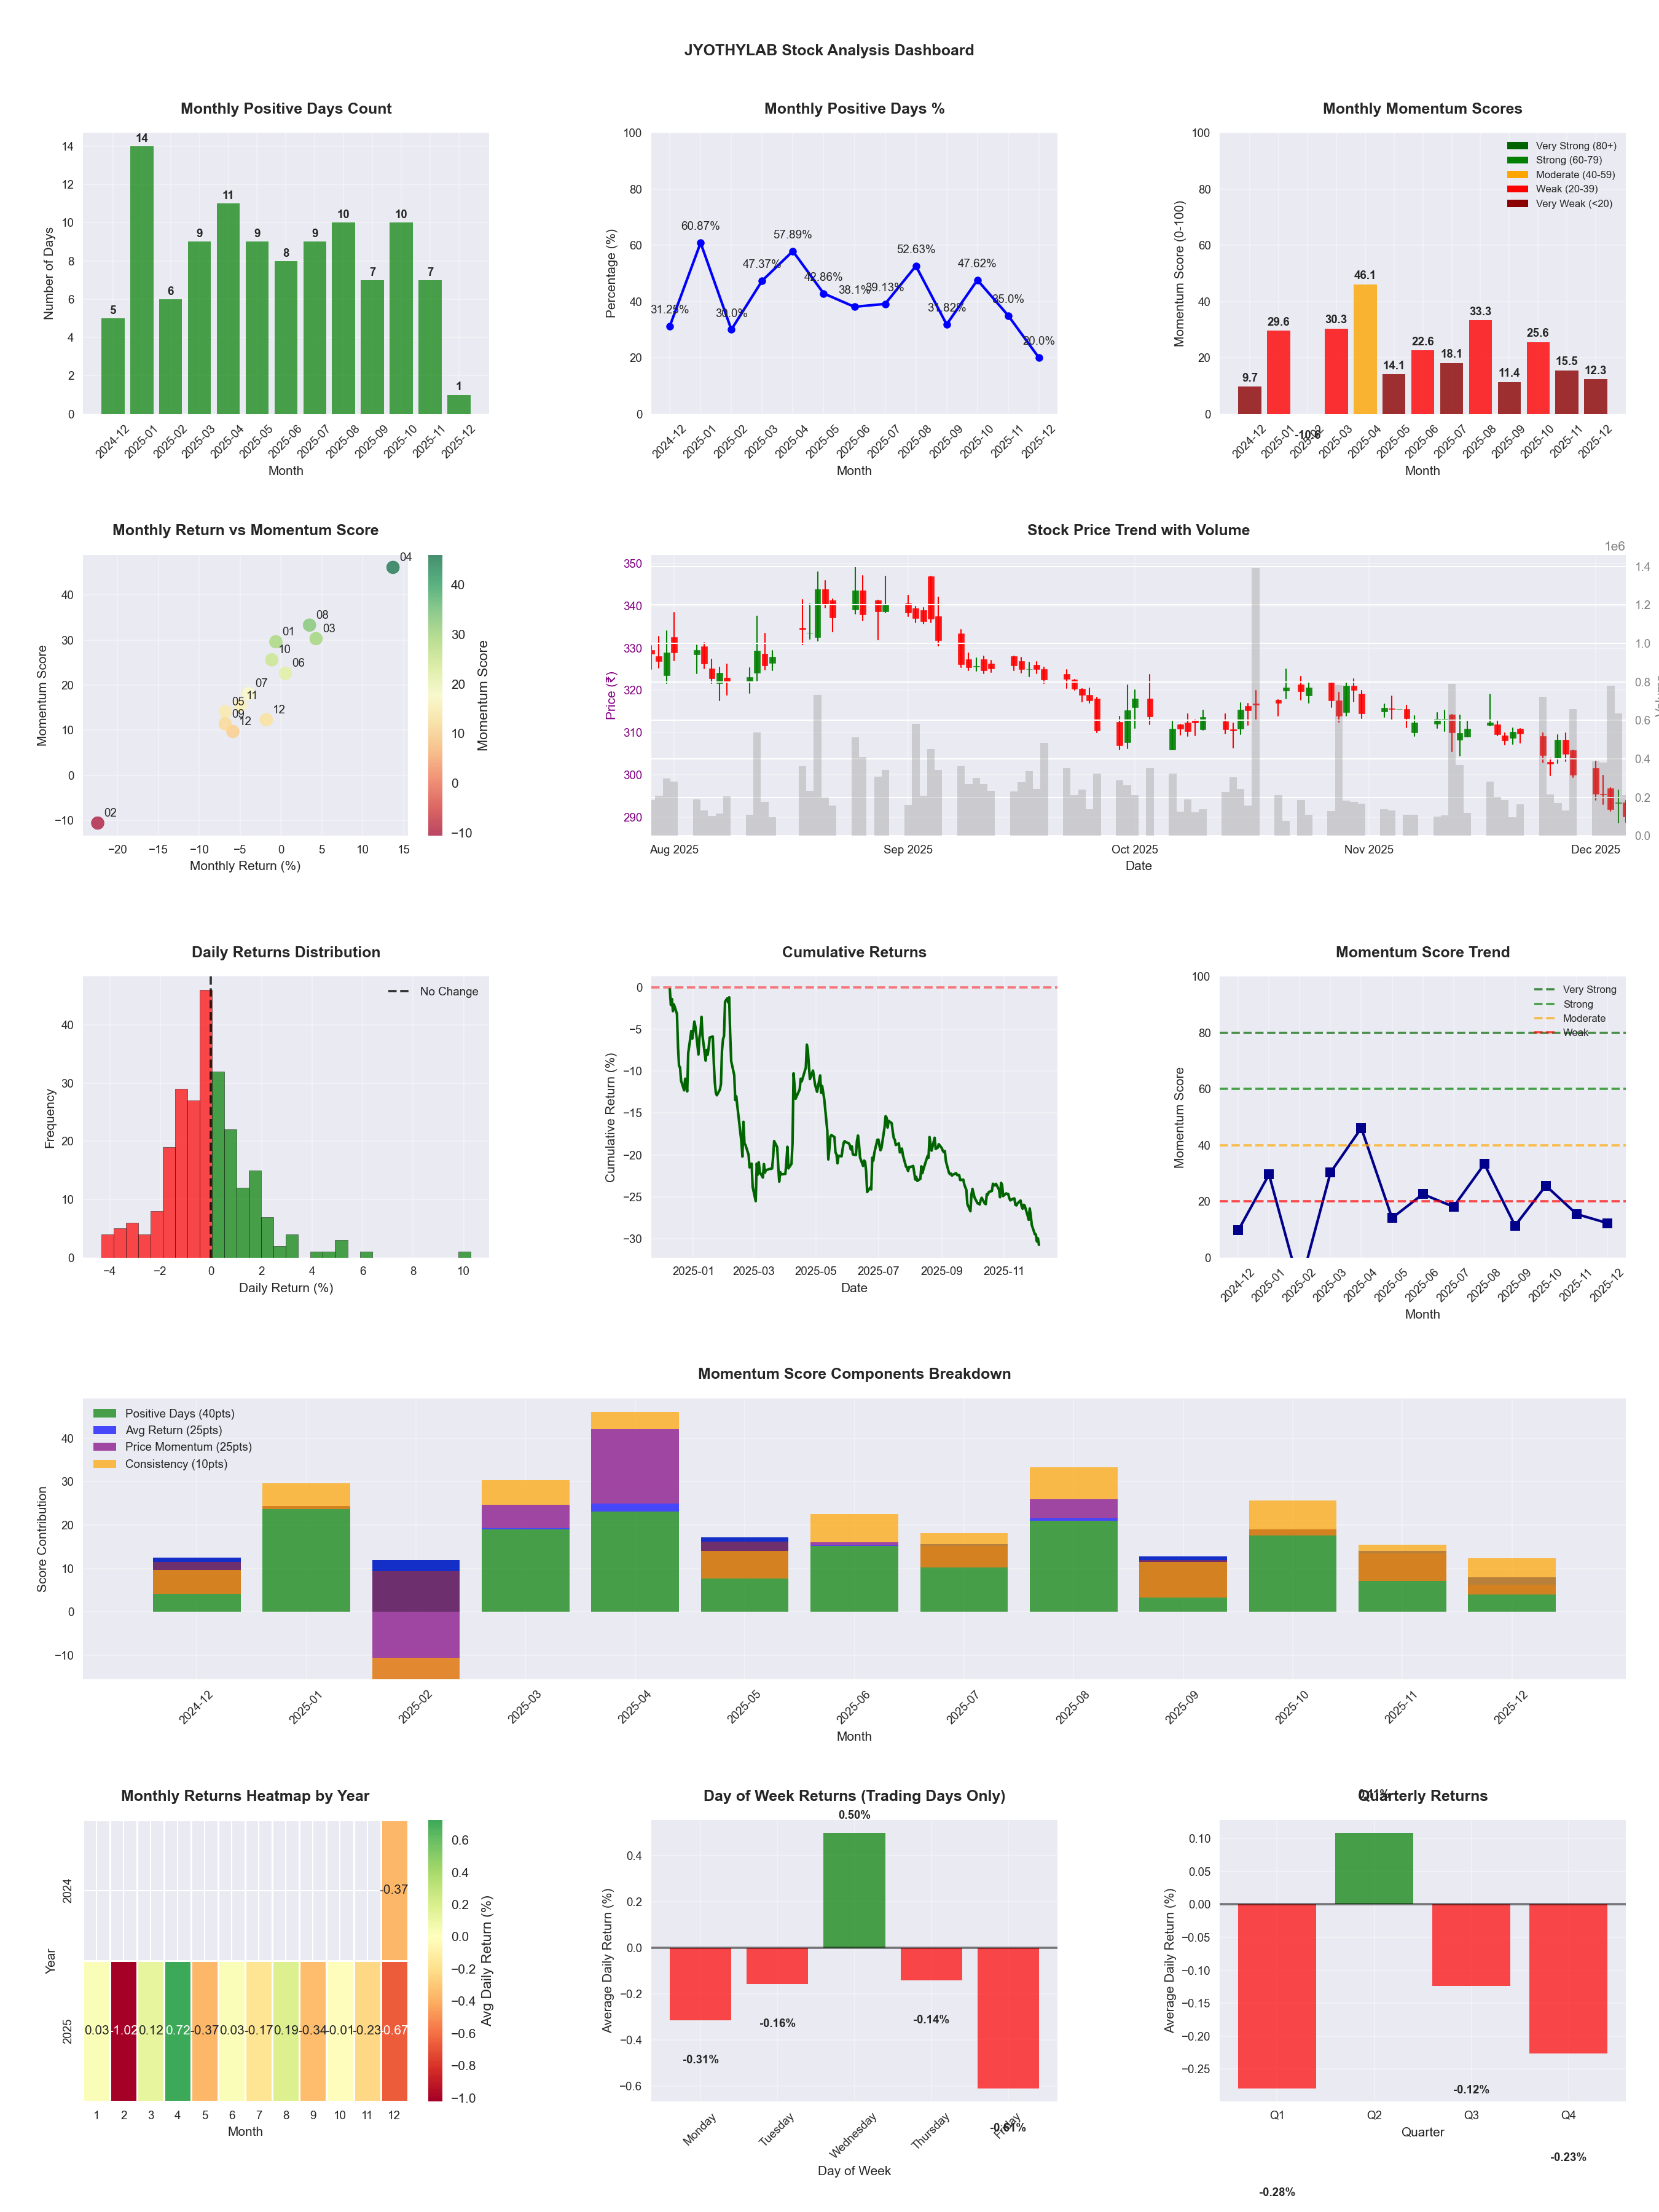
📊 Key Insights & Metrics
Symbol
📈 JYOTHYLAB
Date
📅 2026-04-11
Volatility
🟡 1.55%
Win Rate
⚠️ 42.3%
Avg Daily Return
📉 -0.18%
Max Drawdown
📉 -49.42%
IBD RS Score
📊 6.1
Weak
Market Rank
#463
Best Month
🏆 2026-04
Best Months to Trade
📅 Apr, Aug, Feb
Best Days to Trade
📅 Wednesday, Tuesday
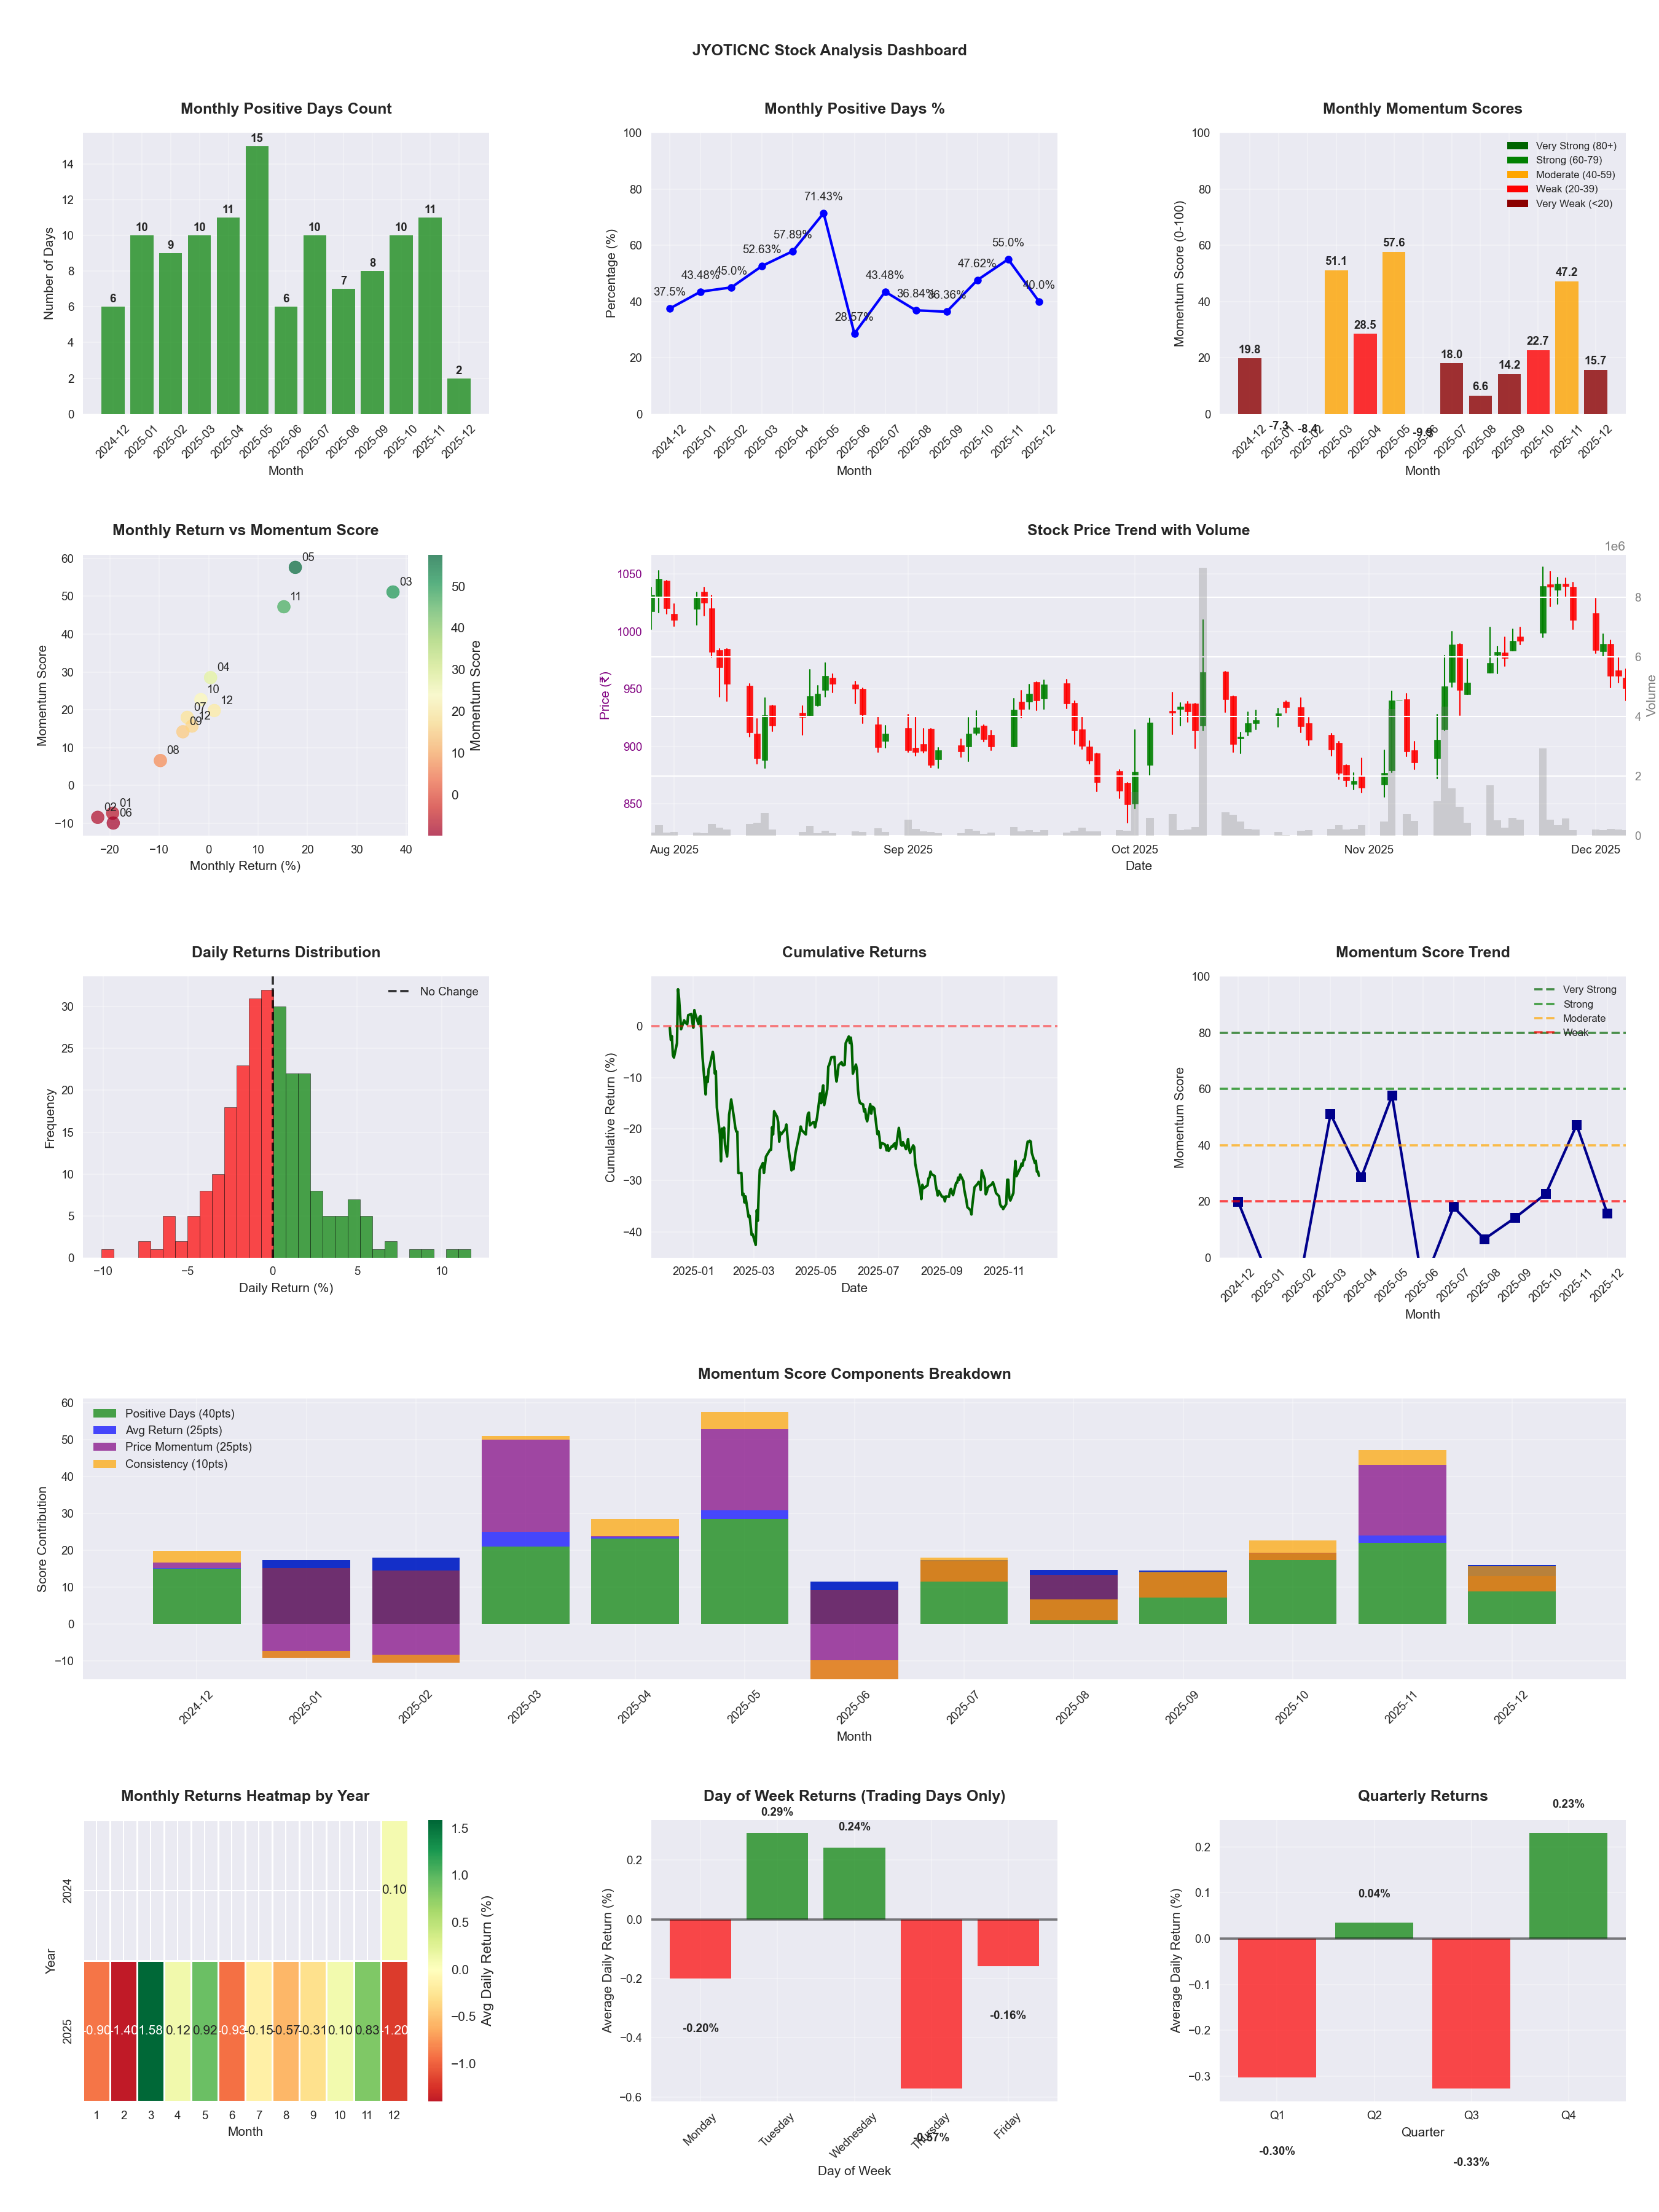
📊 Key Insights & Metrics
Symbol
📈 JYOTICNC
Date
📅 2026-04-11
Volatility
🟡 2.46%
Risk Profile
⚠️ suitable for aggressive investors
Win Rate
⚠️ 44.3%
Avg Daily Return
📉 -0.06%
Max Drawdown
📉 -46.25%
IBD RS Score
📊 23.1
Weak
Market Rank
#379
Best Month
🏆 2025-05
Best Months to Trade
📅 Apr, May, Nov
Best Days to Trade
📅 Wednesday, Tuesday
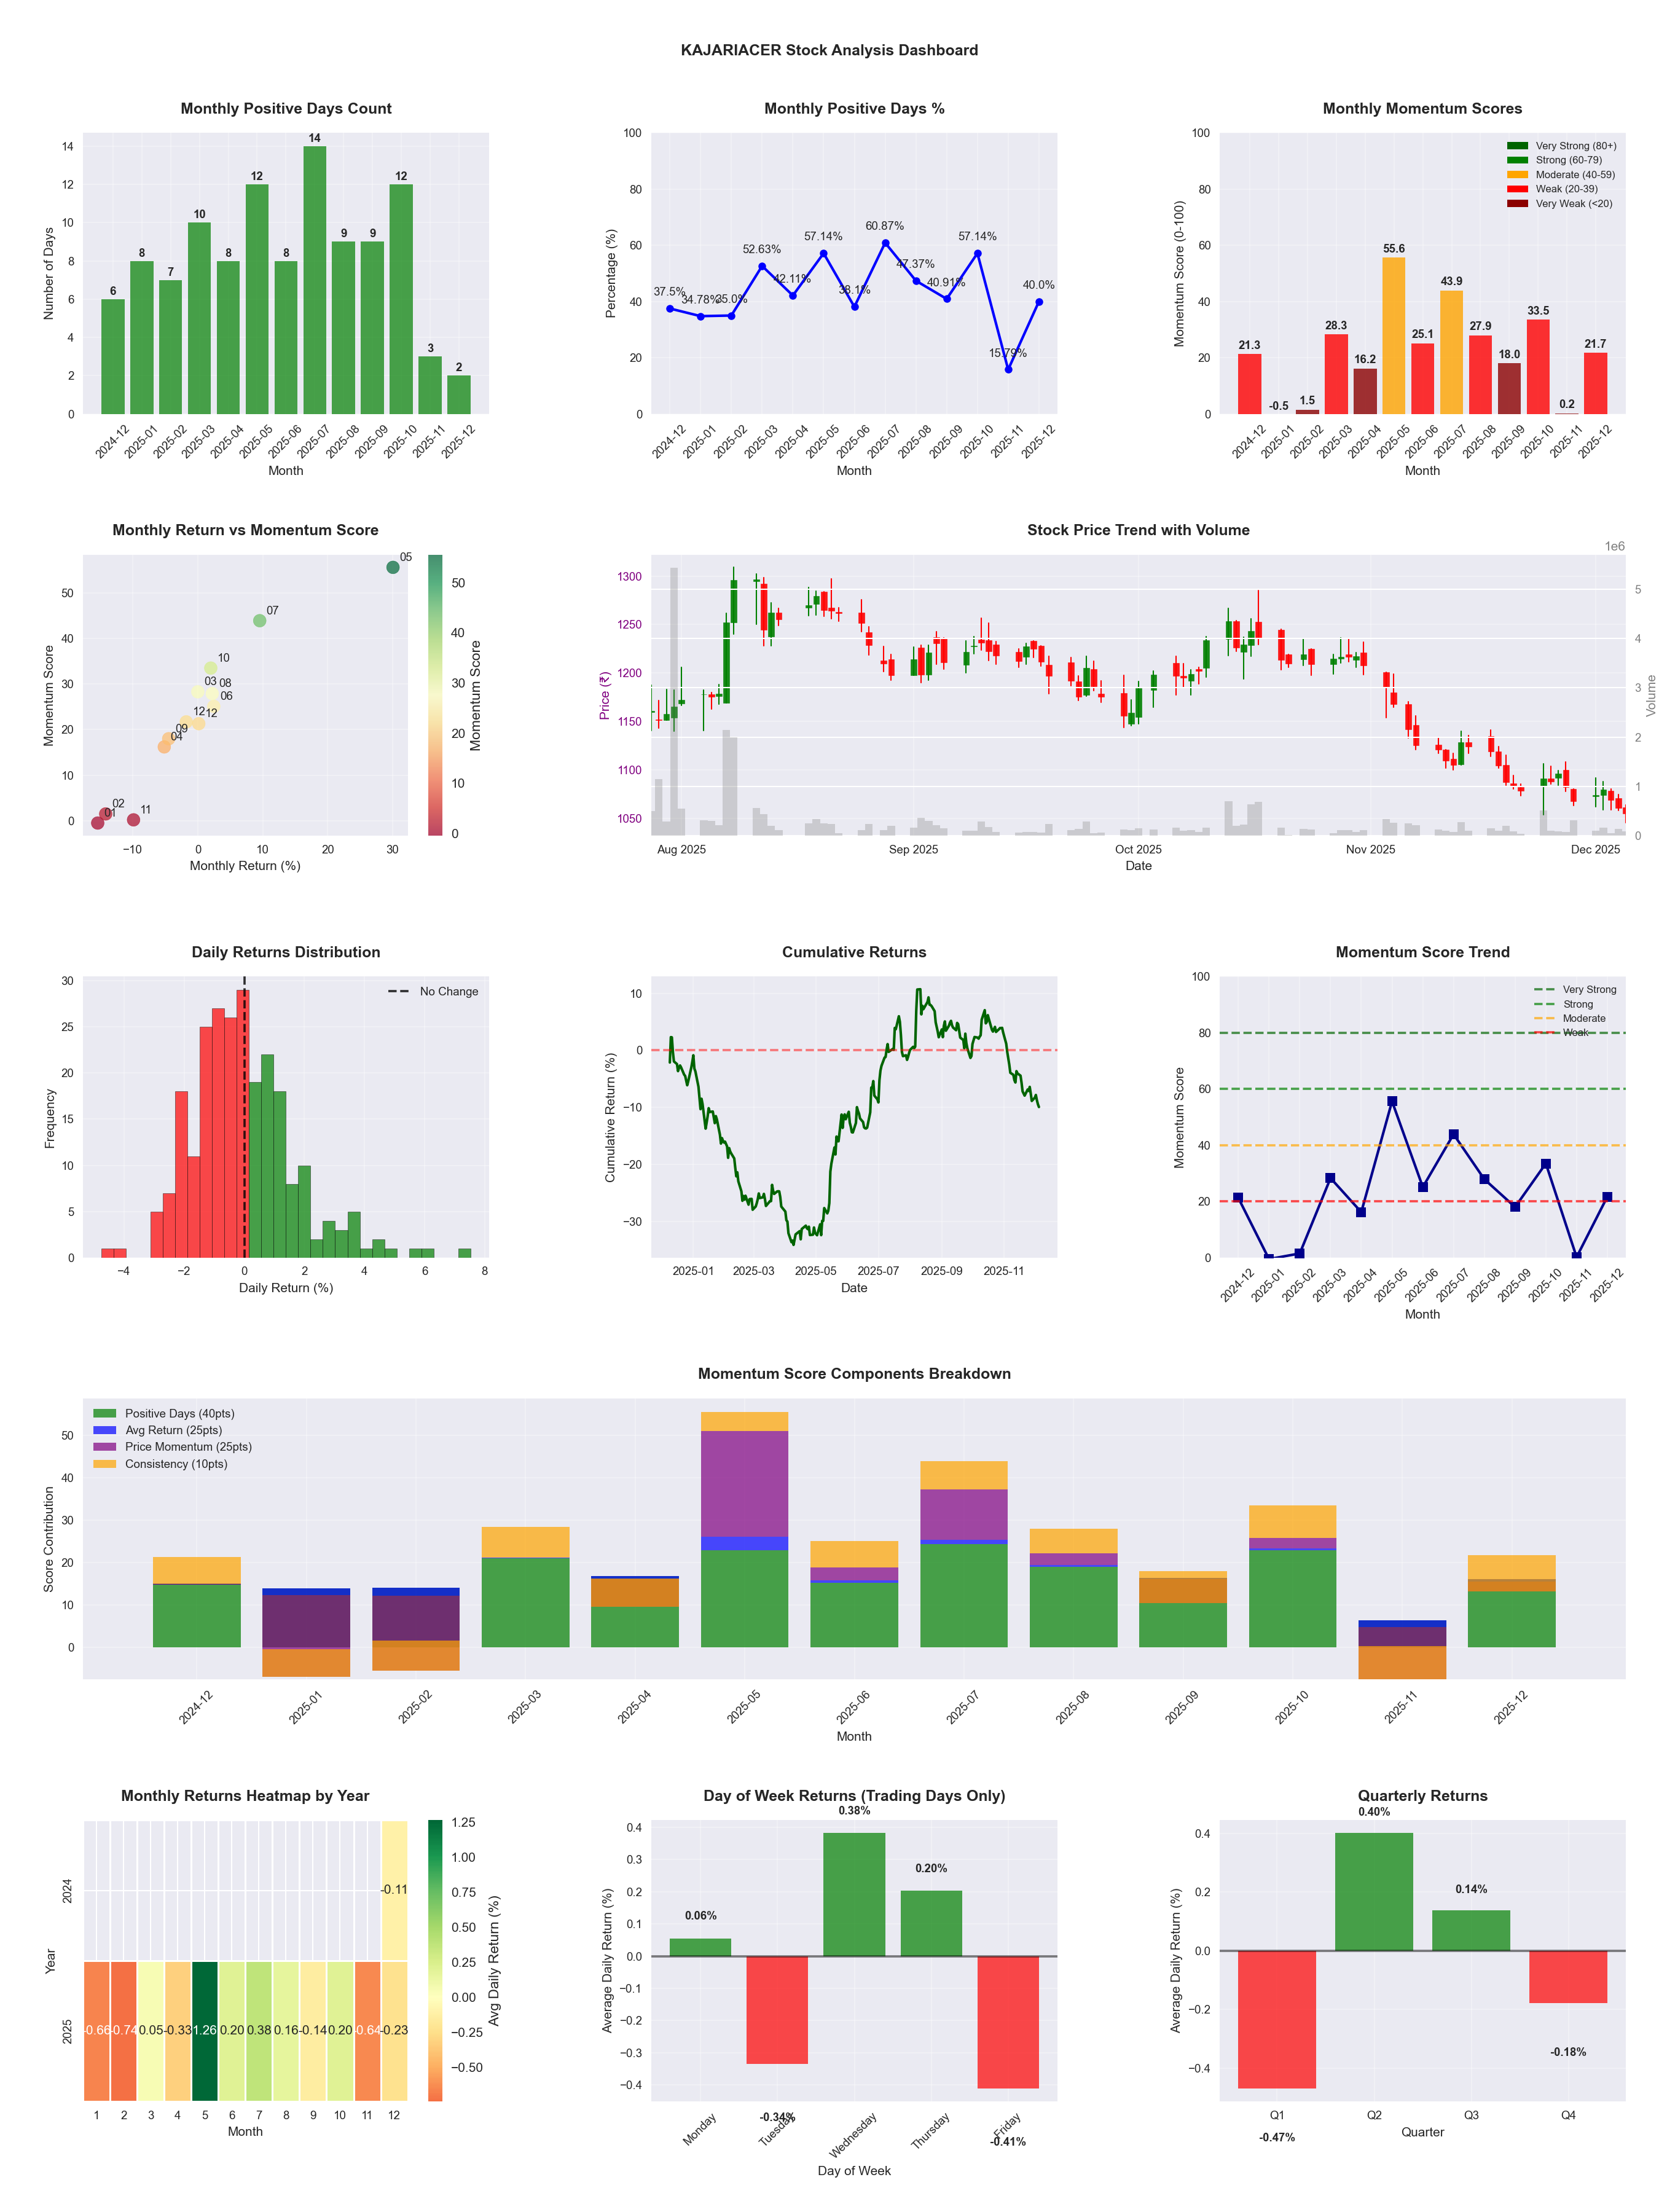
📊 Key Insights & Metrics
Symbol
📈 KAJARIACER
Date
📅 2026-04-11
Volatility
🟡 2.00%
Risk Profile
⚠️ suitable for aggressive investors
Win Rate
⚠️ 48.4%
Avg Daily Return
📈 +0.16%
Max Drawdown
📉 -31.84%
IBD RS Score
📊 77.1
Strong
Market Rank
#113
Best Month
🏆 2026-04
Worst Month
📉 2025-11
Best Months to Trade
📅 May, Apr, Jul
Best Days to Trade
📅 Wednesday, Thursday
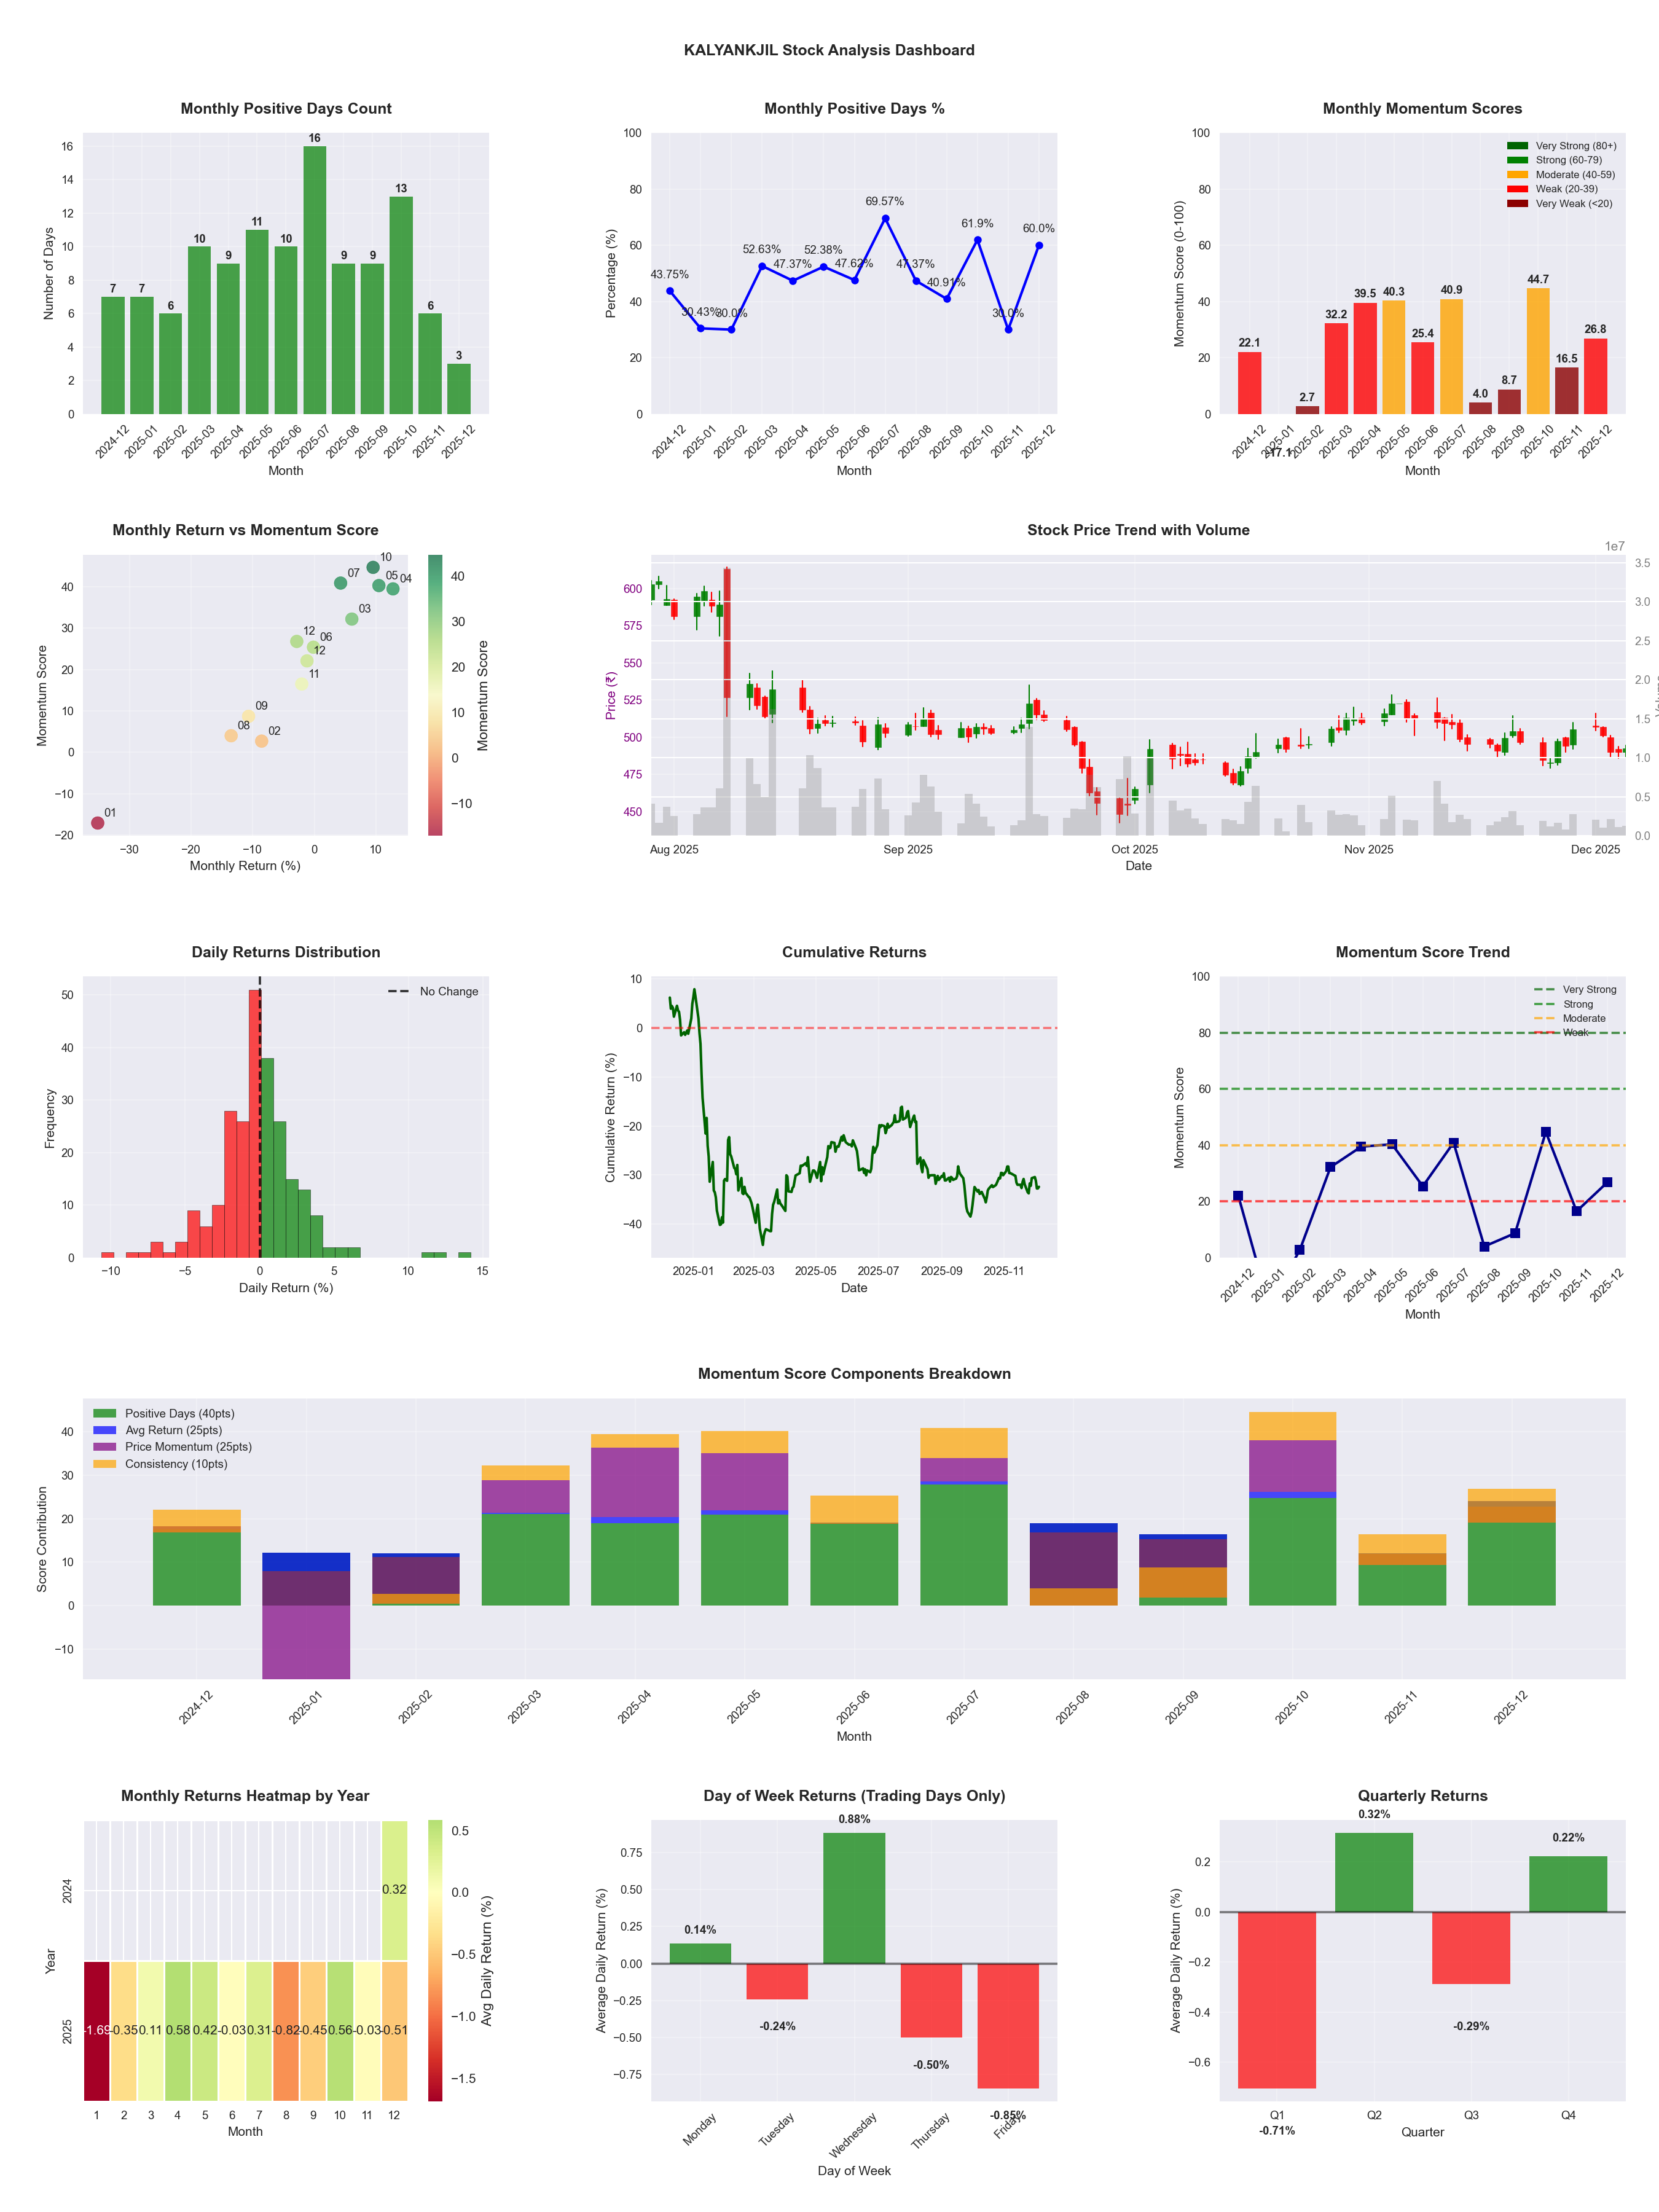
📊 Key Insights & Metrics
Symbol
📈 KALYANKJIL
Date
📅 2026-04-11
Volatility
🟡 2.43%
Risk Profile
⚠️ suitable for aggressive investors
Win Rate
⚠️ 48.8%
Avg Daily Return
📉 -0.02%
Max Drawdown
📉 -40.83%
IBD RS Score
📊 30.2
Weak
Market Rank
#344
Best Month
🏆 2026-04
Best Months to Trade
📅 Apr, Feb, Oct
Best Days to Trade
📅 Wednesday, Monday
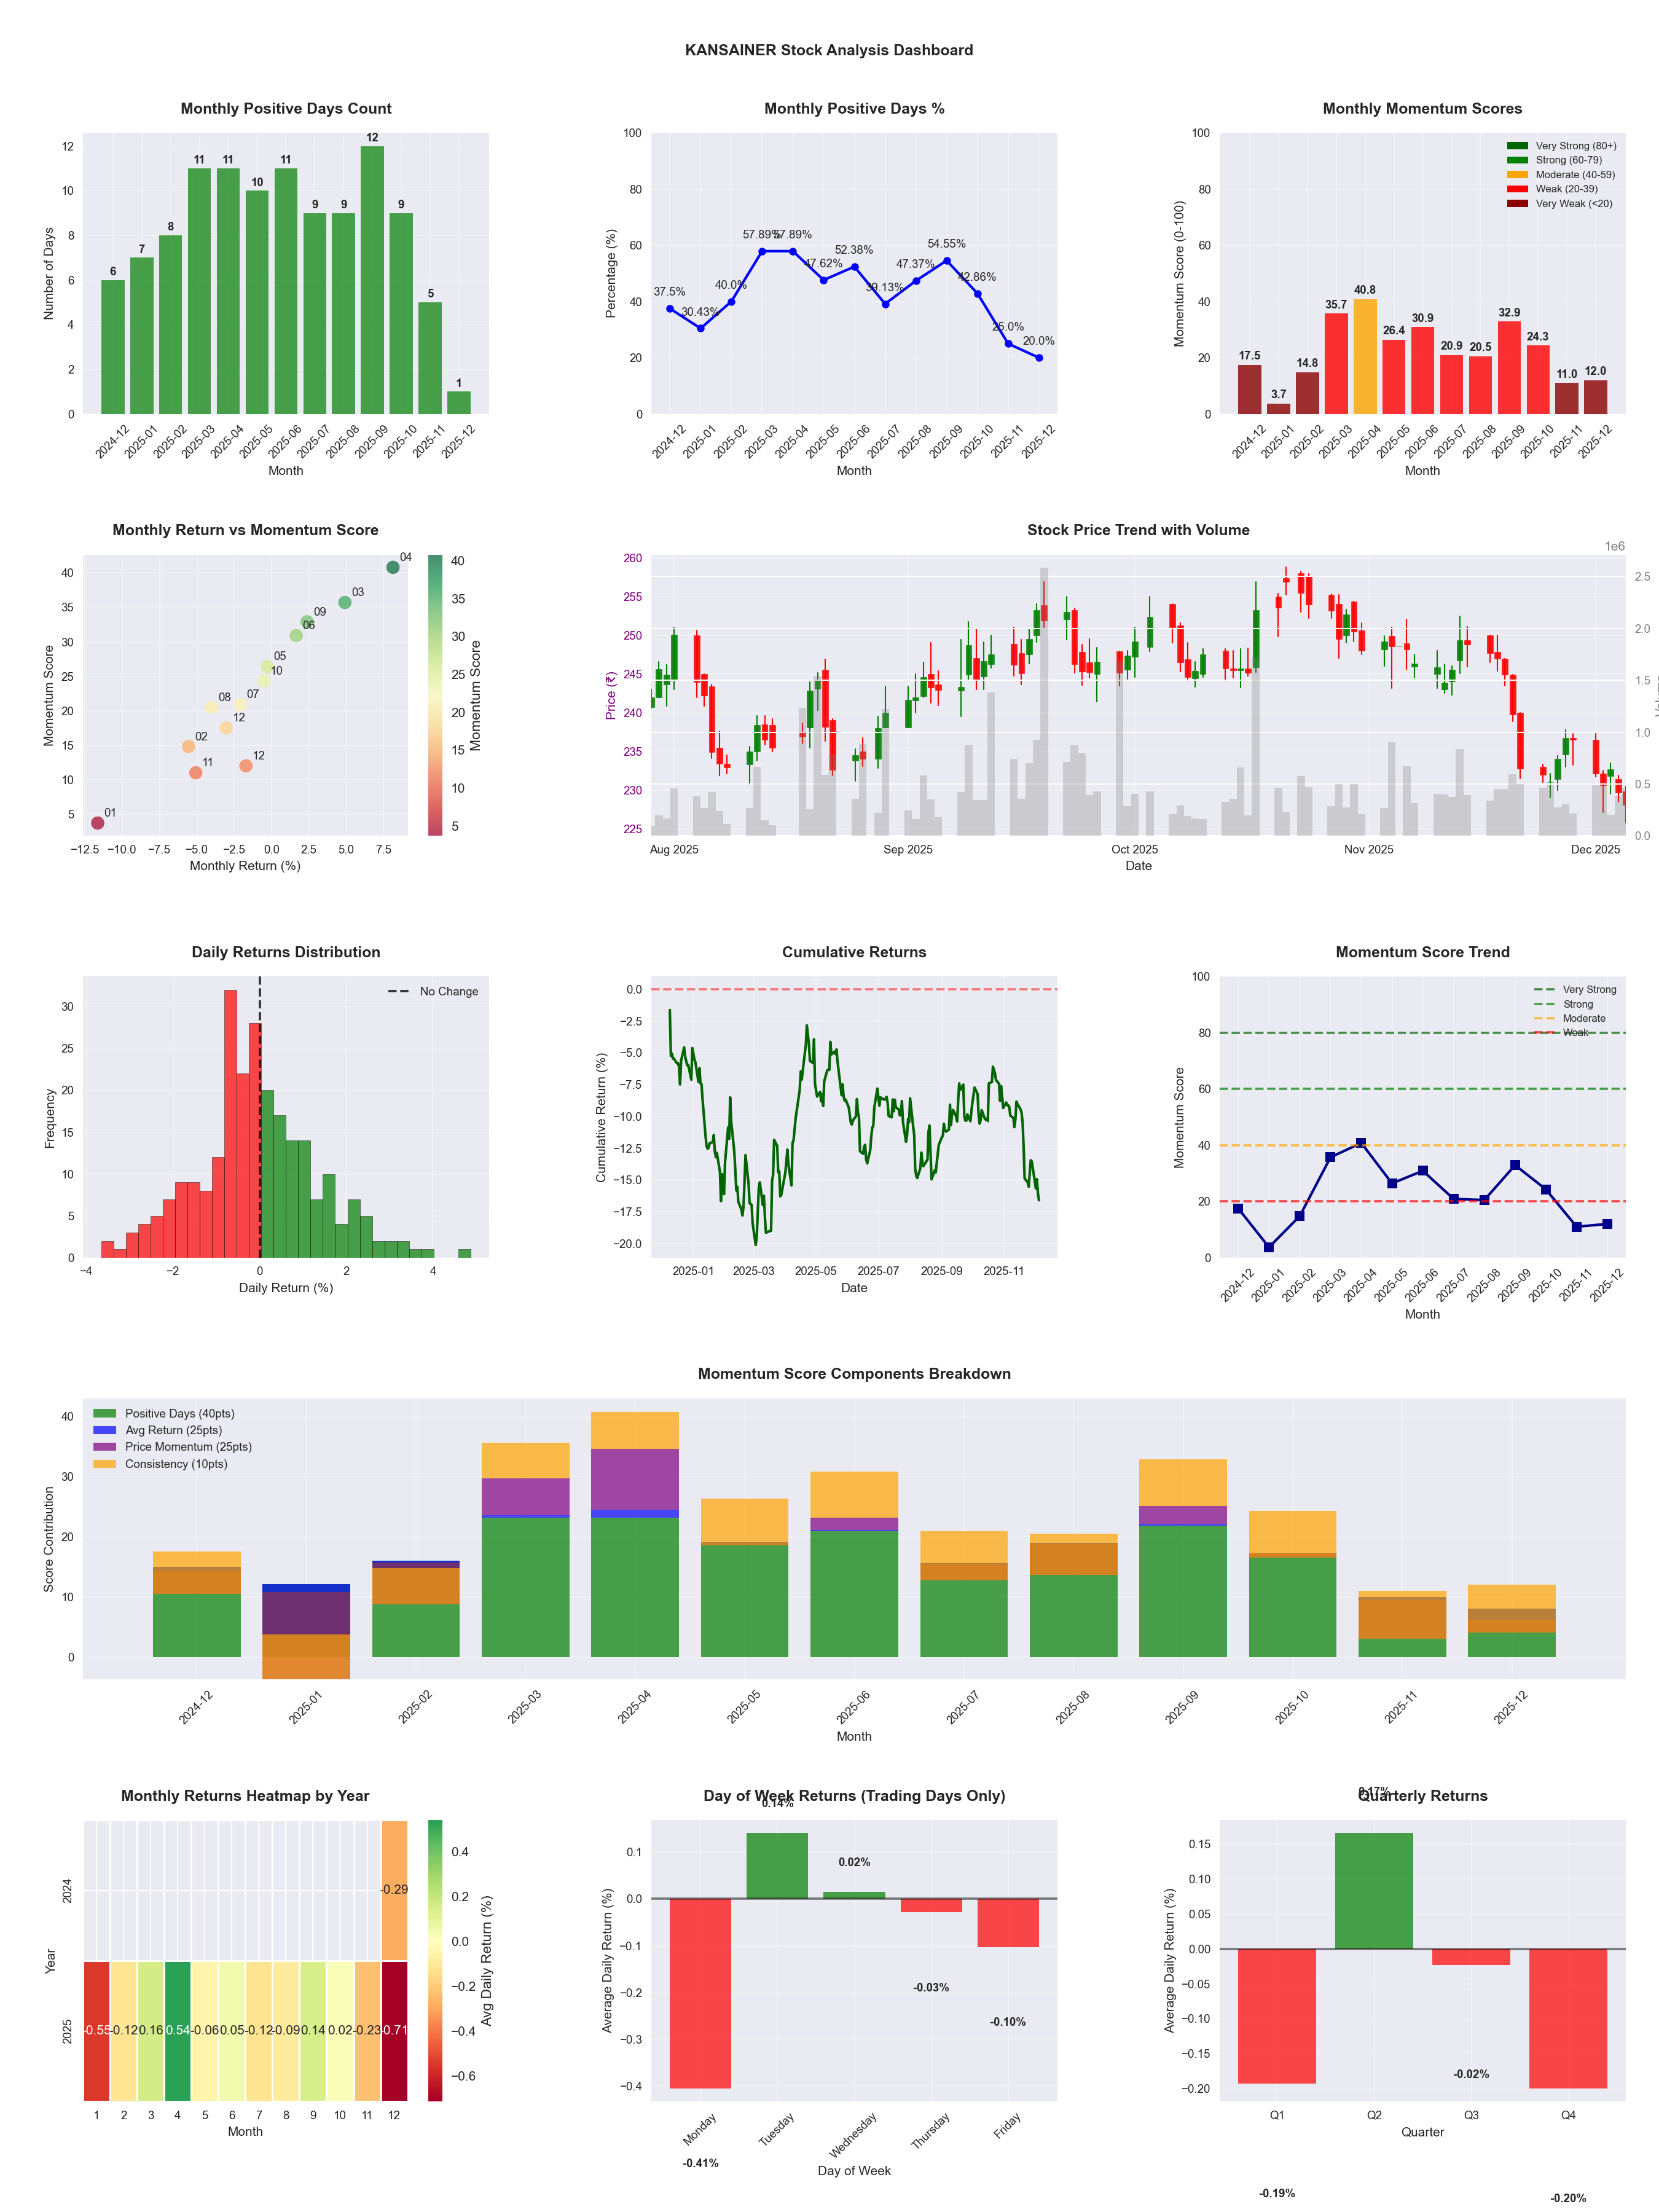
📊 Key Insights & Metrics
Symbol
📈 KANSAINER
Date
📅 2026-03-21
Volatility
🟢 1.42%
Win Rate
⚠️ 43.1%
Avg Daily Return
📉 -0.14%
Max Drawdown
📉 -37.24%
Best Month
🏆 2025-04
Best Months to Trade
📅 Apr, Sep, Jun
Best Days to Trade
📅 Wednesday, Tuesday
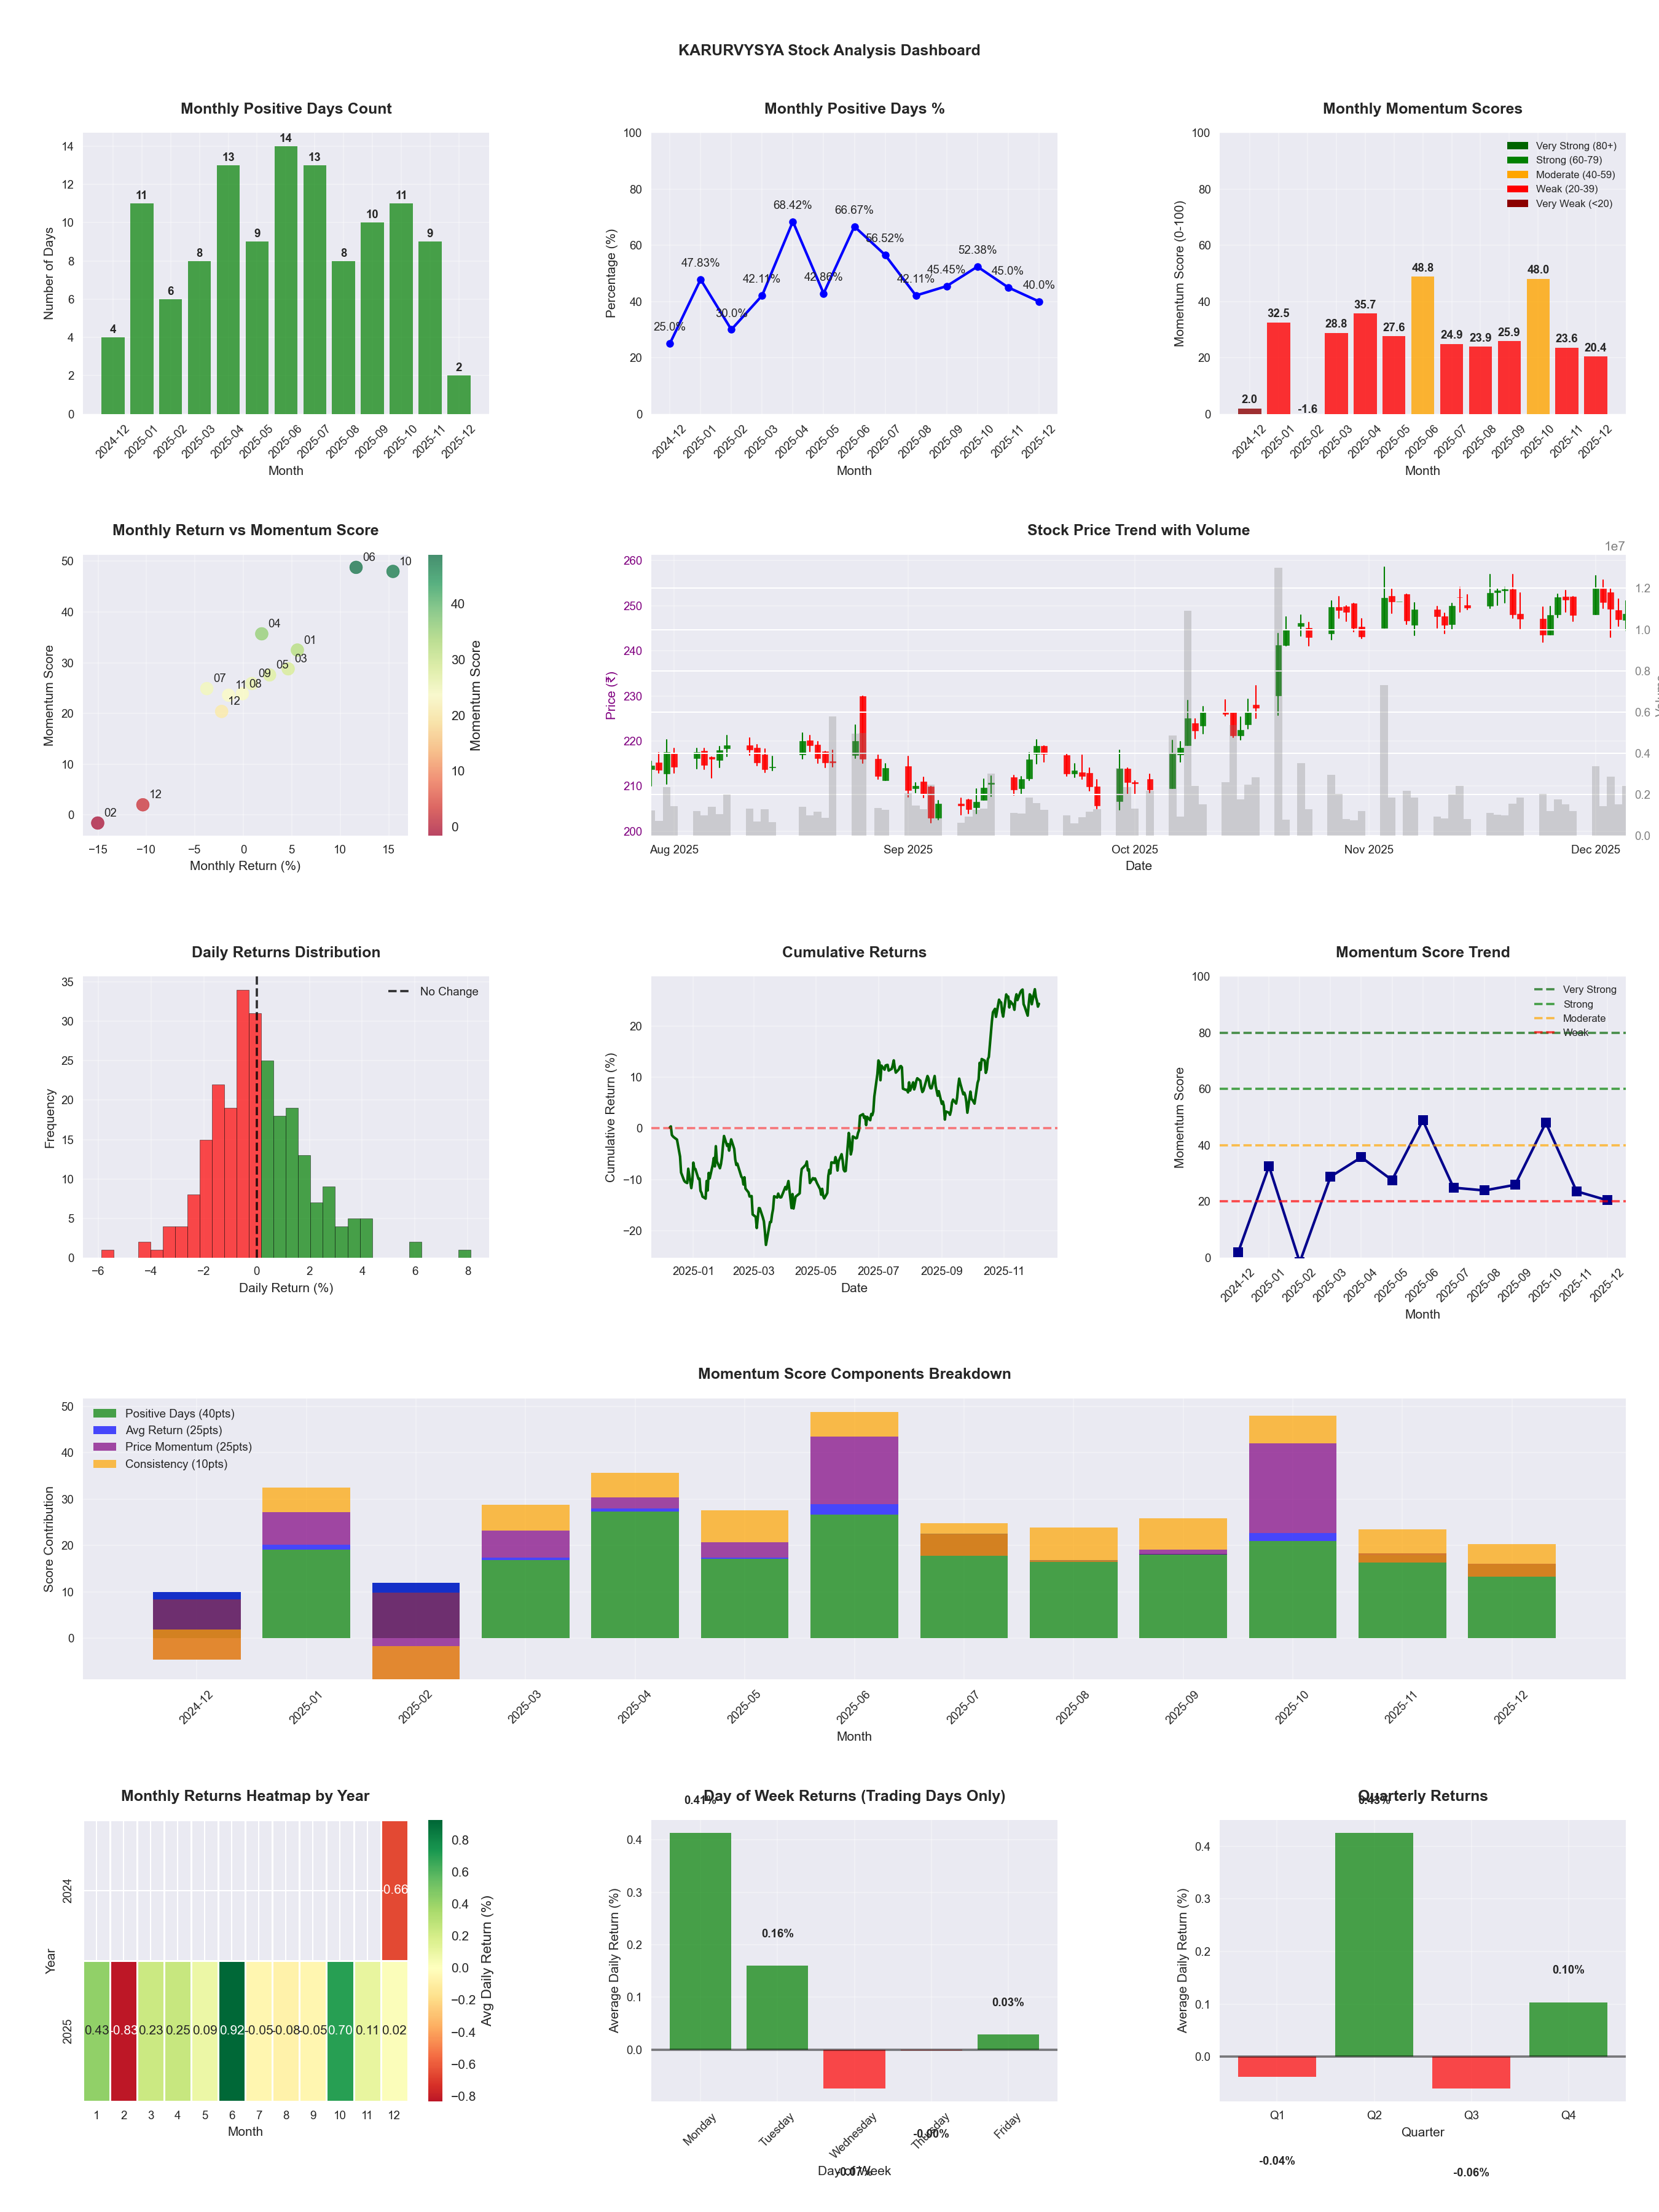
📊 Key Insights & Metrics
Symbol
📈 KARURVYSYA
Date
📅 2026-04-11
Volatility
🟡 2.09%
Risk Profile
⚠️ suitable for aggressive investors
Win Rate
⚠️ 52.0%
Avg Daily Return
📈 +0.22%
Max Drawdown
📉 -22.47%
IBD RS Score
📊 91.1
Leader
Market Rank
#44
Best Month
🏆 2025-06
Worst Month
📉 2026-03
Best Months to Trade
📅 Jun, Oct, Jan
Best Days to Trade
📅 Tuesday, Wednesday
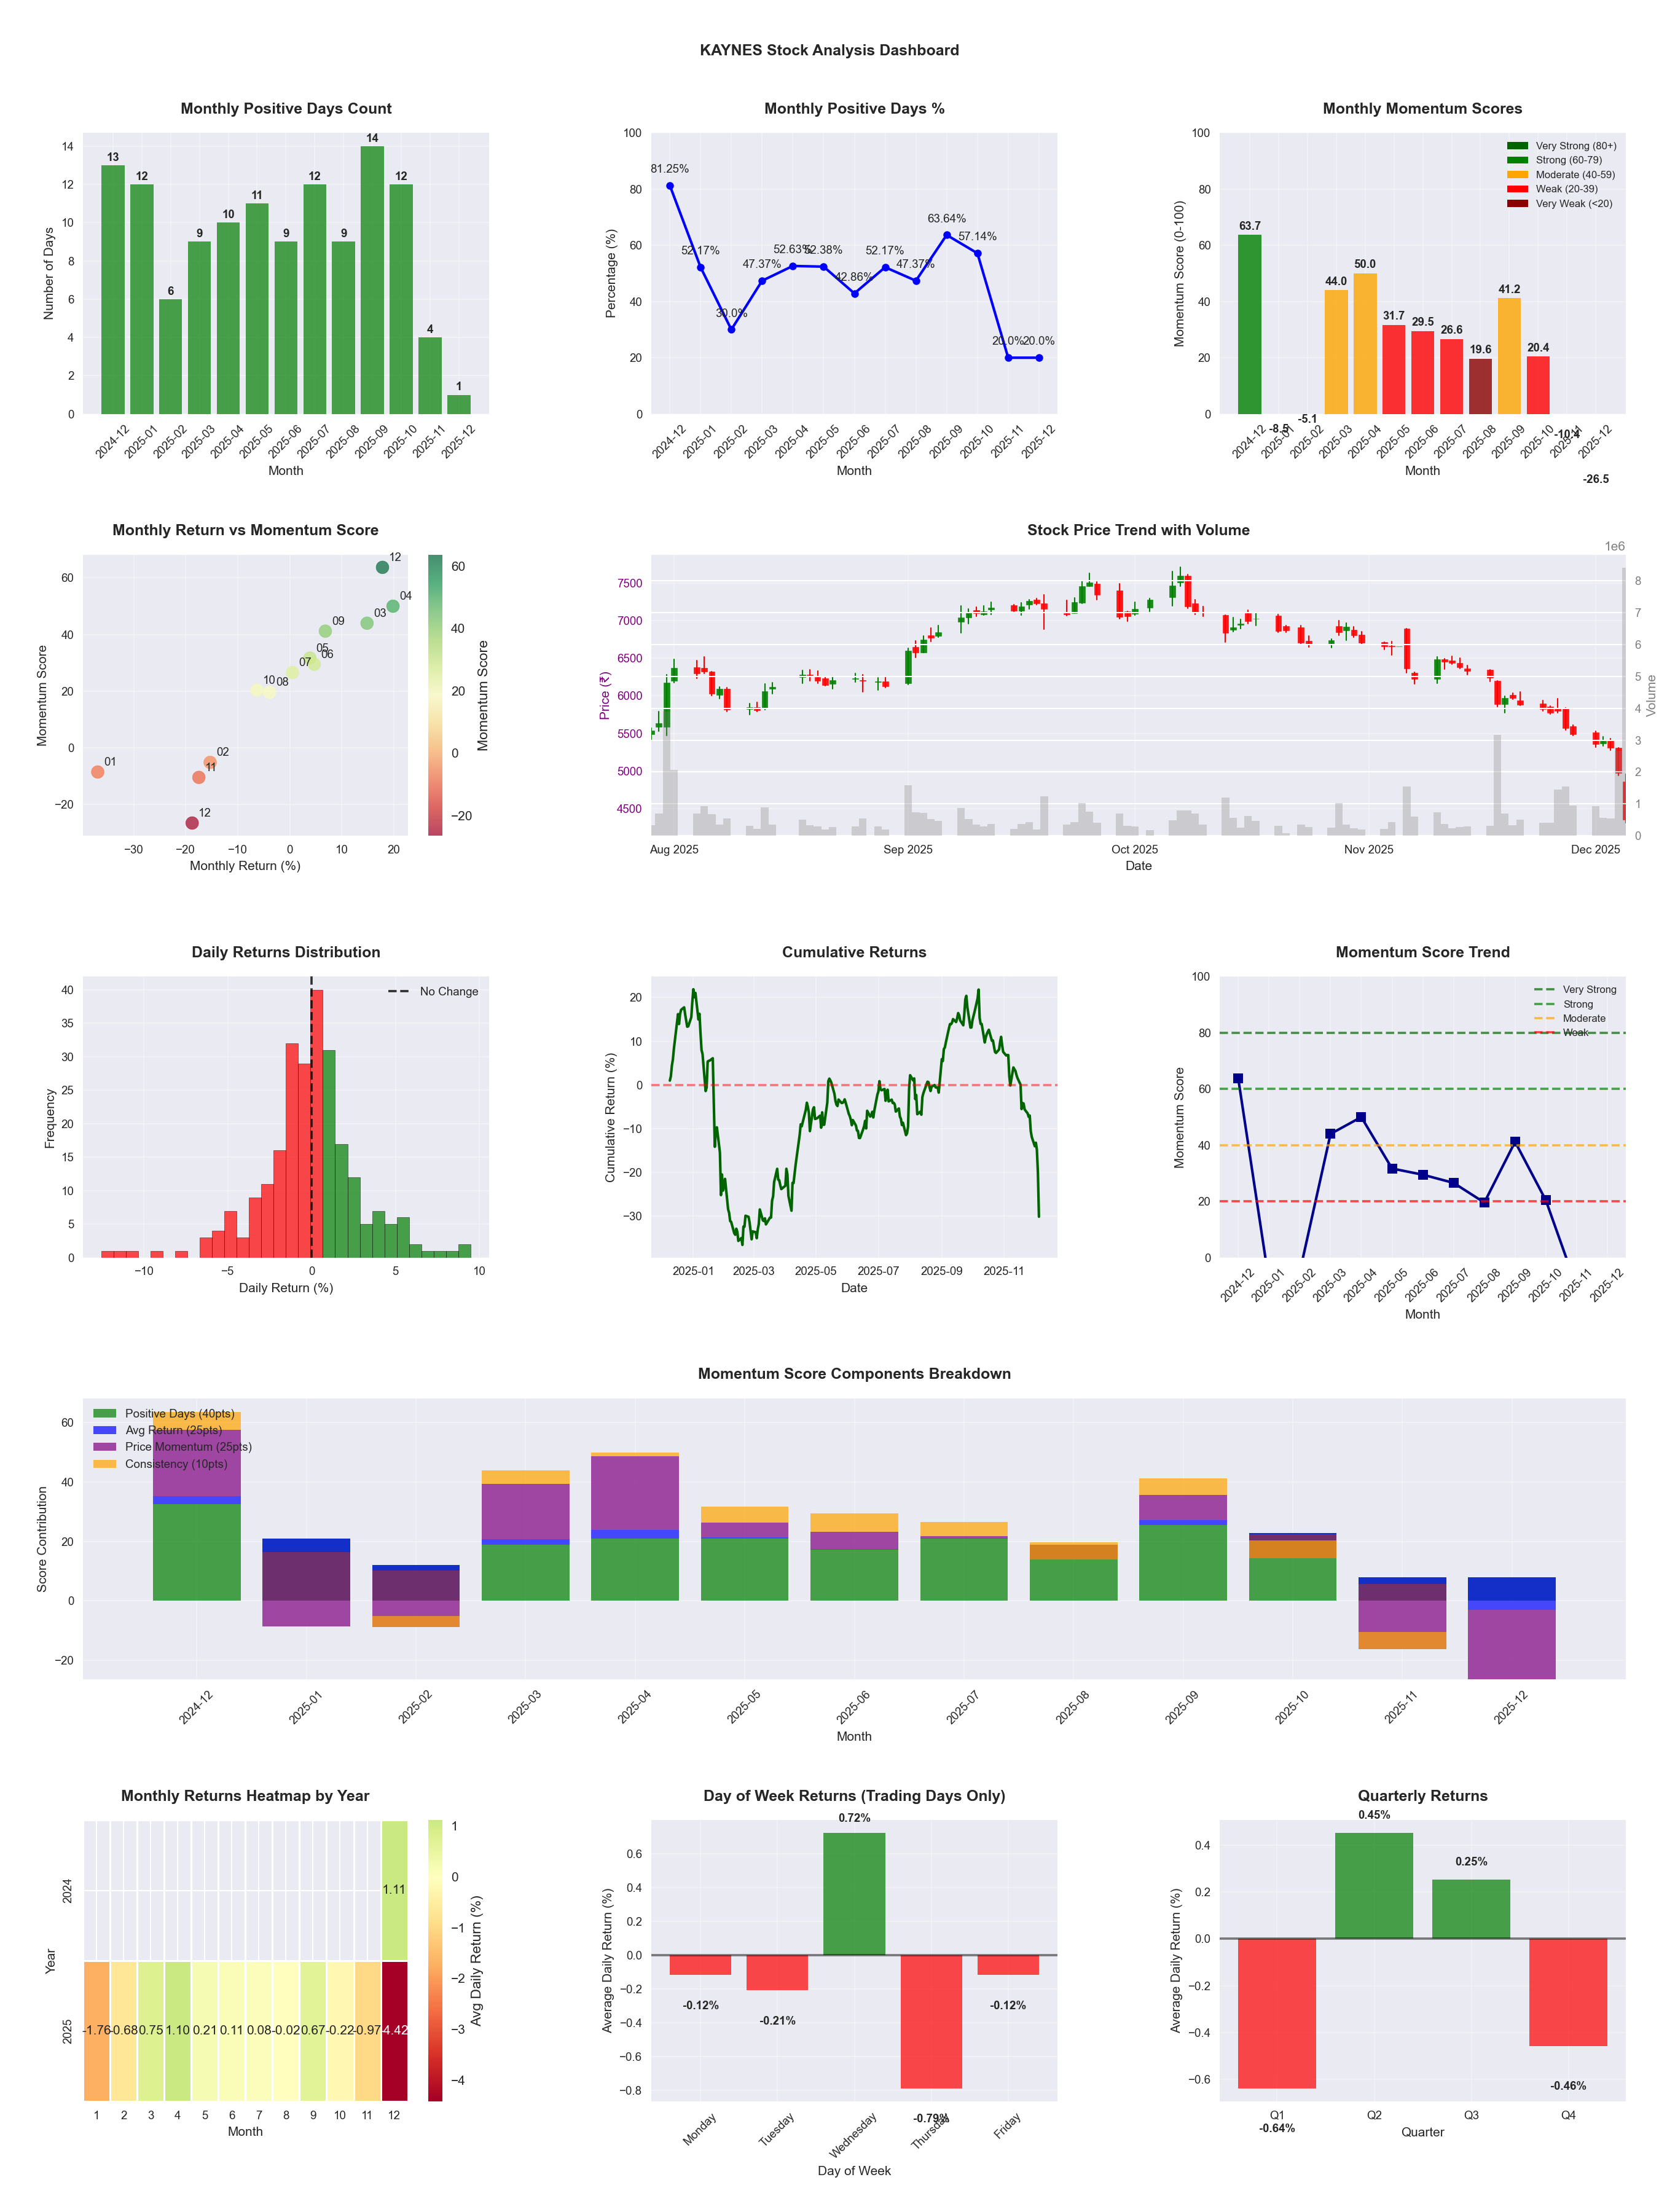
📊 Key Insights & Metrics
Symbol
📈 KAYNES
Date
📅 2026-04-11
Volatility
🟡 2.99%
Risk Profile
⚠️ suitable for aggressive investors
Win Rate
⚠️ 47.1%
Avg Daily Return
📉 -0.06%
Max Drawdown
📉 -56.10%
IBD RS Score
📊 15.2
Weak
Market Rank
#418
Best Month
🏆 2026-04
Best Months to Trade
📅 Apr, Sep, Feb
Best Days to Trade
📅 Wednesday, Tuesday
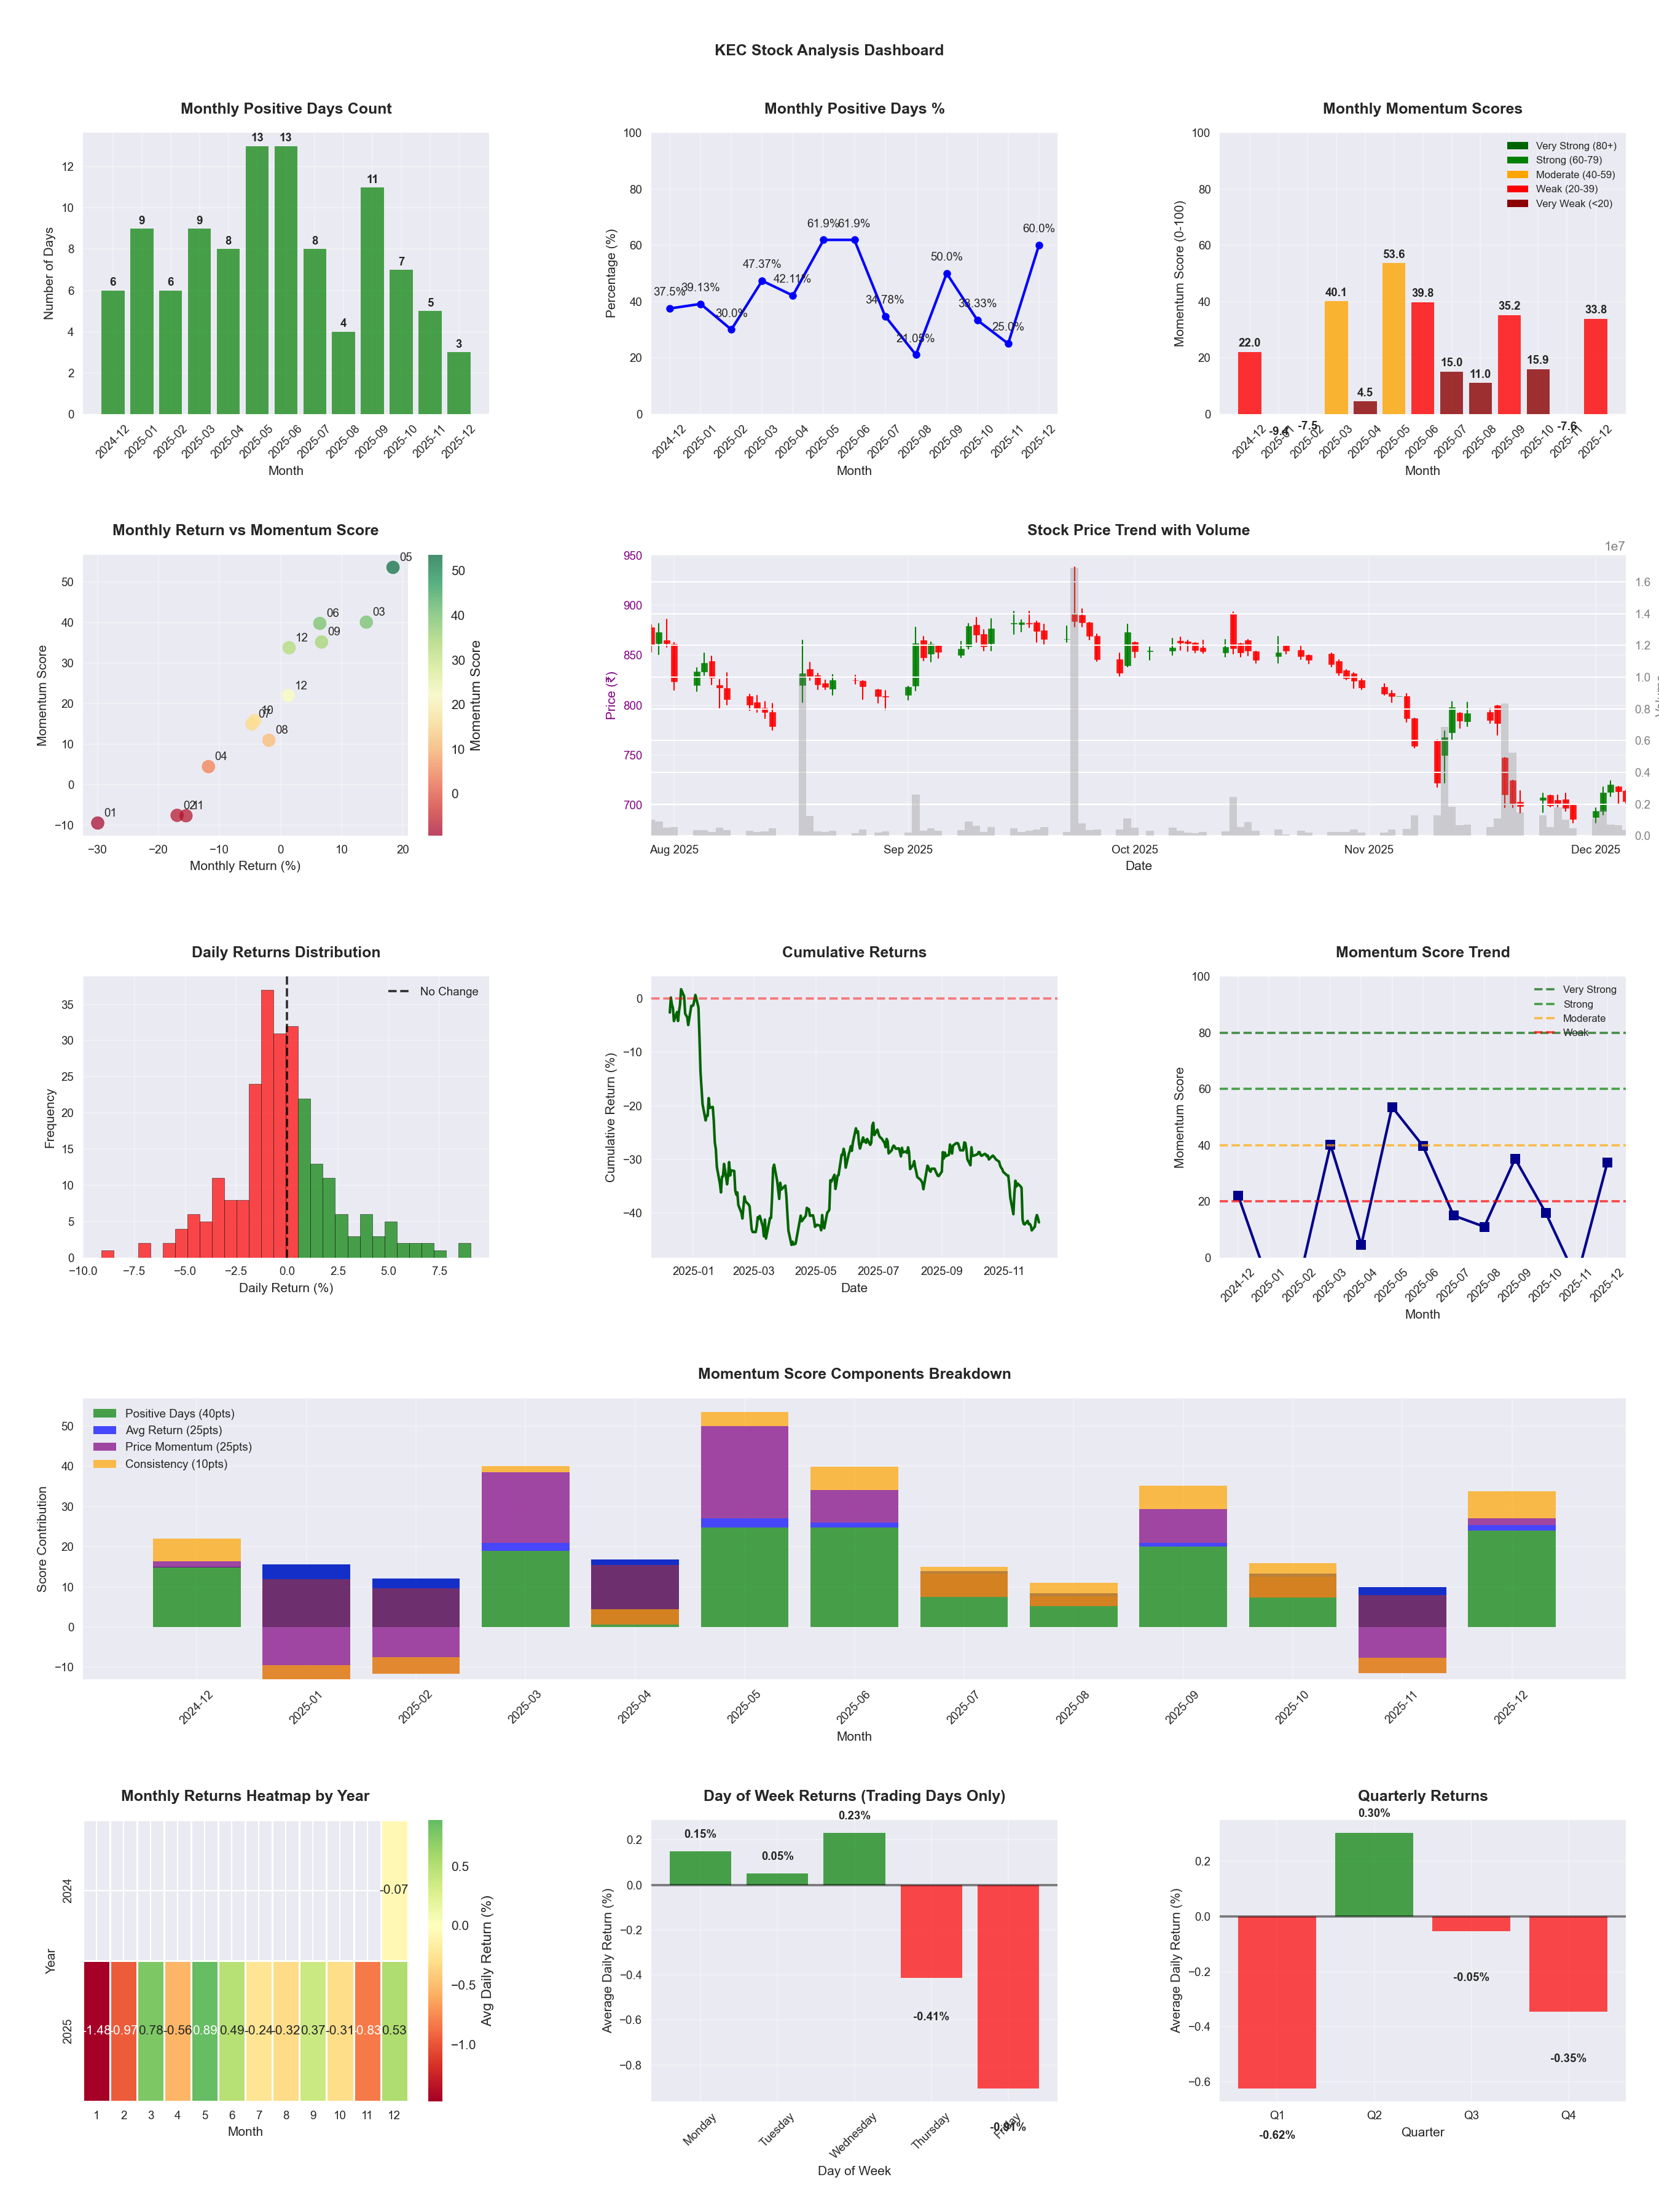
📊 Key Insights & Metrics
Symbol
📈 KEC
Date
📅 2026-04-11
Volatility
🟡 2.36%
Risk Profile
⚠️ suitable for aggressive investors
Win Rate
⚠️ 43.9%
Avg Daily Return
📉 -0.03%
Max Drawdown
📉 -44.91%
IBD RS Score
📊 8.7
Weak
Market Rank
#450
Best Month
🏆 2025-05
Best Months to Trade
📅 Apr, May, Jun
Best Days to Trade
📅 Tuesday, Wednesday
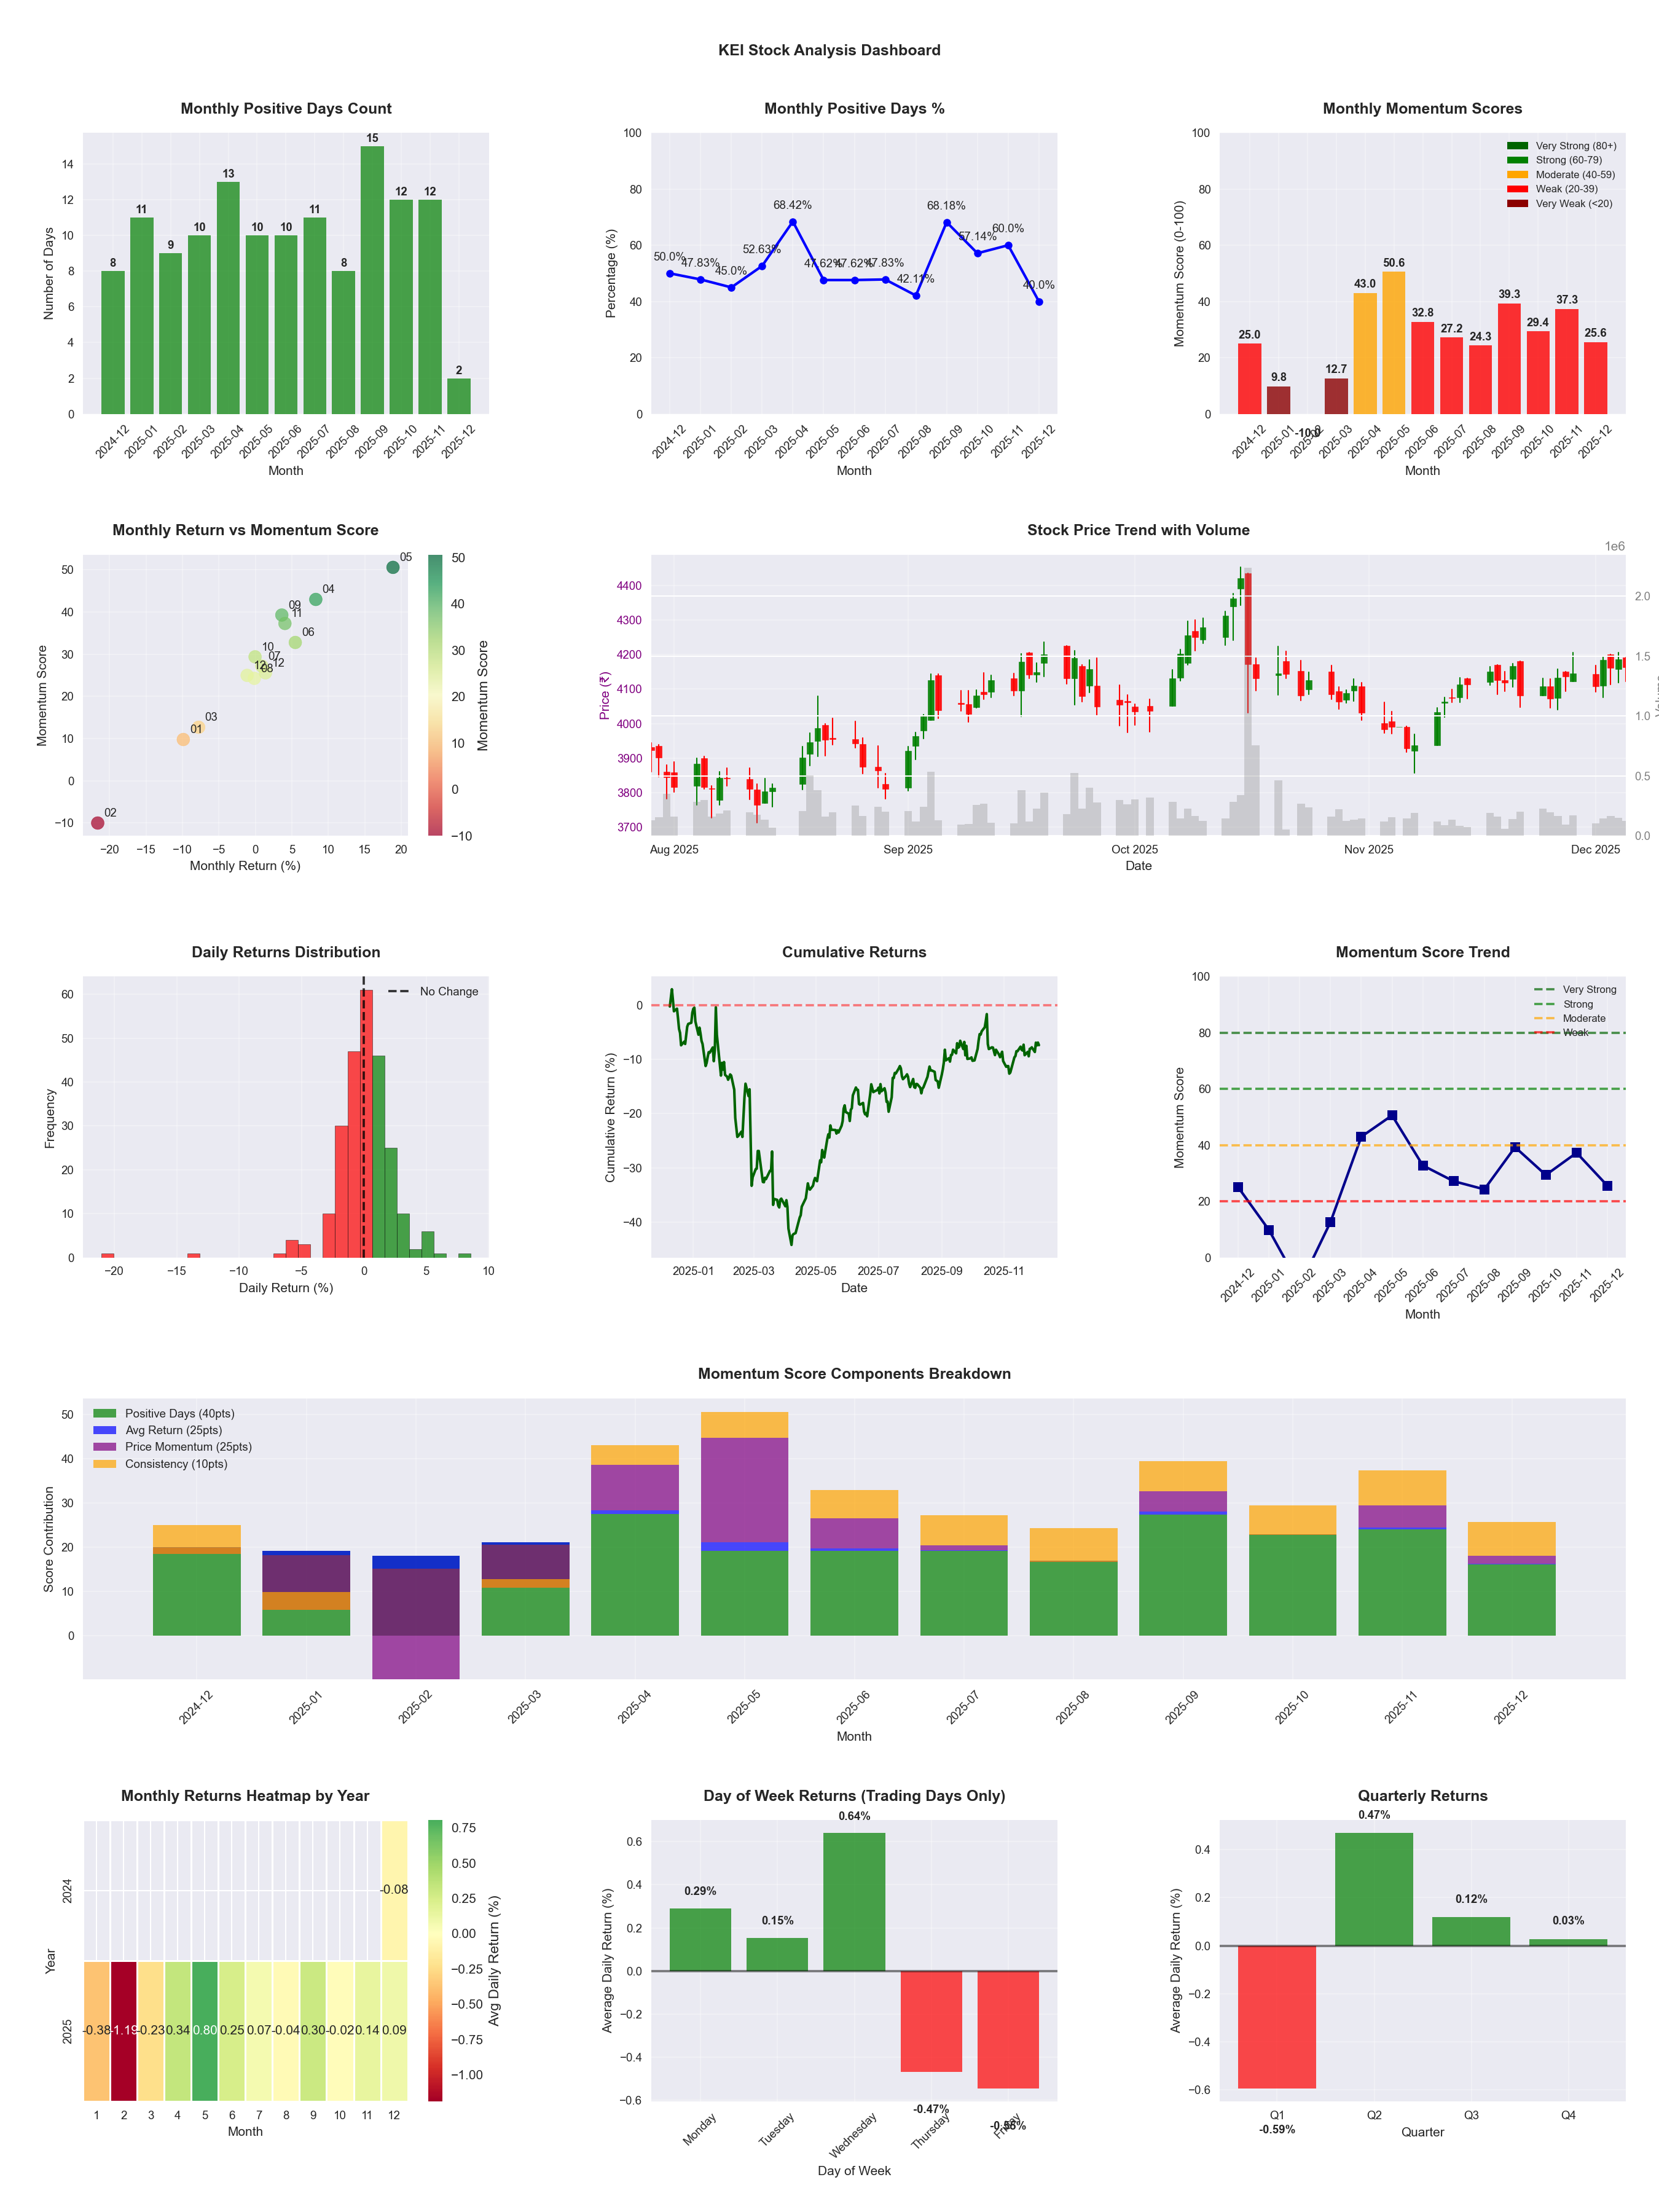
📊 Key Insights & Metrics
Symbol
📈 KEI
Date
📅 2026-04-11
Volatility
🟡 1.95%
Win Rate
⚠️ 53.7%
Avg Daily Return
📈 +0.24%
Max Drawdown
📉 -23.35%
IBD RS Score
📊 85.8
Strong
Market Rank
#70
Best Month
🏆 2026-02
Best Months to Trade
📅 Apr, Feb, May
Best Days to Trade
📅 Monday, Wednesday
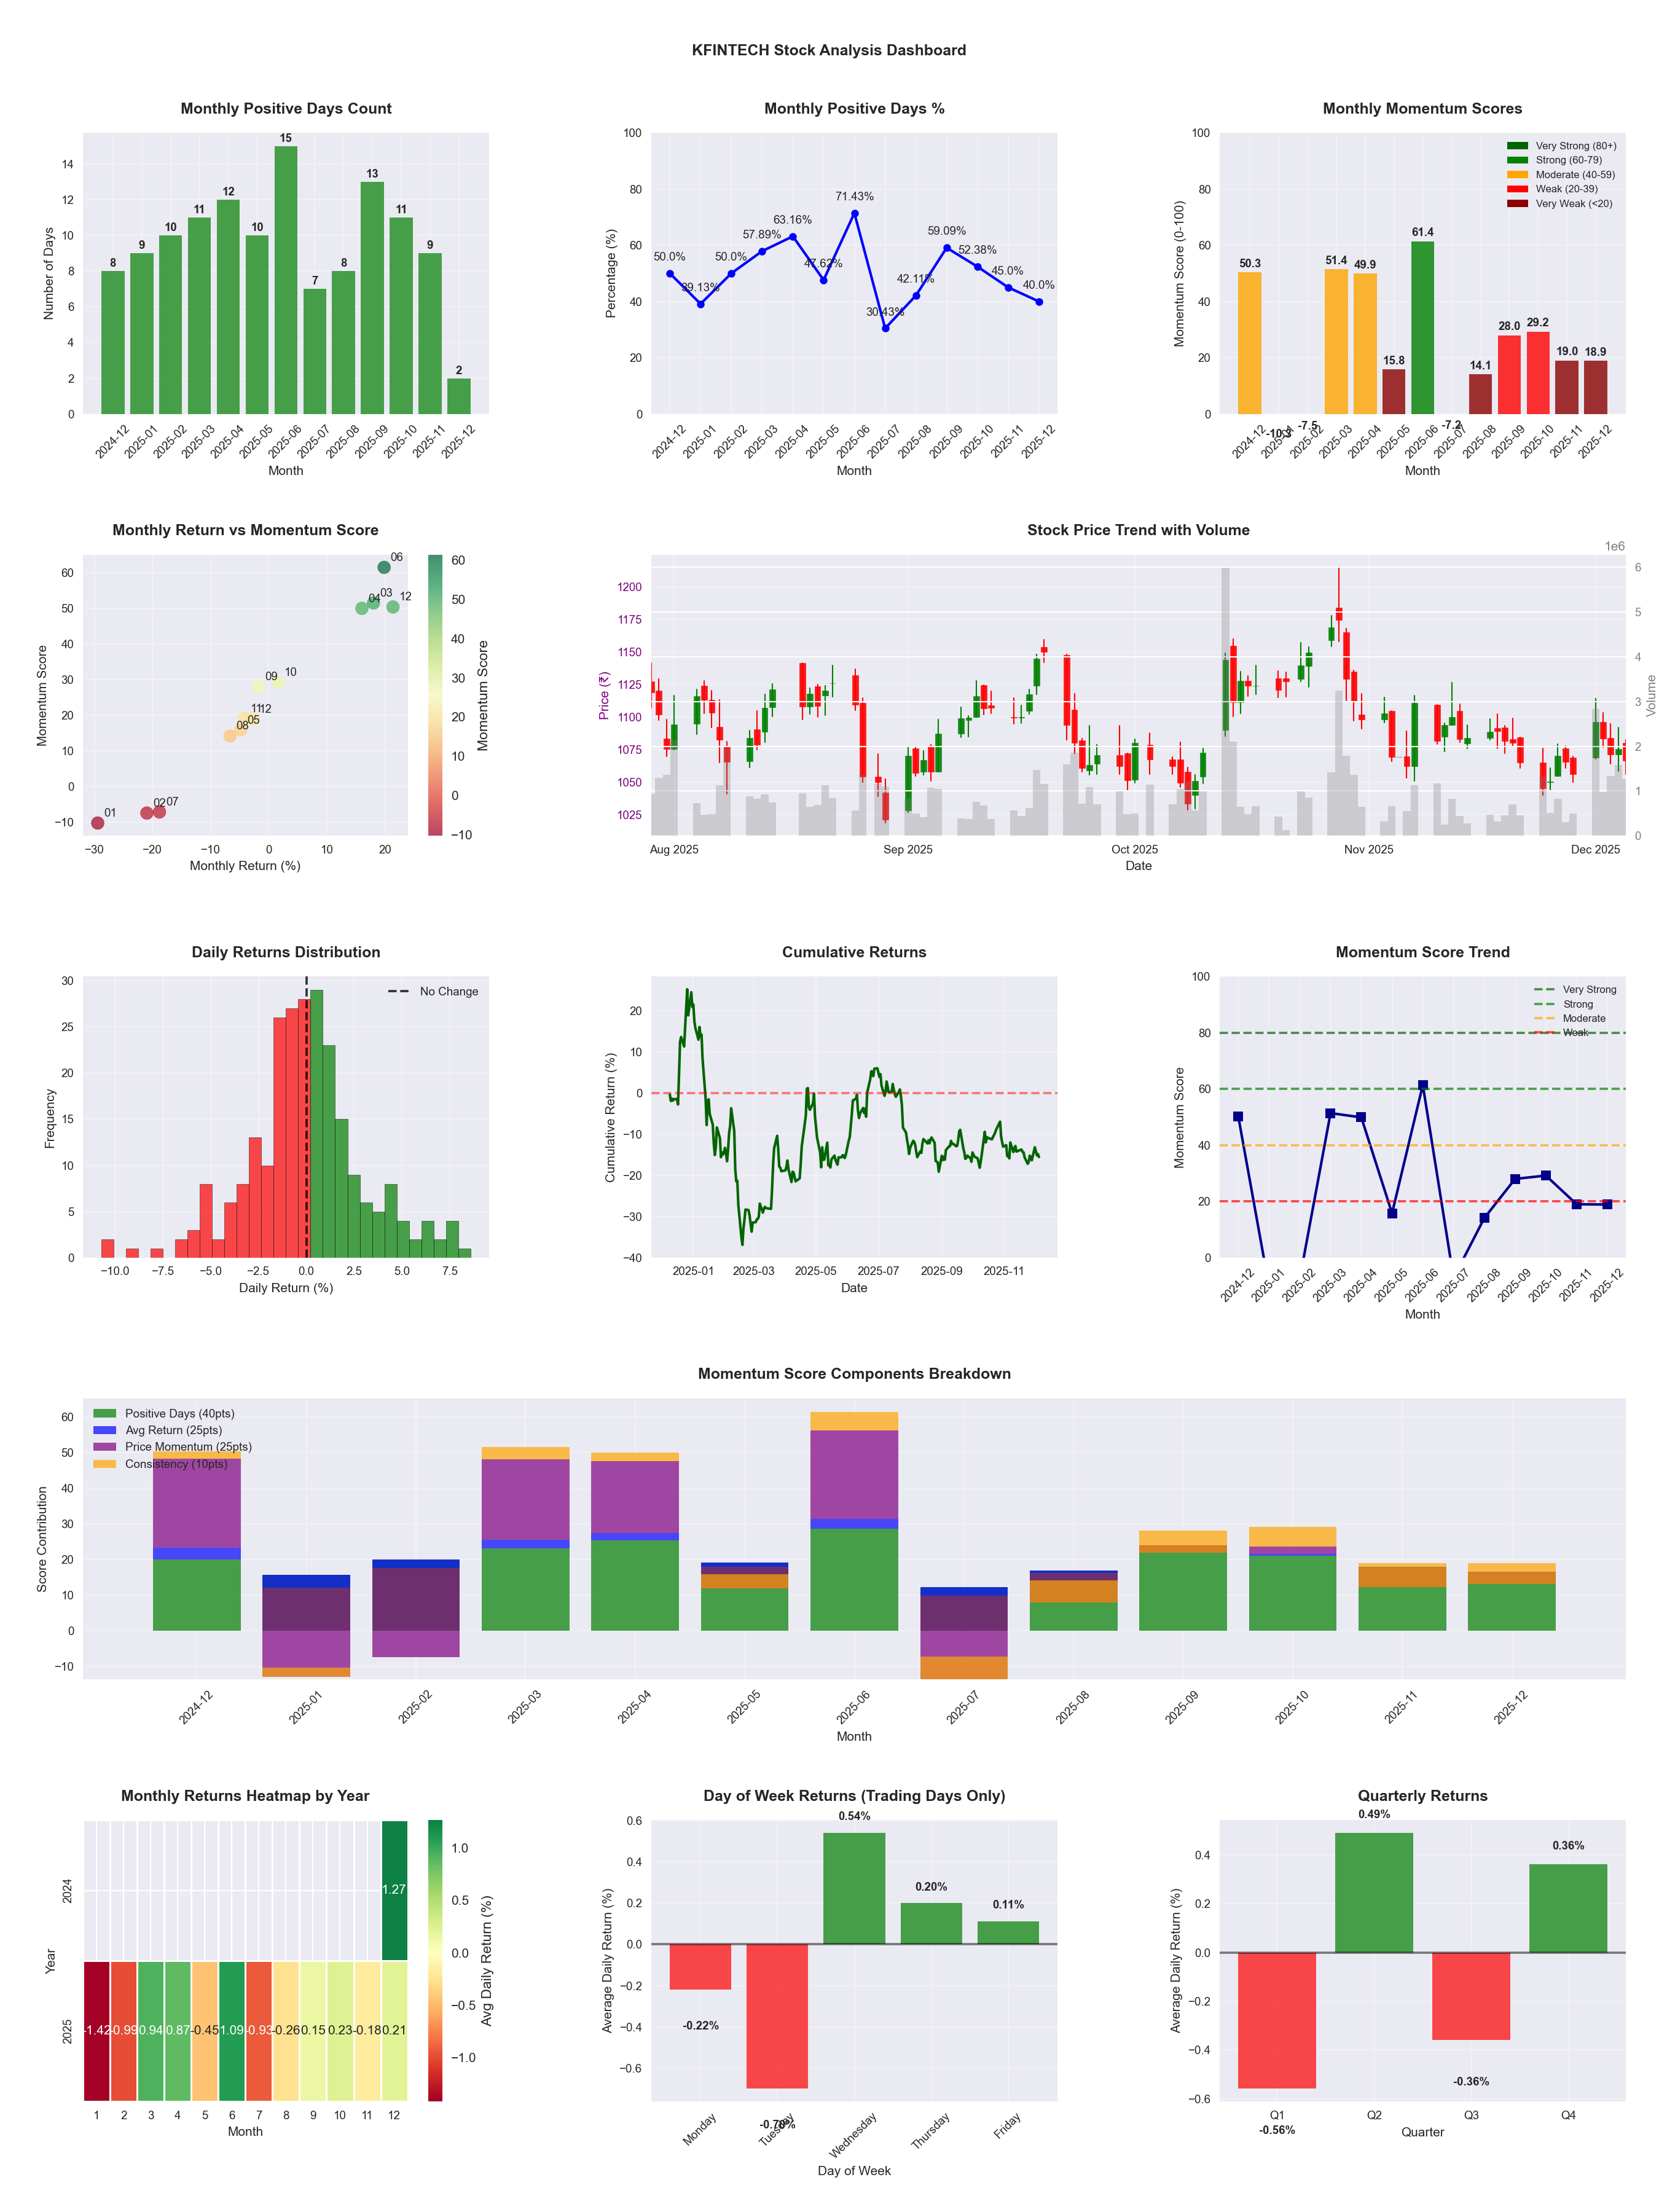
📊 Key Insights & Metrics
Symbol
📈 KFINTECH
Date
📅 2026-04-11
Volatility
🟡 2.31%
Risk Profile
⚠️ suitable for aggressive investors
Win Rate
⚠️ 47.1%
Avg Daily Return
📉 -0.01%
Max Drawdown
📉 -34.52%
IBD RS Score
📊 15.6
Weak
Market Rank
#416
Best Month
🏆 2025-06
Best Months to Trade
📅 Apr, Jun, Oct
Best Days to Trade
📅 Monday, Wednesday
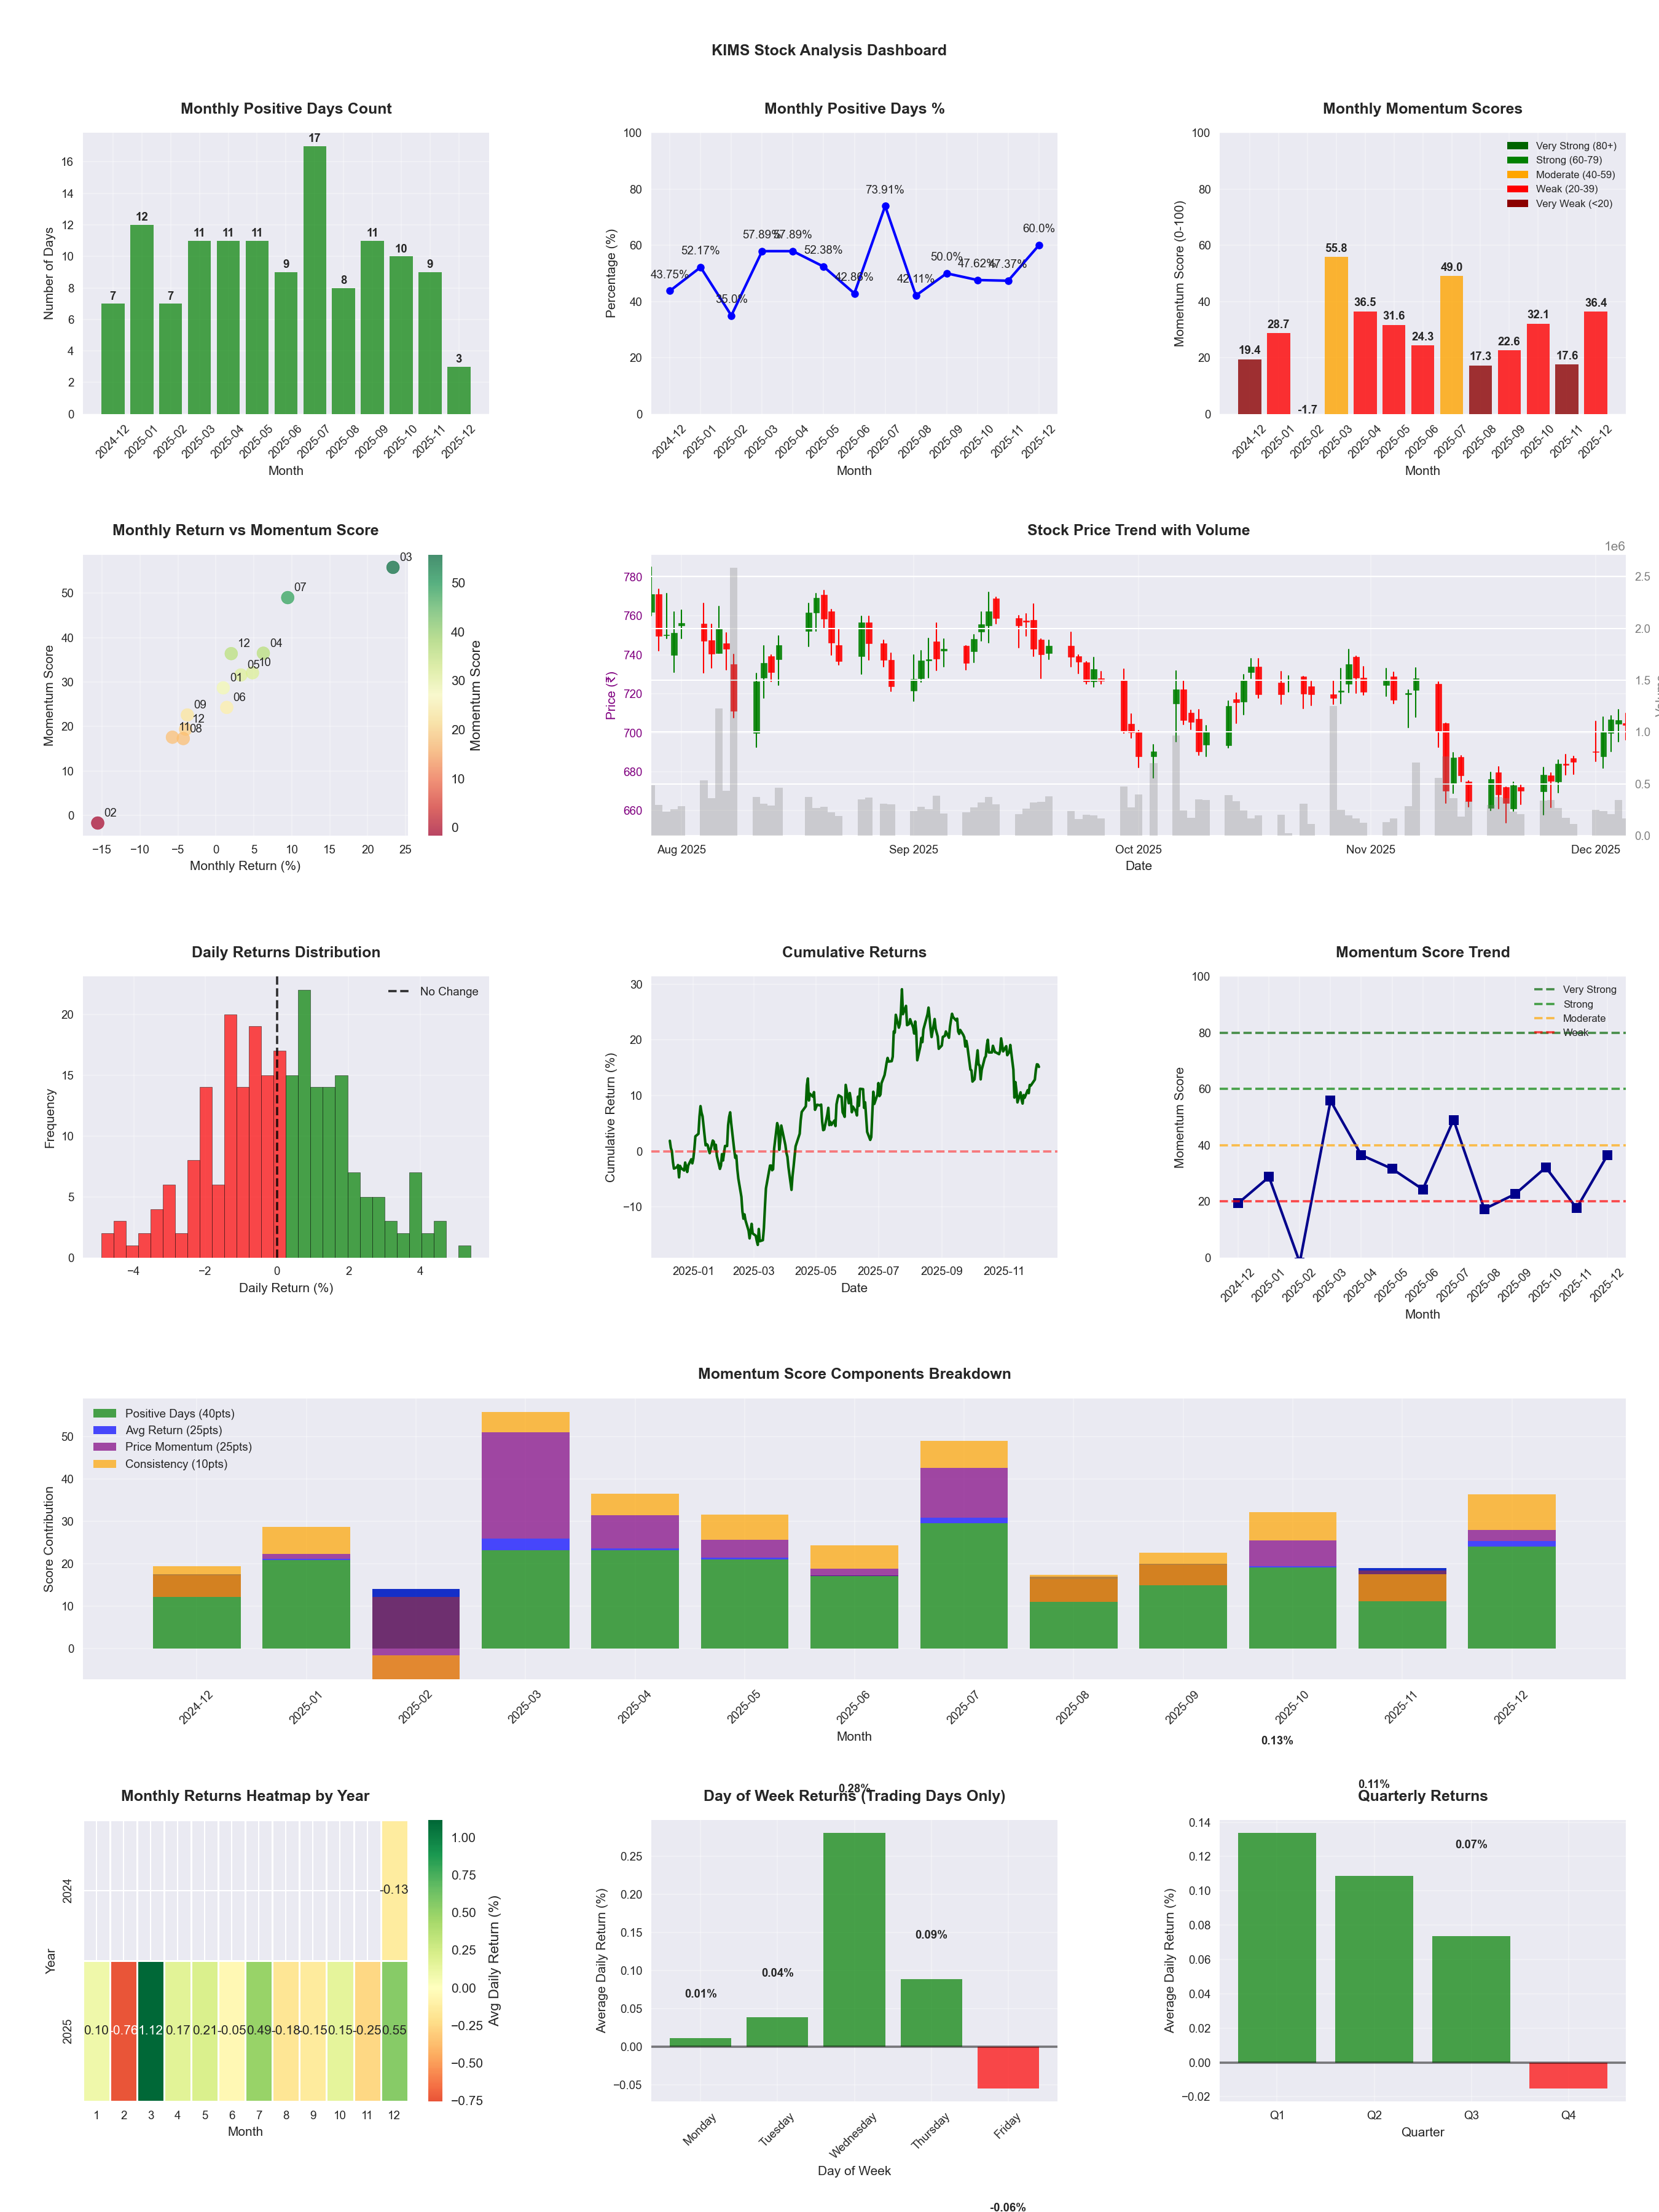
📊 Key Insights & Metrics
Symbol
📈 KIMS
Date
📅 2026-04-11
Volatility
🟡 1.98%
Win Rate
⚠️ 50.0%
Avg Daily Return
📈 +0.05%
Max Drawdown
📉 -26.26%
IBD RS Score
📊 64.3
Average
Market Rank
#176
Best Month
🏆 2026-02
Best Months to Trade
📅 Feb, Apr, Jul
Best Days to Trade
📅 Tuesday, Wednesday
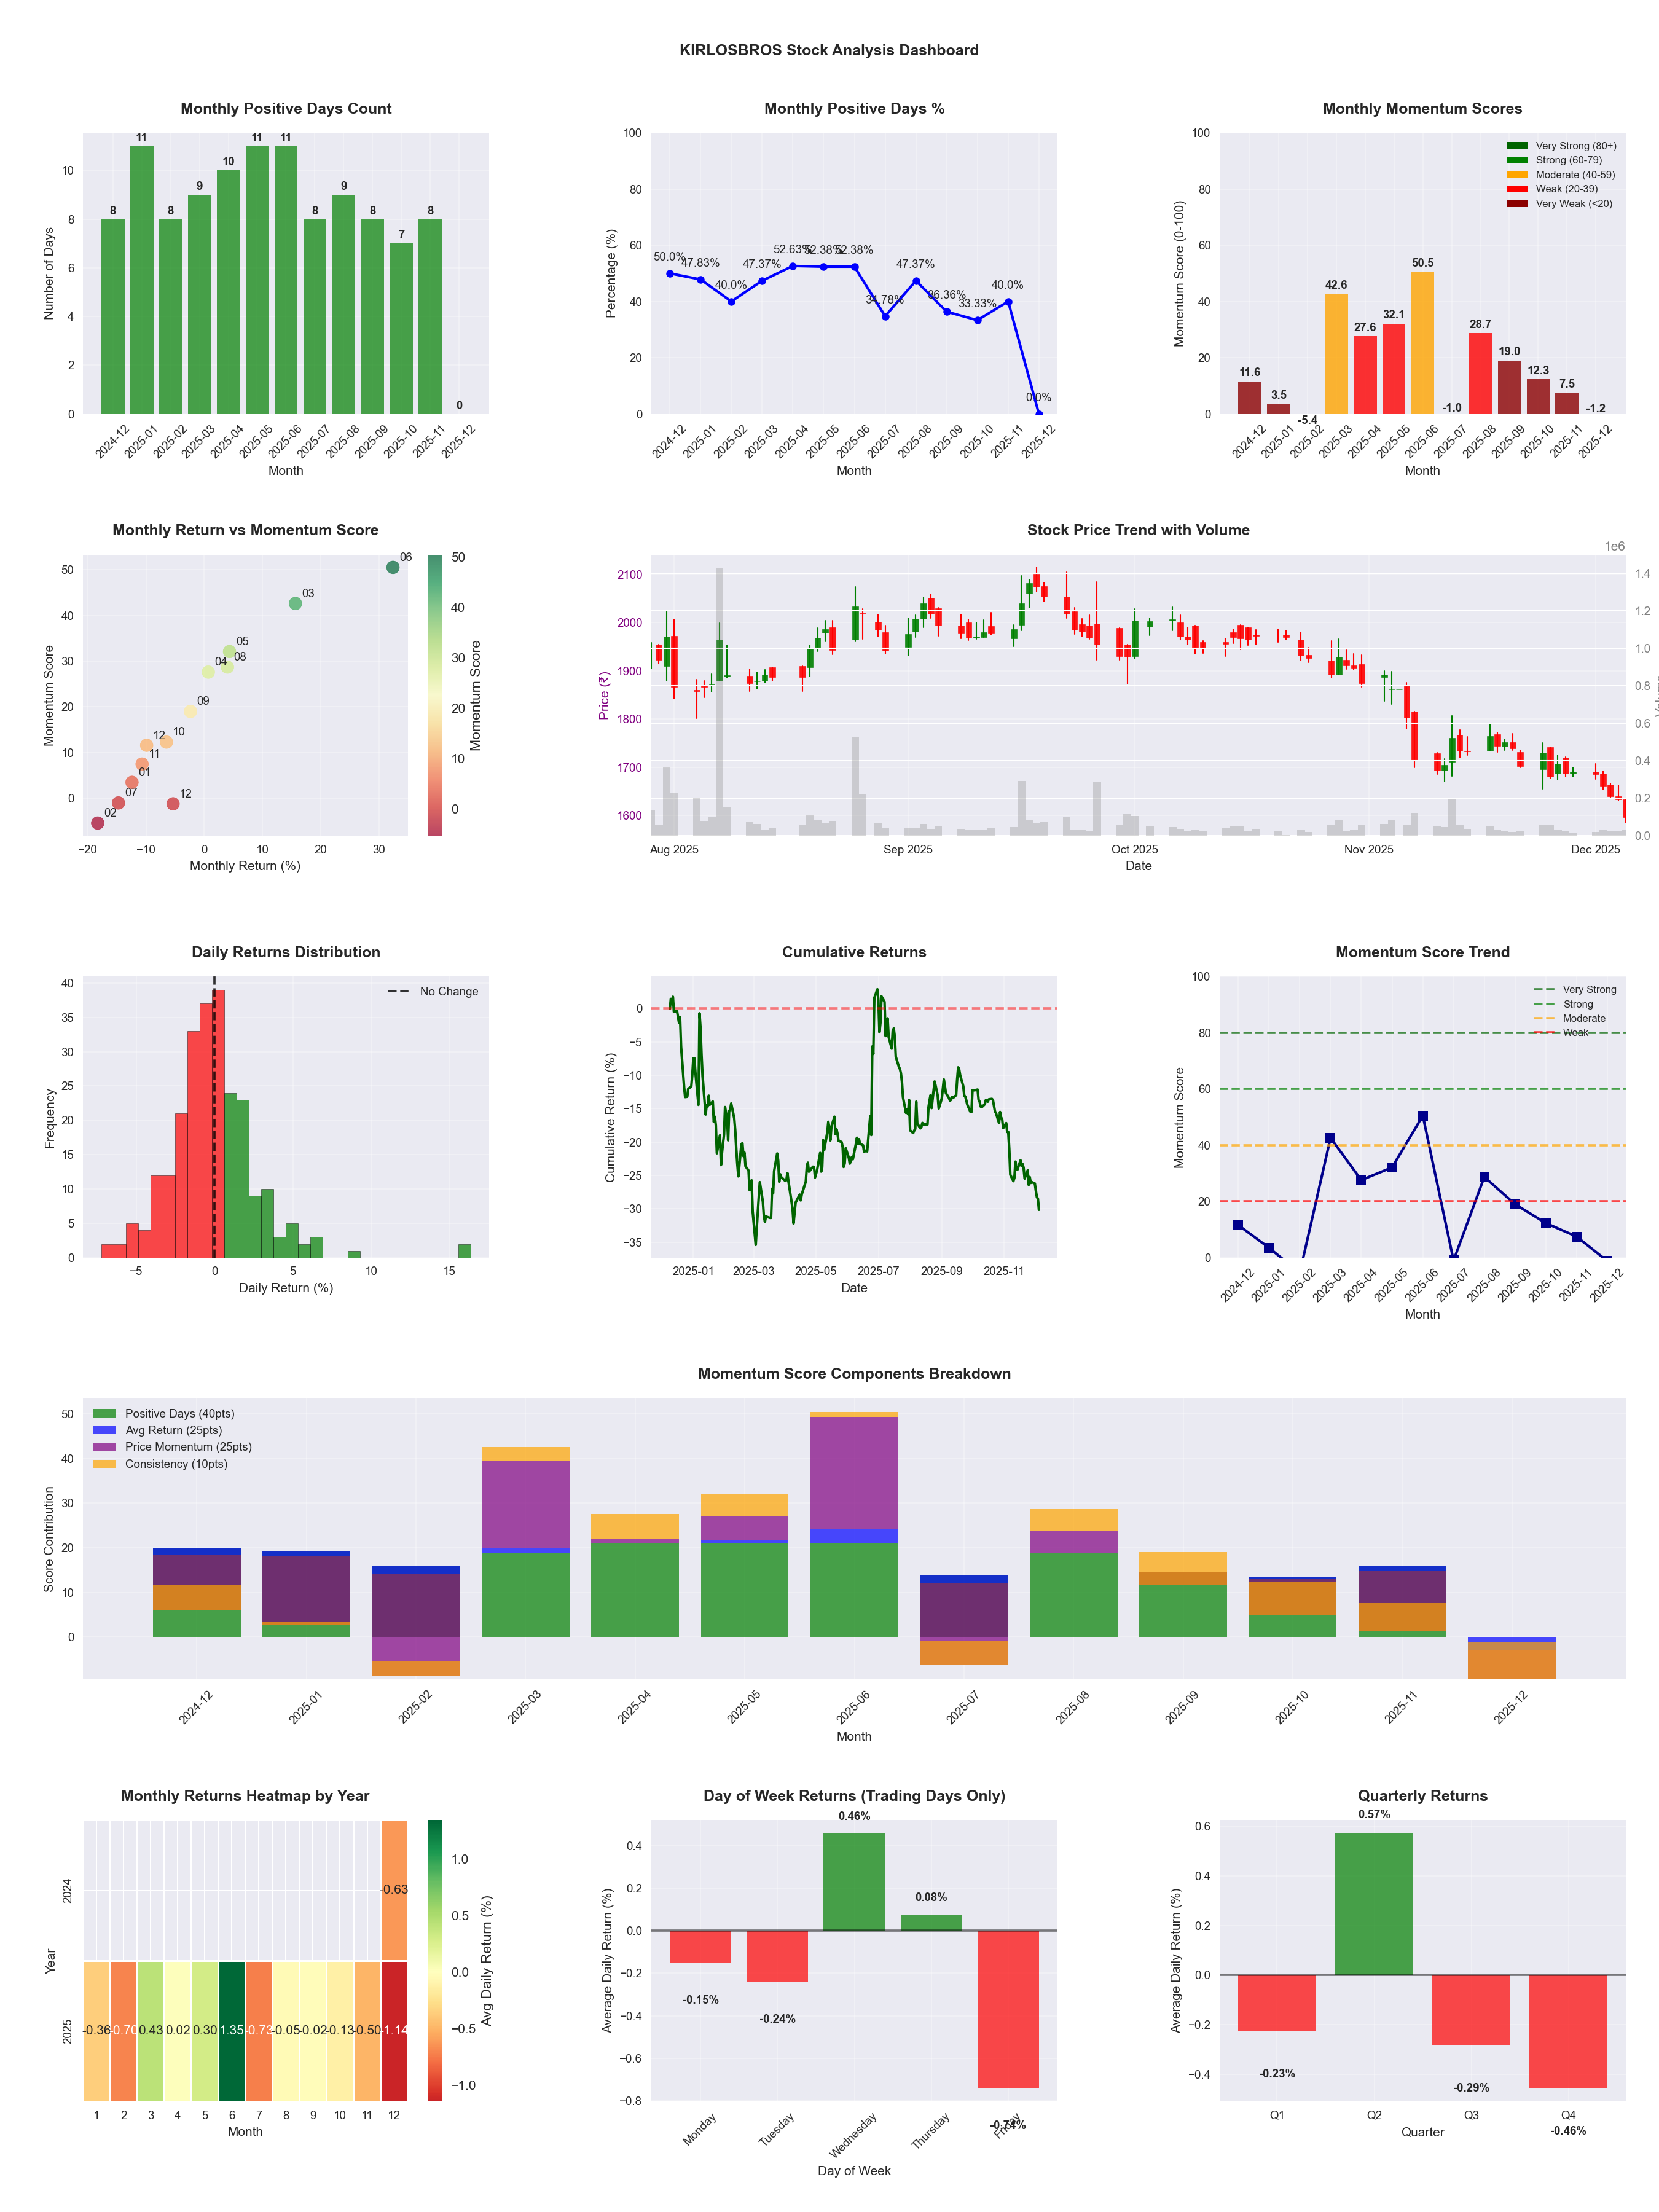
📊 Key Insights & Metrics
Symbol
📈 KIRLOSBROS
Date
📅 2026-04-11
Volatility
🟡 2.58%
Risk Profile
⚠️ suitable for aggressive investors
Win Rate
⚠️ 44.7%
Avg Daily Return
📈 +0.02%
Max Drawdown
📉 -43.00%
IBD RS Score
📊 36.7
Weak
Market Rank
#312
Best Month
🏆 2026-04
Best Months to Trade
📅 Jun, Apr, May
Best Days to Trade
📅 Wednesday, Monday
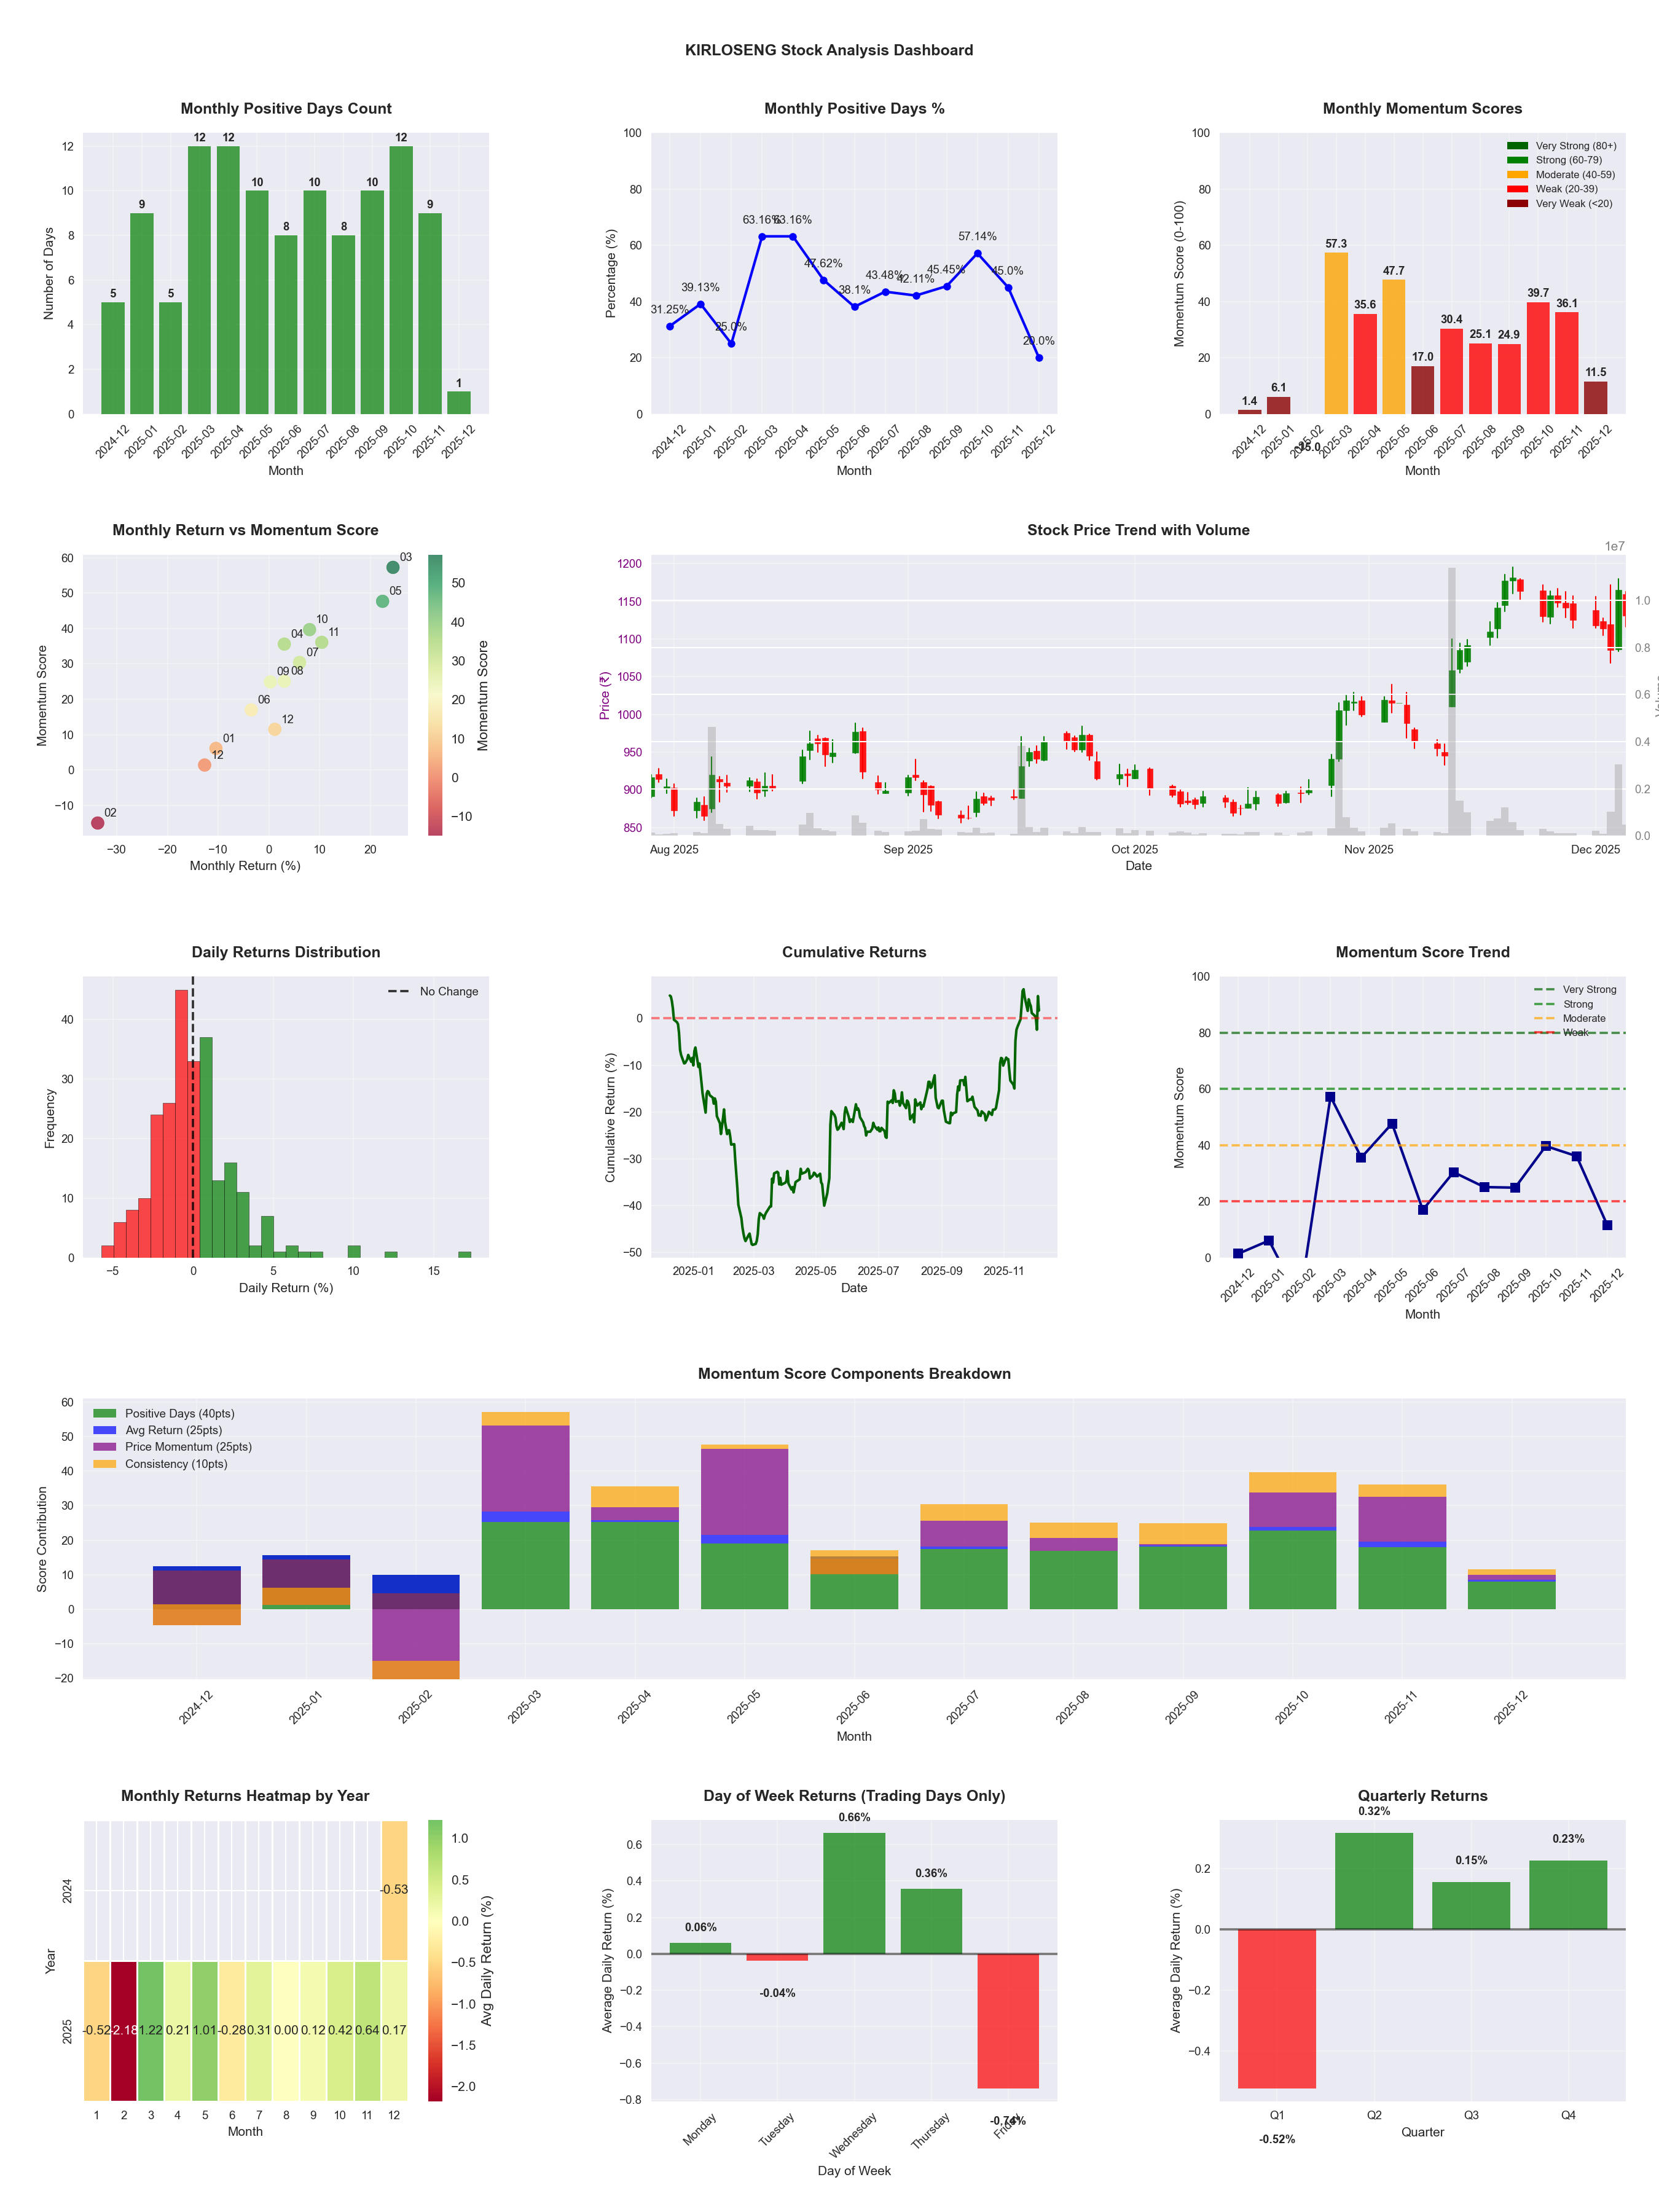
📊 Key Insights & Metrics
Symbol
📈 KIRLOSENG
Date
📅 2026-04-11
Volatility
🟡 2.69%
Risk Profile
⚠️ suitable for aggressive investors
Win Rate
⚠️ 49.0%
Avg Daily Return
📈 +0.33%
Max Drawdown
📉 -16.59%
IBD RS Score
📊 98.4
Leader
Market Rank
#8
Best Month
🏆 2026-02
Worst Month
📉 2026-03
Best Months to Trade
📅 May, Feb, Apr
Best Days to Trade
📅 Wednesday, Thursday
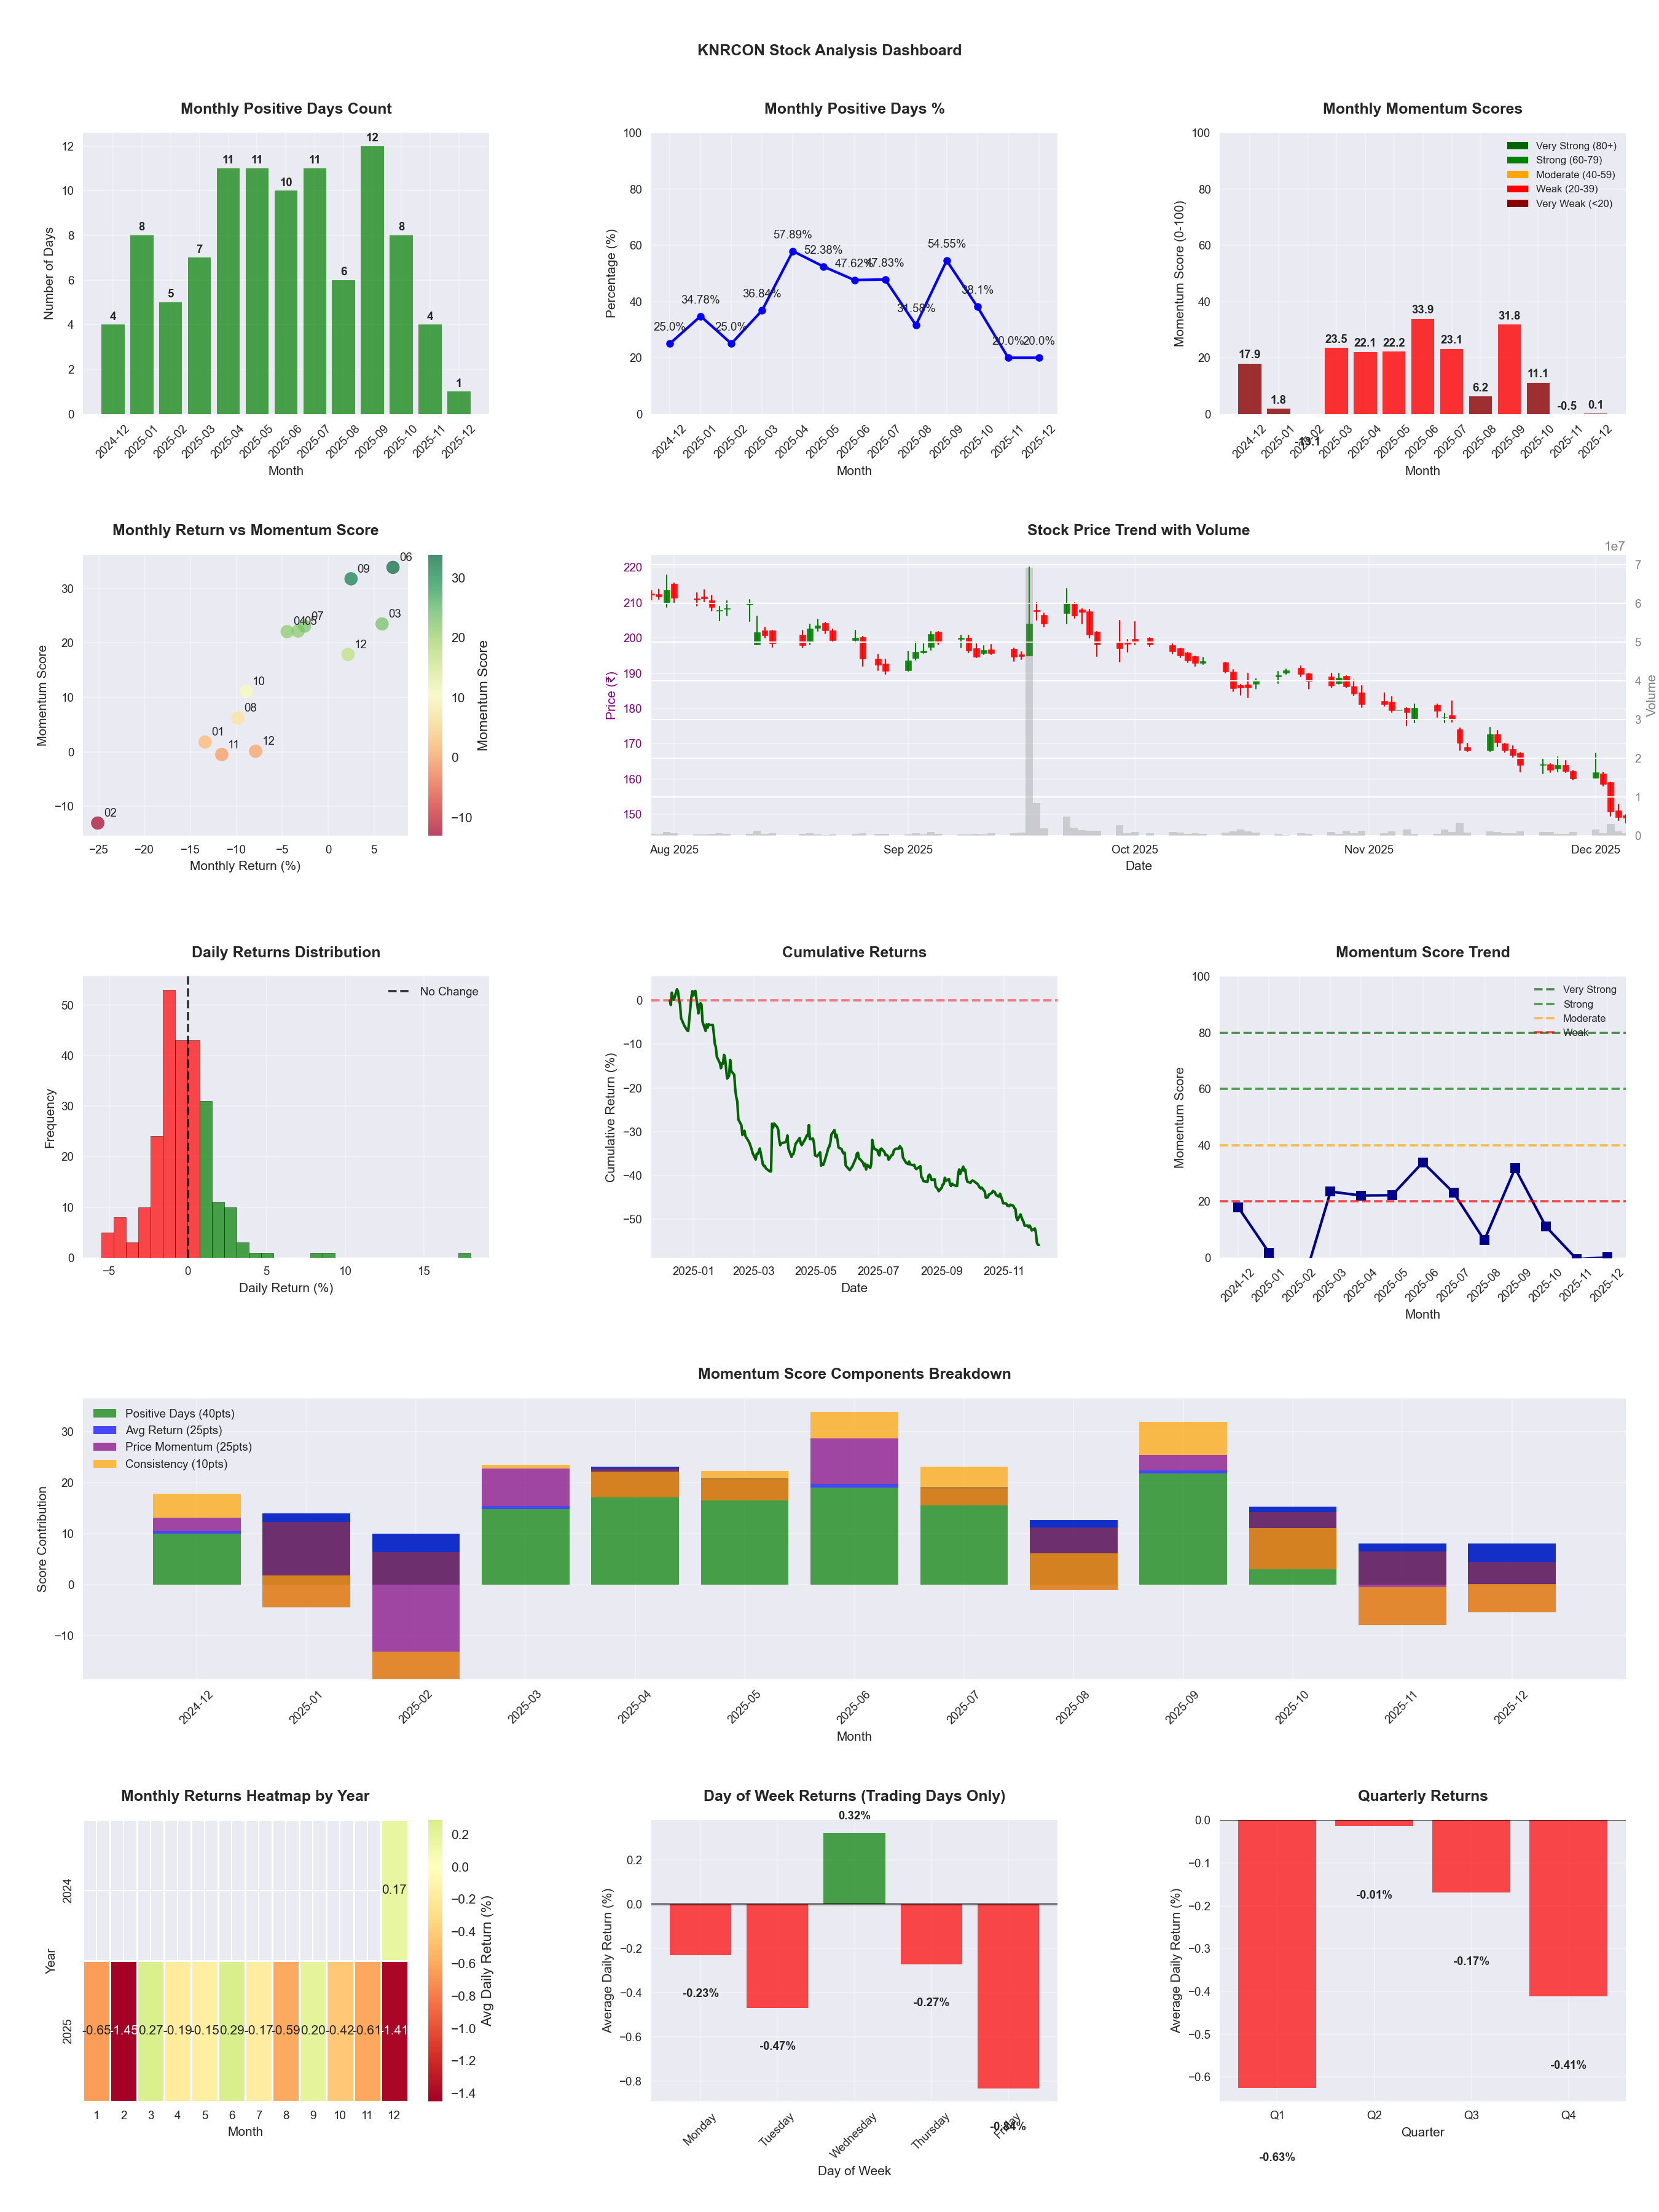
📊 Key Insights & Metrics
Symbol
📈 KNRCON
Date
📅 2026-03-21
Volatility
🟡 2.15%
Risk Profile
⚠️ suitable for aggressive investors
Win Rate
⚠️ 40.1%
Avg Daily Return
📉 -0.27%
Max Drawdown
📉 -51.22%
Best Month
🏆 2025-06
Best Months to Trade
📅 Jun, Sep, Dec
Best Days to Trade
📅 Wednesday, Monday
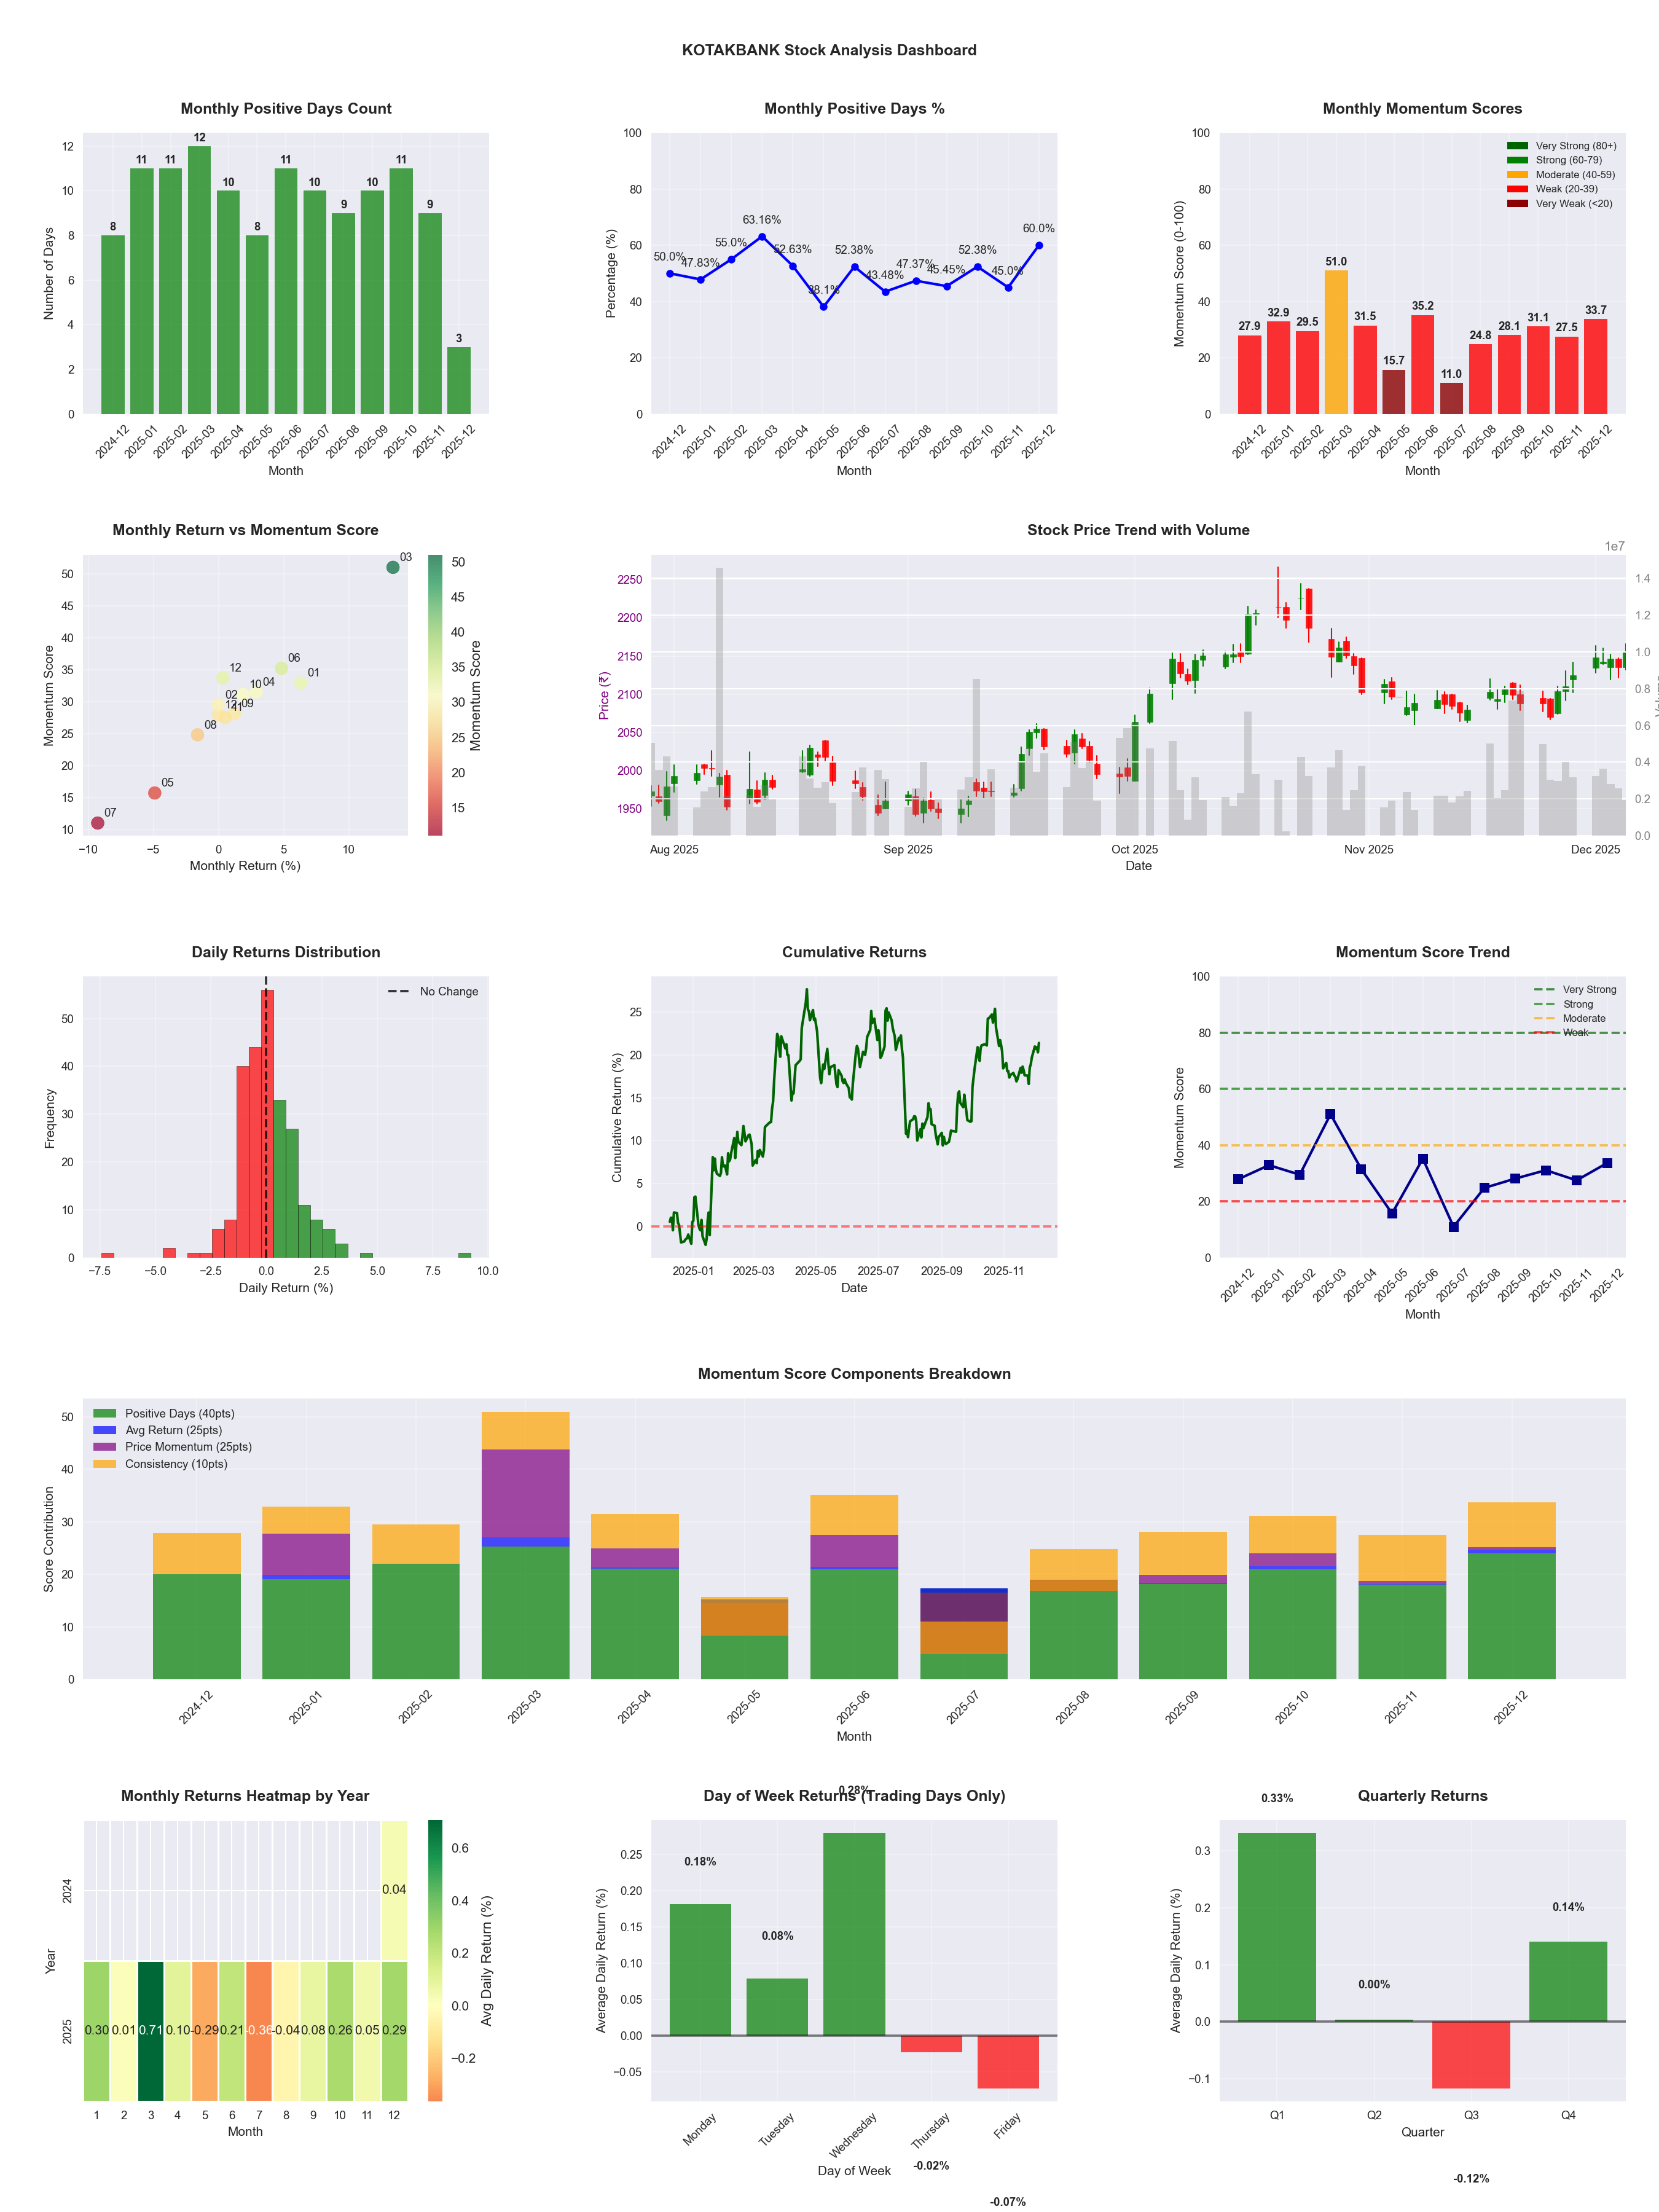
📊 Key Insights & Metrics
Symbol
📈 KOTAKBANK
Date
📅 2026-04-11
Volatility
🟢 1.35%
Win Rate
⚠️ 46.3%
Avg Daily Return
📉 -0.04%
Max Drawdown
📉 -22.03%
IBD RS Score
📊 30.8
Weak
Market Rank
#341
Best Month
🏆 2026-04
Worst Month
📉 2026-03
Best Months to Trade
📅 Apr, Oct, Jun
Best Days to Trade
📅 Wednesday, Tuesday
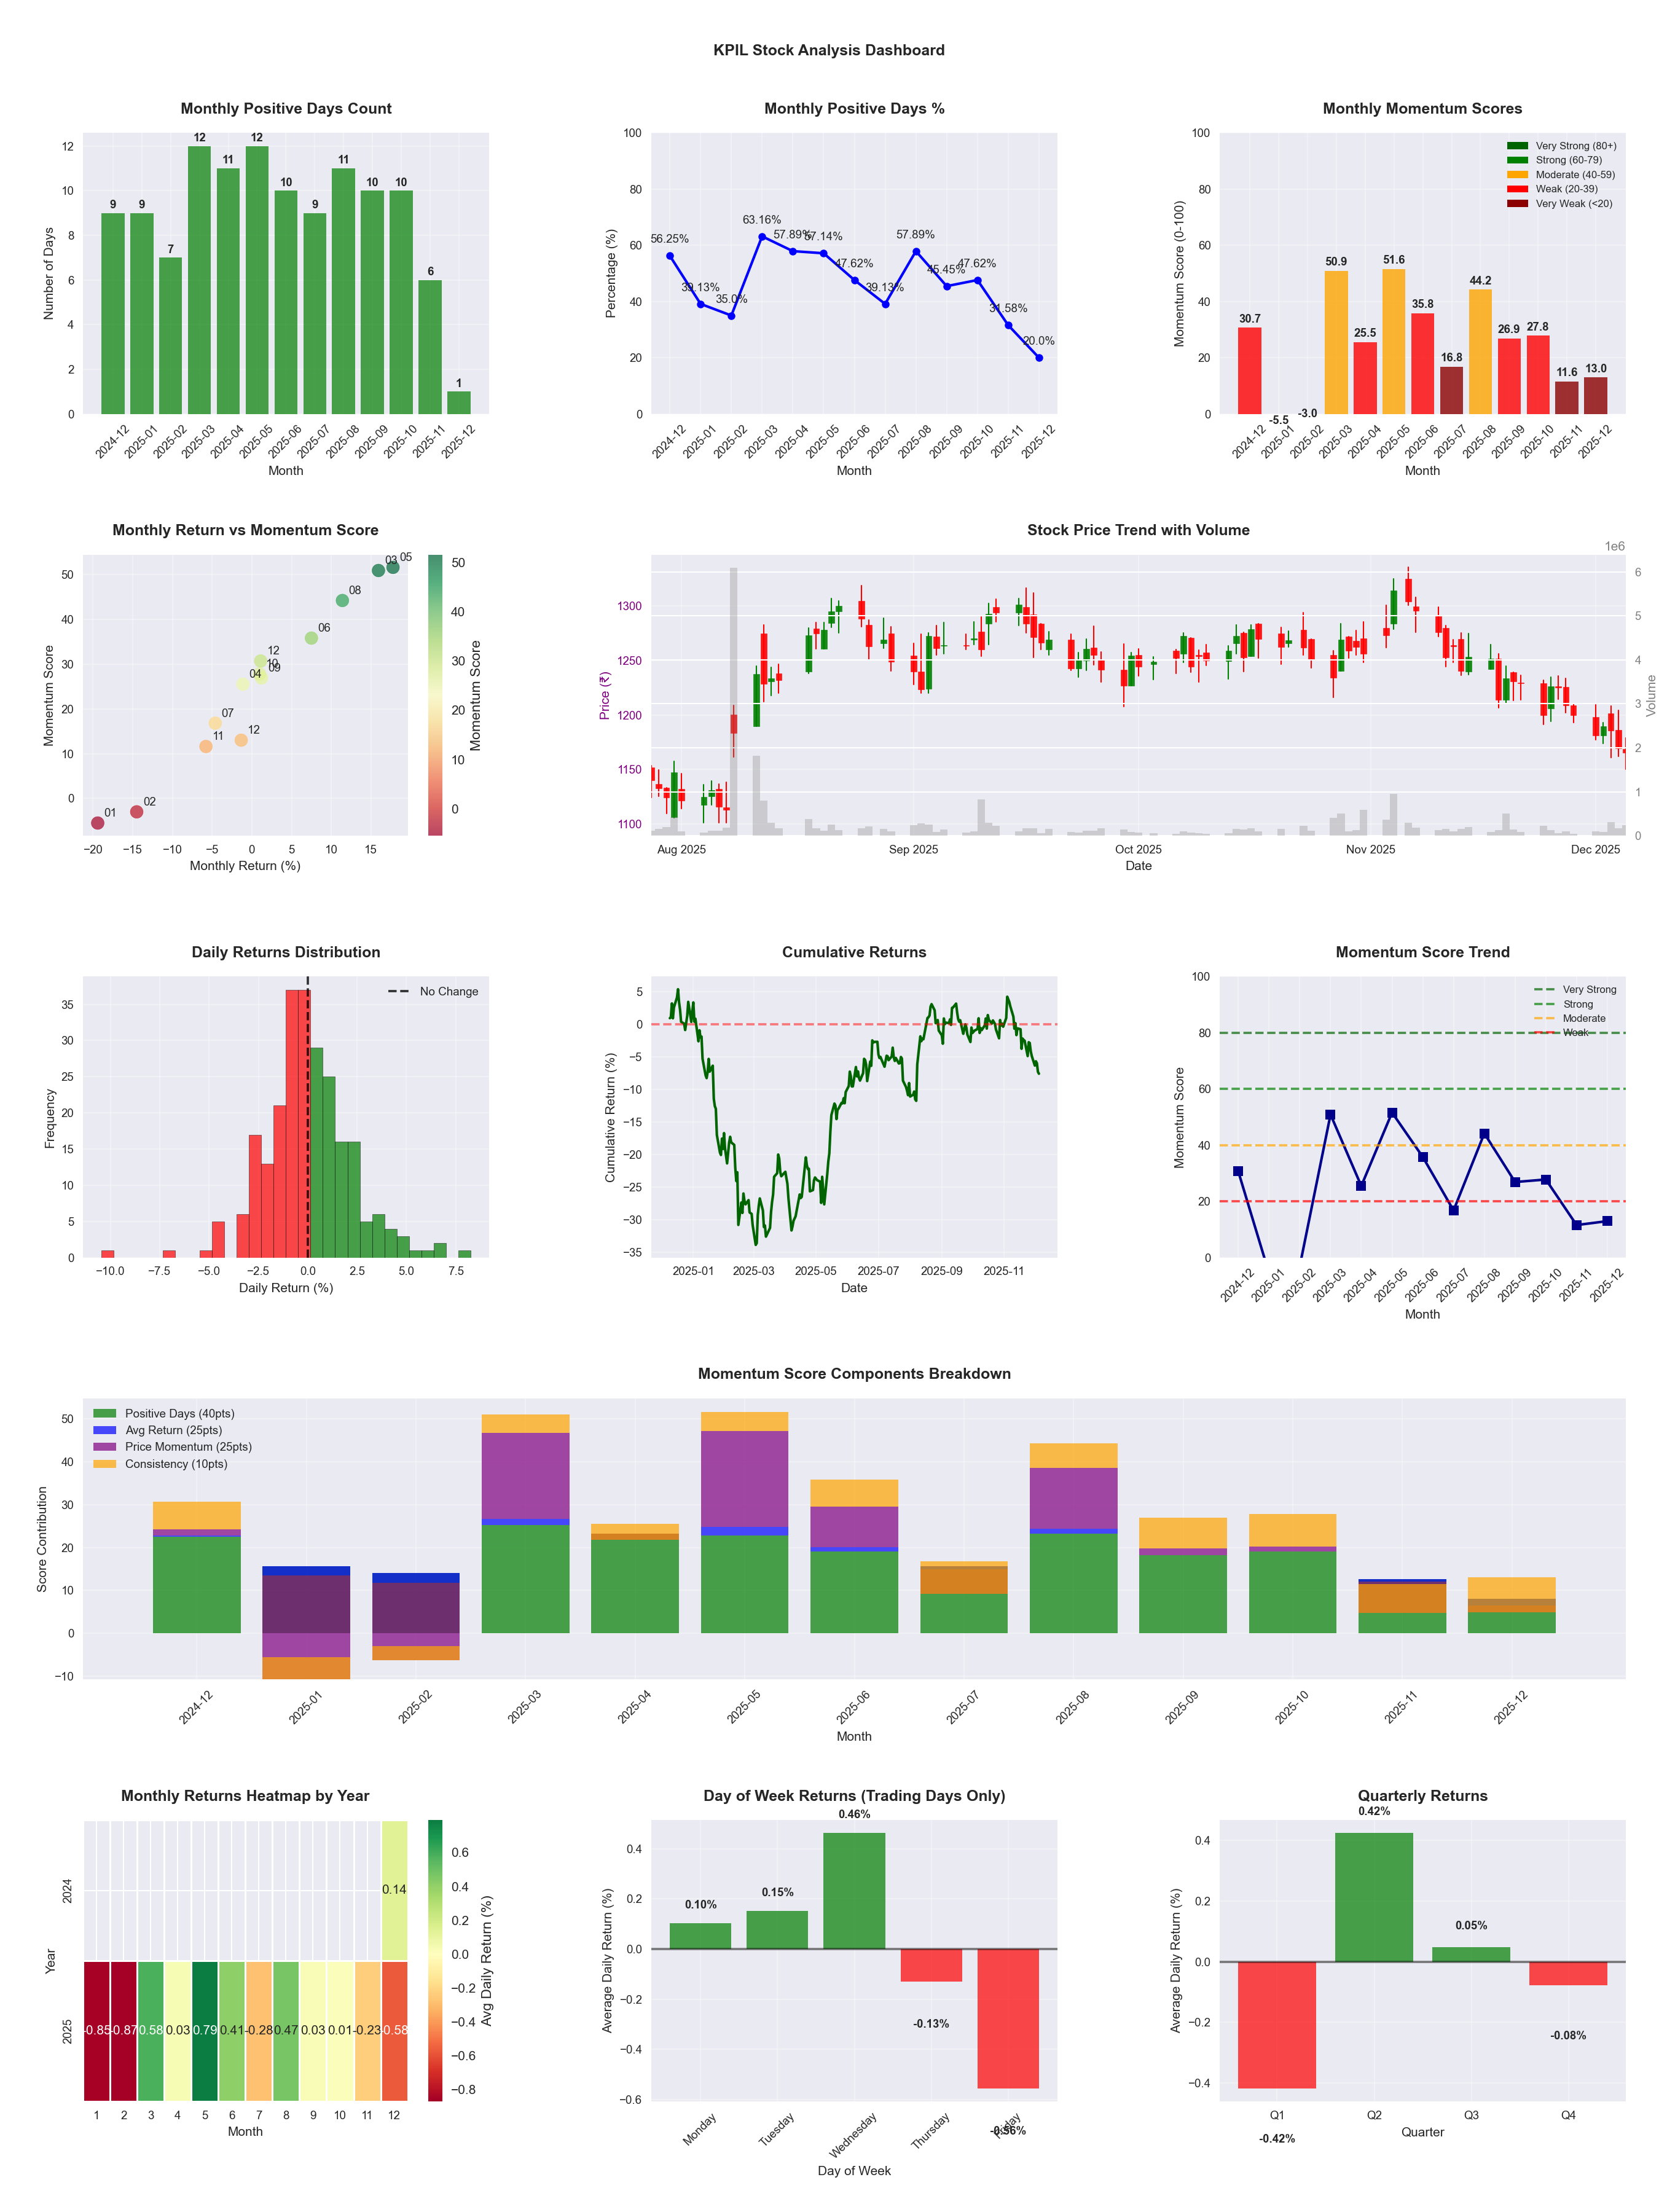
📊 Key Insights & Metrics
Symbol
📈 KPIL
Date
📅 2026-04-11
Volatility
🟡 2.04%
Risk Profile
⚠️ suitable for aggressive investors
Win Rate
⚠️ 48.2%
Avg Daily Return
📈 +0.14%
Max Drawdown
📉 -22.55%
IBD RS Score
📊 73.0
Strong
Market Rank
#133
Best Month
🏆 2026-04
Worst Month
📉 2026-03
Best Months to Trade
📅 Apr, May, Aug
Best Days to Trade
📅 Wednesday, Tuesday
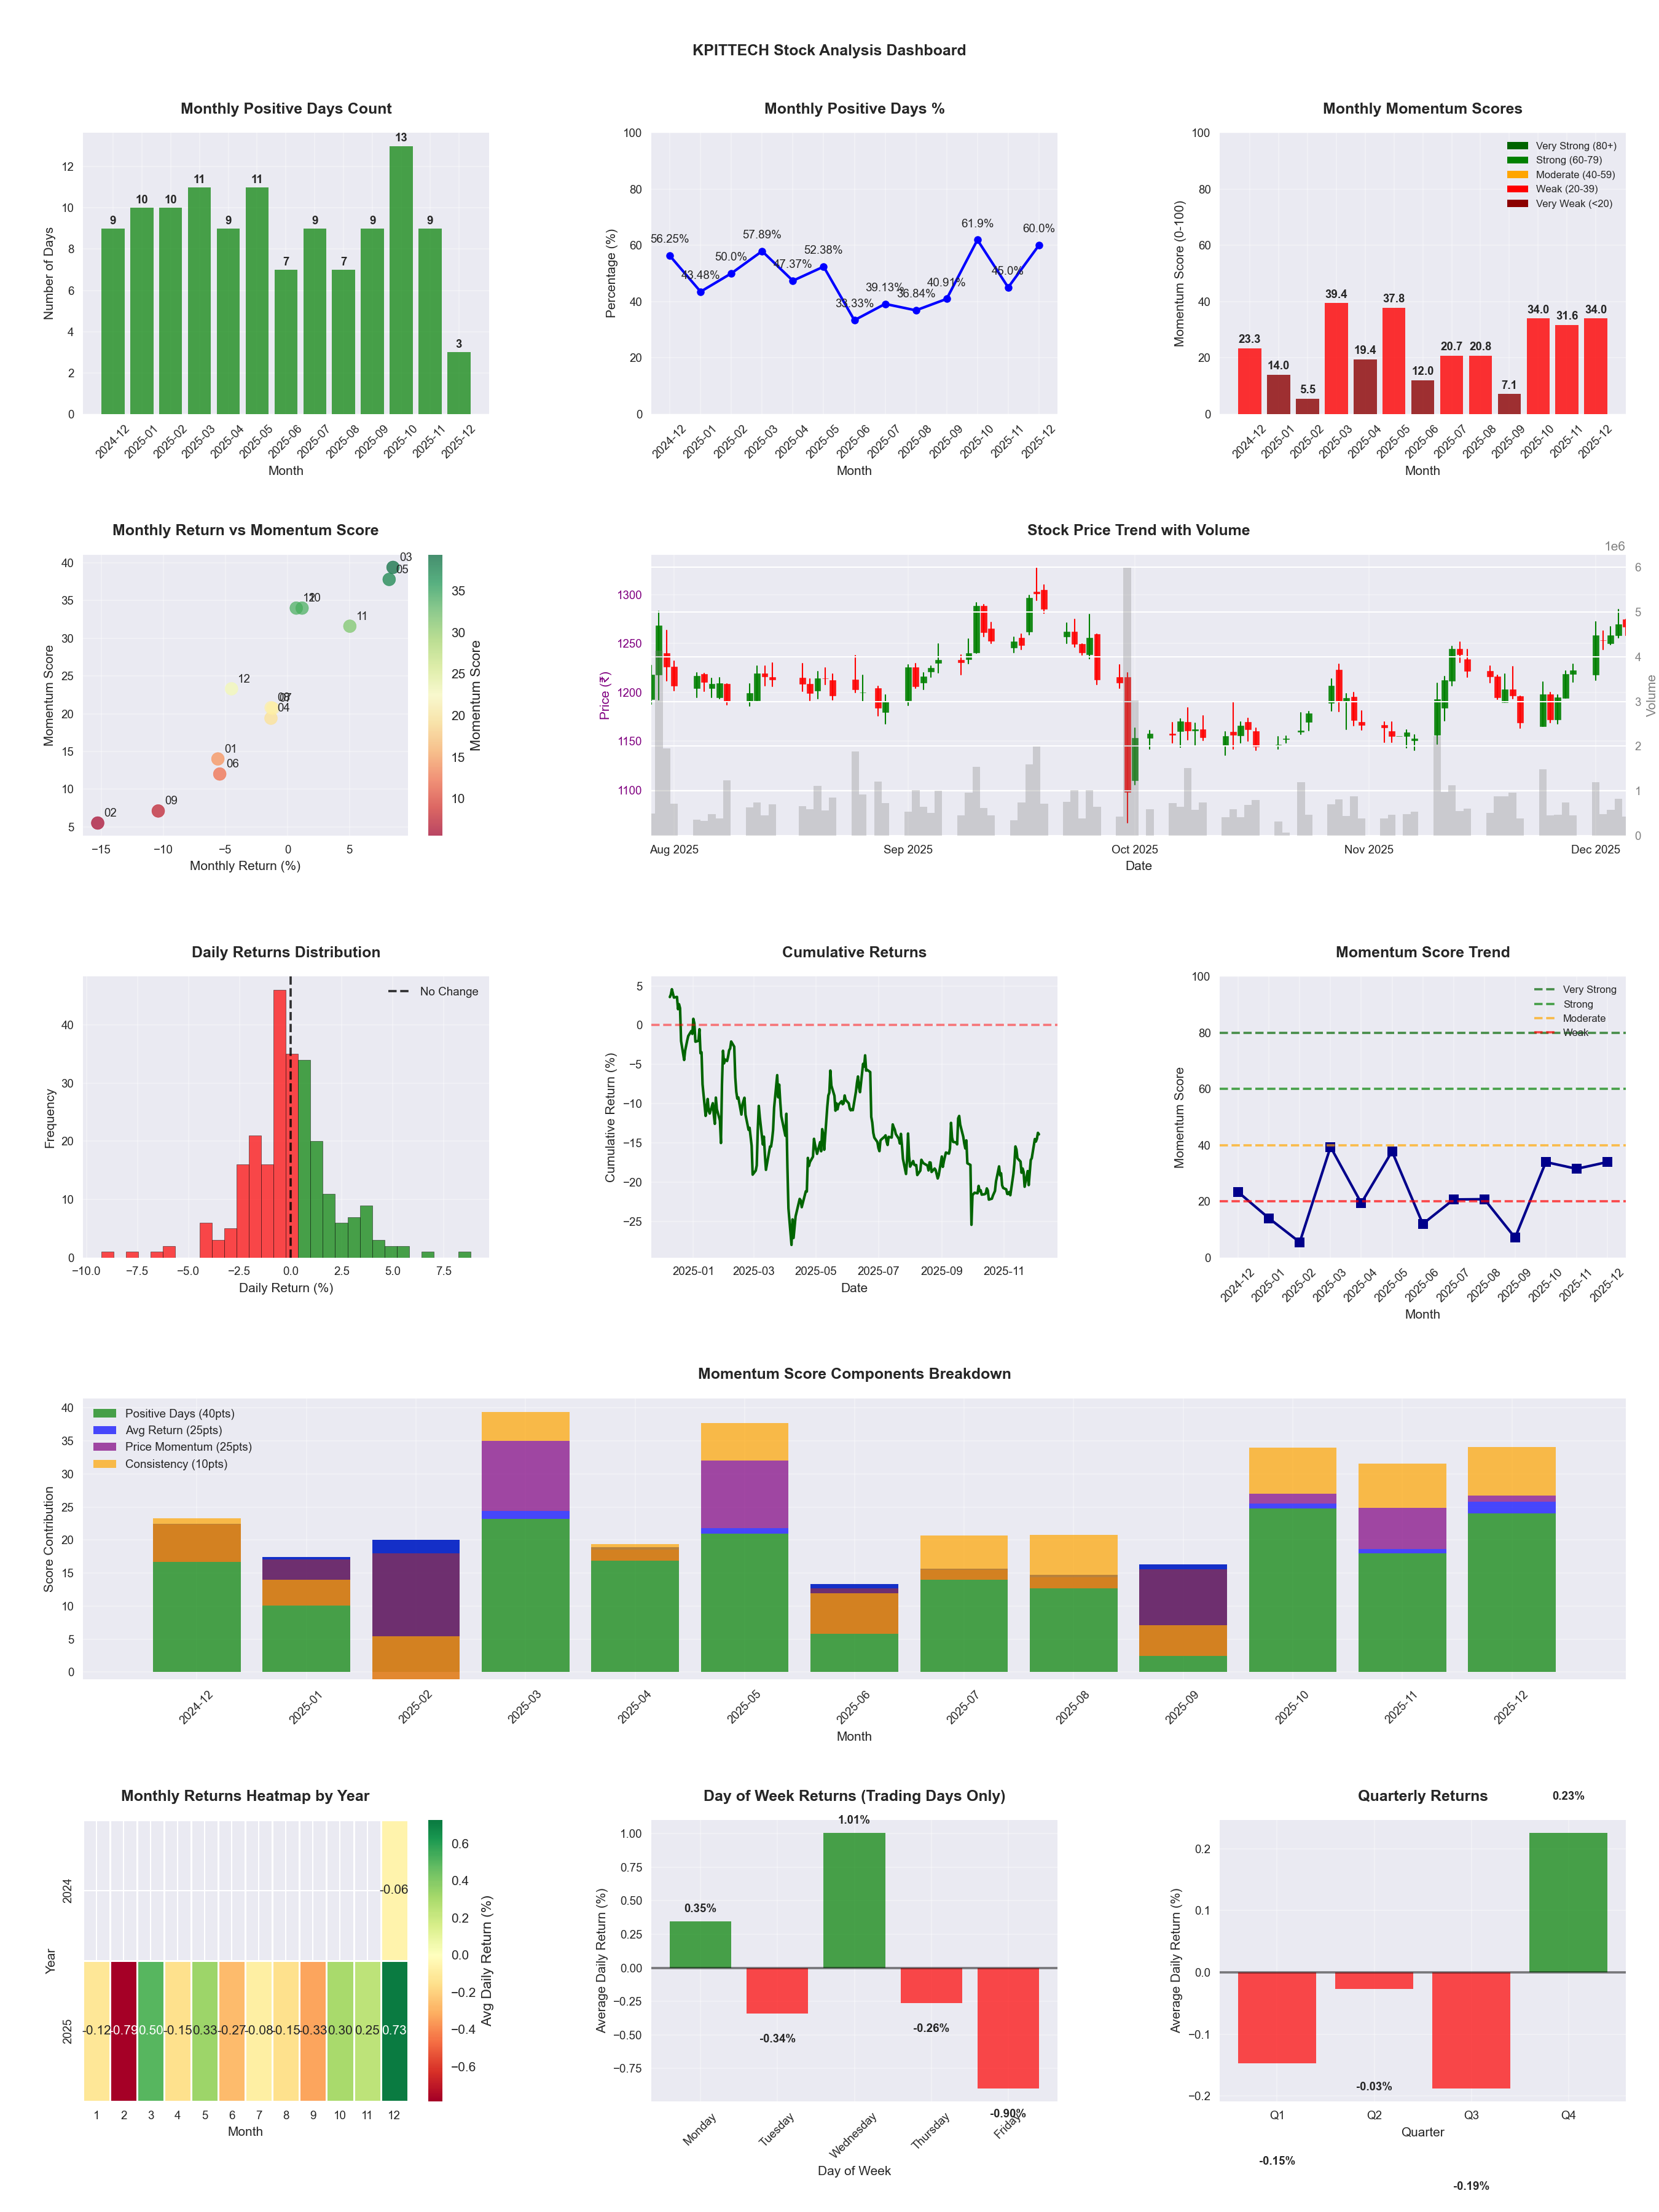
📊 Key Insights & Metrics
Symbol
📈 KPITTECH
Date
📅 2026-04-11
Volatility
🟡 2.11%
Risk Profile
⚠️ suitable for aggressive investors
Win Rate
⚠️ 42.3%
Avg Daily Return
📉 -0.16%
Max Drawdown
📉 -55.23%
IBD RS Score
📊 1.0
Weak
Market Rank
#488
Best Month
🏆 2026-04
Best Months to Trade
📅 Apr, May, Oct
Best Days to Trade
📅 Wednesday, Monday
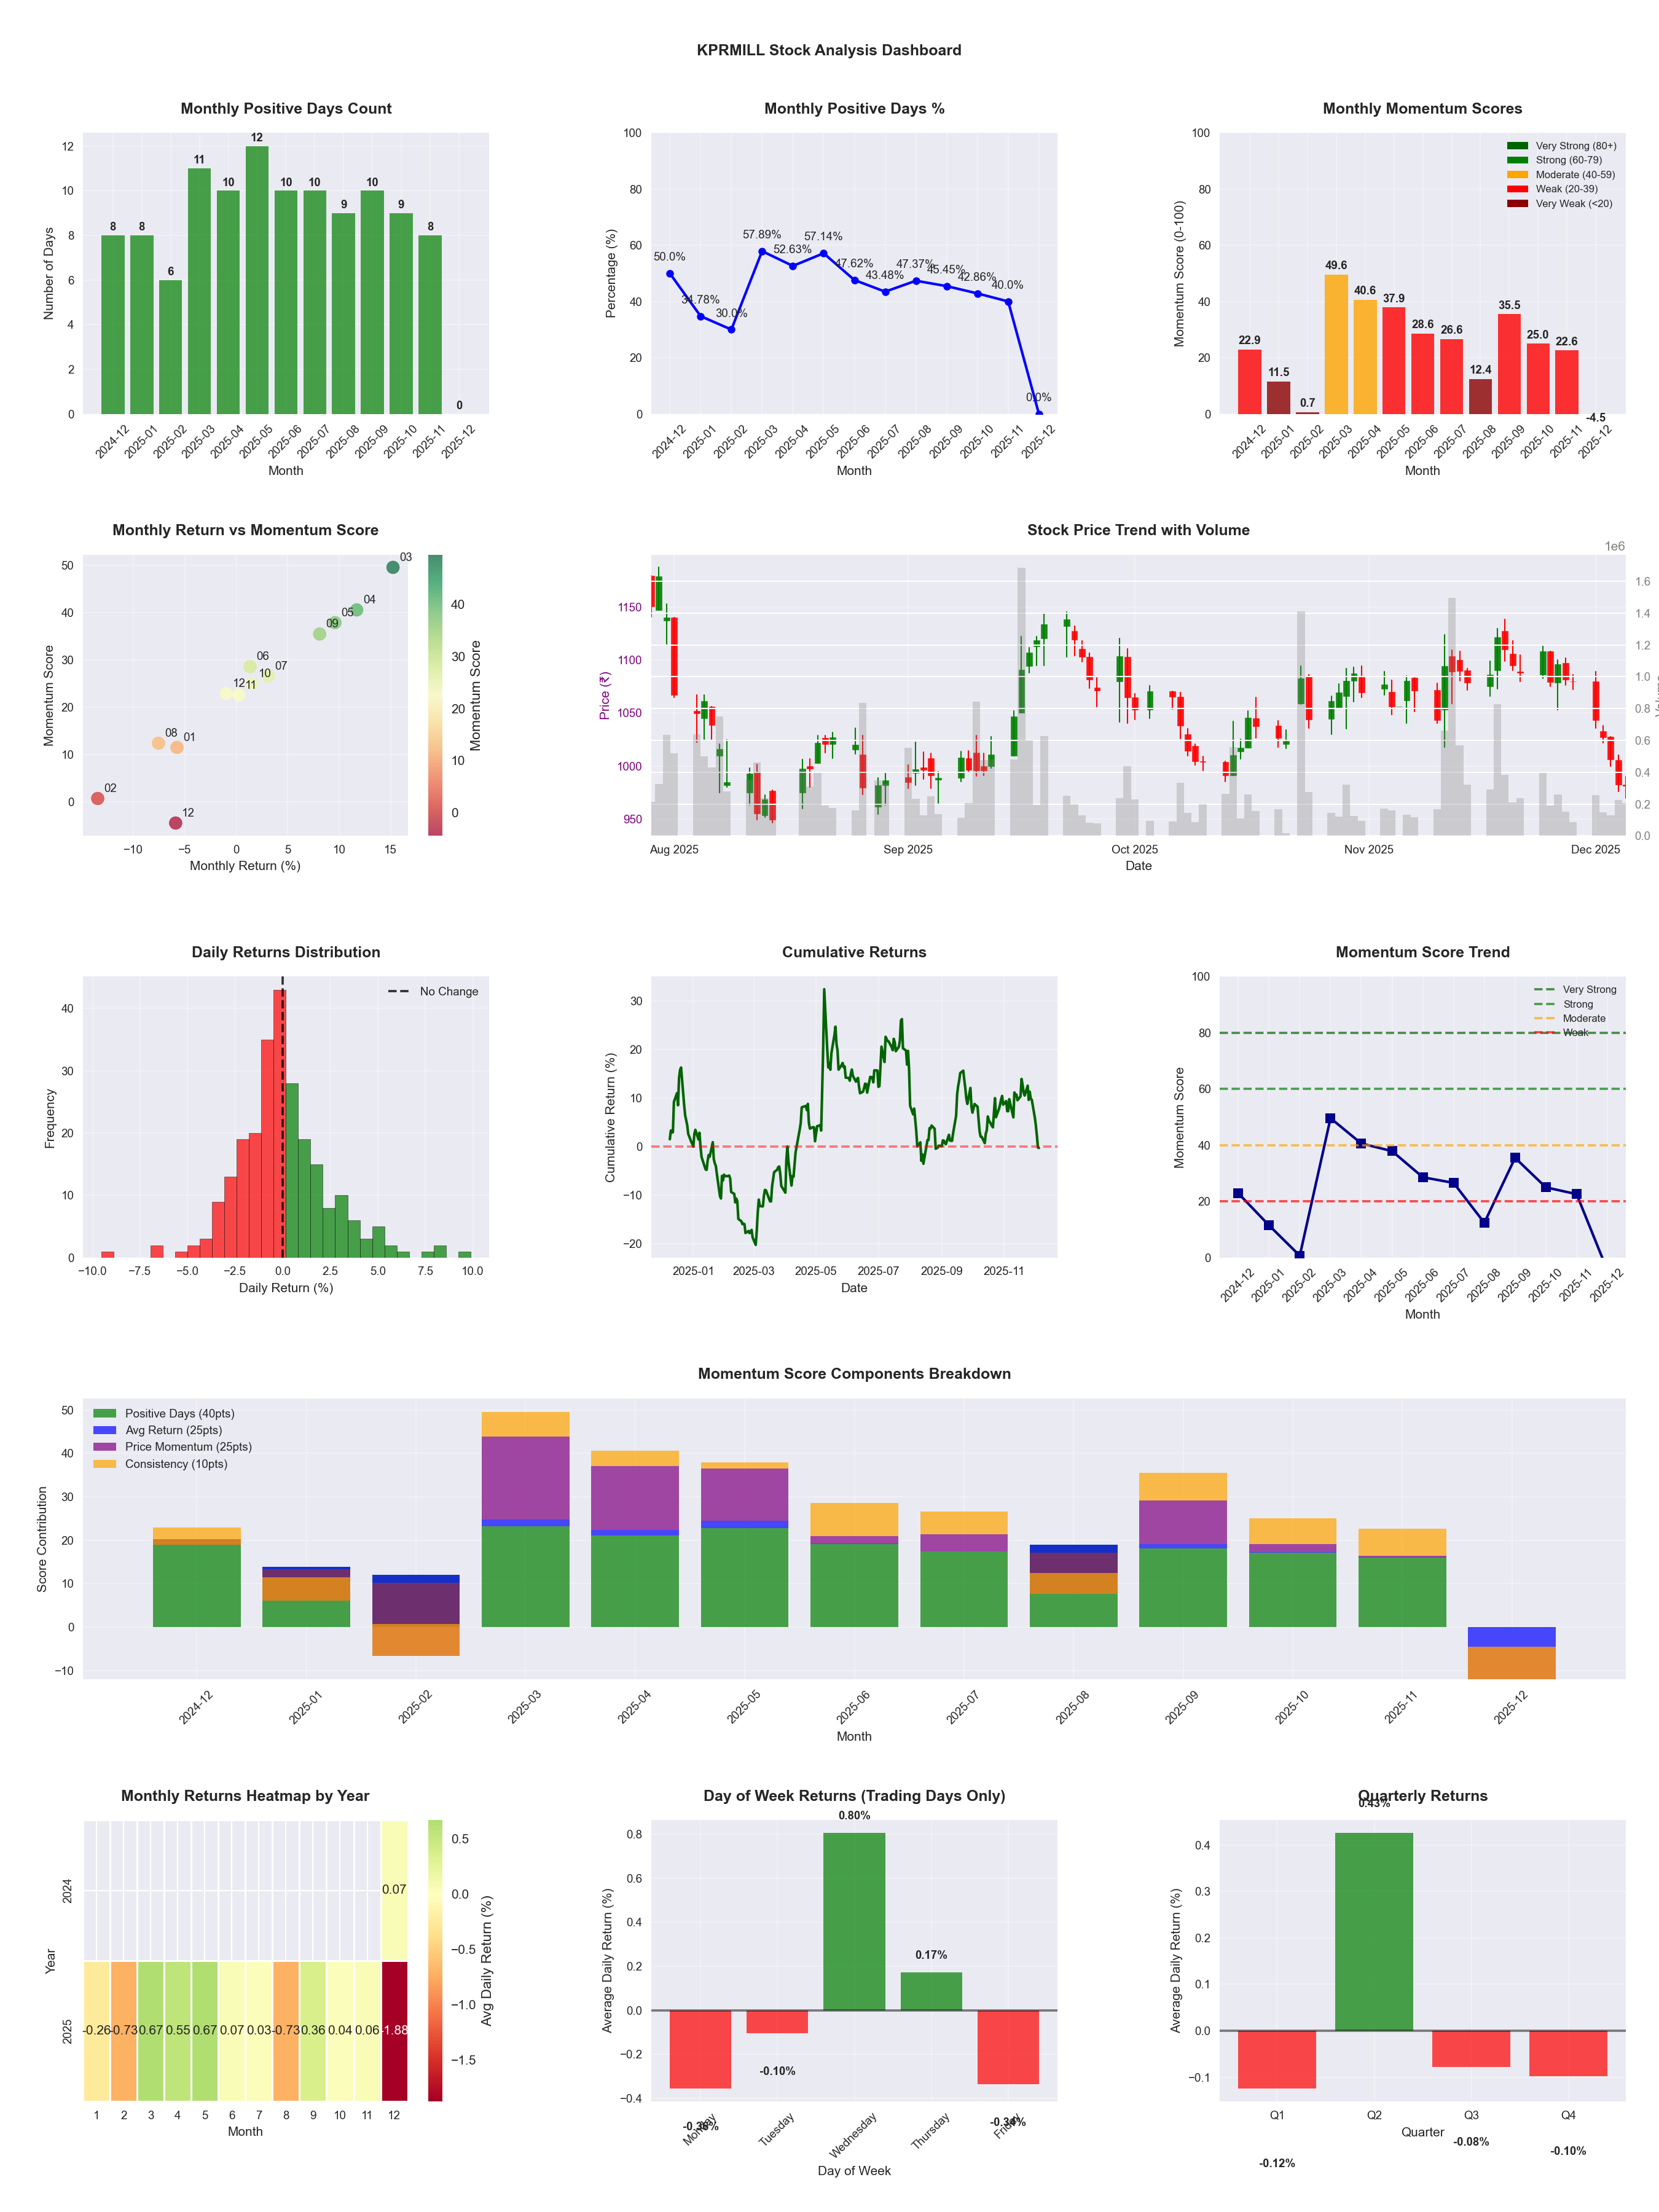
📊 Key Insights & Metrics
Symbol
📈 KPRMILL
Date
📅 2026-04-11
Volatility
🟡 2.68%
Risk Profile
⚠️ suitable for aggressive investors
Win Rate
⚠️ 44.3%
Avg Daily Return
📉 -0.01%
Max Drawdown
📉 -37.64%
IBD RS Score
📊 42.0
Weak
Market Rank
#286
Best Month
🏆 2025-05
Worst Month
📉 2025-12
Best Months to Trade
📅 May, Apr, Sep
Best Days to Trade
📅 Wednesday, Tuesday
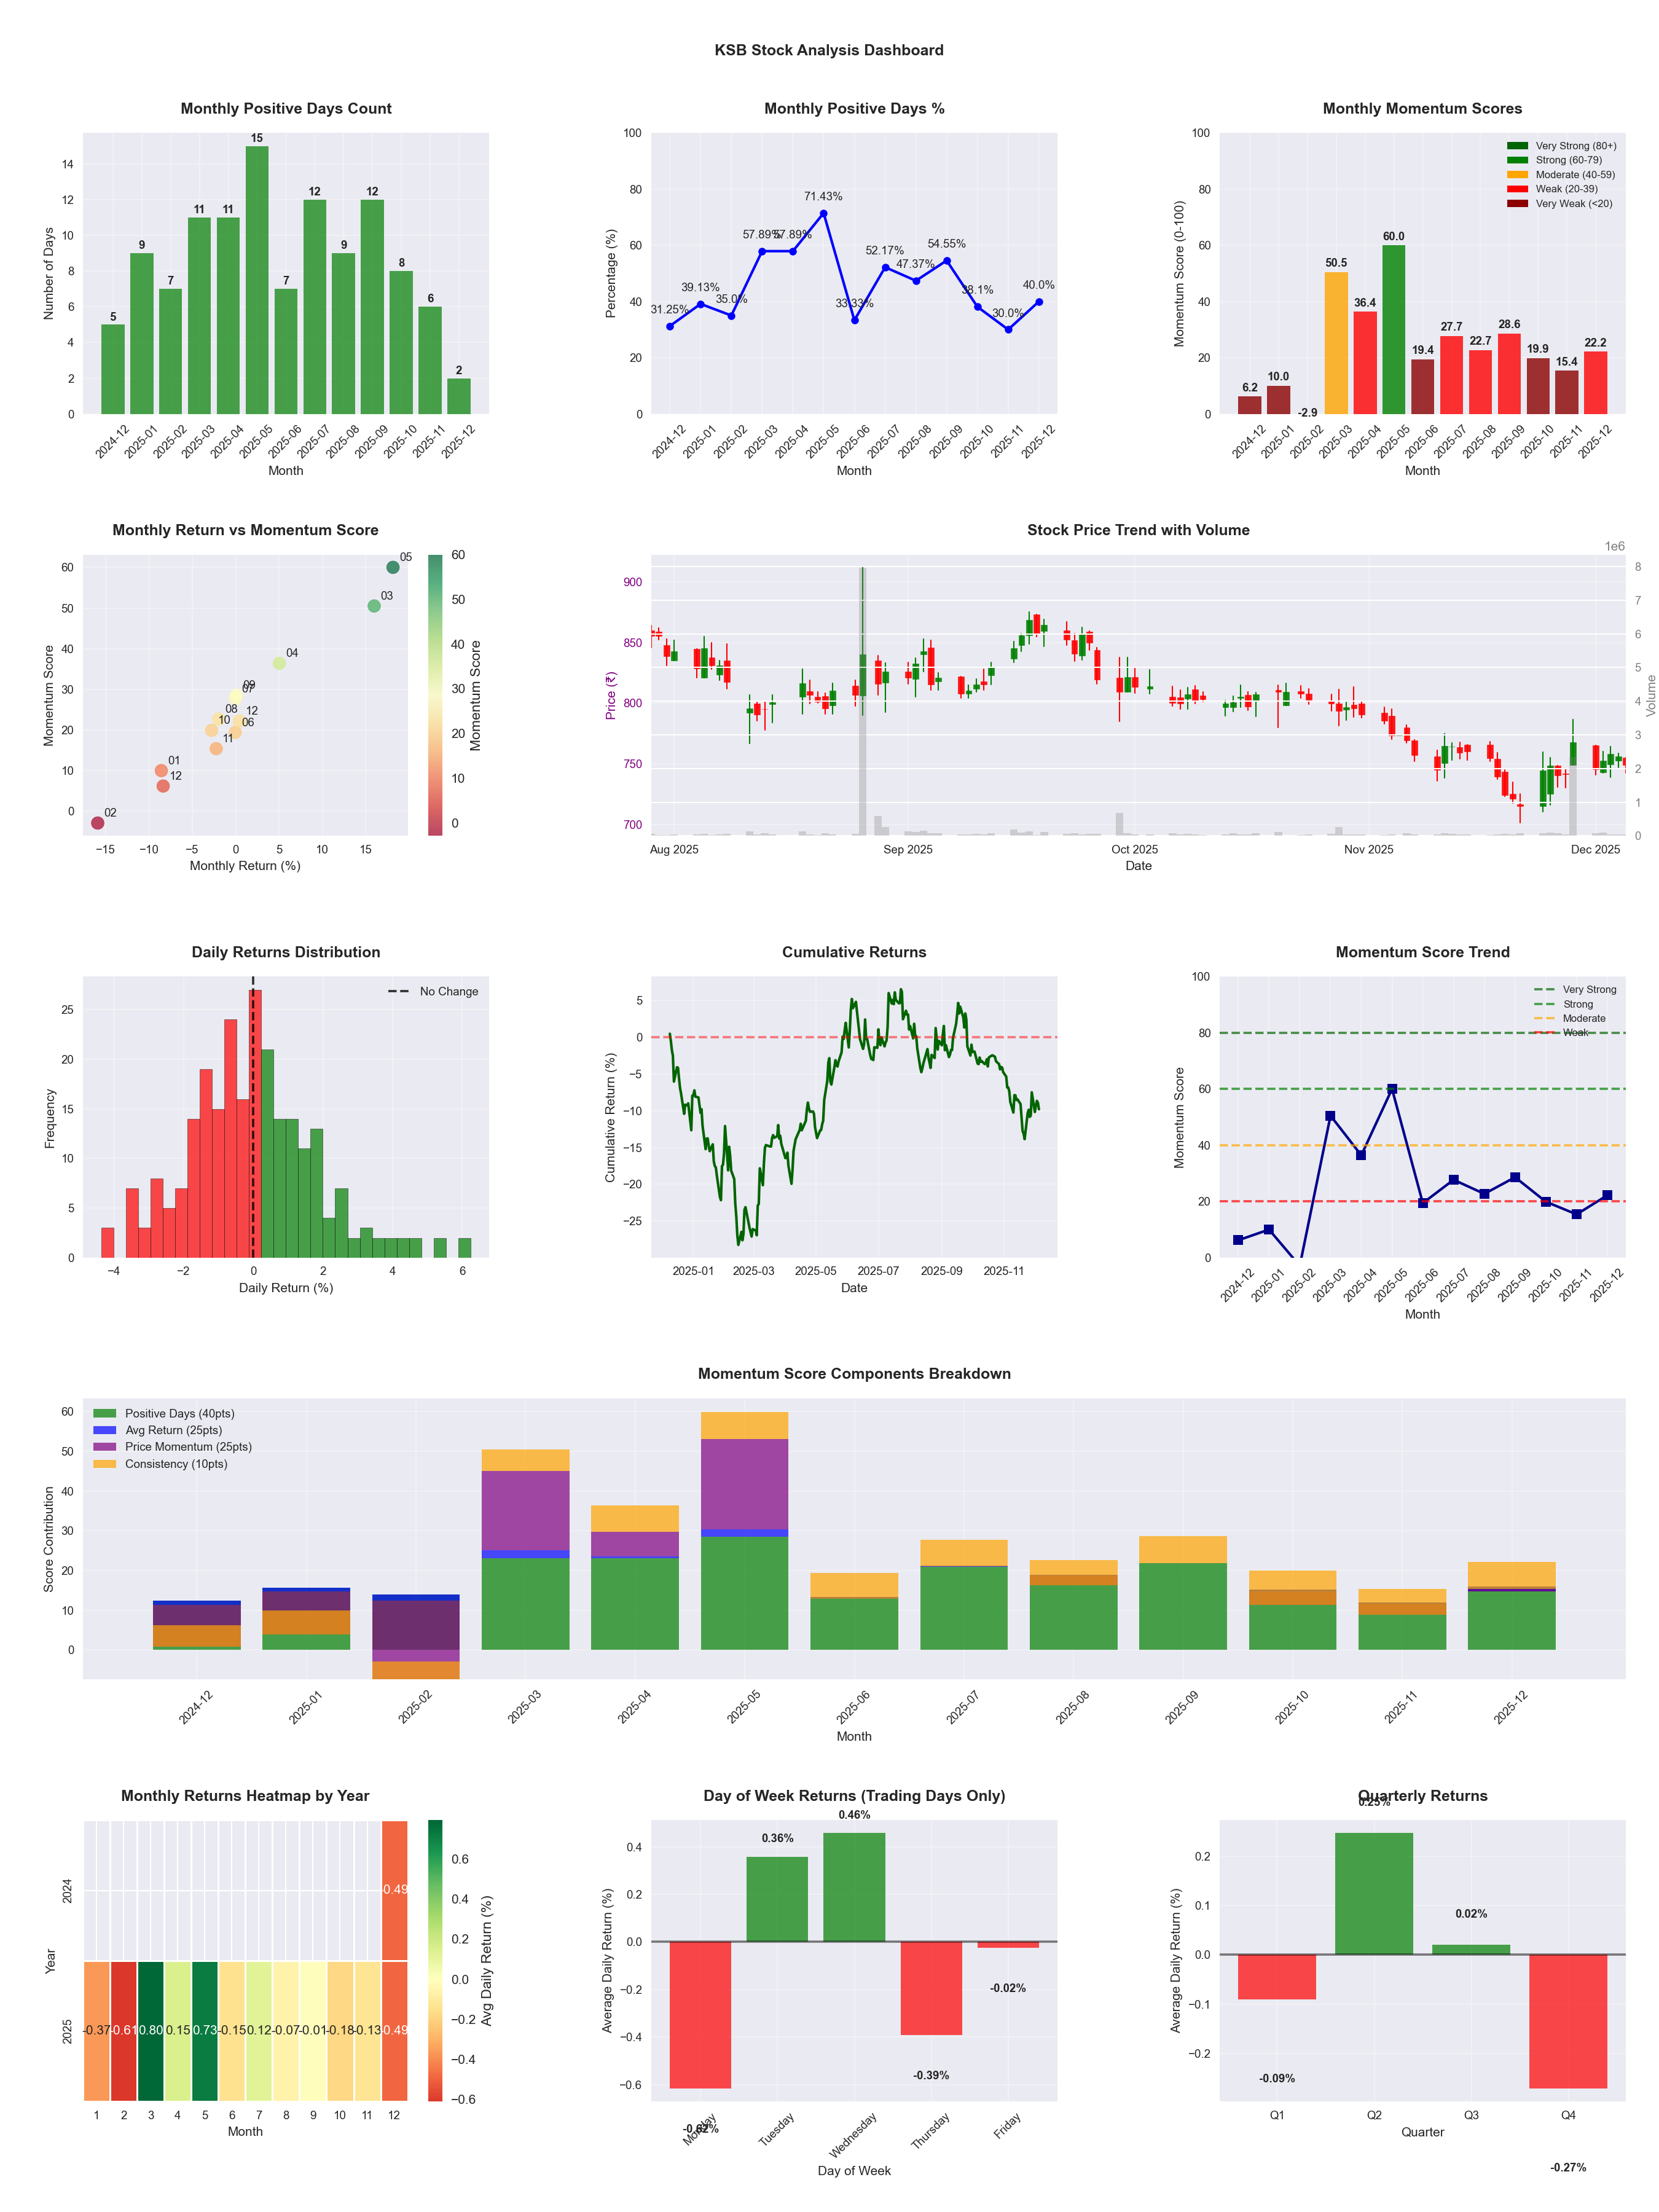
📊 Key Insights & Metrics
Symbol
📈 KSB
Date
📅 2026-04-11
Volatility
🟡 1.79%
Win Rate
⚠️ 49.6%
Avg Daily Return
📈 +0.11%
Max Drawdown
📉 -23.09%
IBD RS Score
📊 82.8
Strong
Market Rank
#85
Best Month
🏆 2025-05
Worst Month
📉 2025-11
Best Months to Trade
📅 Apr, May, Feb
Best Days to Trade
📅 Wednesday, Tuesday
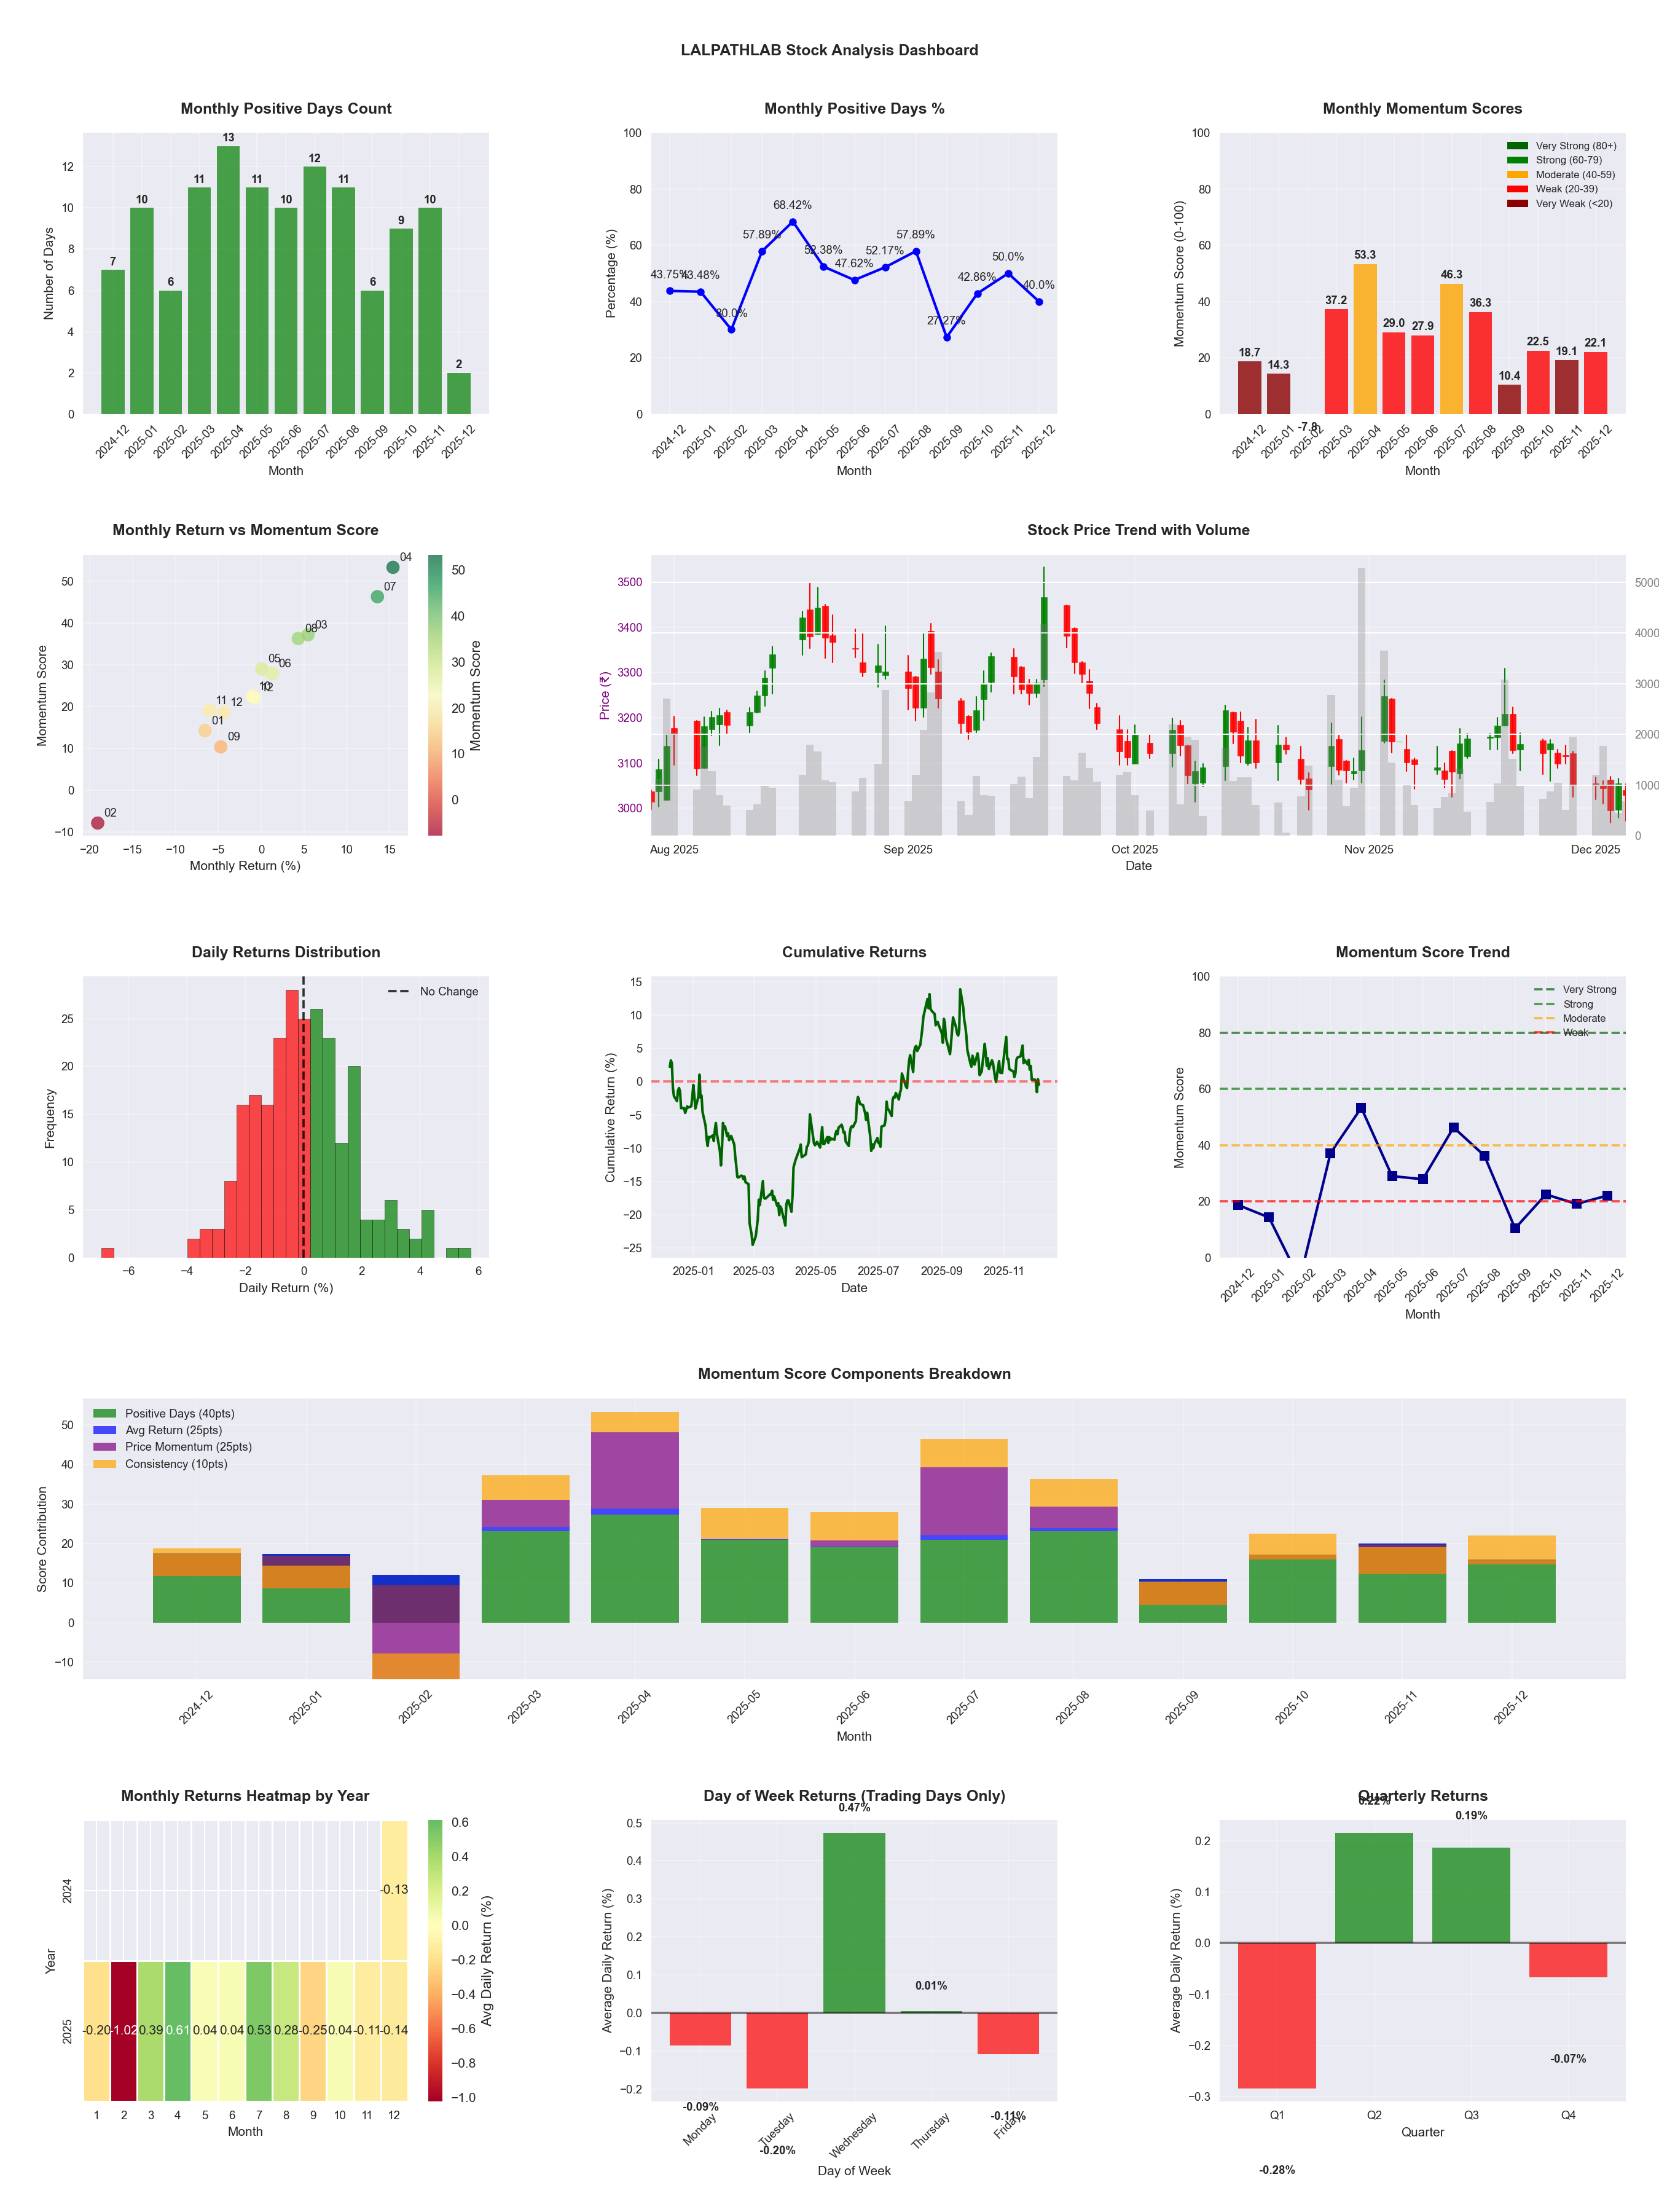
📊 Key Insights & Metrics
Symbol
📈 LALPATHLAB
Date
📅 2026-04-11
Volatility
🟡 1.52%
Win Rate
⚠️ 47.1%
Avg Daily Return
📈 +0.03%
Max Drawdown
📉 -24.35%
IBD RS Score
📊 58.0
Average
Market Rank
#207
Best Month
🏆 2026-04
Worst Month
📉 2025-09
Best Months to Trade
📅 Jul, Apr, Aug
Best Days to Trade
📅 Wednesday, Tuesday
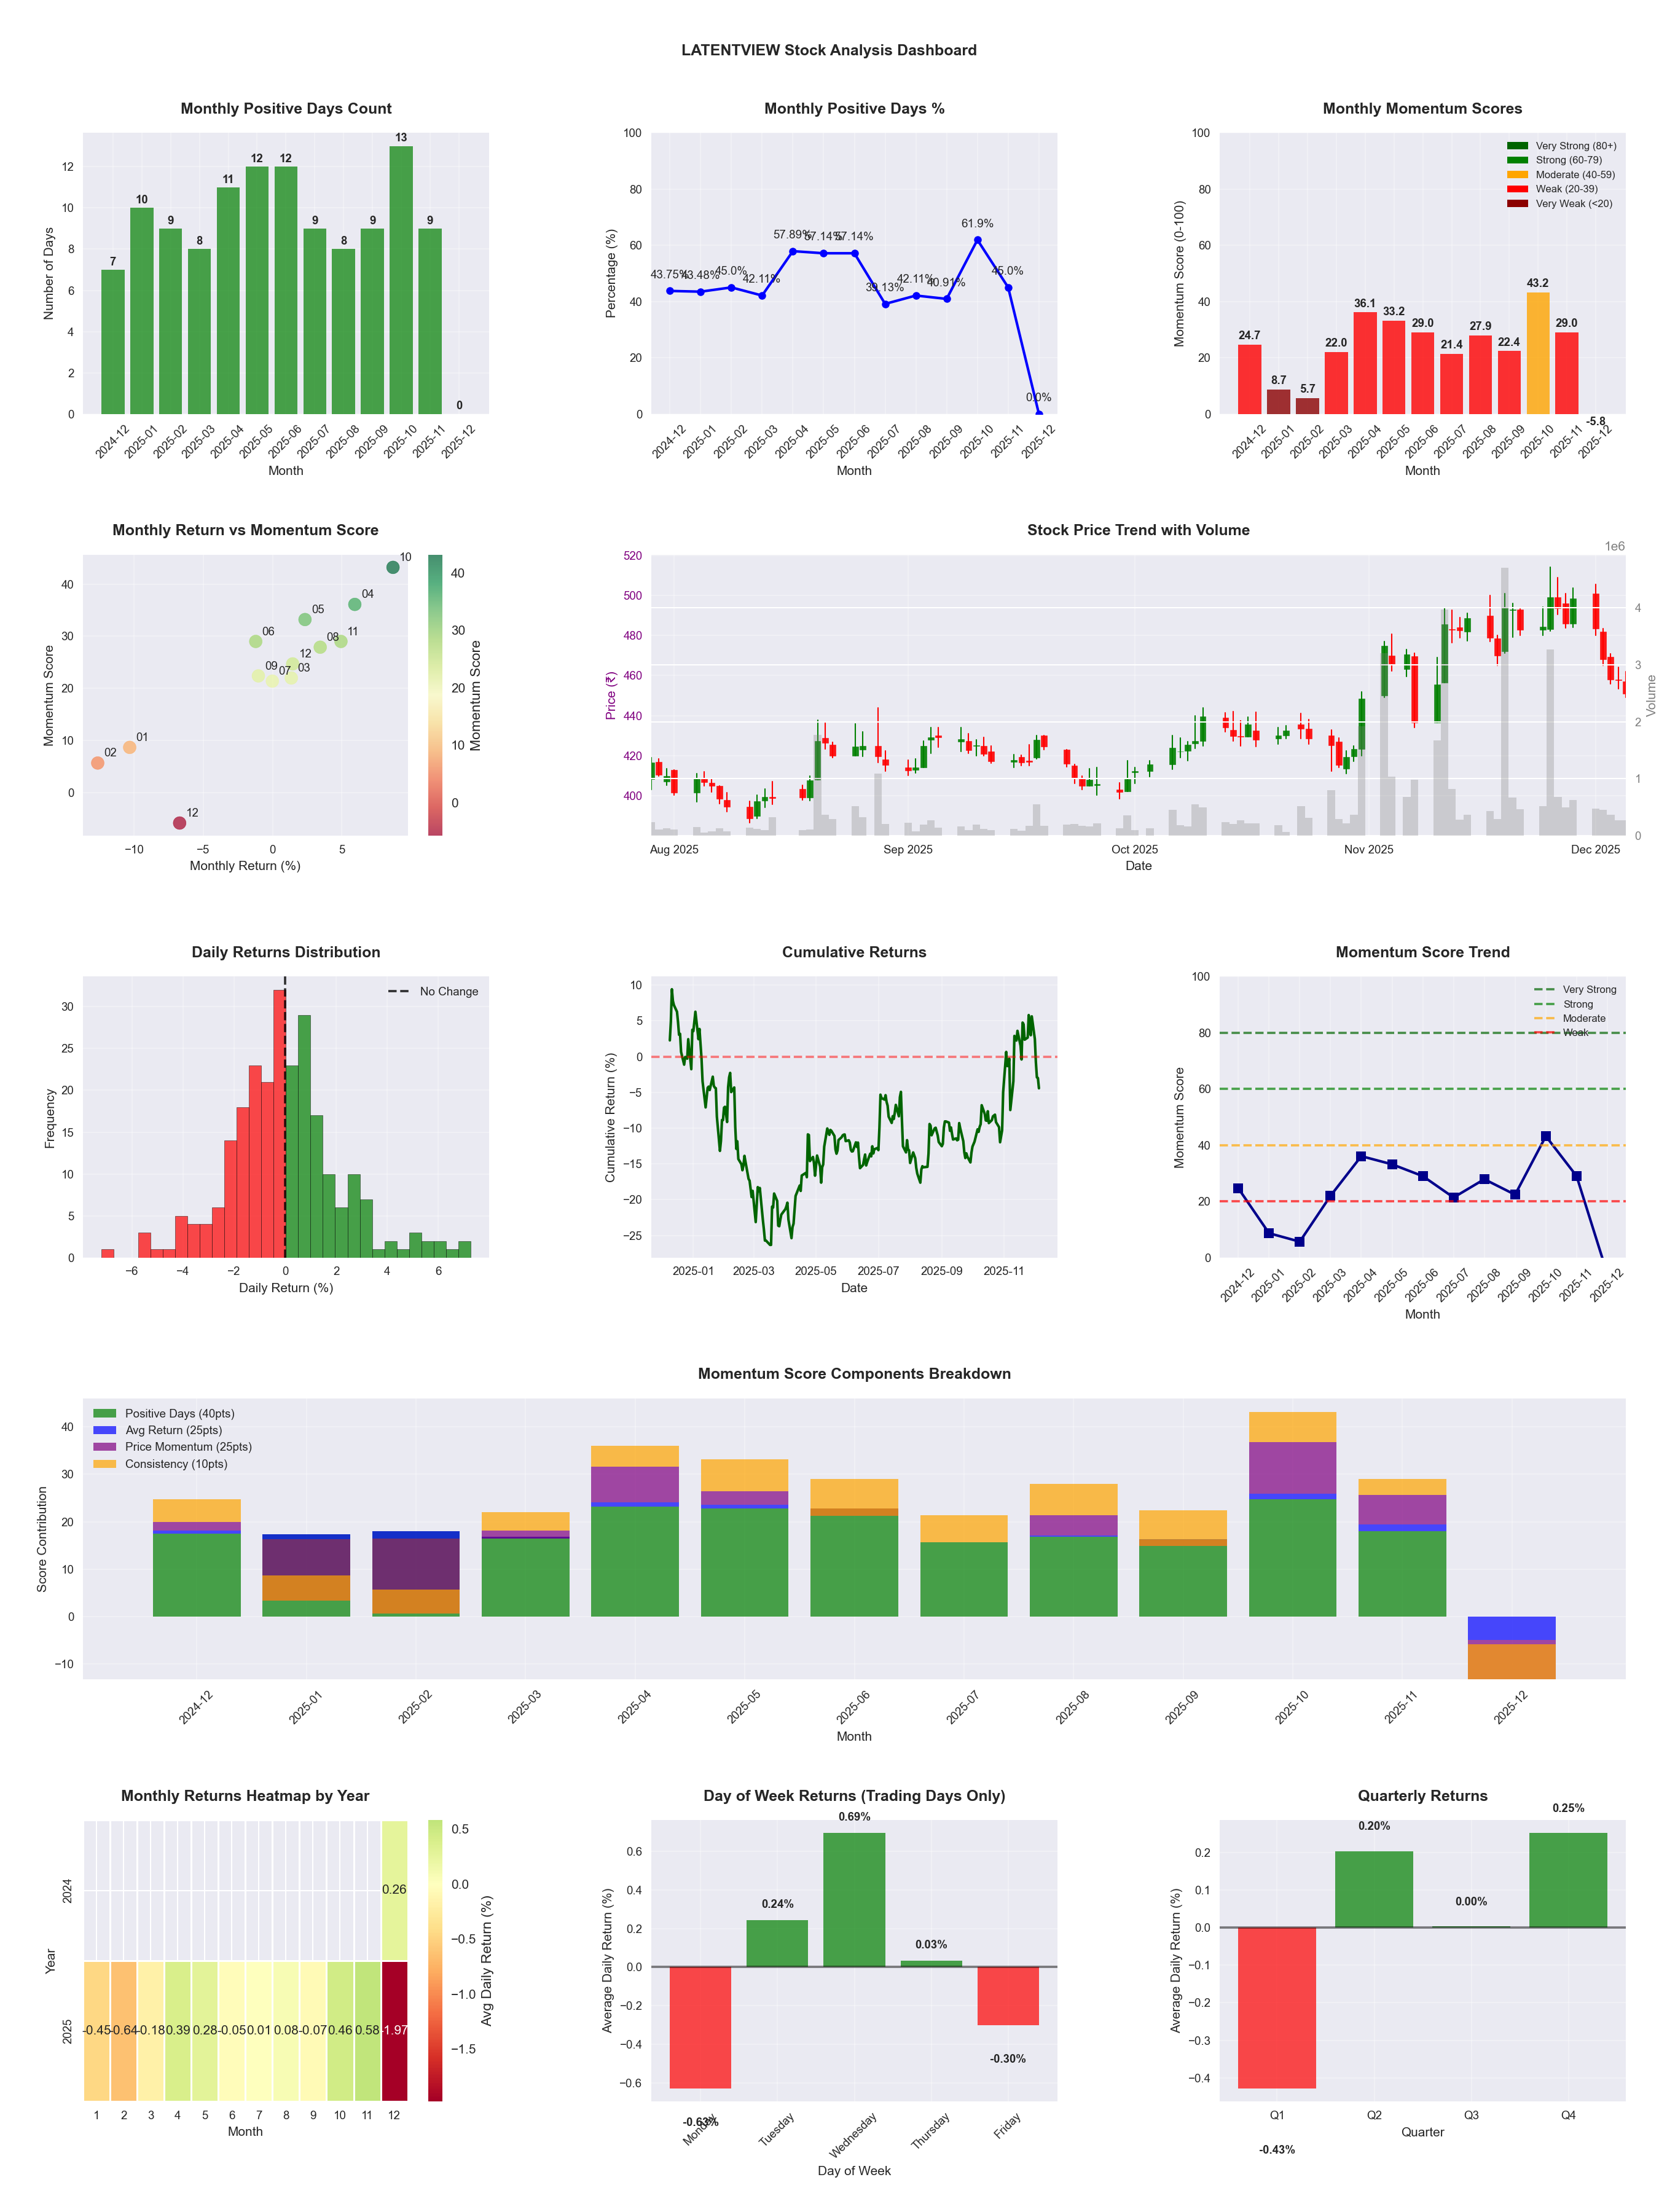
📊 Key Insights & Metrics
Symbol
📈 LATENTVIEW
Date
📅 2026-04-11
Volatility
🟡 2.75%
Risk Profile
⚠️ suitable for aggressive investors
Win Rate
⚠️ 42.3%
Avg Daily Return
📉 -0.07%
Max Drawdown
📉 -50.29%
IBD RS Score
📊 3.2
Weak
Market Rank
#477
Best Month
🏆 2025-10
Best Months to Trade
📅 Apr, Nov, Oct
Best Days to Trade
📅 Wednesday, Thursday
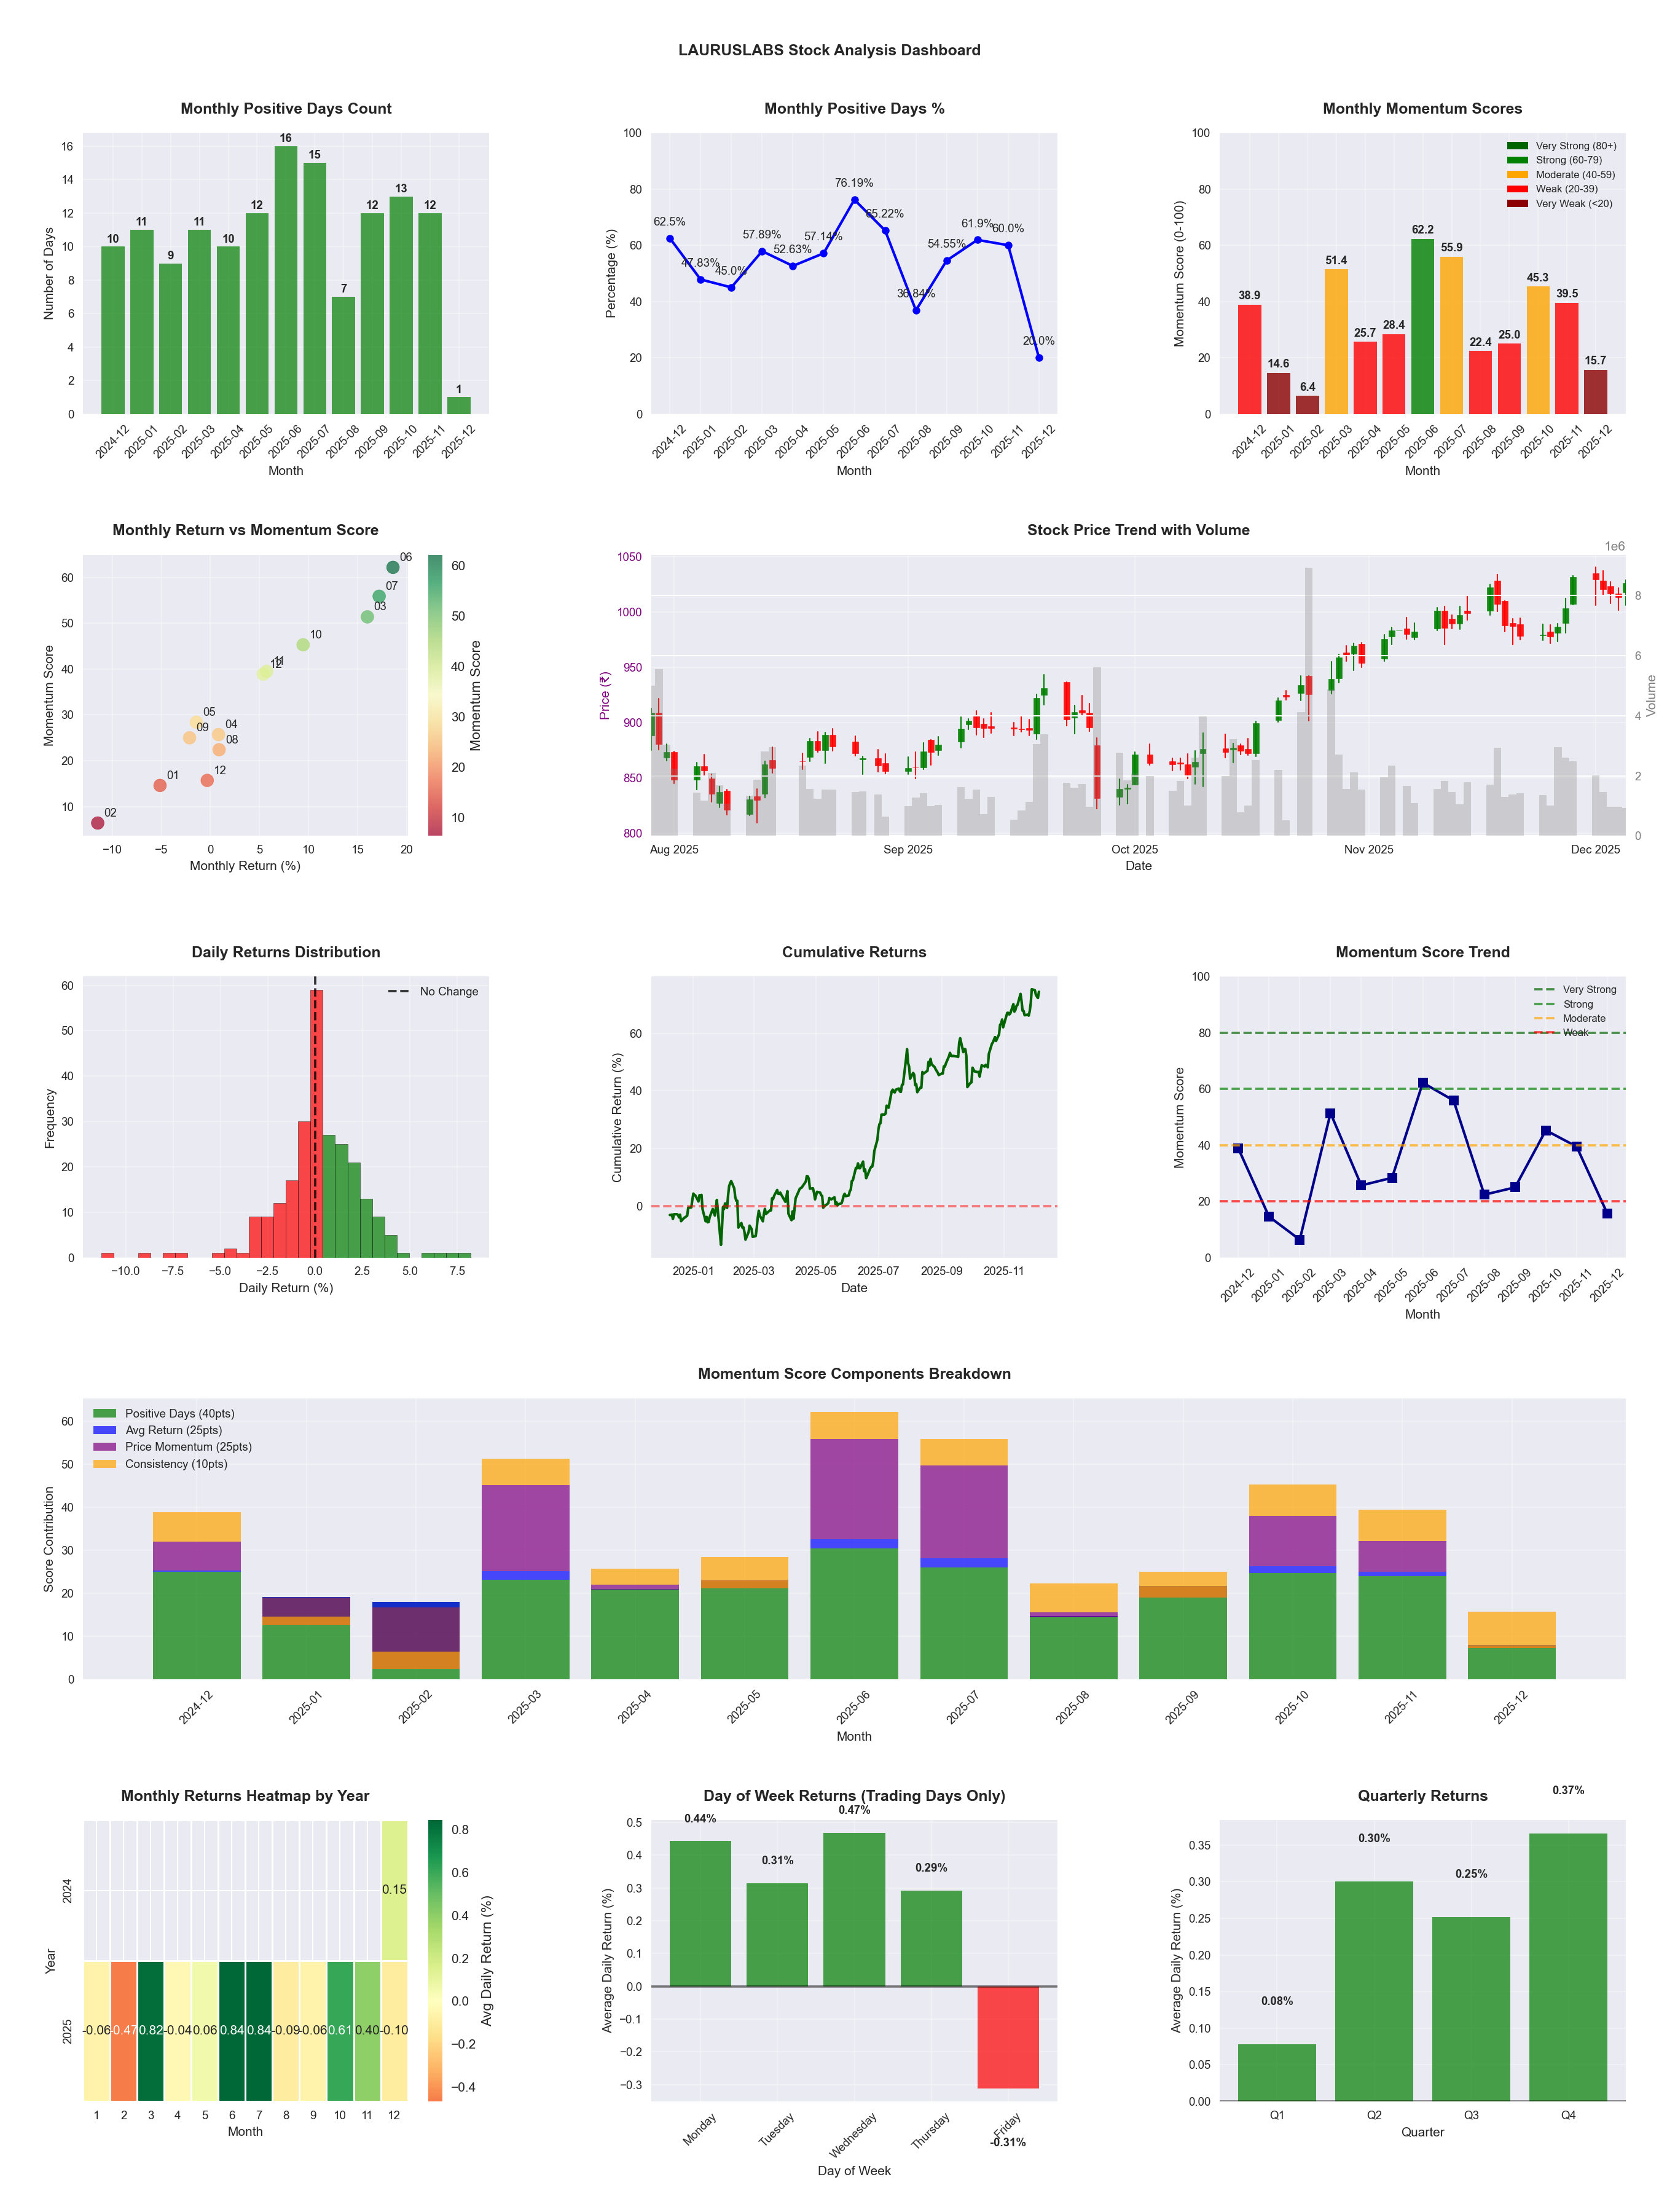
📊 Key Insights & Metrics
Symbol
📈 LAURUSLABS
Date
📅 2026-04-11
Volatility
🟡 1.81%
Win Rate
⚠️ 56.1%
Avg Daily Return
📈 +0.26%
Max Drawdown
📉 -16.27%
IBD RS Score
📊 93.5
Leader
Market Rank
#32
Best Month
🏆 2025-06
Worst Month
📉 2026-01
Best Months to Trade
📅 Jun, Jul, Oct
Best Days to Trade
📅 Wednesday, Monday
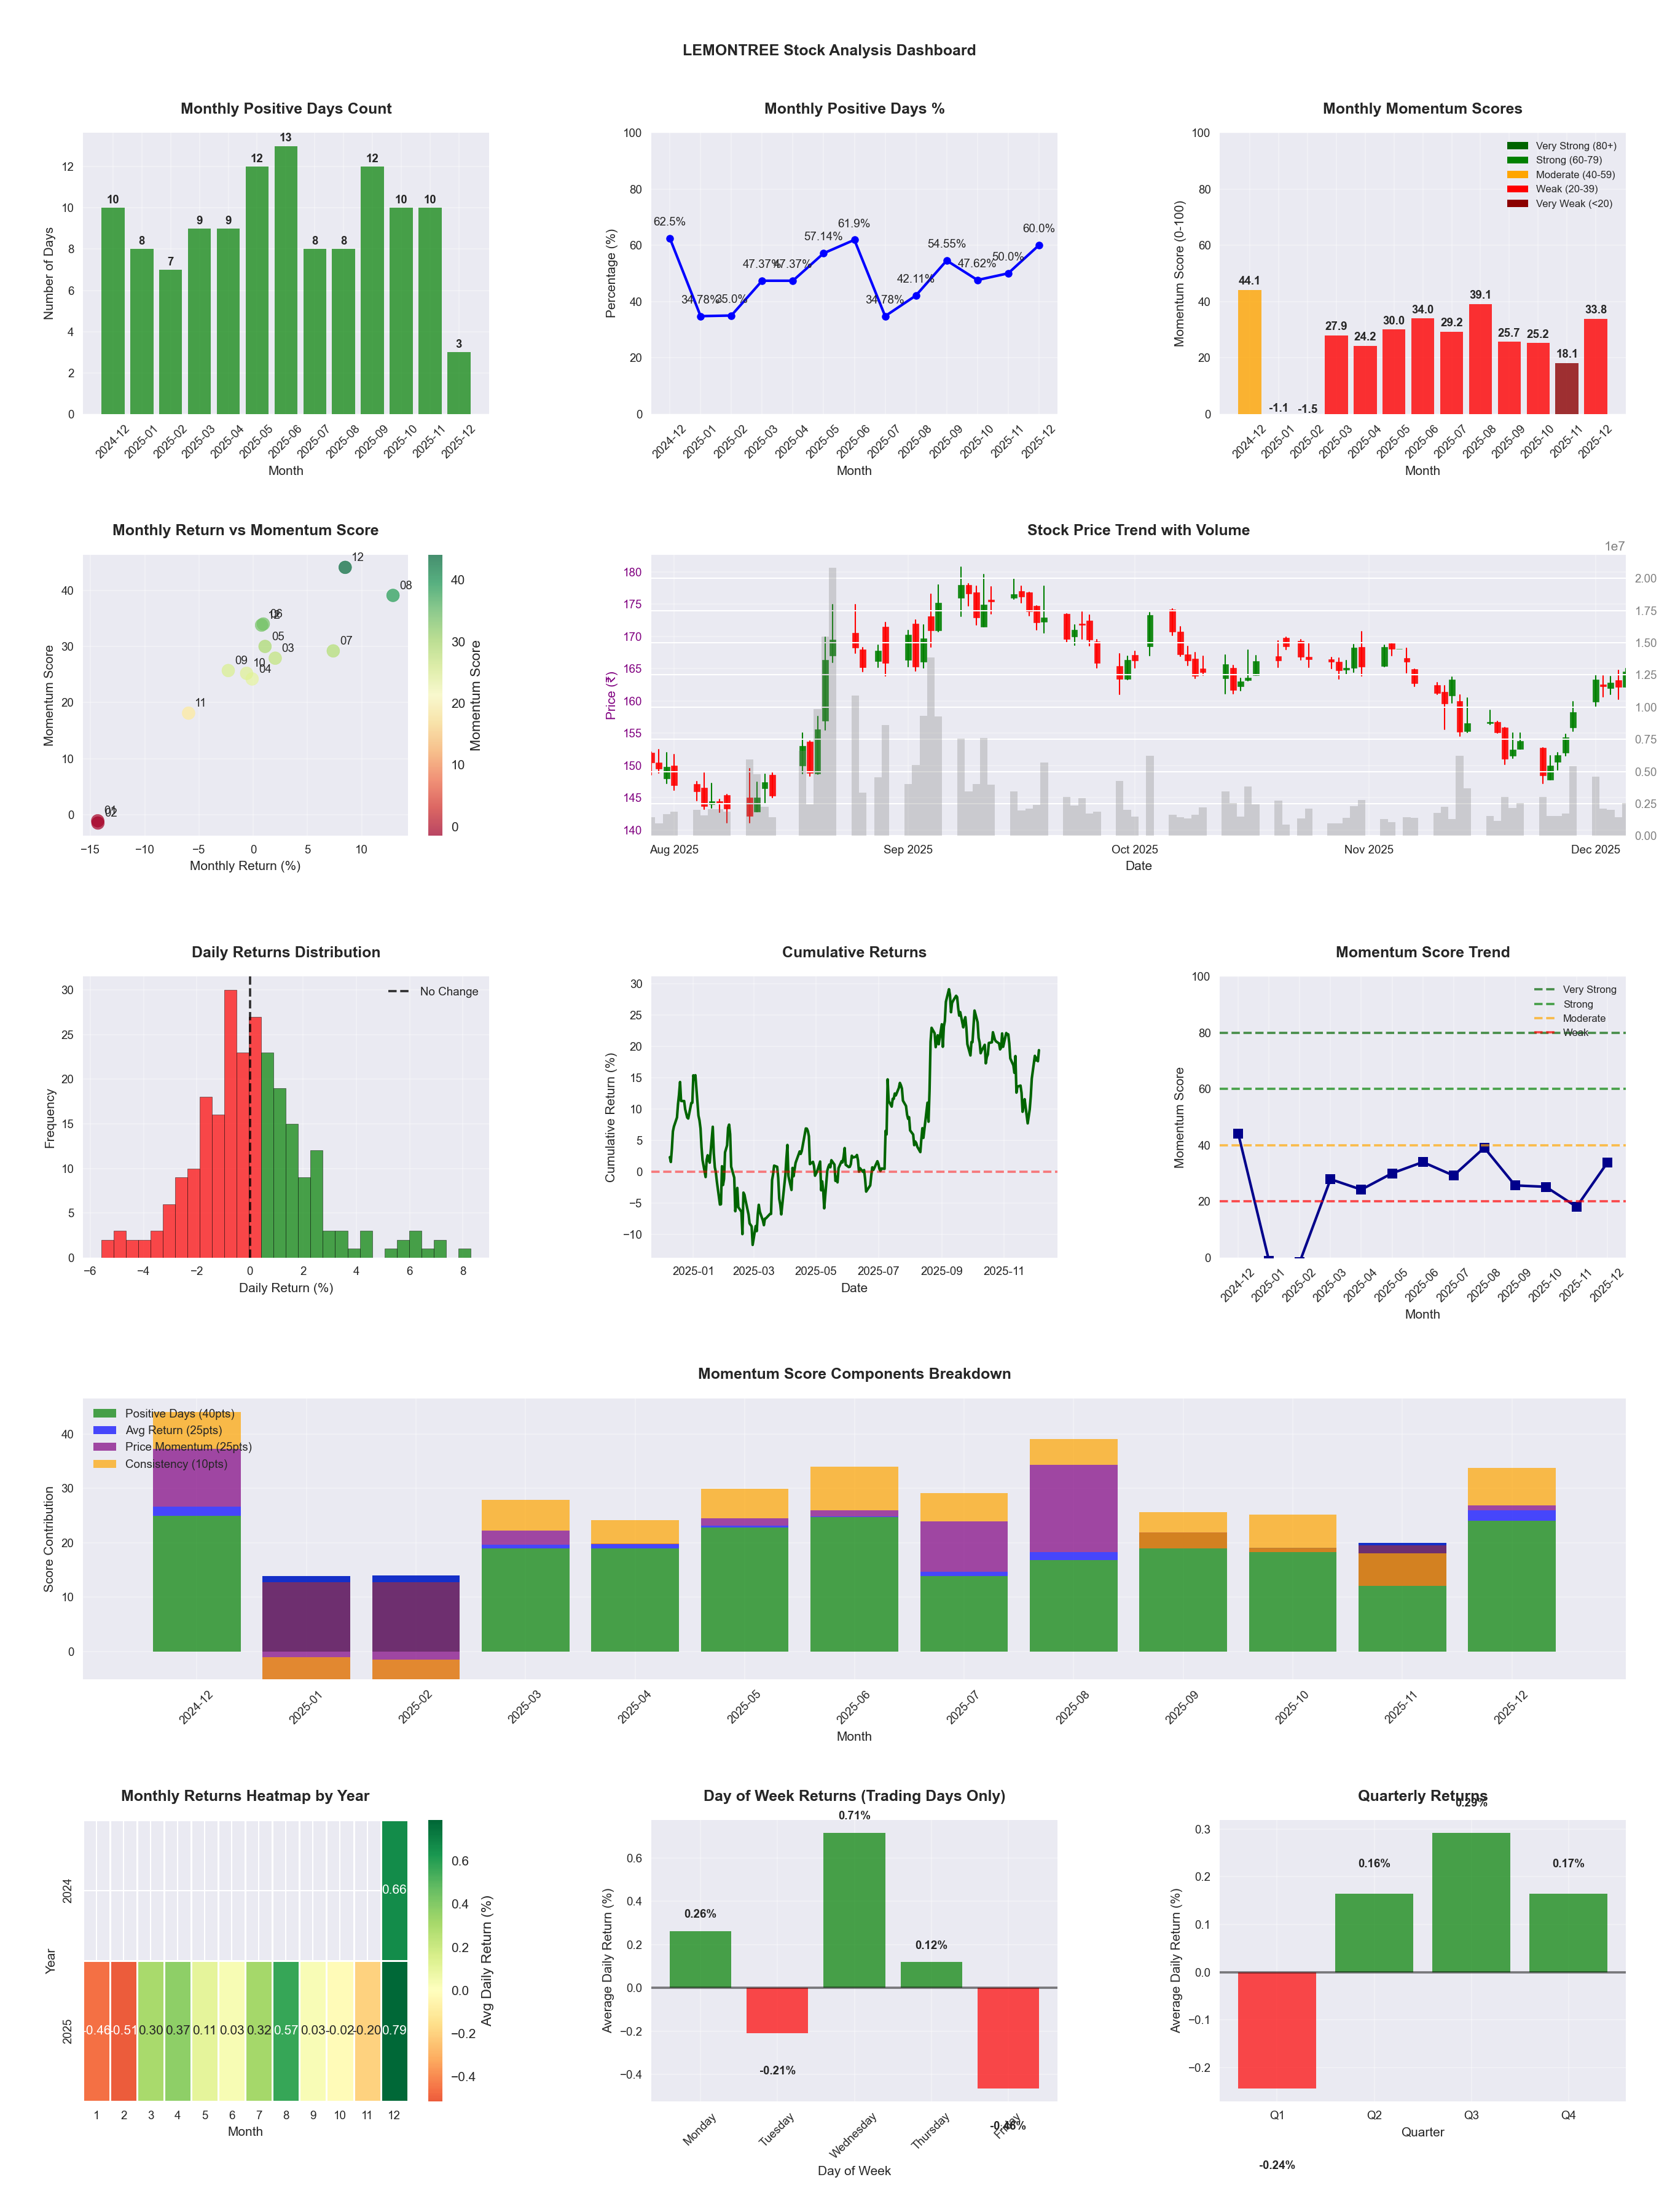
📊 Key Insights & Metrics
Symbol
📈 LEMONTREE
Date
📅 2026-04-11
Volatility
🟡 2.06%
Risk Profile
⚠️ suitable for aggressive investors
Win Rate
⚠️ 46.3%
Avg Daily Return
📉 -0.06%
Max Drawdown
📉 -43.56%
IBD RS Score
📊 7.7
Weak
Market Rank
#455
Best Month
🏆 2026-04
Best Months to Trade
📅 Apr, Aug, Jul
Best Days to Trade
📅 Wednesday, Monday
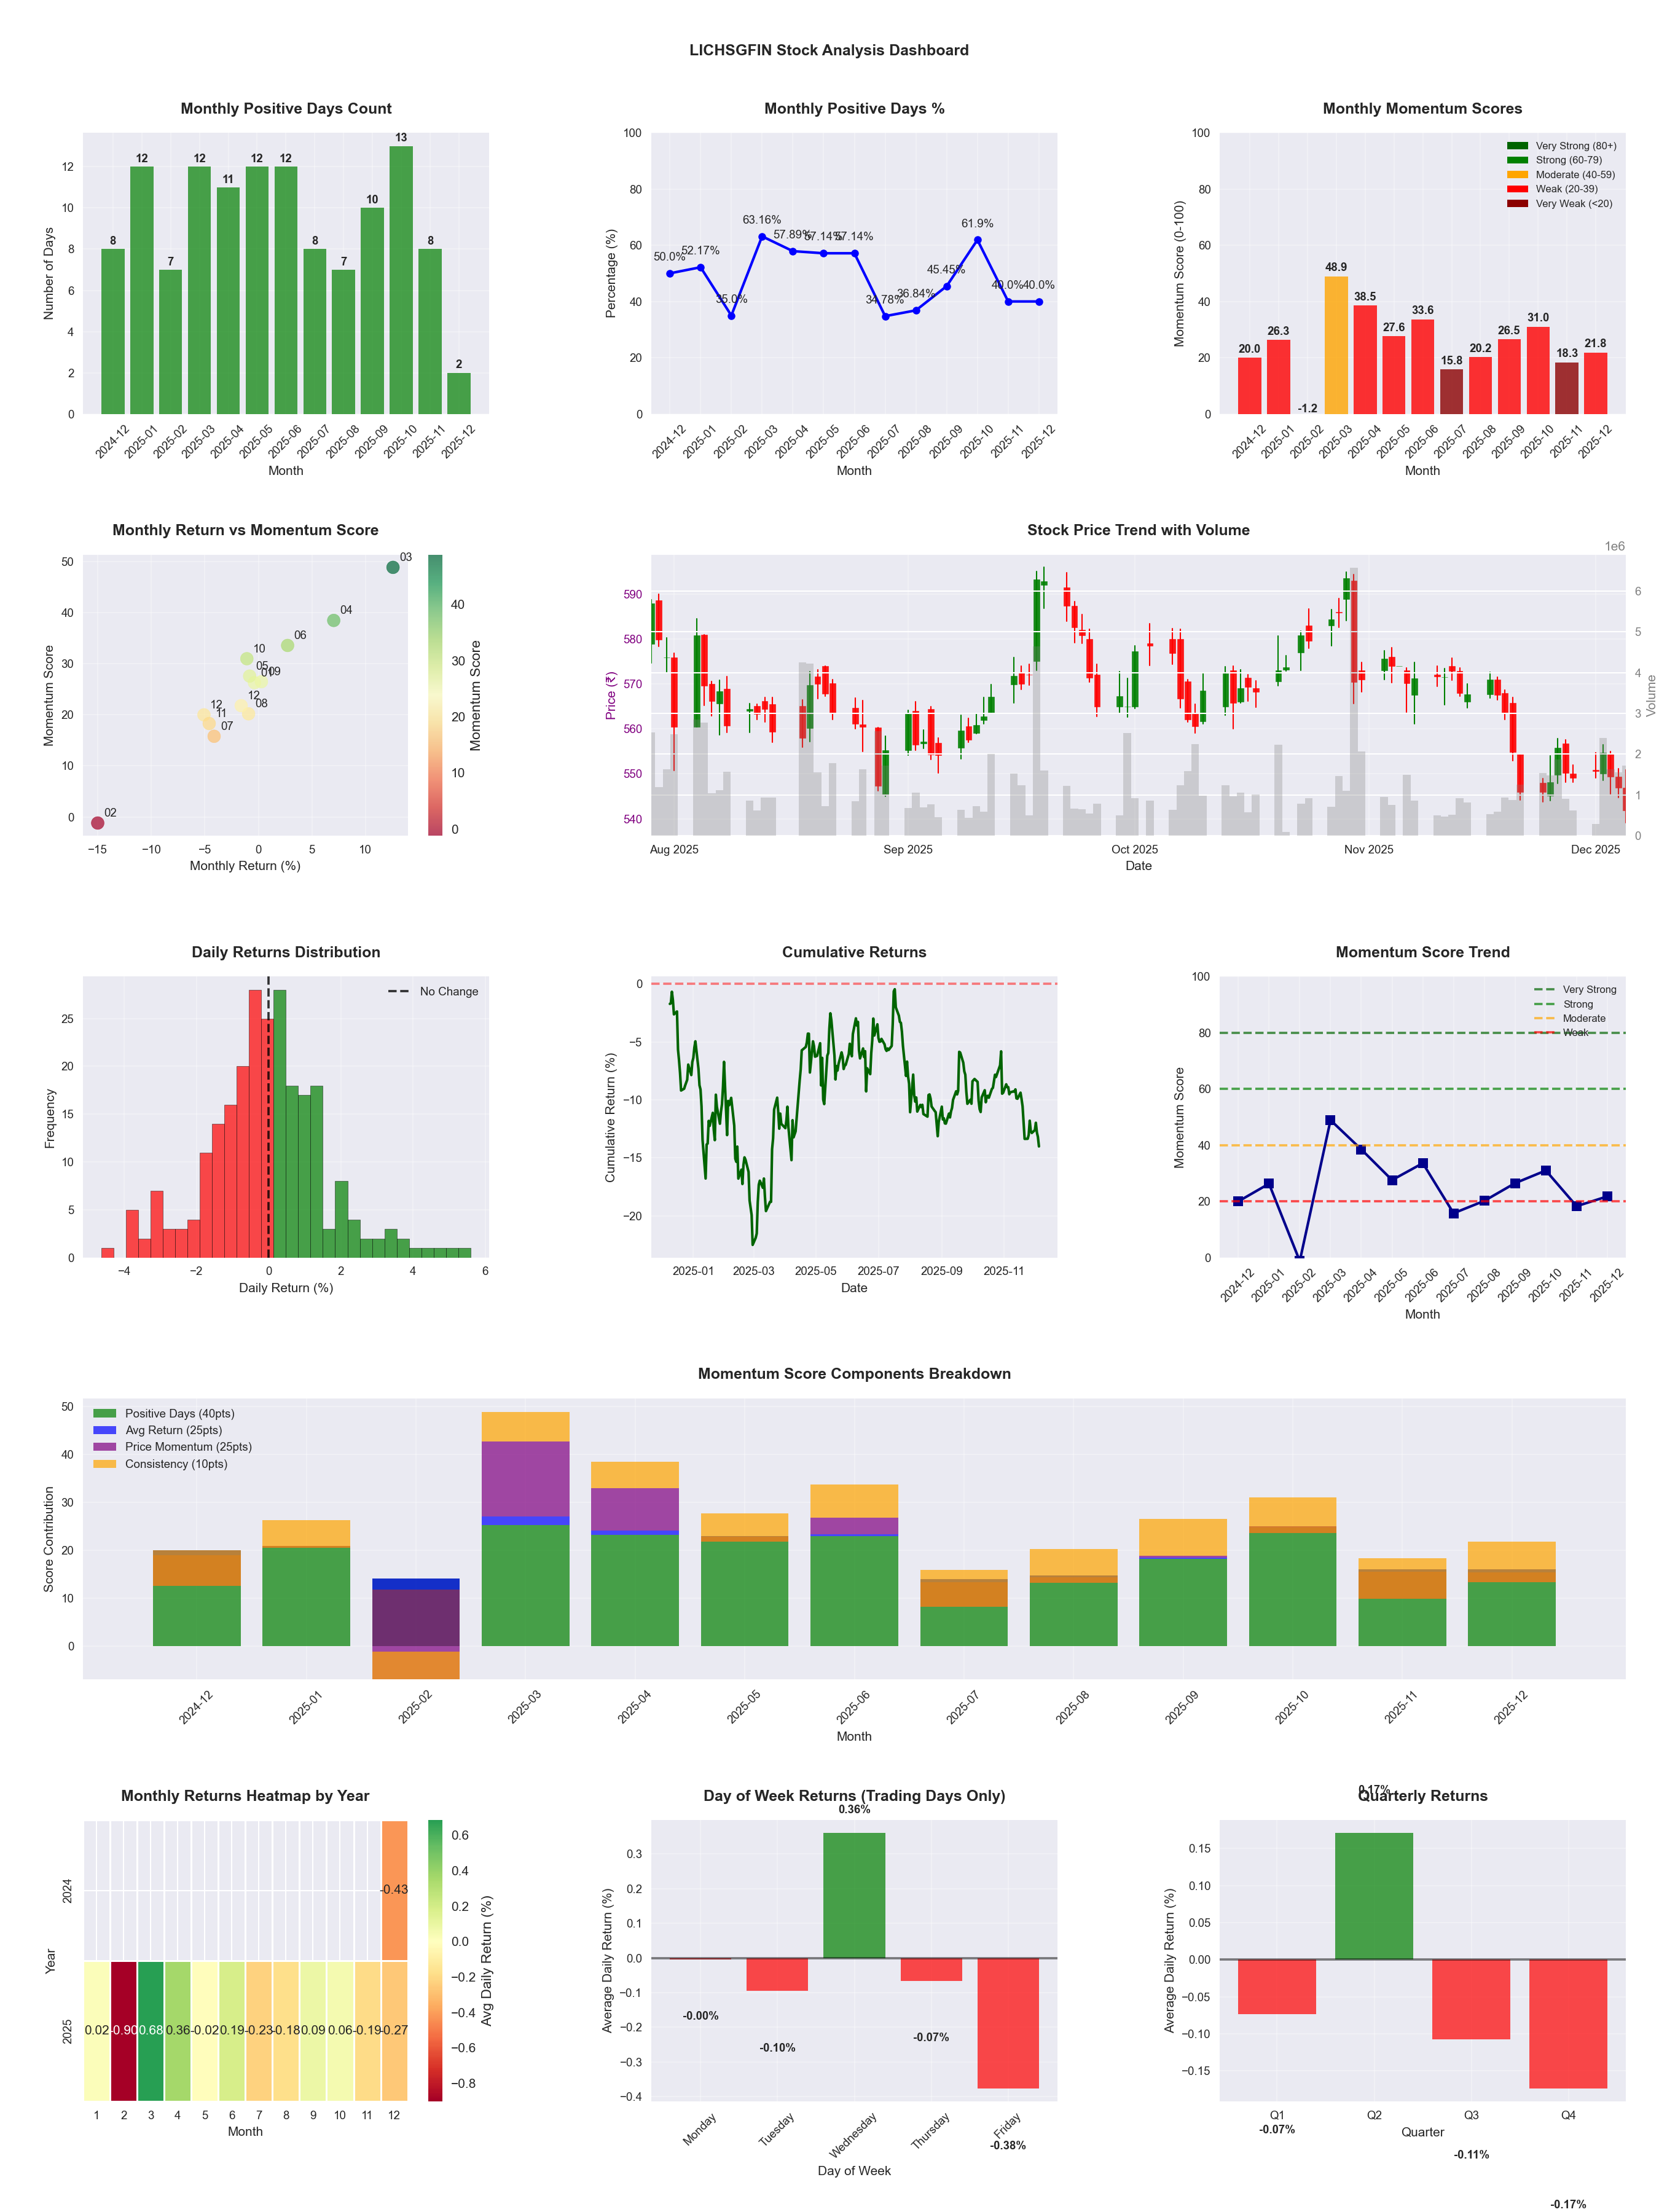
📊 Key Insights & Metrics
Symbol
📈 LICHSGFIN
Date
📅 2026-04-11
Volatility
🟡 1.57%
Win Rate
⚠️ 49.2%
Avg Daily Return
📉 -0.00%
Max Drawdown
📉 -26.55%
IBD RS Score
📊 49.5
Weak
Market Rank
#249
Best Month
🏆 2026-04
Worst Month
📉 2026-03
Best Months to Trade
📅 Apr, Jun, Feb
Best Days to Trade
📅 Wednesday, Tuesday
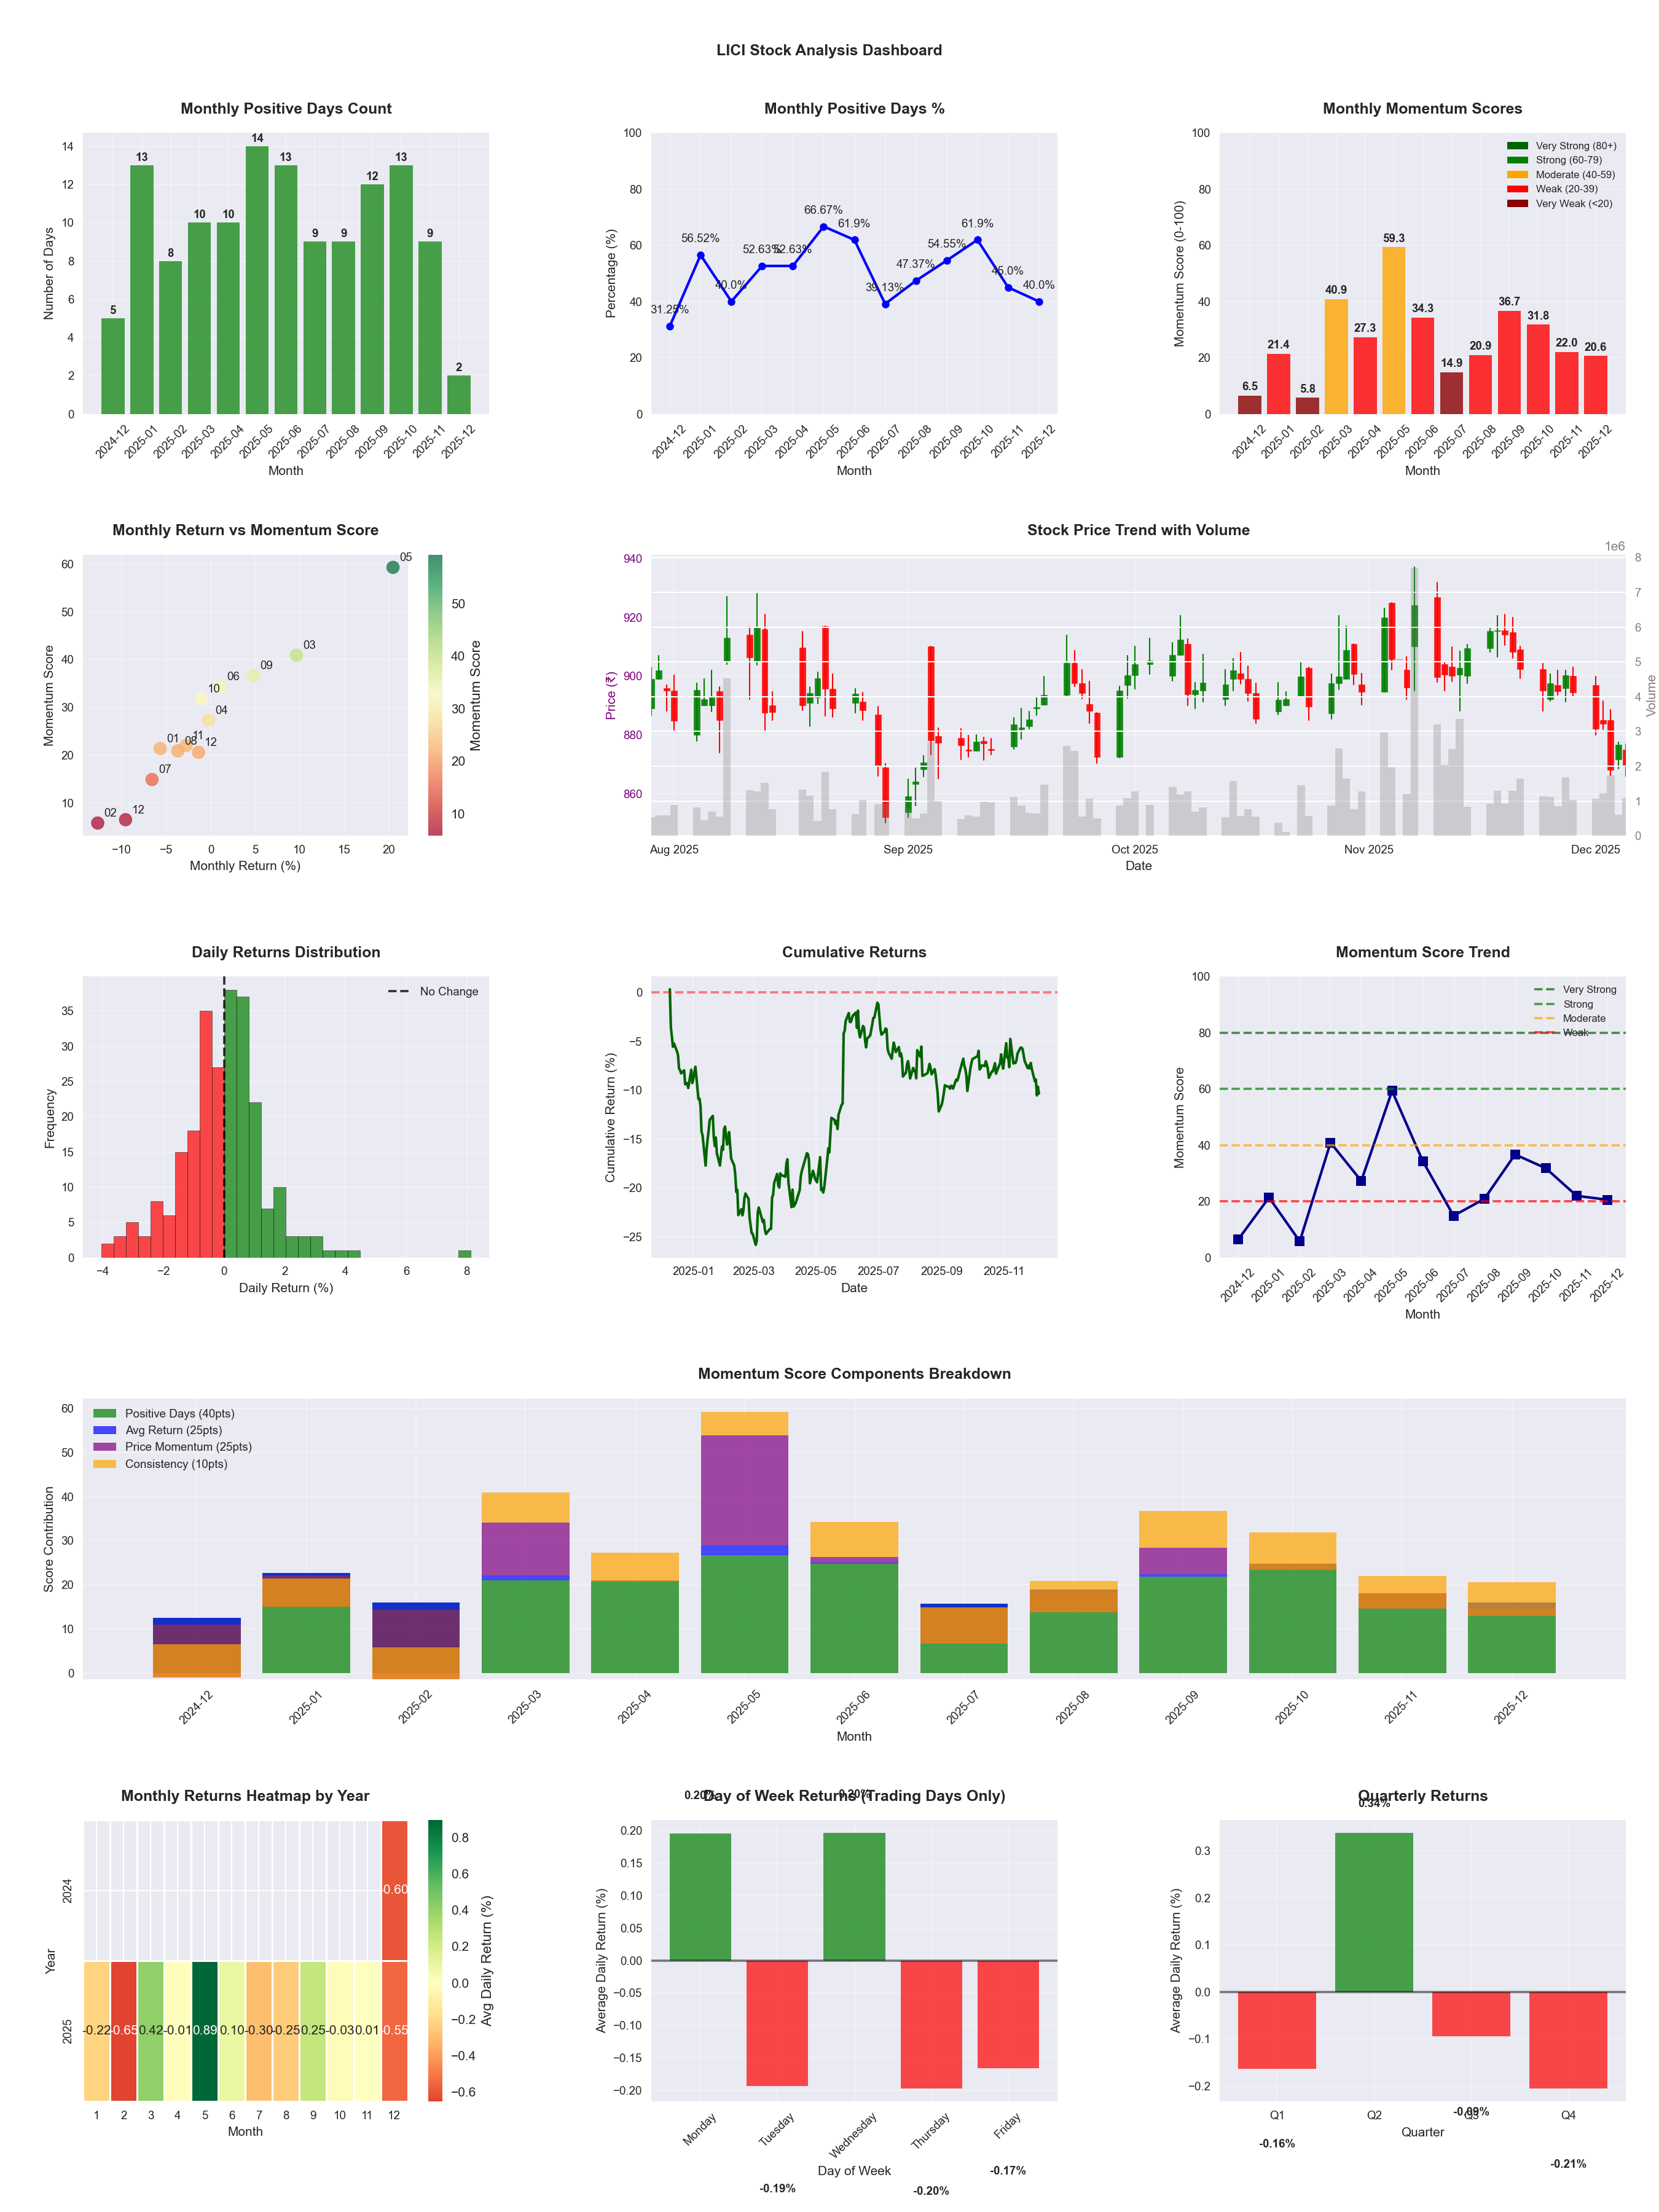
📊 Key Insights & Metrics
Symbol
📈 LICI
Date
📅 2026-04-11
Volatility
🟡 1.55%
Win Rate
⚠️ 50.4%
Avg Daily Return
📈 +0.03%
Max Drawdown
📉 -24.42%
IBD RS Score
📊 48.3
Weak
Market Rank
#255
Best Month
🏆 2025-05
Worst Month
📉 2026-03
Best Months to Trade
📅 May, Apr, Sep
Best Days to Trade
📅 Wednesday, Tuesday
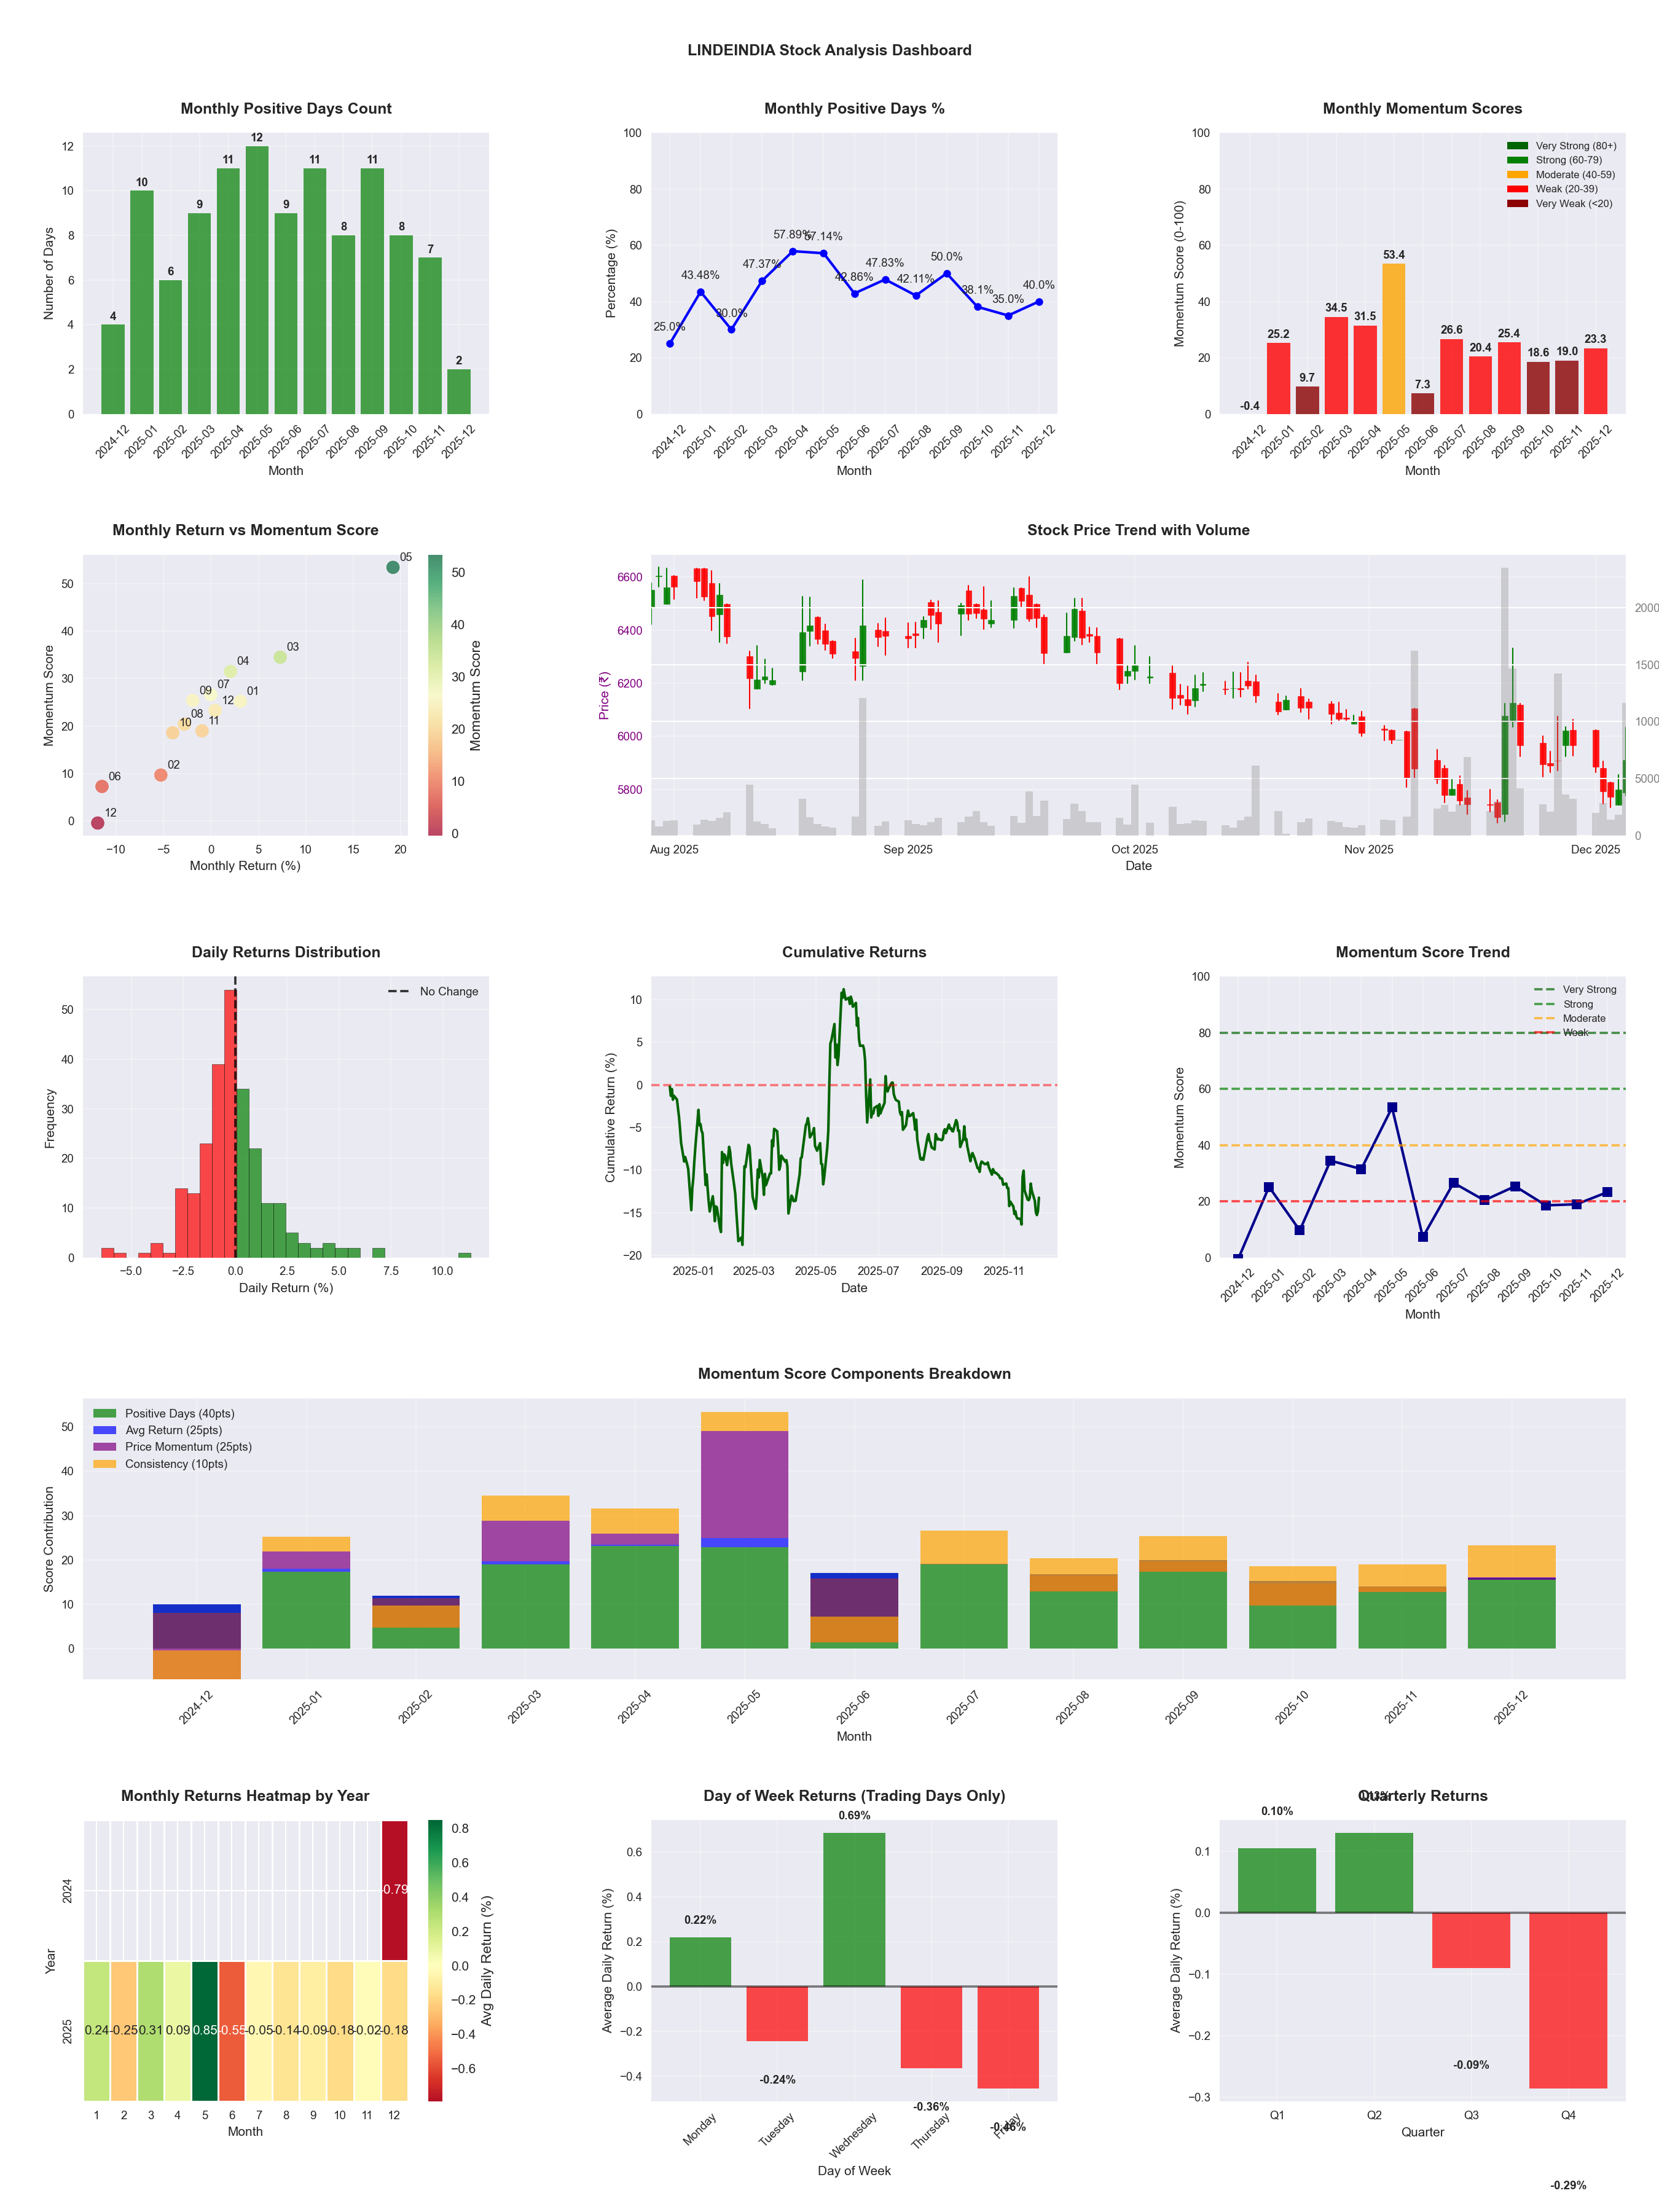
📊 Key Insights & Metrics
Symbol
📈 LINDEINDIA
Date
📅 2026-04-11
Volatility
🟡 1.90%
Win Rate
⚠️ 47.4%
Avg Daily Return
📈 +0.10%
Max Drawdown
📉 -24.81%
IBD RS Score
📊 85.4
Strong
Market Rank
#72
Best Month
🏆 2025-05
Worst Month
📉 2025-06
Best Months to Trade
📅 May, Apr, Feb
Best Days to Trade
📅 Monday, Wednesday
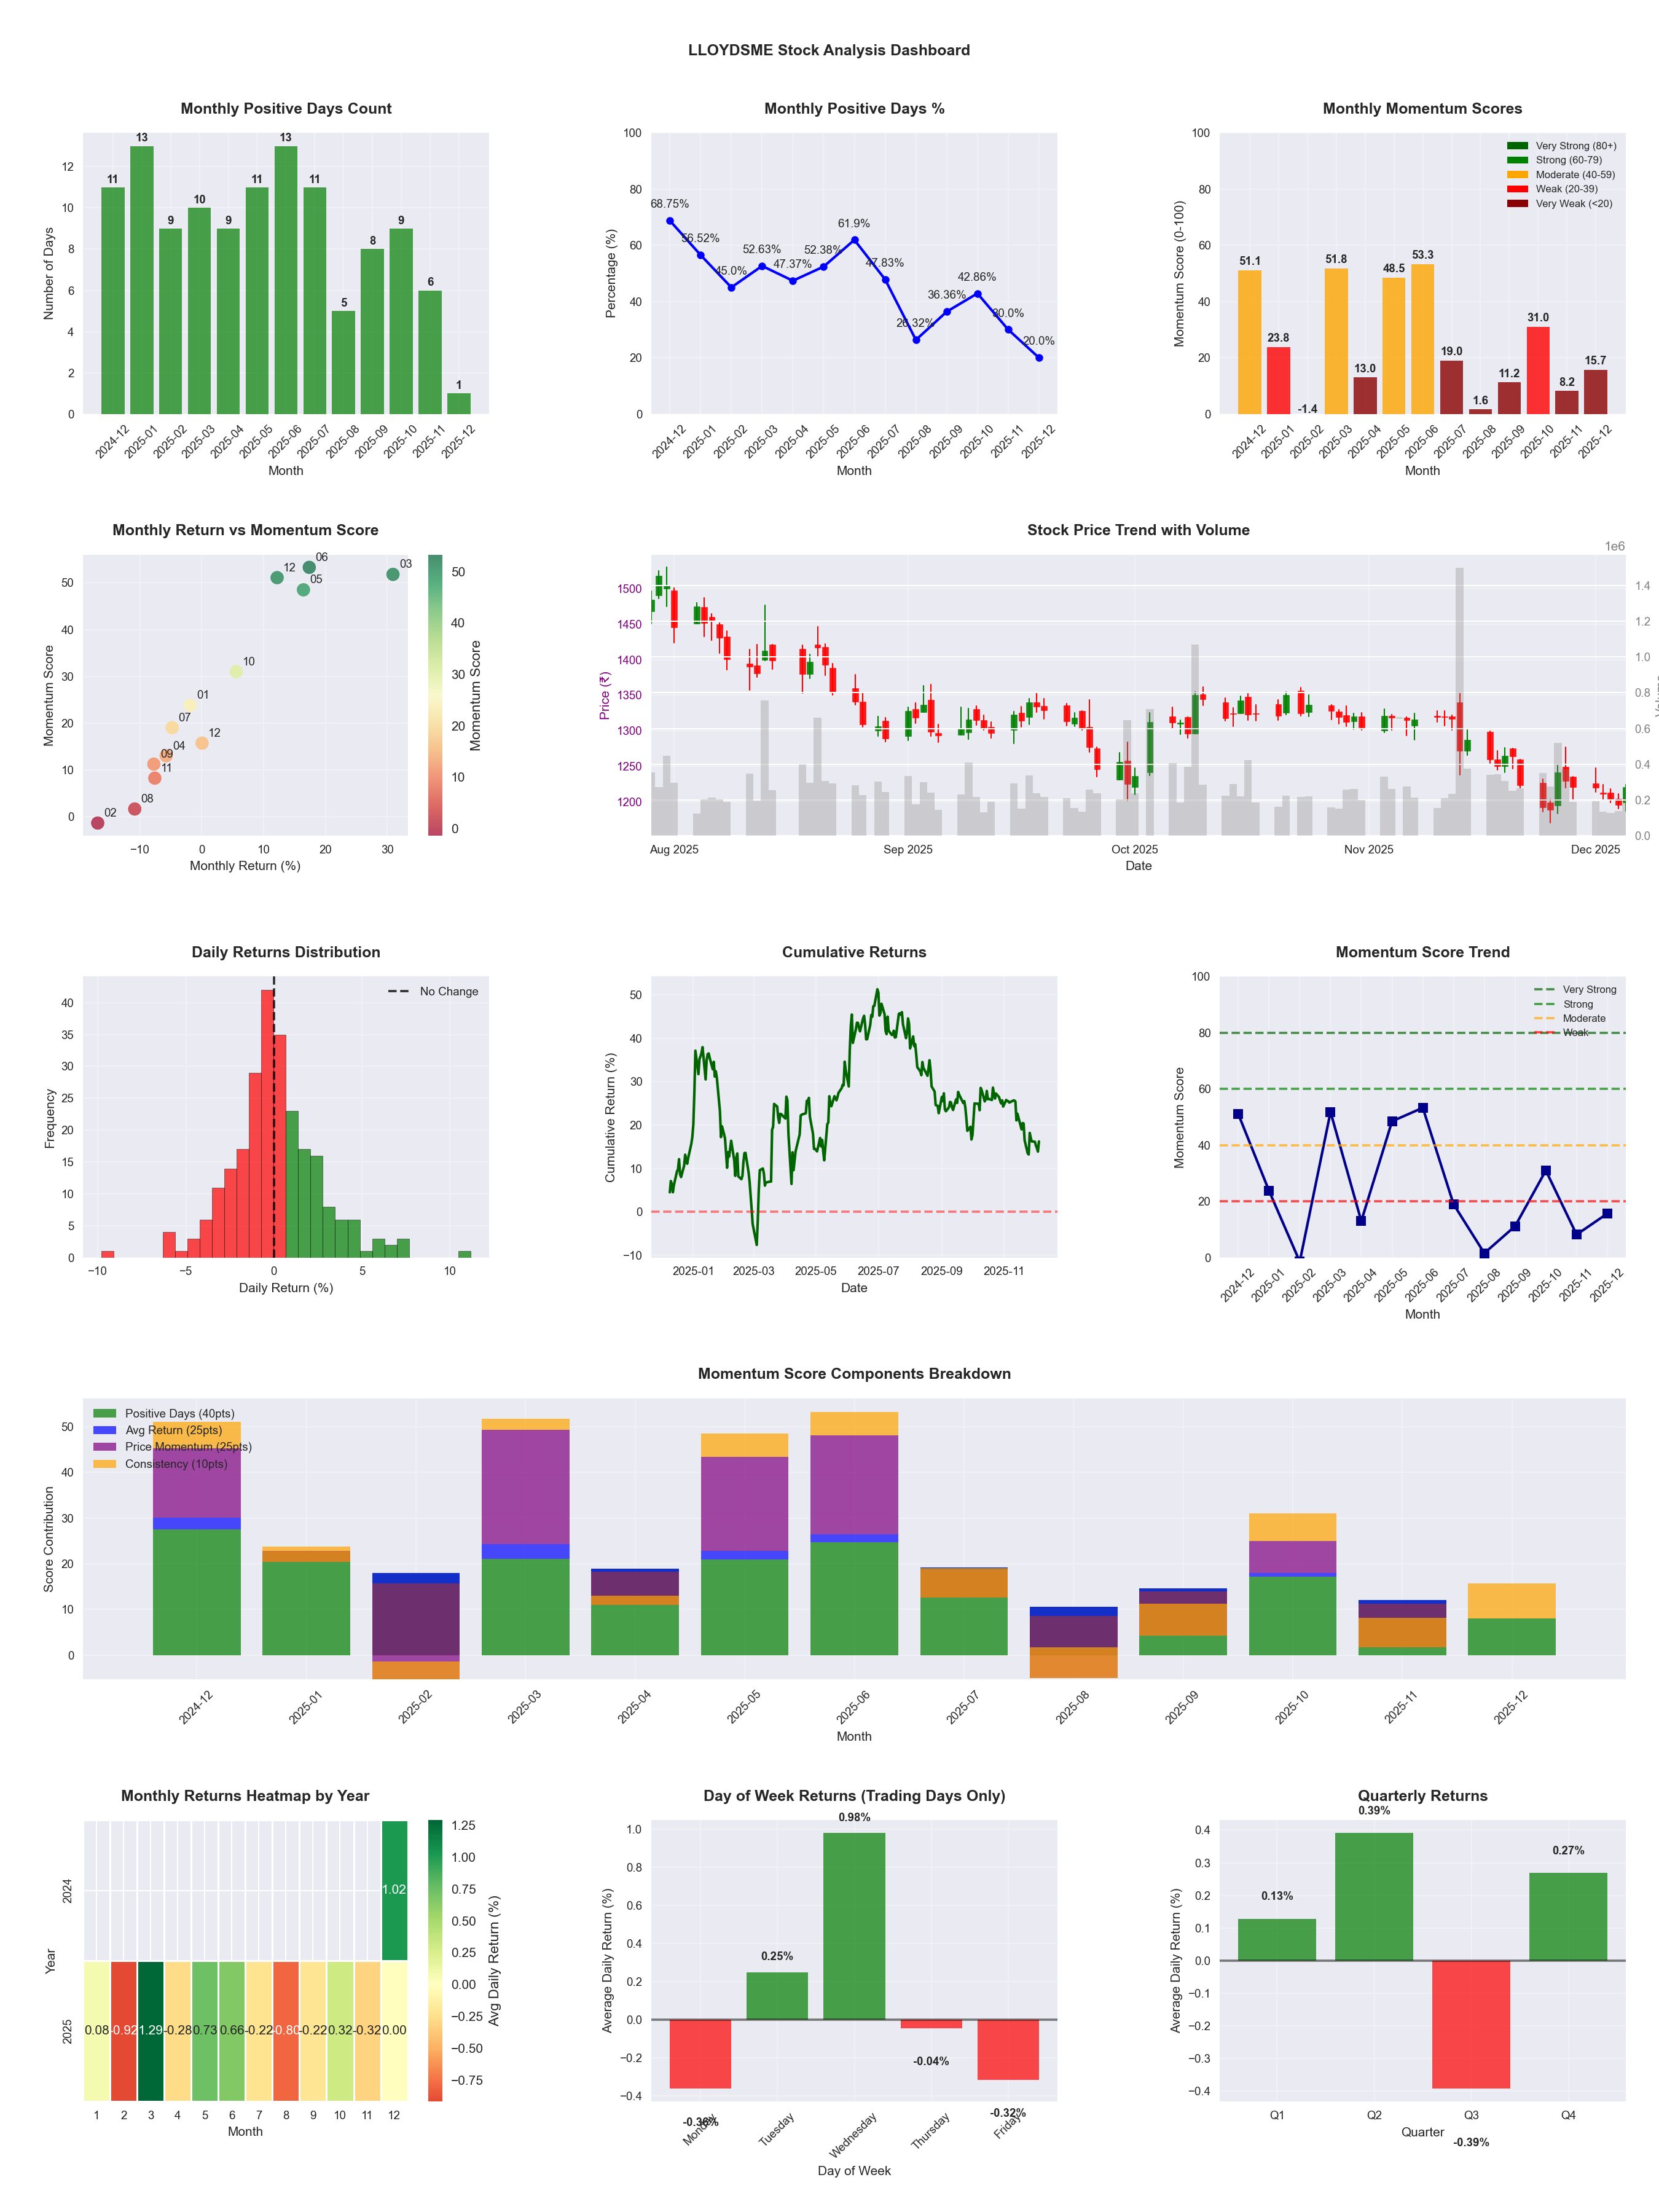
📊 Key Insights & Metrics
Symbol
📈 LLOYDSME
Date
📅 2026-04-11
Volatility
🟡 2.39%
Risk Profile
⚠️ suitable for aggressive investors
Win Rate
⚠️ 44.3%
Avg Daily Return
📈 +0.12%
Max Drawdown
📉 -30.88%
IBD RS Score
📊 83.0
Strong
Market Rank
#84
Best Month
🏆 2026-04
Best Months to Trade
📅 Apr, May, Jun
Best Days to Trade
📅 Wednesday, Tuesday
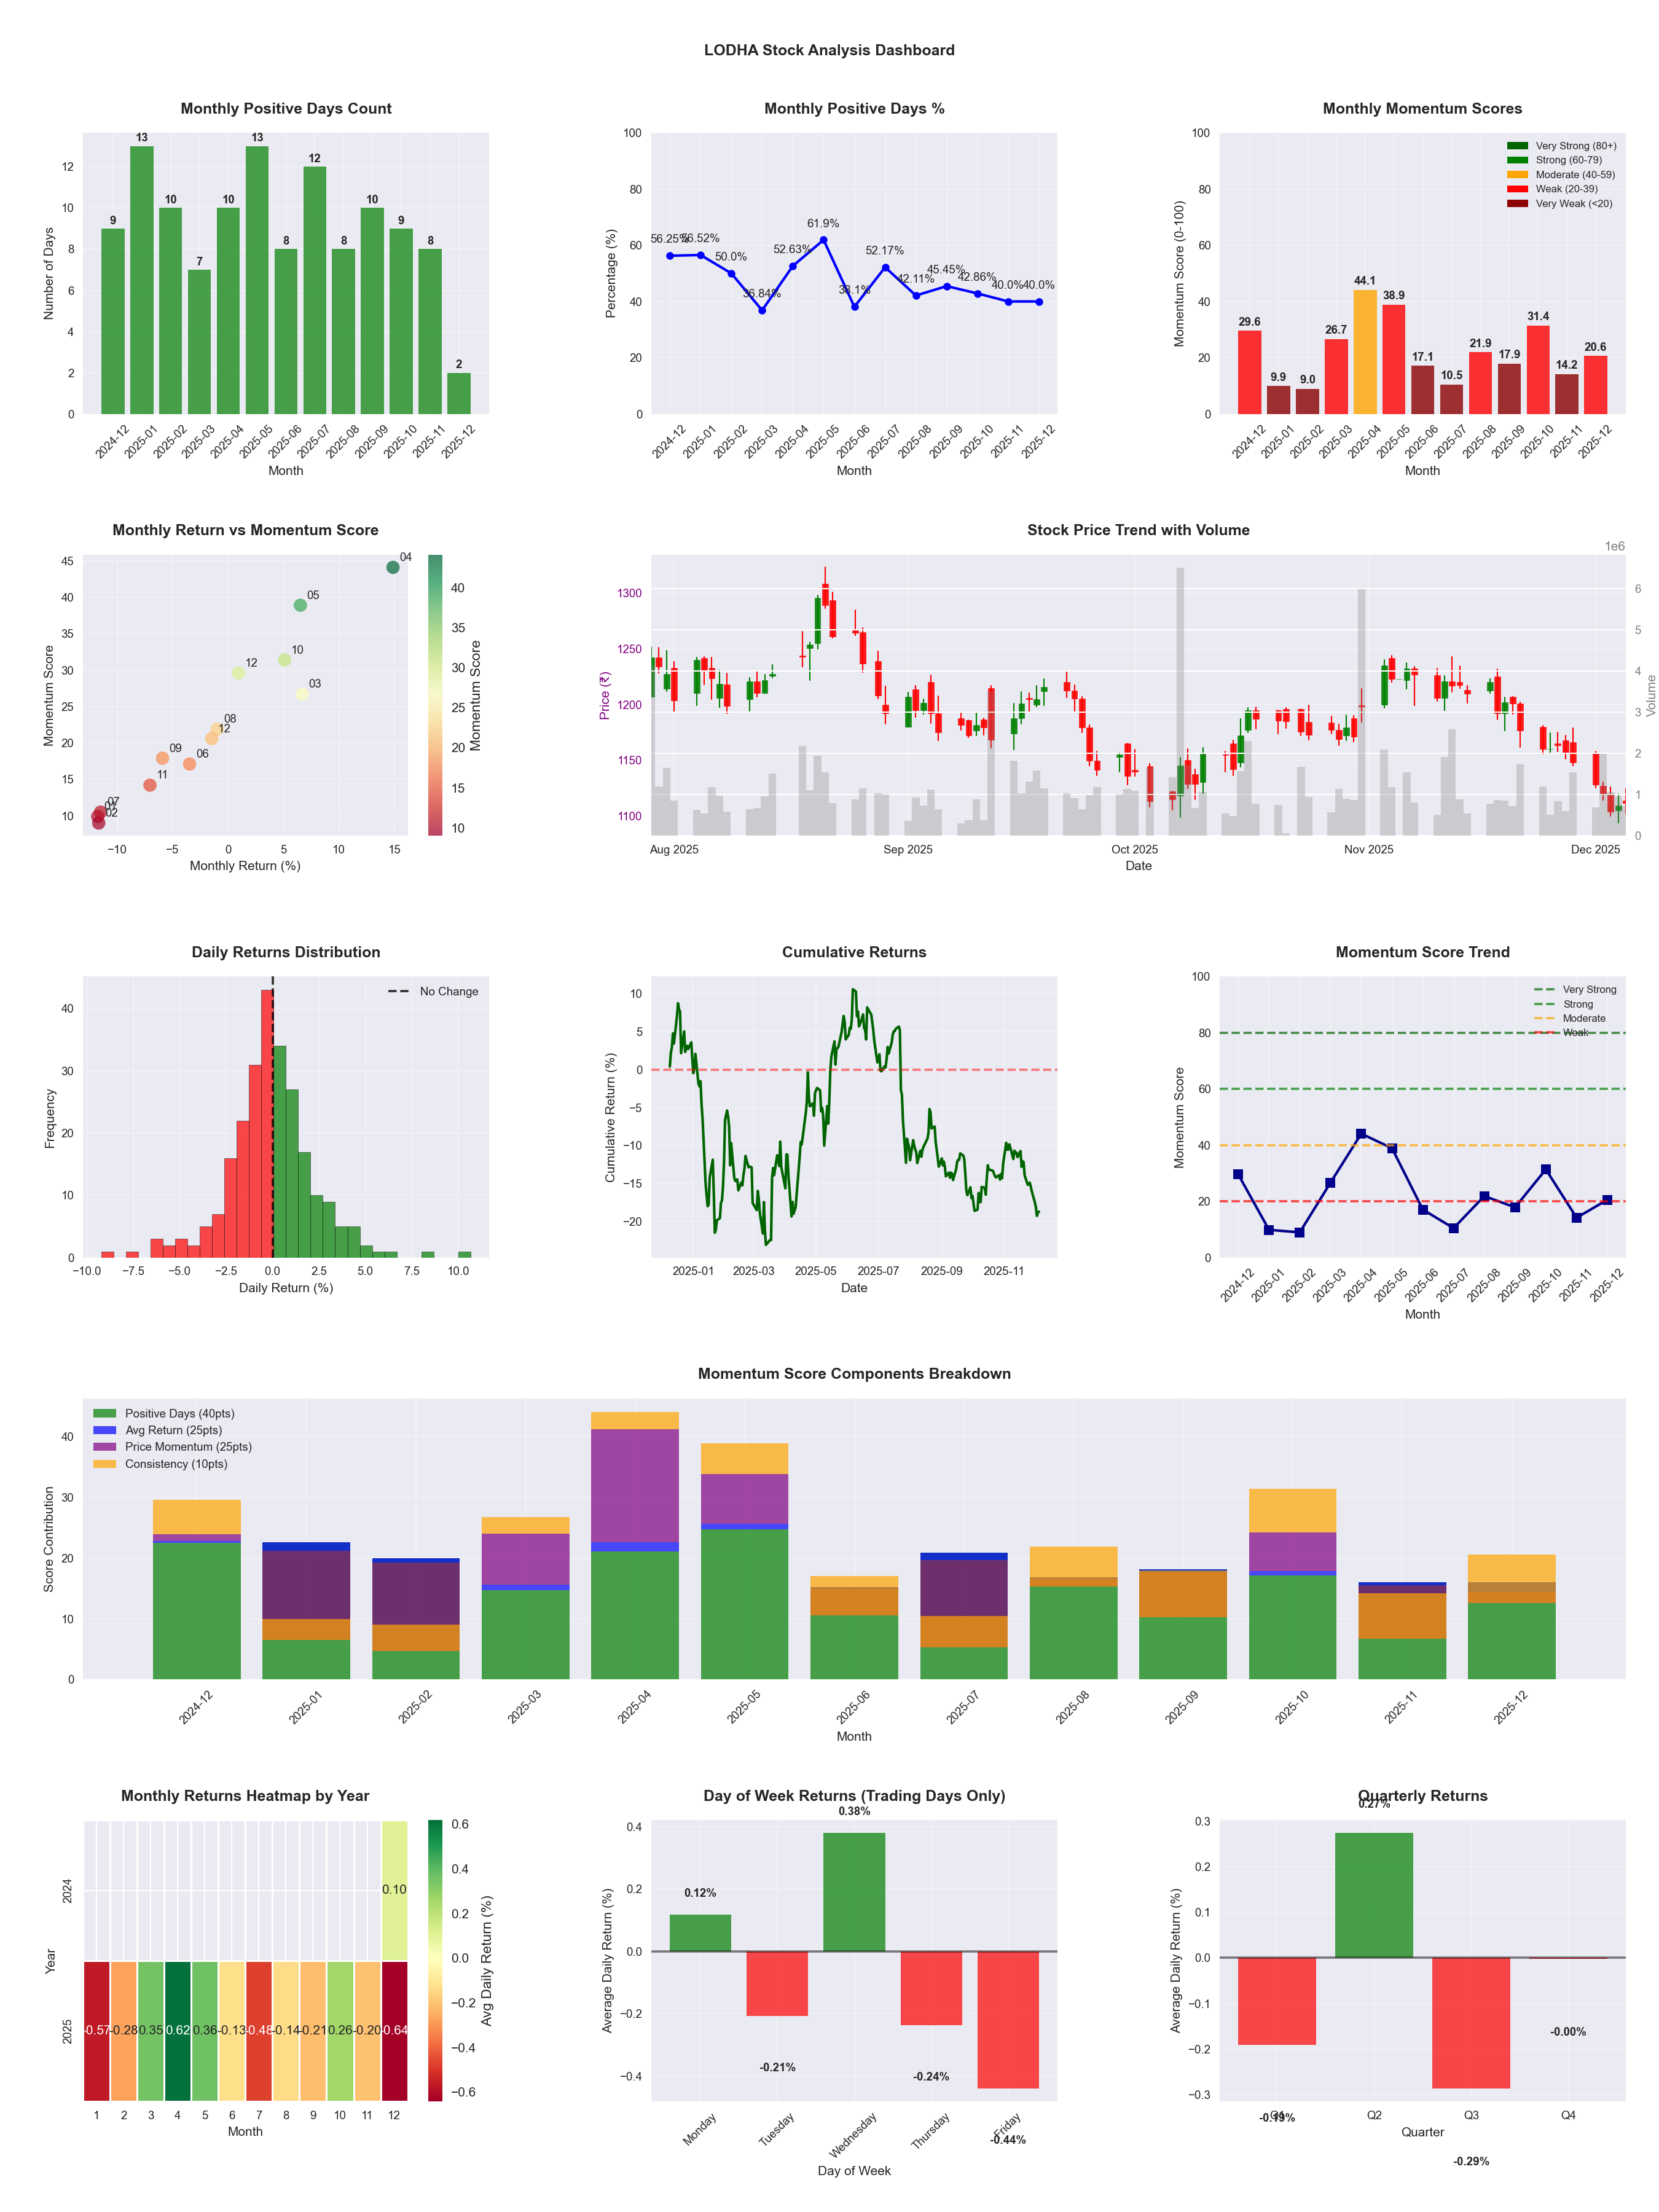
📊 Key Insights & Metrics
Symbol
📈 LODHA
Date
📅 2026-04-11
Volatility
🟡 2.19%
Risk Profile
⚠️ suitable for aggressive investors
Win Rate
⚠️ 46.3%
Avg Daily Return
📉 -0.10%
Max Drawdown
📉 -55.20%
IBD RS Score
📊 4.1
Weak
Market Rank
#473
Best Month
🏆 2026-04
Best Months to Trade
📅 Apr, May, Oct
Best Days to Trade
📅 Wednesday, Monday
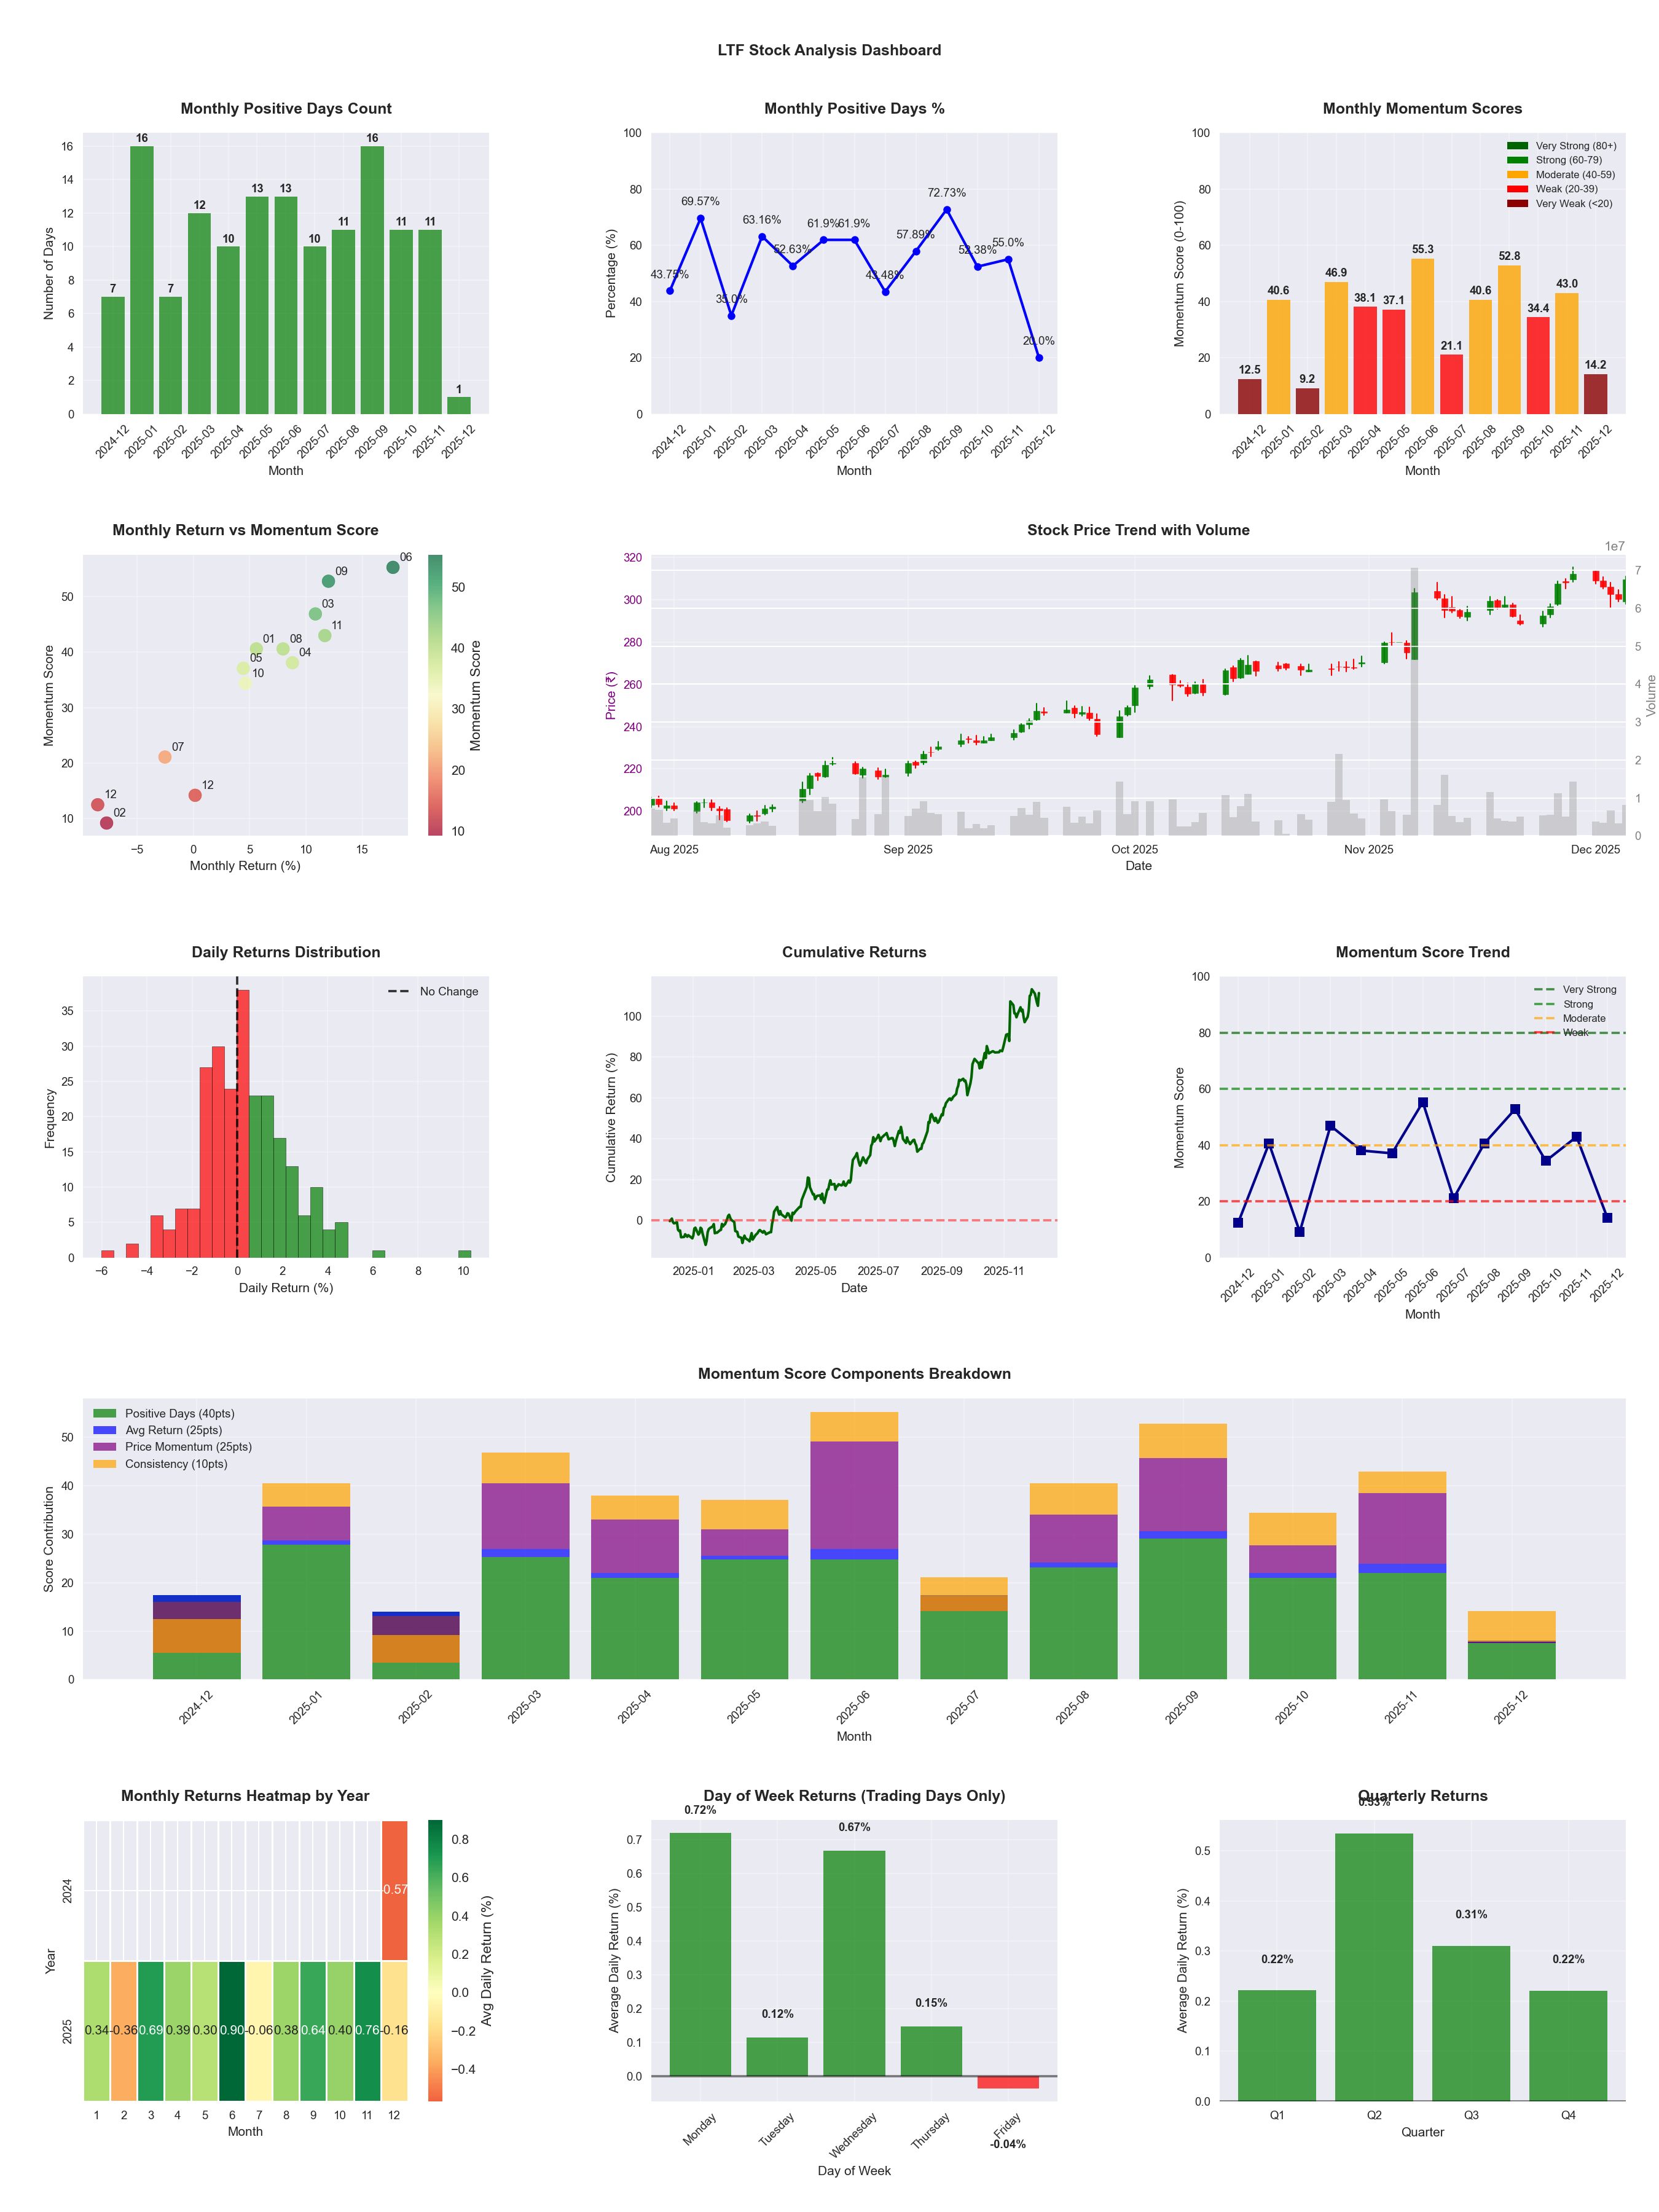
📊 Key Insights & Metrics
Symbol
📈 LTF
Date
📅 2026-04-11
Volatility
🟡 2.11%
Risk Profile
⚠️ suitable for aggressive investors
Win Rate
⚠️ 53.7%
Avg Daily Return
📈 +0.27%
Max Drawdown
📉 -25.01%
IBD RS Score
📊 88.4
Strong
Market Rank
#57
Best Month
🏆 2025-06
Worst Month
📉 2026-03
Best Months to Trade
📅 Apr, Jun, Nov
Best Days to Trade
📅 Monday, Wednesday
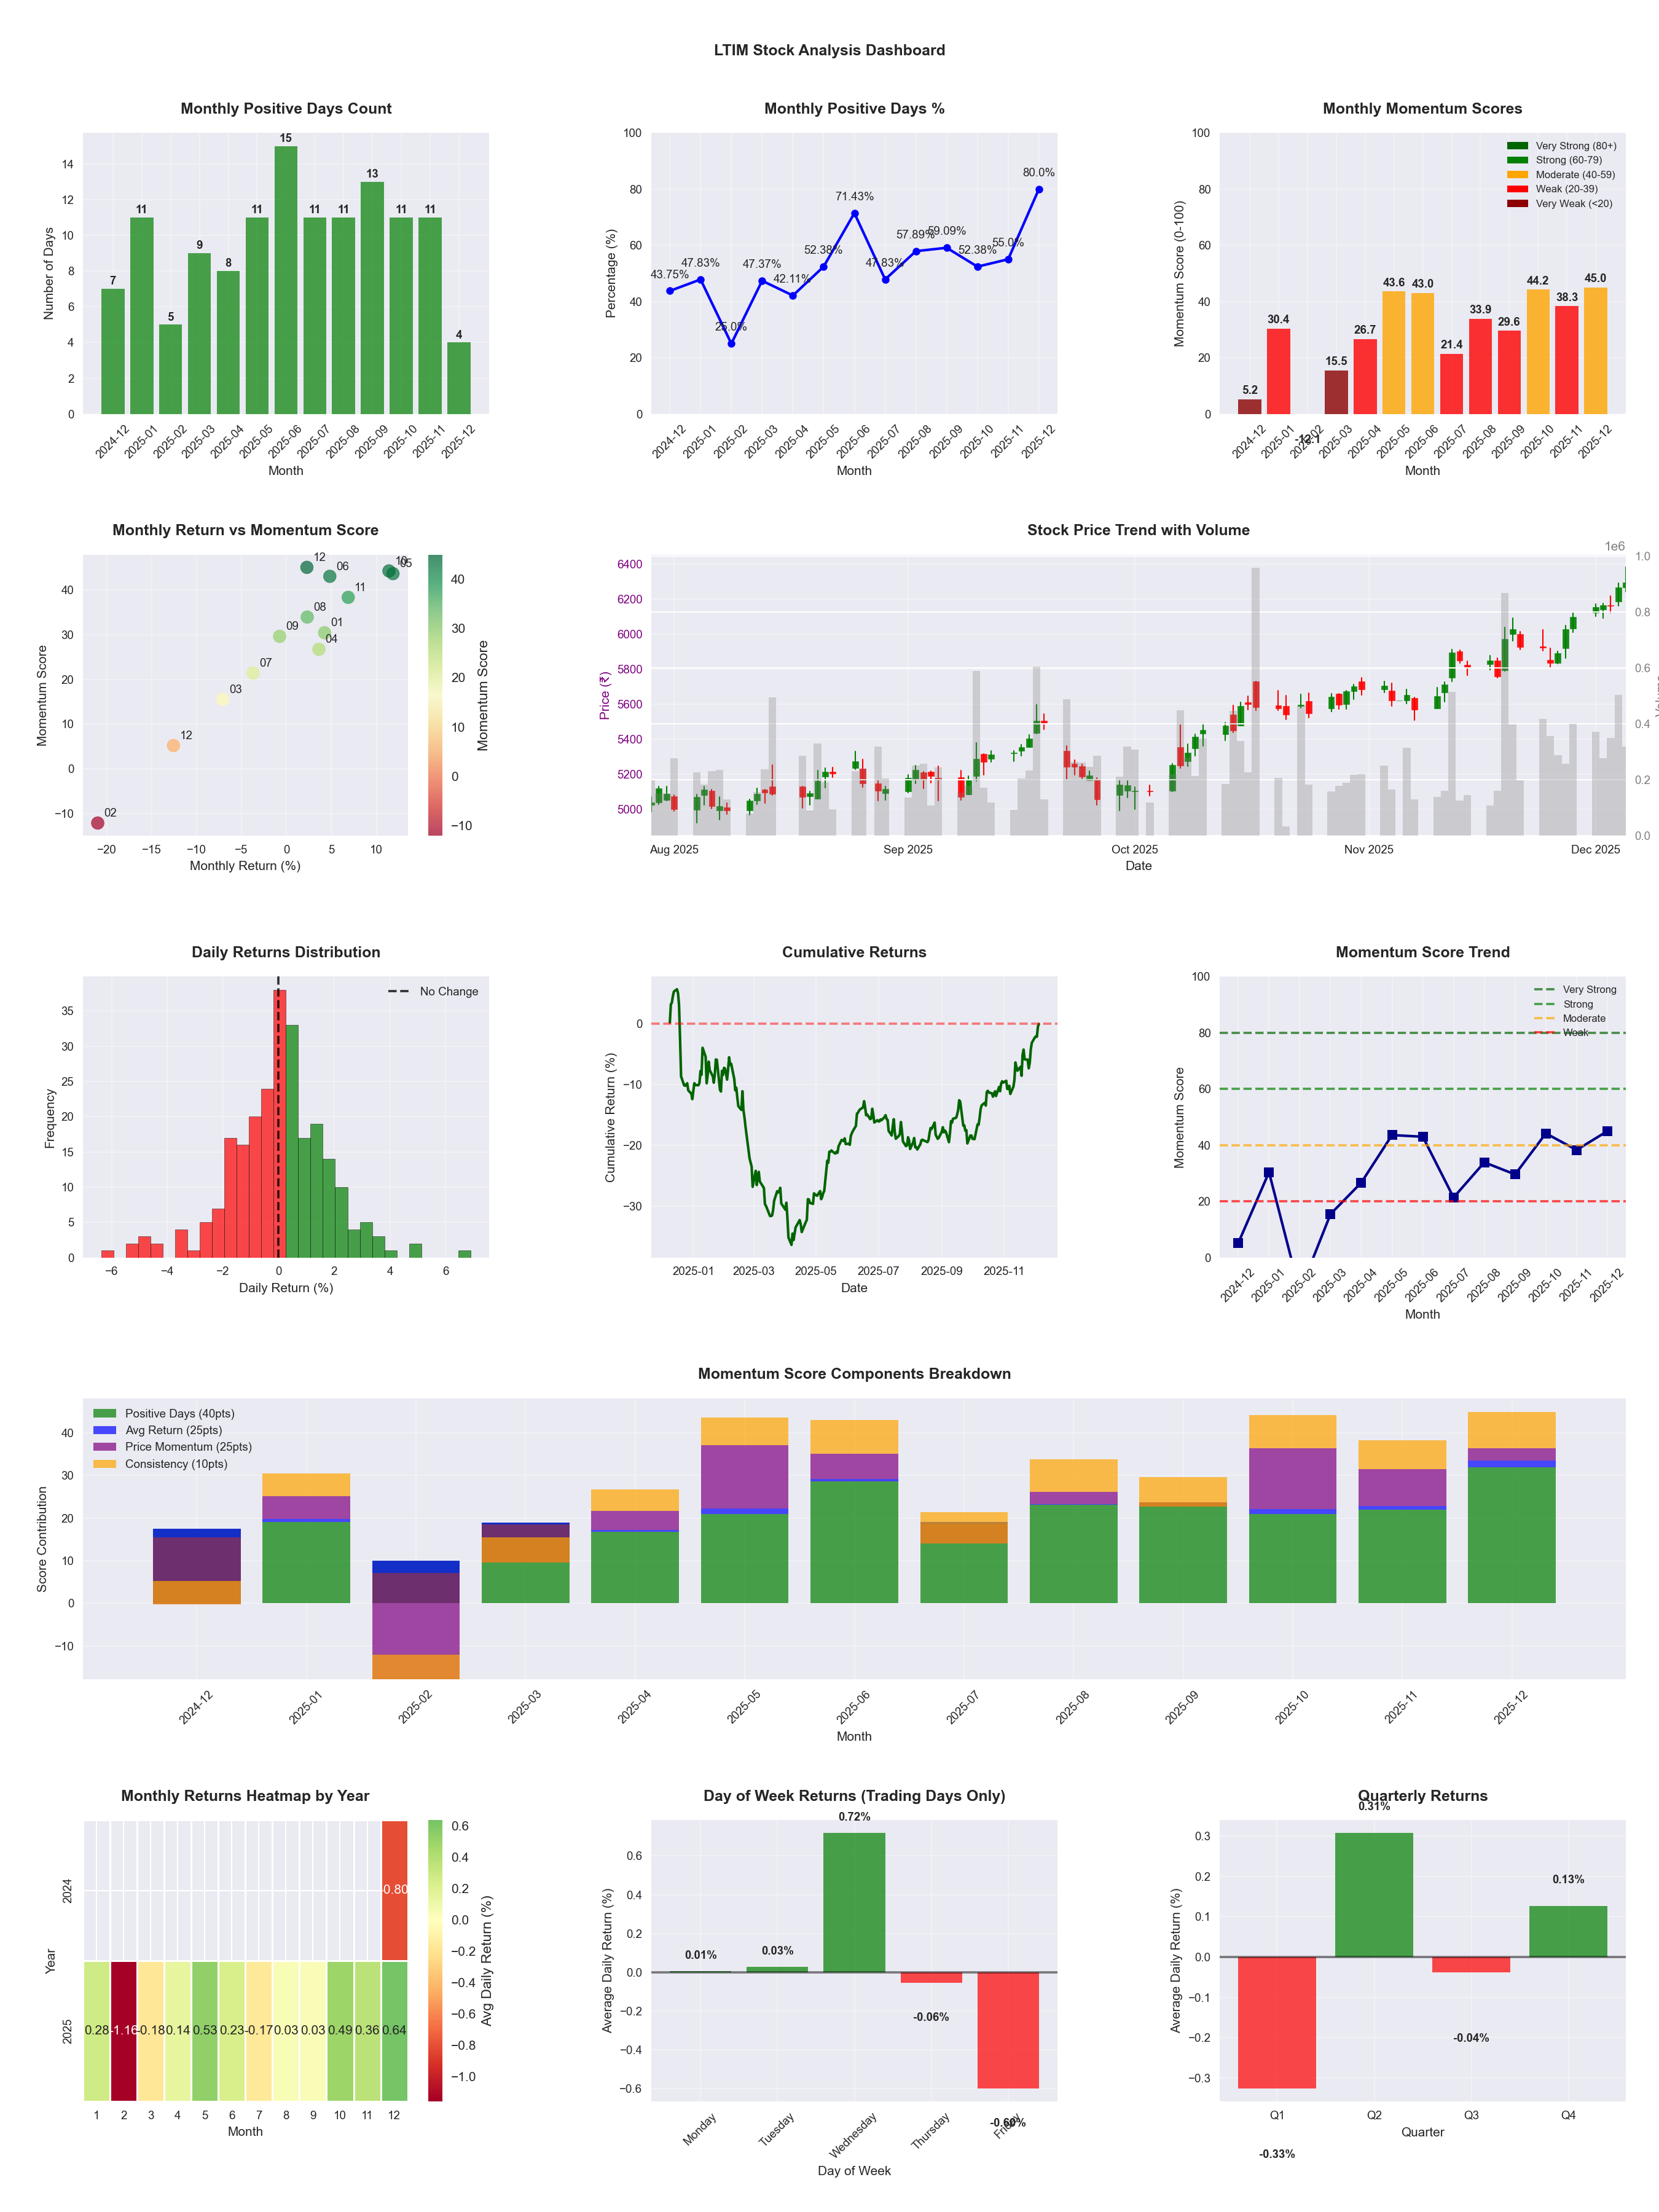
📊 Key Insights & Metrics
Symbol
📈 LTIM
Date
📅 2026-04-11
Volatility
🟡 1.71%
Win Rate
⚠️ 51.2%
Avg Daily Return
📈 +0.04%
Max Drawdown
📉 -37.35%
IBD RS Score
📊 26.8
Weak
Market Rank
#361
Best Month
🏆 2026-04
Best Months to Trade
📅 Apr, May, Oct
Best Days to Trade
📅 Wednesday, Monday
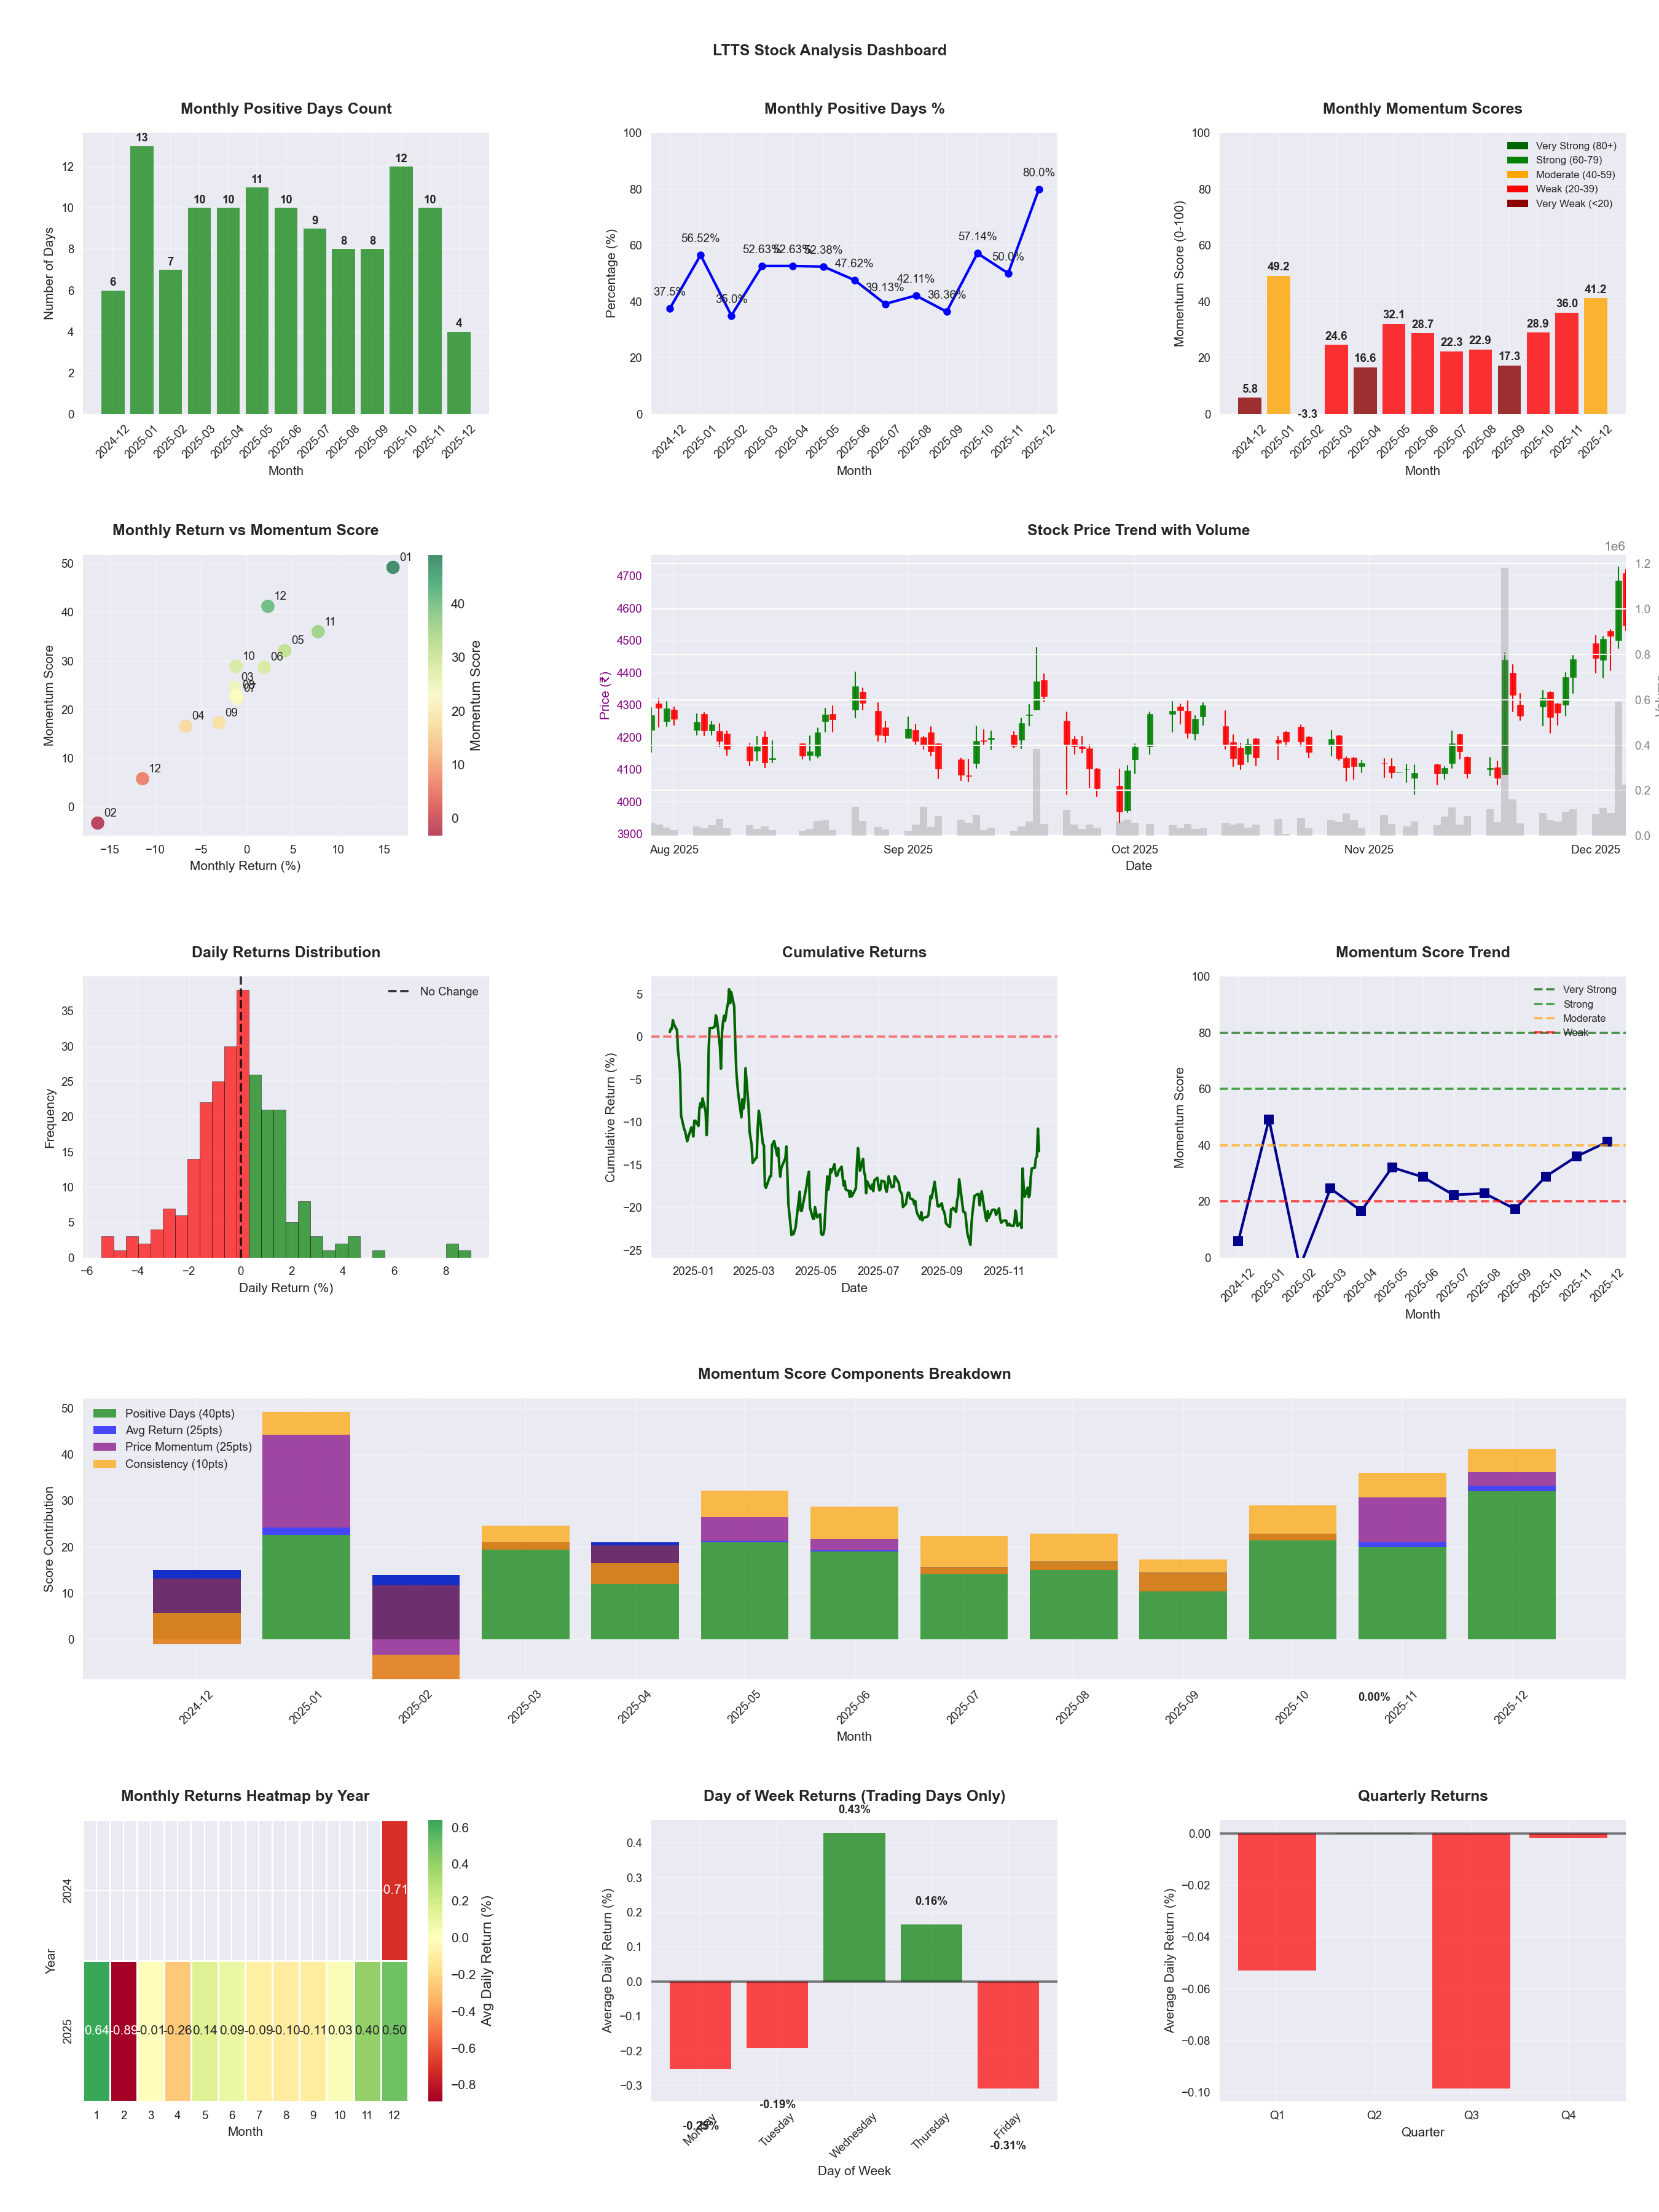
📊 Key Insights & Metrics
Symbol
📈 LTTS
Date
📅 2026-04-11
Volatility
🟡 2.06%
Risk Profile
⚠️ suitable for aggressive investors
Win Rate
⚠️ 46.8%
Avg Daily Return
📉 -0.05%
Max Drawdown
📉 -34.51%
IBD RS Score
📊 14.6
Weak
Market Rank
#421
Best Month
🏆 2025-11
Best Months to Trade
📅 Apr, Nov, May
Best Days to Trade
📅 Wednesday, Thursday
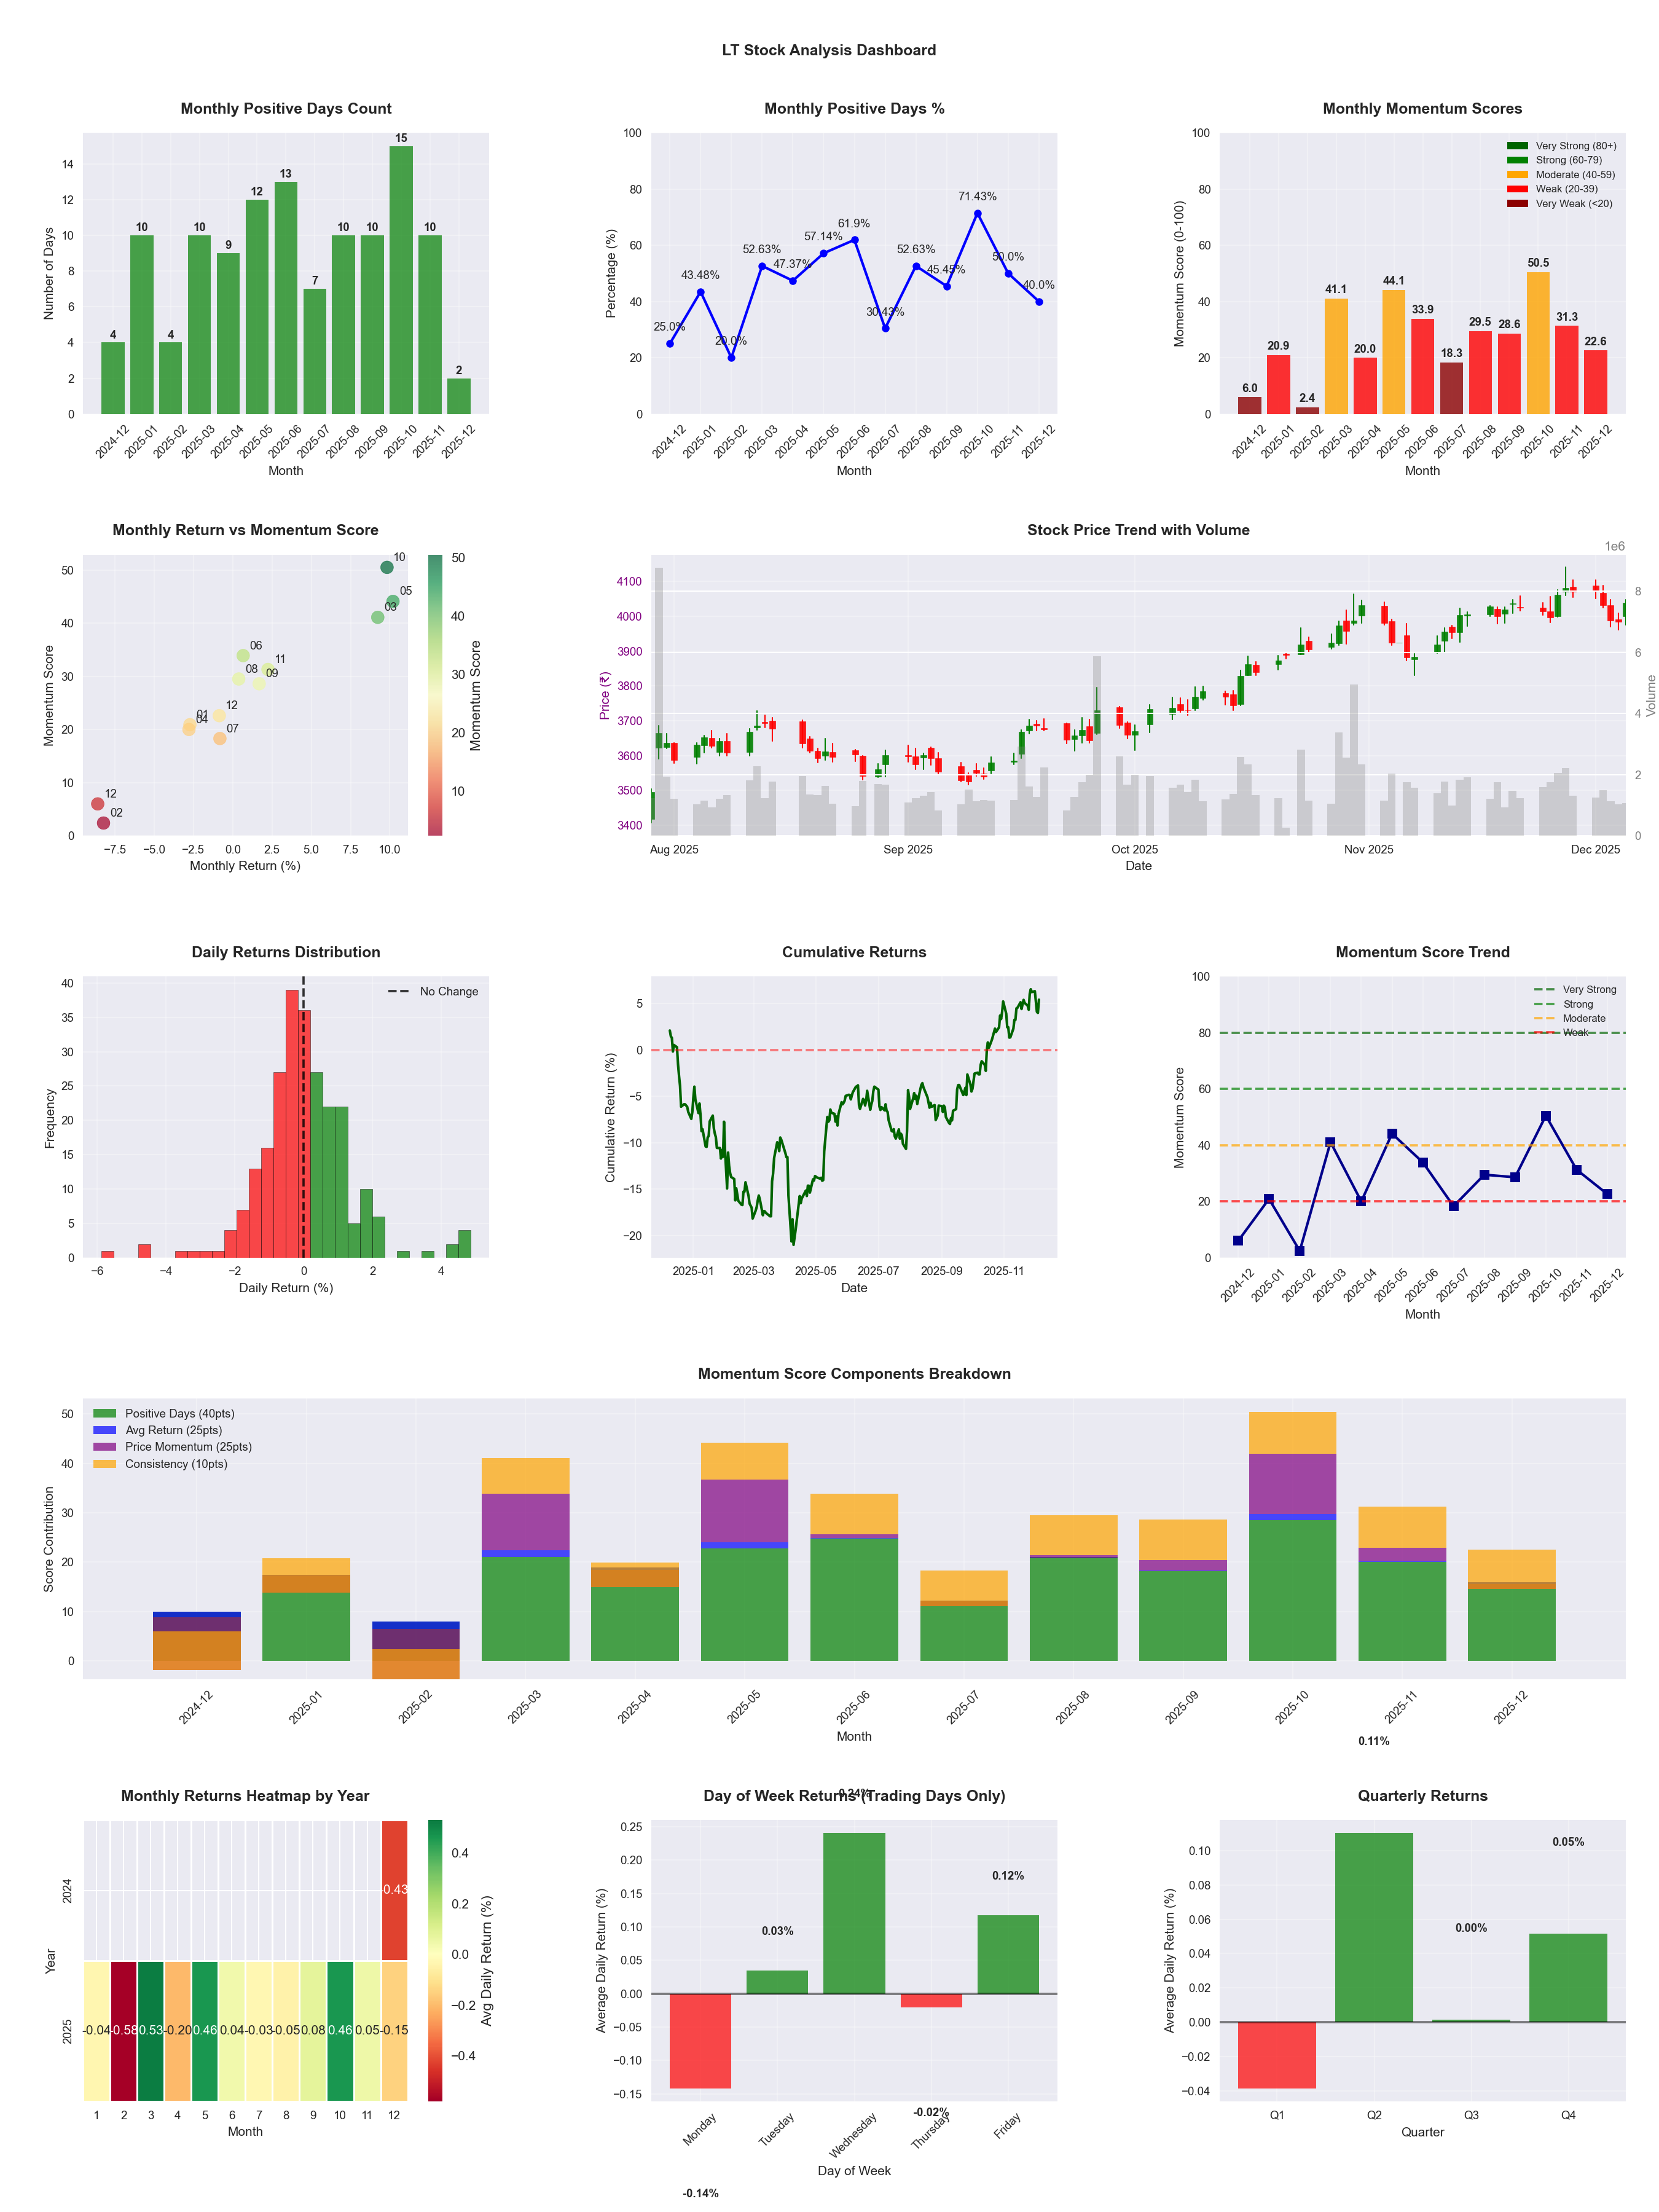
📊 Key Insights & Metrics
Symbol
📈 LT
Date
📅 2026-04-11
Volatility
🟡 1.56%
Win Rate
⚠️ 51.2%
Avg Daily Return
📈 +0.11%
Max Drawdown
📉 -24.35%
IBD RS Score
📊 74.6
Strong
Market Rank
#125
Best Month
🏆 2025-10
Worst Month
📉 2026-03
Best Months to Trade
📅 Apr, Oct, May
Best Days to Trade
📅 Wednesday, Tuesday
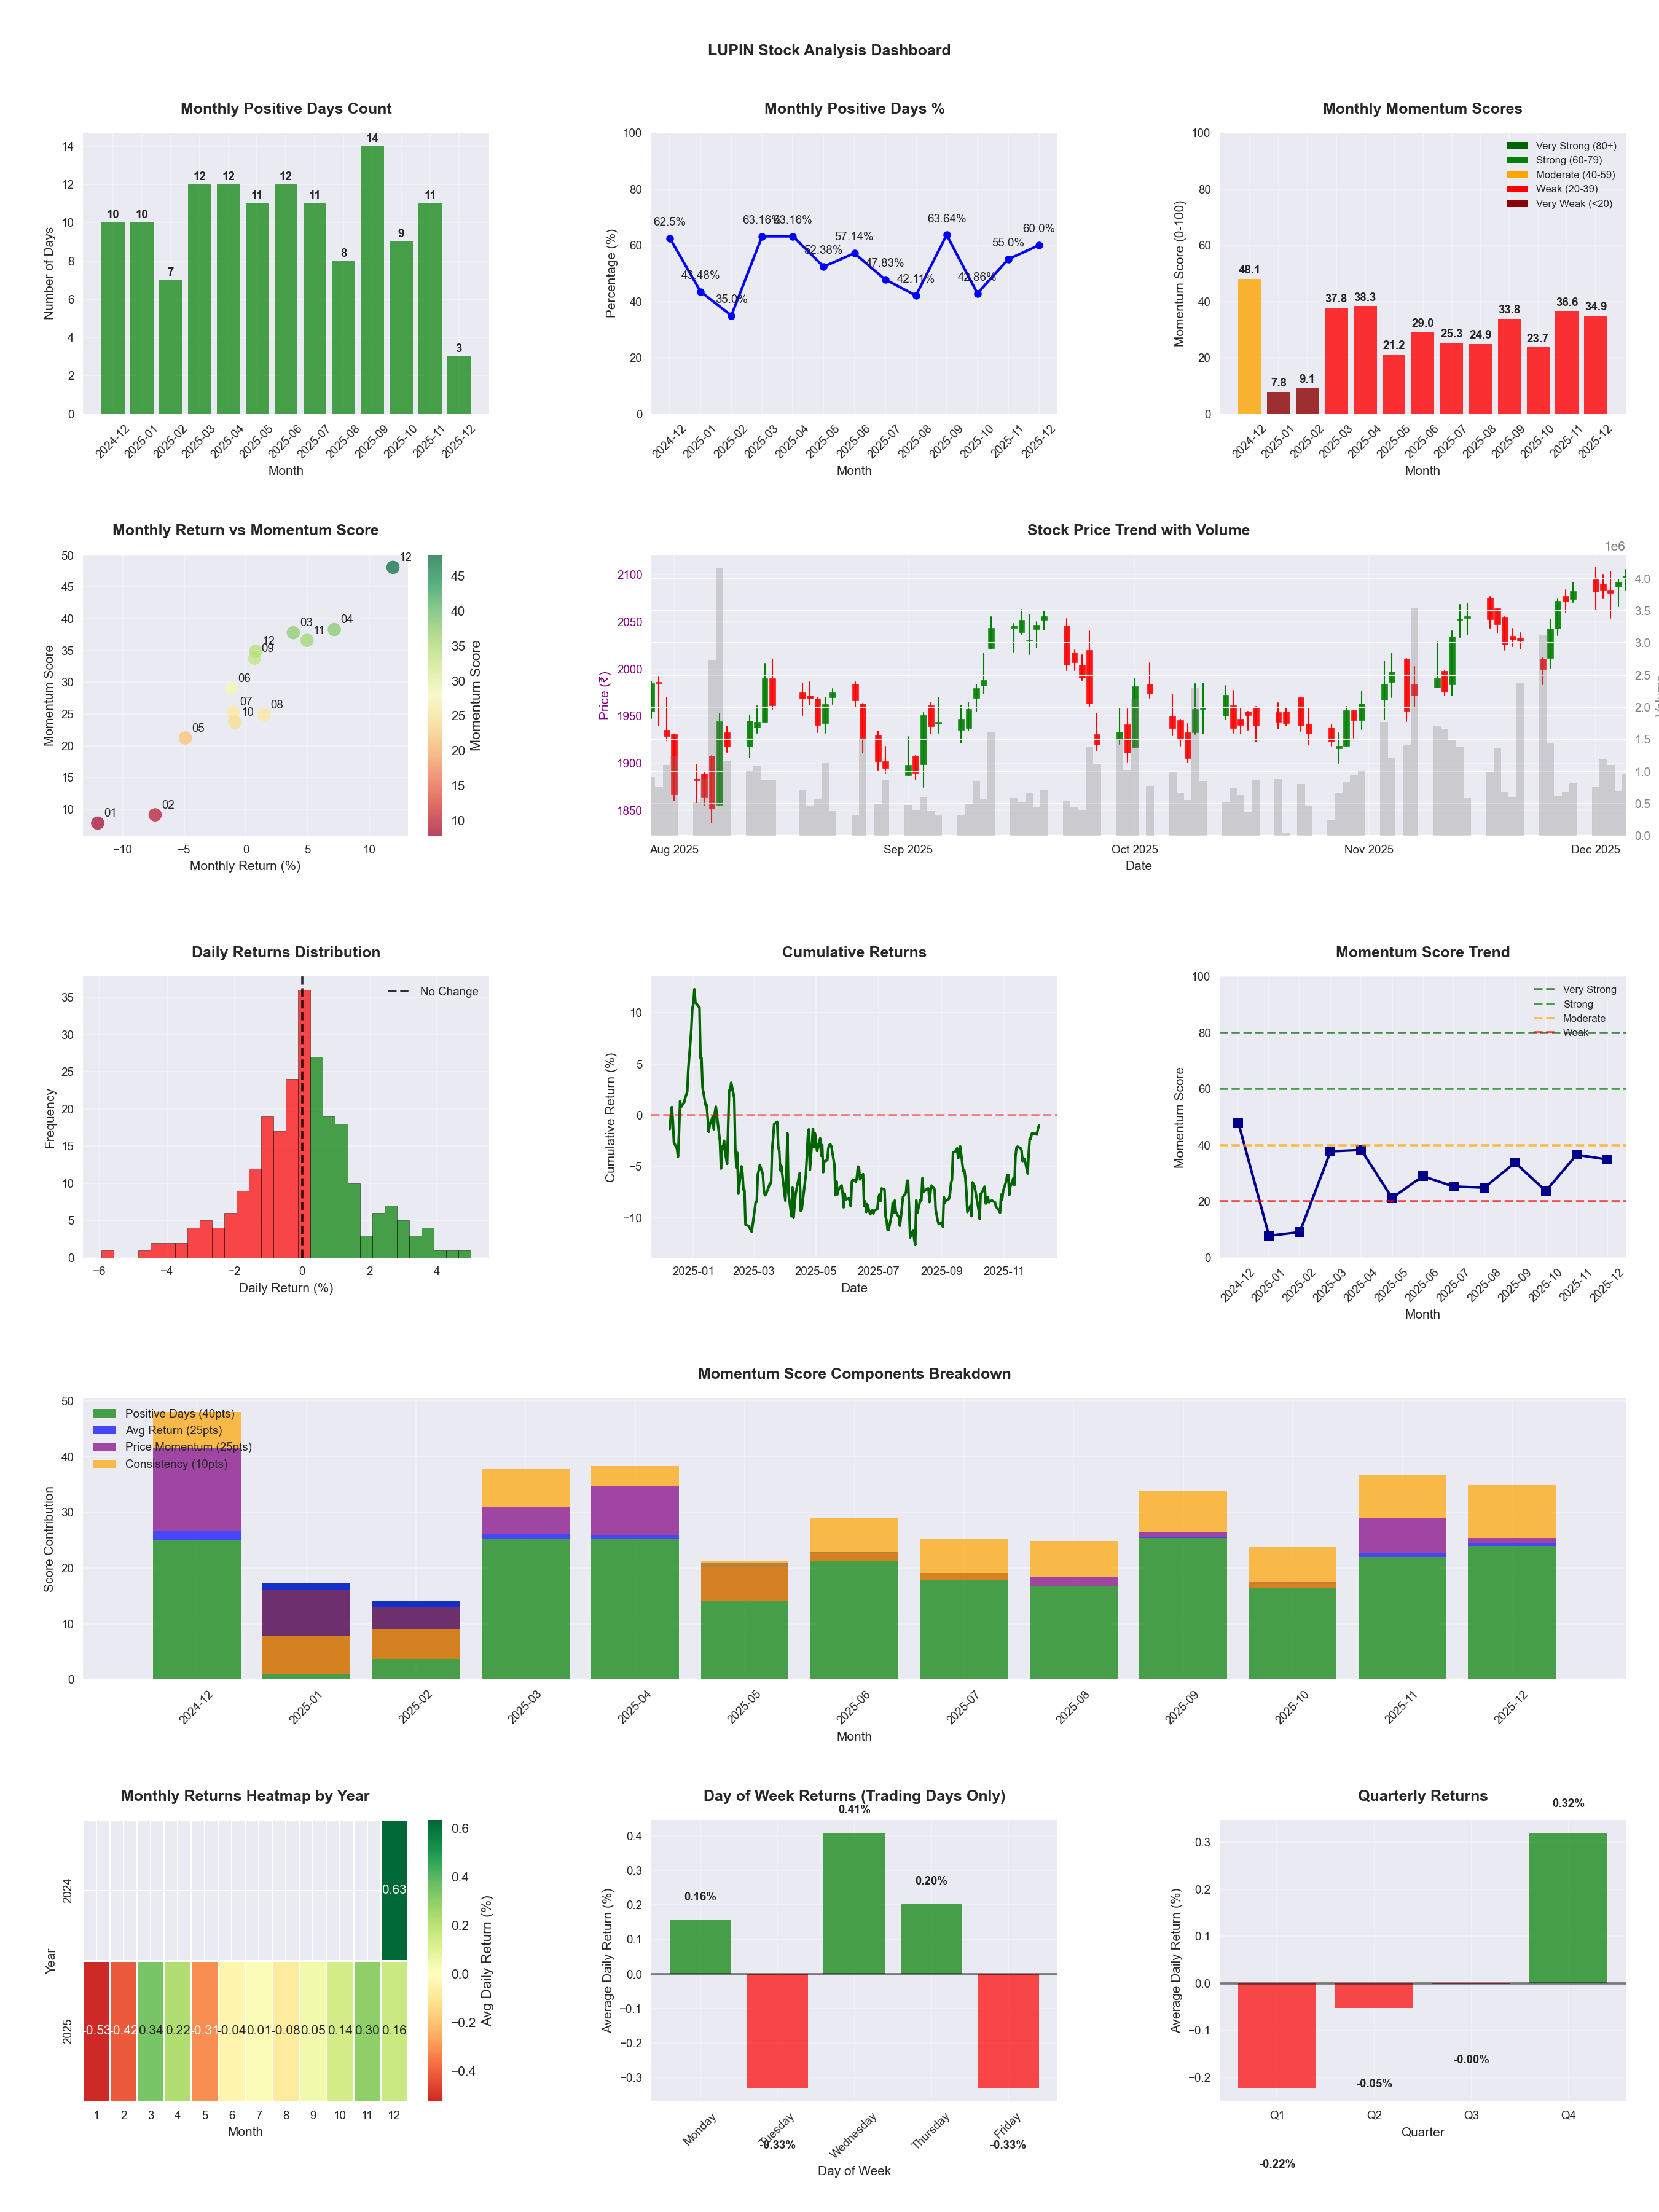
📊 Key Insights & Metrics
Symbol
📈 LUPIN
Date
📅 2026-04-11
Volatility
🟢 1.36%
Win Rate
⚠️ 54.5%
Avg Daily Return
📈 +0.08%
Max Drawdown
📉 -11.50%
IBD RS Score
📊 84.0
Strong
Market Rank
#79
Best Month
🏆 2026-02
Worst Month
📉 2025-05
Best Months to Trade
📅 Apr, Feb, Nov
Best Days to Trade
📅 Wednesday, Thursday
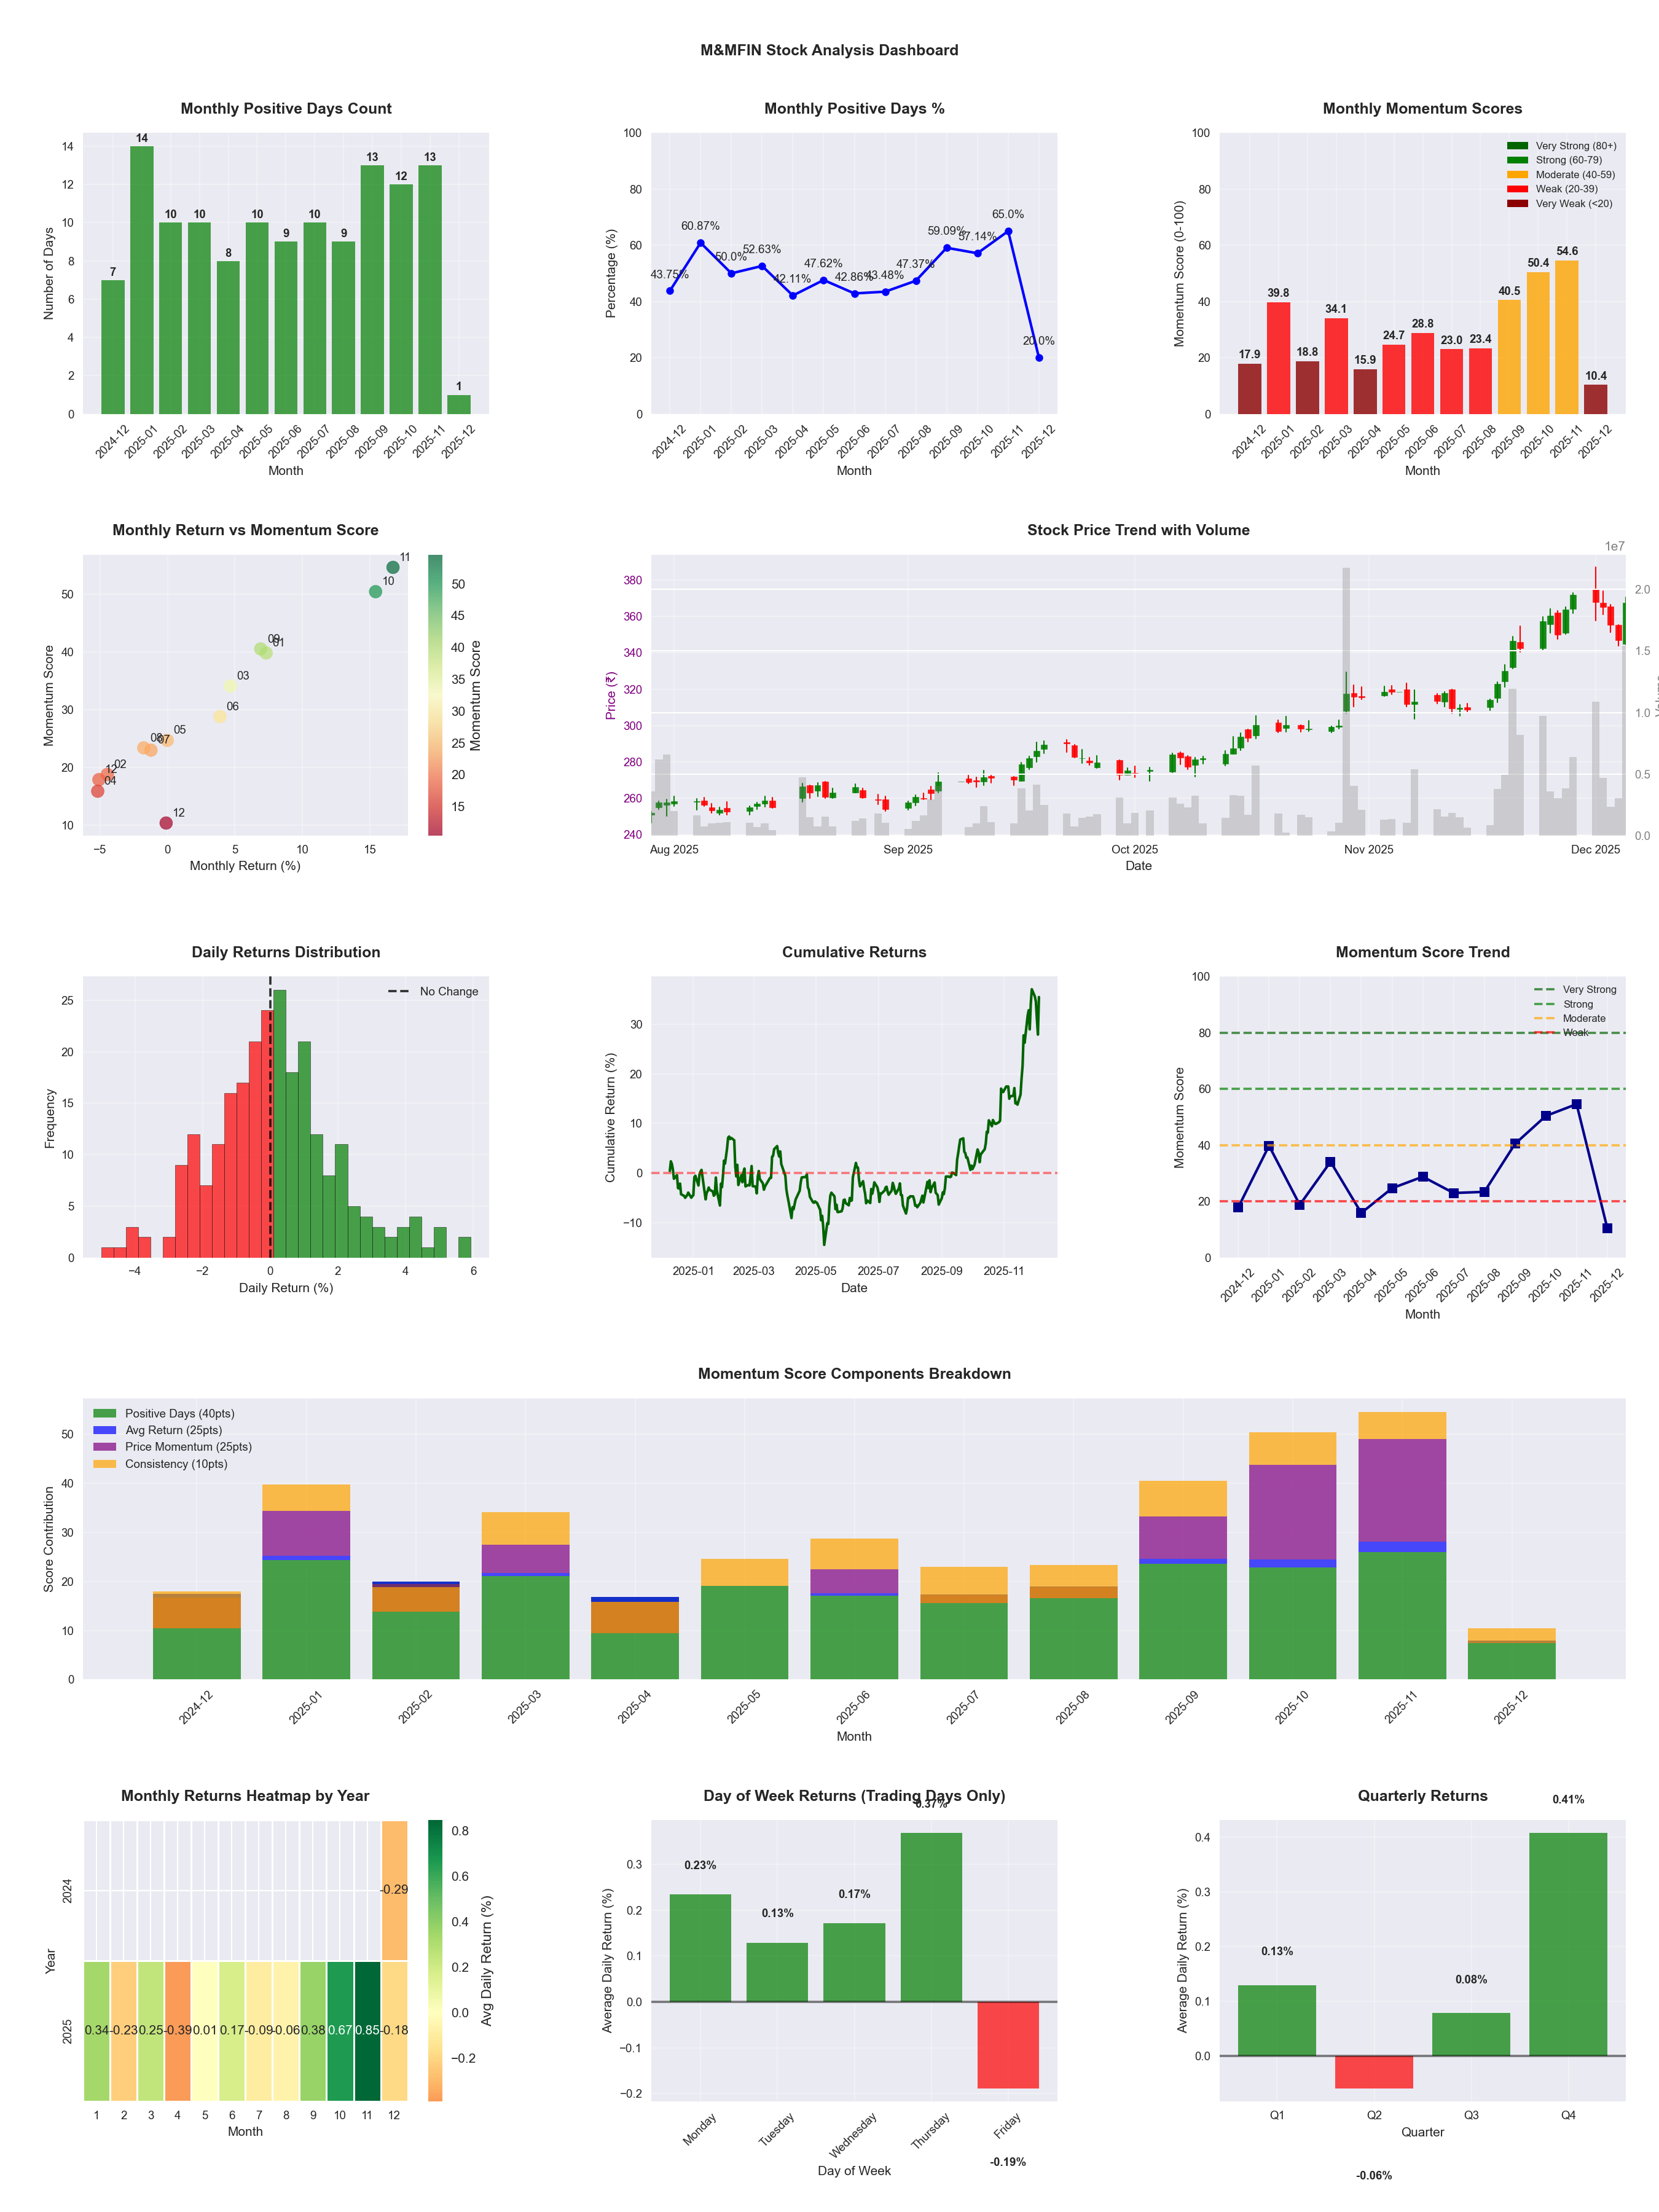
📊 Key Insights & Metrics
Symbol
📈 M
Date
📅 2026-04-11
Volatility
🟡 2.15%
Risk Profile
⚠️ suitable for aggressive investors
Win Rate
⚠️ 50.8%
Avg Daily Return
📈 +0.09%
Max Drawdown
📉 -31.38%
Best Month
🏆 2025-11
Best Months to Trade
📅 Nov, Oct, Dec
Best Days to Trade
📅 Tuesday, Wednesday
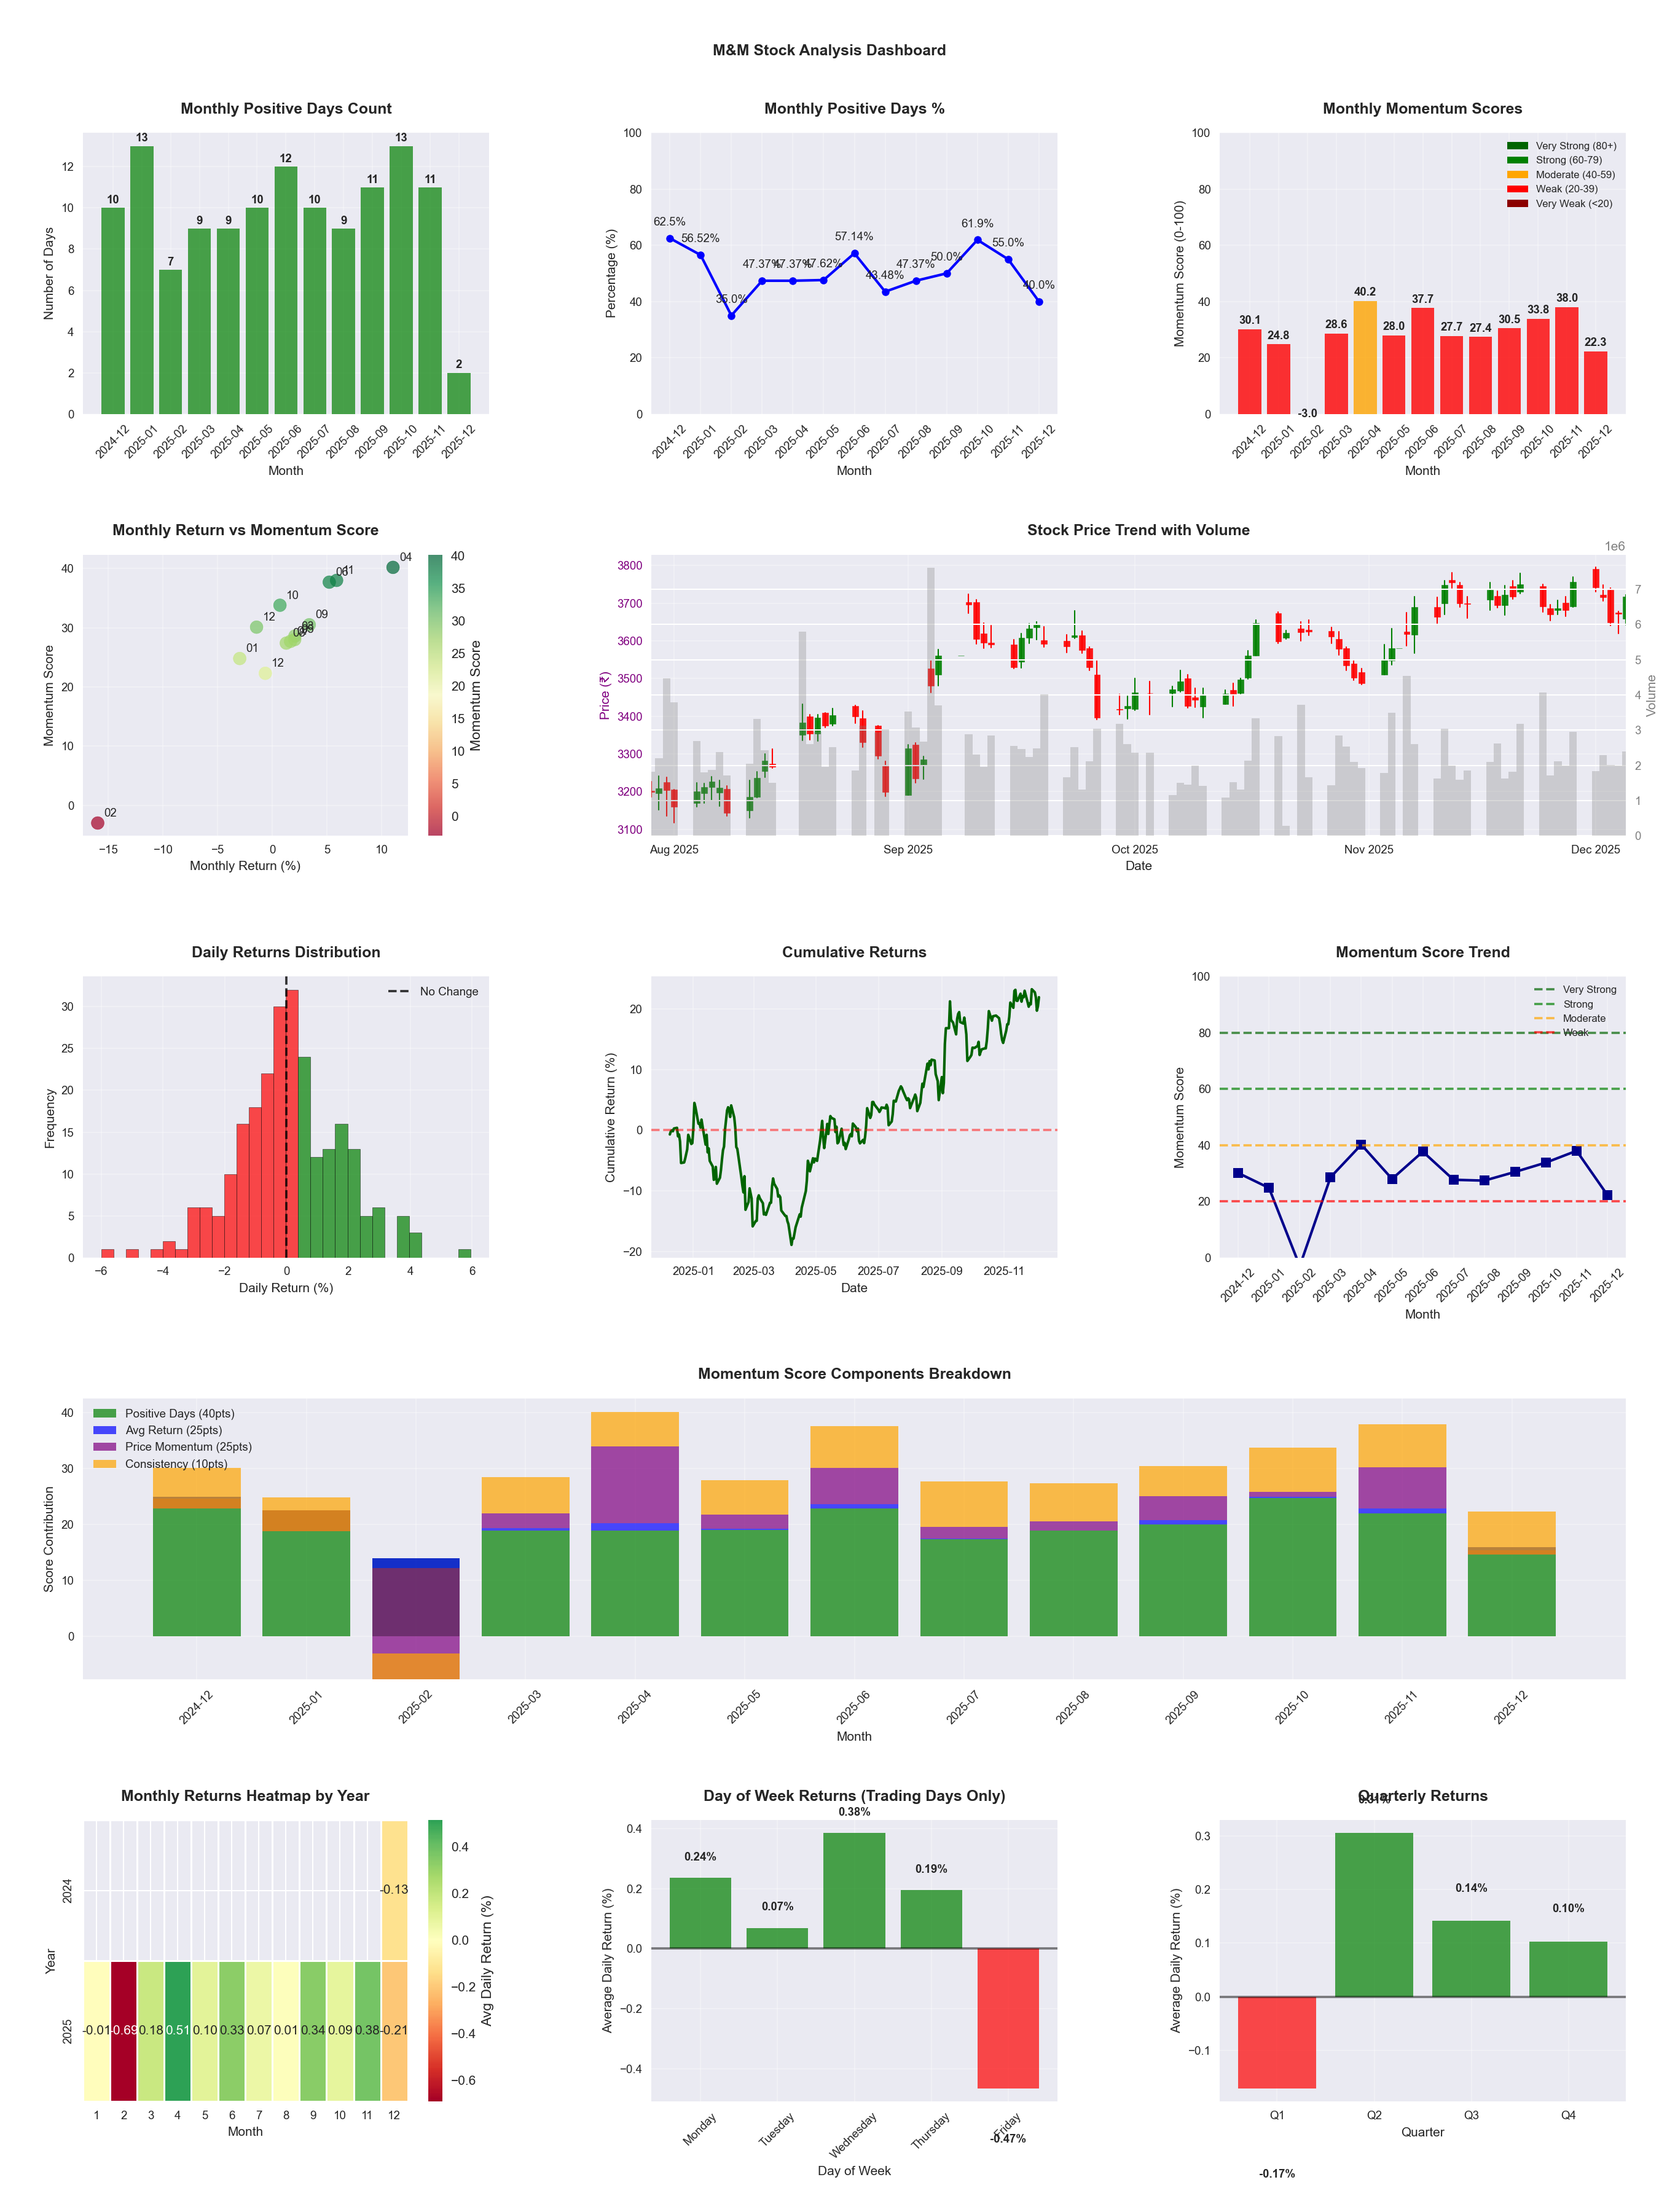
📊 Key Insights & Metrics
Symbol
📈 M
Date
📅 2026-04-11
Volatility
🟡 1.73%
Win Rate
⚠️ 49.6%
Avg Daily Return
📈 +0.11%
Max Drawdown
📉 -22.91%
Best Month
🏆 2025-04
Worst Month
📉 2026-03
Best Months to Trade
📅 Apr, Nov, Sep
Best Days to Trade
📅 Wednesday, Monday
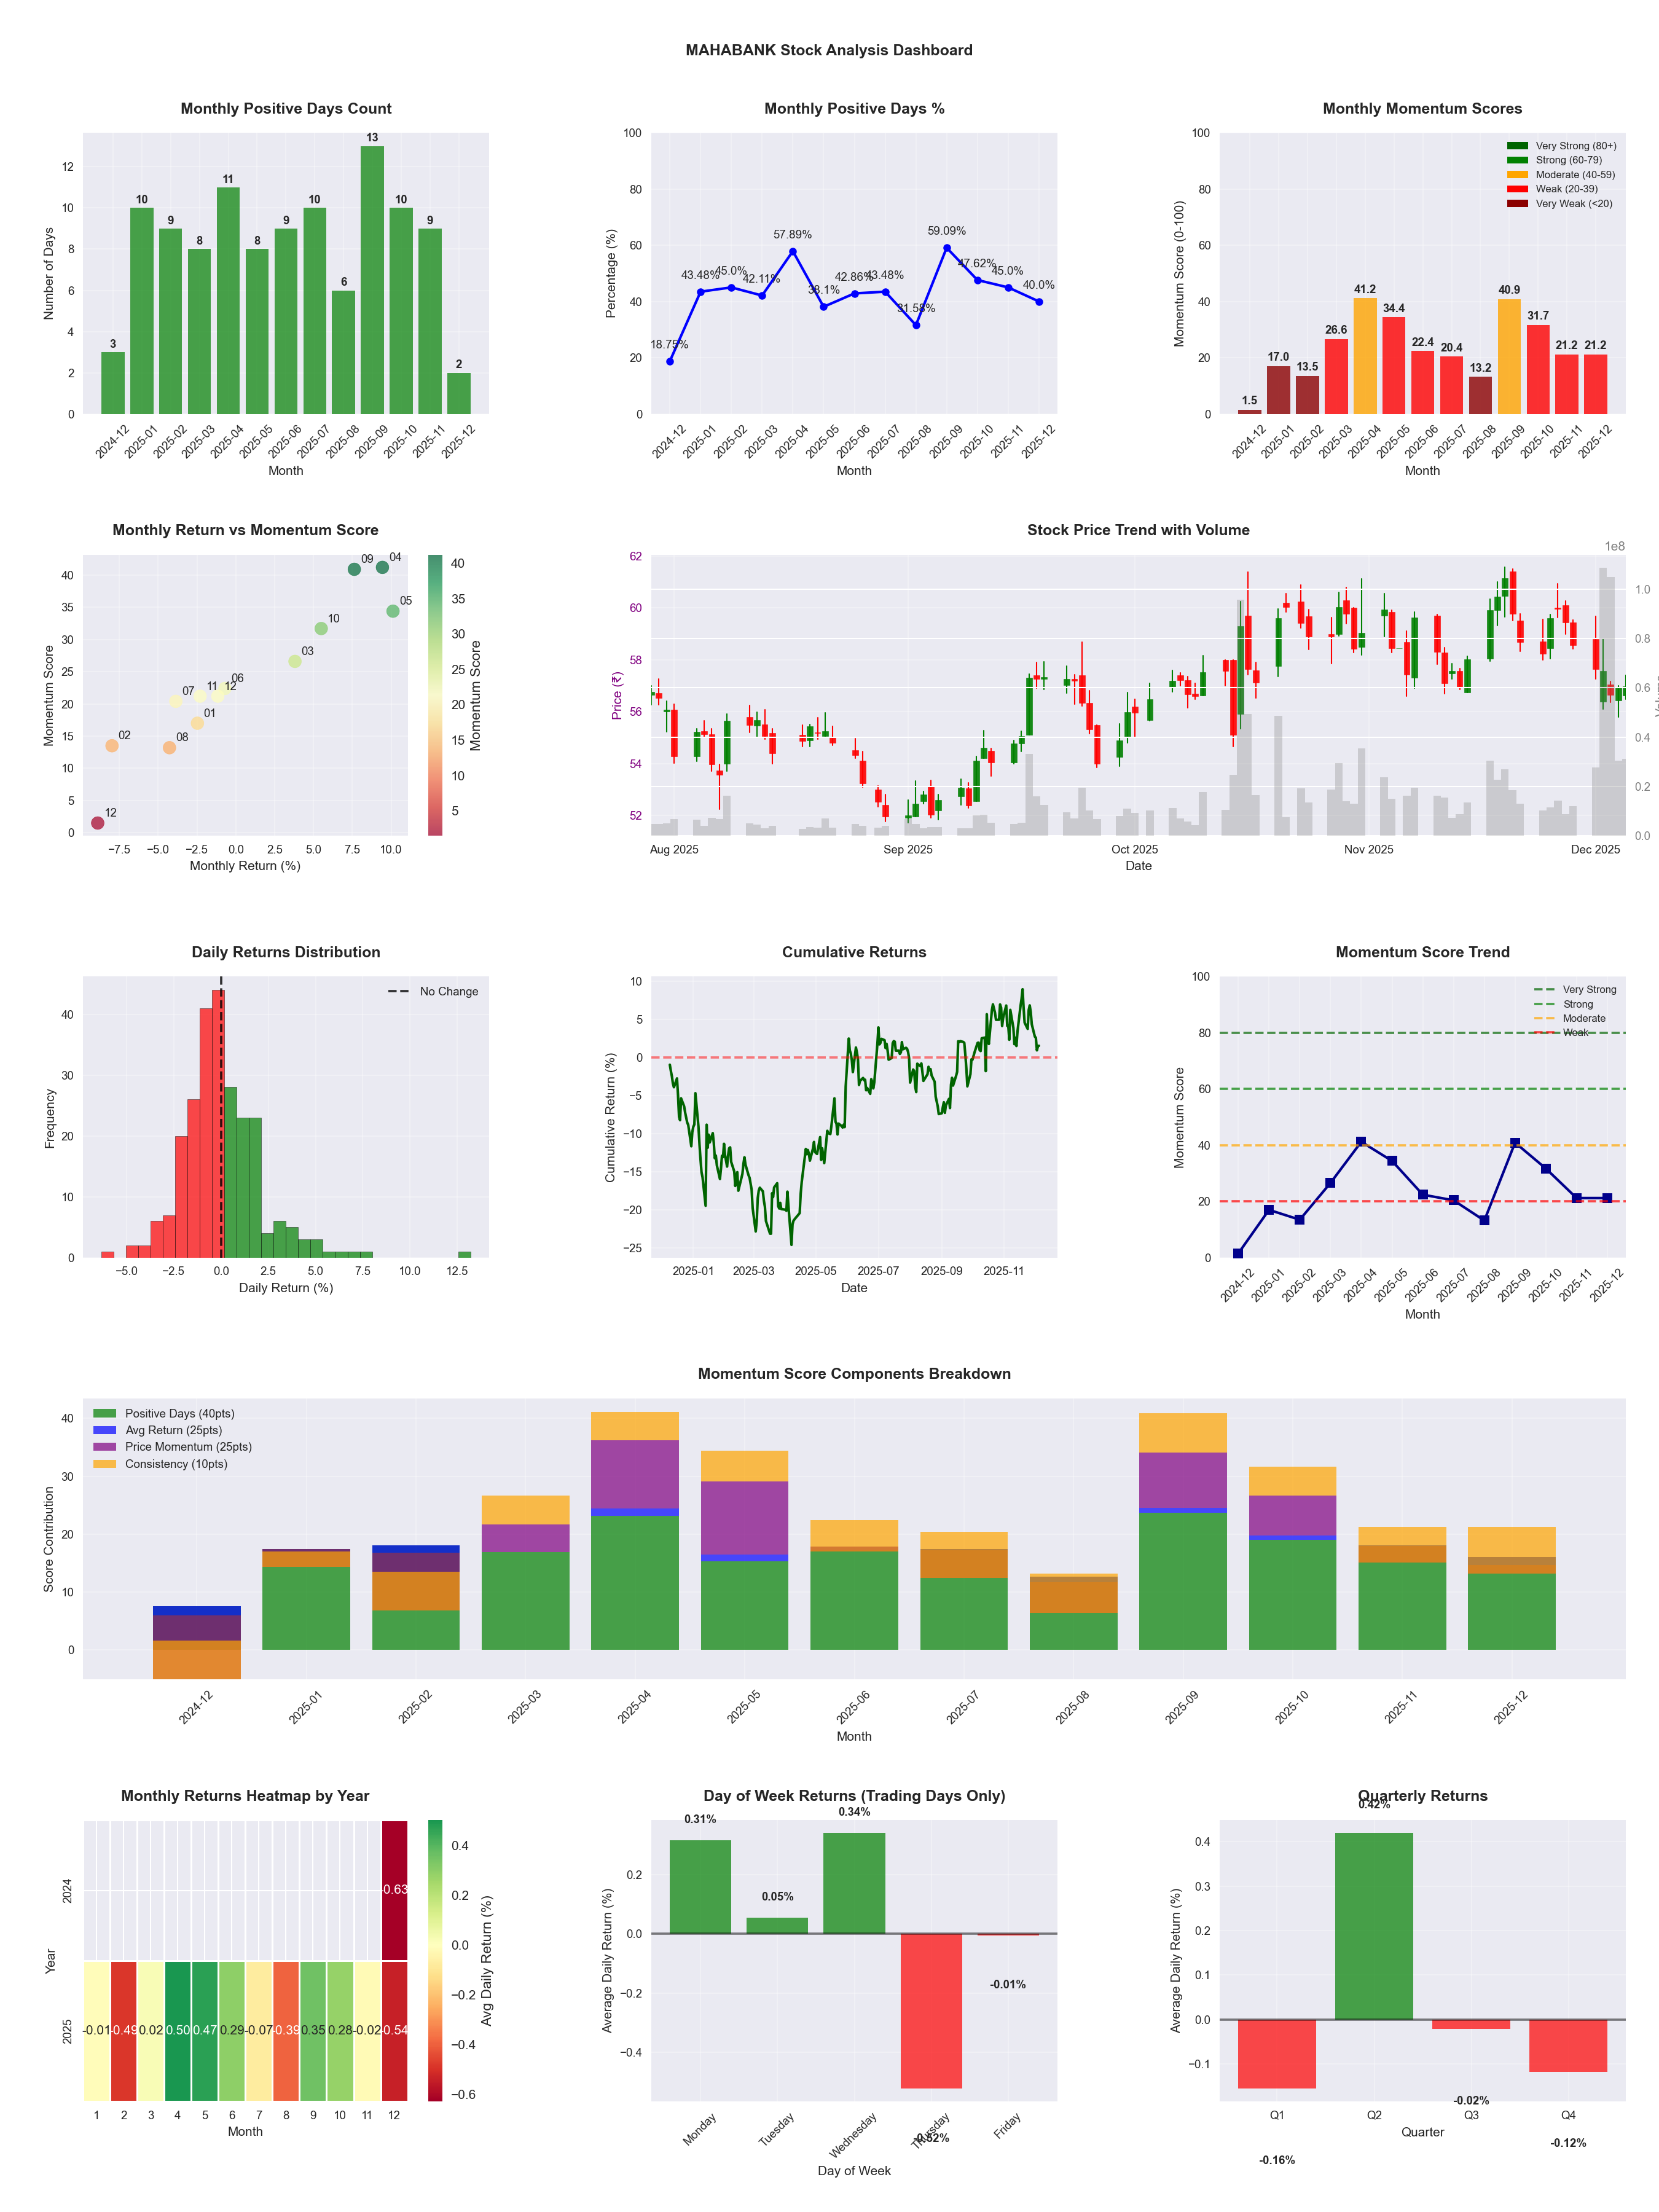
📊 Key Insights & Metrics
Symbol
📈 MAHABANK
Date
📅 2026-04-11
Volatility
🟡 2.13%
Risk Profile
⚠️ suitable for aggressive investors
Win Rate
⚠️ 49.6%
Avg Daily Return
📈 +0.22%
Max Drawdown
📉 -18.93%
IBD RS Score
📊 92.9
Leader
Market Rank
#35
Best Month
🏆 2026-02
Best Months to Trade
📅 Apr, Feb, May
Best Days to Trade
📅 Wednesday, Monday
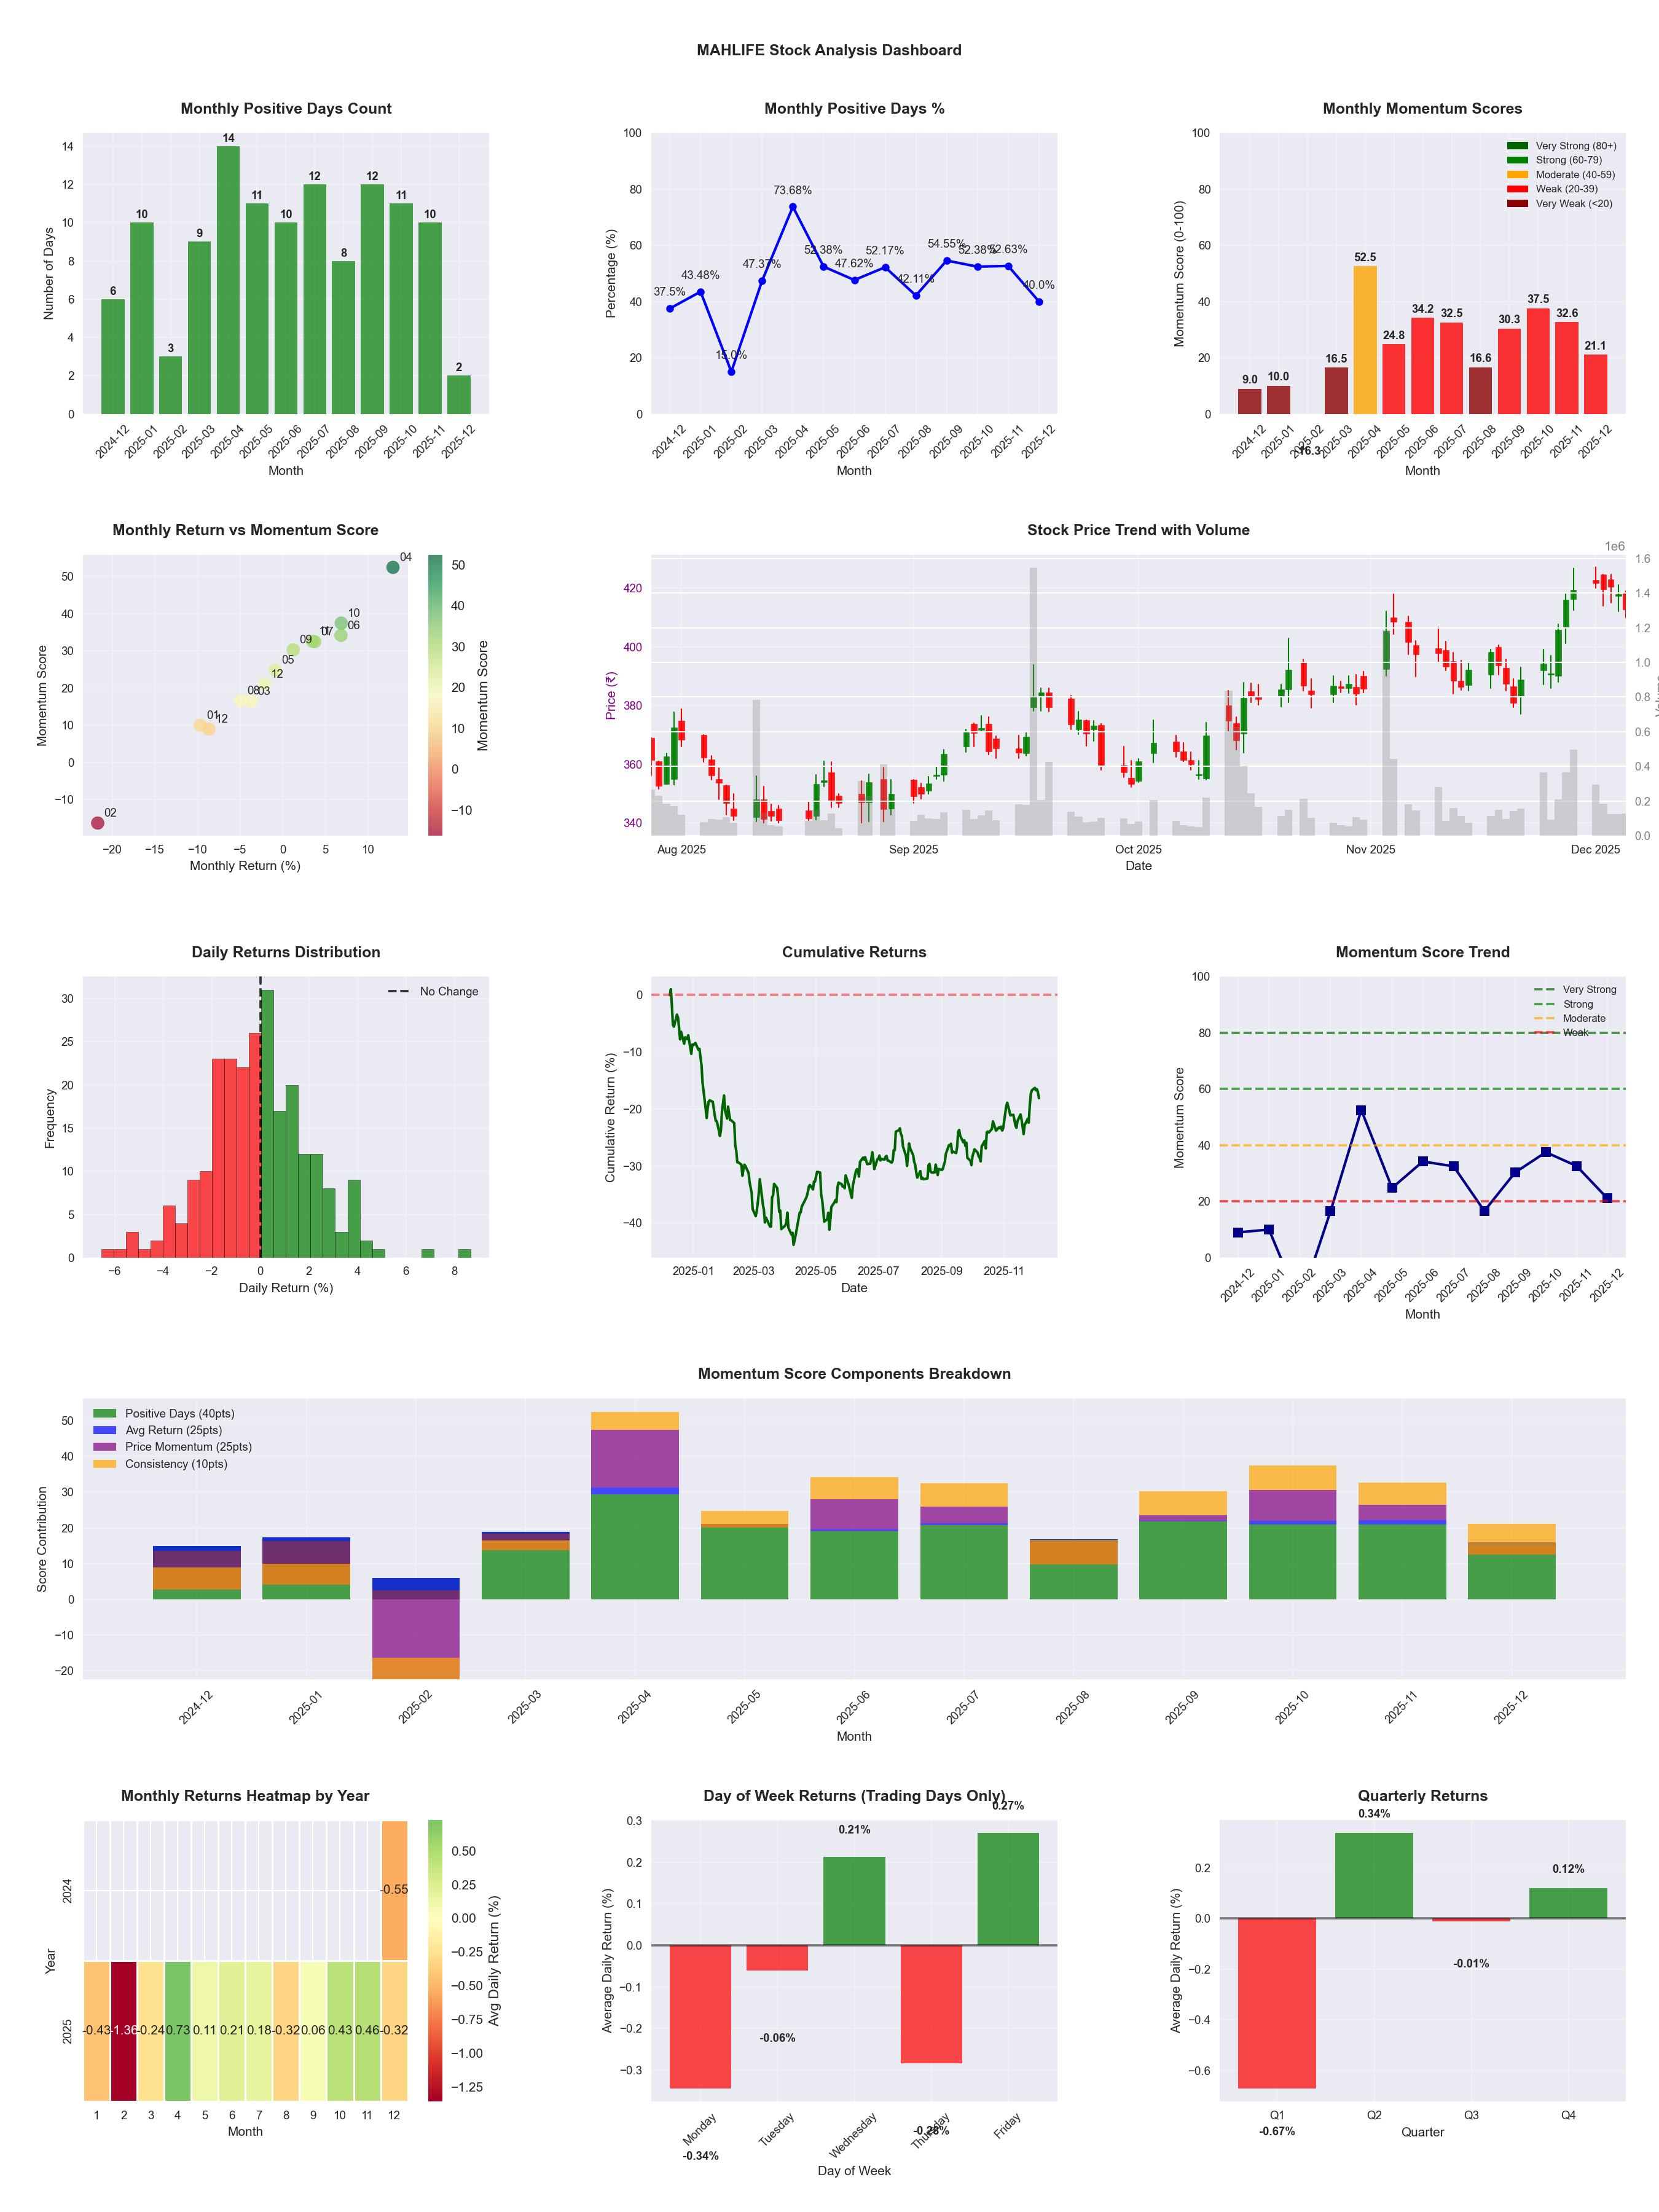
📊 Key Insights & Metrics
Symbol
📈 MAHLIFE
Date
📅 2026-03-21
Volatility
🟡 1.98%
Win Rate
⚠️ 49.4%
Avg Daily Return
📈 +0.02%
Max Drawdown
📉 -20.57%
Best Month
🏆 2025-04
Best Months to Trade
📅 Apr, Nov, Oct
Best Days to Trade
📅 Wednesday, Monday
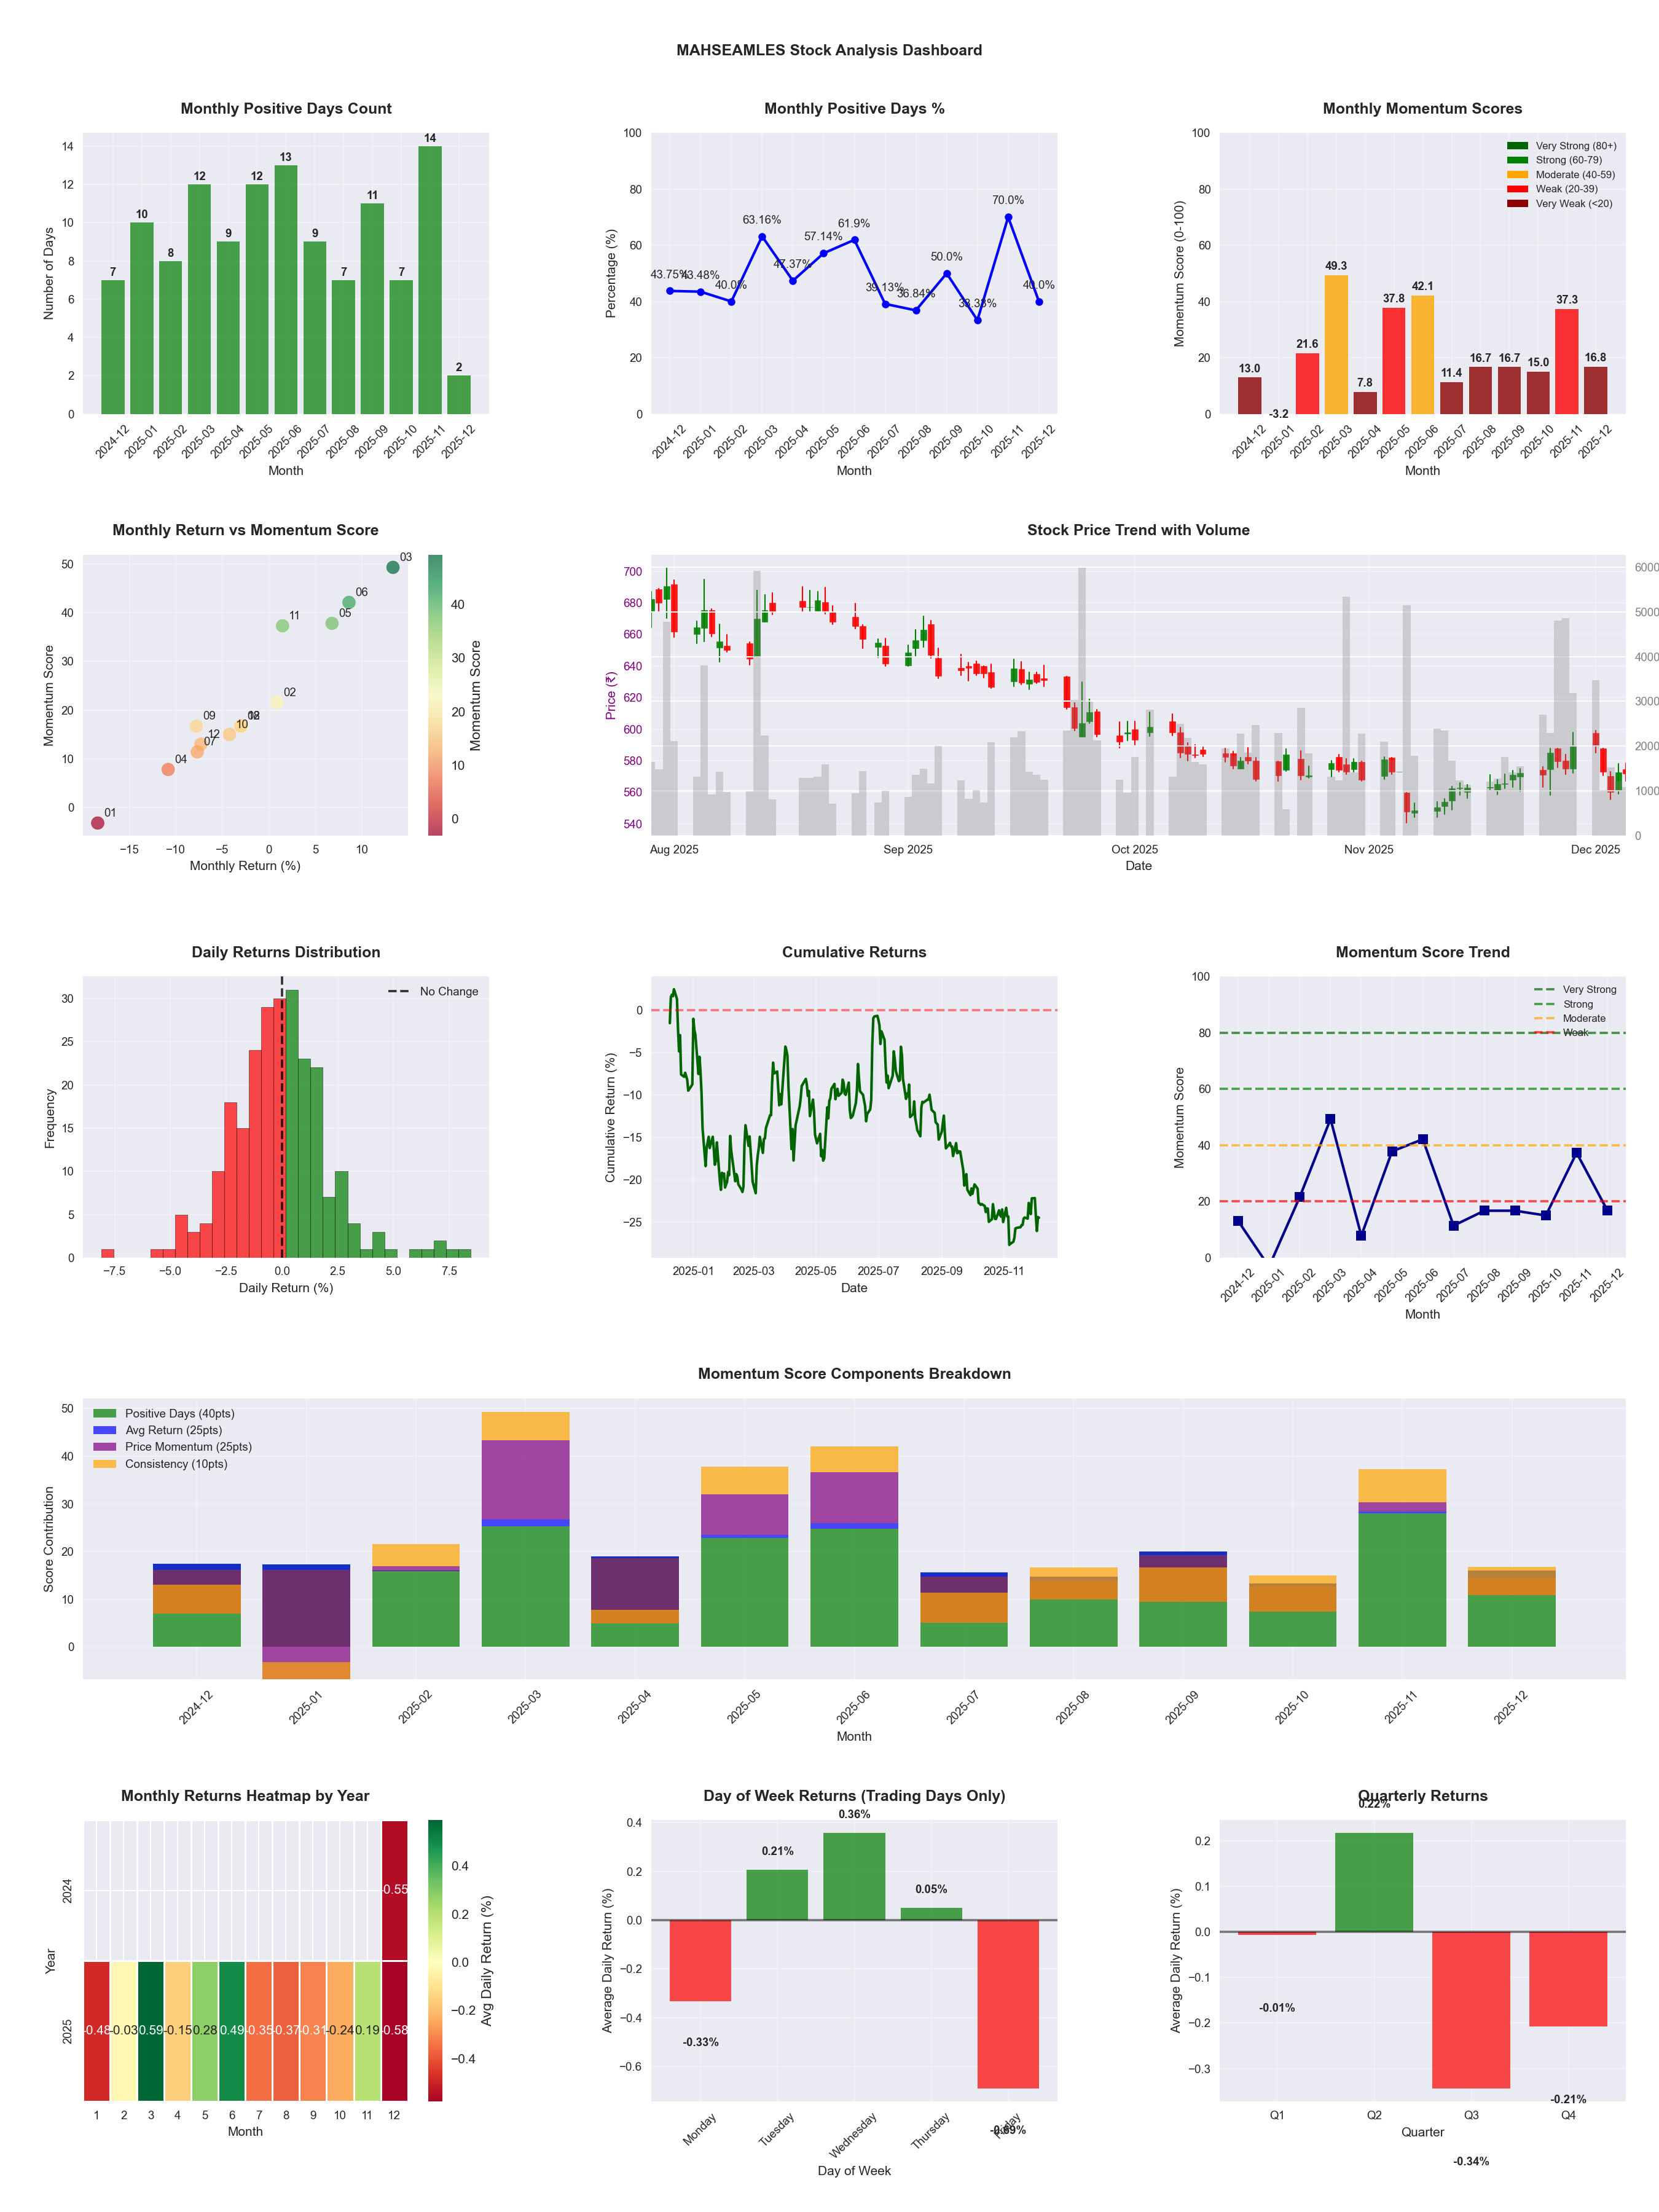
📊 Key Insights & Metrics
Symbol
📈 MAHSEAMLES
Date
📅 2026-04-11
Volatility
🟡 1.74%
Win Rate
⚠️ 50.0%
Avg Daily Return
📉 -0.00%
Max Drawdown
📉 -32.63%
IBD RS Score
📊 70.0
Average
Market Rank
#148
Best Month
🏆 2026-04
Worst Month
📉 2025-07
Best Months to Trade
📅 Apr, Jun, Feb
Best Days to Trade
📅 Wednesday, Monday
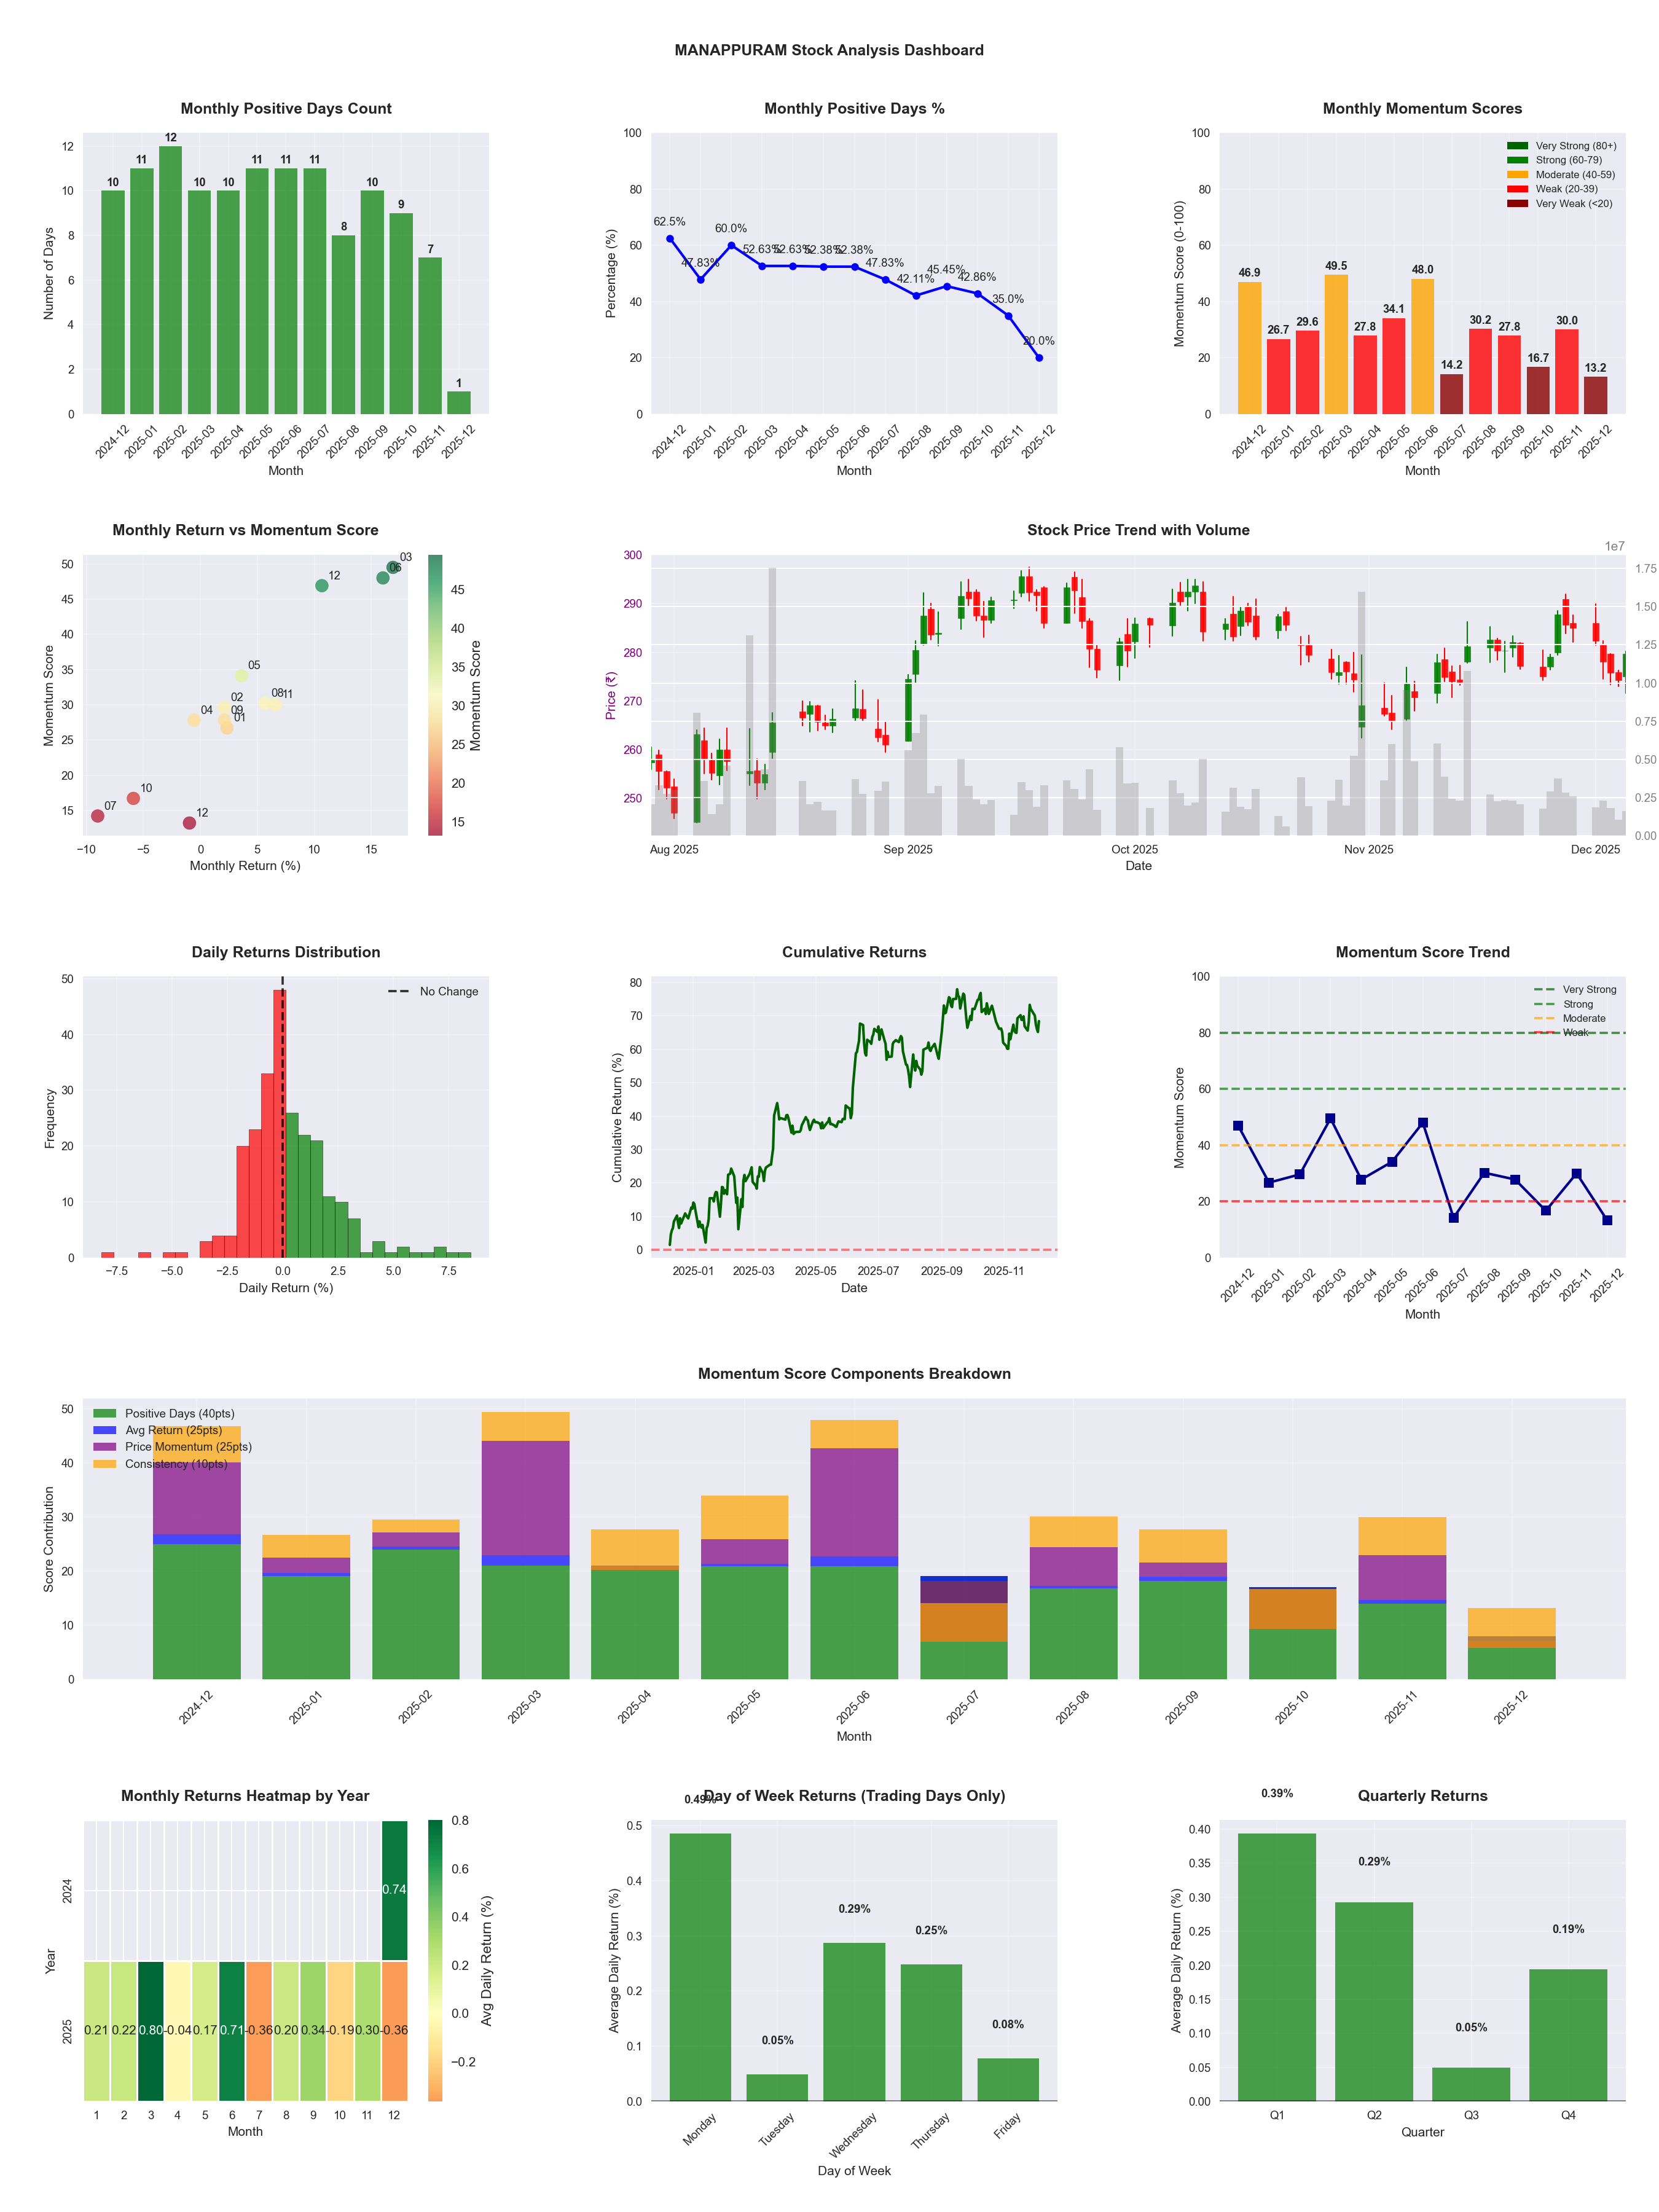
📊 Key Insights & Metrics
Symbol
📈 MANAPPURAM
Date
📅 2026-04-11
Volatility
🟡 1.92%
Win Rate
⚠️ 48.0%
Avg Daily Return
📈 +0.09%
Max Drawdown
📉 -21.37%
IBD RS Score
📊 63.5
Average
Market Rank
#180
Best Month
🏆 2025-06
Worst Month
📉 2026-03
Best Months to Trade
📅 Jun, Apr, Dec
Best Days to Trade
📅 Monday, Wednesday
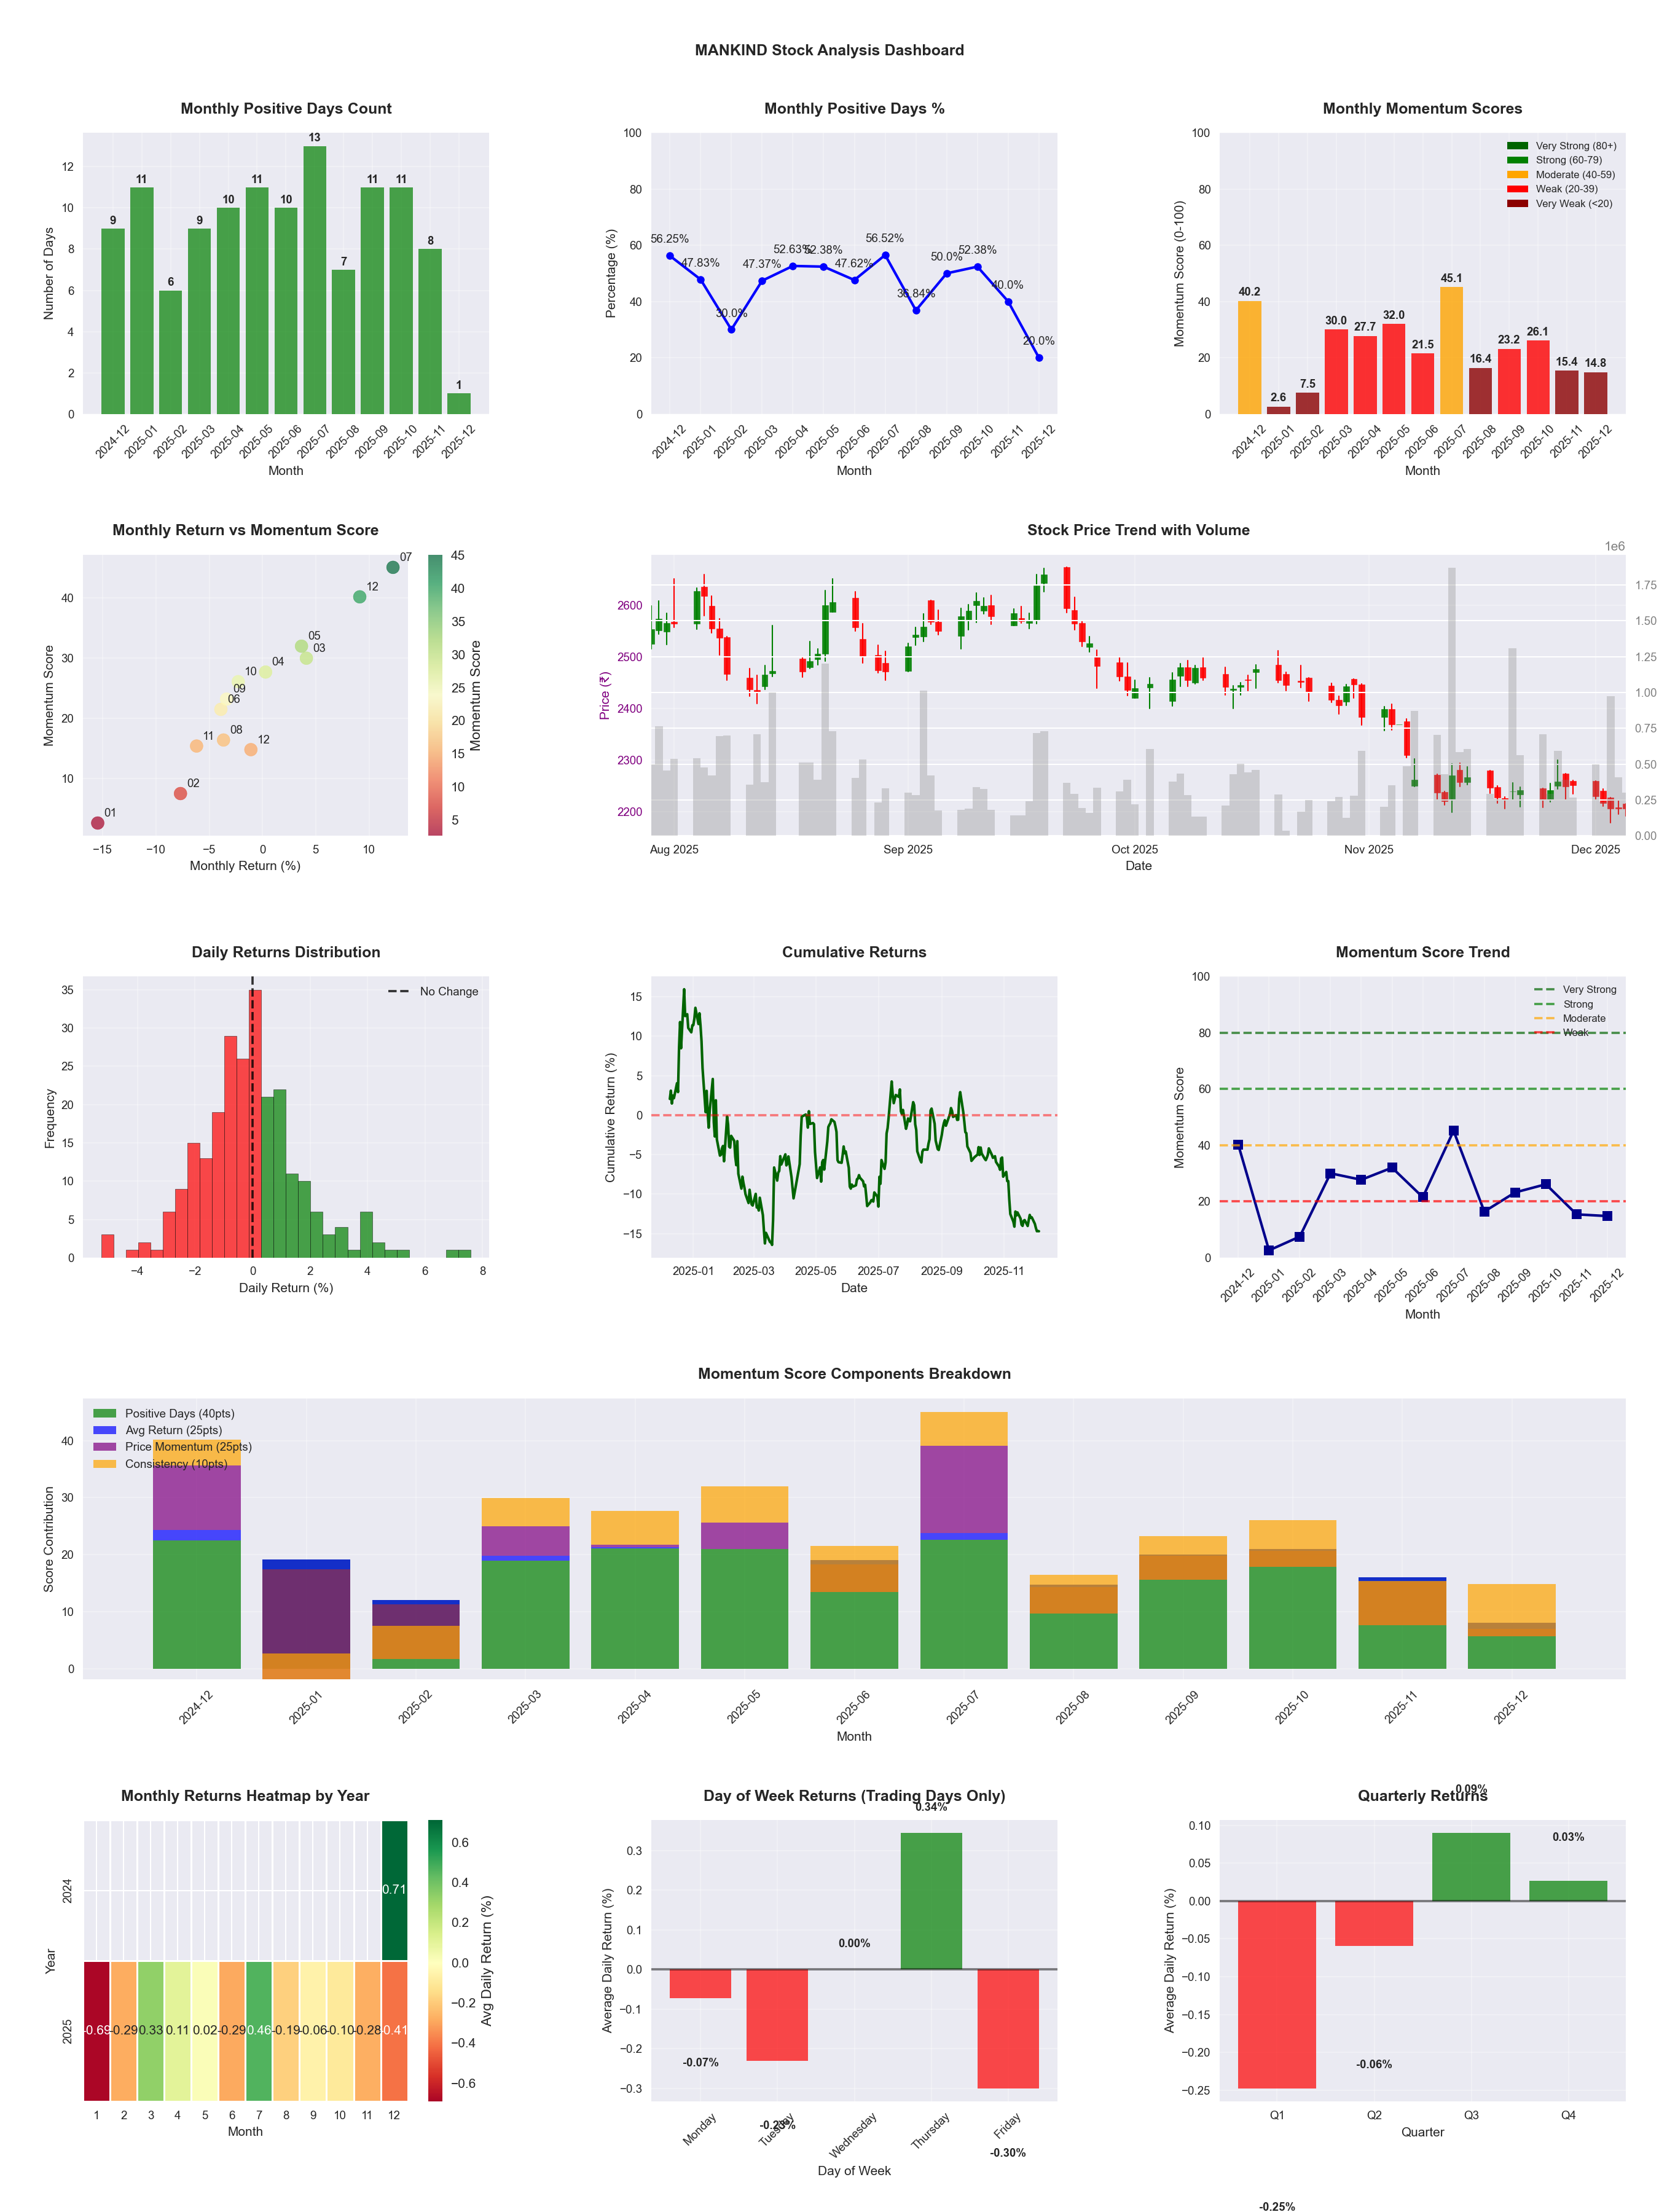
📊 Key Insights & Metrics
Symbol
📈 MANKIND
Date
📅 2026-04-11
Volatility
🟡 1.63%
Win Rate
⚠️ 47.1%
Avg Daily Return
📉 -0.04%
Max Drawdown
📉 -28.49%
IBD RS Score
📊 29.6
Weak
Market Rank
#347
Best Month
🏆 2025-07
Worst Month
📉 2026-03
Best Months to Trade
📅 Apr, Jul, Feb
Best Days to Trade
📅 Wednesday, Tuesday
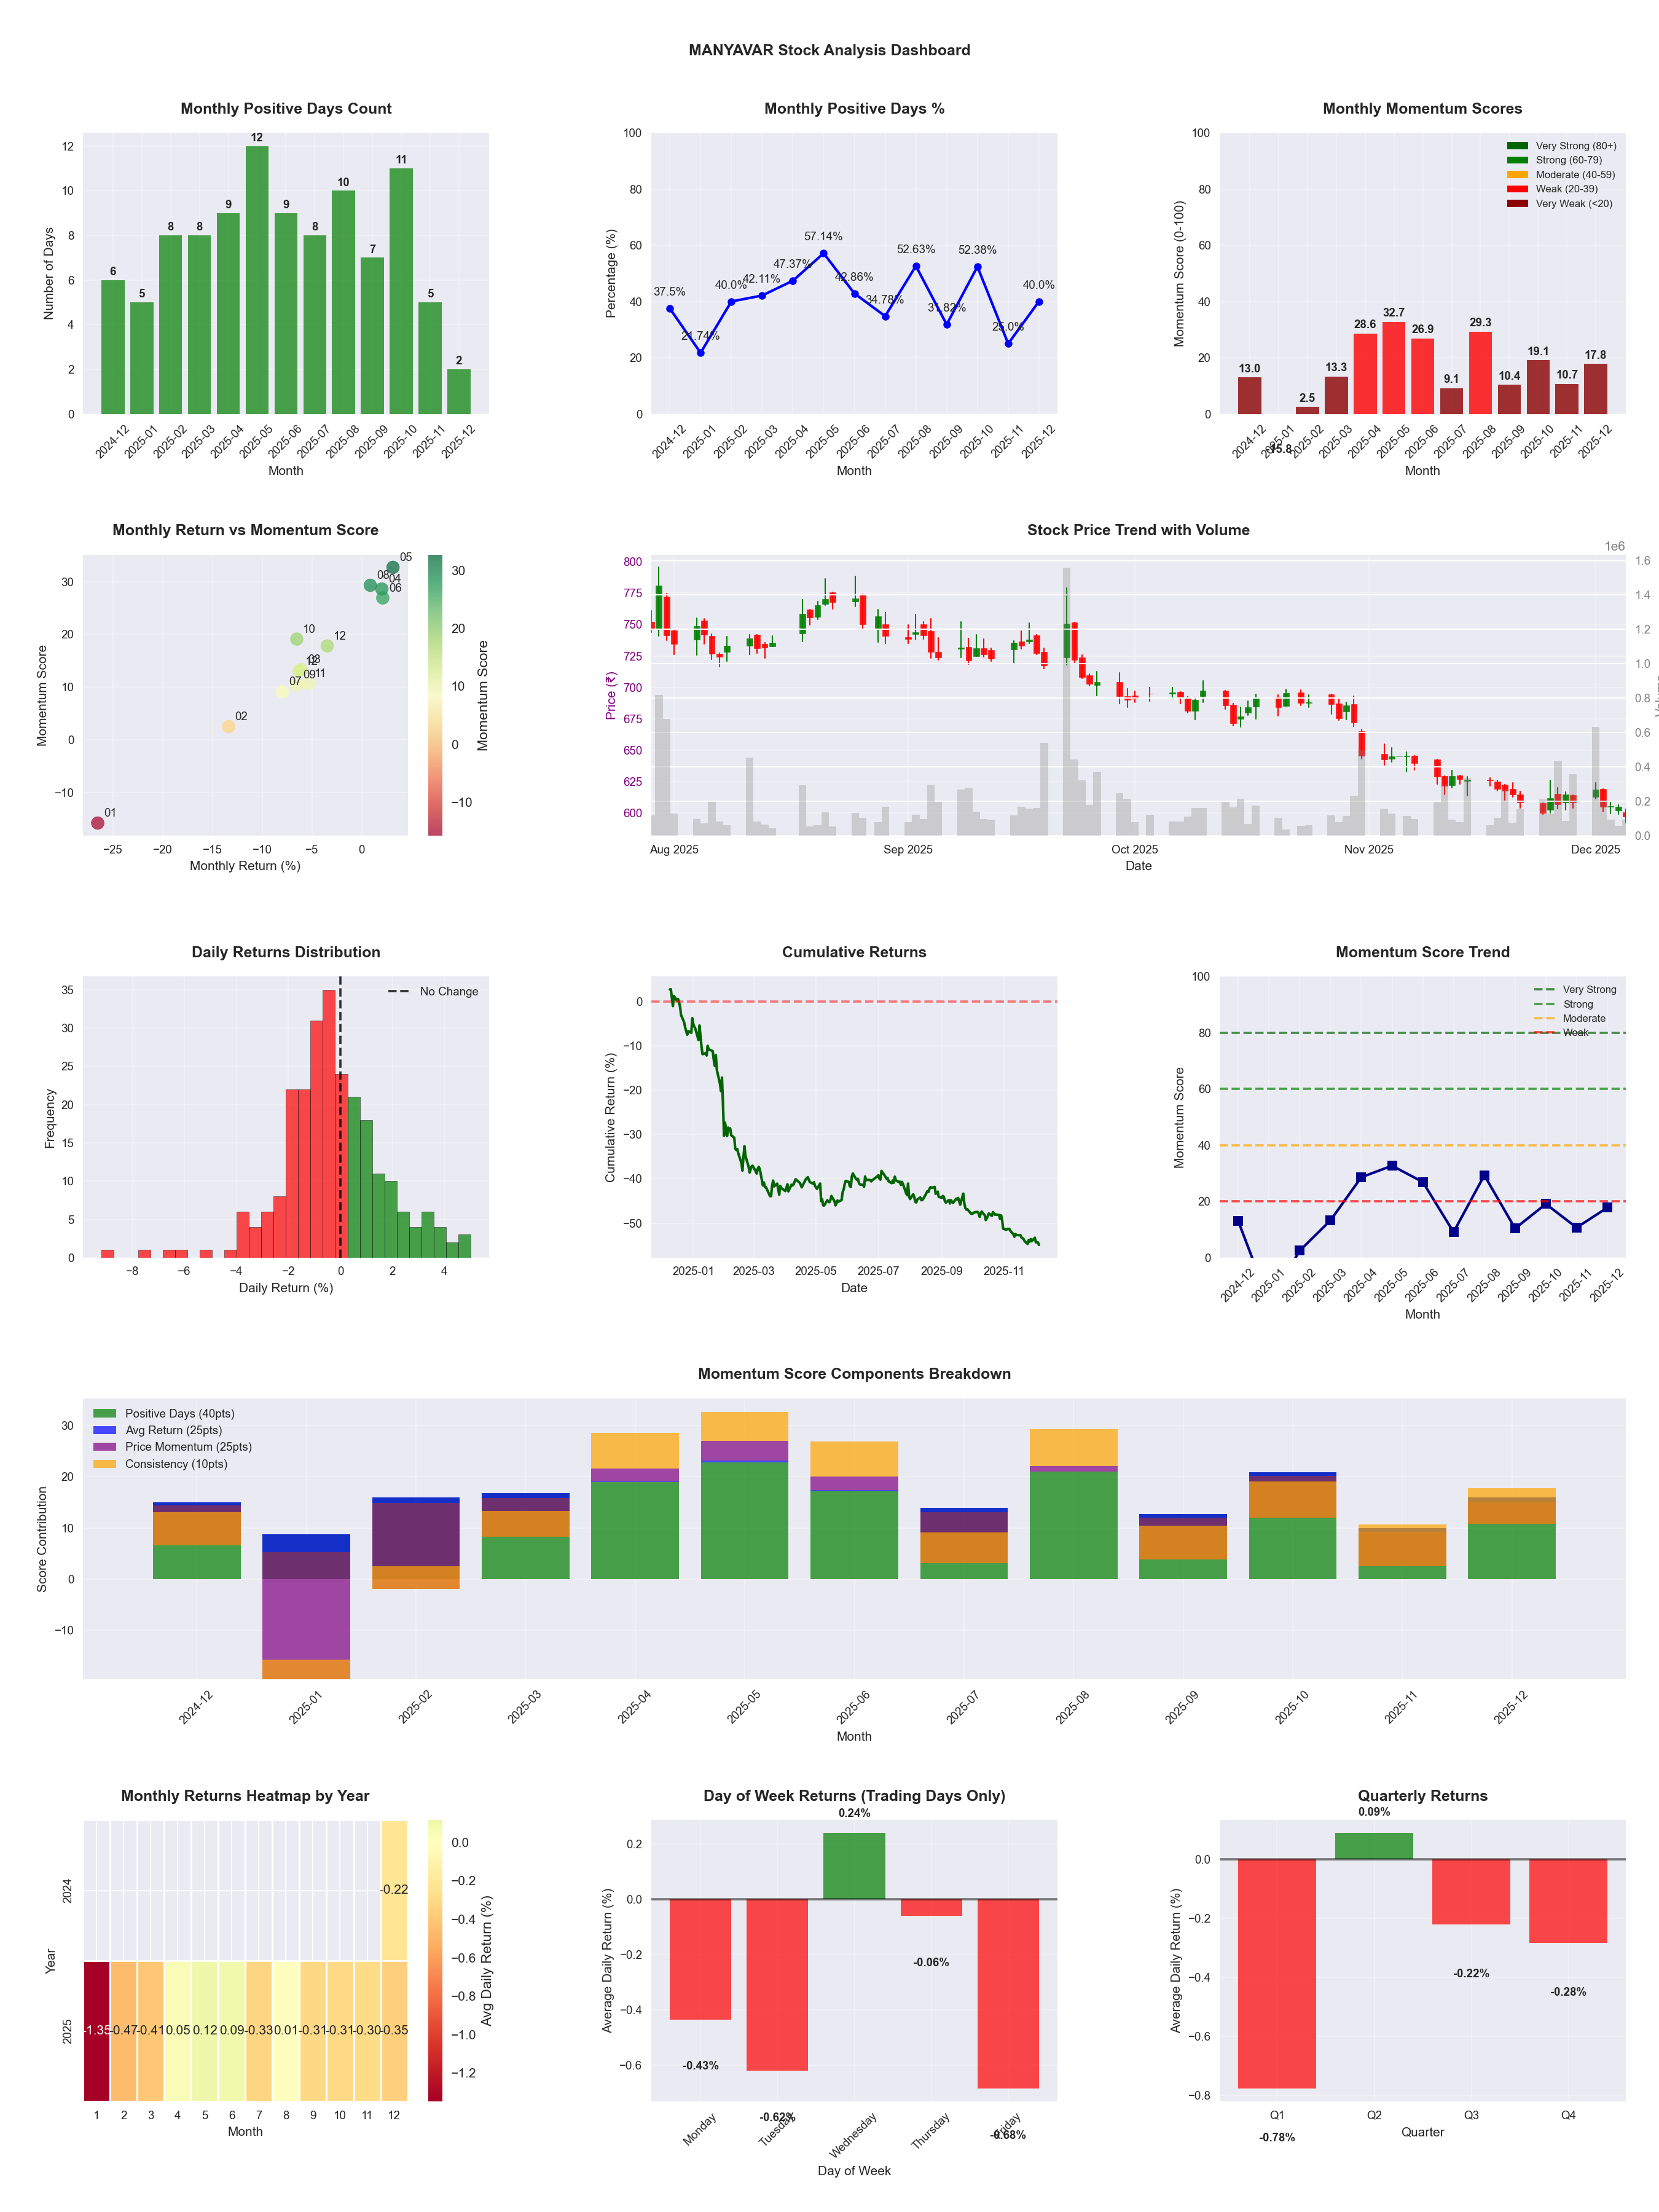
📊 Key Insights & Metrics
Symbol
📈 MANYAVAR
Date
📅 2026-04-11
Volatility
🟡 1.89%
Win Rate
❌ 39.4%
Avg Daily Return
📉 -0.26%
Max Drawdown
📉 -58.83%
IBD RS Score
📊 1.2
Weak
Market Rank
#487
Best Month
🏆 2026-04
Best Months to Trade
📅 Apr, May, Jun
Best Days to Trade
📅 Wednesday, Monday
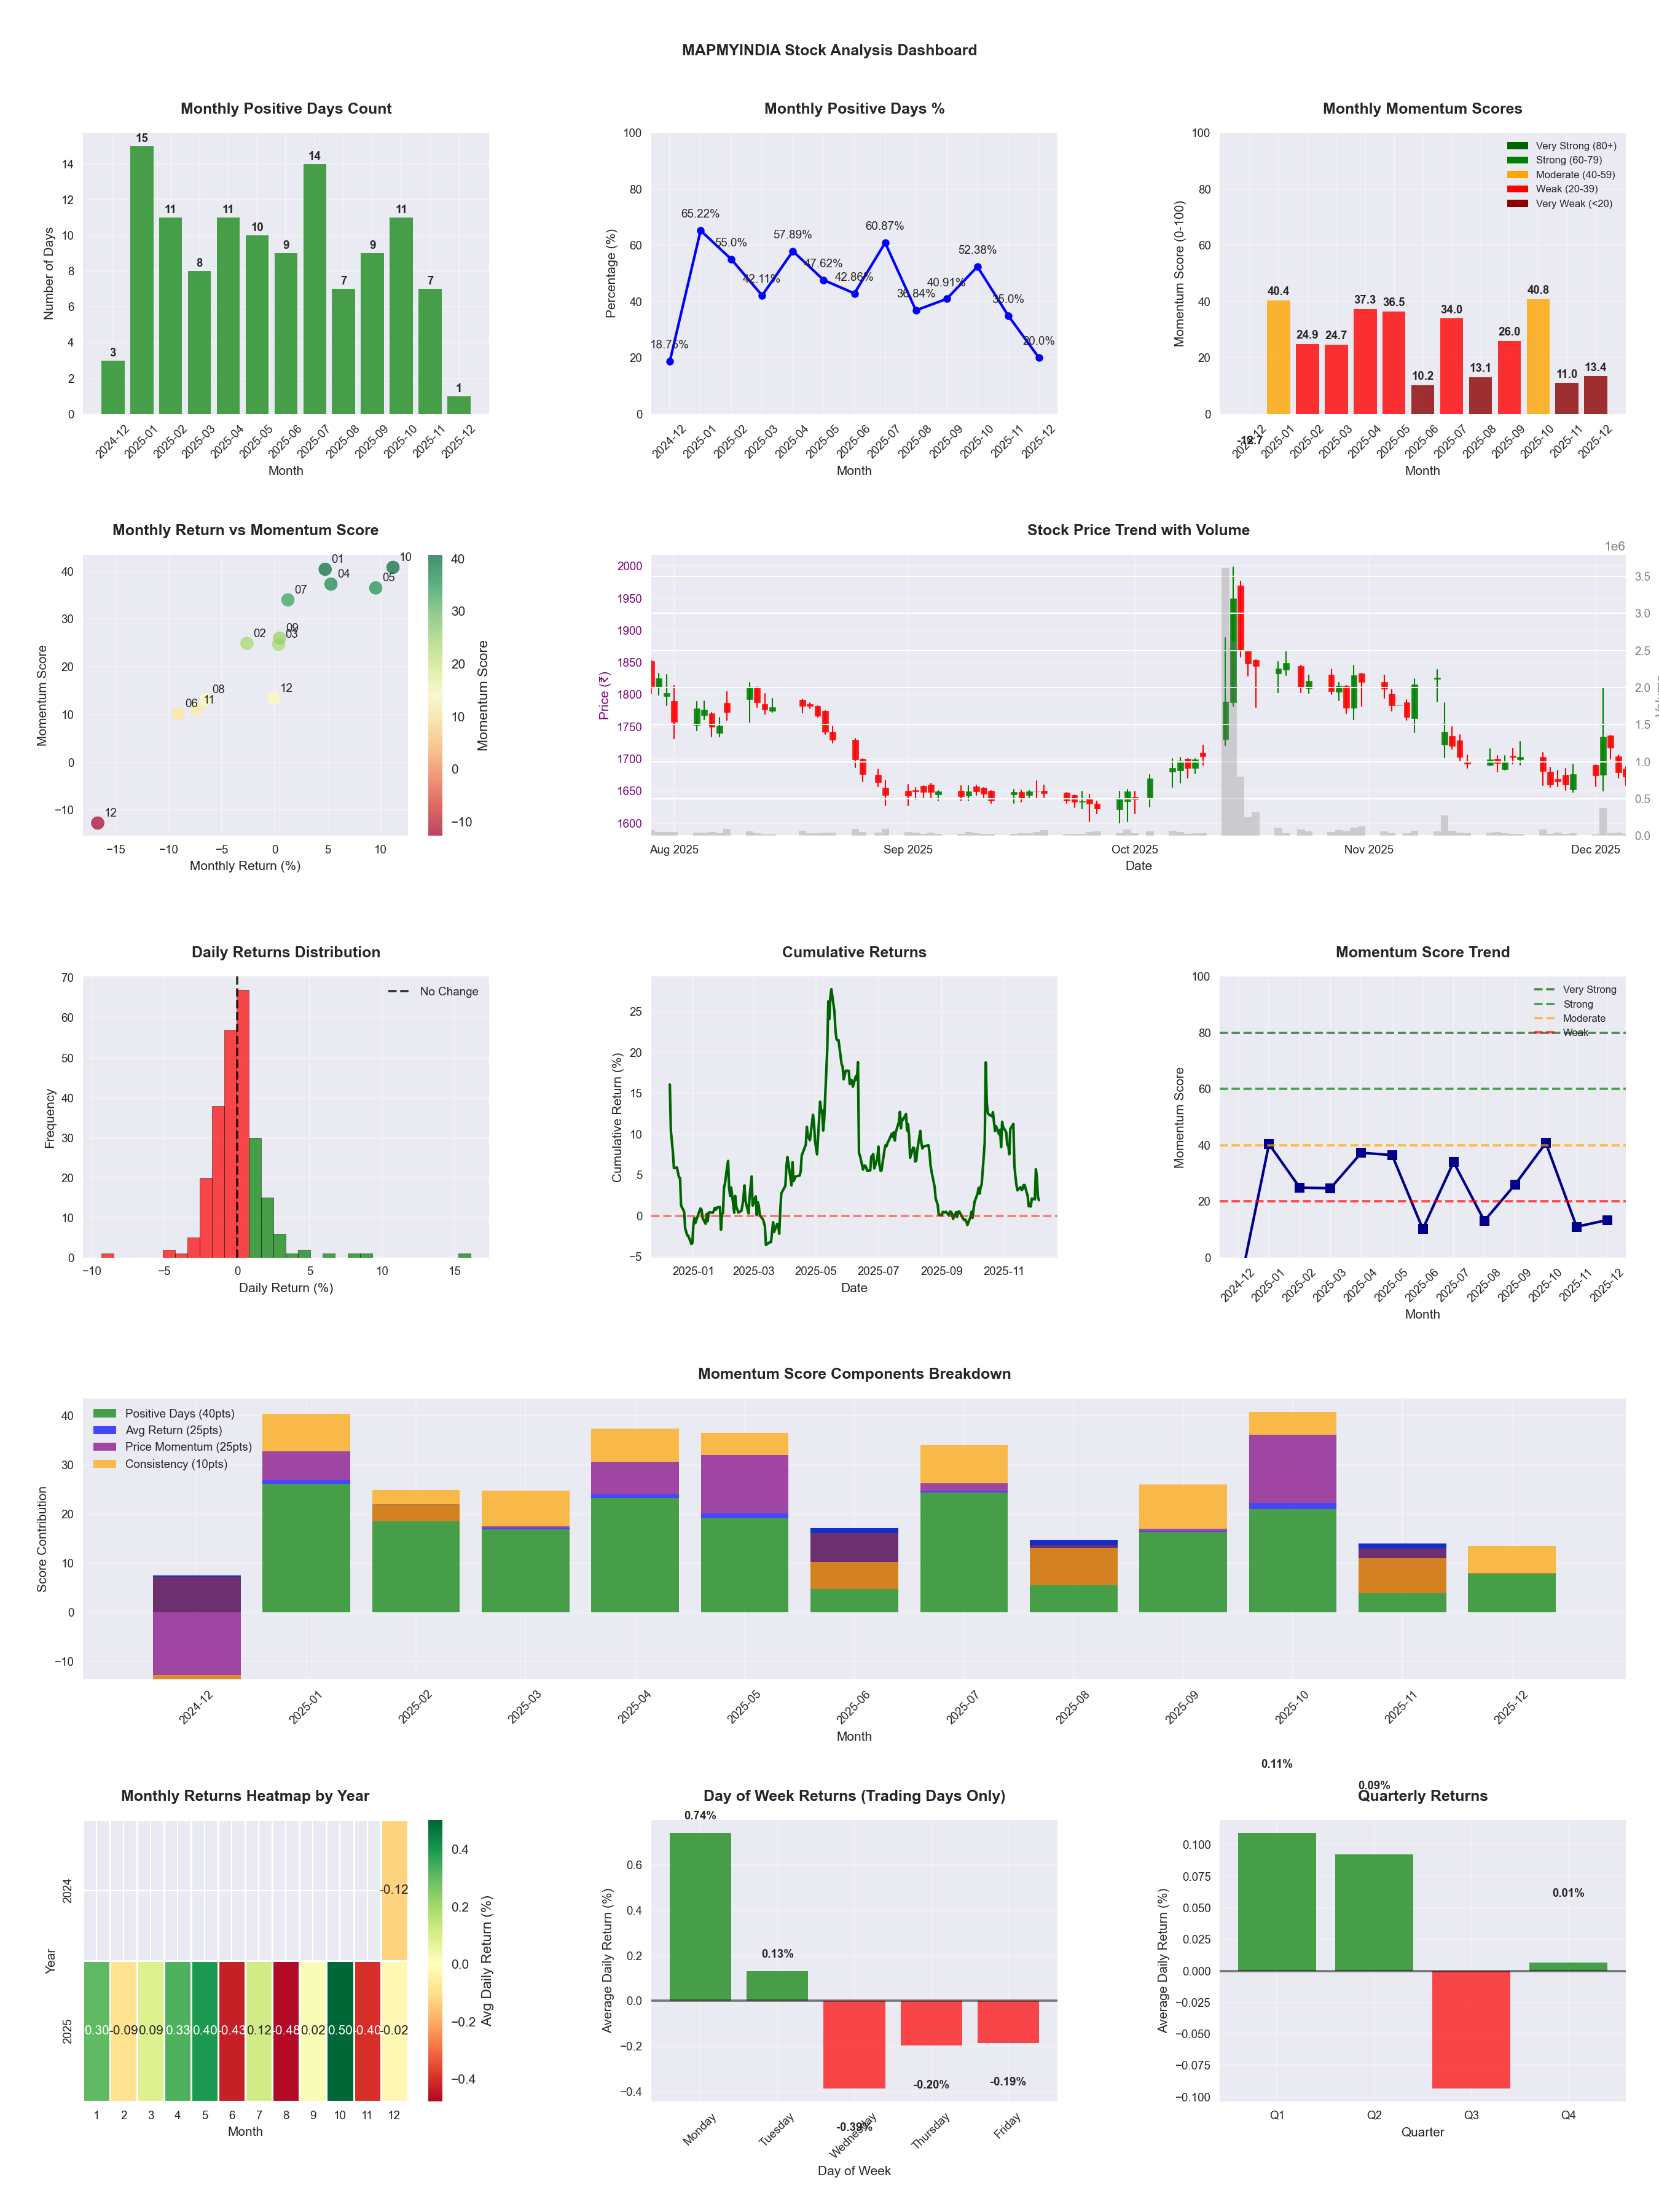
📊 Key Insights & Metrics
Symbol
📈 MAPMYINDIA
Date
📅 2026-04-11
Volatility
🟡 2.16%
Risk Profile
⚠️ suitable for aggressive investors
Win Rate
⚠️ 44.3%
Avg Daily Return
📉 -0.22%
Max Drawdown
📉 -61.78%
IBD RS Score
📊 0.4
Weak
Market Rank
#491
Best Month
🏆 2026-04
Best Months to Trade
📅 Apr, Oct, May
Best Days to Trade
📅 Tuesday, Monday
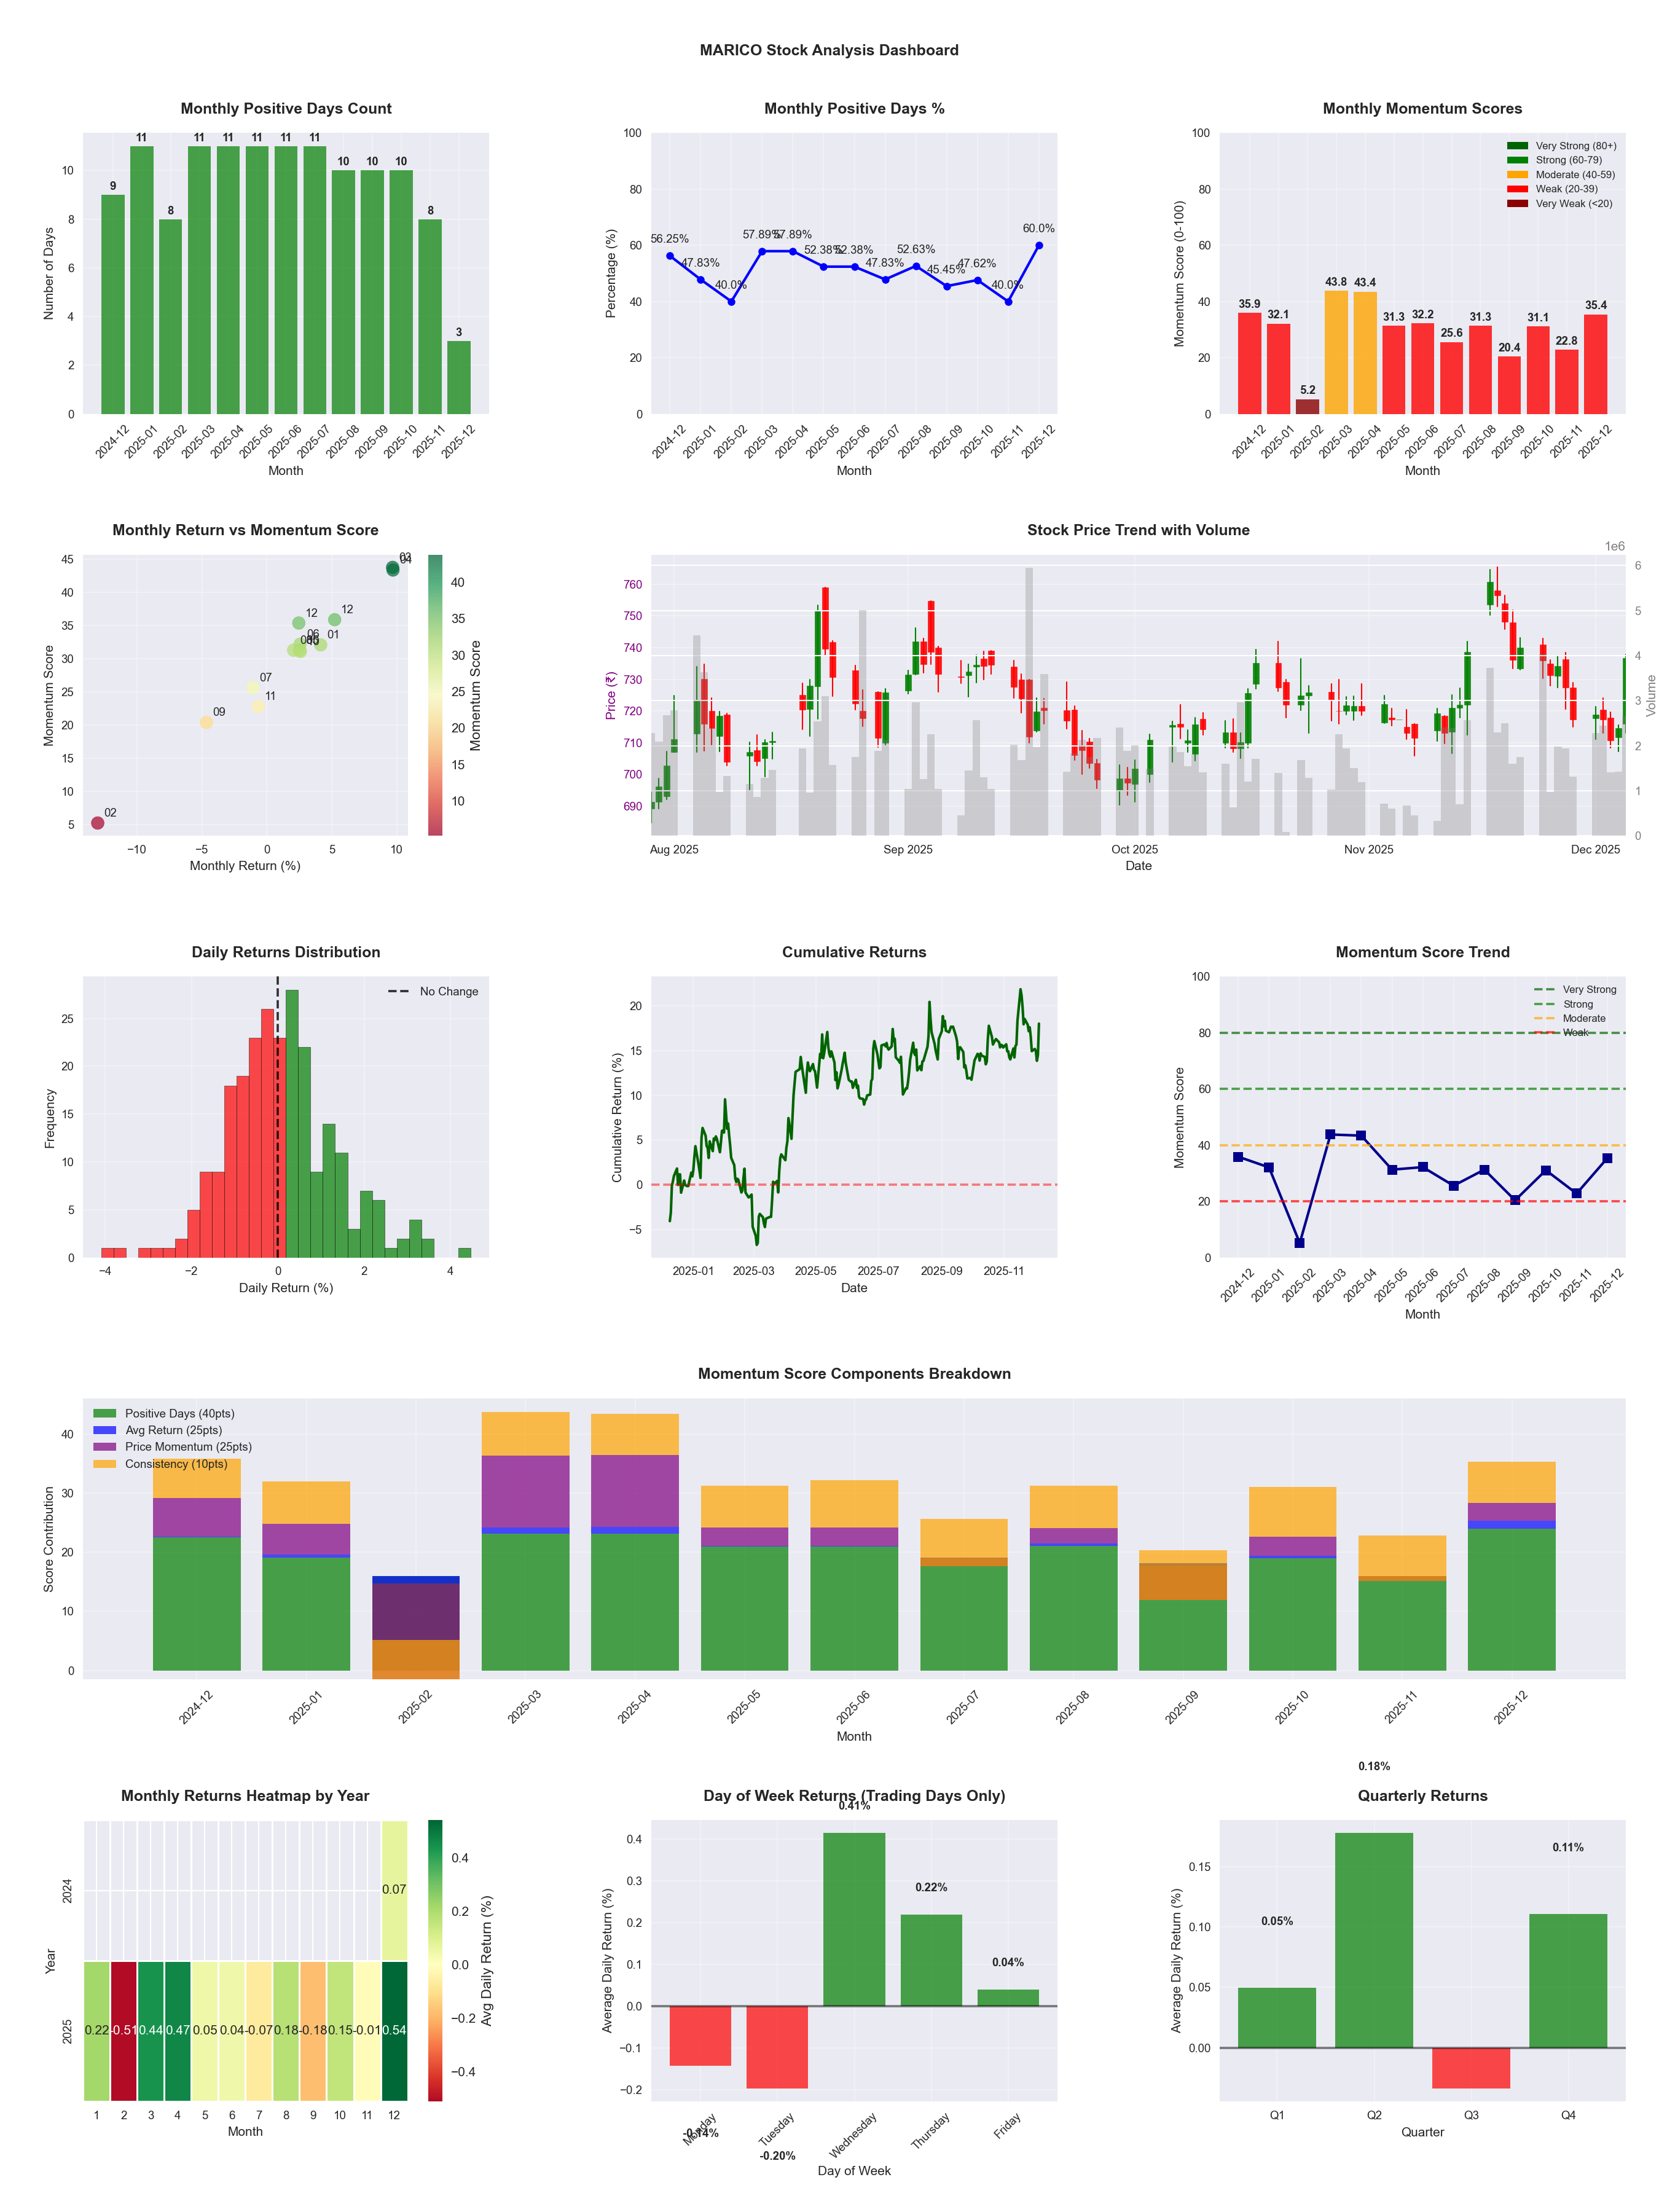
📊 Key Insights & Metrics
Symbol
📈 MARICO
Date
📅 2026-04-11
Volatility
🟢 1.16%
Win Rate
⚠️ 49.2%
Avg Daily Return
📈 +0.04%
Max Drawdown
📉 -10.50%
IBD RS Score
📊 70.8
Strong
Market Rank
#144
Best Month
🏆 2026-02
Worst Month
📉 2026-03
Best Months to Trade
📅 Feb, Apr, Dec
Best Days to Trade
📅 Monday, Wednesday
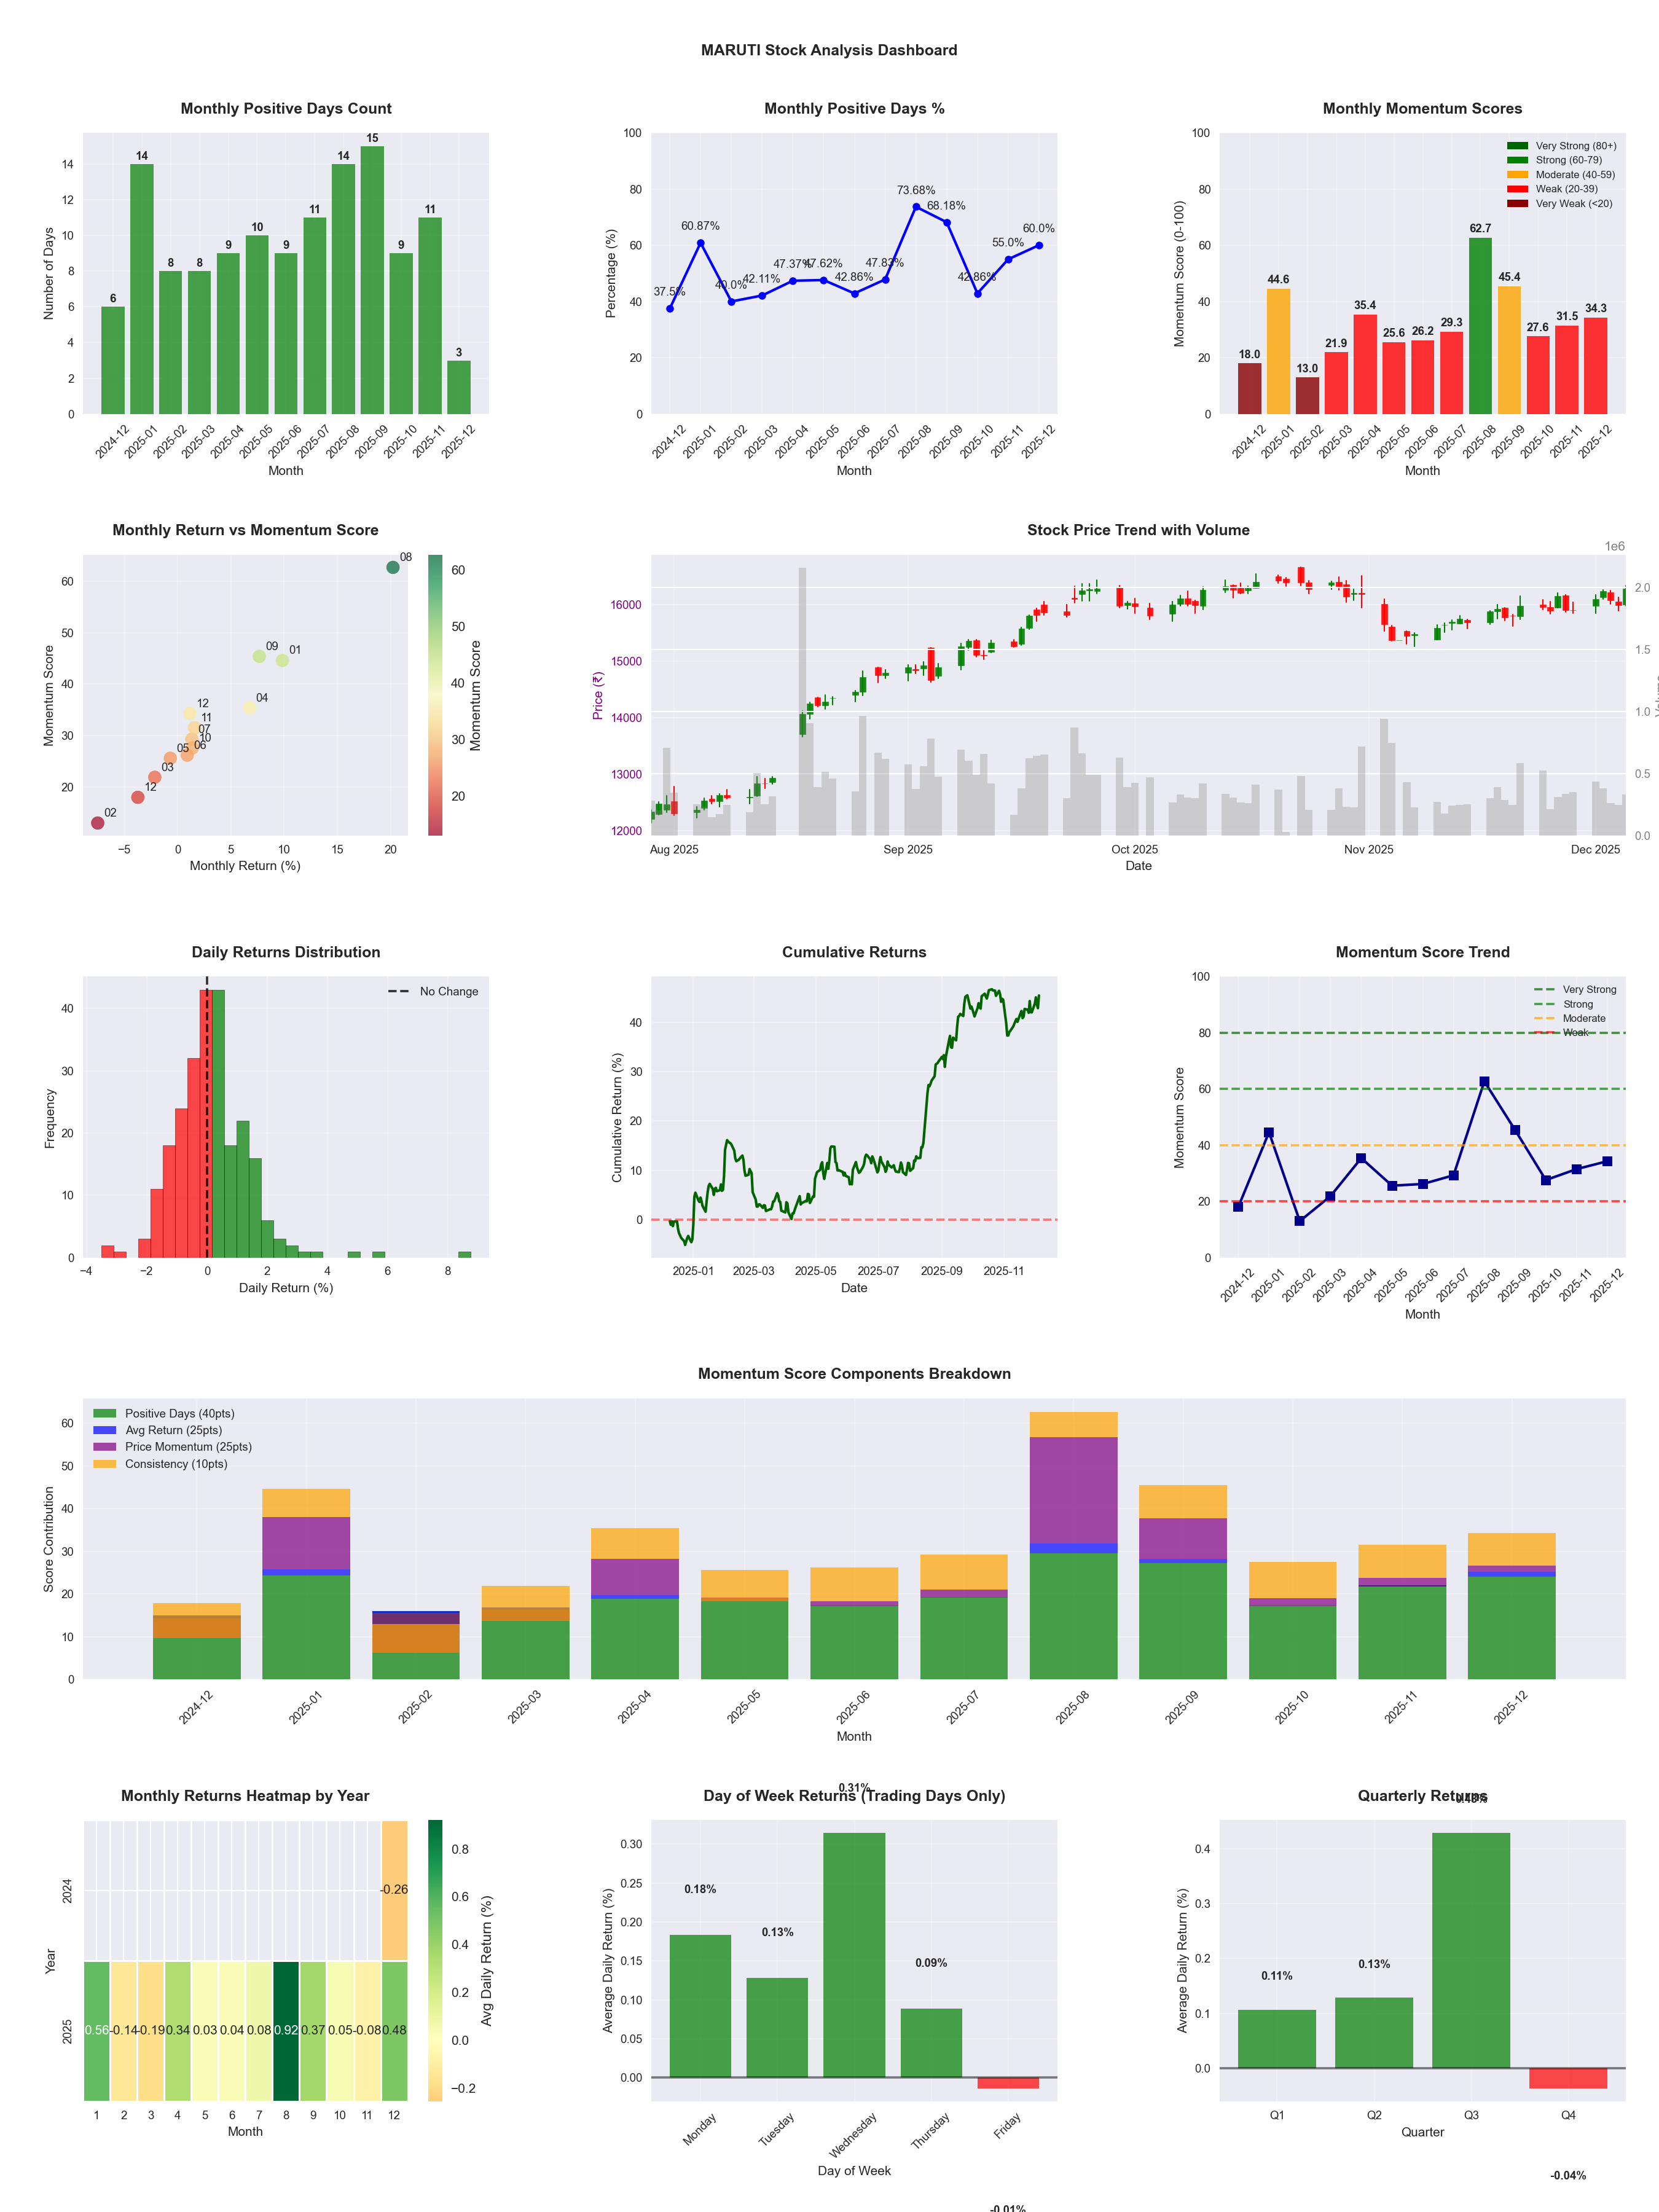
📊 Key Insights & Metrics
Symbol
📈 MARUTI
Date
📅 2026-04-11
Volatility
🟢 1.44%
Win Rate
⚠️ 51.2%
Avg Daily Return
📈 +0.08%
Max Drawdown
📉 -28.83%
IBD RS Score
📊 54.2
Average
Market Rank
#226
Best Month
🏆 2025-08
Worst Month
📉 2026-03
Best Months to Trade
📅 Apr, Aug, Sep
Best Days to Trade
📅 Wednesday, Tuesday
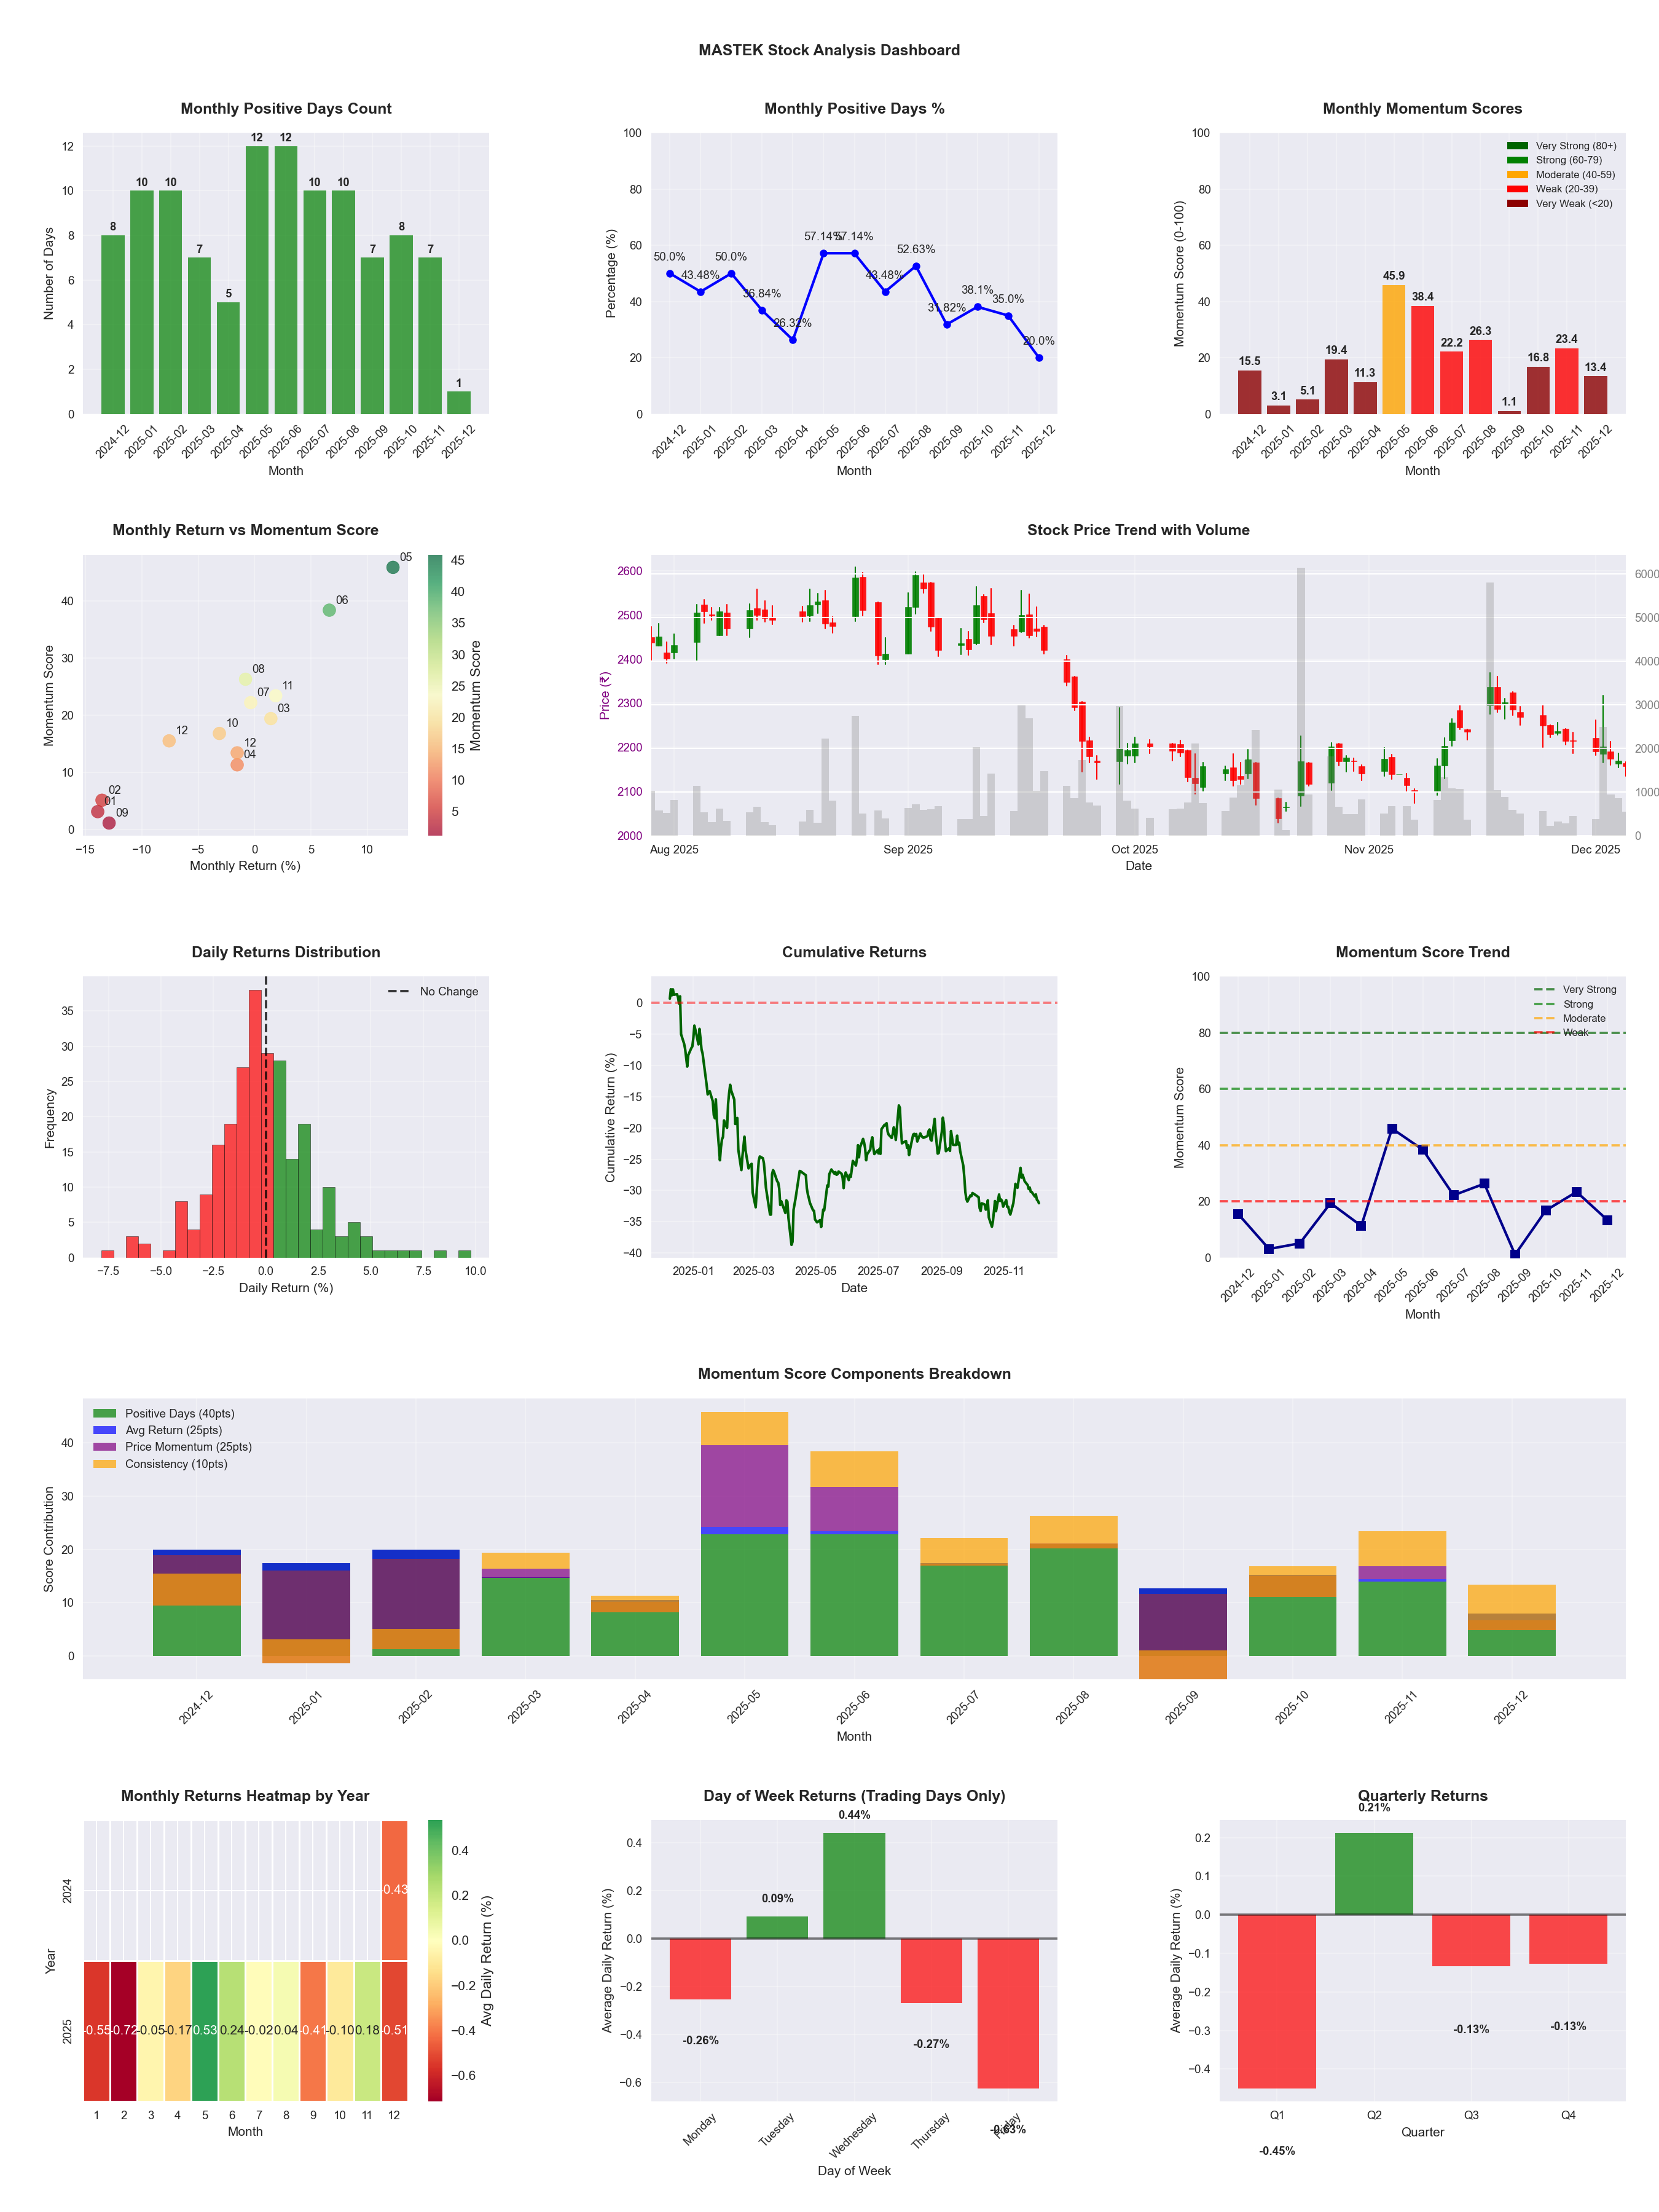
📊 Key Insights & Metrics
Symbol
📈 MASTEK
Date
📅 2026-03-21
Volatility
🟡 2.20%
Risk Profile
⚠️ suitable for aggressive investors
Win Rate
⚠️ 40.5%
Avg Daily Return
📉 -0.16%
Max Drawdown
📉 -45.14%
Best Month
🏆 2025-05
Best Months to Trade
📅 May, Jun, Nov
Best Days to Trade
📅 Monday, Wednesday
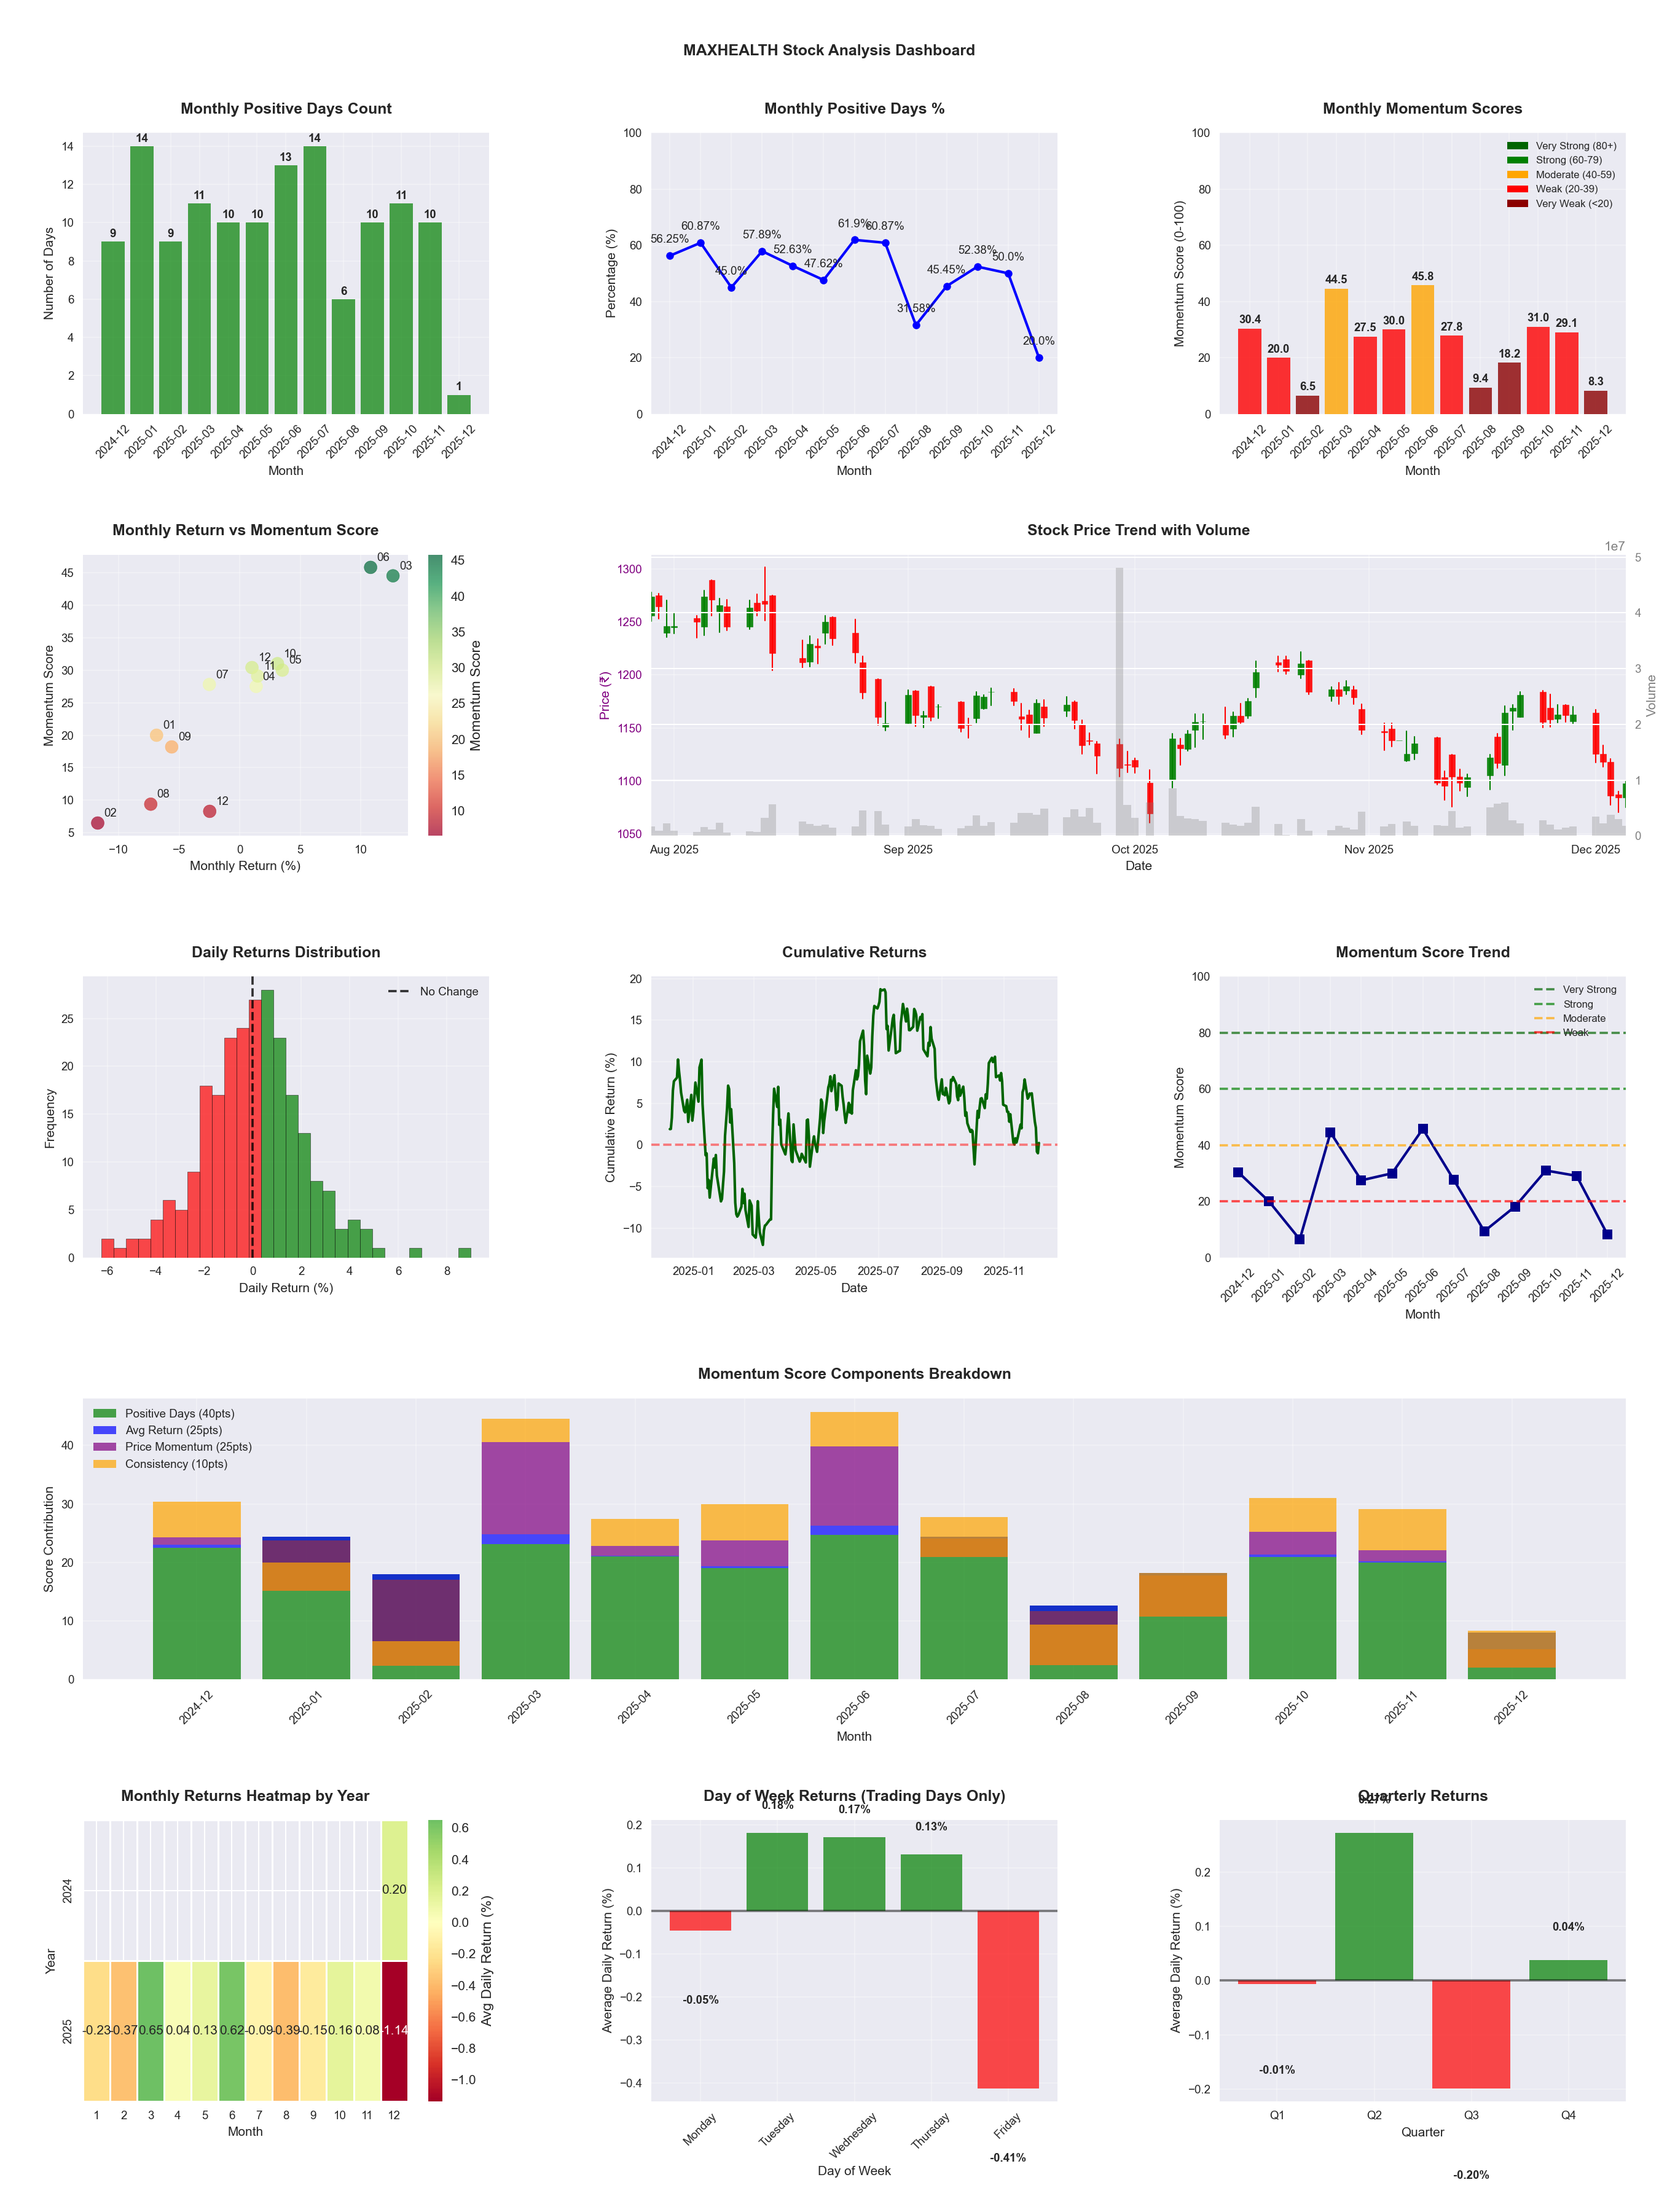
📊 Key Insights & Metrics
Symbol
📈 MAXHEALTH
Date
📅 2026-04-11
Volatility
🟡 1.68%
Win Rate
⚠️ 49.2%
Avg Daily Return
📉 -0.04%
Max Drawdown
📉 -28.33%
IBD RS Score
📊 30.4
Weak
Market Rank
#343
Best Month
🏆 2026-02
Worst Month
📉 2026-03
Best Months to Trade
📅 Feb, Jun, Oct
Best Days to Trade
📅 Wednesday, Monday
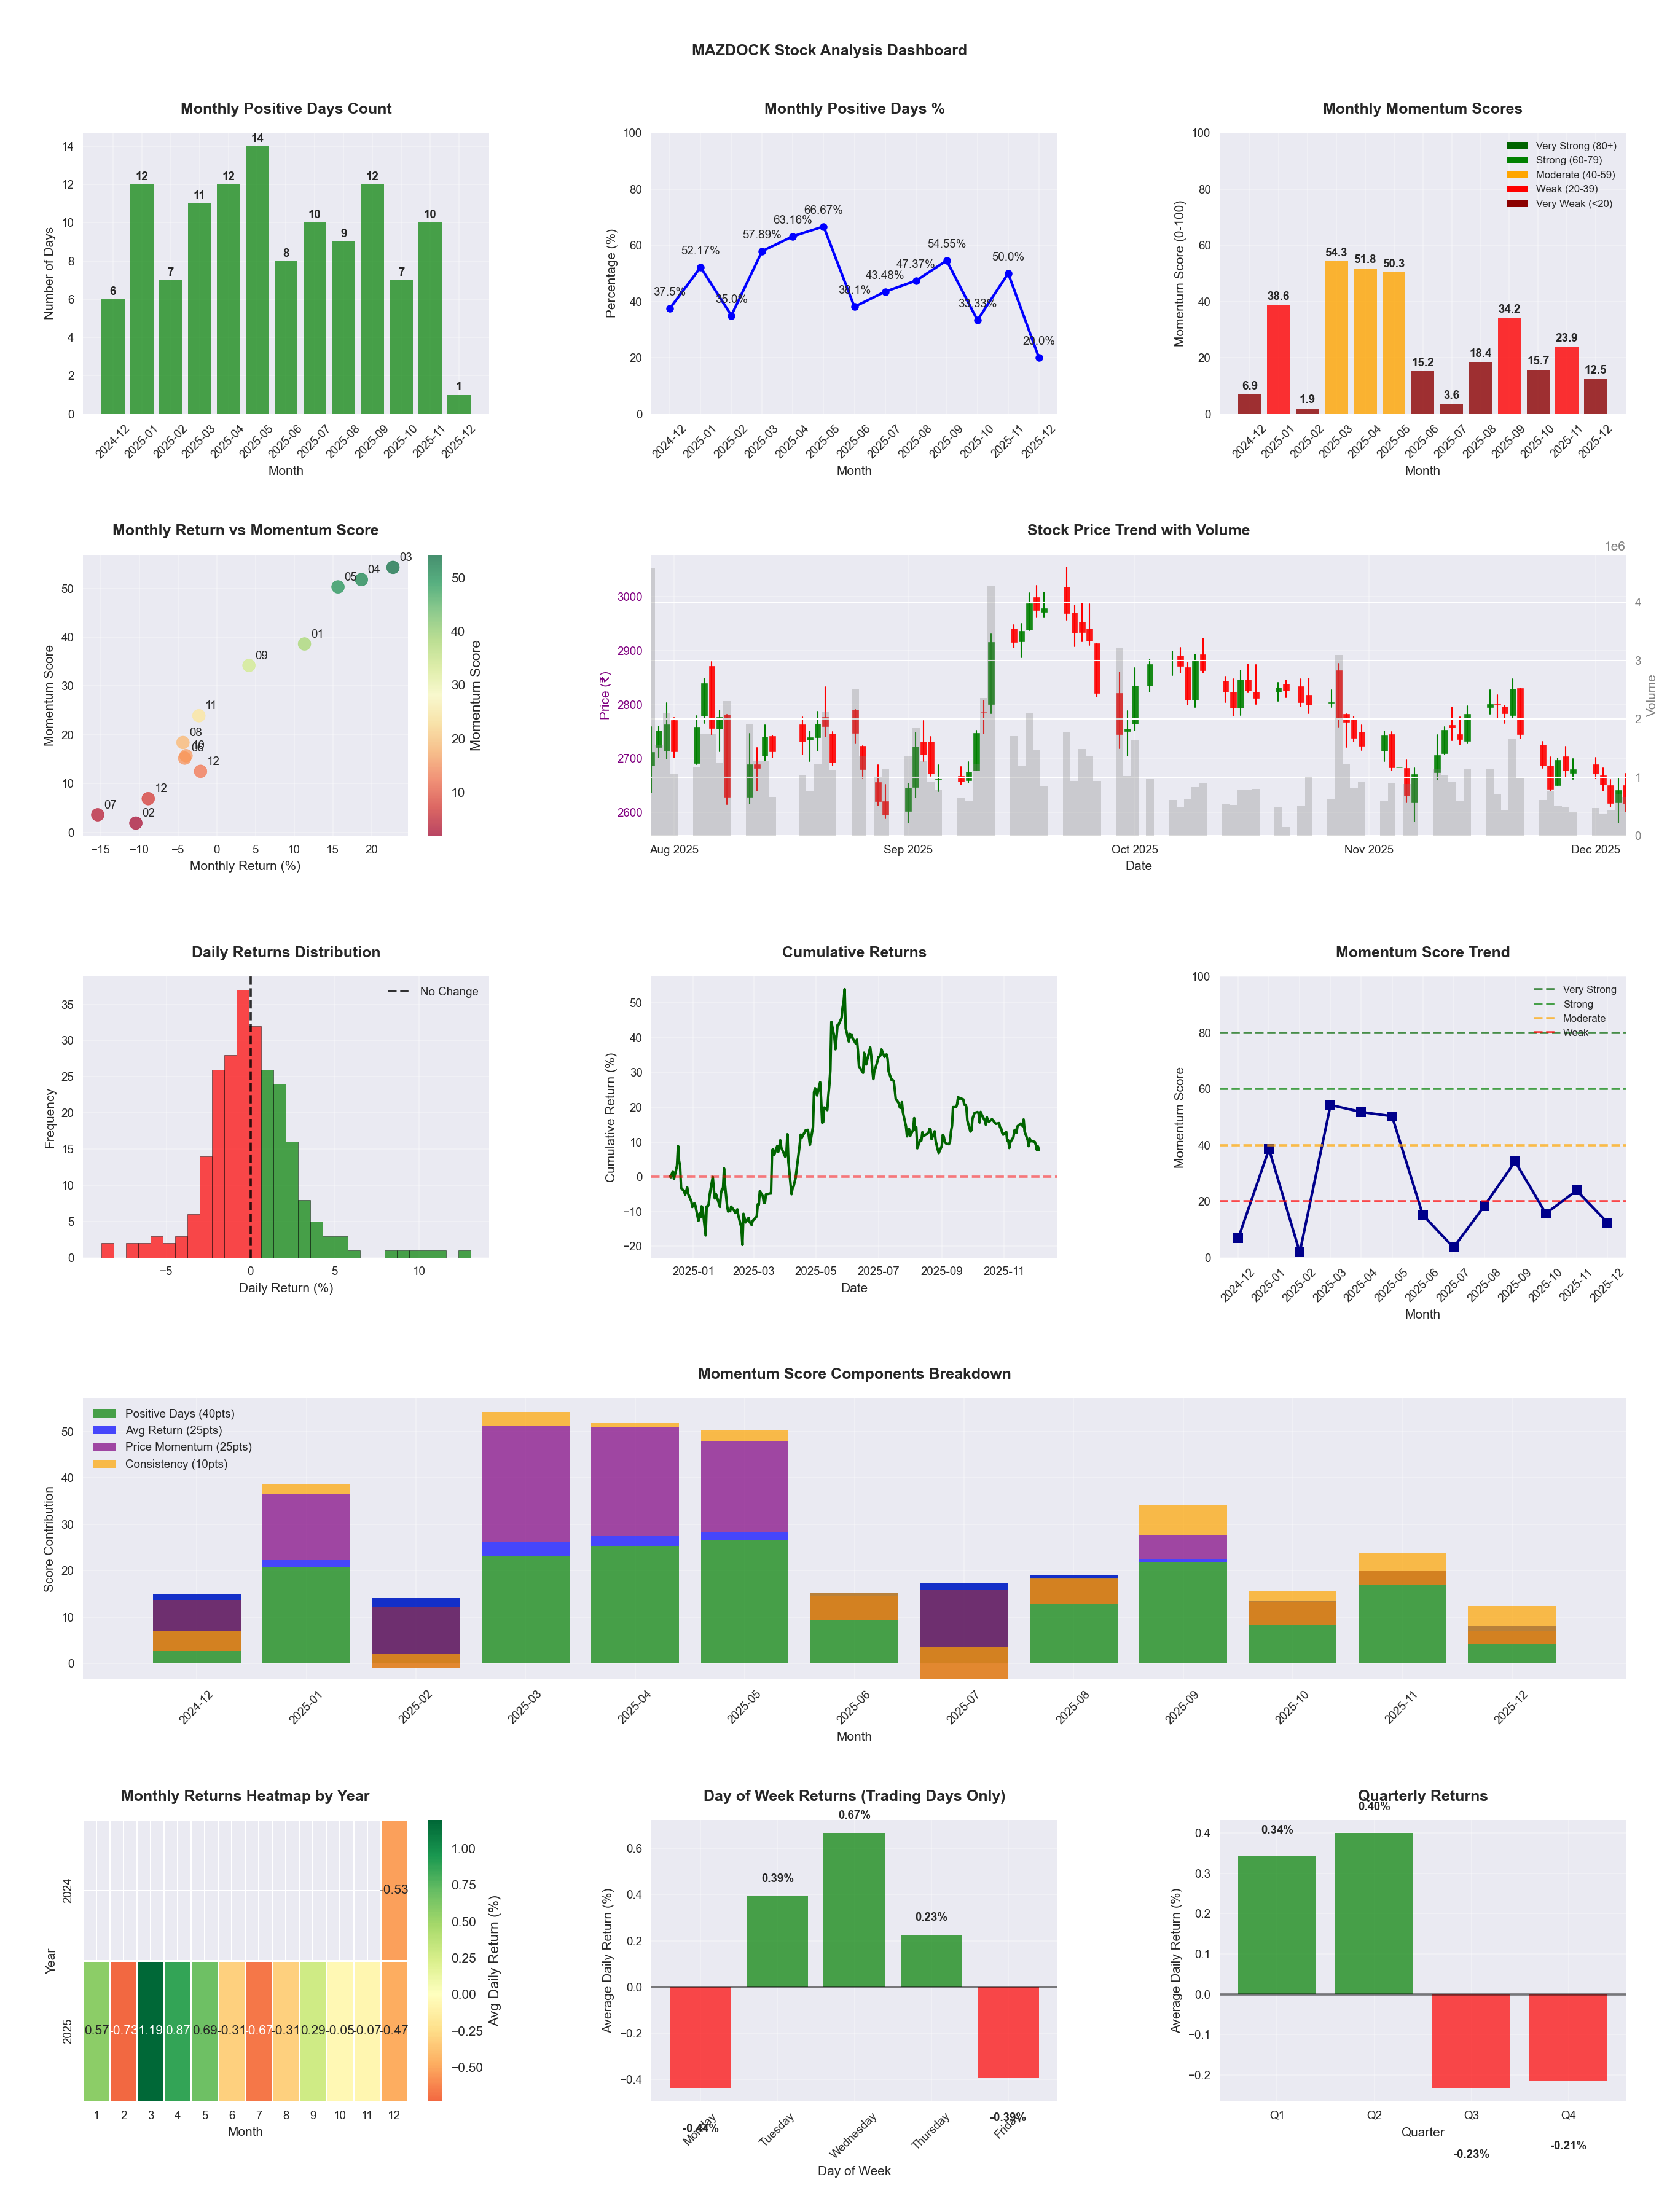
📊 Key Insights & Metrics
Symbol
📈 MAZDOCK
Date
📅 2026-04-11
Volatility
🟡 2.54%
Risk Profile
⚠️ suitable for aggressive investors
Win Rate
⚠️ 48.4%
Avg Daily Return
📈 +0.04%
Max Drawdown
📉 -44.60%
IBD RS Score
📊 43.0
Weak
Market Rank
#281
Best Month
🏆 2025-04
Worst Month
📉 2025-07
Best Months to Trade
📅 Apr, May, Sep
Best Days to Trade
📅 Wednesday, Tuesday
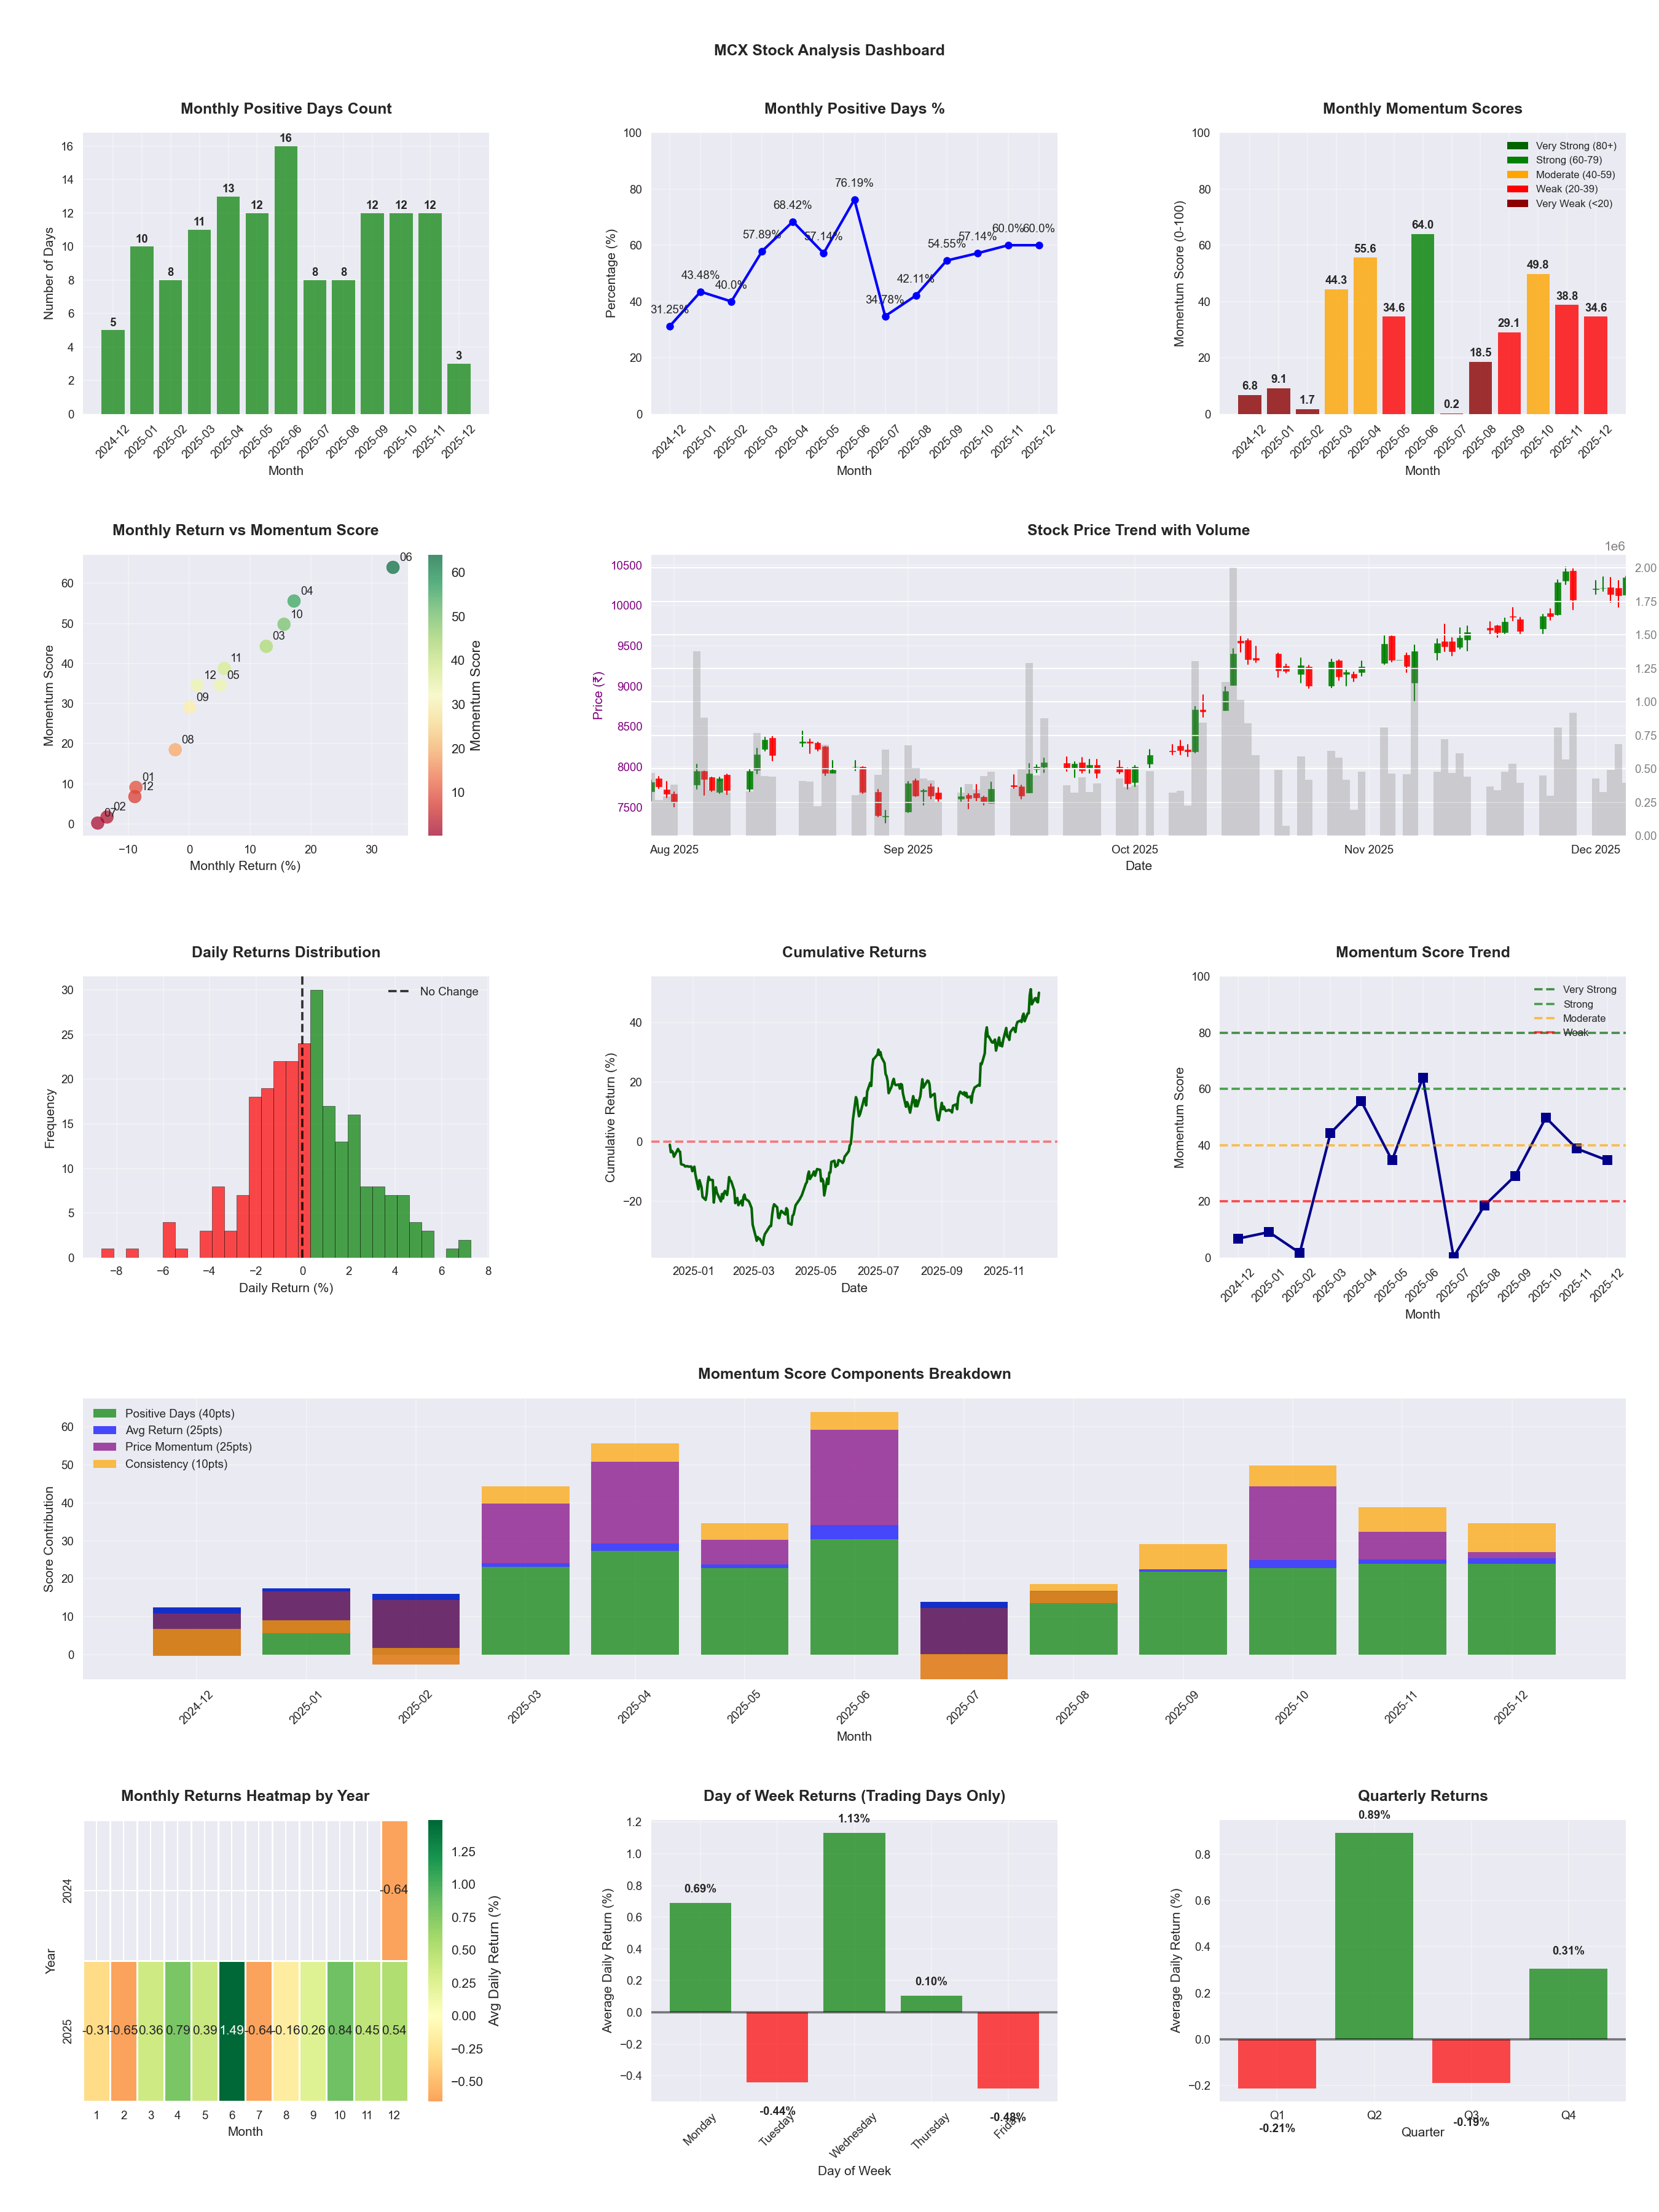
📊 Key Insights & Metrics
Symbol
📈 MCX
Date
📅 2026-04-11
Volatility
🟡 2.45%
Risk Profile
⚠️ suitable for aggressive investors
Win Rate
⚠️ 55.3%
Avg Daily Return
📈 +0.40%
Max Drawdown
📉 -18.13%
IBD RS Score
📊 99.0
Leader
Market Rank
#5
Best Month
🏆 2025-06
Worst Month
📉 2025-07
Best Months to Trade
📅 Jun, Apr, Oct
Best Days to Trade
📅 Monday, Wednesday
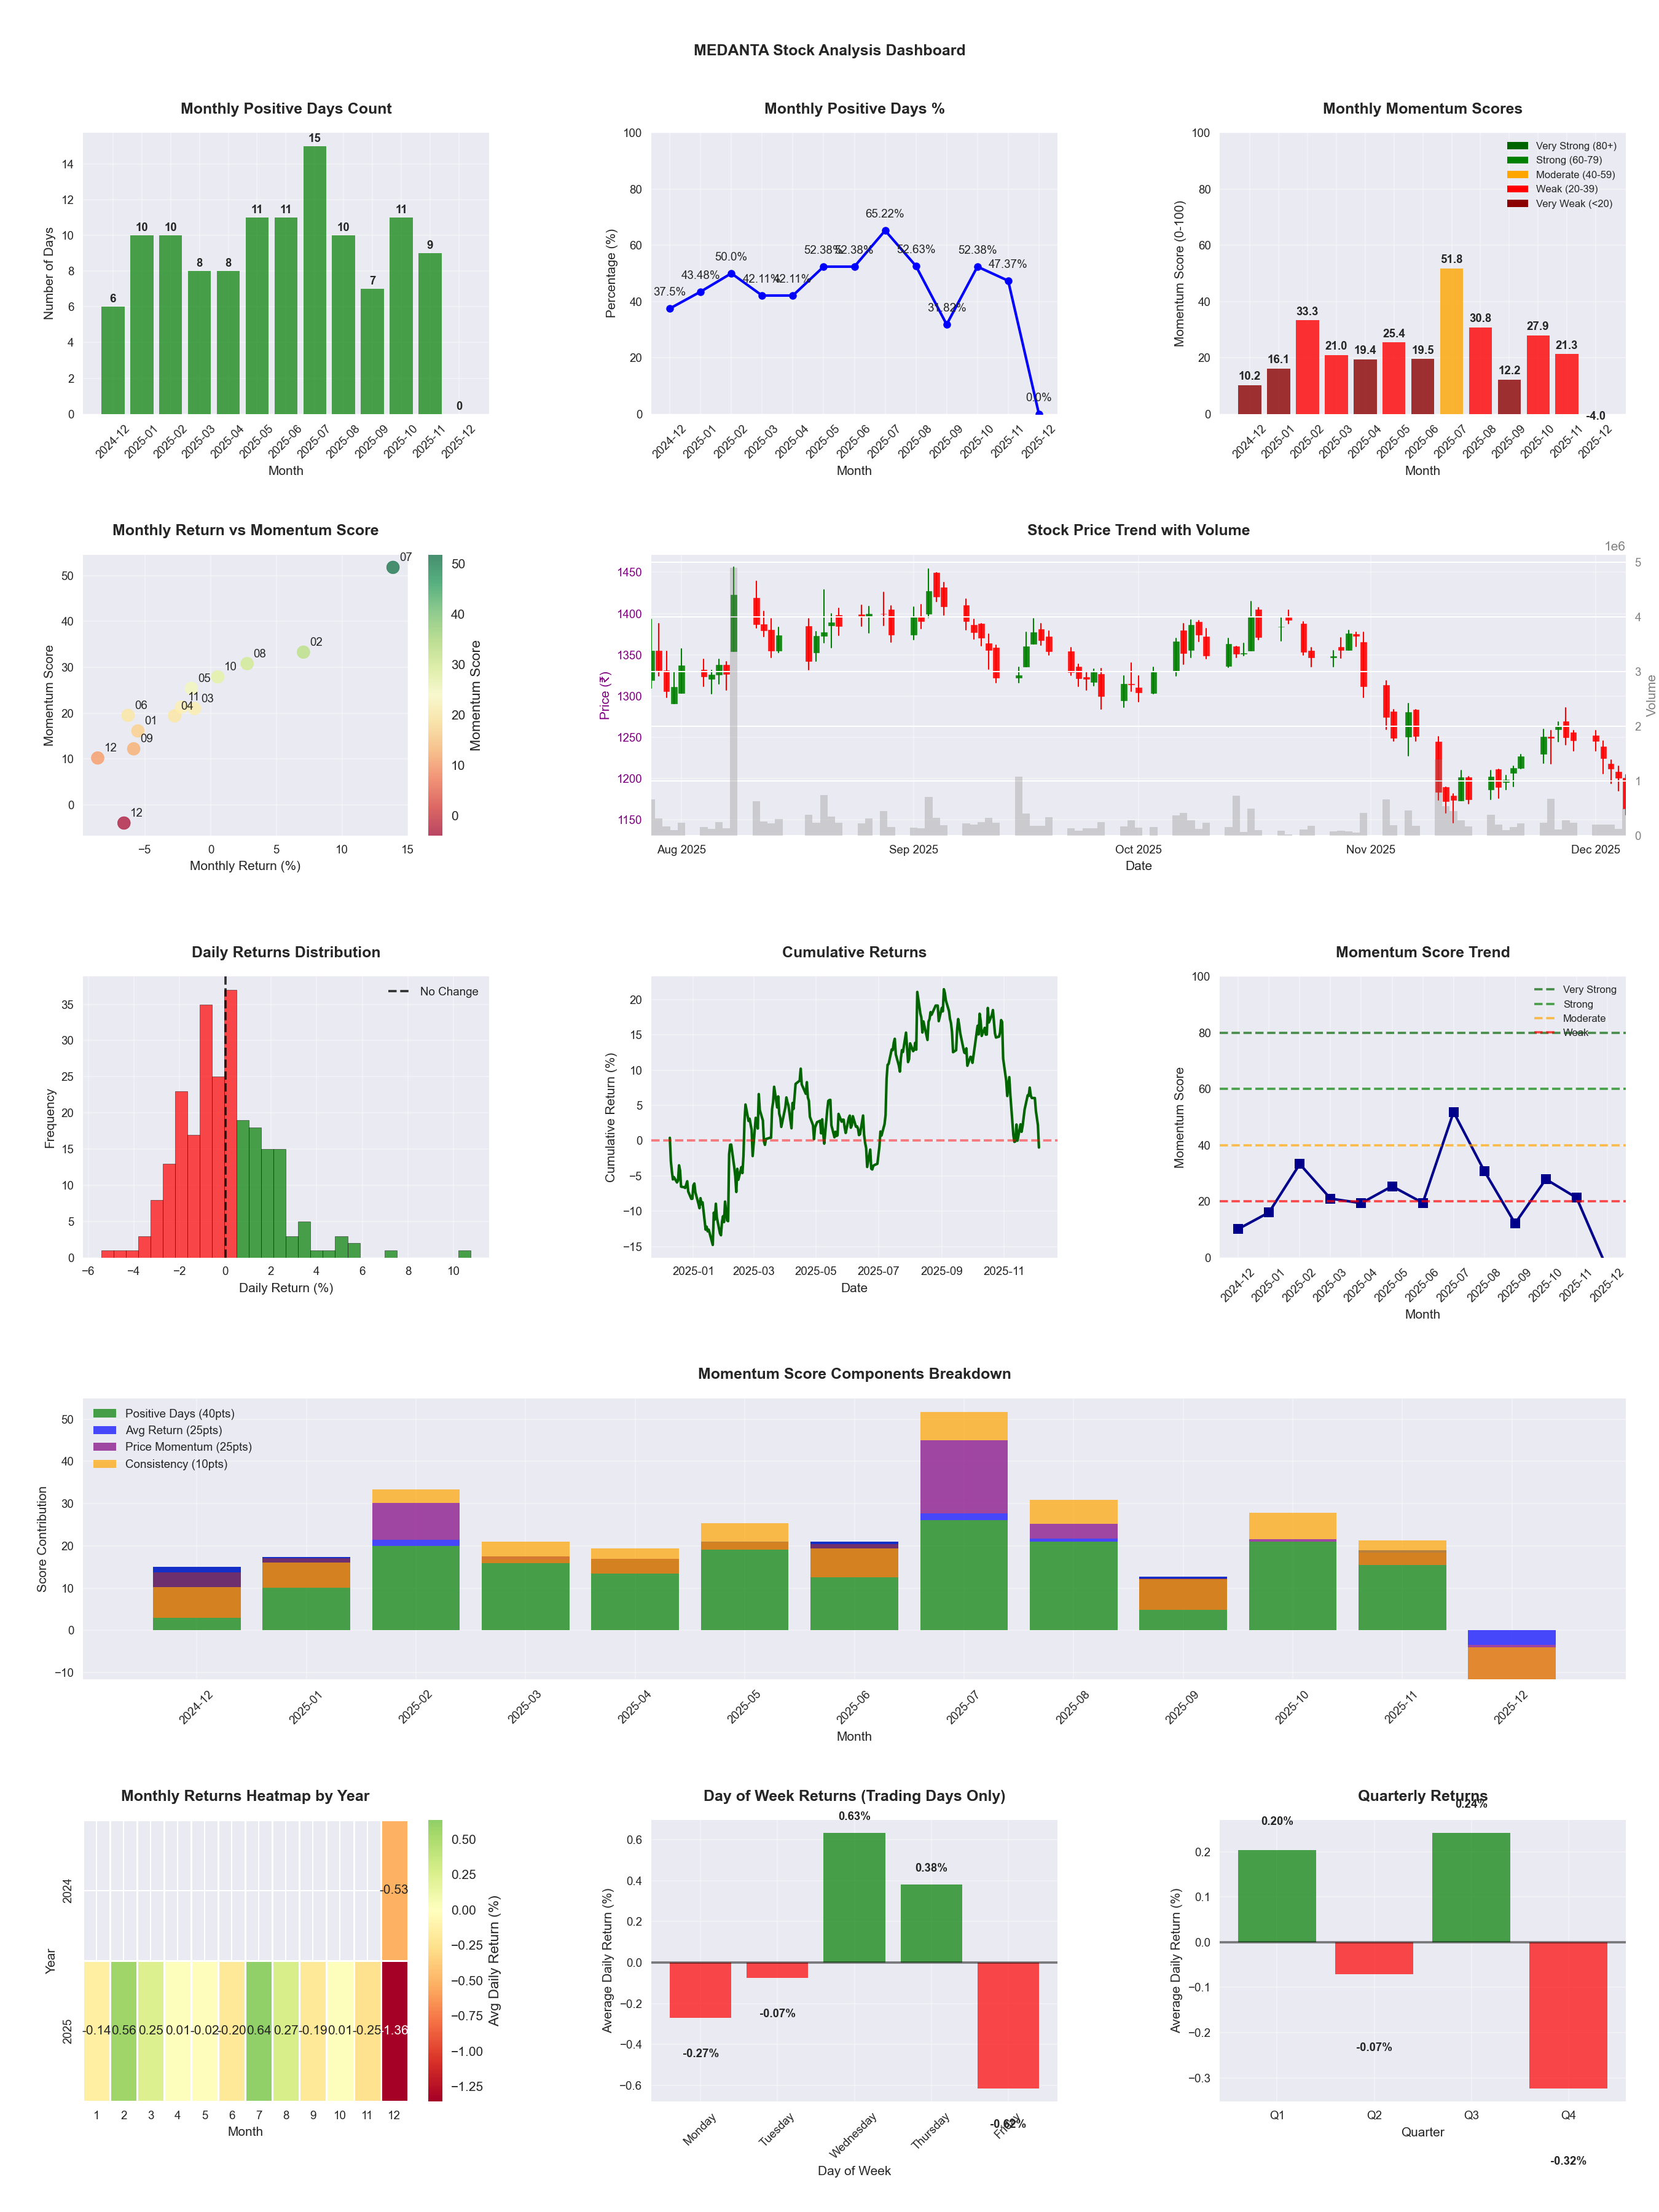
📊 Key Insights & Metrics
Symbol
📈 MEDANTA
Date
📅 2026-04-11
Volatility
🟡 1.86%
Win Rate
⚠️ 48.4%
Avg Daily Return
📉 -0.05%
Max Drawdown
📉 -32.66%
IBD RS Score
📊 25.2
Weak
Market Rank
#369
Best Month
🏆 2026-04
Best Months to Trade
📅 Jul, Feb, Aug
Best Days to Trade
📅 Wednesday, Monday
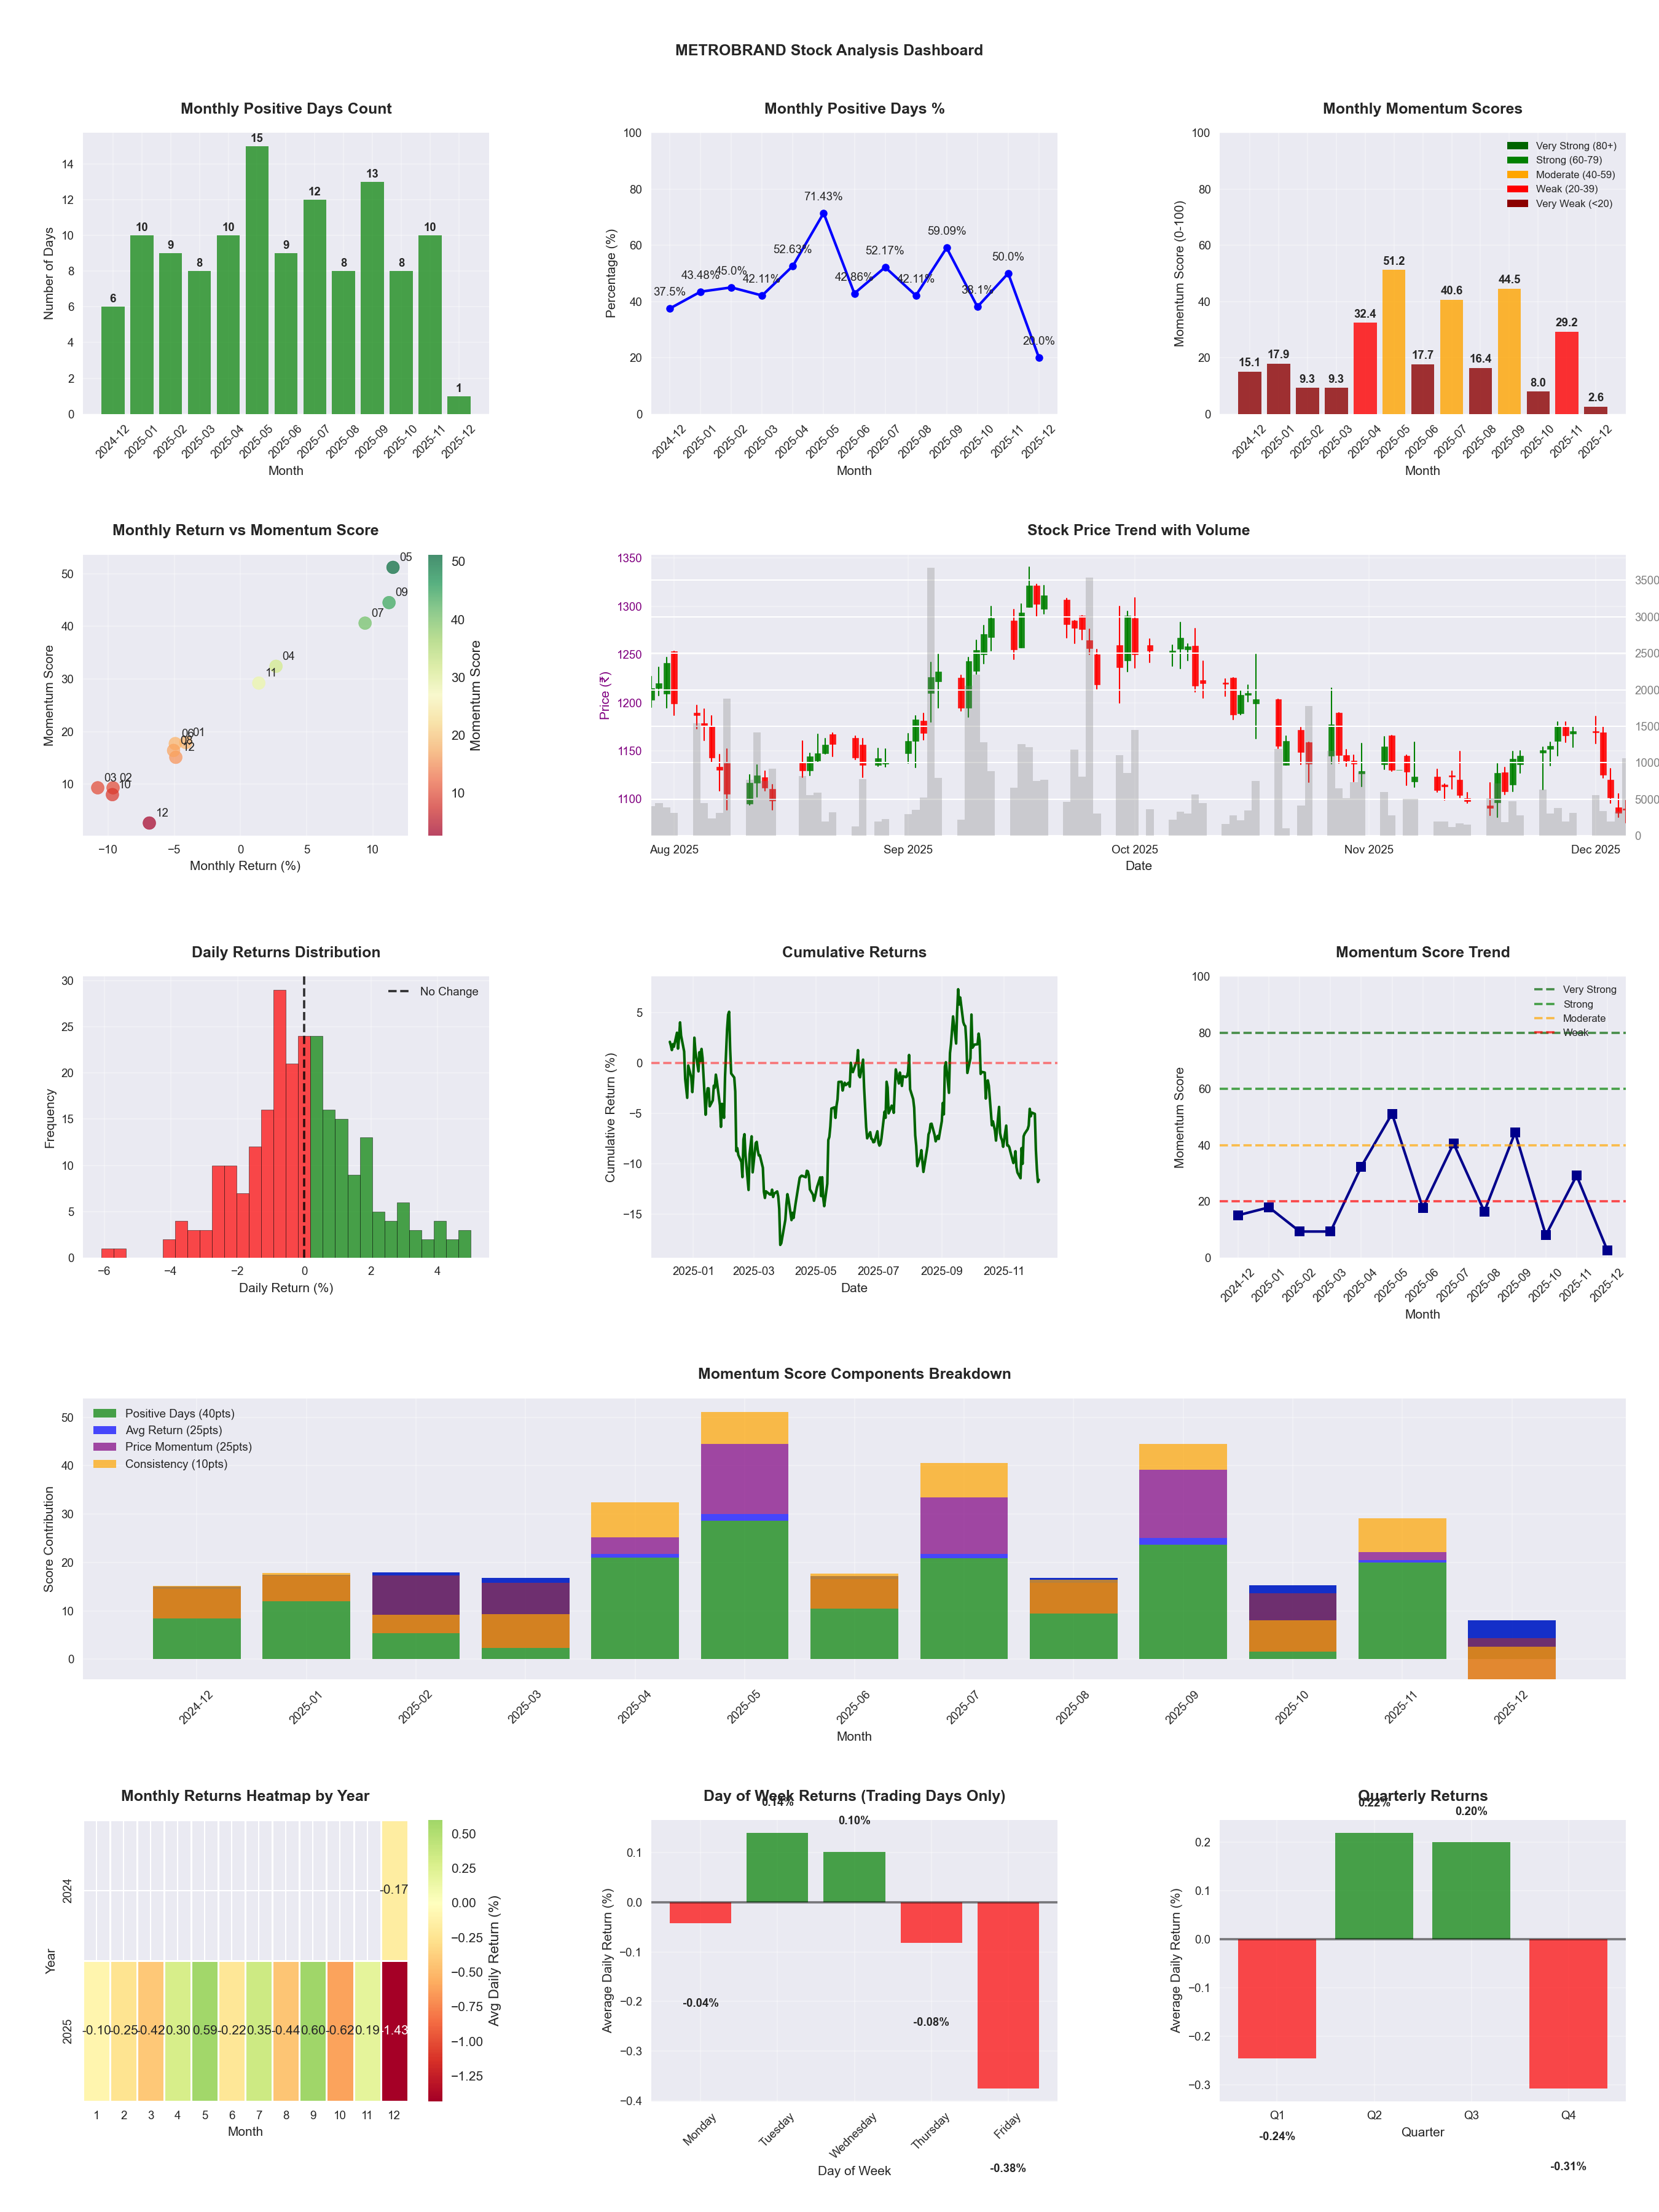
📊 Key Insights & Metrics
Symbol
📈 METROBRAND
Date
📅 2026-03-21
Volatility
🟡 1.89%
Win Rate
⚠️ 46.8%
Avg Daily Return
📉 -0.04%
Max Drawdown
📉 -30.83%
Best Month
🏆 2025-05
Best Months to Trade
📅 Sep, May, Jul
Best Days to Trade
📅 Wednesday, Tuesday
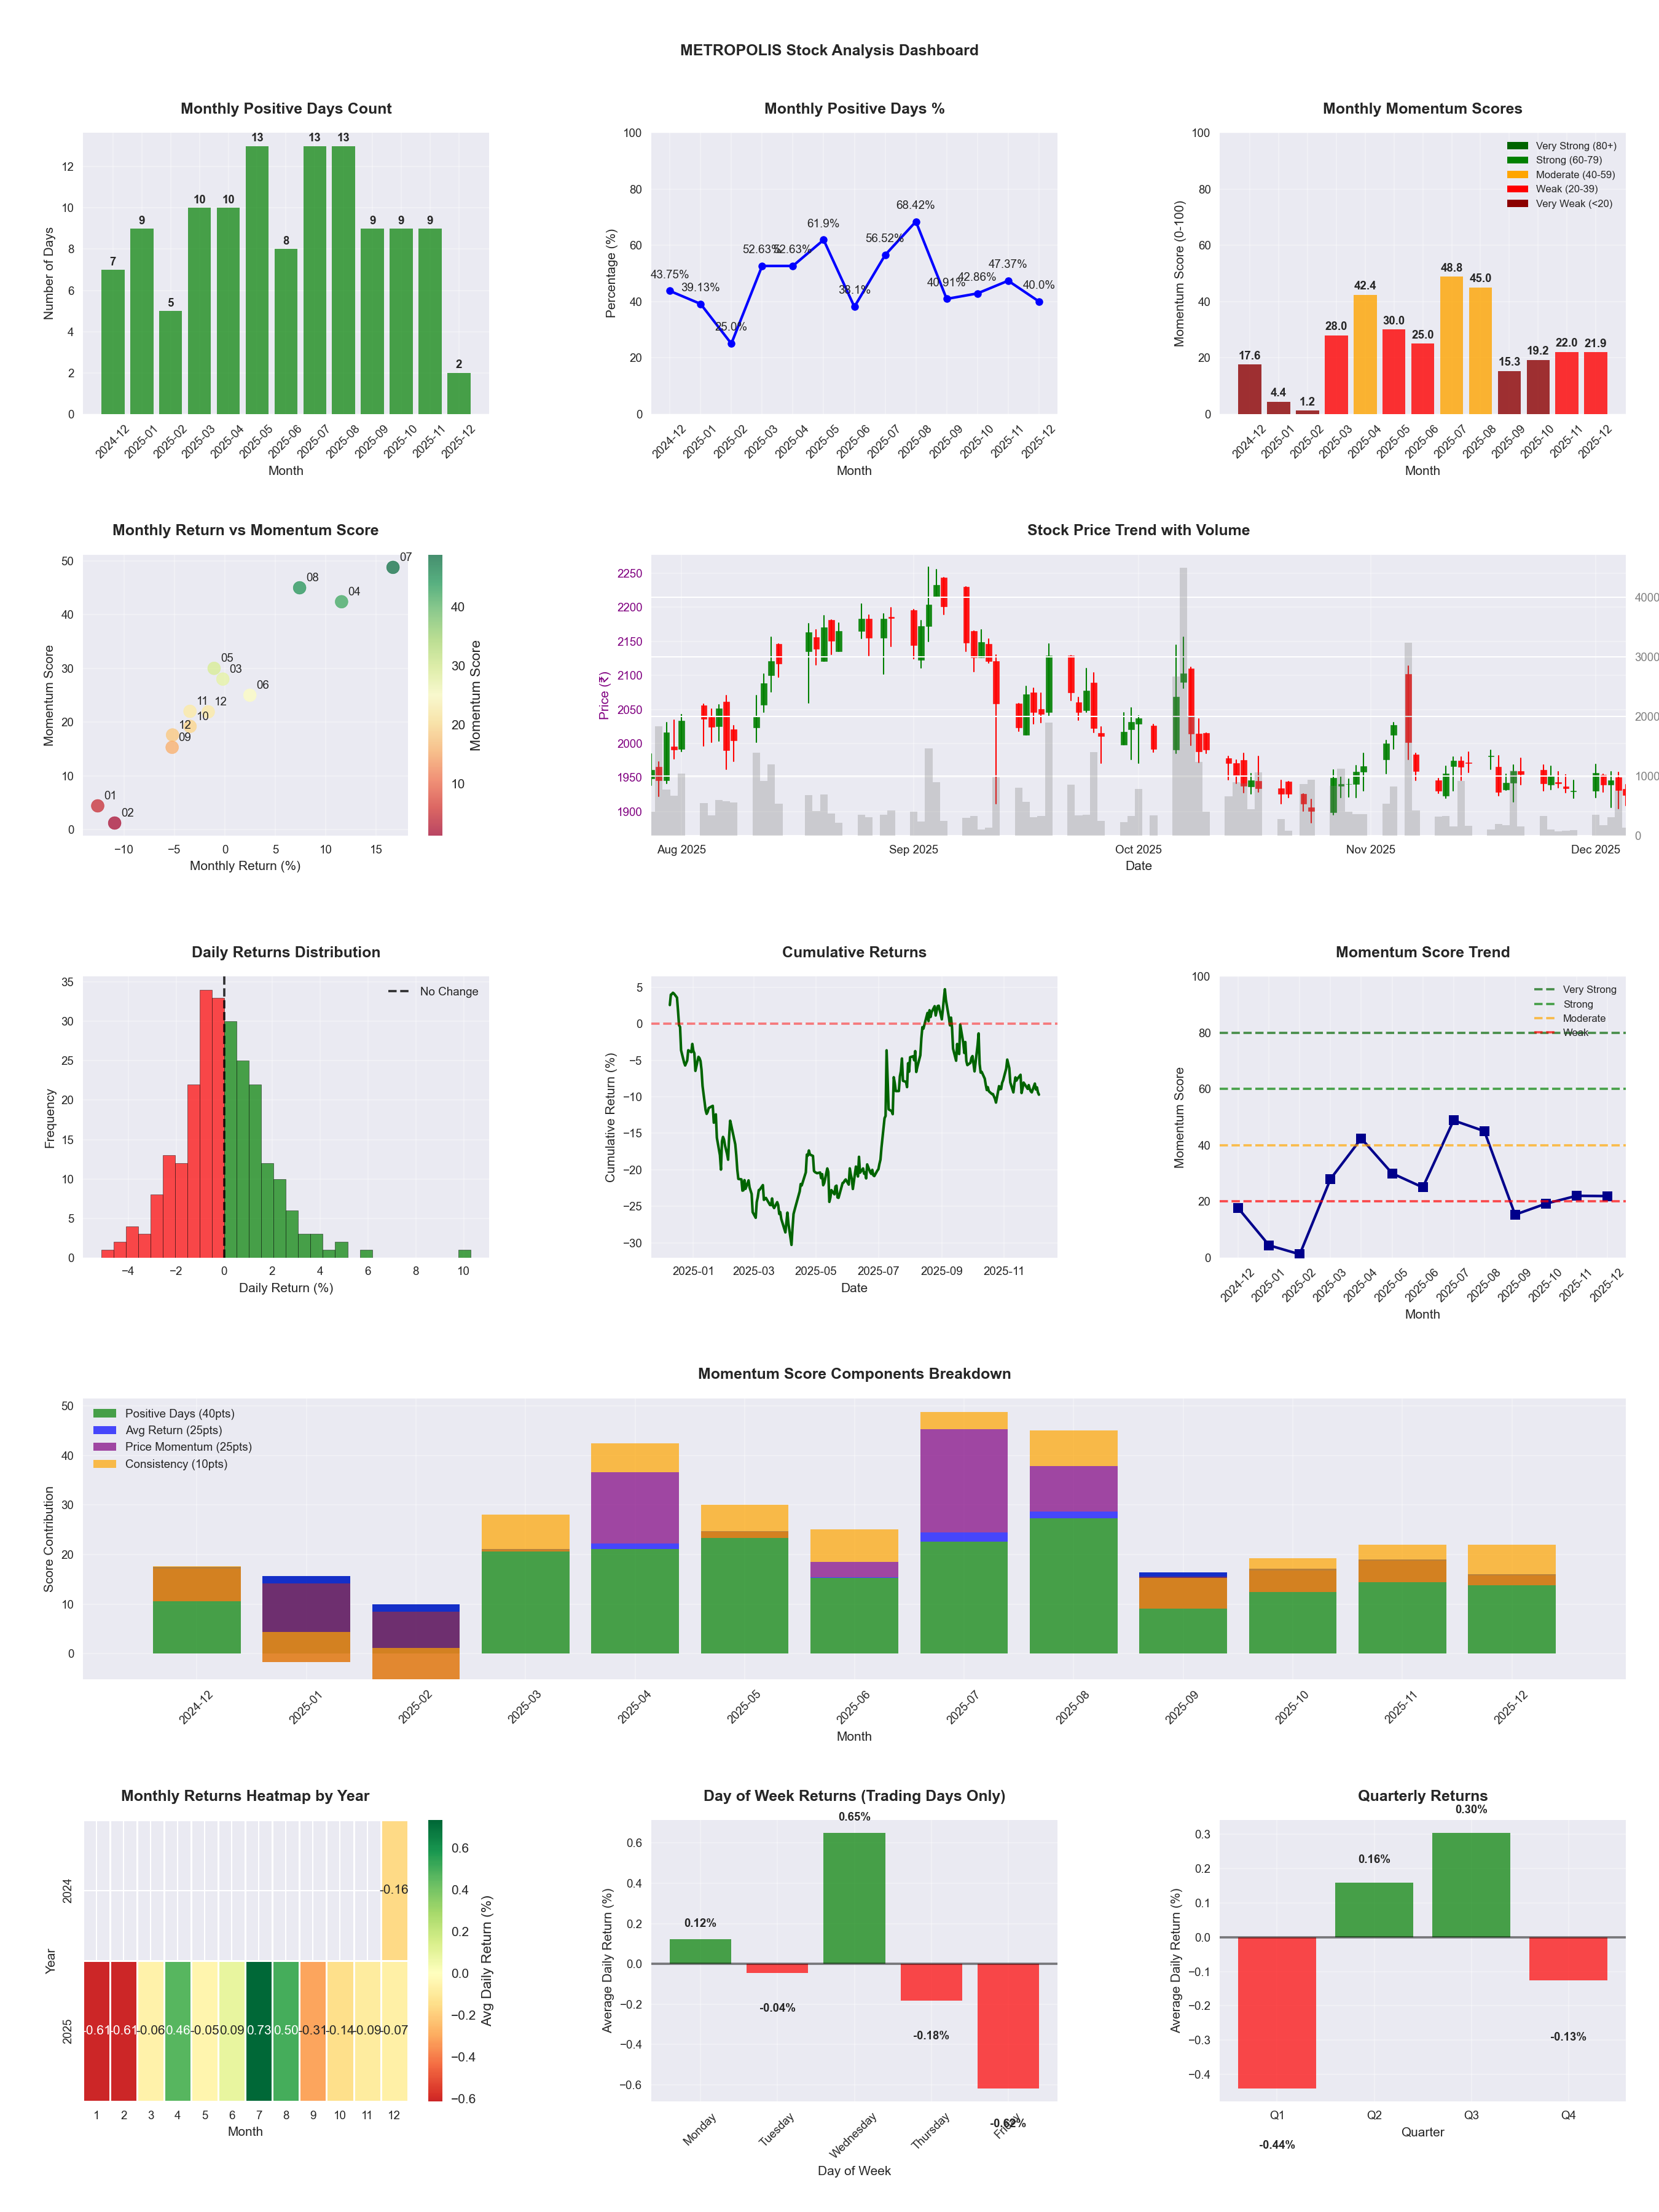
📊 Key Insights & Metrics
Symbol
📈 METROPOLIS
Date
📅 2026-04-11
Volatility
🟡 1.89%
Win Rate
⚠️ 48.4%
Avg Daily Return
📈 +0.08%
Max Drawdown
📉 -24.42%
IBD RS Score
📊 64.5
Average
Market Rank
#175
Best Month
🏆 2026-04
Worst Month
📉 2026-03
Best Months to Trade
📅 Apr, Jul, Aug
Best Days to Trade
📅 Monday, Wednesday
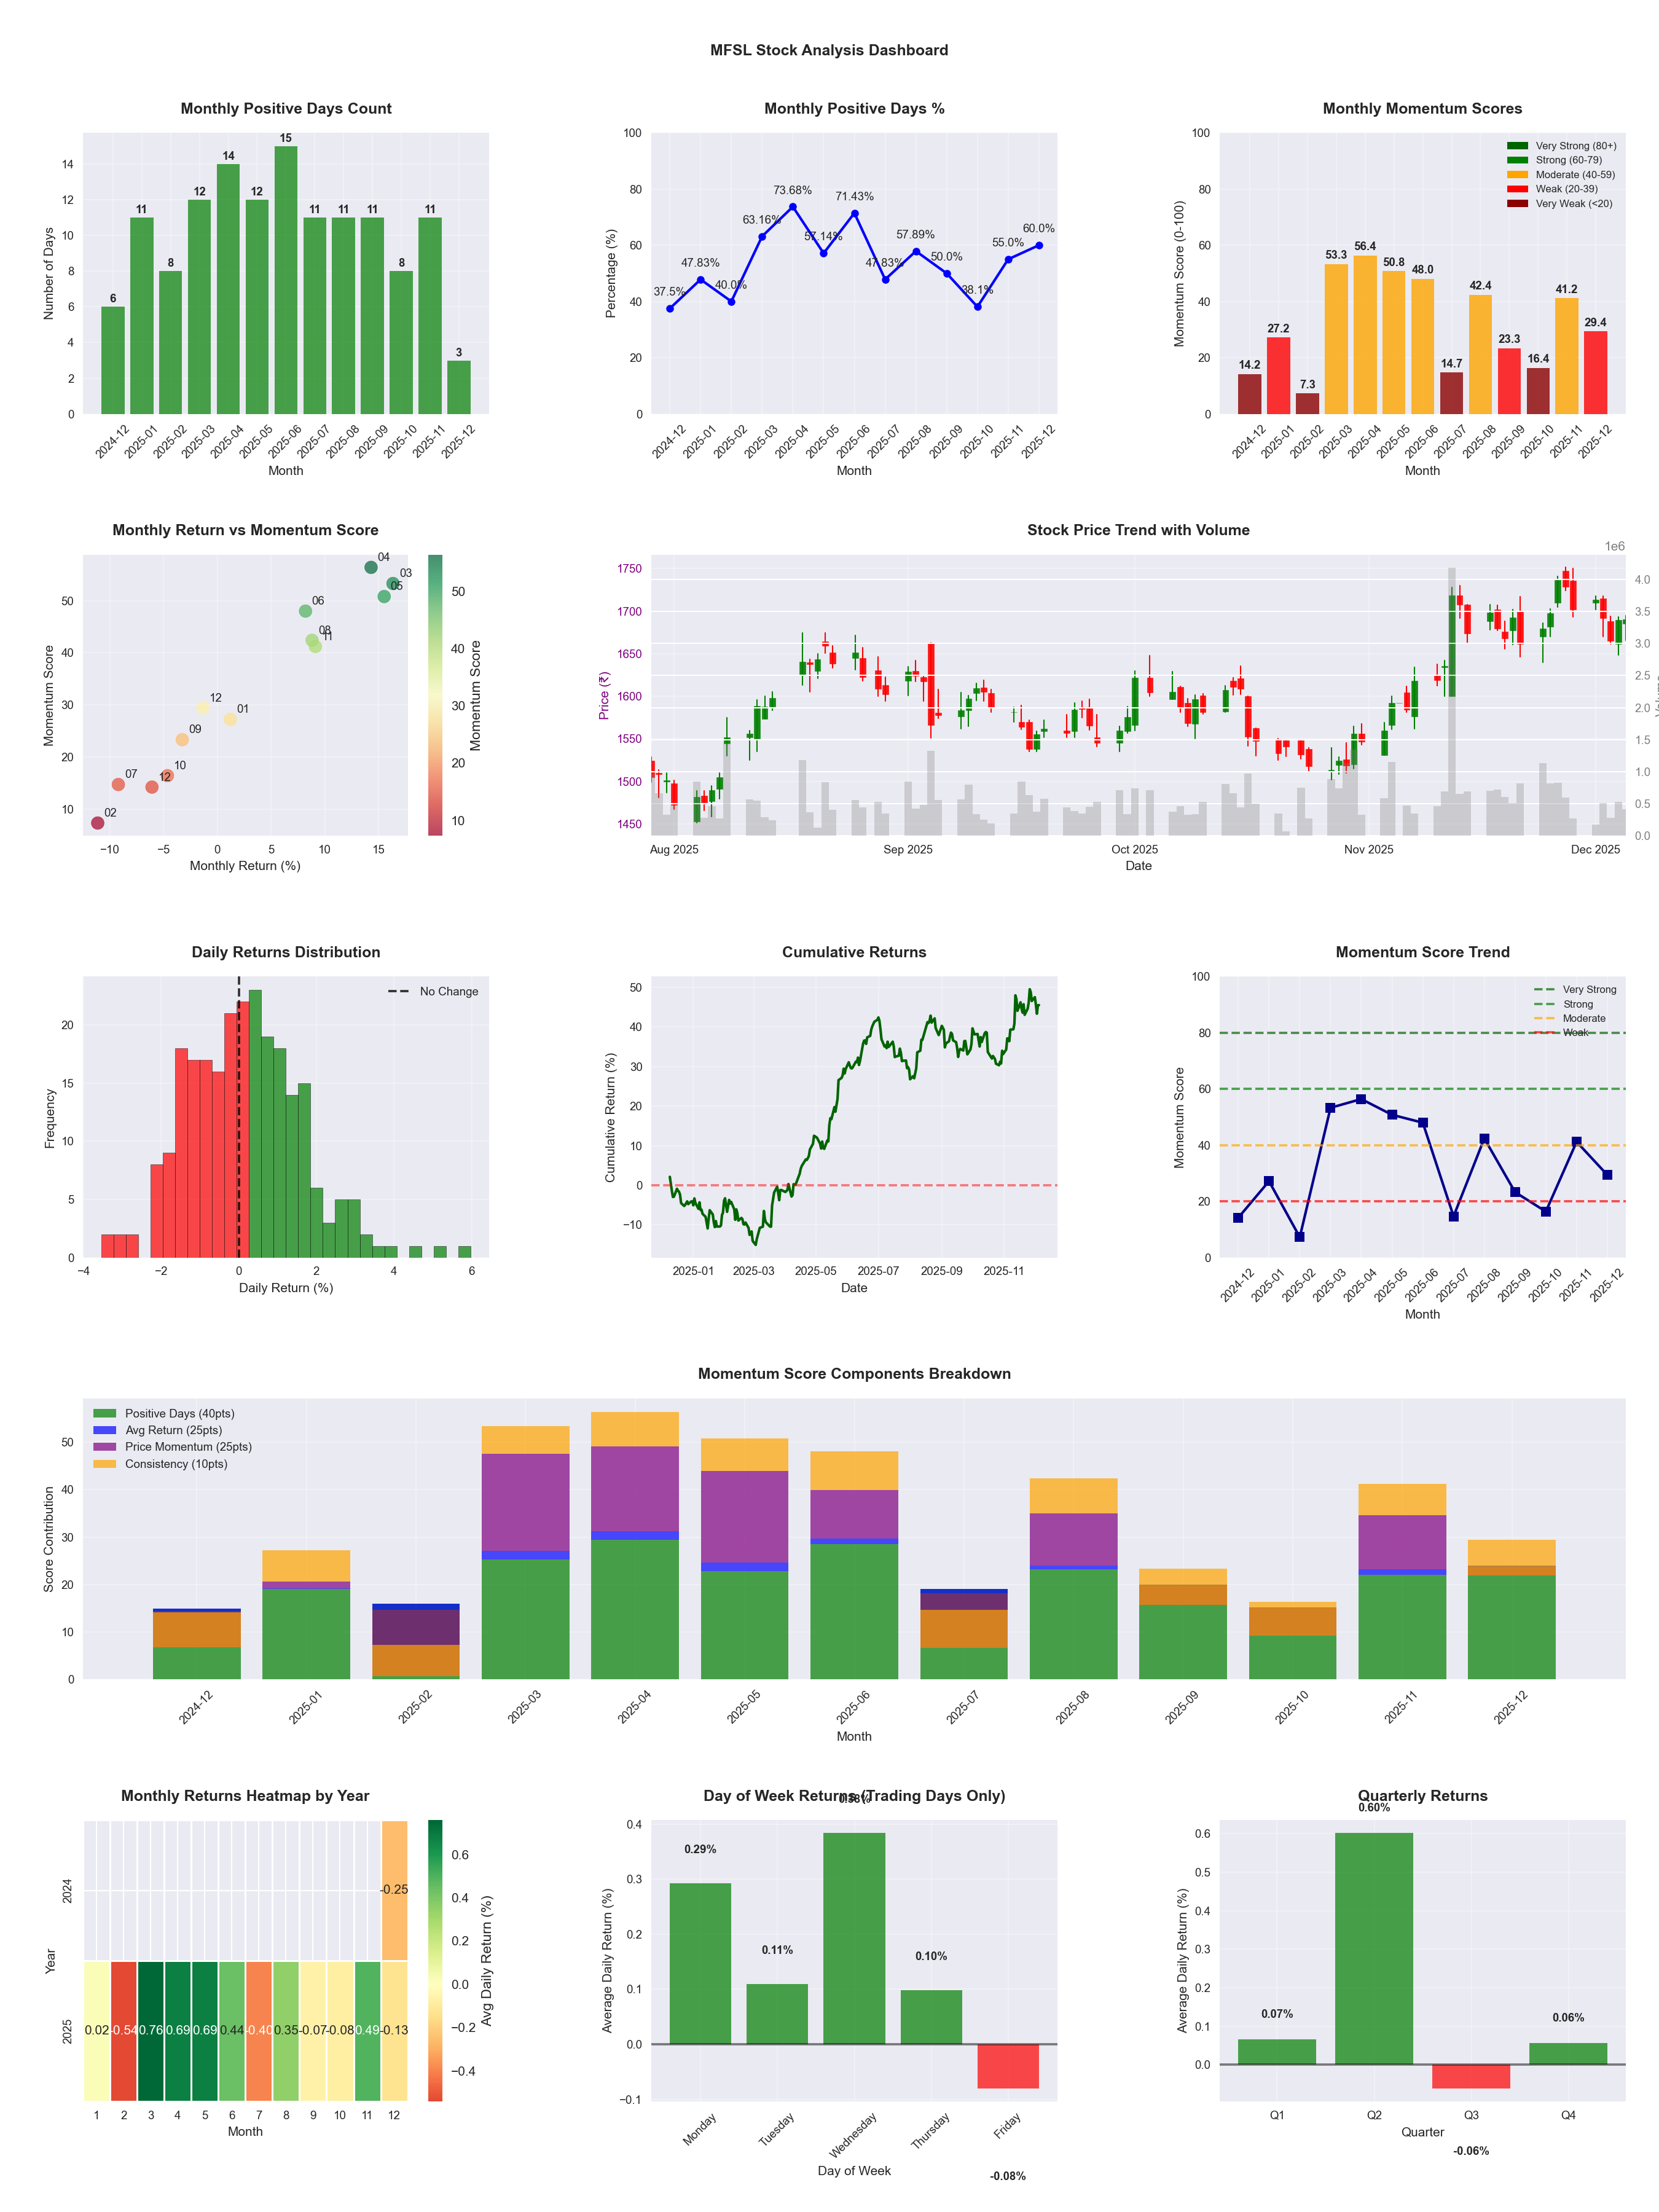
📊 Key Insights & Metrics
Symbol
📈 MFSL
Date
📅 2026-04-11
Volatility
🟡 1.50%
Win Rate
⚠️ 54.9%
Avg Daily Return
📈 +0.15%
Max Drawdown
📉 -21.70%
IBD RS Score
📊 75.1
Strong
Market Rank
#123
Best Month
🏆 2025-04
Worst Month
📉 2026-03
Best Months to Trade
📅 Apr, May, Feb
Best Days to Trade
📅 Monday, Wednesday
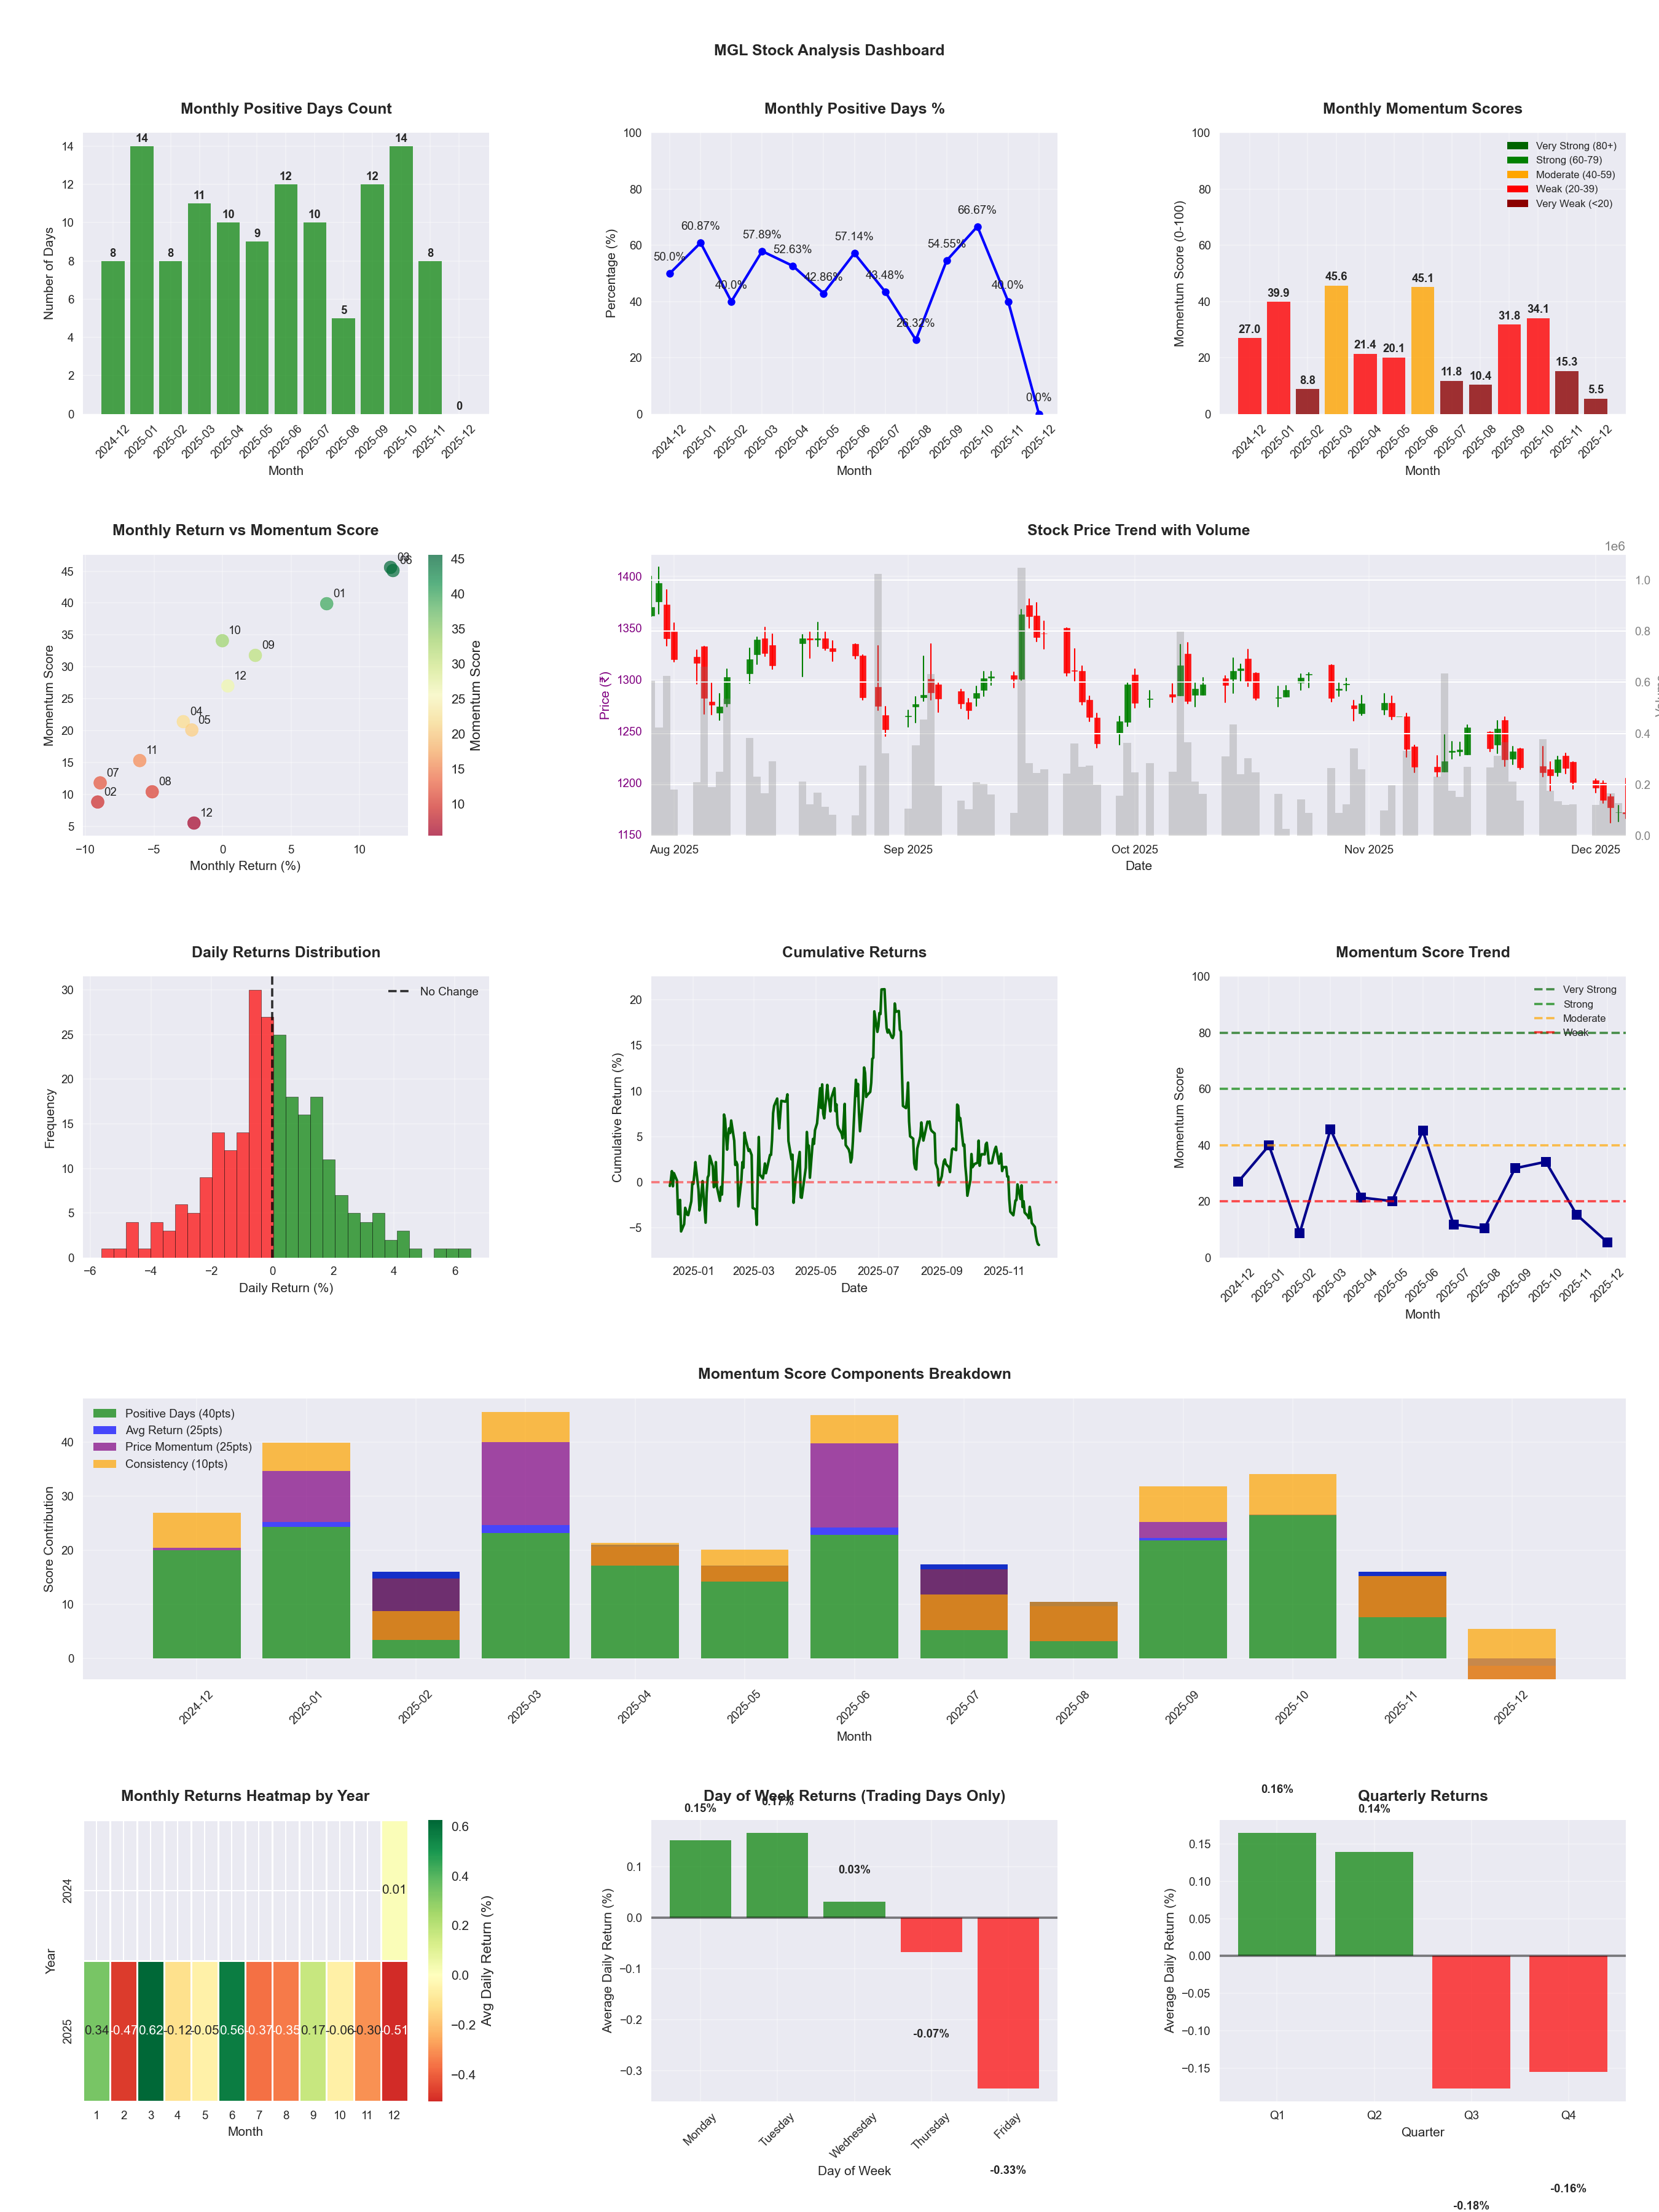
📊 Key Insights & Metrics
Symbol
📈 MGL
Date
📅 2026-04-11
Volatility
🟡 1.99%
Win Rate
⚠️ 48.0%
Avg Daily Return
📉 -0.04%
Max Drawdown
📉 -39.69%
IBD RS Score
📊 39.6
Weak
Market Rank
#298
Best Month
🏆 2026-04
Best Months to Trade
📅 Apr, Feb, Jun
Best Days to Trade
📅 Monday, Wednesday
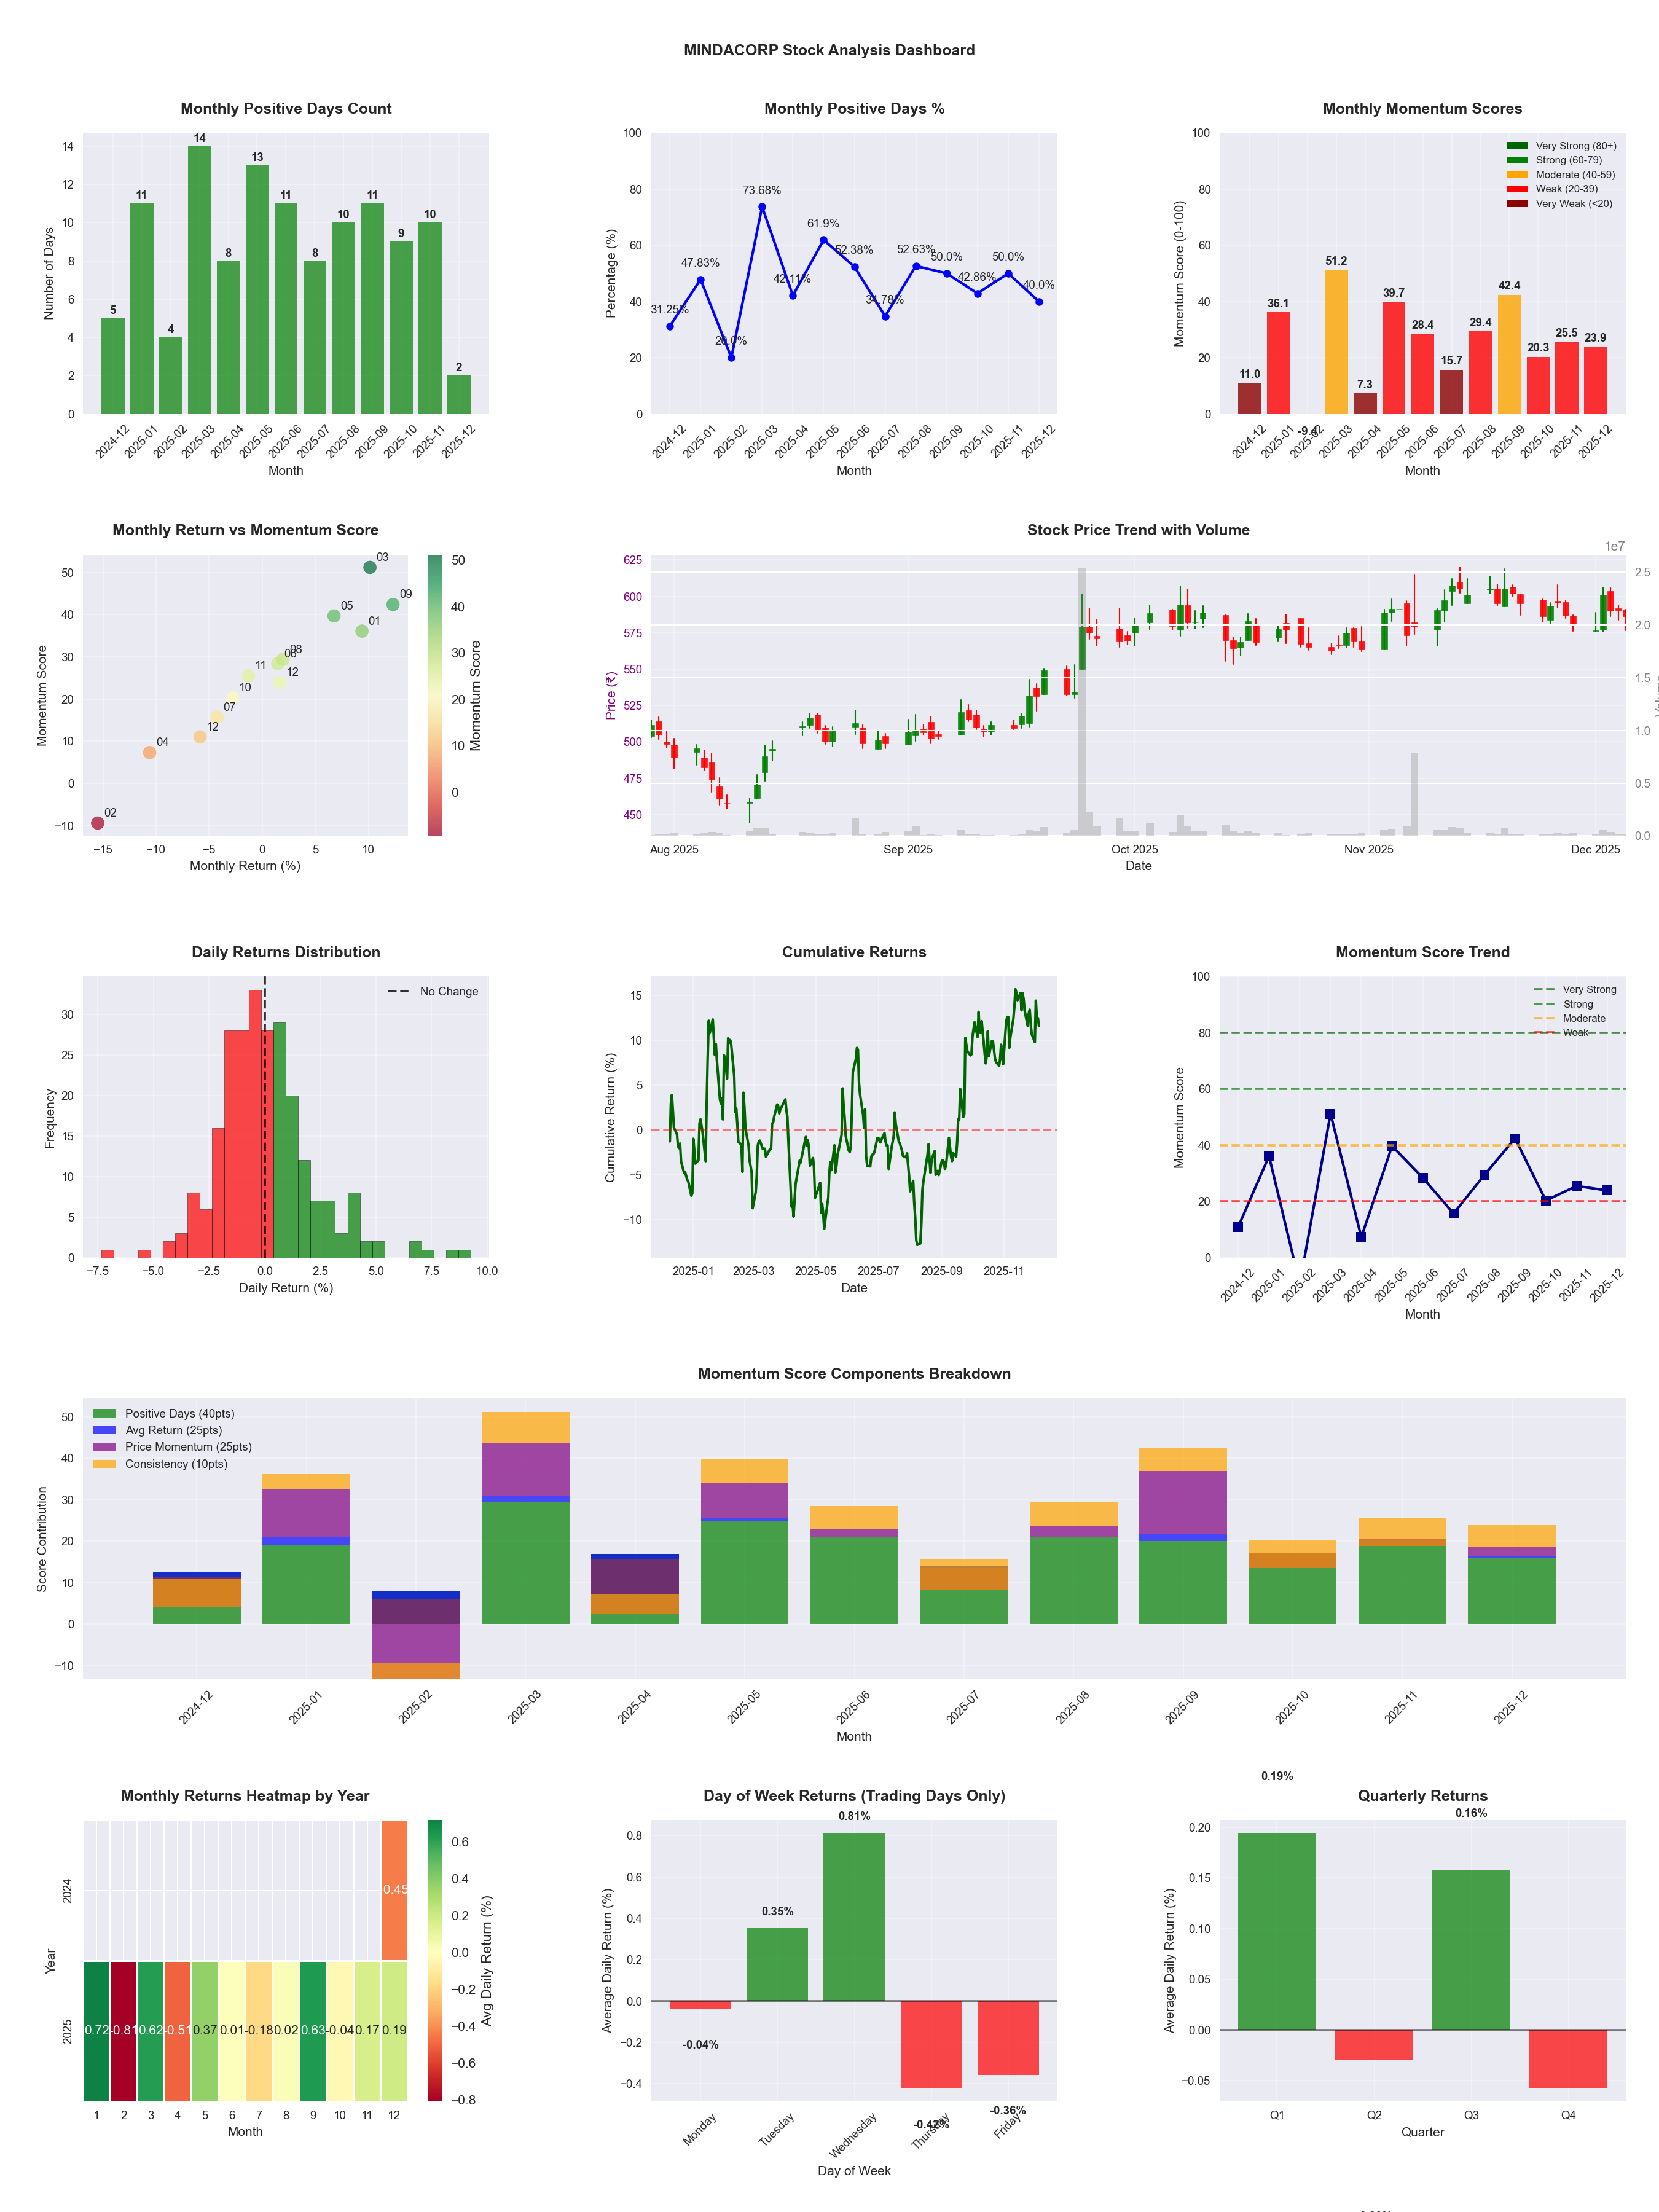
📊 Key Insights & Metrics
Symbol
📈 MINDACORP
Date
📅 2026-04-11
Volatility
🟡 2.02%
Risk Profile
⚠️ suitable for aggressive investors
Win Rate
⚠️ 46.8%
Avg Daily Return
📈 +0.04%
Max Drawdown
📉 -20.78%
IBD RS Score
📊 47.9
Weak
Market Rank
#257
Best Month
🏆 2025-09
Worst Month
📉 2026-03
Best Months to Trade
📅 Sep, May, Nov
Best Days to Trade
📅 Wednesday, Tuesday
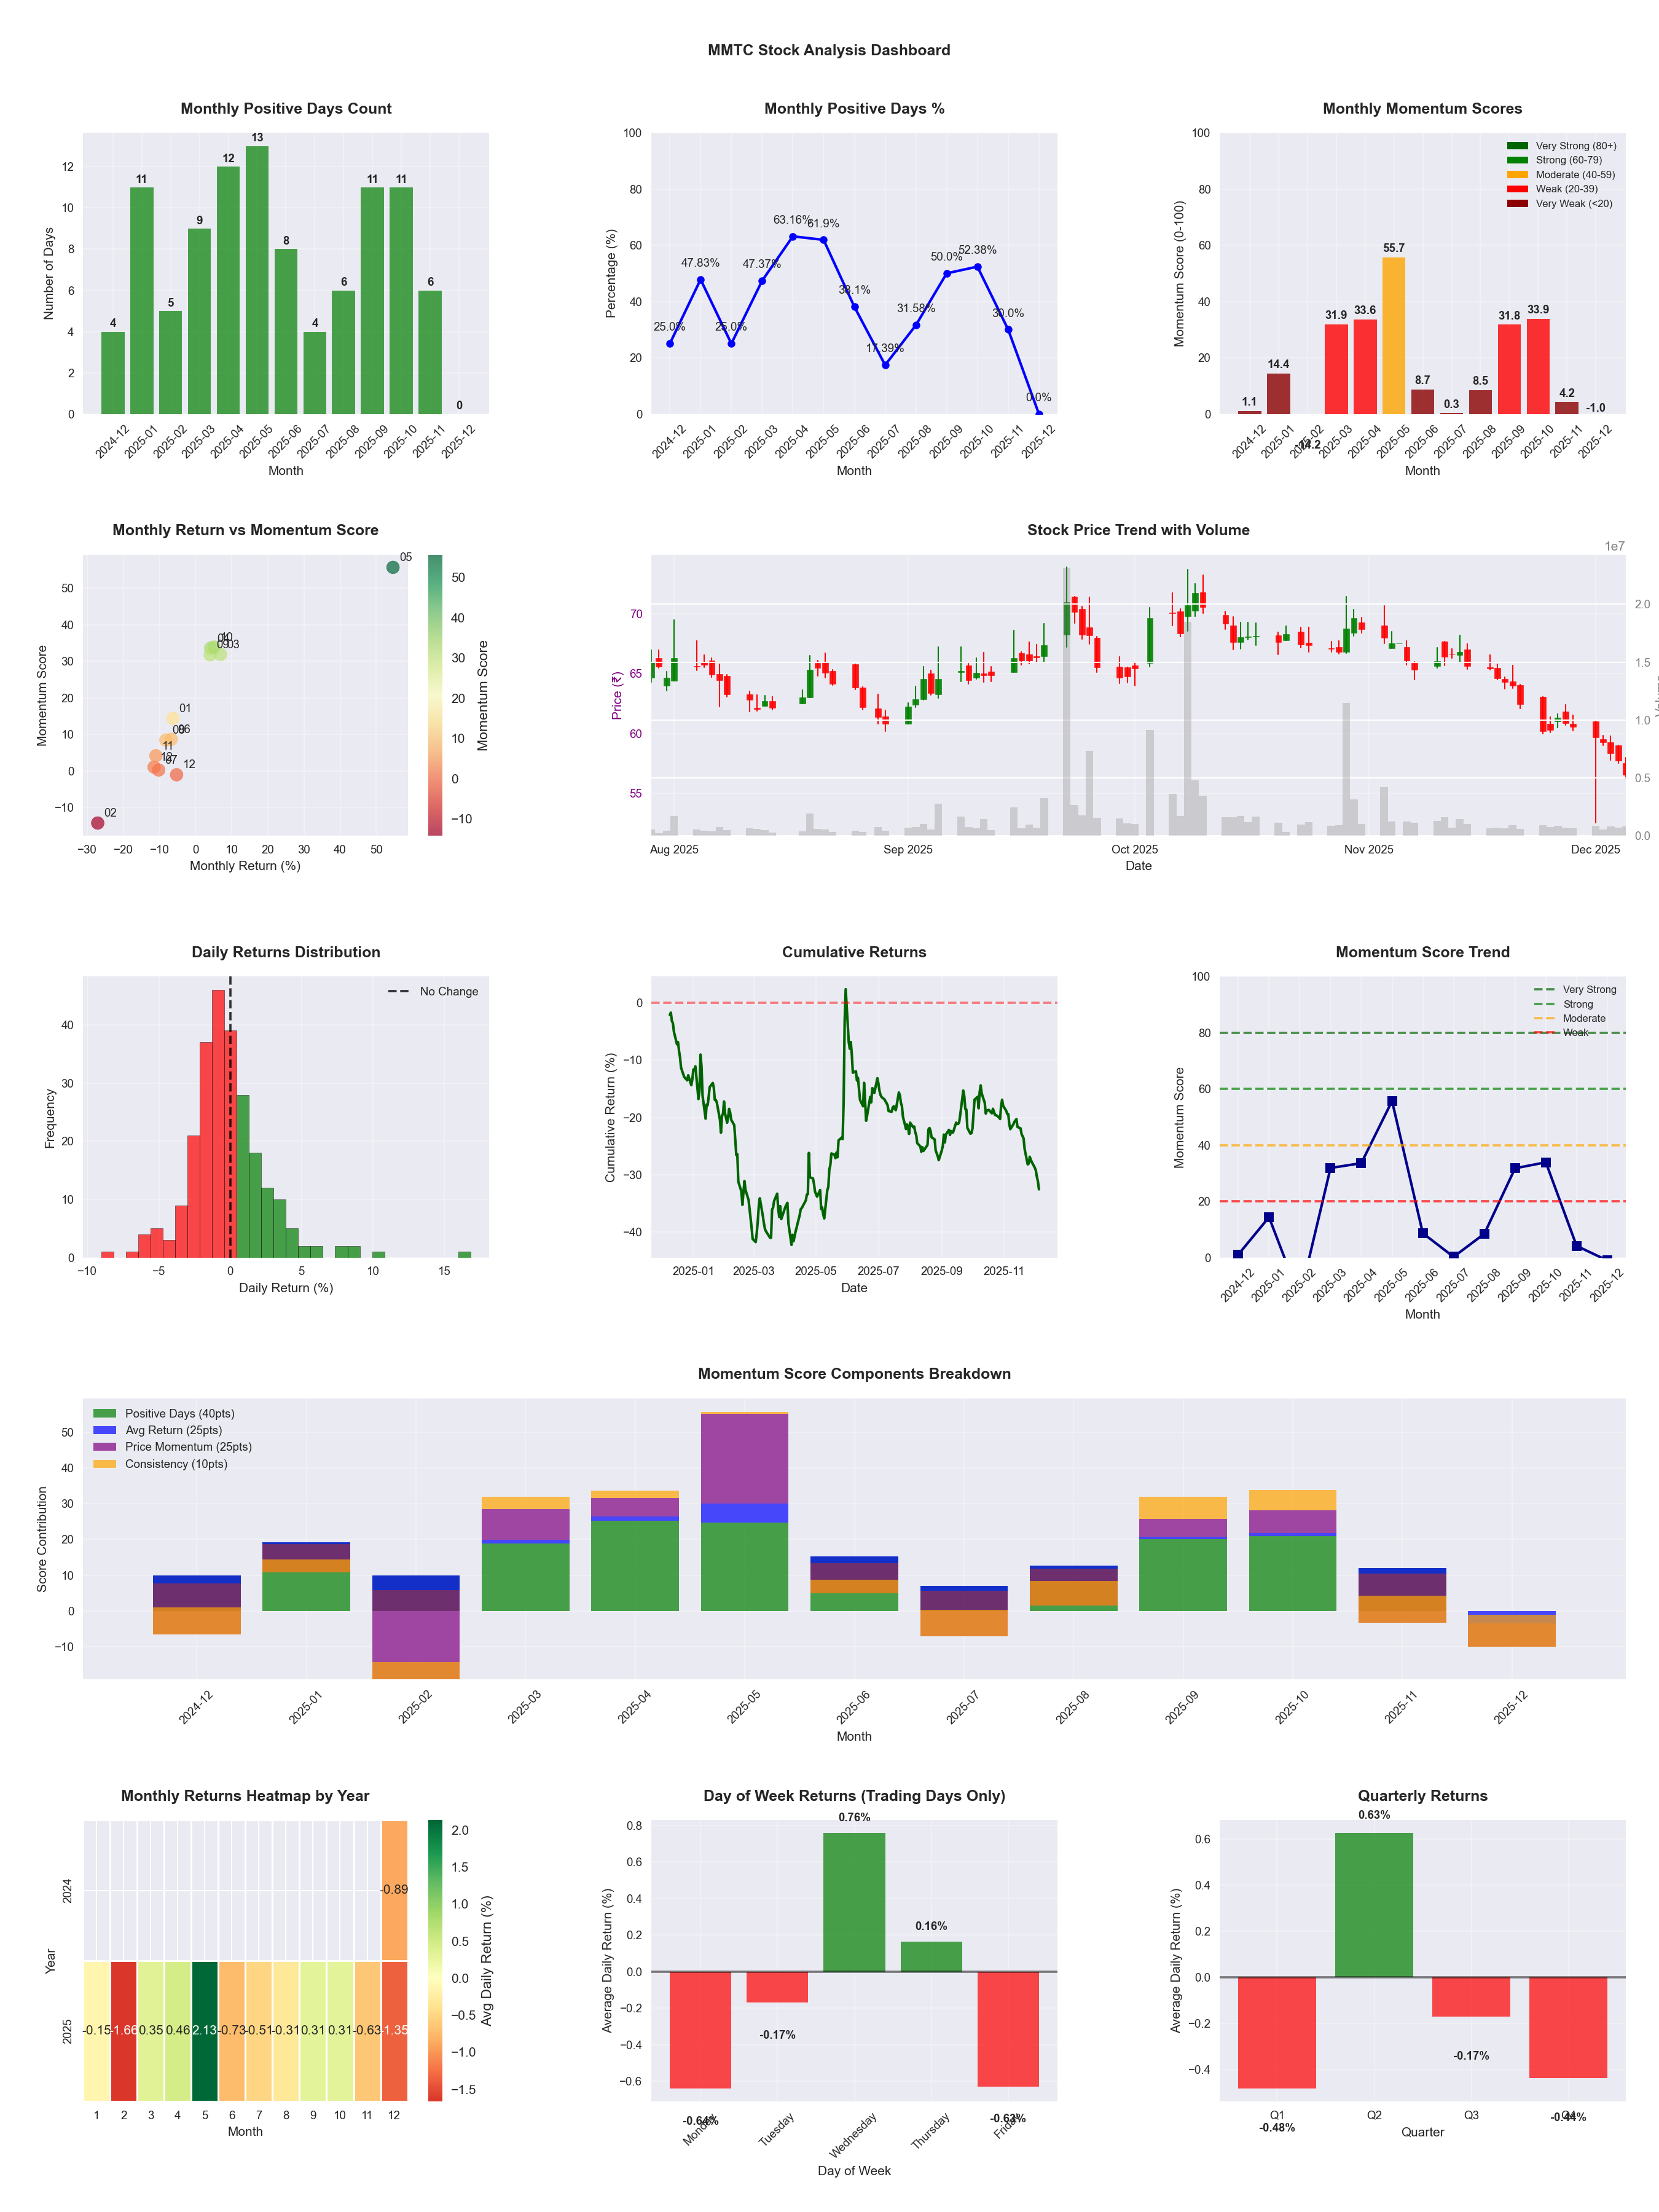
📊 Key Insights & Metrics
Symbol
📈 MMTC
Date
📅 2026-04-11
Volatility
🔴 3.19%
Risk Profile
⚠️ suitable for aggressive investors
Win Rate
⚠️ 44.7%
Avg Daily Return
📈 +0.11%
Max Drawdown
📉 -39.26%
IBD RS Score
📊 48.9
Weak
Market Rank
#252
Best Month
🏆 2026-04
Worst Month
📉 2025-07
Best Months to Trade
📅 May, Apr, Dec
Best Days to Trade
📅 Wednesday, Monday
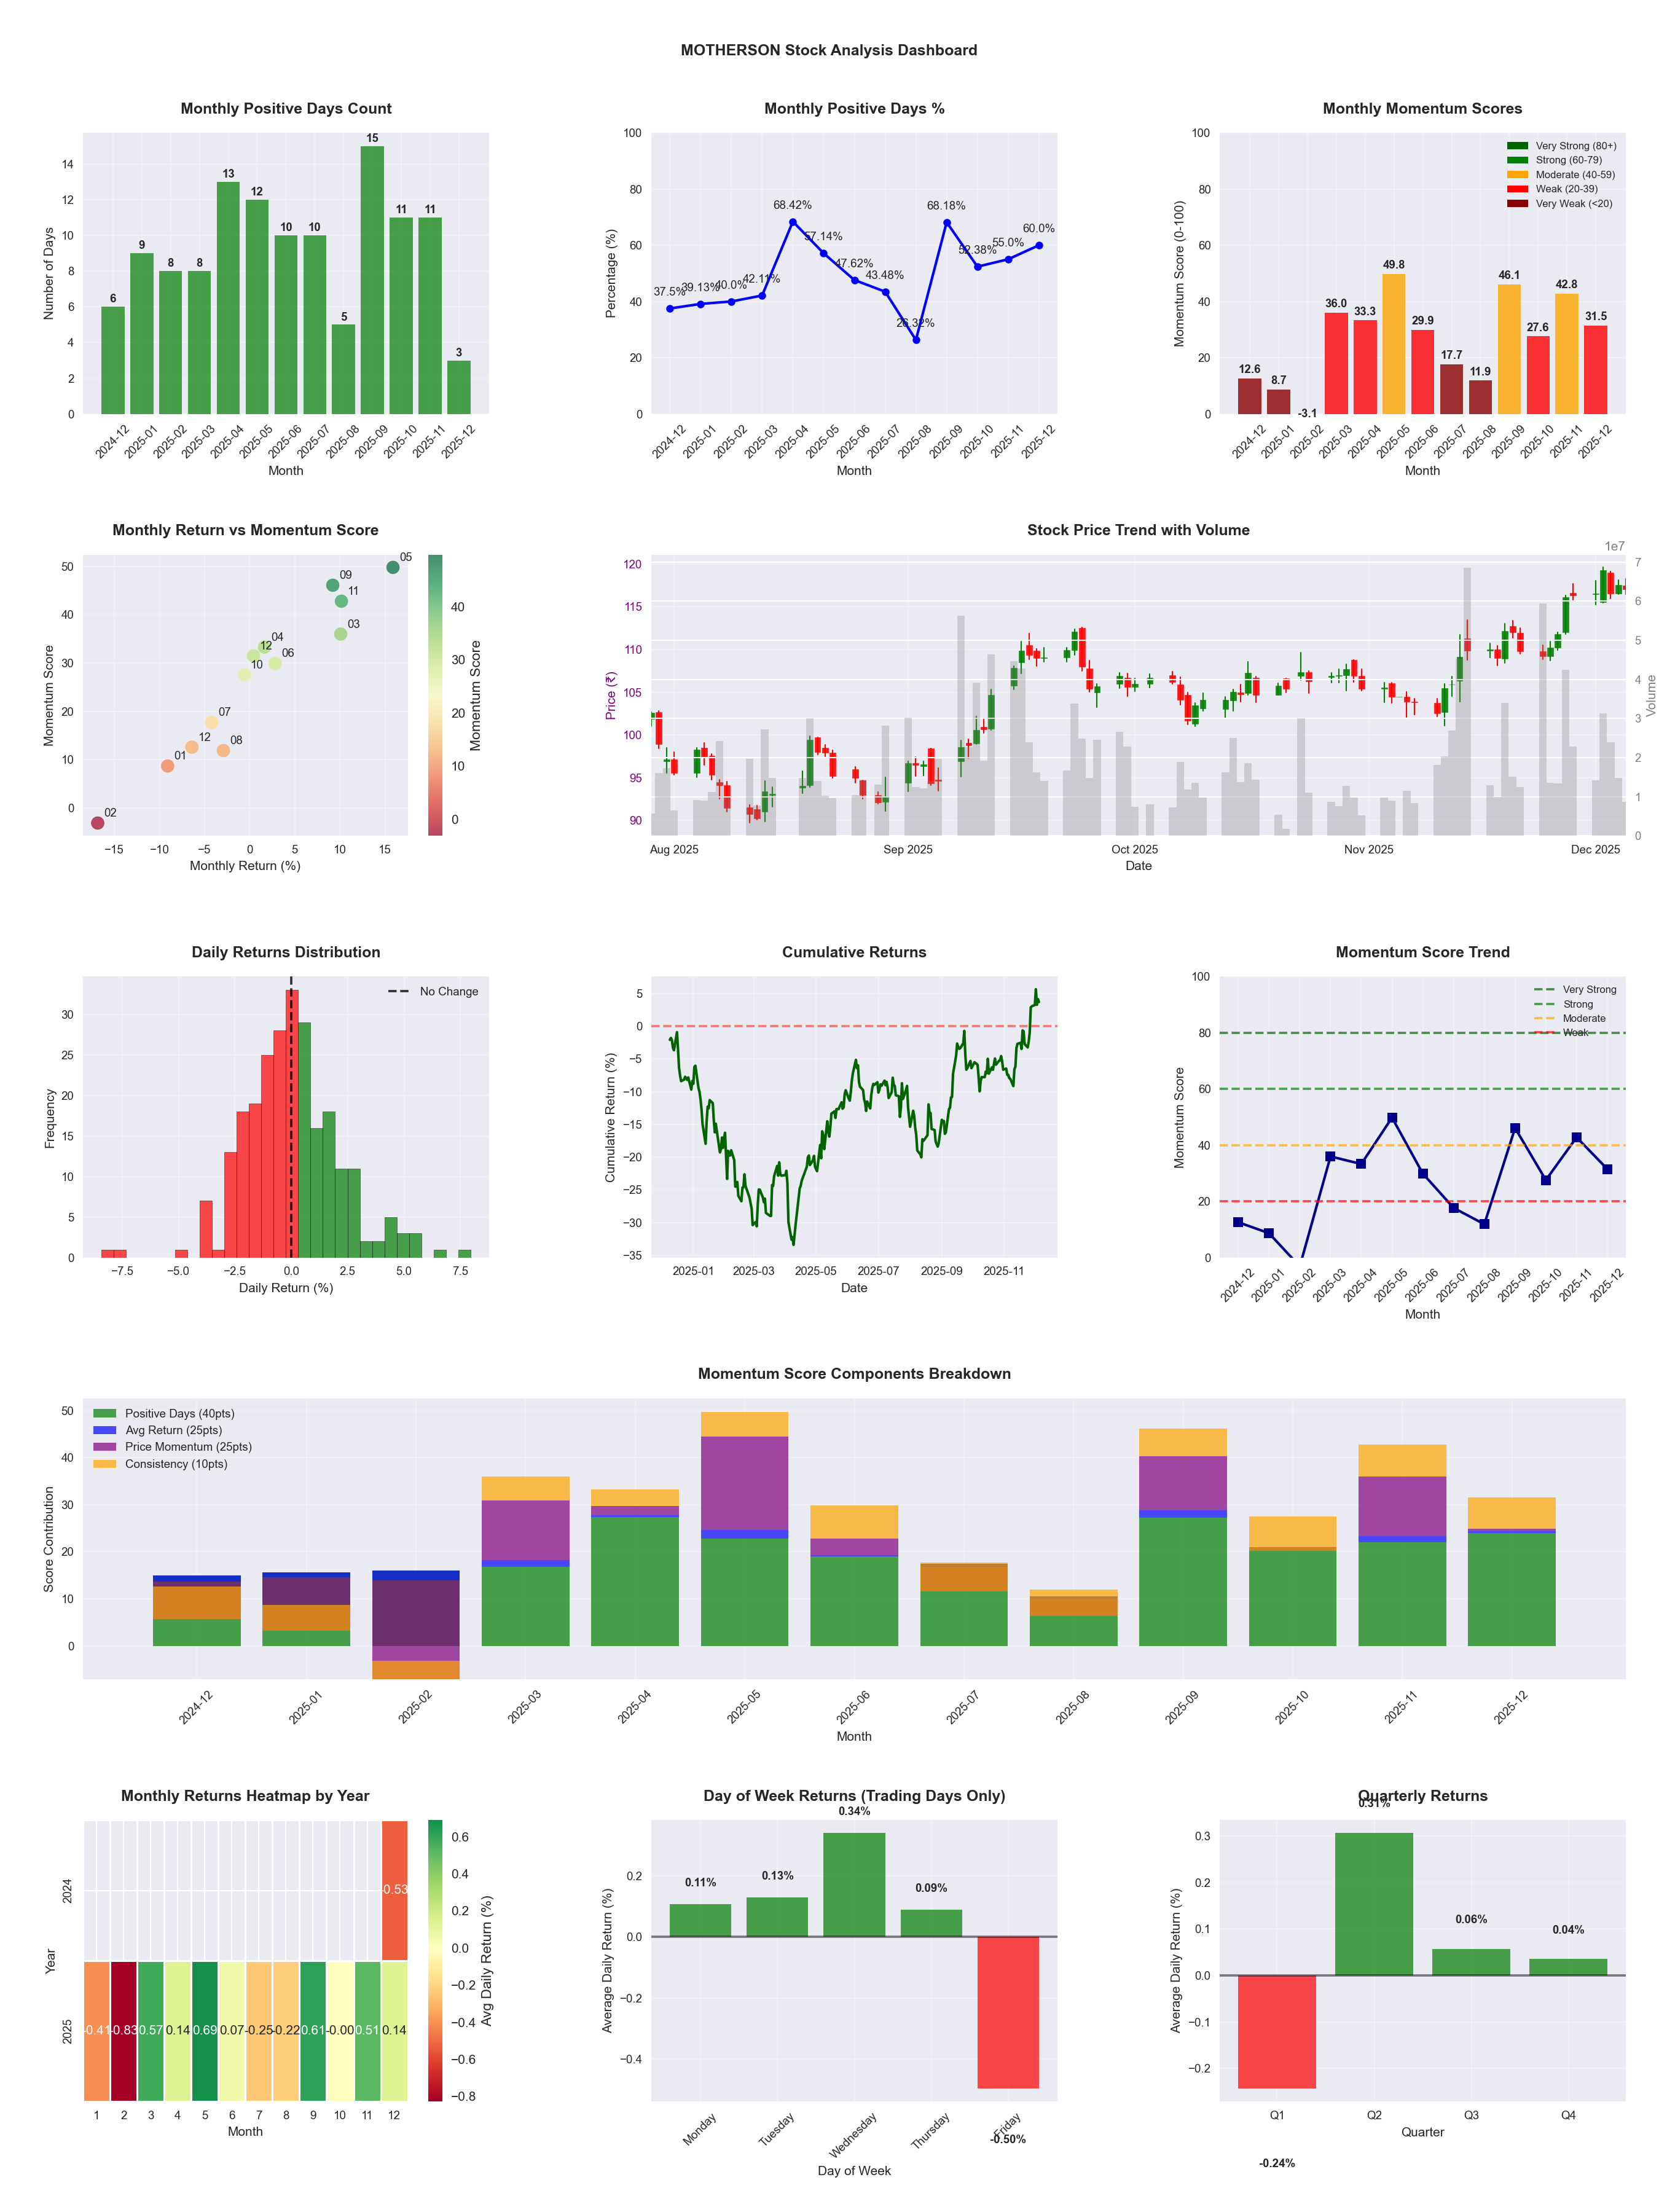
📊 Key Insights & Metrics
Symbol
📈 MOTHERSON
Date
📅 2026-04-11
Volatility
🟡 2.15%
Risk Profile
⚠️ suitable for aggressive investors
Win Rate
⚠️ 51.2%
Avg Daily Return
📈 +0.20%
Max Drawdown
📉 -22.10%
IBD RS Score
📊 86.6
Strong
Market Rank
#66
Best Month
🏆 2026-02
Best Months to Trade
📅 Apr, Feb, May
Best Days to Trade
📅 Tuesday, Monday
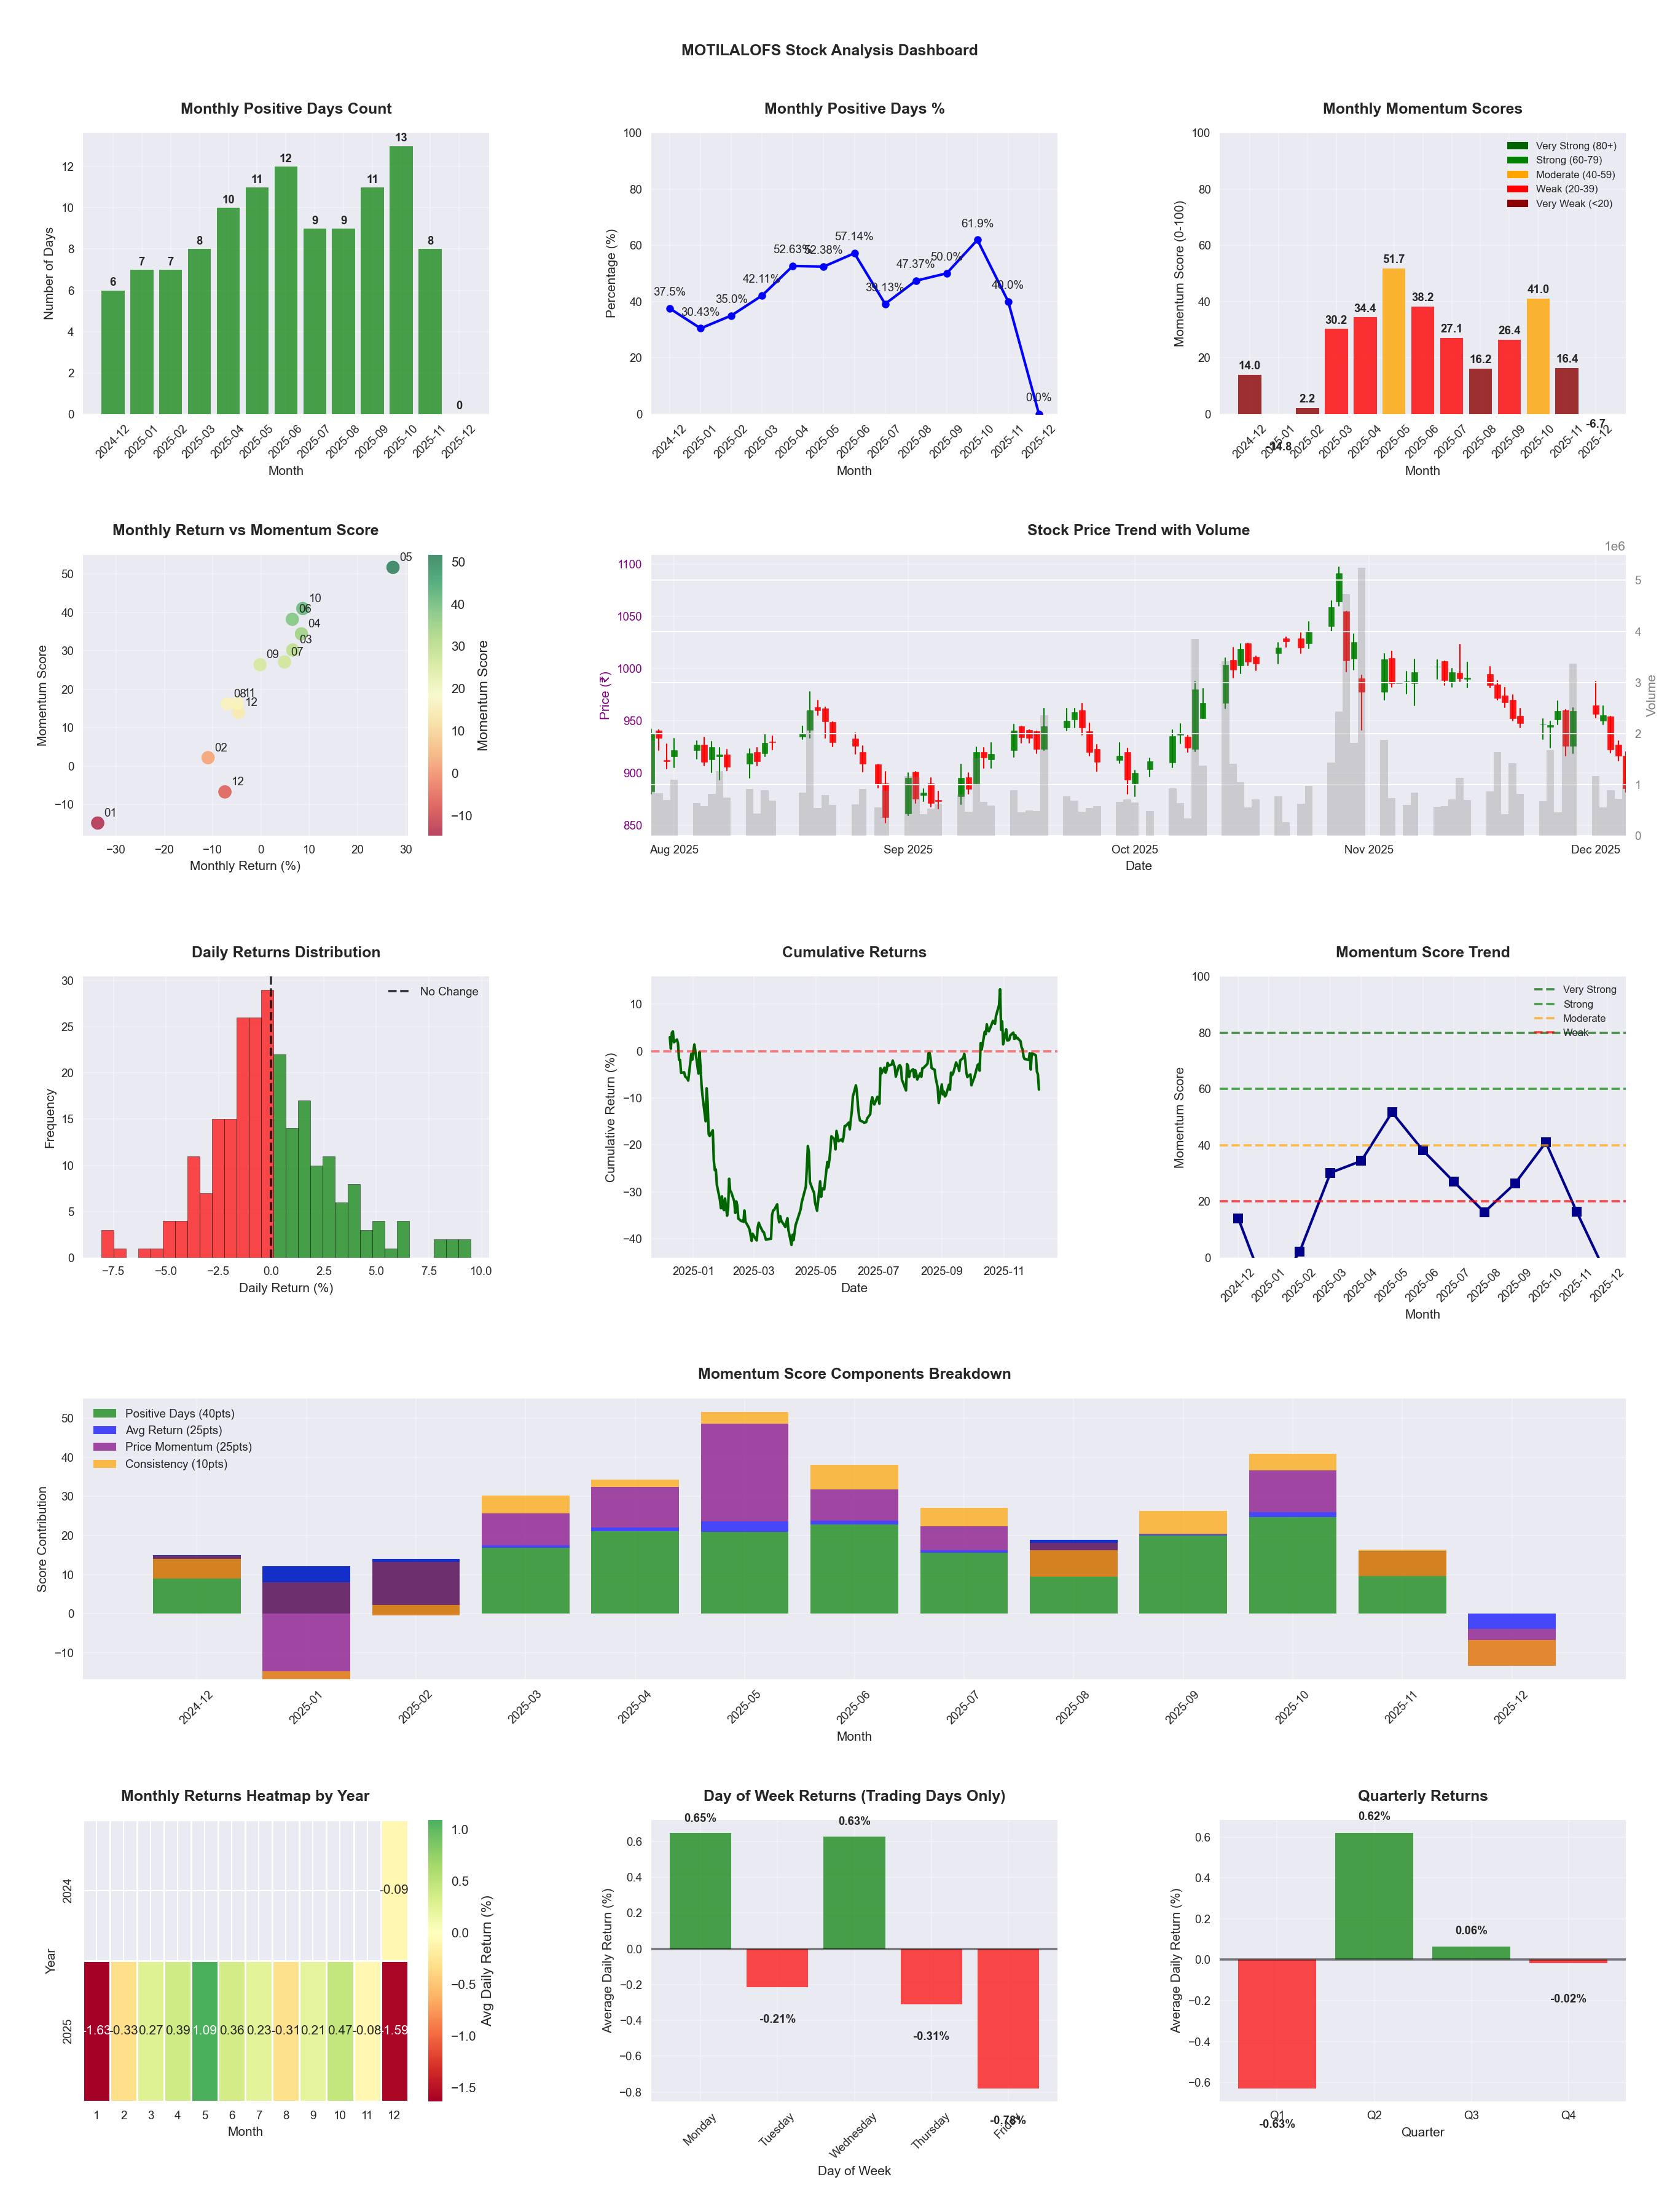
📊 Key Insights & Metrics
Symbol
📈 MOTILALOFS
Date
📅 2026-04-11
Volatility
🟡 2.68%
Risk Profile
⚠️ suitable for aggressive investors
Win Rate
⚠️ 44.3%
Avg Daily Return
📈 +0.14%
Max Drawdown
📉 -41.97%
IBD RS Score
📊 52.1
Average
Market Rank
#236
Best Month
🏆 2026-04
Best Months to Trade
📅 Apr, May, Oct
Best Days to Trade
📅 Wednesday, Monday
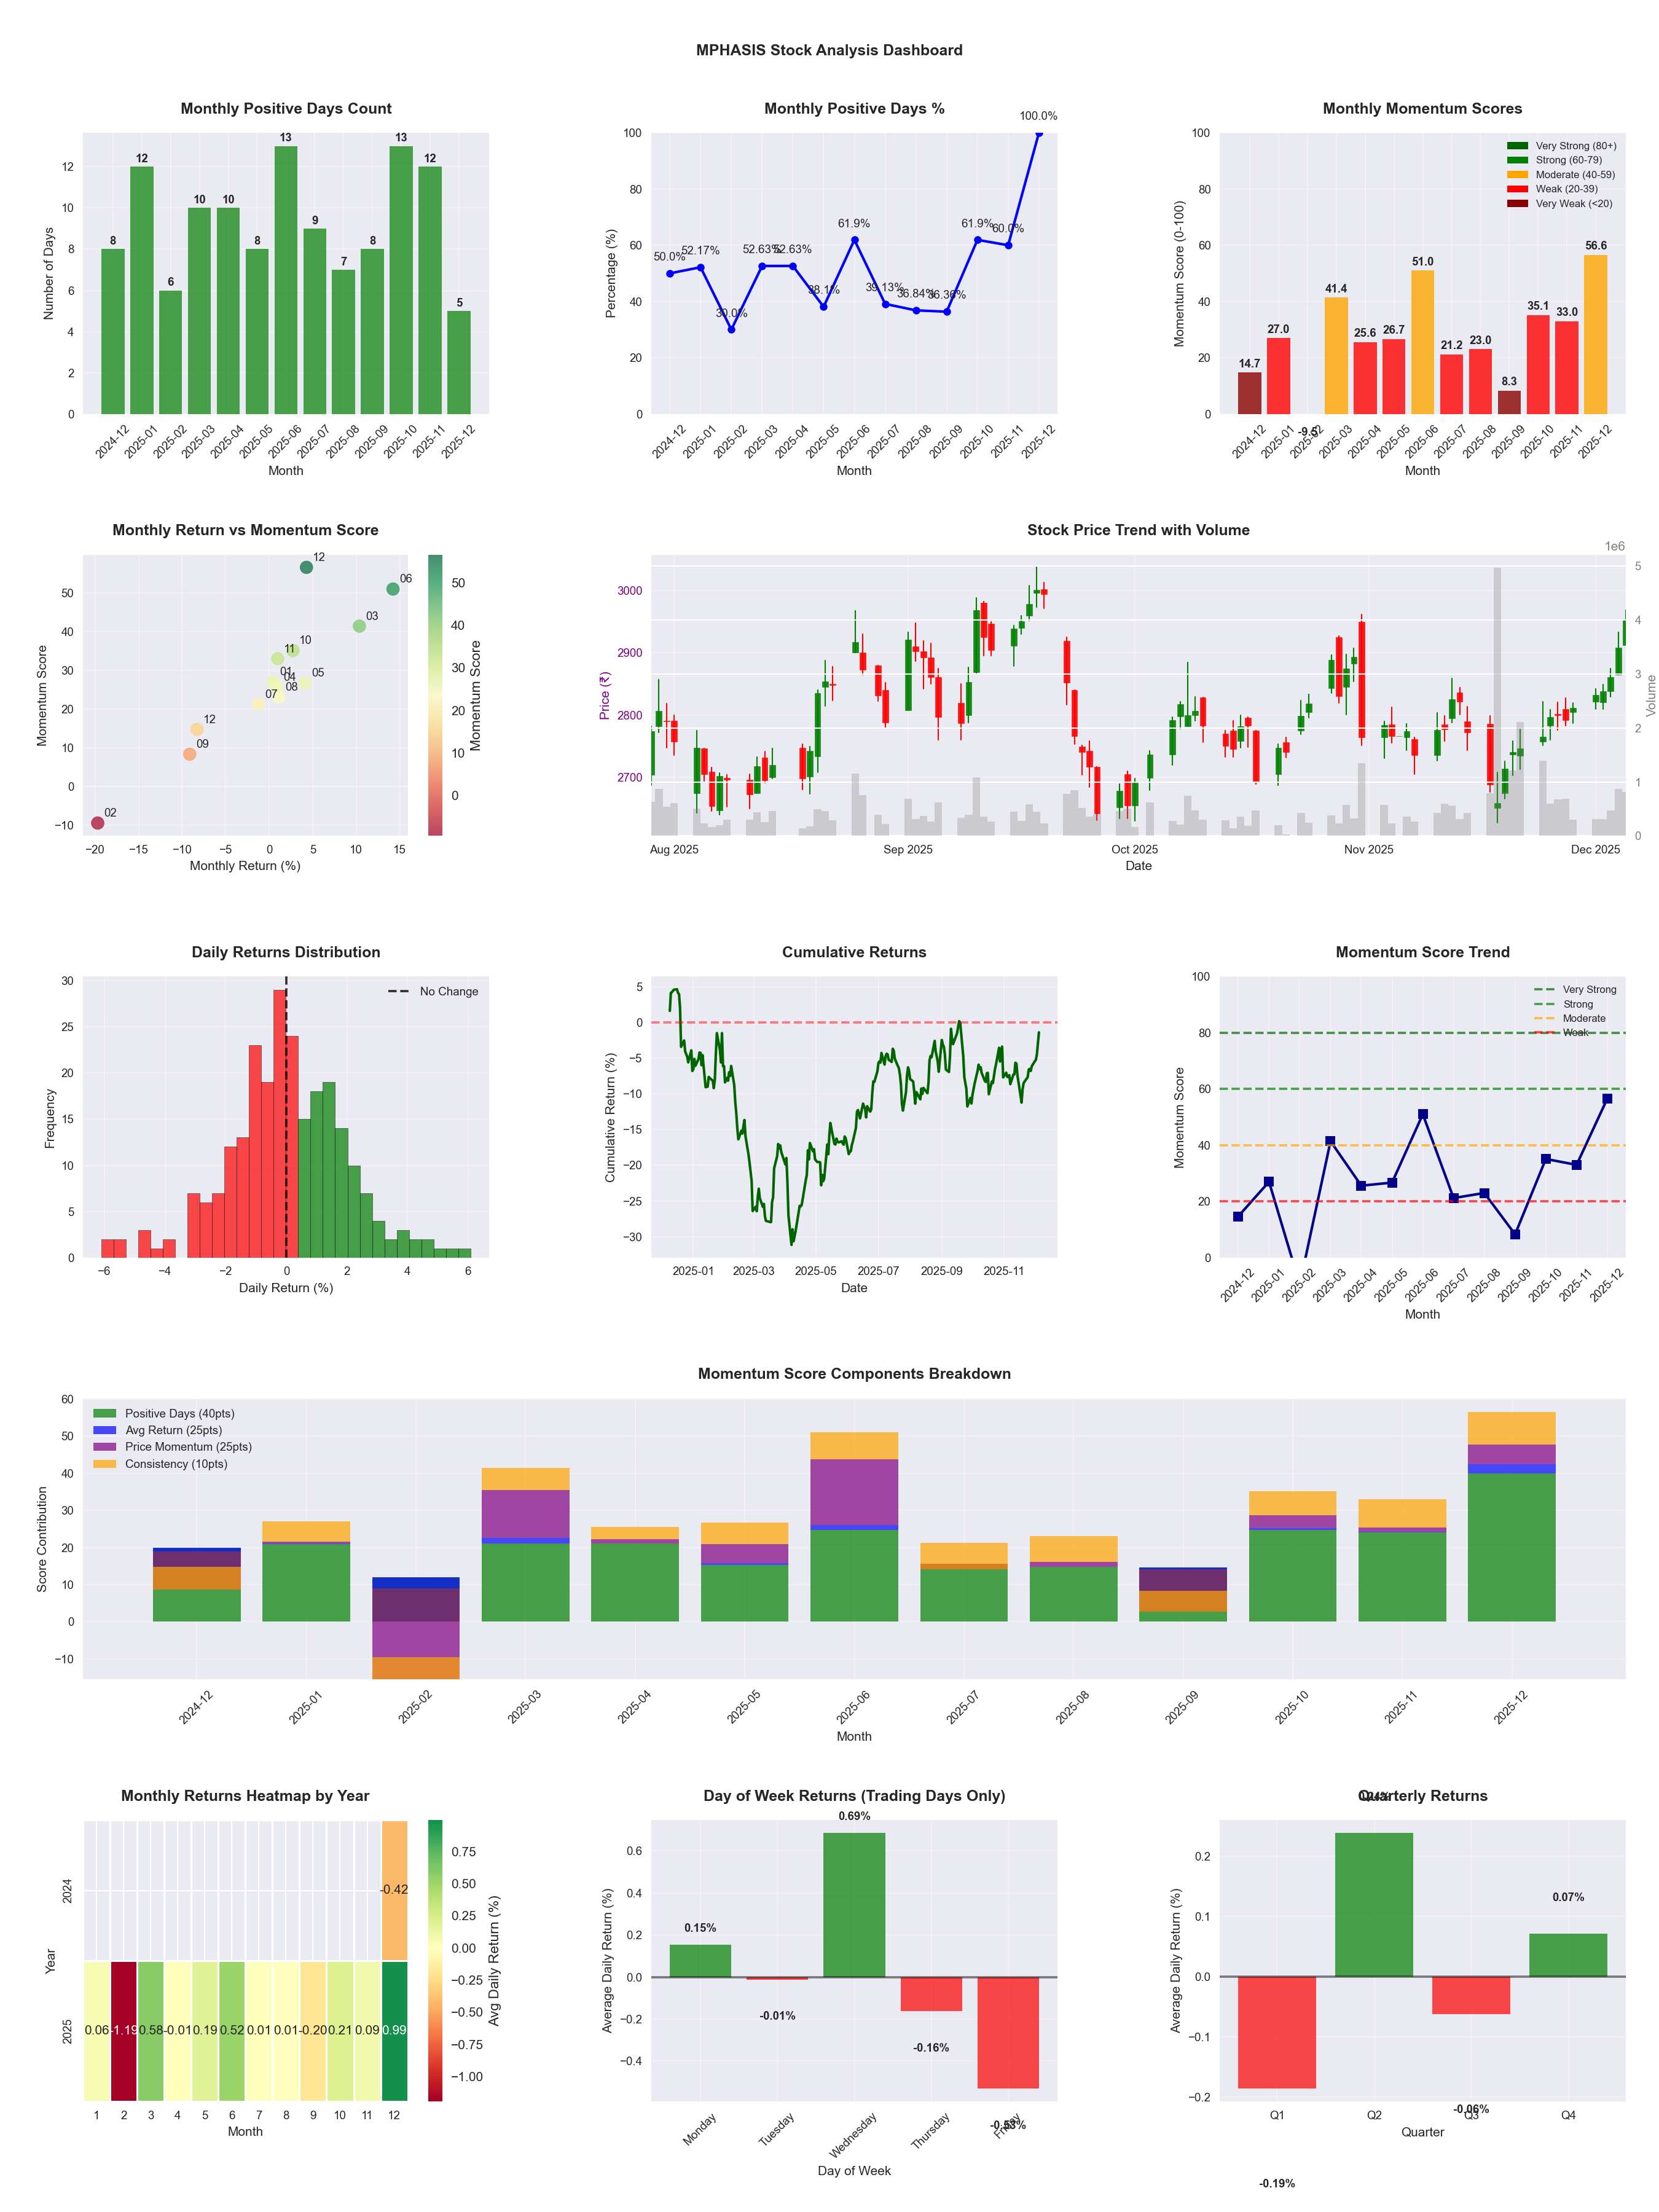
📊 Key Insights & Metrics
Symbol
📈 MPHASIS
Date
📅 2026-04-11
Volatility
🟡 1.80%
Win Rate
⚠️ 48.4%
Avg Daily Return
📈 +0.05%
Max Drawdown
📉 -31.77%
IBD RS Score
📊 29.8
Weak
Market Rank
#346
Best Month
🏆 2026-04
Best Months to Trade
📅 Apr, Jun, Oct
Best Days to Trade
📅 Wednesday, Tuesday
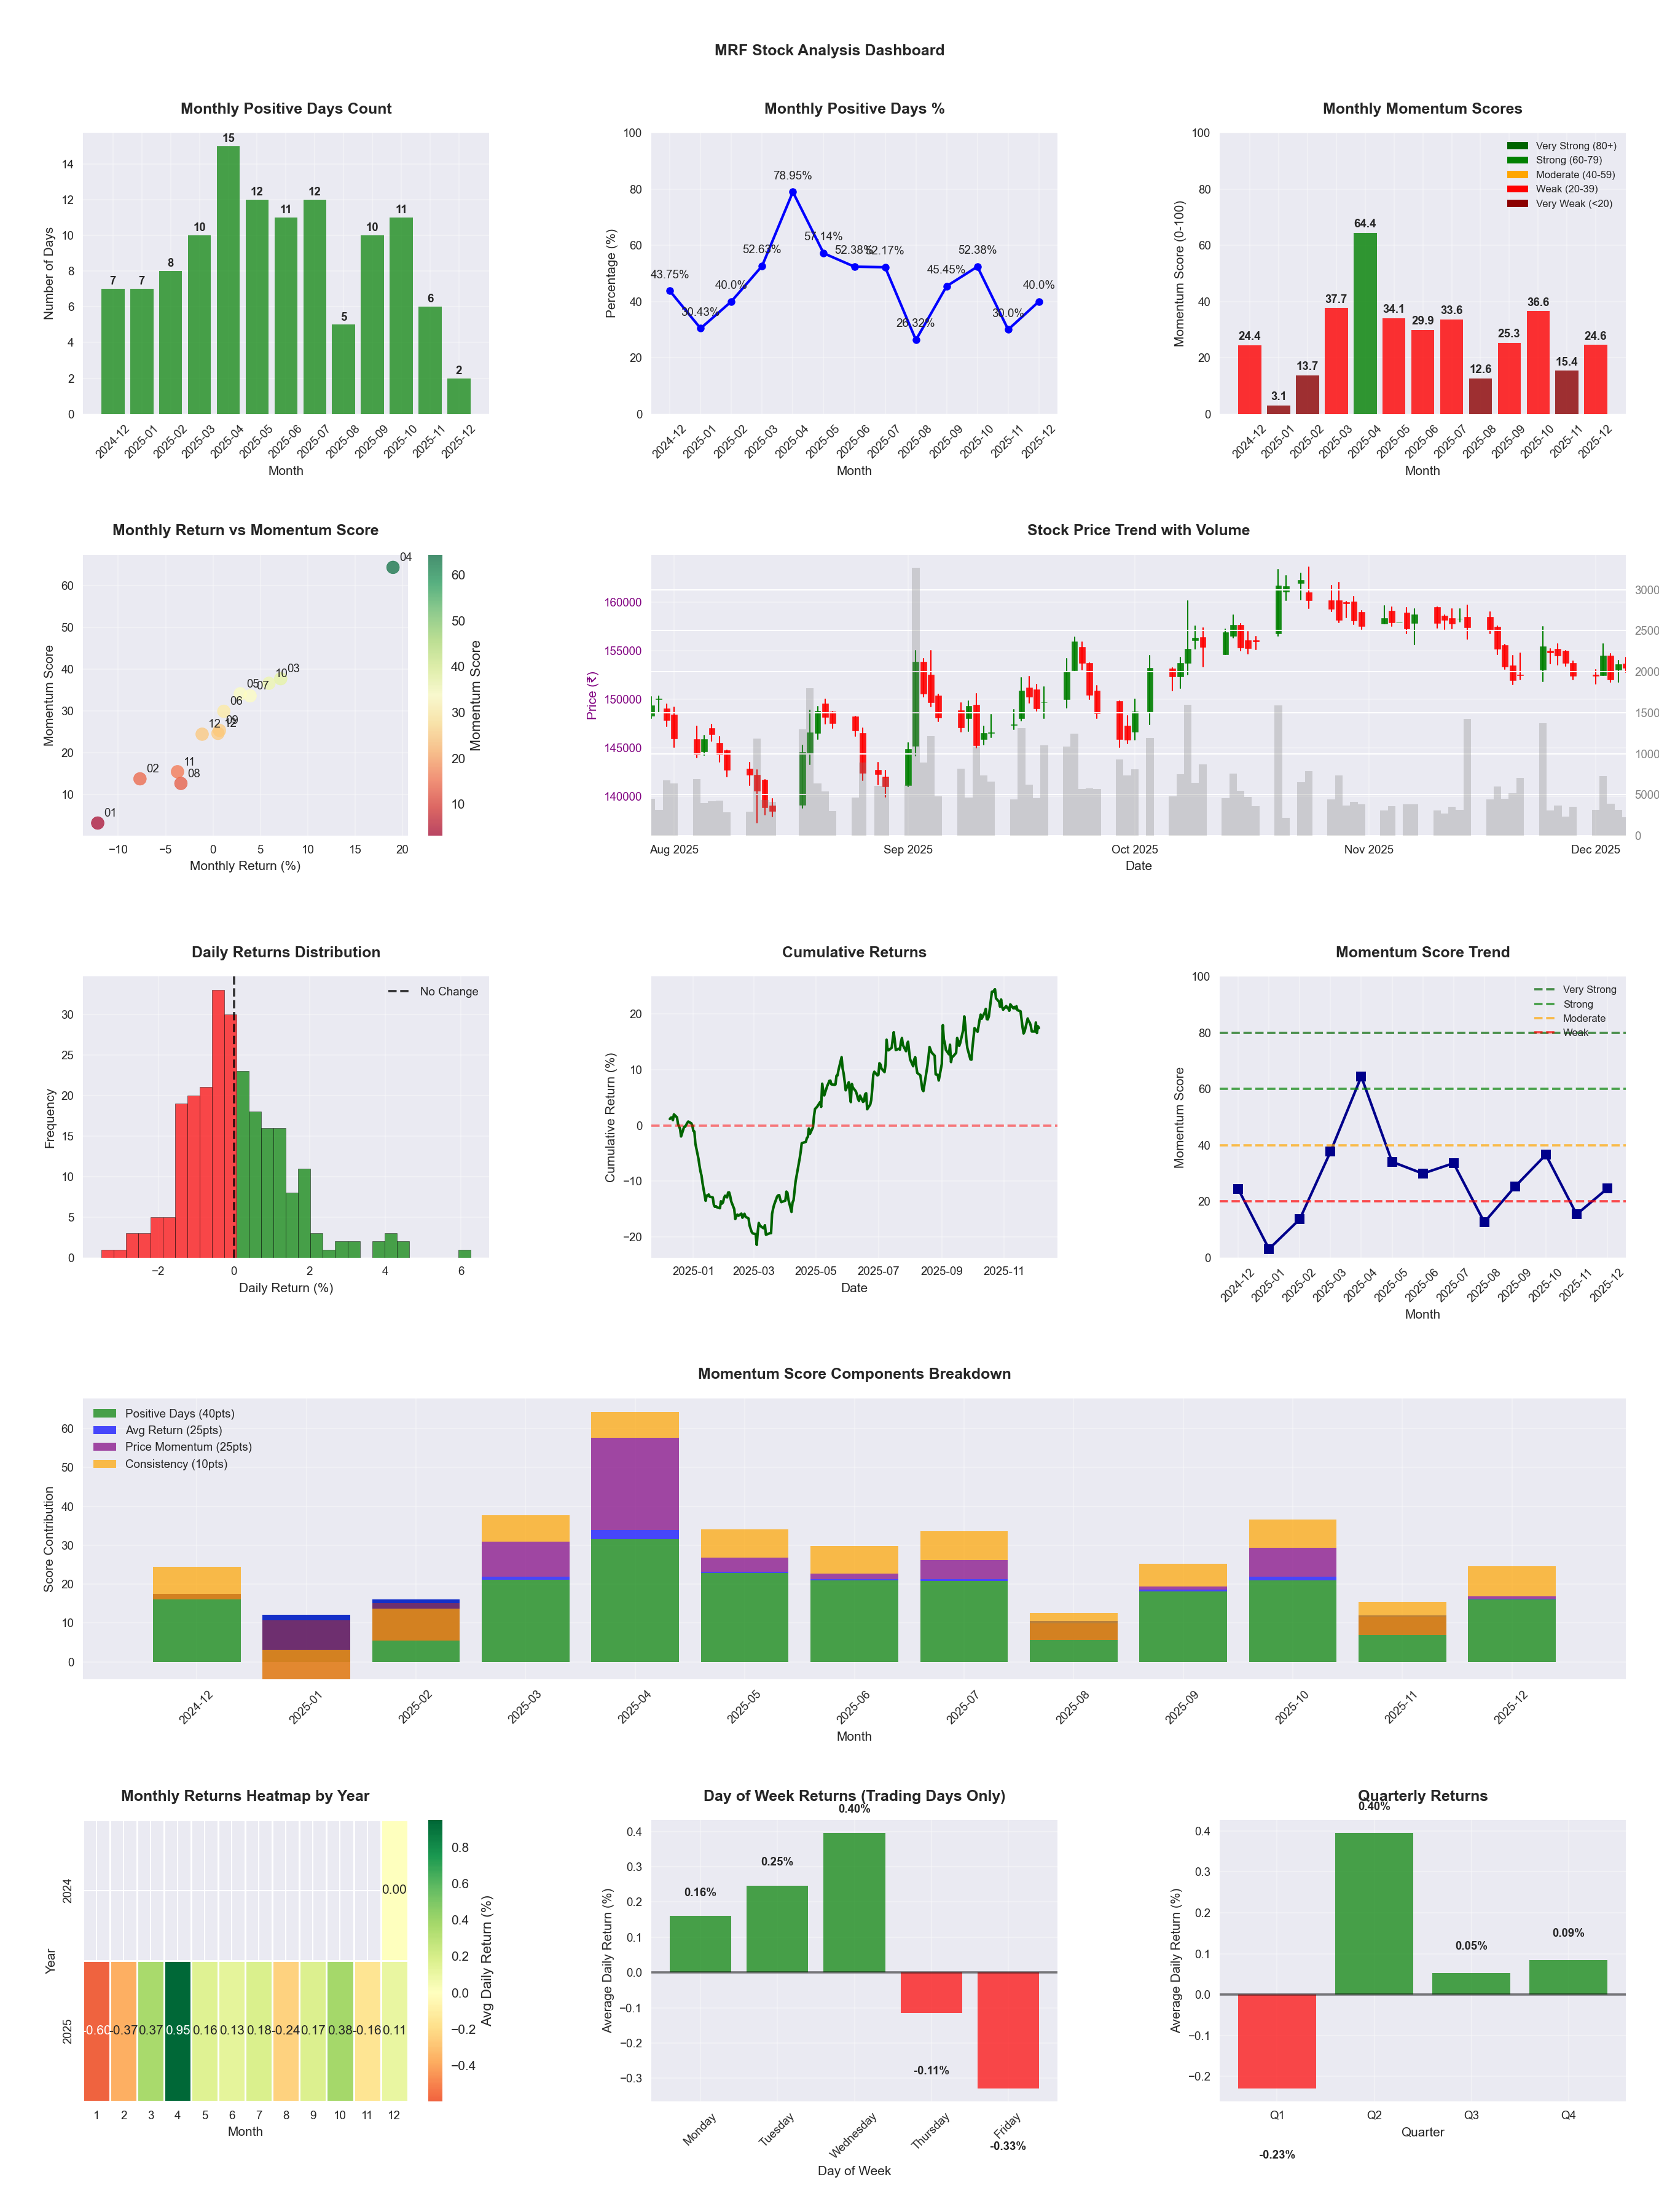
📊 Key Insights & Metrics
Symbol
📈 MRF
Date
📅 2026-04-11
Volatility
🟡 1.59%
Win Rate
⚠️ 46.5%
Avg Daily Return
📈 +0.07%
Max Drawdown
📉 -22.99%
IBD RS Score
📊 51.1
Average
Market Rank
#241
Best Month
🏆 2025-04
Best Months to Trade
📅 Apr, Oct, Feb
Best Days to Trade
📅 Tuesday, Wednesday
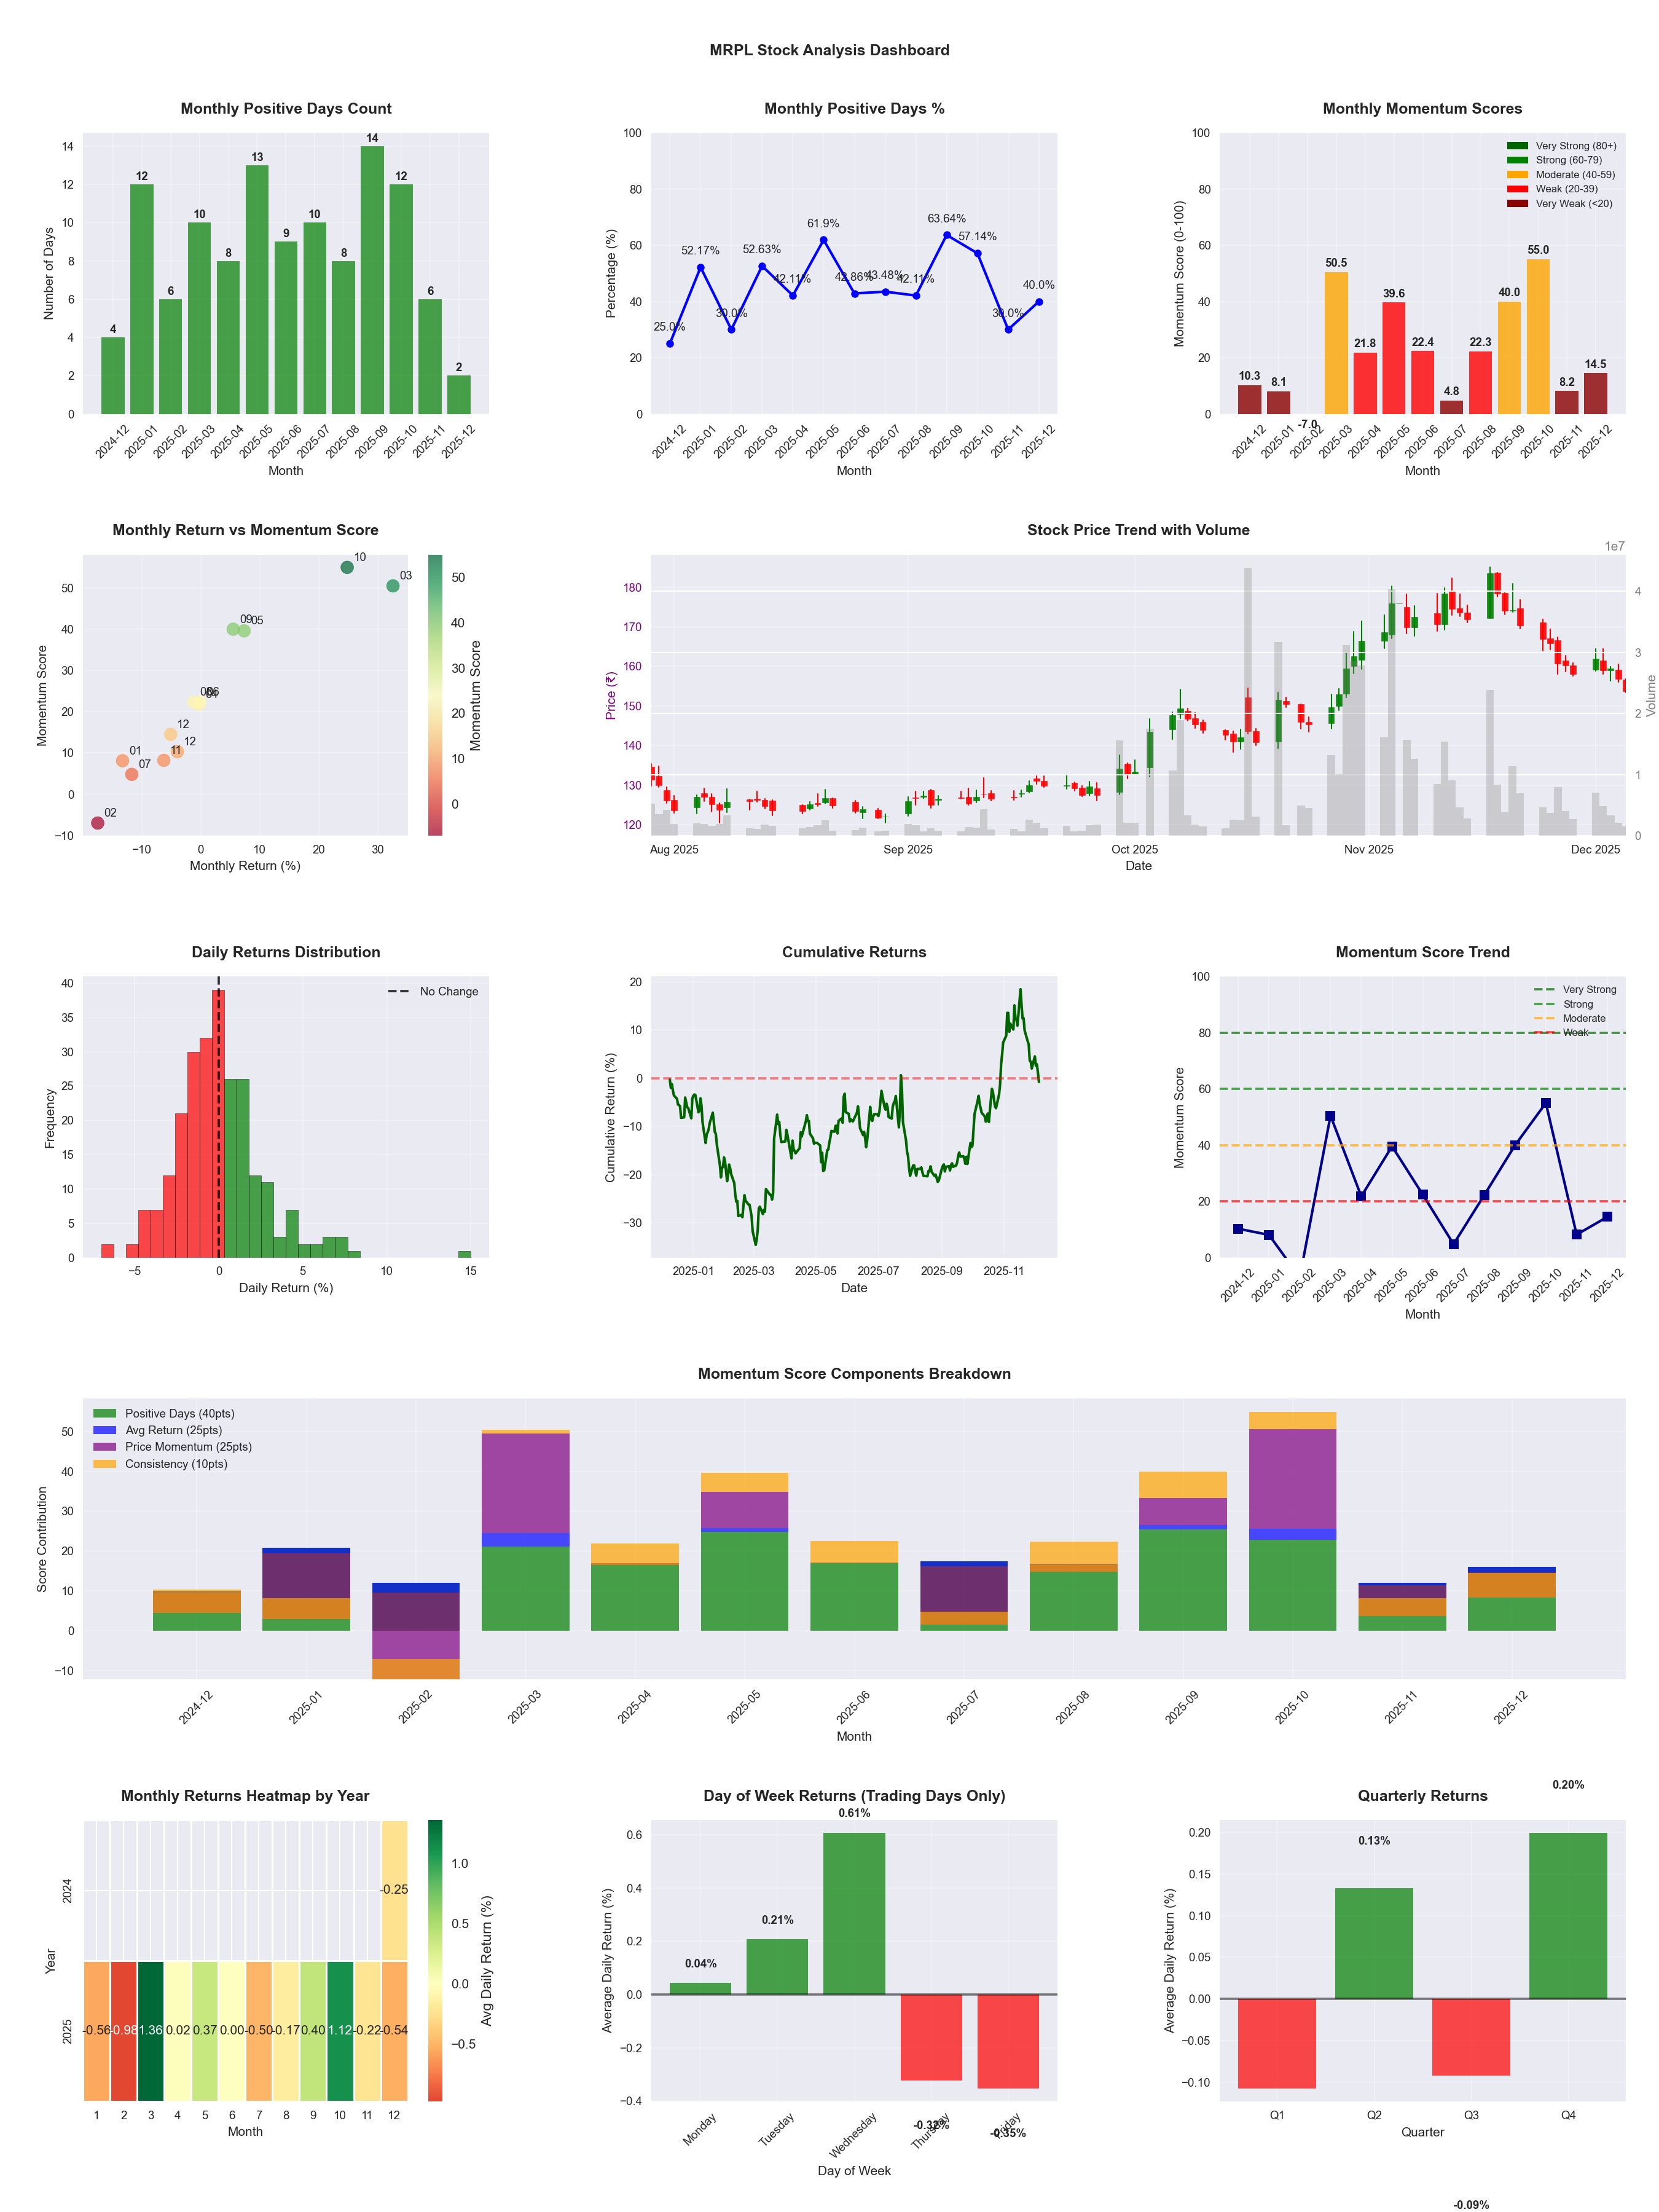
📊 Key Insights & Metrics
Symbol
📈 MRPL
Date
📅 2026-04-11
Volatility
🟡 2.88%
Risk Profile
⚠️ suitable for aggressive investors
Win Rate
⚠️ 48.0%
Avg Daily Return
📈 +0.17%
Max Drawdown
📉 -24.15%
IBD RS Score
📊 93.1
Leader
Market Rank
#34
Best Month
🏆 2025-10
Worst Month
📉 2025-07
Best Months to Trade
📅 Oct, Jan, Feb
Best Days to Trade
📅 Wednesday, Monday
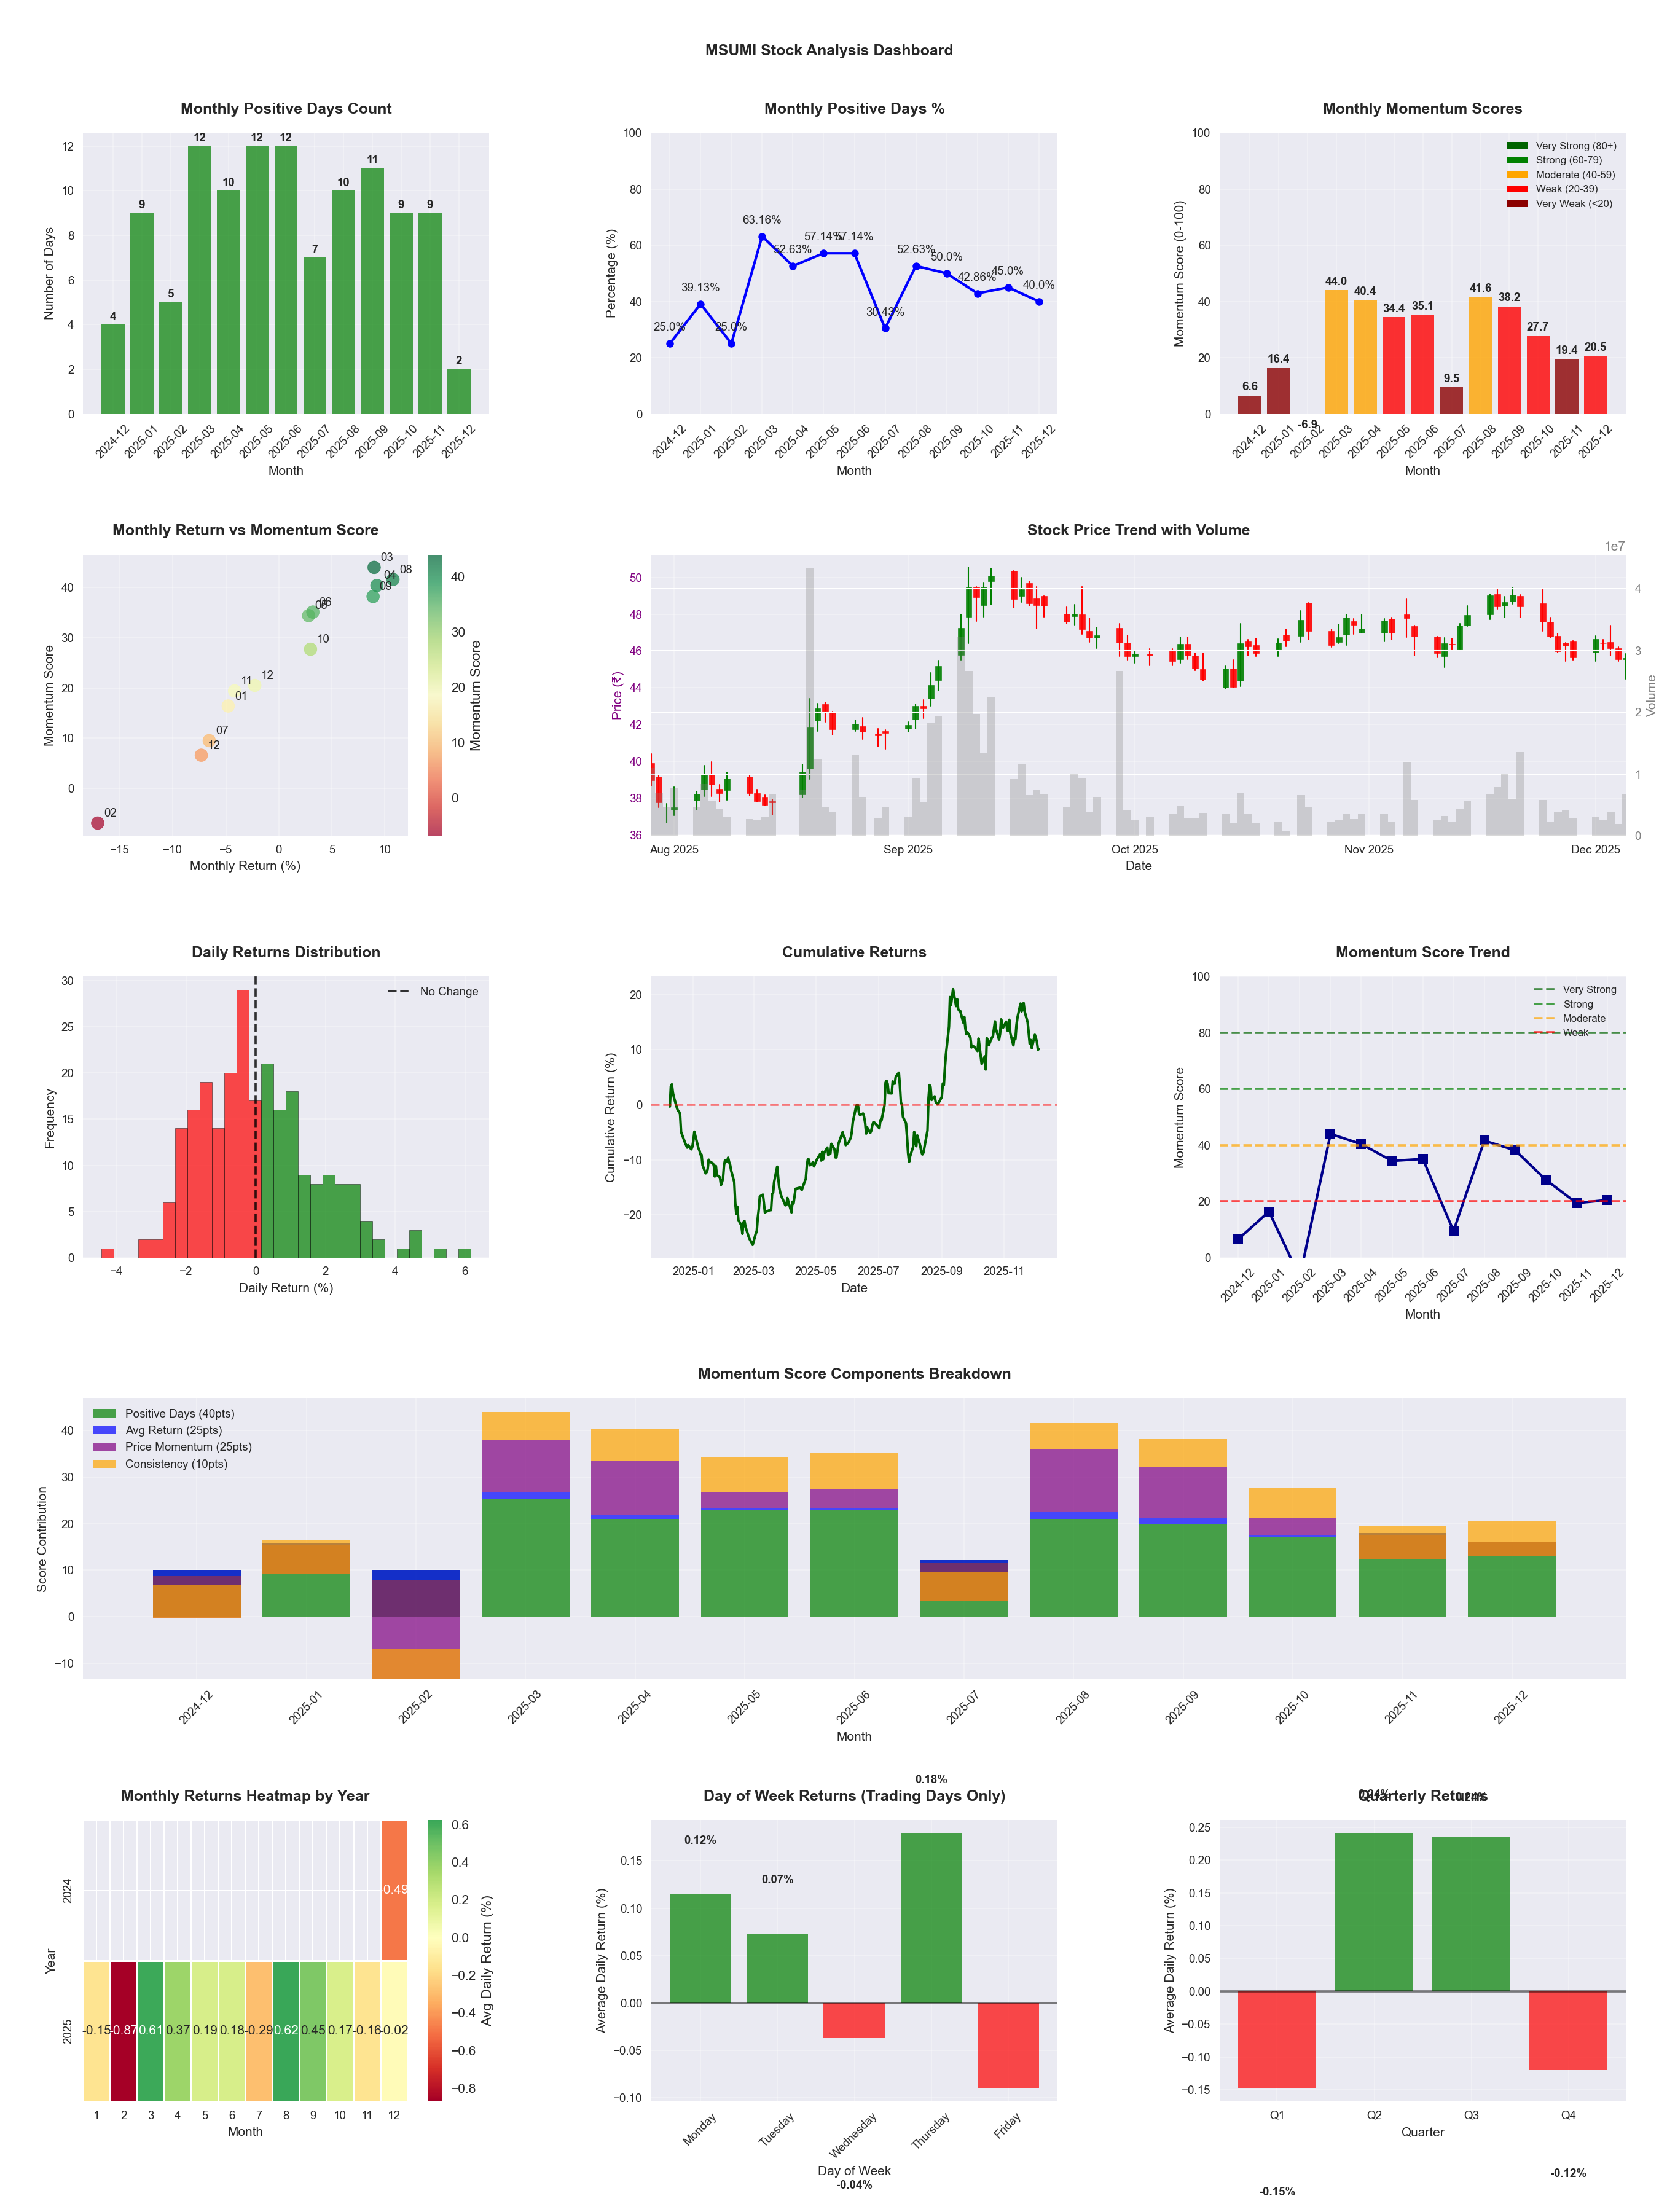
📊 Key Insights & Metrics
Symbol
📈 MSUMI
Date
📅 2026-04-11
Volatility
🟡 1.84%
Win Rate
⚠️ 45.1%
Avg Daily Return
📈 +0.06%
Max Drawdown
📉 -31.05%
IBD RS Score
📊 41.8
Weak
Market Rank
#287
Best Month
🏆 2025-08
Worst Month
📉 2026-03
Best Months to Trade
📅 Apr, Aug, Sep
Best Days to Trade
📅 Tuesday, Monday
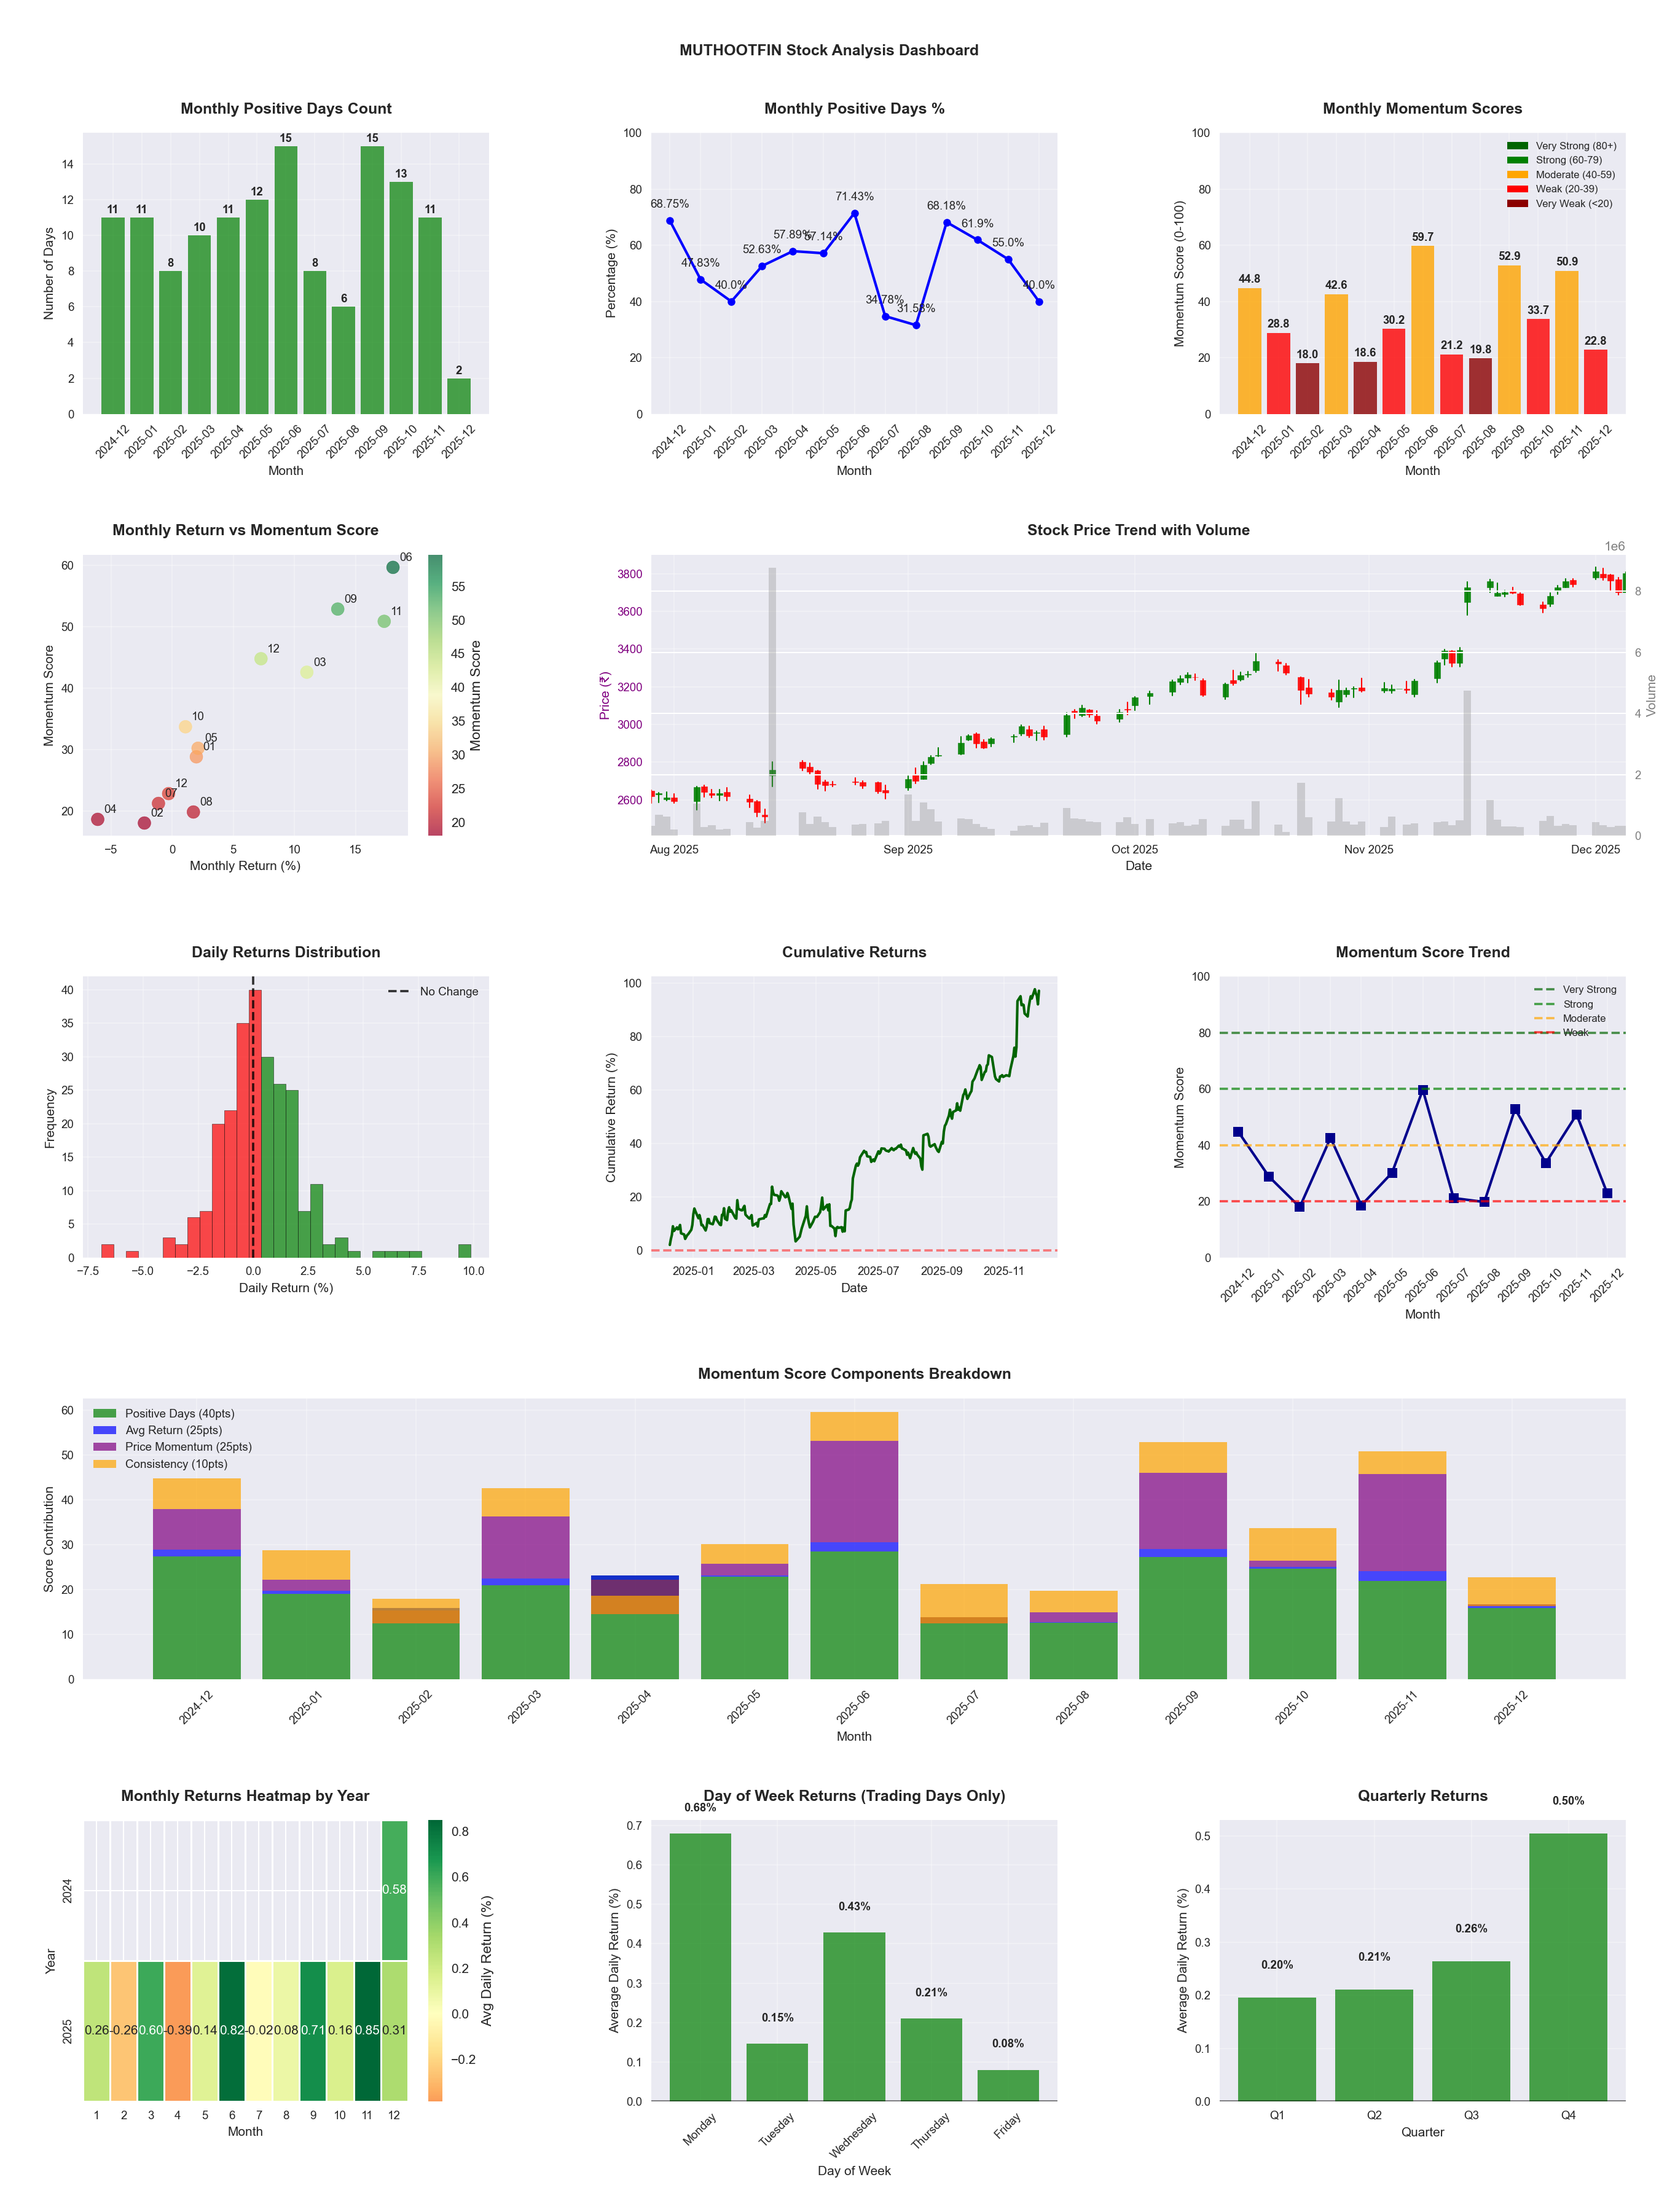
📊 Key Insights & Metrics
Symbol
📈 MUTHOOTFIN
Date
📅 2026-04-11
Volatility
🟡 2.31%
Risk Profile
⚠️ suitable for aggressive investors
Win Rate
⚠️ 54.9%
Avg Daily Return
📈 +0.26%
Max Drawdown
📉 -23.86%
IBD RS Score
📊 89.2
Strong
Market Rank
#53
Best Month
🏆 2025-06
Worst Month
📉 2026-03
Best Months to Trade
📅 Apr, Nov, Jun
Best Days to Trade
📅 Monday, Wednesday
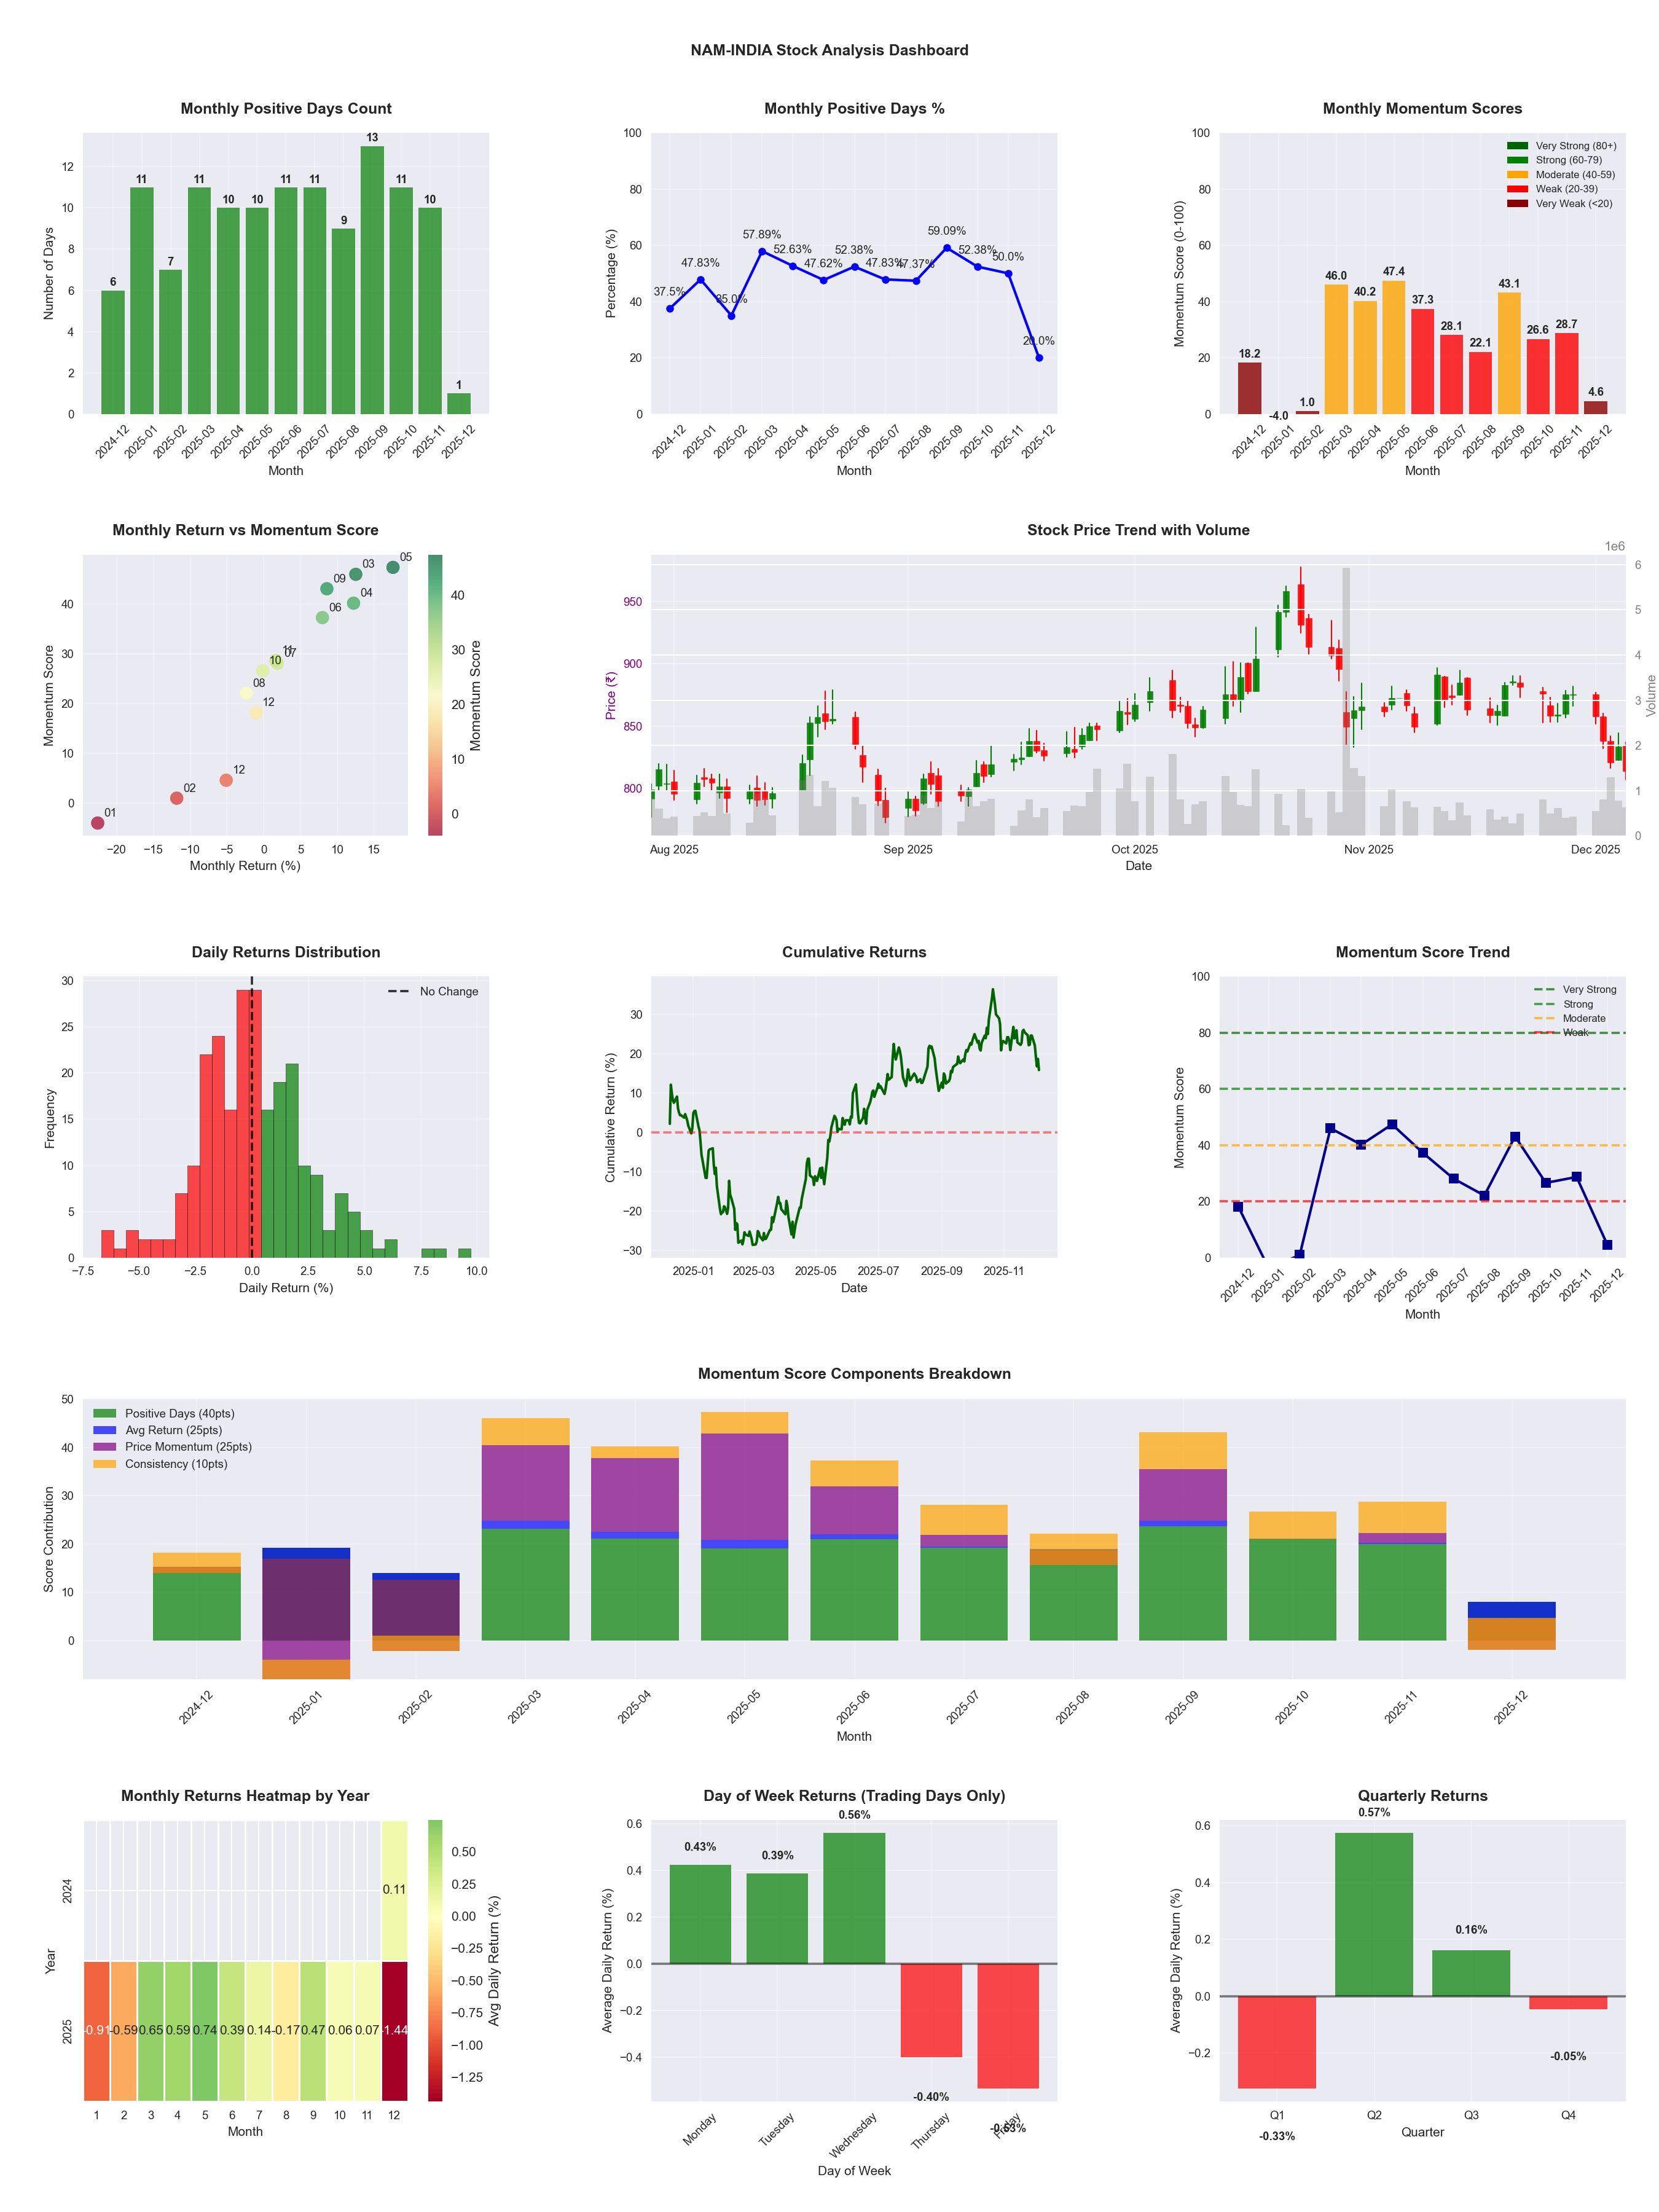
📊 Key Insights & Metrics
Symbol
📈 NAM
Date
📅 2026-04-11
Volatility
🟡 2.45%
Risk Profile
⚠️ suitable for aggressive investors
Win Rate
⚠️ 48.8%
Avg Daily Return
📈 +0.26%
Max Drawdown
📉 -18.62%
Best Month
🏆 2026-04
Worst Month
📉 2026-03
Best Months to Trade
📅 Apr, May, Sep
Best Days to Trade
📅 Wednesday, Monday
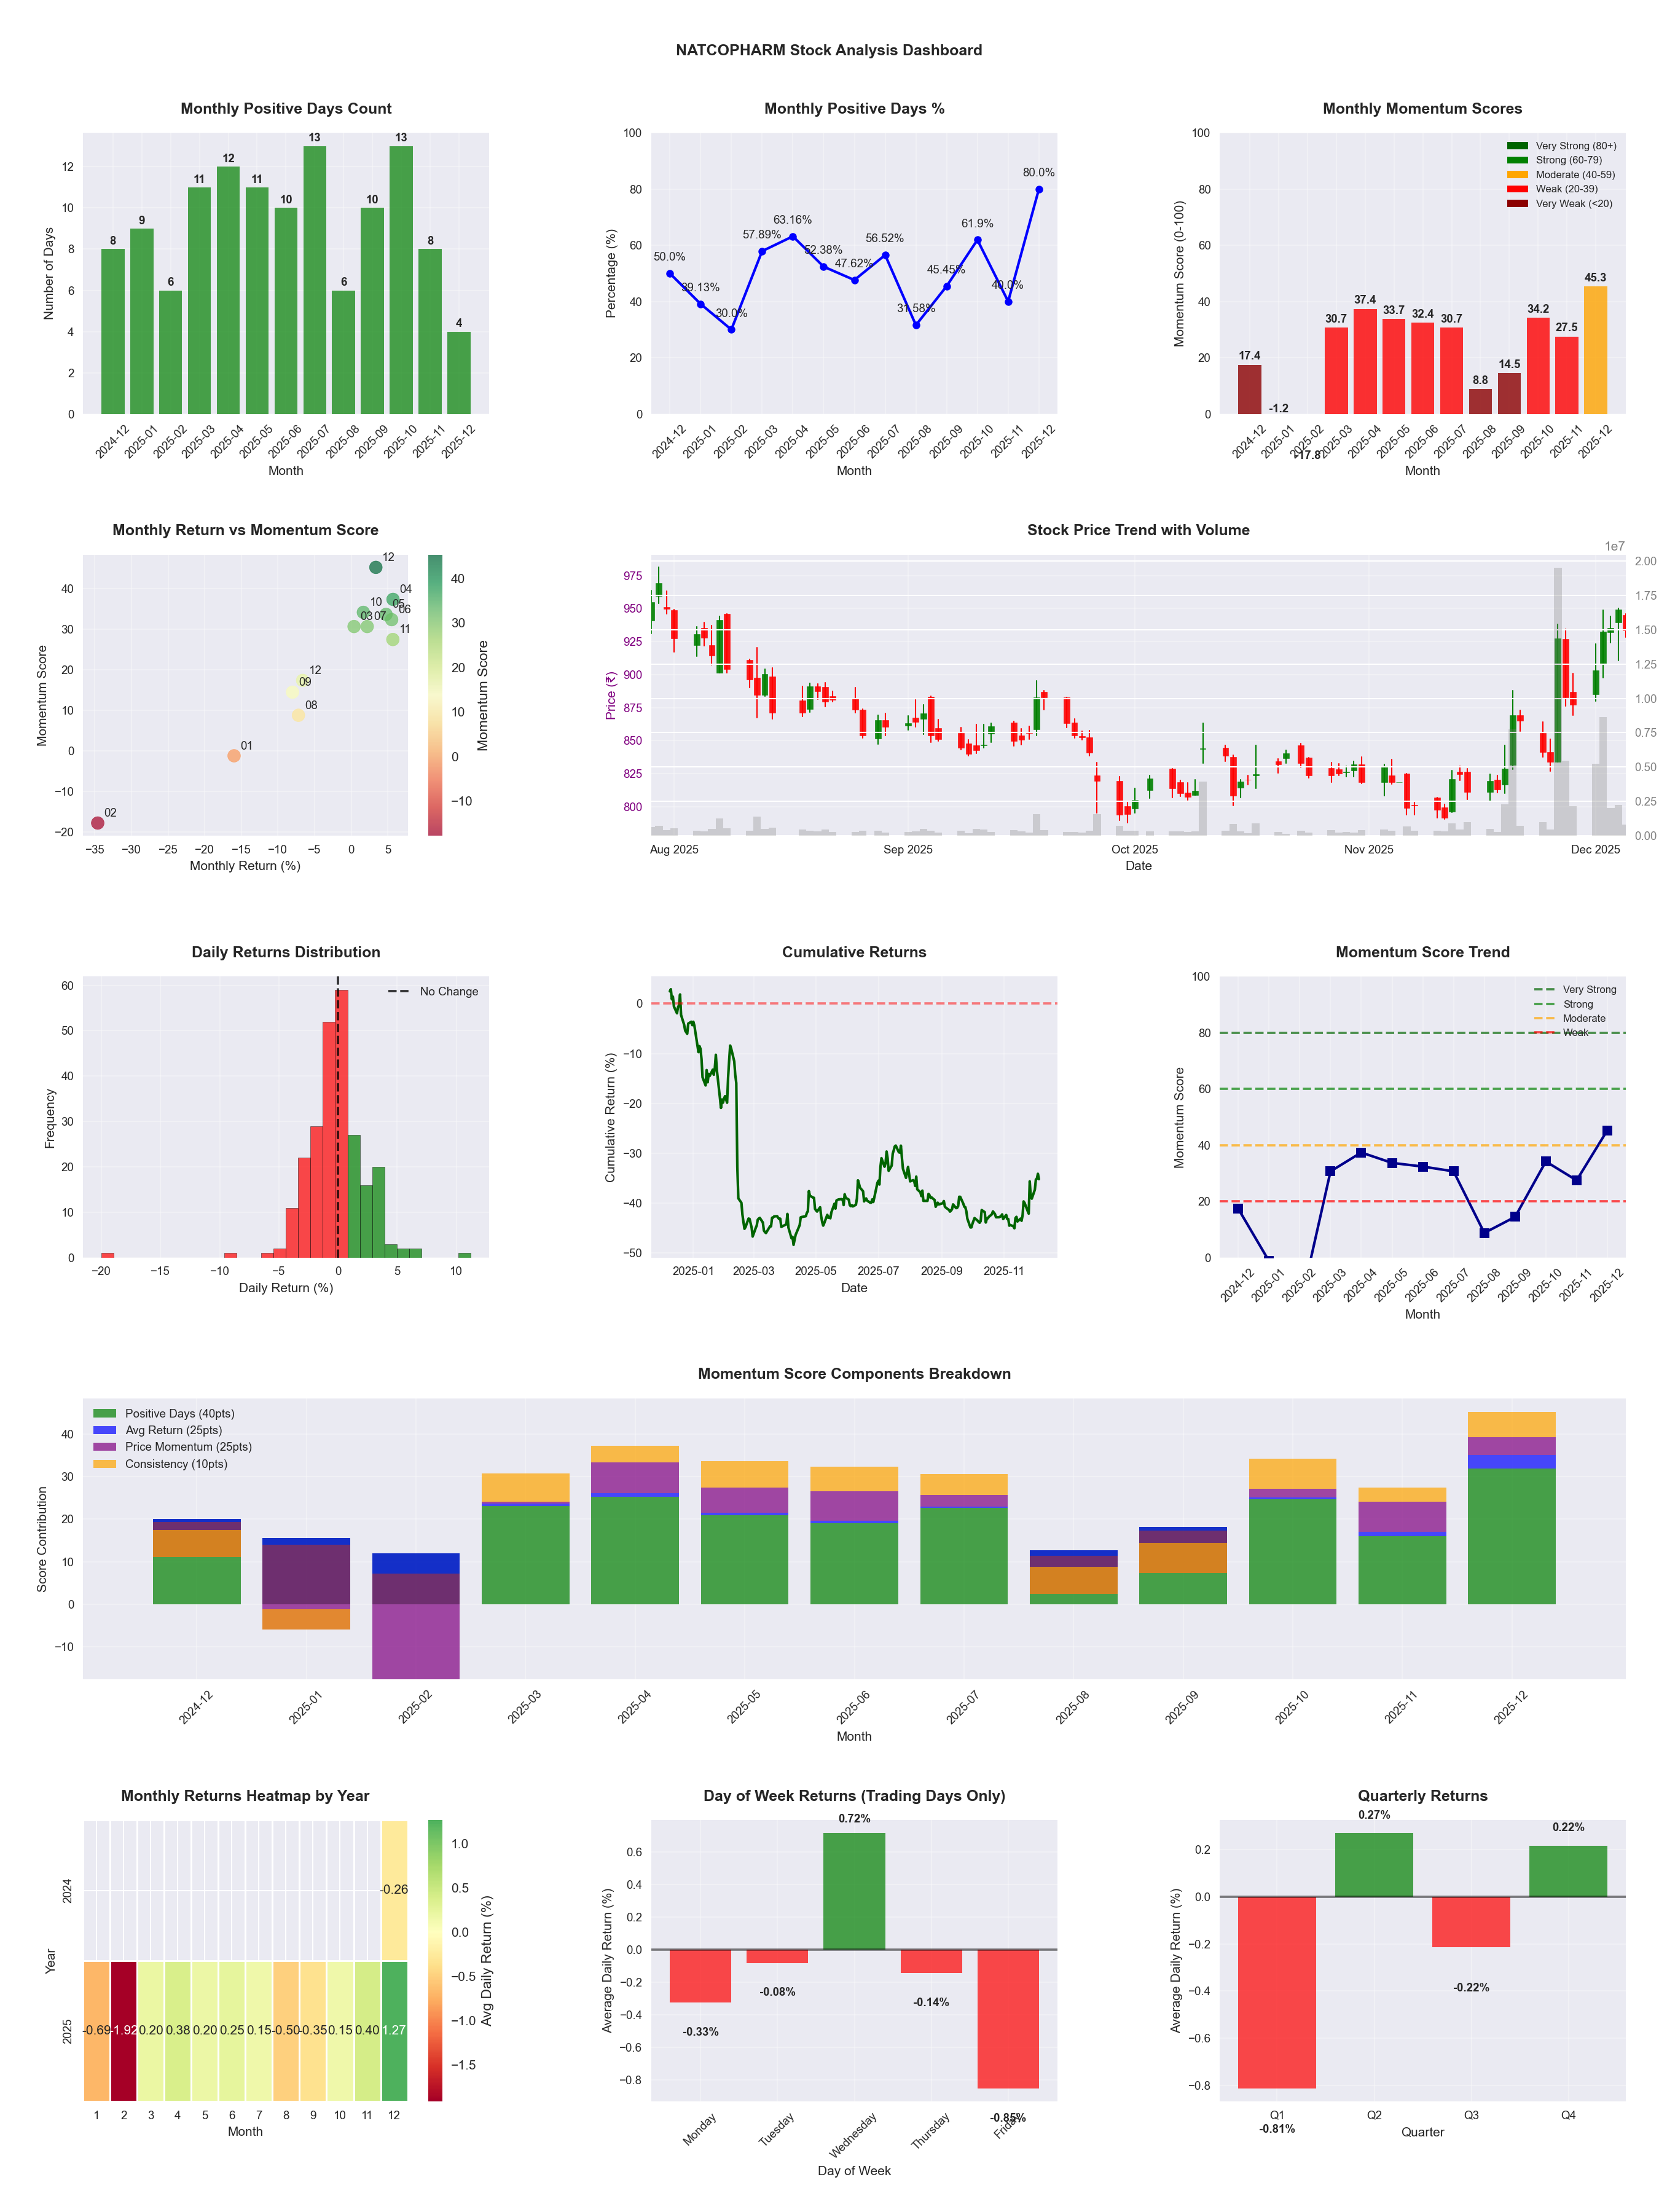
📊 Key Insights & Metrics
Symbol
📈 NATCOPHARM
Date
📅 2026-04-11
Volatility
🟡 2.26%
Risk Profile
⚠️ suitable for aggressive investors
Win Rate
⚠️ 51.2%
Avg Daily Return
📈 +0.17%
Max Drawdown
📉 -23.22%
IBD RS Score
📊 92.1
Leader
Market Rank
#39
Best Month
🏆 2026-04
Worst Month
📉 2025-08
Best Months to Trade
📅 Apr, Feb, Nov
Best Days to Trade
📅 Wednesday, Tuesday
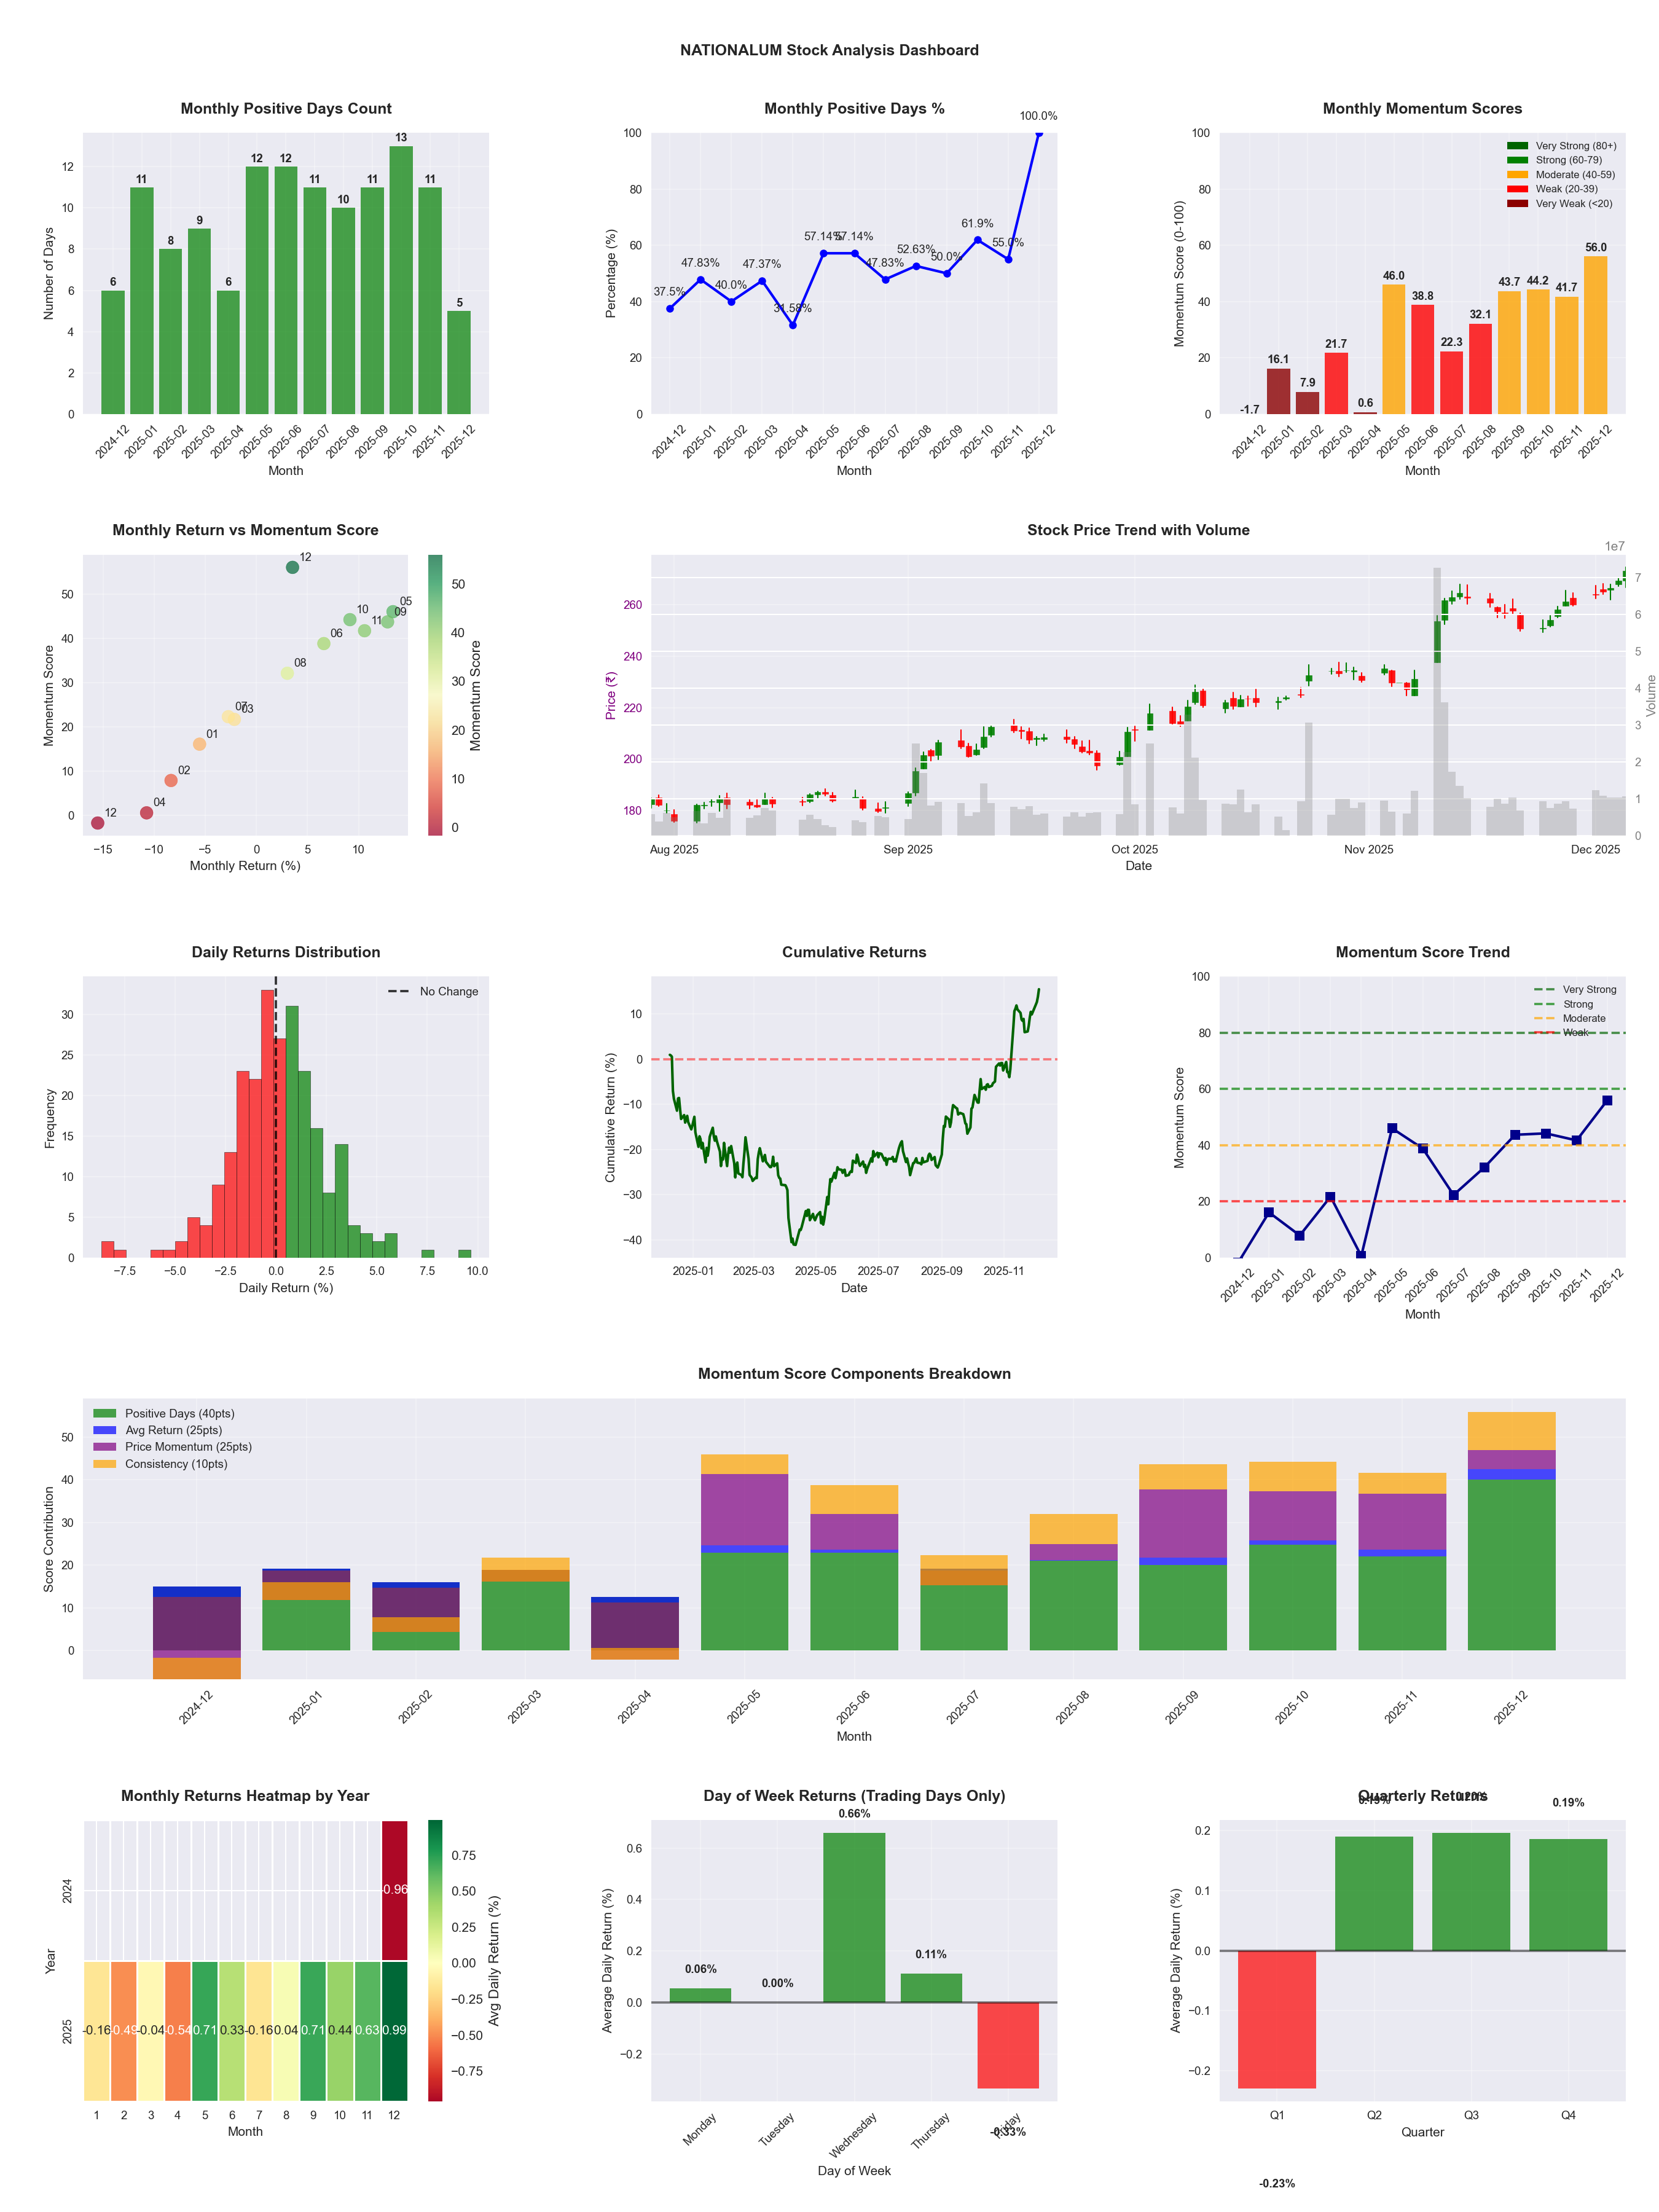
📊 Key Insights & Metrics
Symbol
📈 NATIONALUM
Date
📅 2026-04-11
Volatility
🟡 2.40%
Risk Profile
⚠️ suitable for aggressive investors
Win Rate
⚠️ 57.7%
Avg Daily Return
📈 +0.48%
Max Drawdown
📉 -19.97%
IBD RS Score
📊 99.8
Leader
Market Rank
#1
Best Month
🏆 2026-01
Worst Month
📉 2026-02
Best Months to Trade
📅 Jan, Apr, Dec
Best Days to Trade
📅 Wednesday, Monday
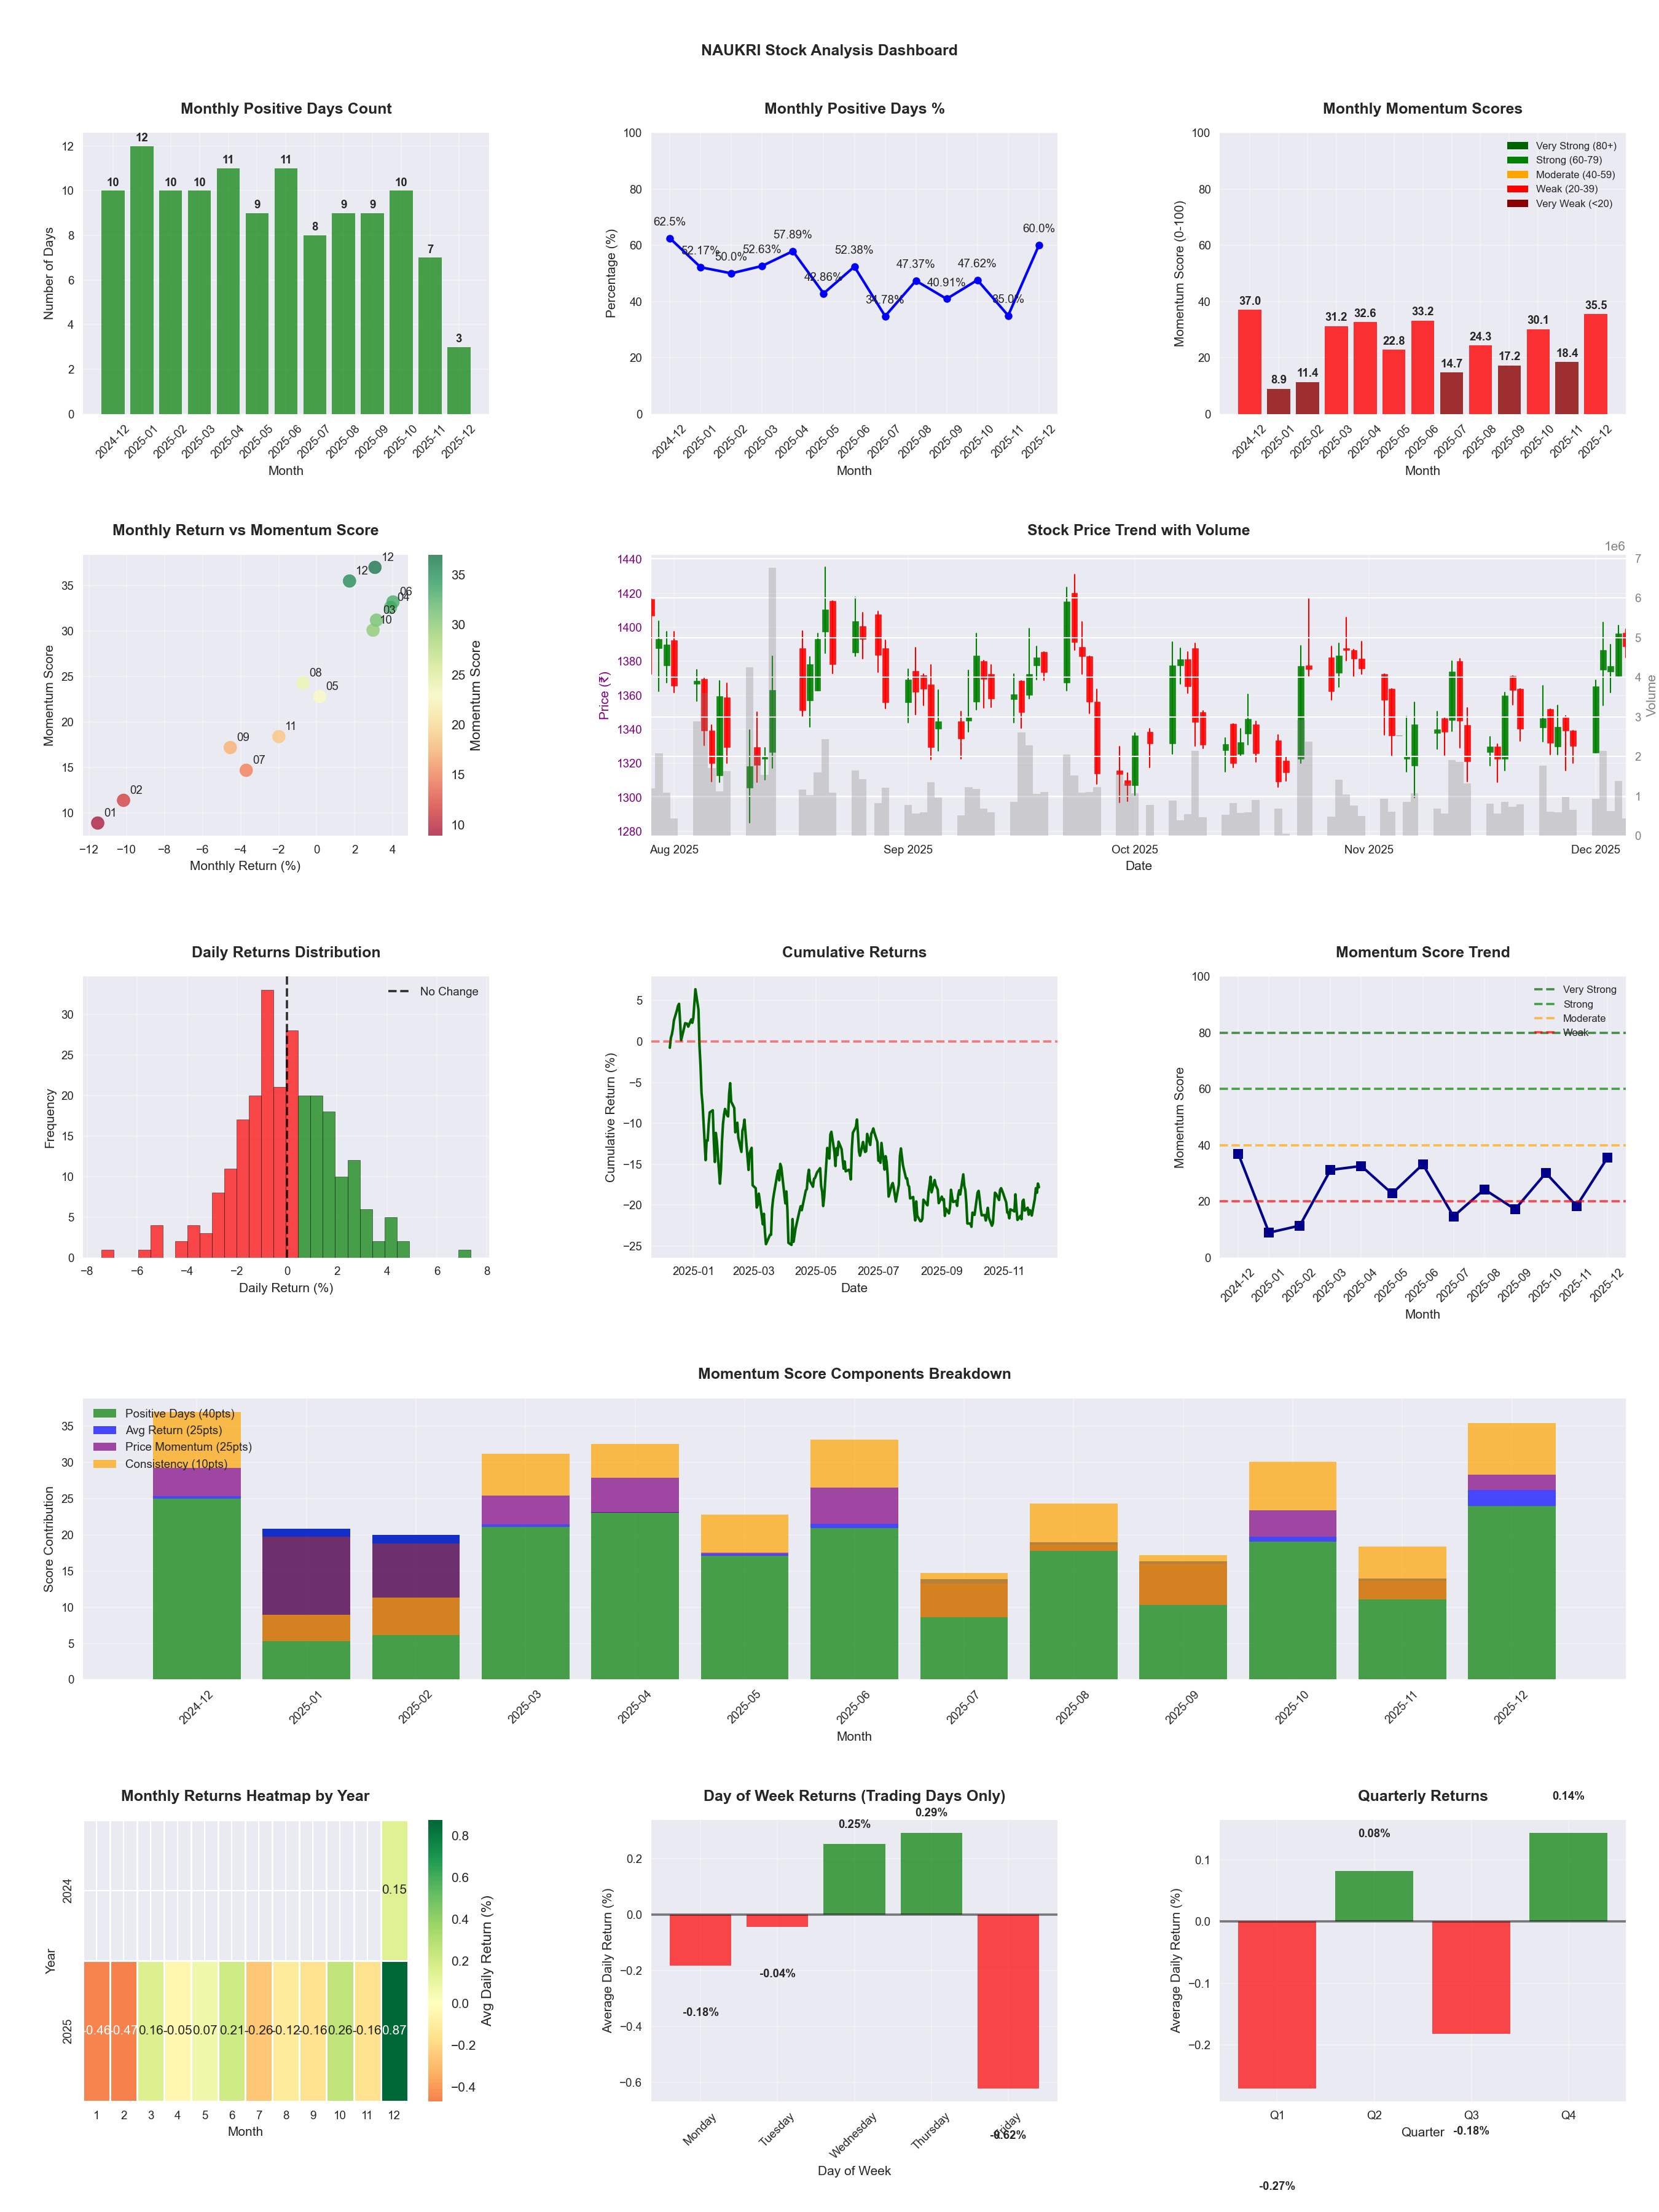
📊 Key Insights & Metrics
Symbol
📈 NAUKRI
Date
📅 2026-04-11
Volatility
🟡 1.75%
Win Rate
⚠️ 43.1%
Avg Daily Return
📉 -0.10%
Max Drawdown
📉 -37.73%
IBD RS Score
📊 5.9
Weak
Market Rank
#464
Best Month
🏆 2025-04
Best Months to Trade
📅 Apr, Oct, Jun
Best Days to Trade
📅 Wednesday, Monday
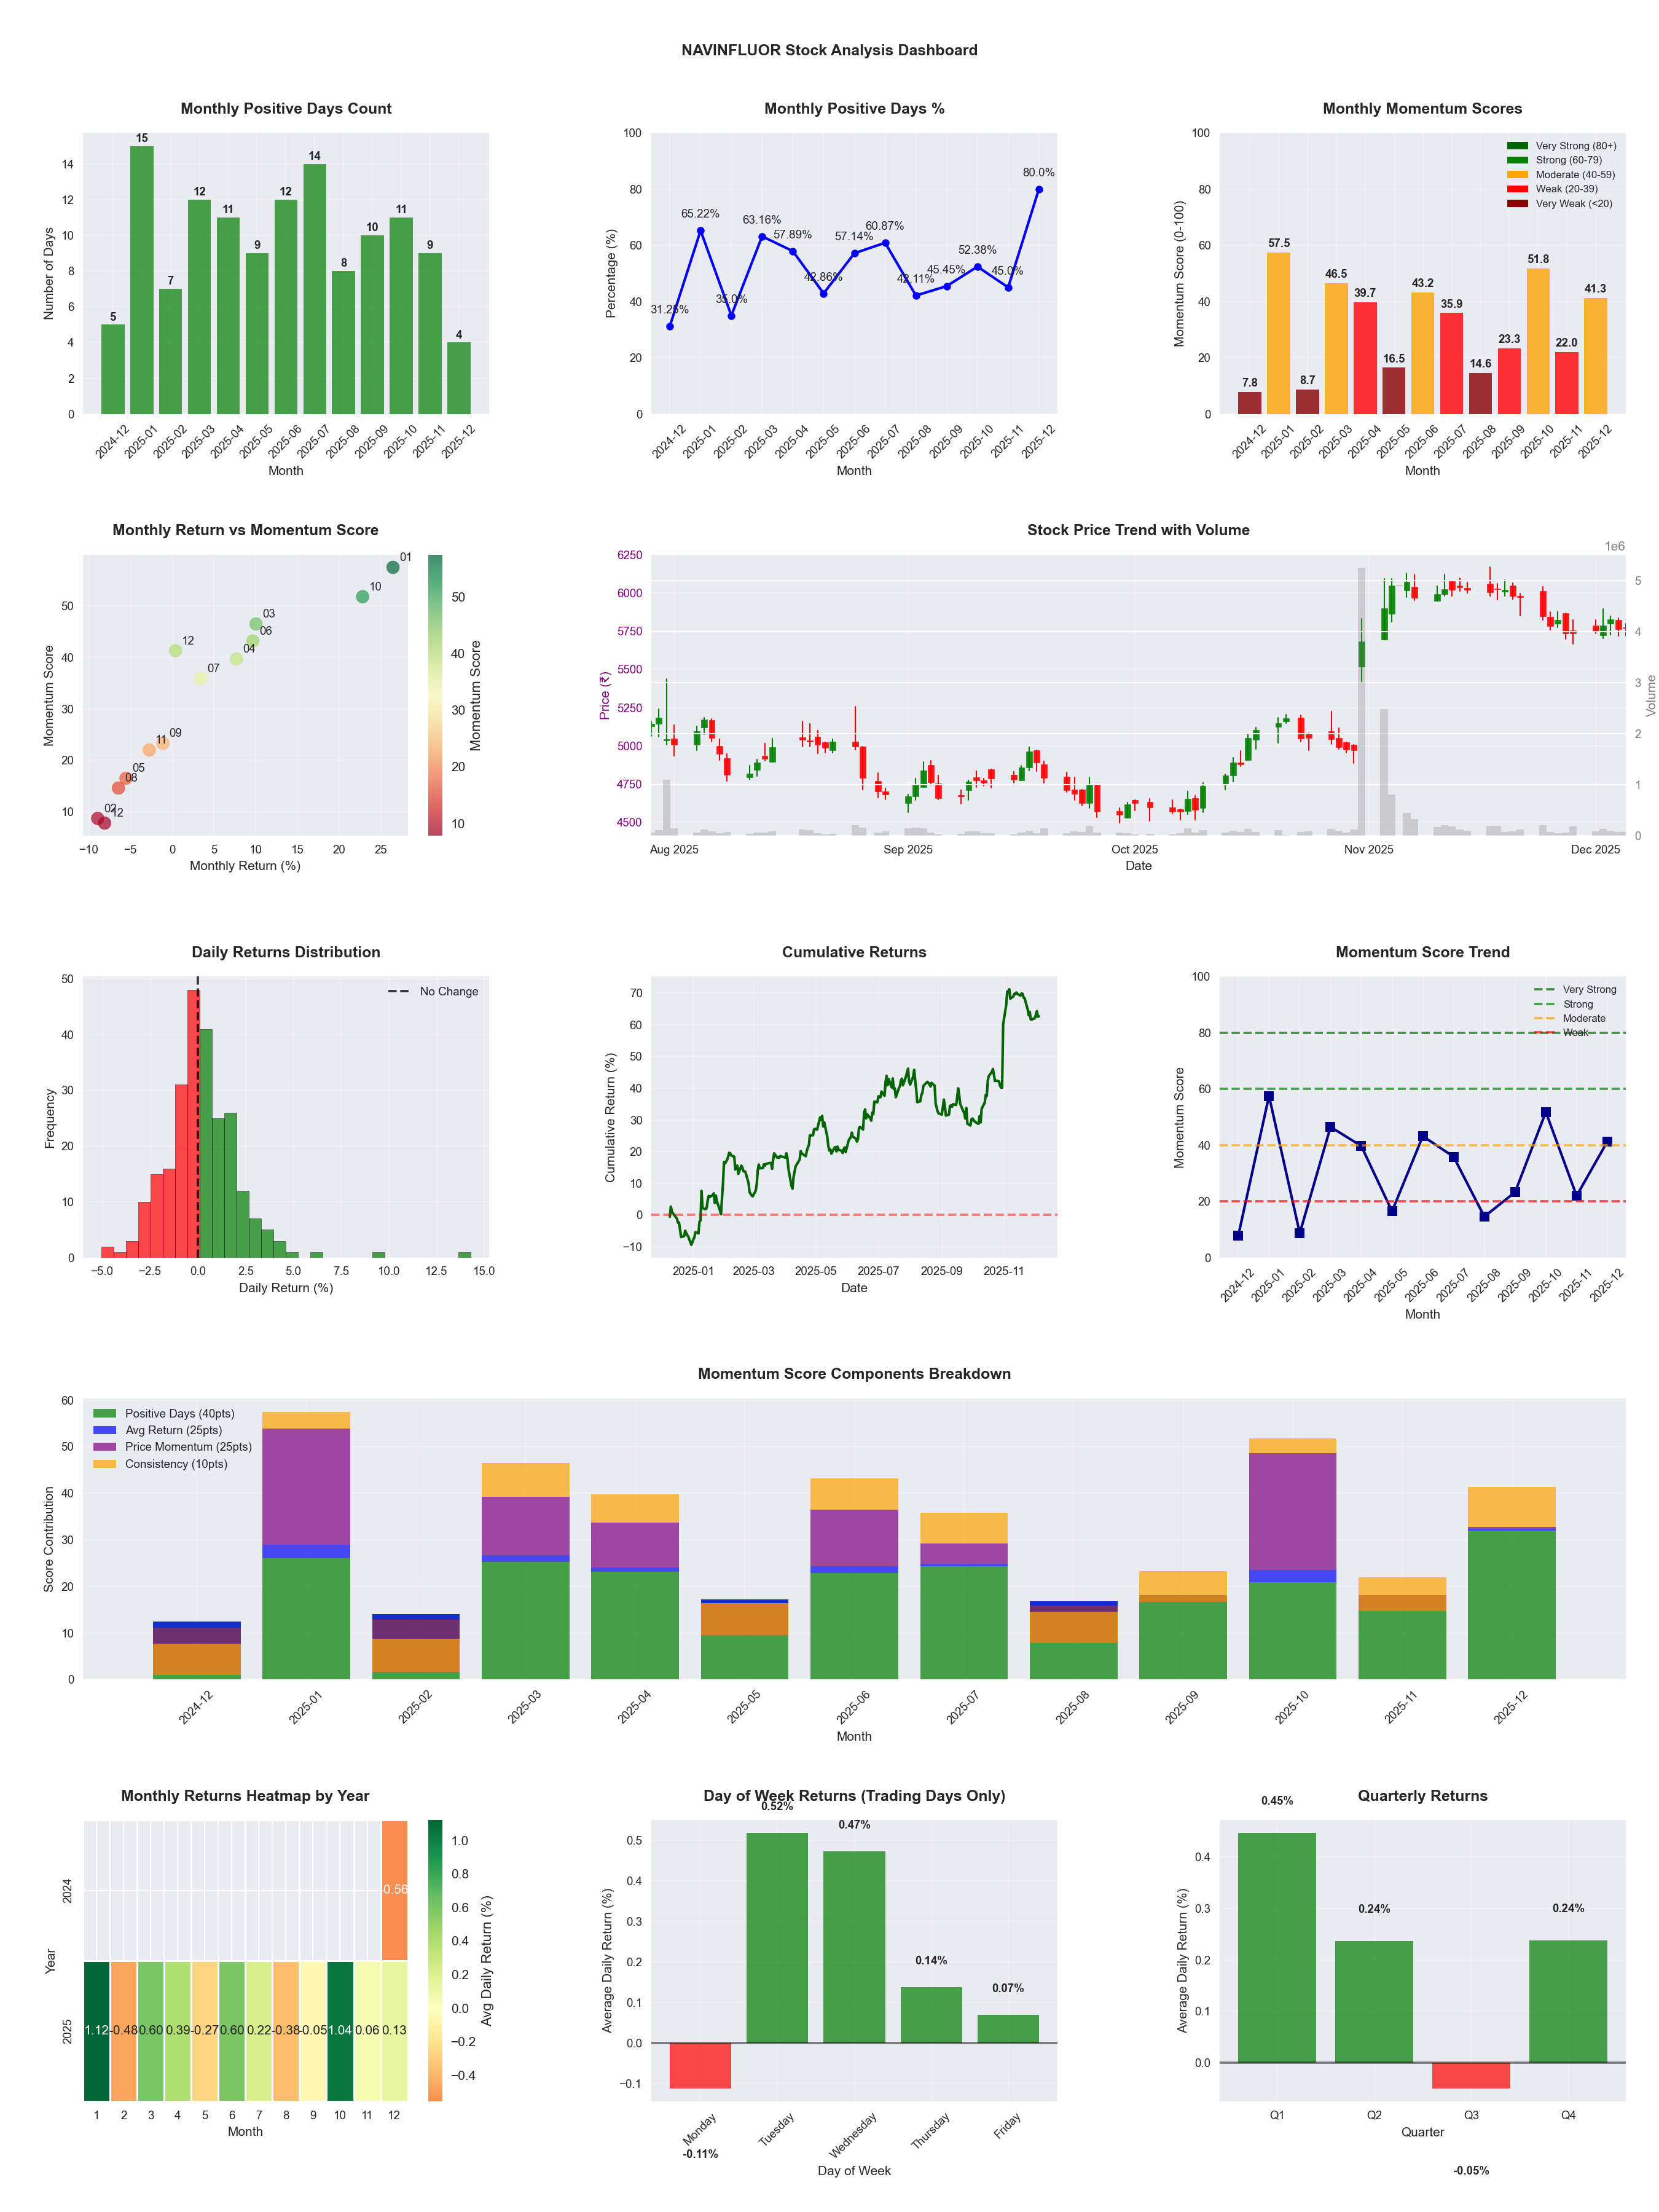
📊 Key Insights & Metrics
Symbol
📈 NAVINFLUOR
Date
📅 2026-04-11
Volatility
🟡 2.11%
Risk Profile
⚠️ suitable for aggressive investors
Win Rate
⚠️ 53.5%
Avg Daily Return
📈 +0.19%
Max Drawdown
📉 -12.45%
IBD RS Score
📊 90.5
Leader
Market Rank
#47
Best Month
🏆 2025-10
Worst Month
📉 2025-08
Best Months to Trade
📅 Oct, Jun, Apr
Best Days to Trade
📅 Tuesday, Wednesday
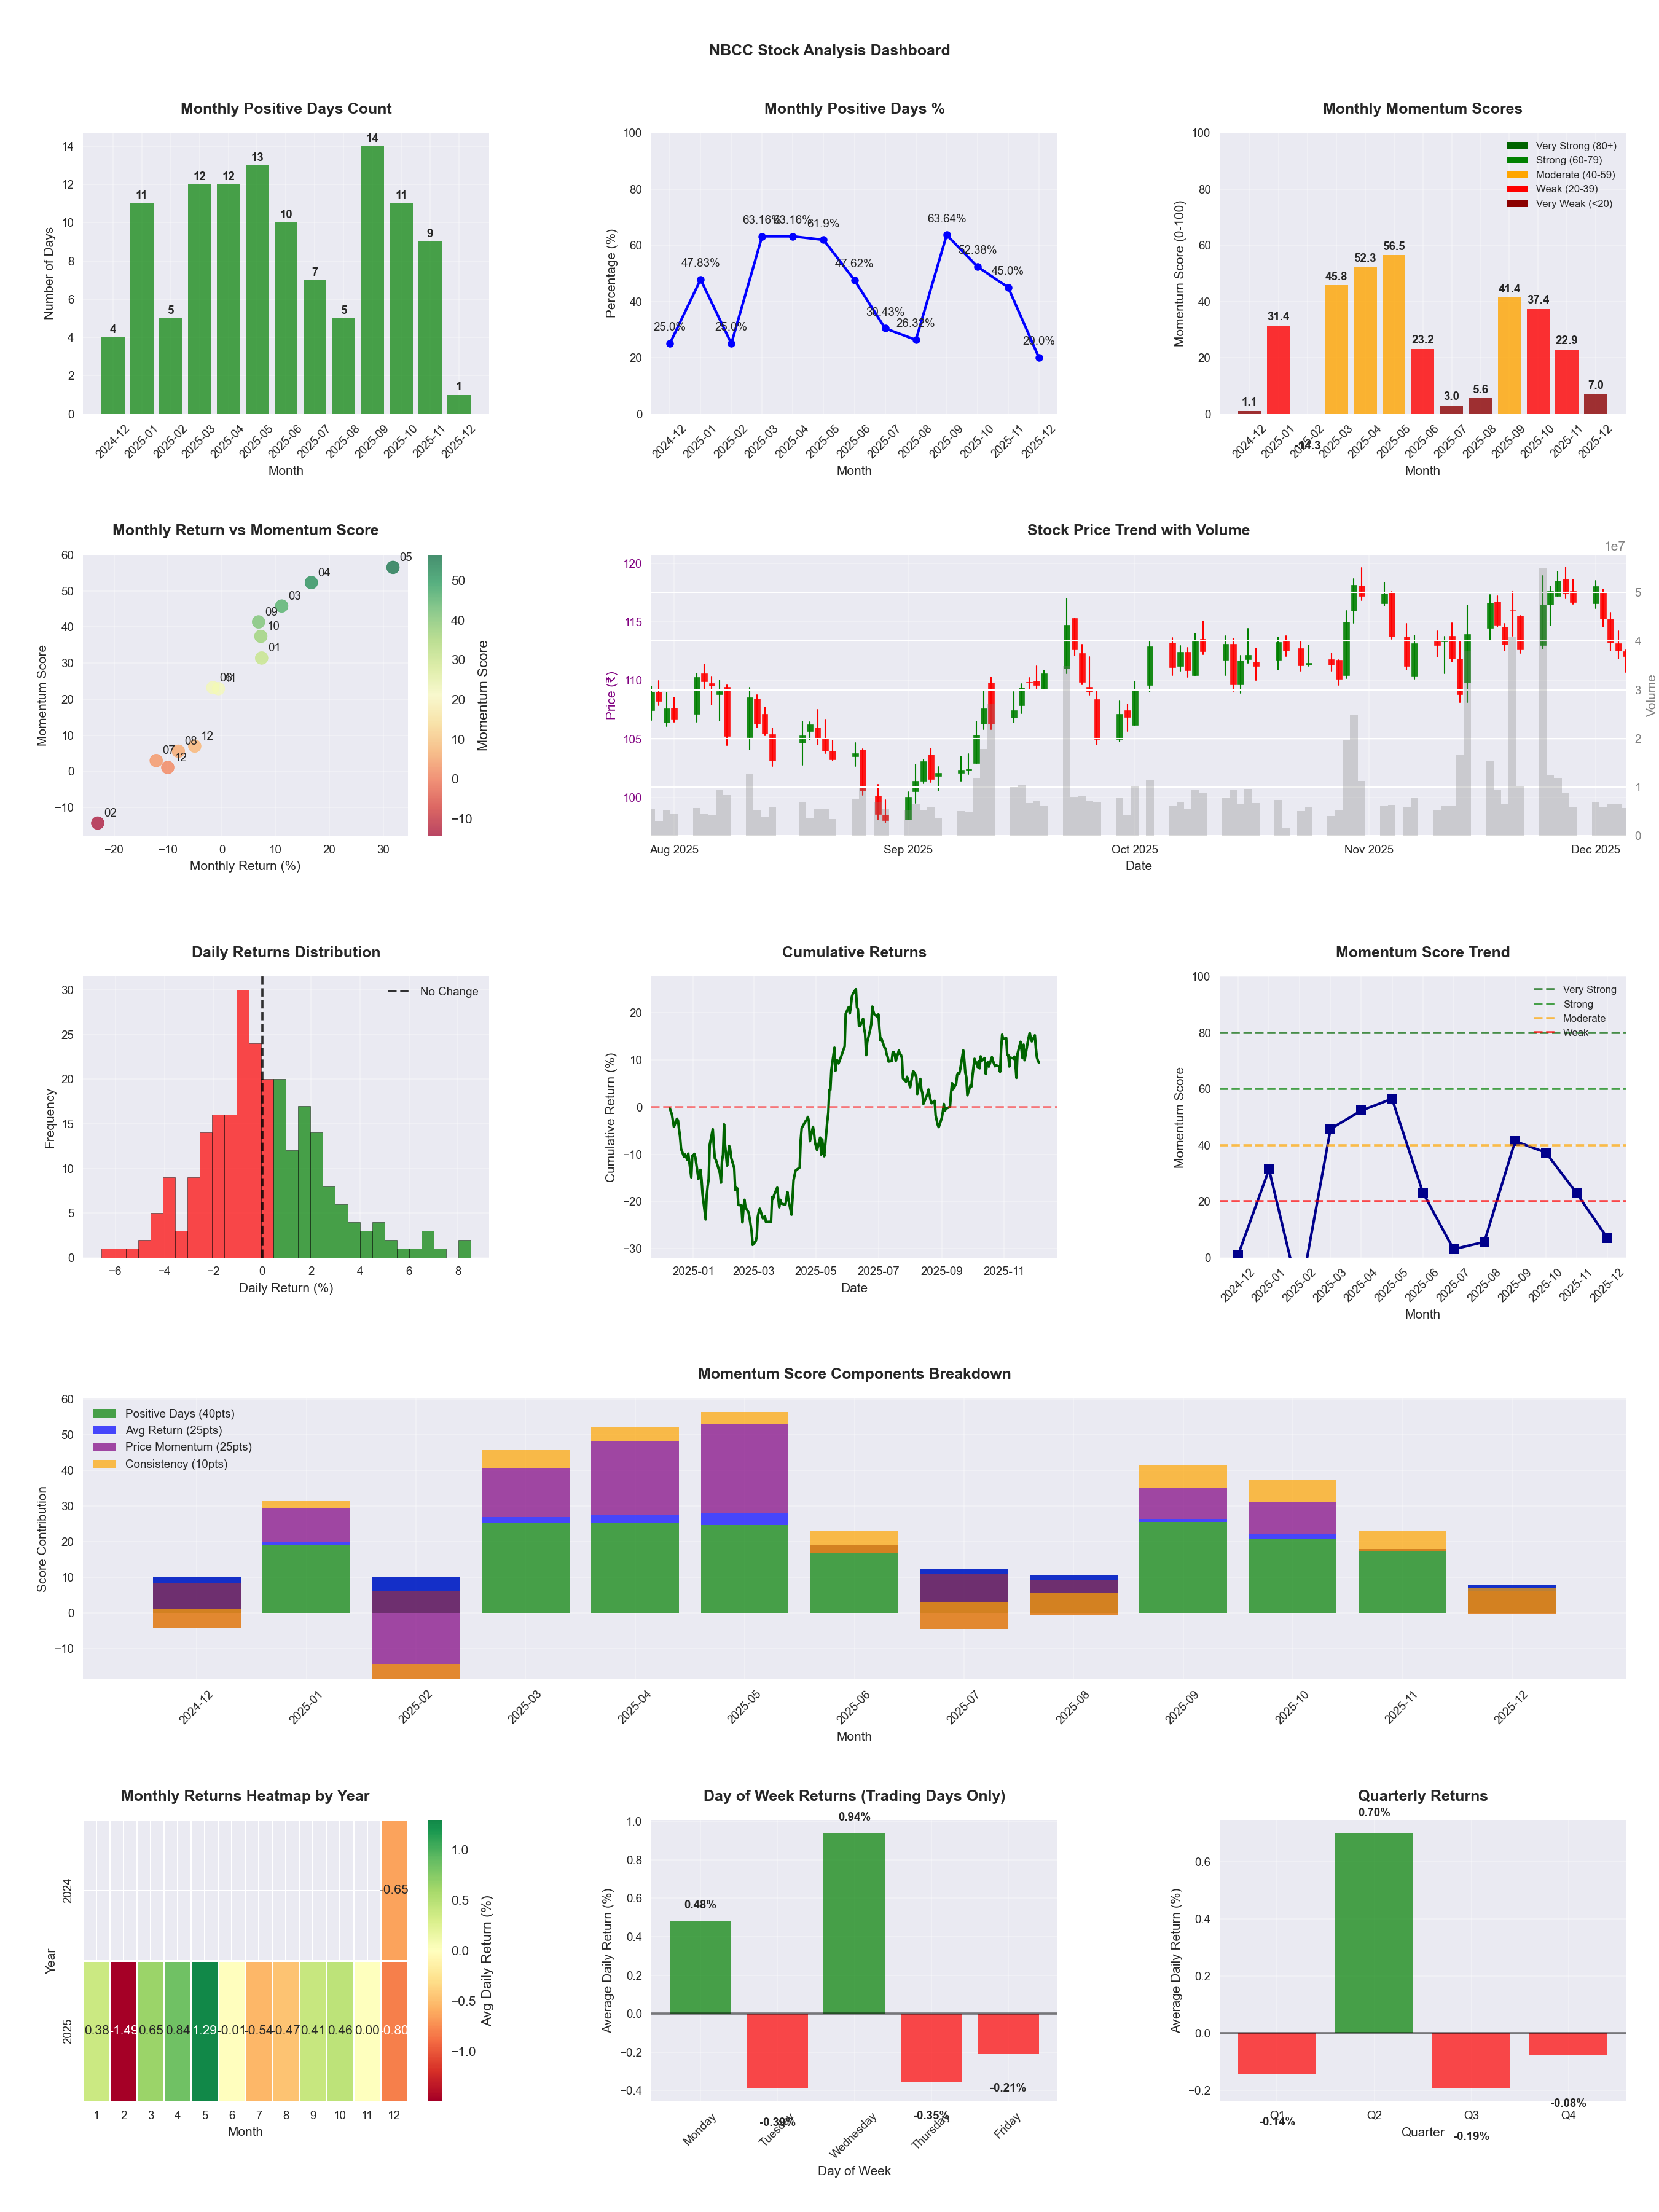
📊 Key Insights & Metrics
Symbol
📈 NBCC
Date
📅 2026-04-11
Volatility
🟡 2.37%
Risk Profile
⚠️ suitable for aggressive investors
Win Rate
⚠️ 44.7%
Avg Daily Return
📈 +0.03%
Max Drawdown
📉 -39.38%
IBD RS Score
📊 18.5
Weak
Market Rank
#402
Best Month
🏆 2025-05
Best Months to Trade
📅 May, Apr, Oct
Best Days to Trade
📅 Monday, Wednesday
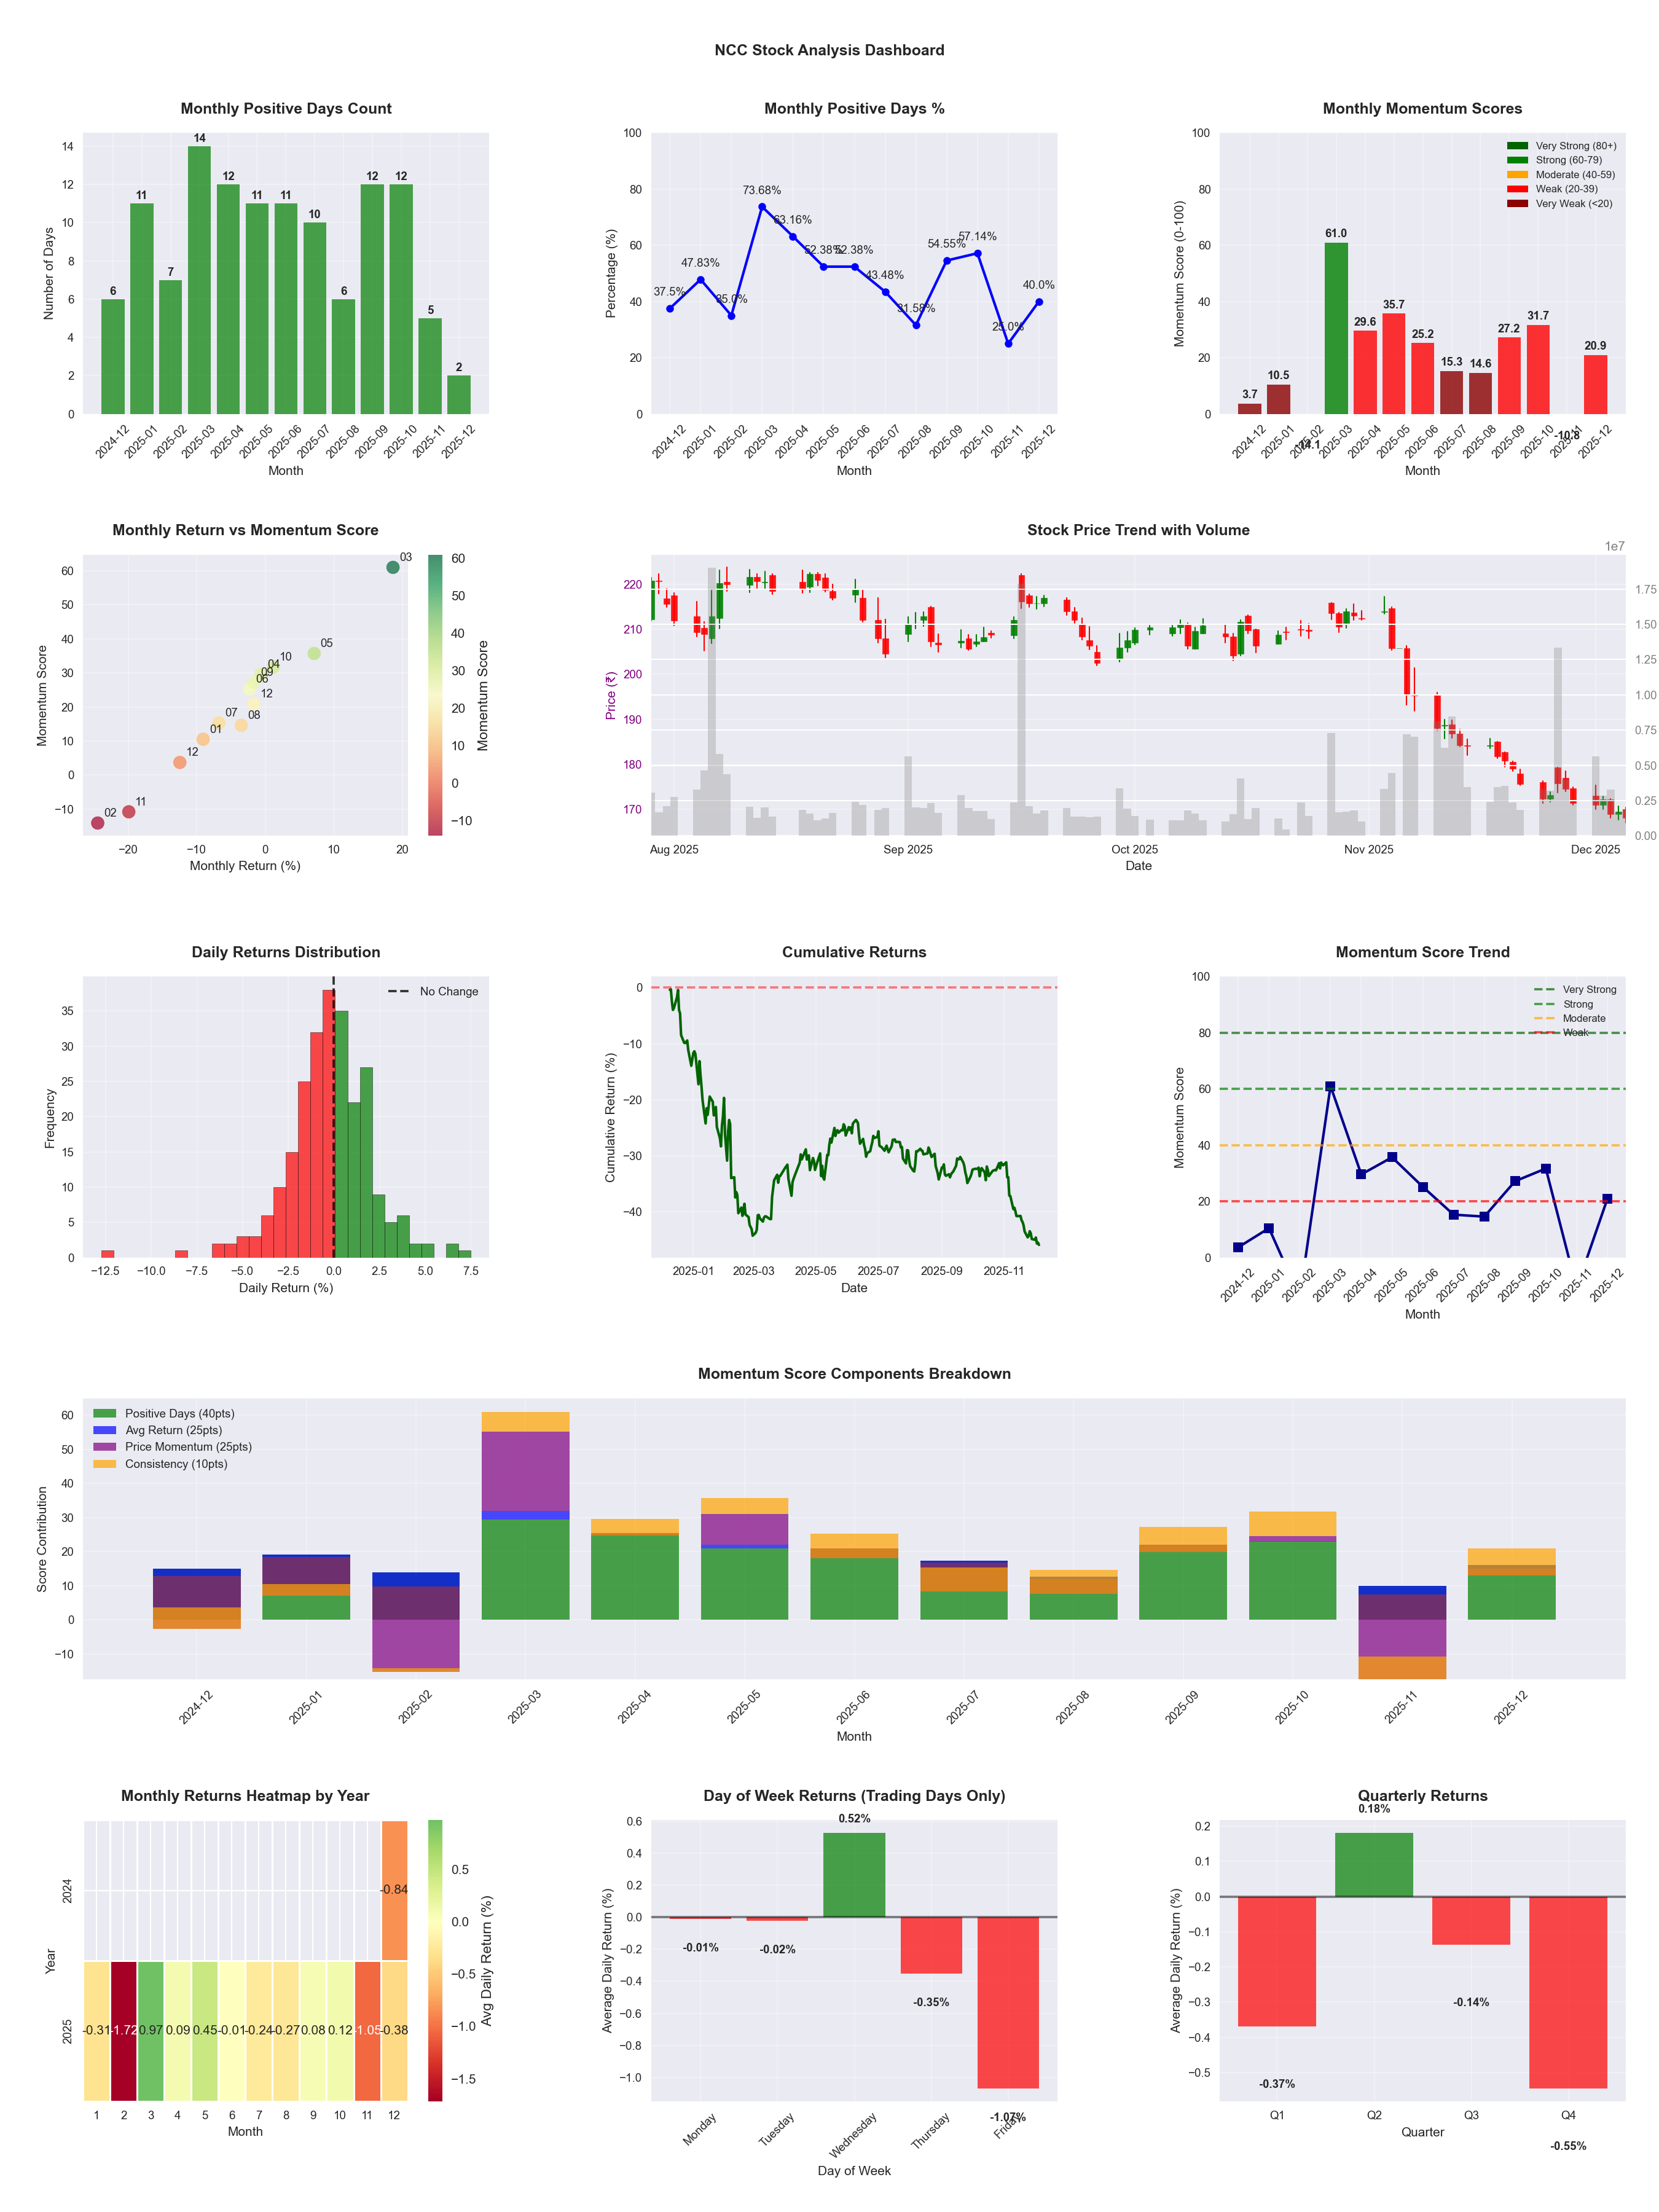
📊 Key Insights & Metrics
Symbol
📈 NCC
Date
📅 2026-04-11
Volatility
🟡 1.93%
Win Rate
⚠️ 45.9%
Avg Daily Return
📉 -0.11%
Max Drawdown
📉 -44.88%
IBD RS Score
📊 21.7
Weak
Market Rank
#386
Best Month
🏆 2026-04
Best Months to Trade
📅 Apr, May, Feb
Best Days to Trade
📅 Wednesday, Monday
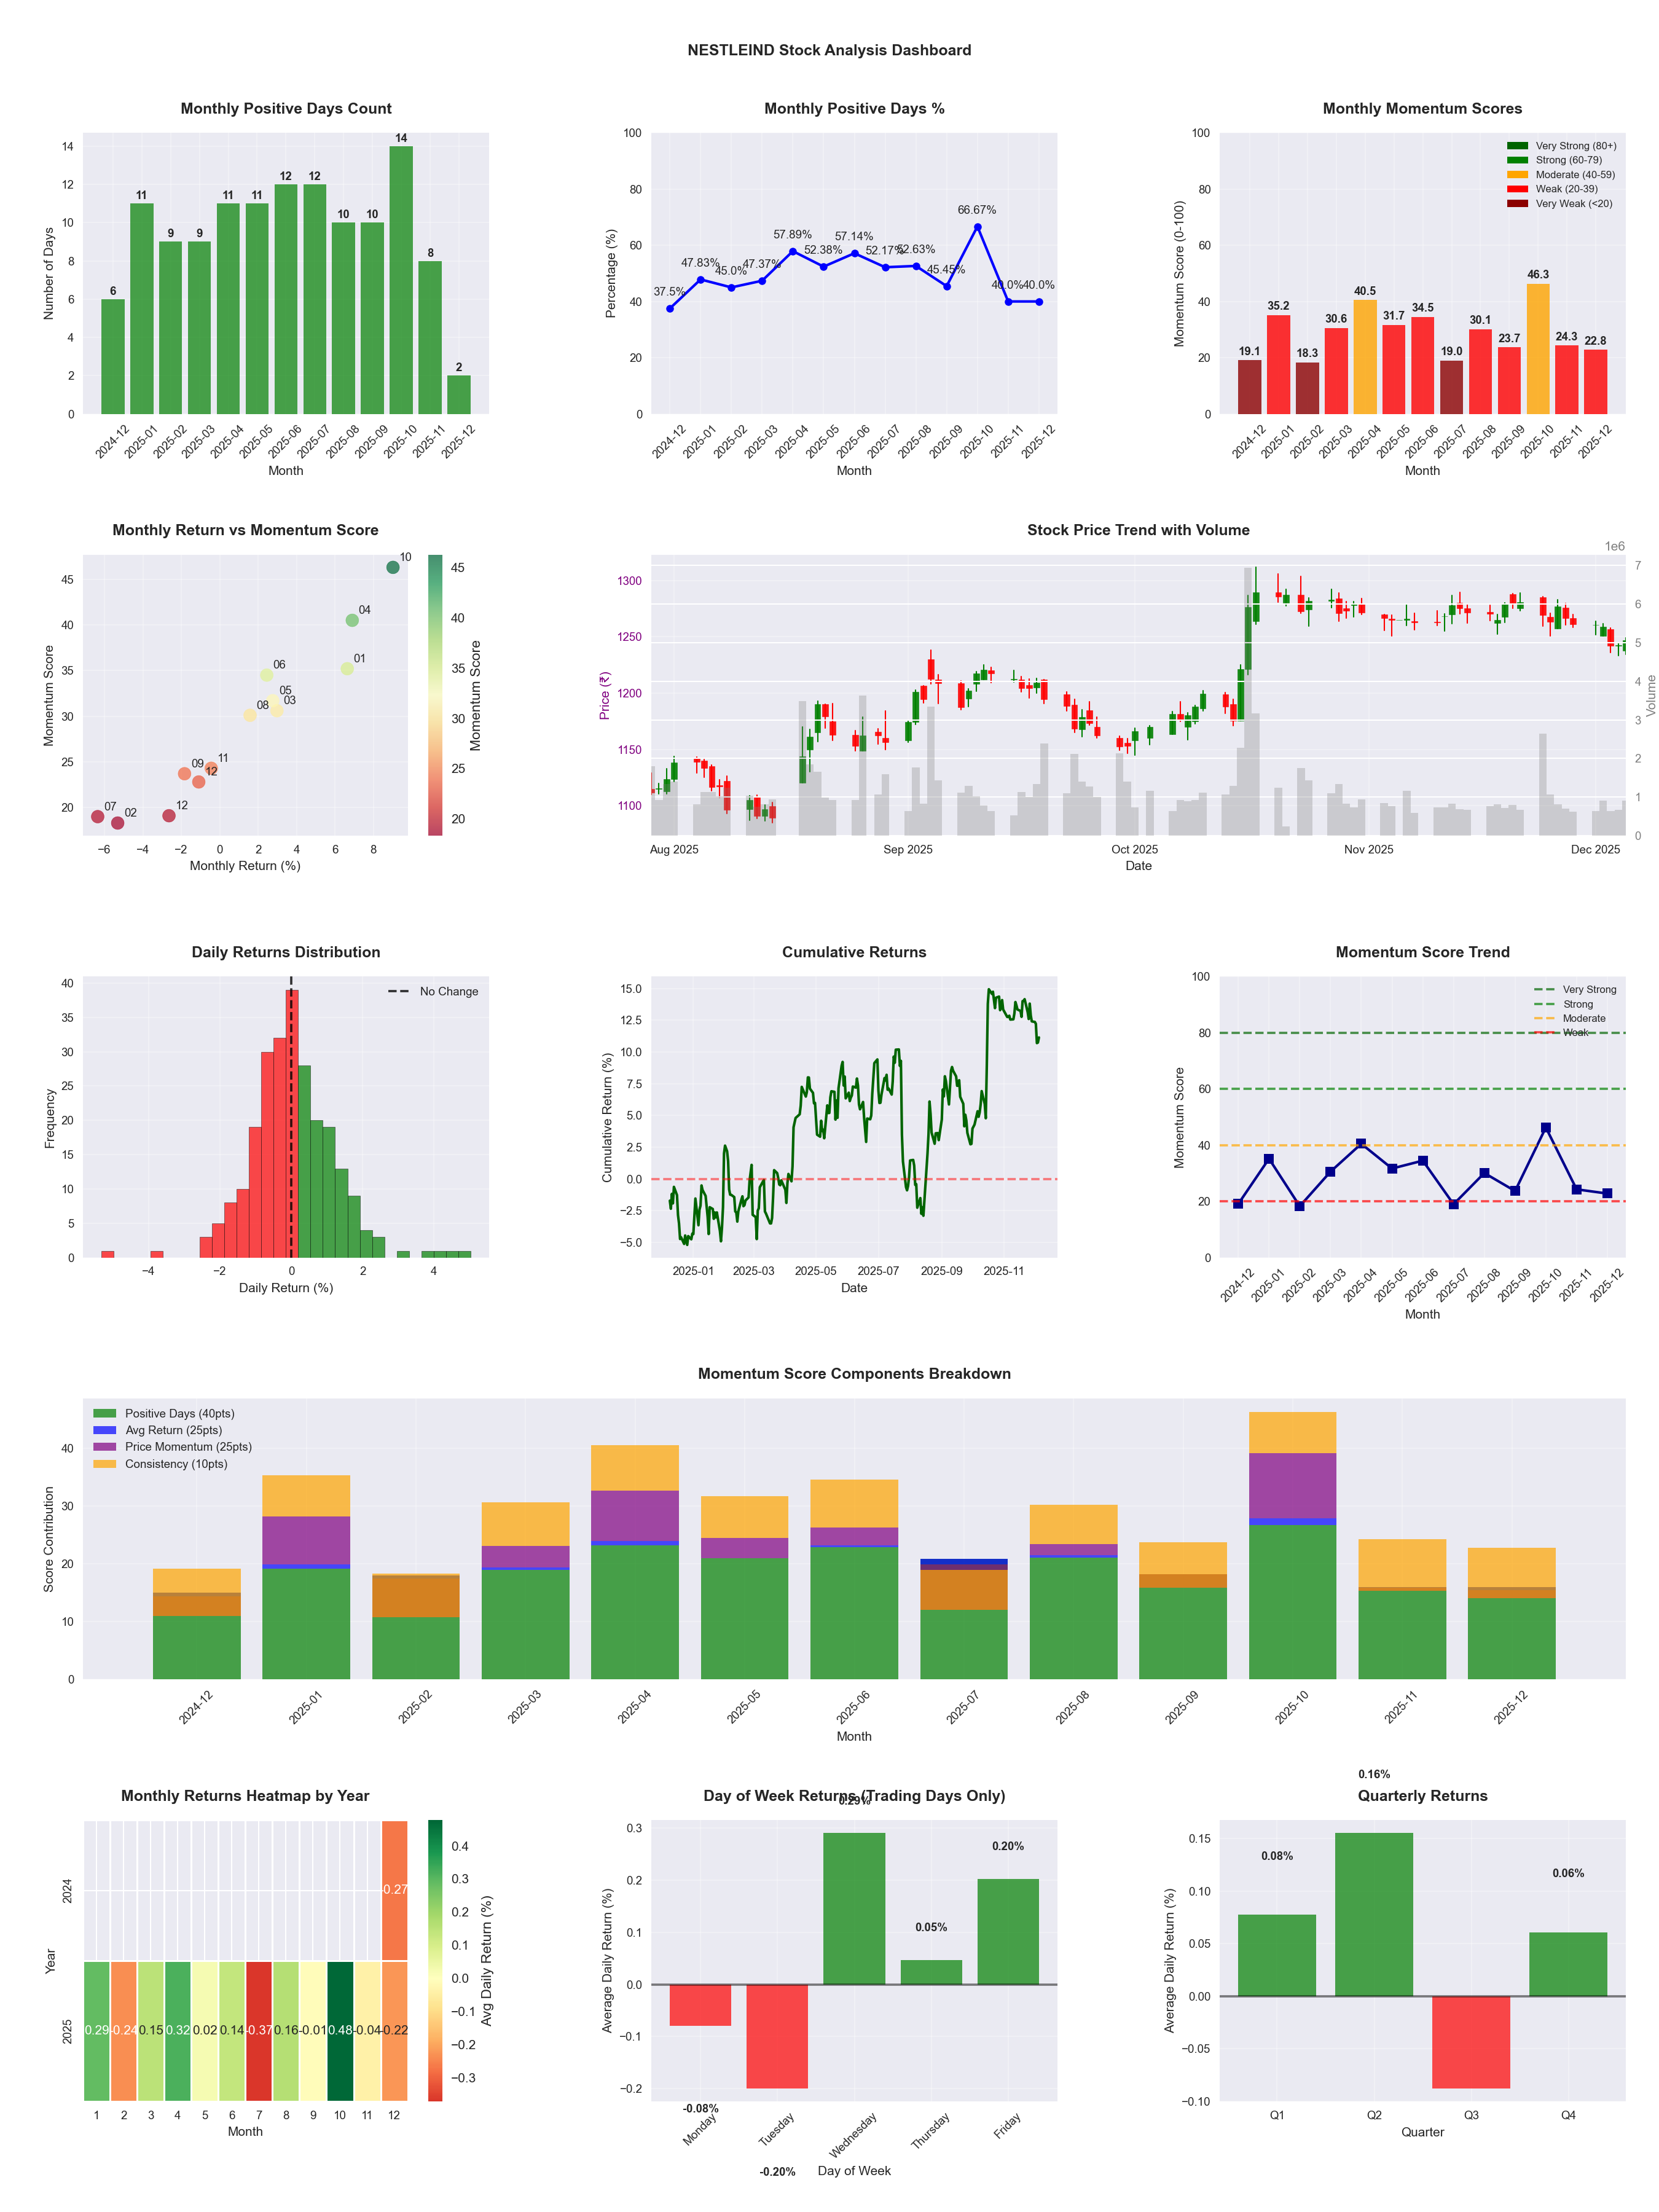
📊 Key Insights & Metrics
Symbol
📈 NESTLEIND
Date
📅 2026-04-11
Volatility
🟢 1.20%
Win Rate
⚠️ 51.6%
Avg Daily Return
📈 +0.03%
Max Drawdown
📉 -11.96%
IBD RS Score
📊 65.5
Average
Market Rank
#170
Best Month
🏆 2026-04
Worst Month
📉 2026-03
Best Months to Trade
📅 Oct, Apr, Jan
Best Days to Trade
📅 Wednesday, Monday
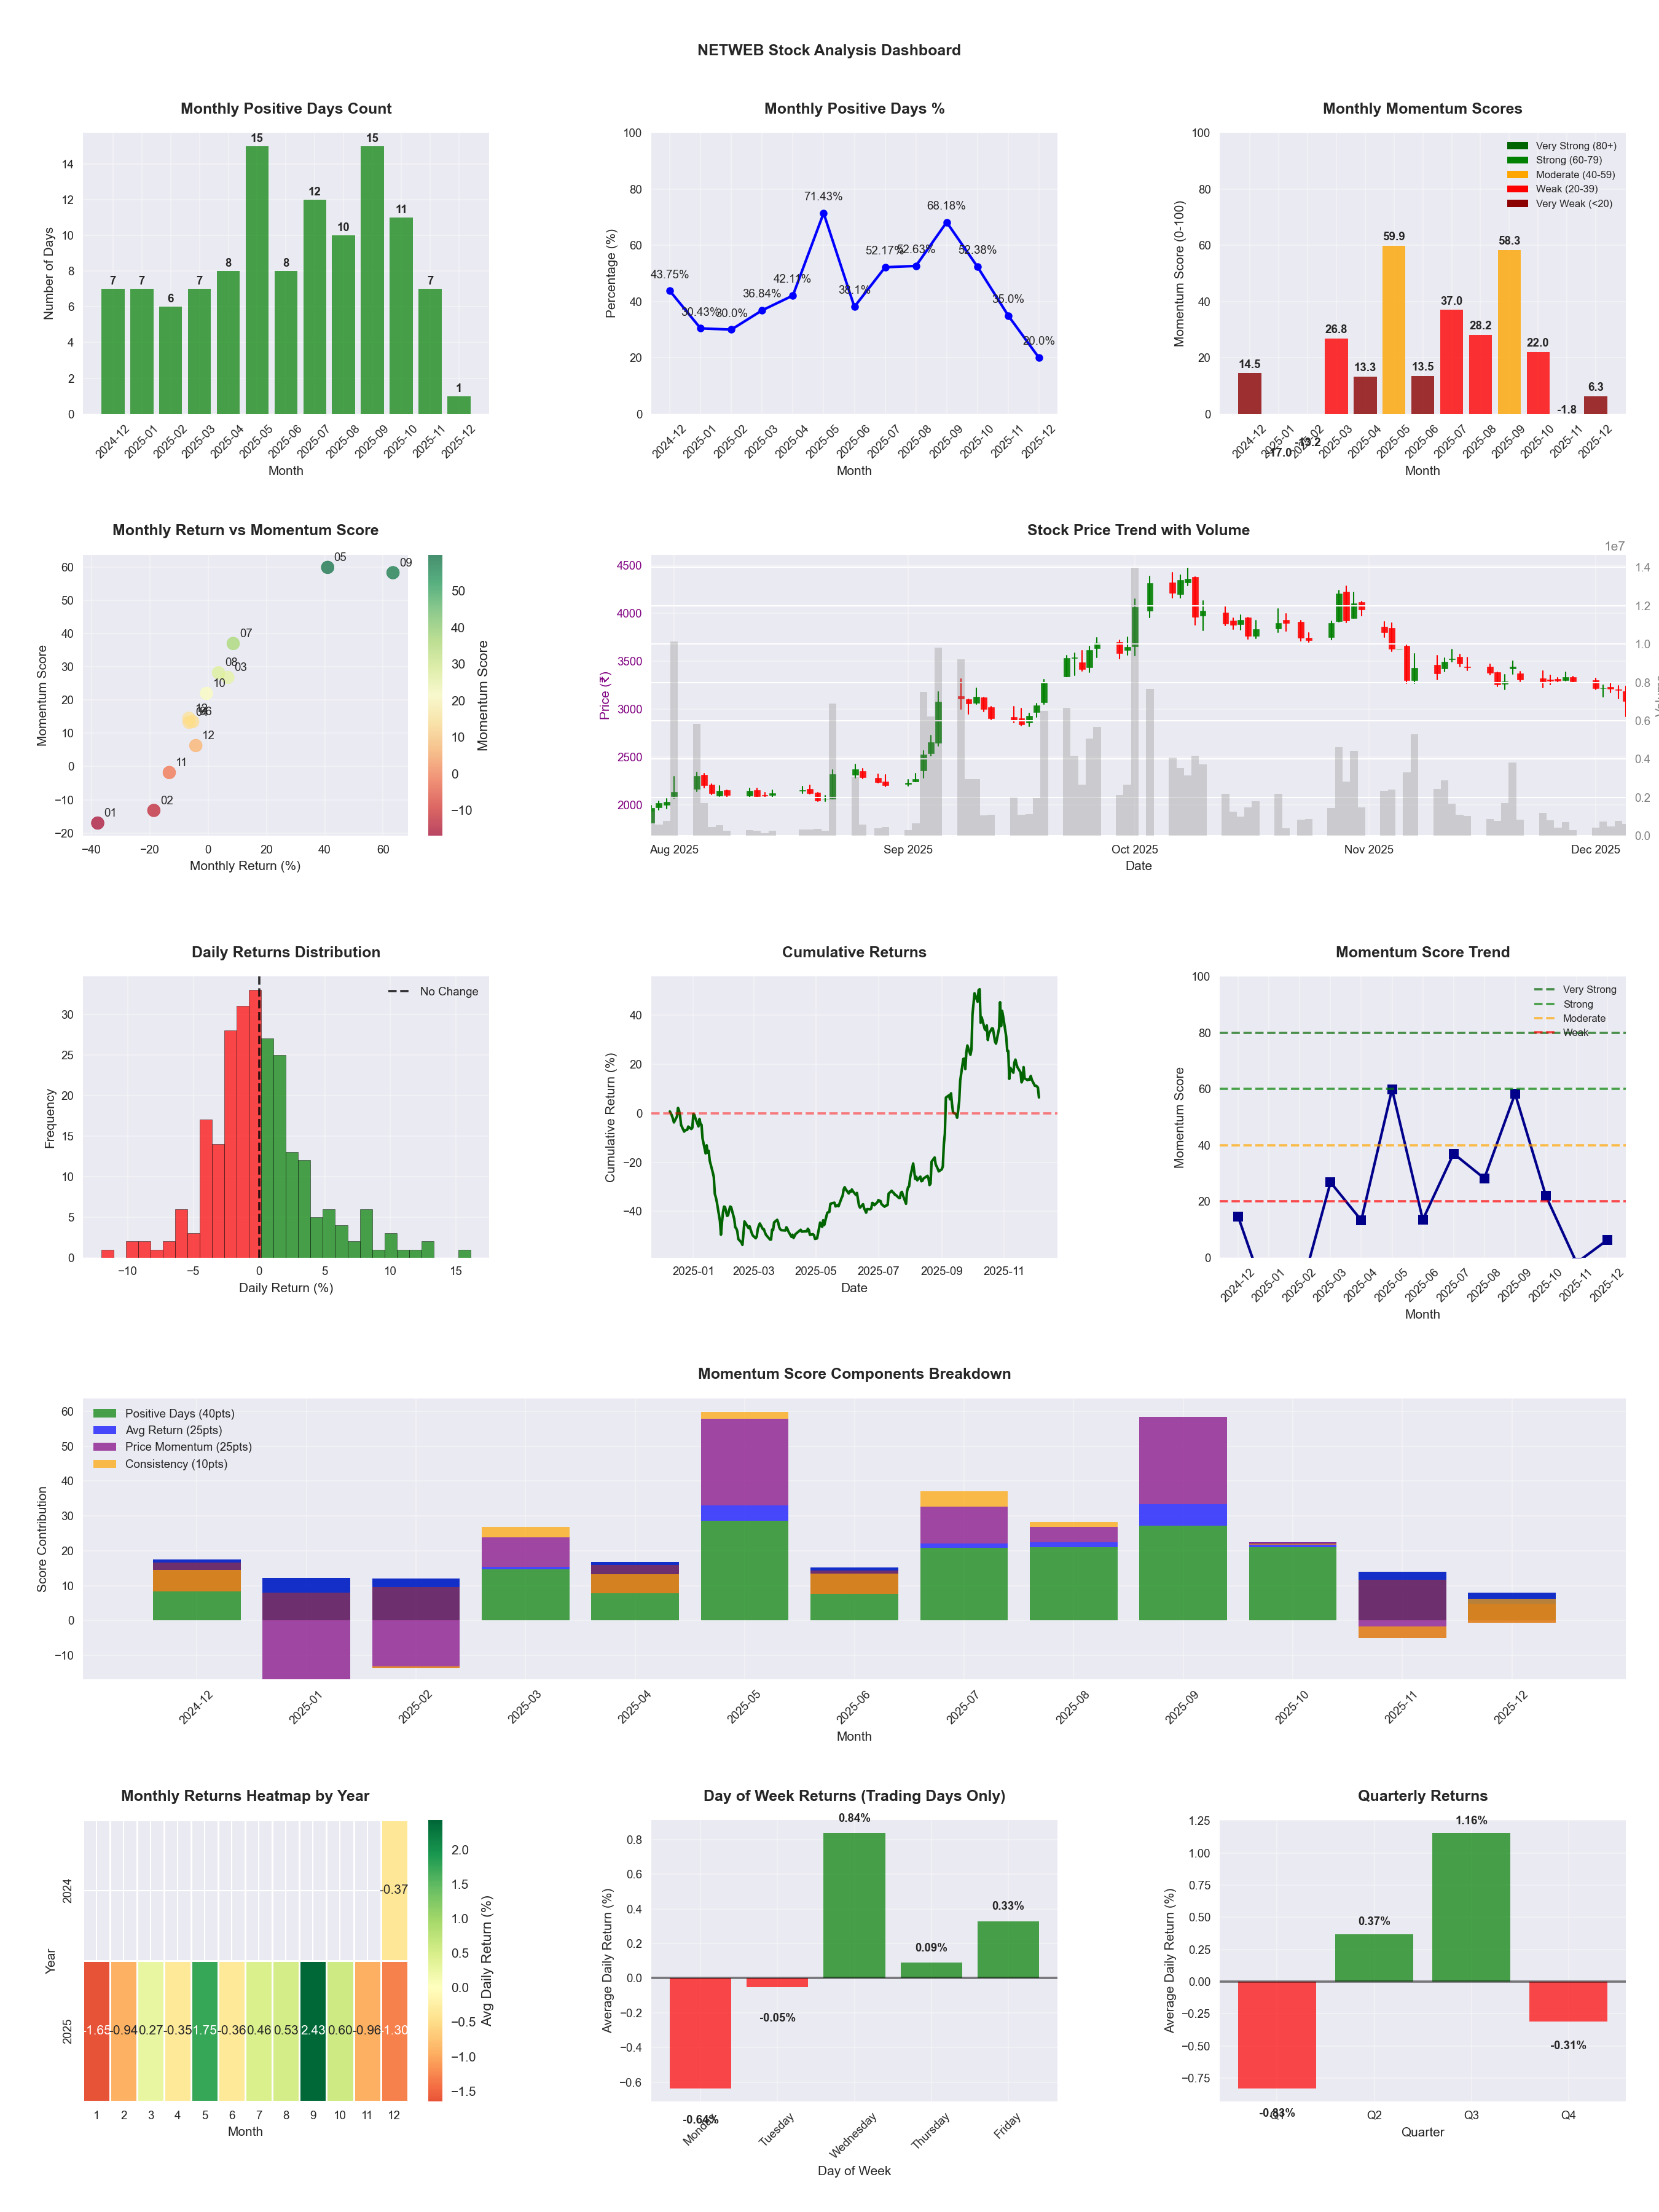
📊 Key Insights & Metrics
Symbol
📈 NETWEB
Date
📅 2026-04-11
Volatility
🔴 3.53%
Risk Profile
⚠️ suitable for aggressive investors
Win Rate
⚠️ 52.9%
Avg Daily Return
📈 +0.40%
Max Drawdown
📉 -30.64%
IBD RS Score
📊 97.0
Leader
Market Rank
#15
Best Month
🏆 2026-02
Best Months to Trade
📅 Sep, May, Feb
Best Days to Trade
📅 Friday, Monday
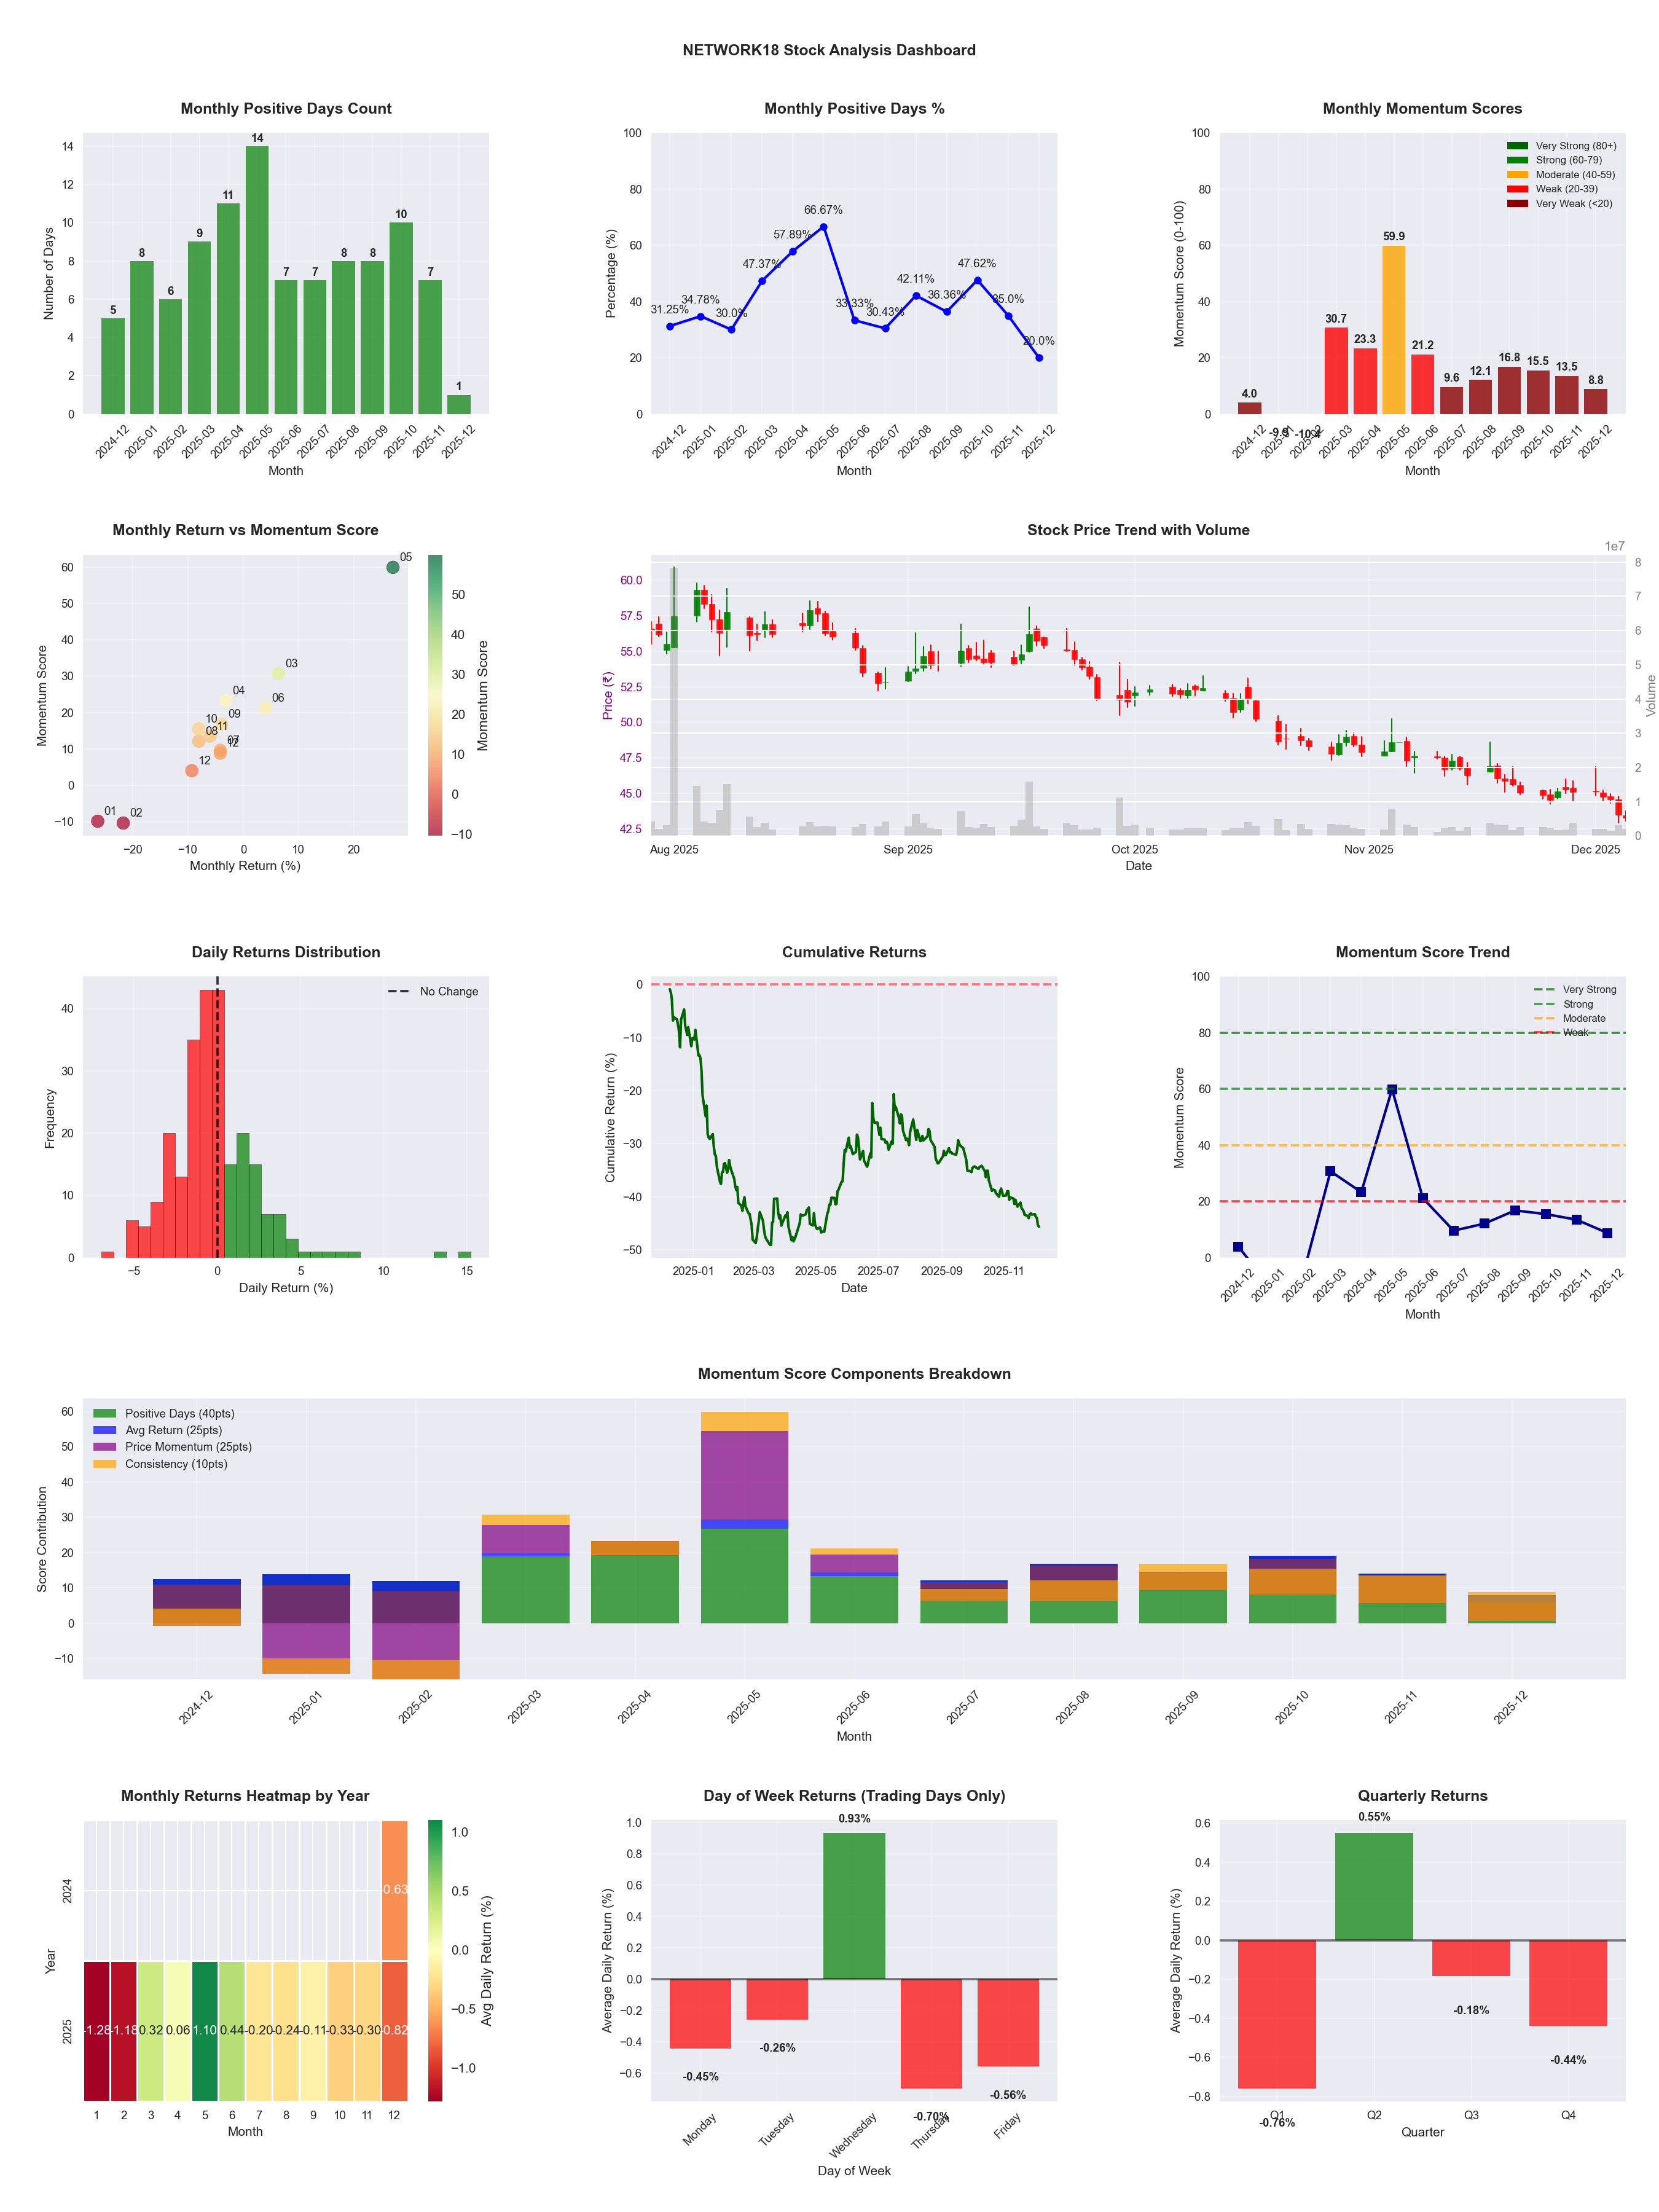
📊 Key Insights & Metrics
Symbol
📈 NETWORK18
Date
📅 2026-03-21
Volatility
🟡 2.44%
Risk Profile
⚠️ suitable for aggressive investors
Win Rate
⚠️ 41.3%
Avg Daily Return
📉 -0.14%
Max Drawdown
📉 -52.01%
Best Month
🏆 2025-05
Worst Month
📉 2026-01
Best Months to Trade
📅 May, Jun, Apr
Best Days to Trade
📅 Wednesday, Monday
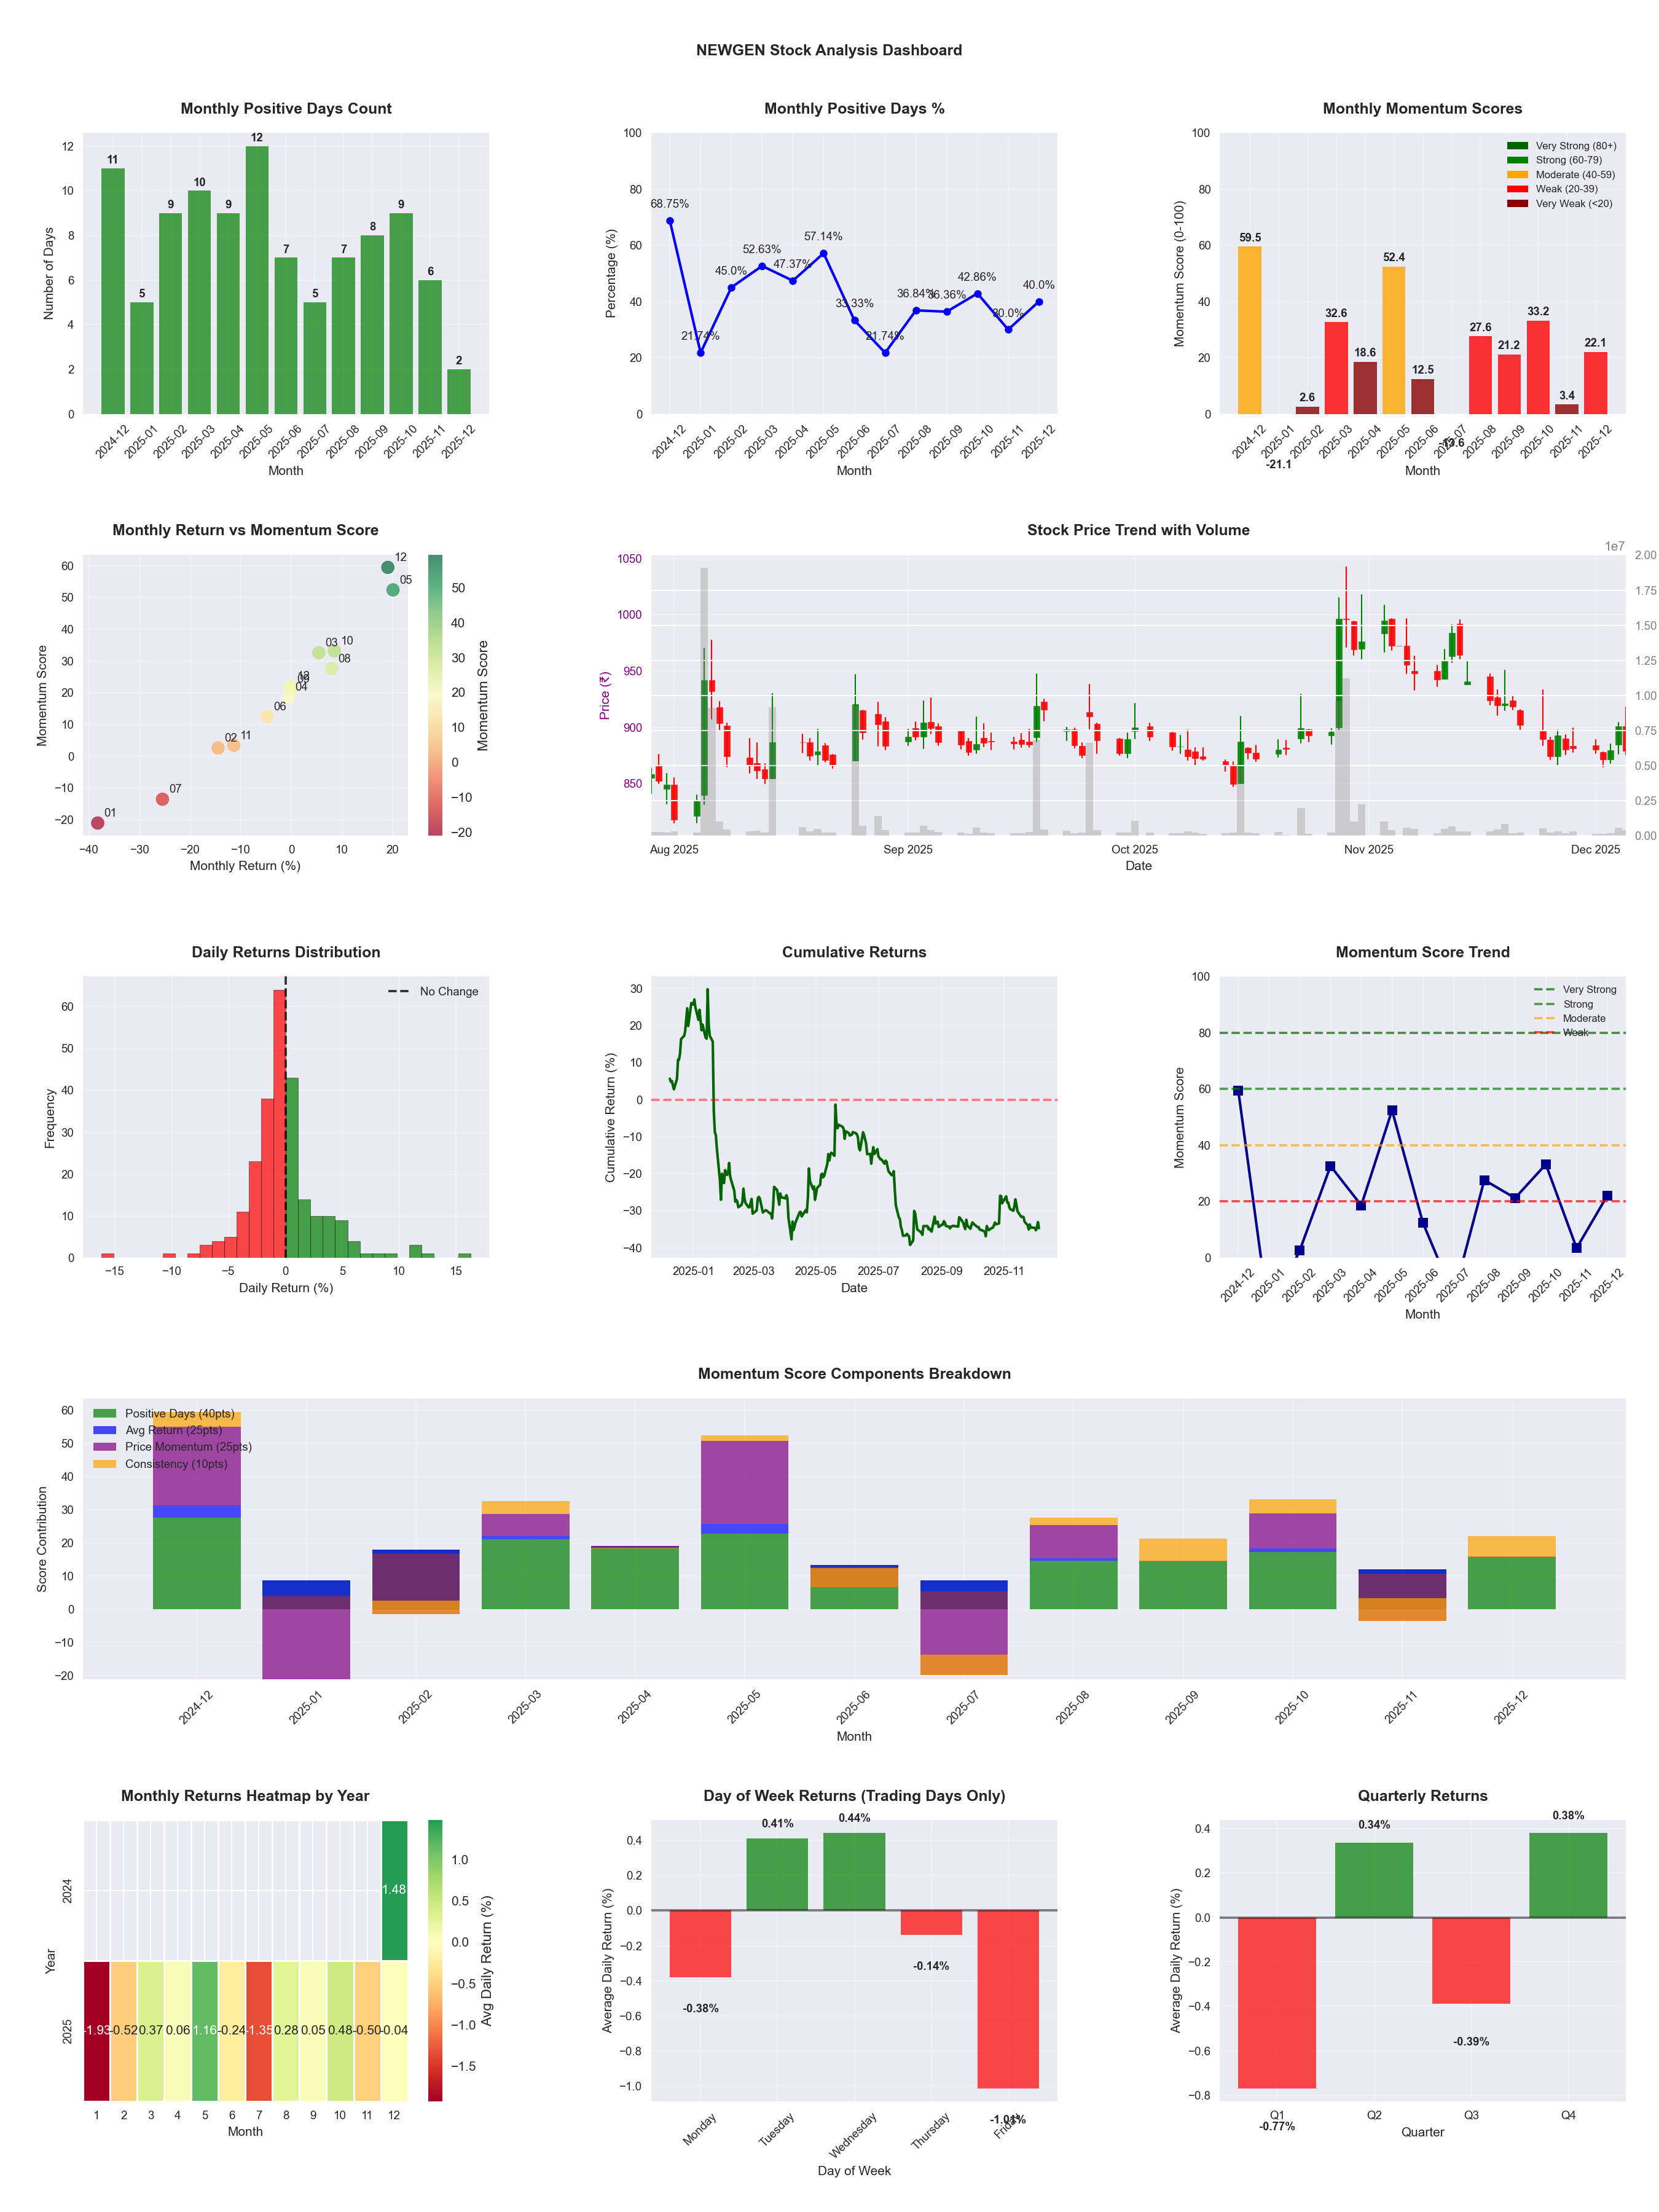
📊 Key Insights & Metrics
Symbol
📈 NEWGEN
Date
📅 2026-04-11
Volatility
🔴 3.33%
Risk Profile
⚠️ suitable for aggressive investors
Win Rate
❌ 36.2%
Avg Daily Return
📉 -0.23%
Max Drawdown
📉 -69.71%
IBD RS Score
📊 0.2
Weak
Market Rank
#492
Best Month
🏆 2025-05
Best Months to Trade
📅 May, Apr, Oct
Best Days to Trade
📅 Tuesday, Wednesday
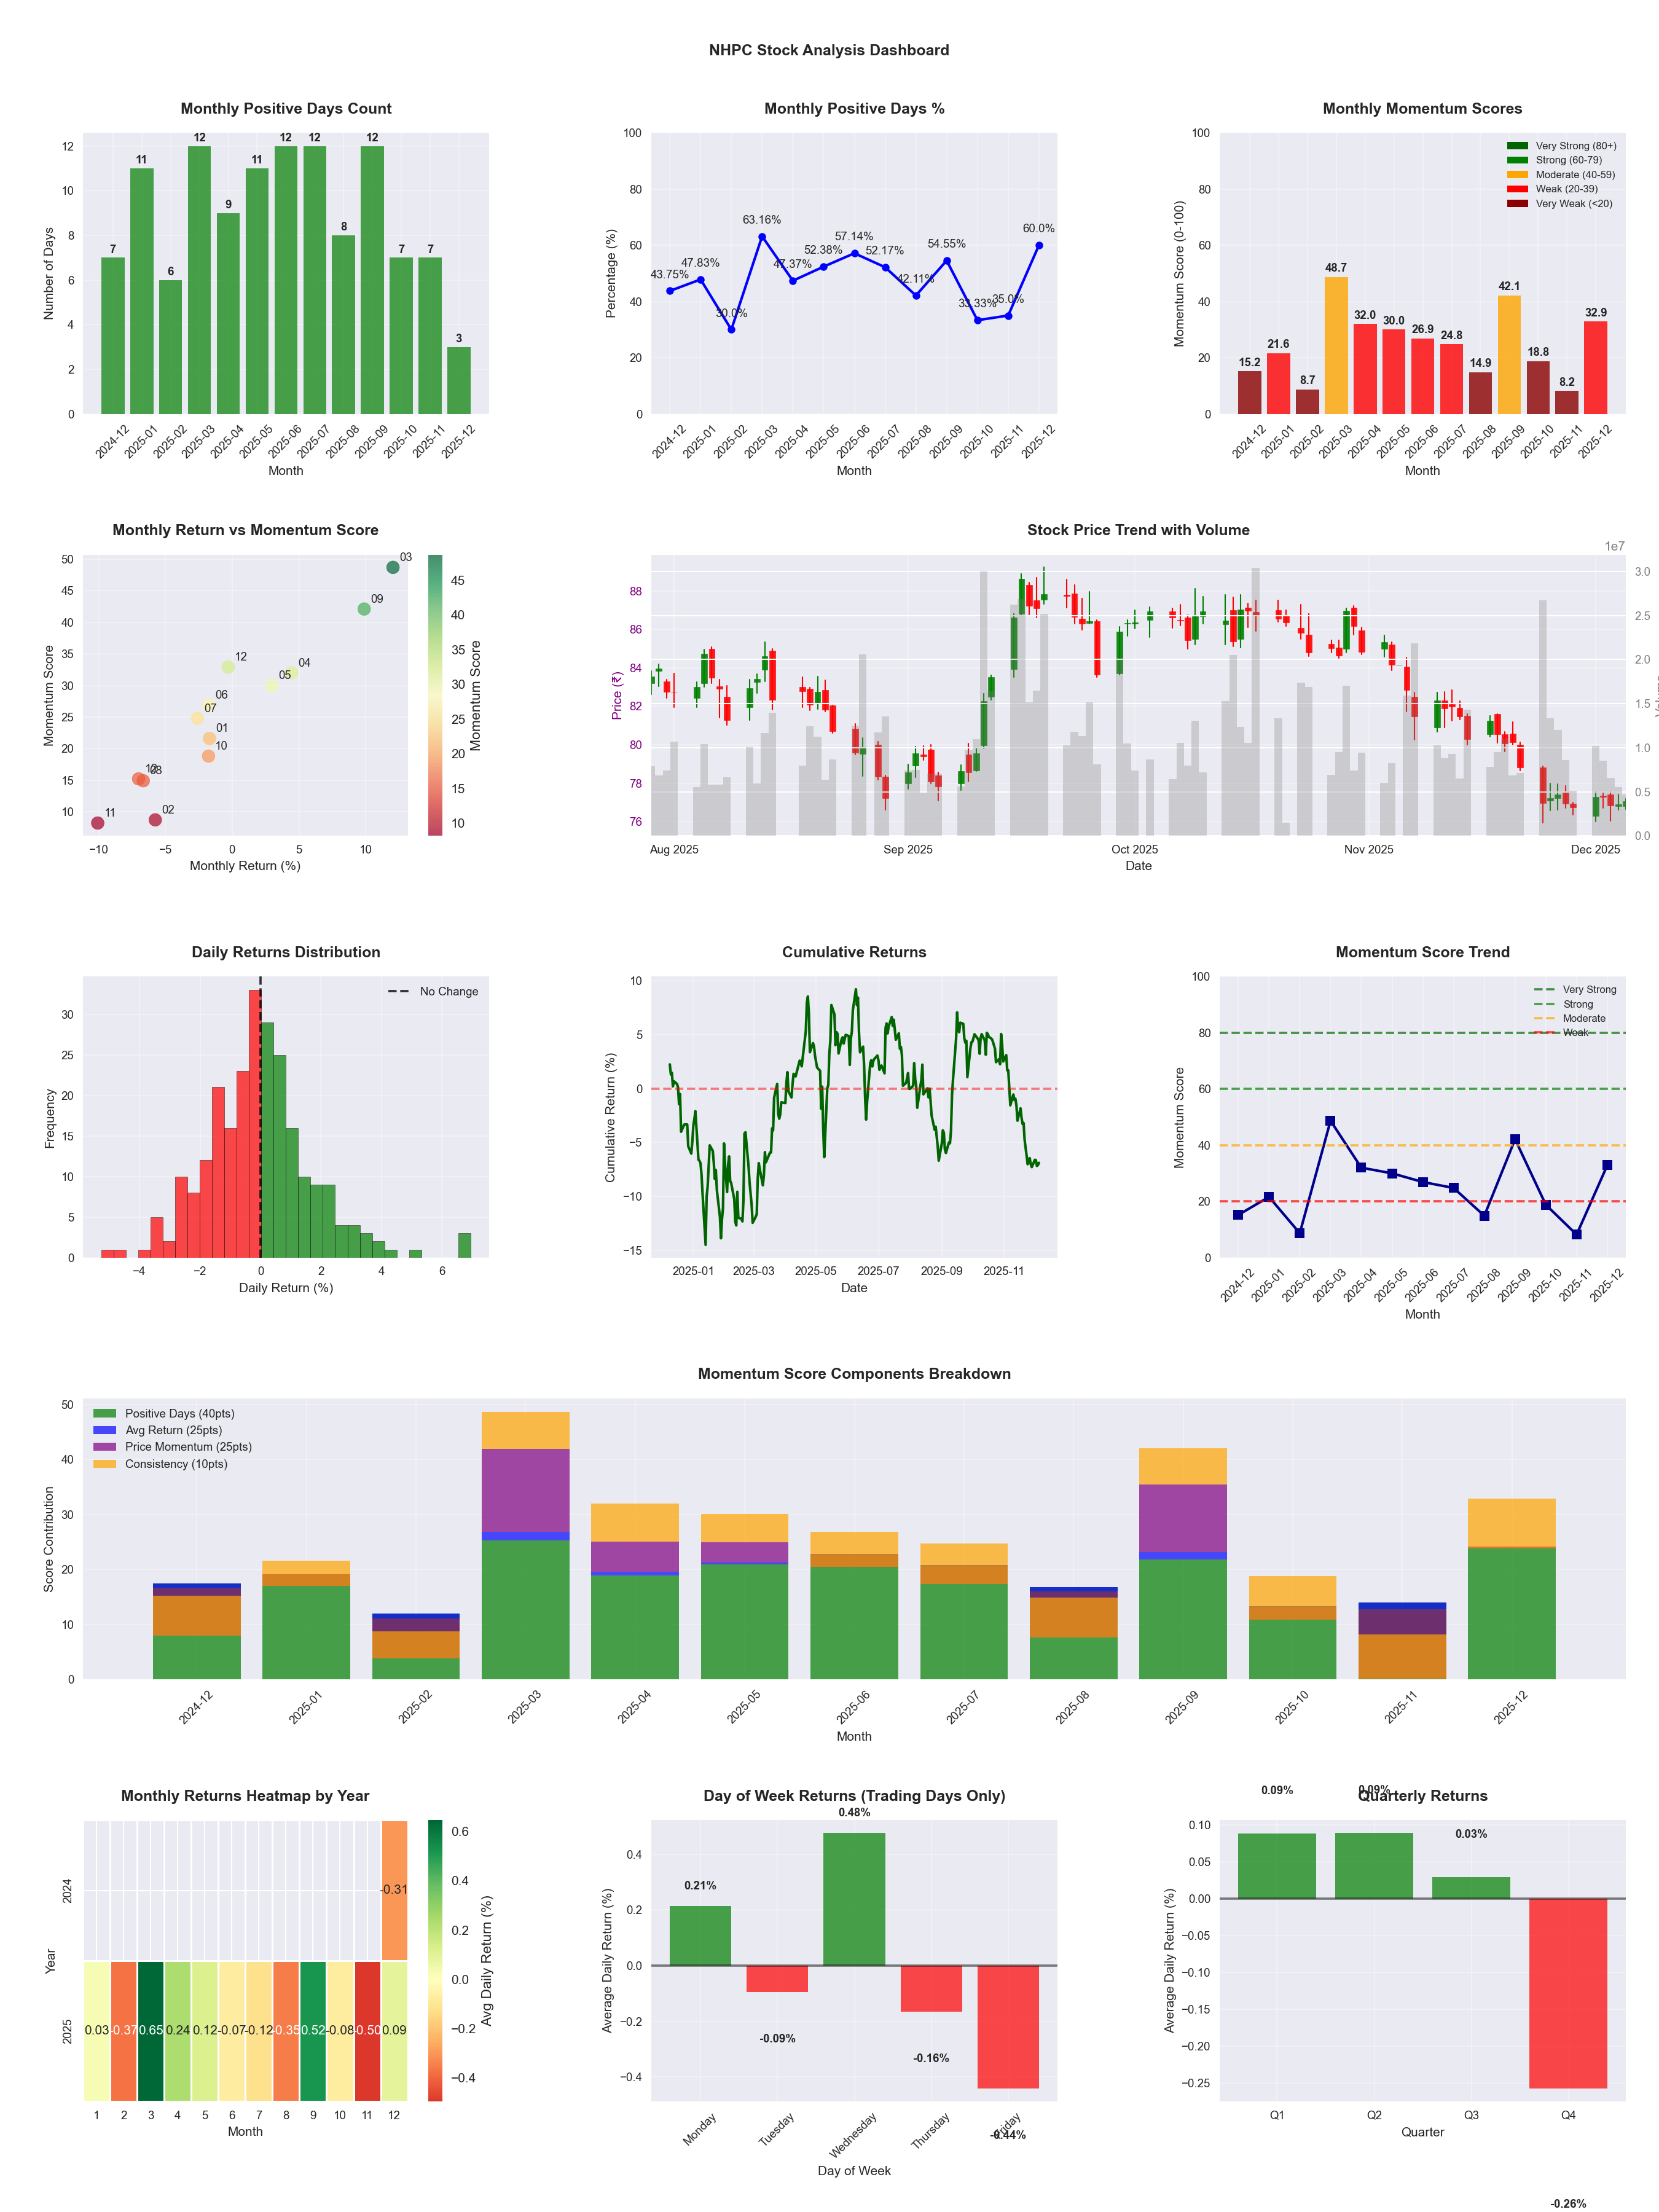
📊 Key Insights & Metrics
Symbol
📈 NHPC
Date
📅 2026-04-11
Volatility
🟡 1.57%
Win Rate
⚠️ 48.0%
Avg Daily Return
📉 -0.01%
Max Drawdown
📉 -18.64%
IBD RS Score
📊 45.4
Weak
Market Rank
#269
Best Month
🏆 2025-09
Worst Month
📉 2025-11
Best Months to Trade
📅 Sep, Apr, Dec
Best Days to Trade
📅 Monday, Wednesday
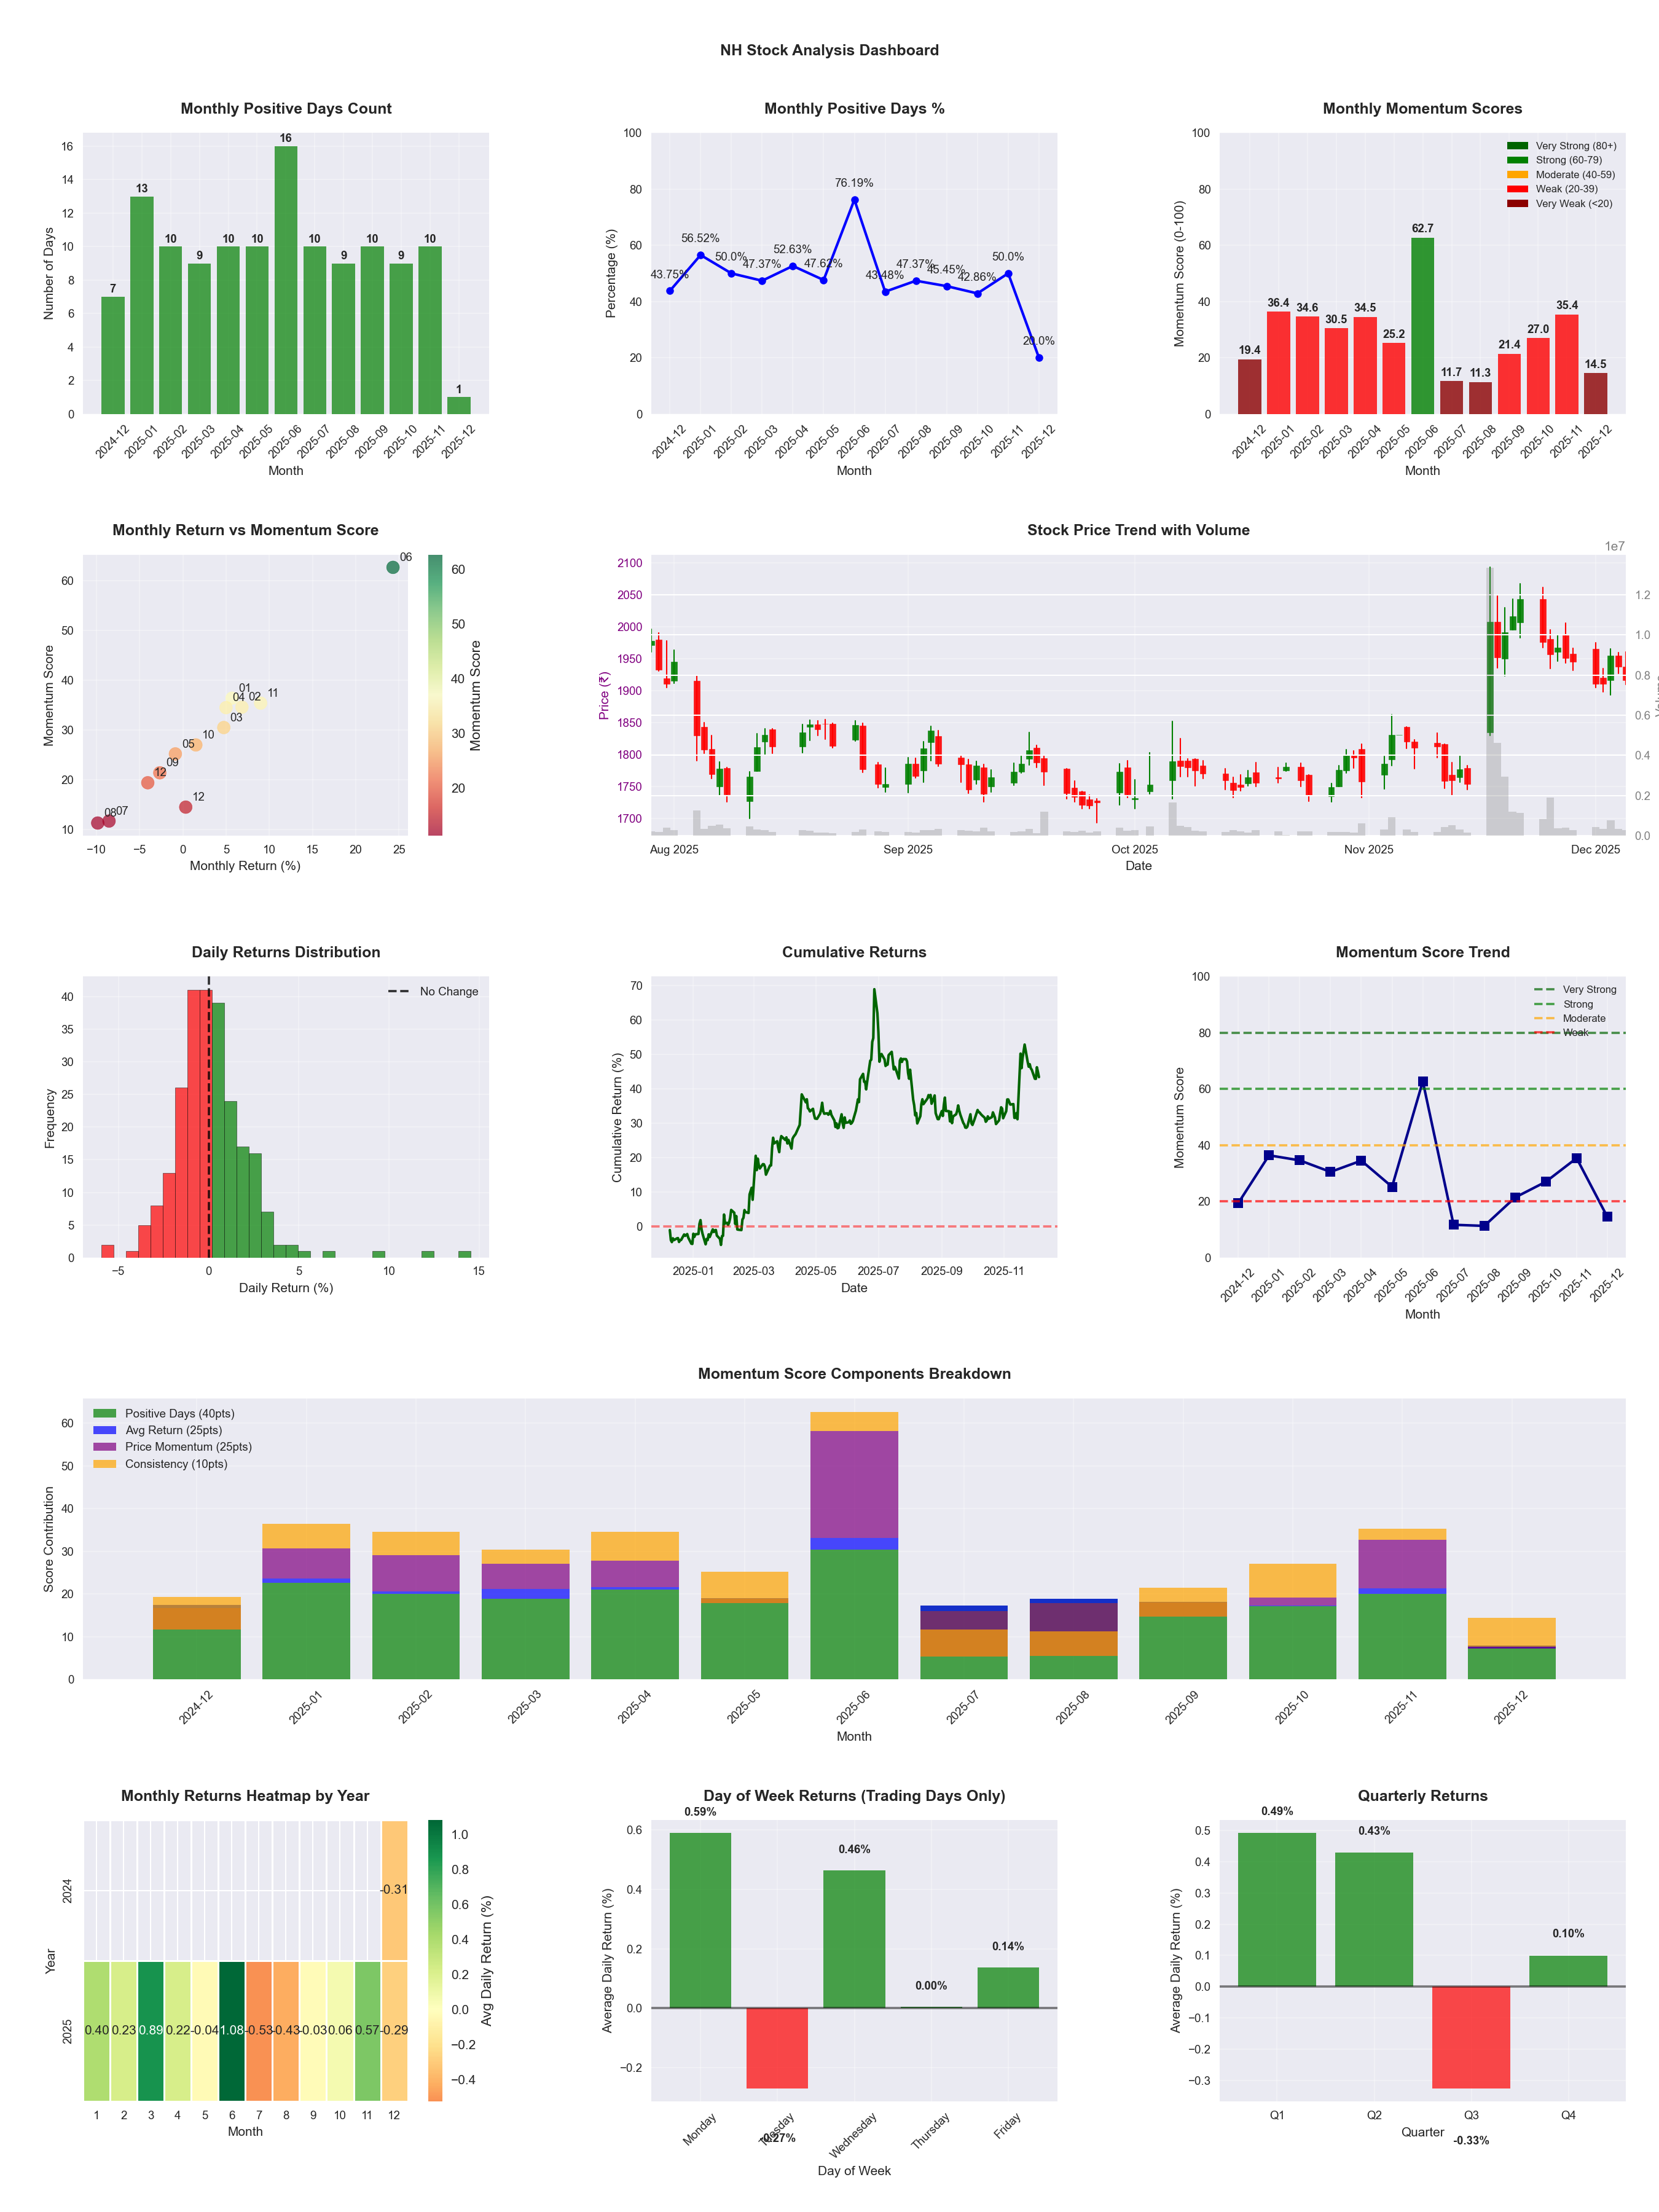
📊 Key Insights & Metrics
Symbol
📈 NH
Date
📅 2026-04-11
Volatility
🟡 2.03%
Risk Profile
⚠️ suitable for aggressive investors
Win Rate
⚠️ 45.9%
Avg Daily Return
📈 +0.03%
Max Drawdown
📉 -28.90%
IBD RS Score
📊 47.3
Weak
Market Rank
#260
Best Month
🏆 2025-06
Worst Month
📉 2026-01
Best Months to Trade
📅 Jun, Apr, Nov
Best Days to Trade
📅 Wednesday, Monday
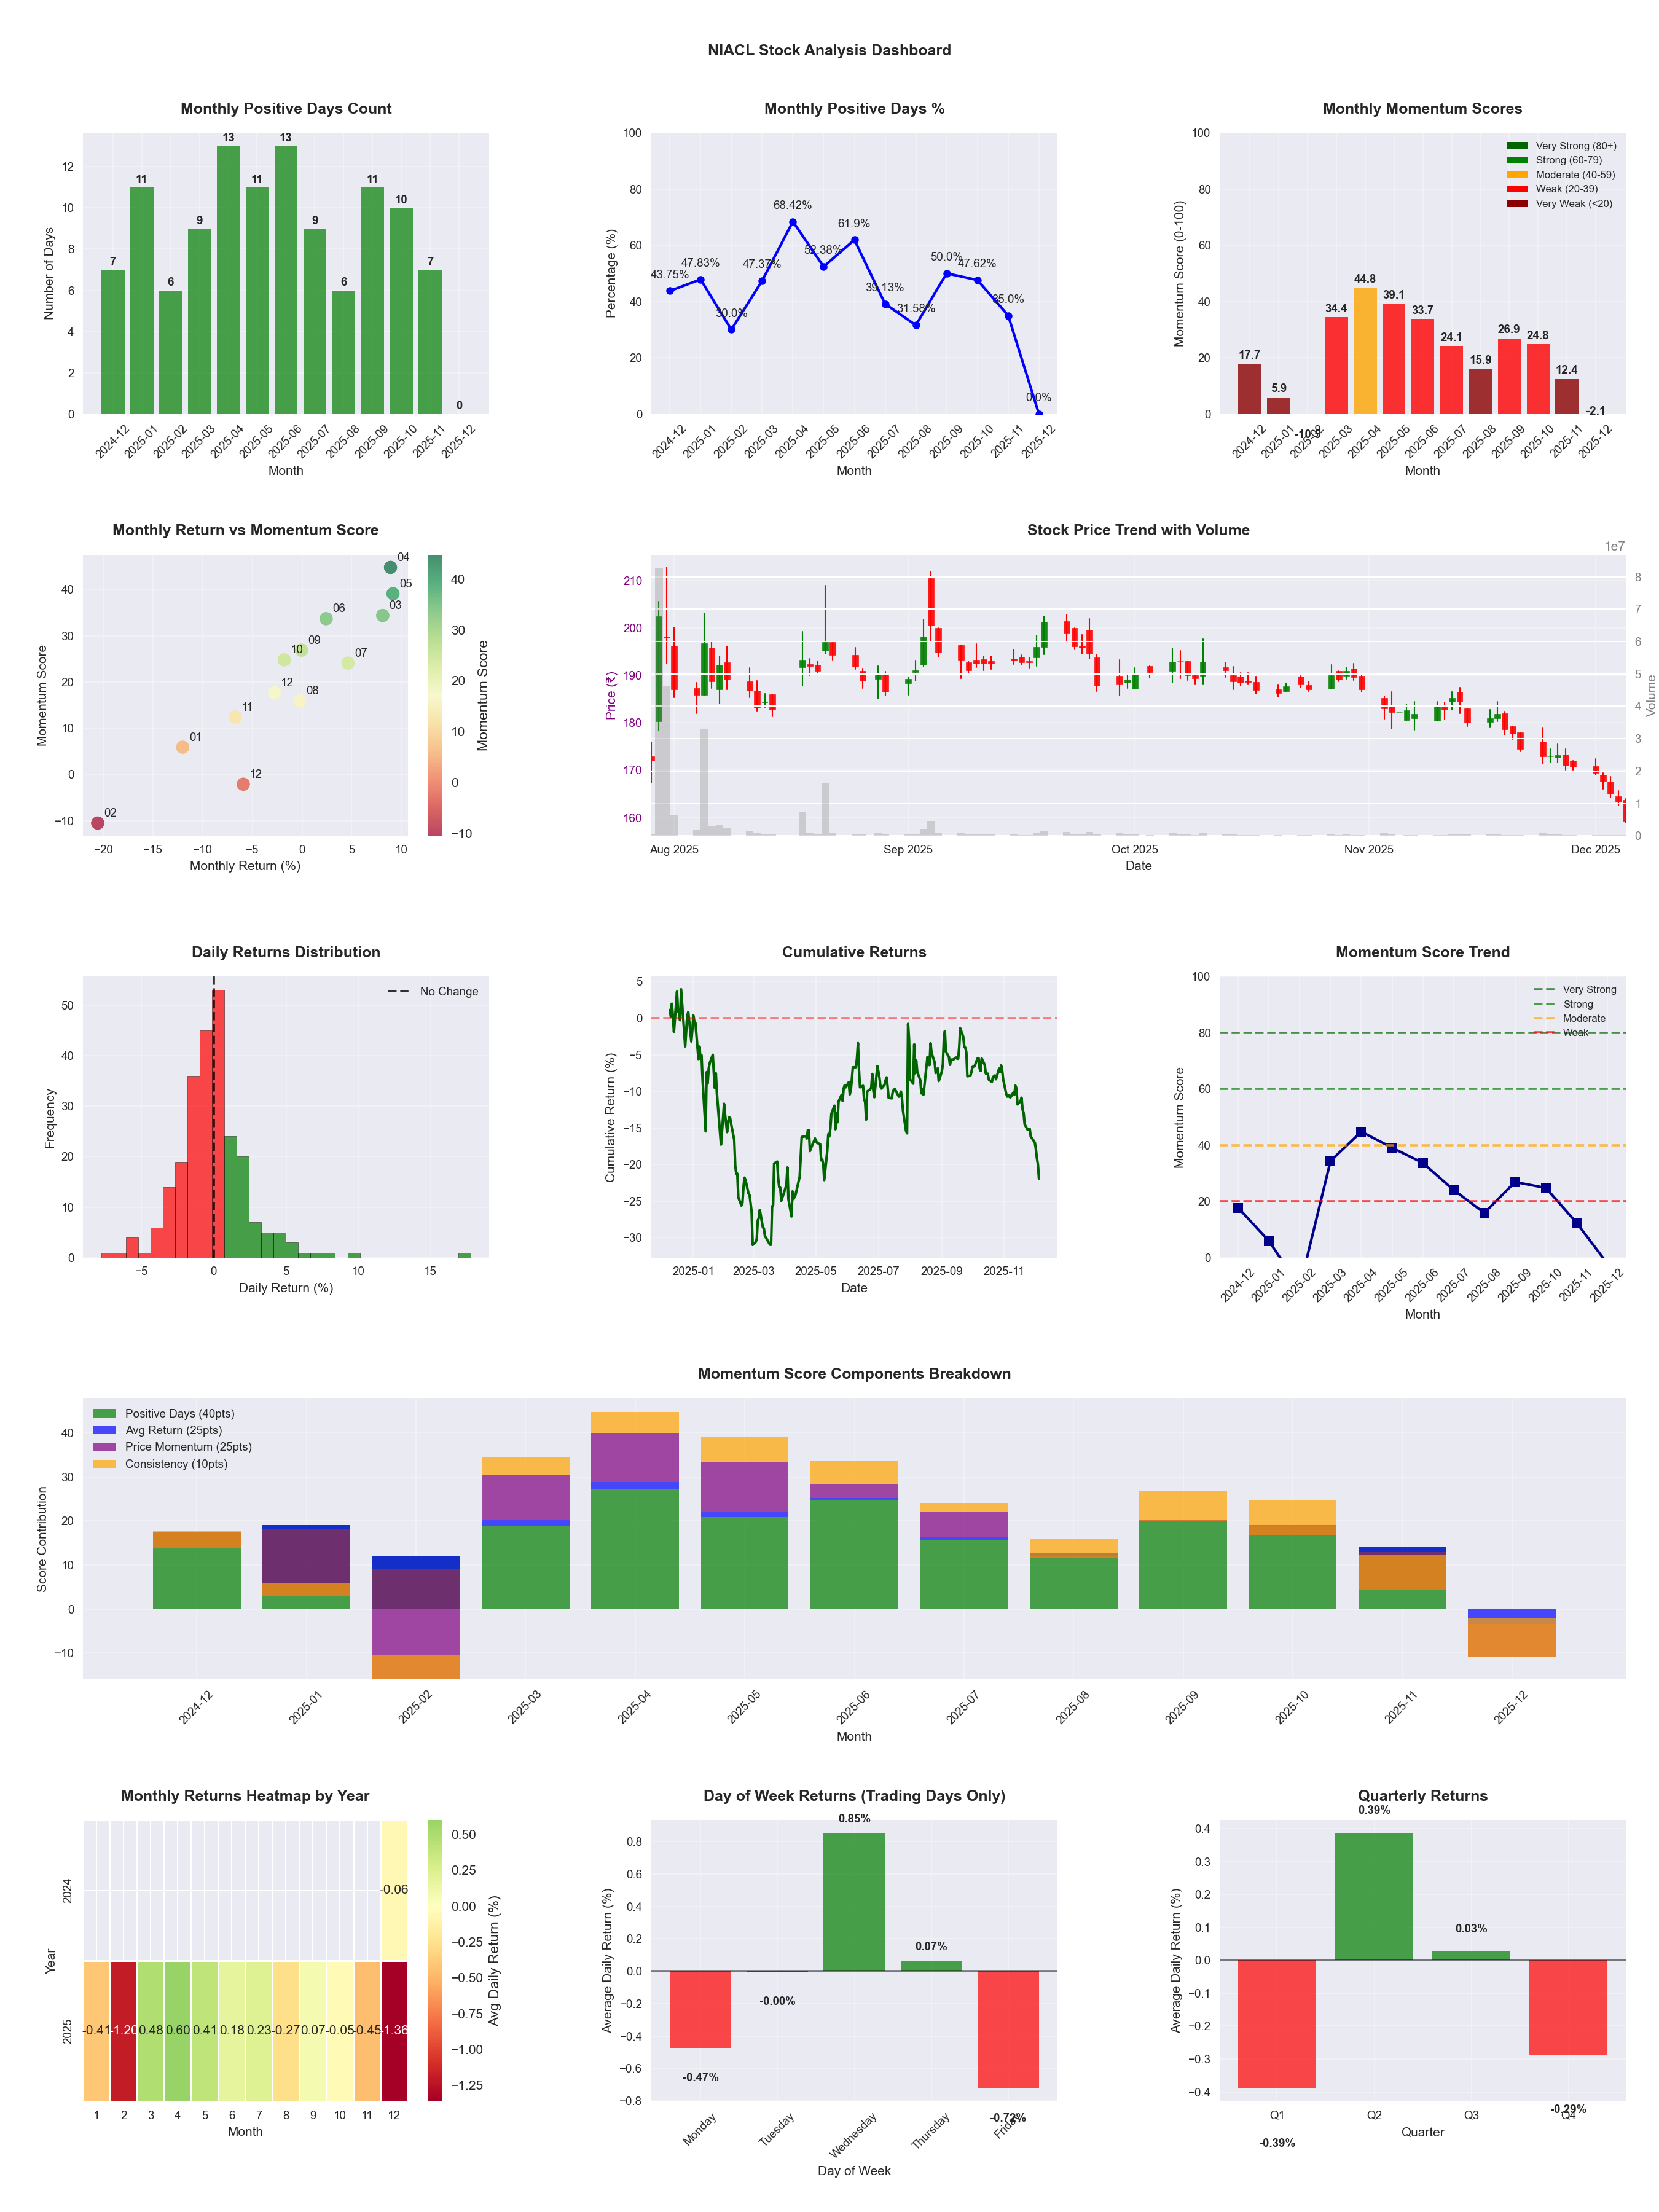
📊 Key Insights & Metrics
Symbol
📈 NIACL
Date
📅 2026-04-11
Volatility
🟡 2.57%
Risk Profile
⚠️ suitable for aggressive investors
Win Rate
⚠️ 45.5%
Avg Daily Return
📈 +0.03%
Max Drawdown
📉 -41.82%
IBD RS Score
📊 46.5
Weak
Market Rank
#264
Best Month
🏆 2026-04
Best Months to Trade
📅 Apr, May, Jul
Best Days to Trade
📅 Wednesday, Tuesday
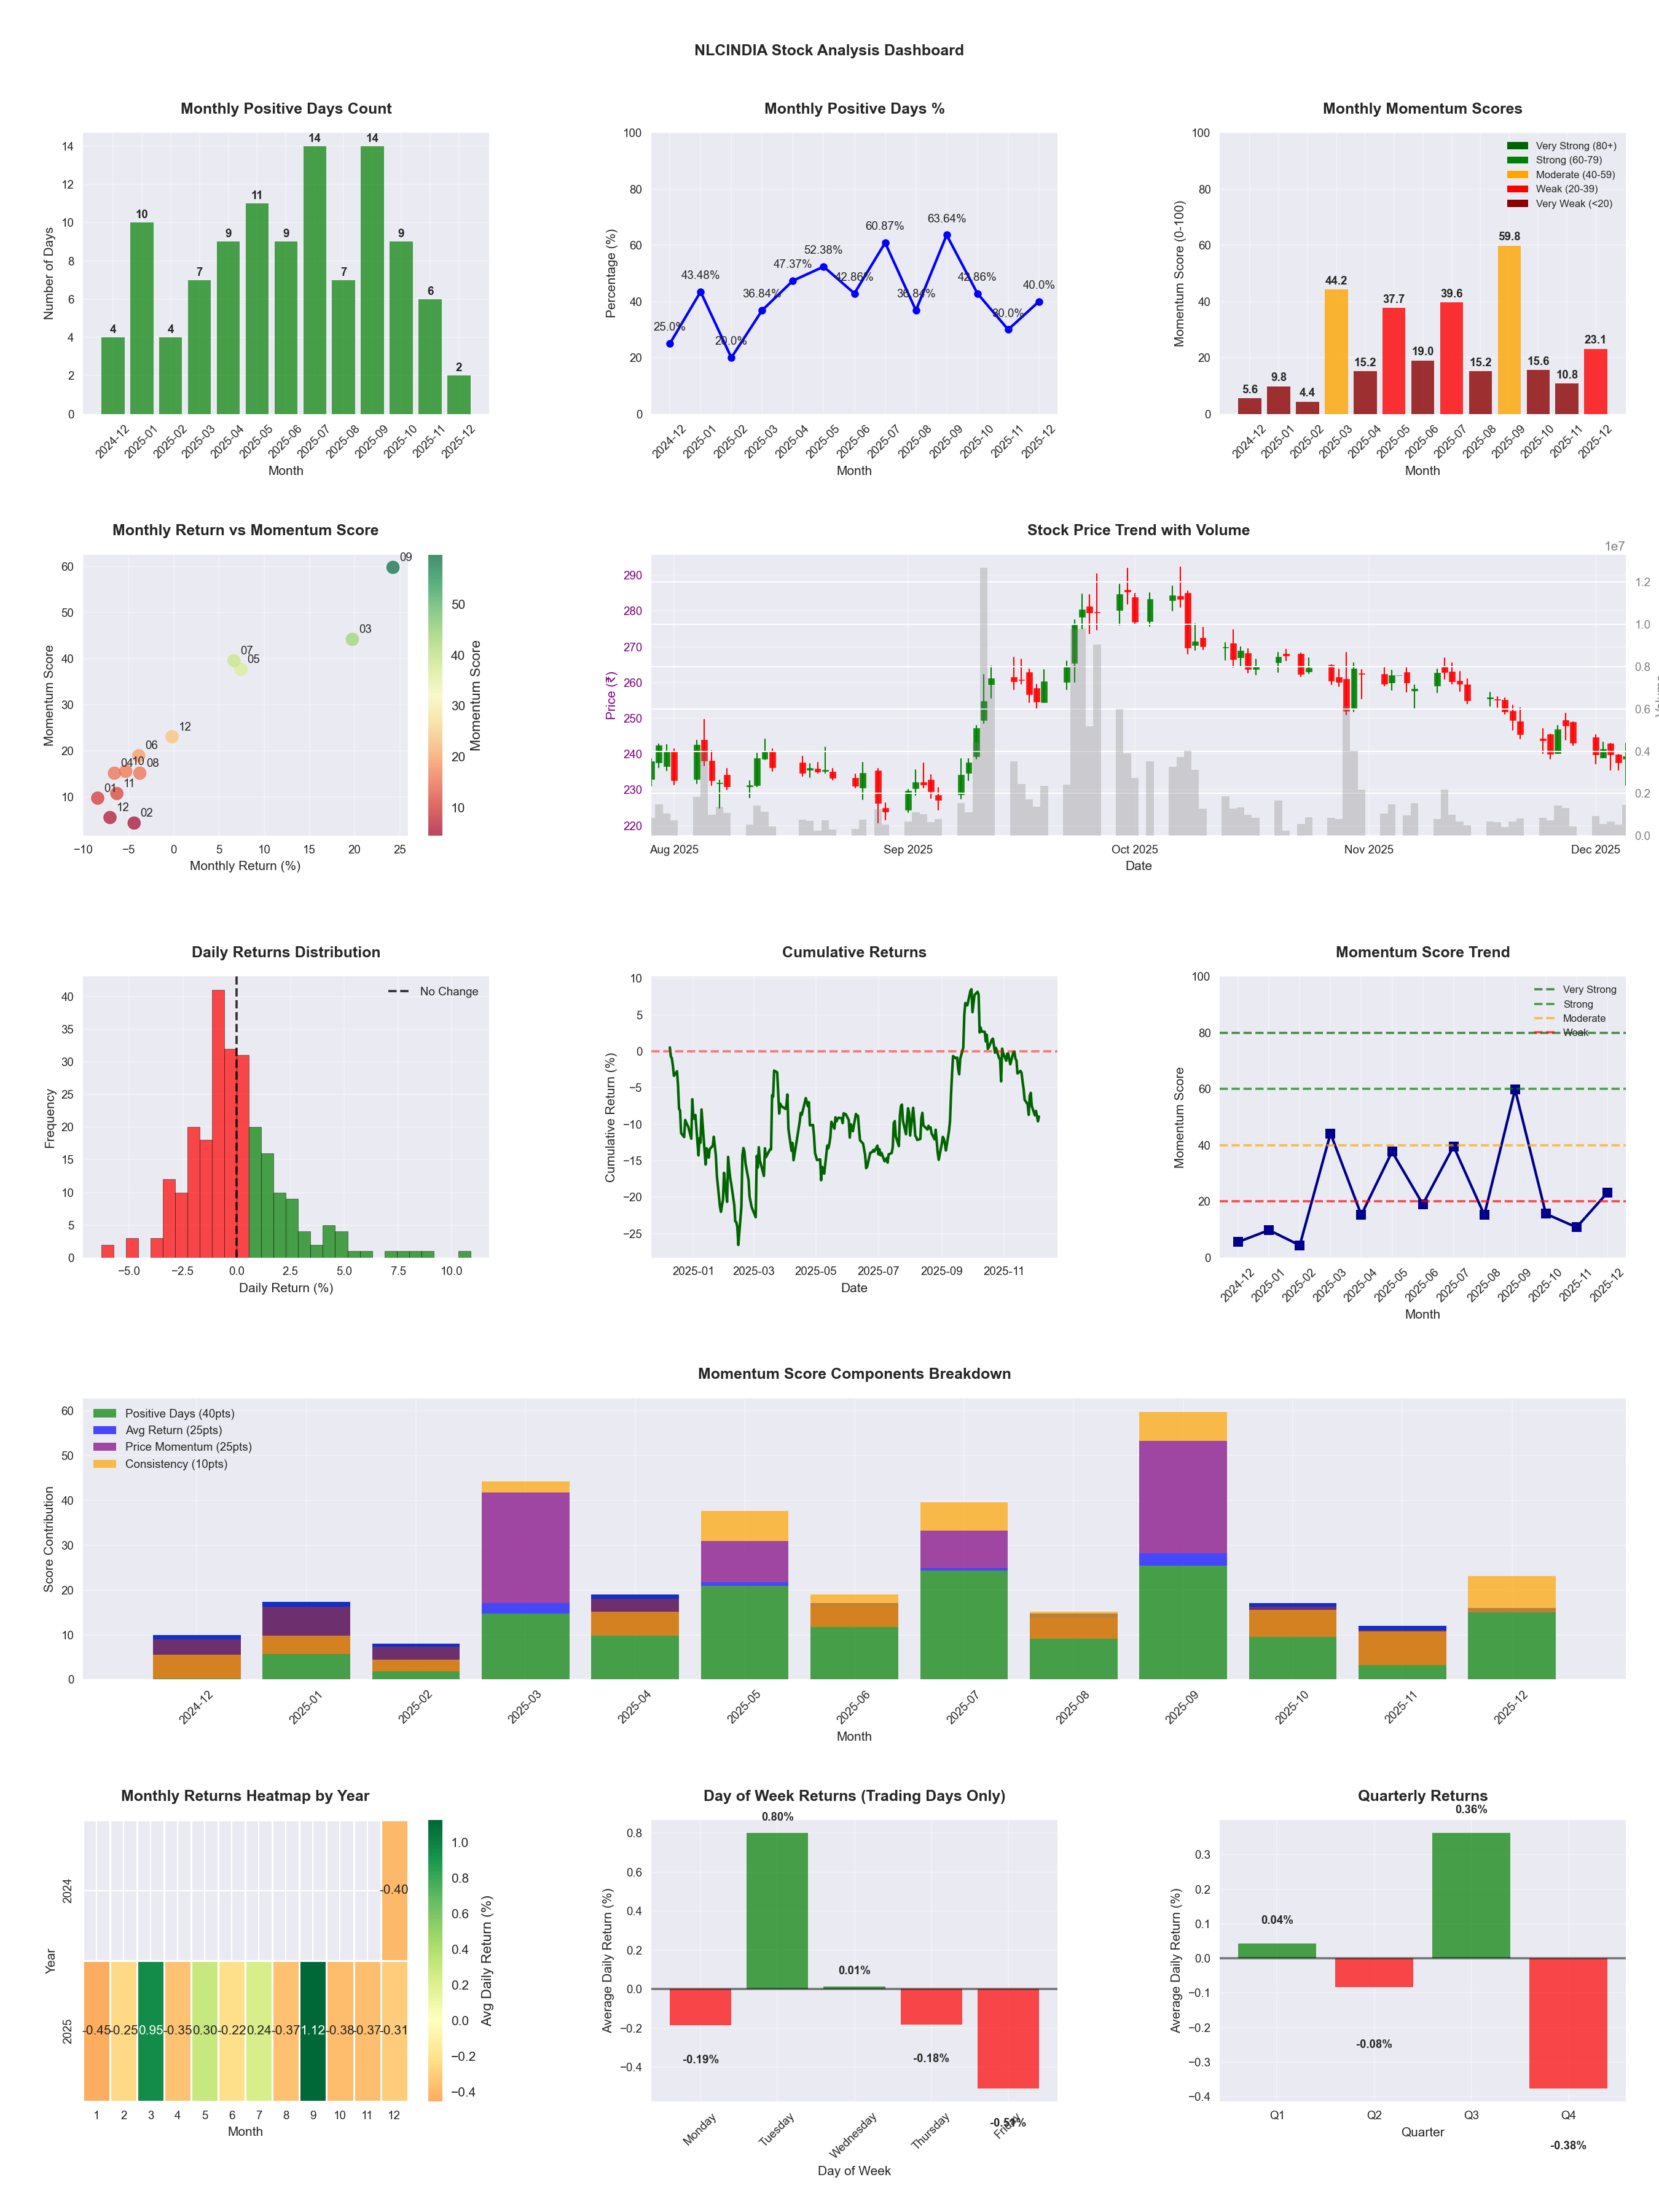
📊 Key Insights & Metrics
Symbol
📈 NLCINDIA
Date
📅 2026-04-11
Volatility
🟡 1.97%
Win Rate
⚠️ 46.3%
Avg Daily Return
📈 +0.09%
Max Drawdown
📉 -17.20%
IBD RS Score
📊 76.5
Strong
Market Rank
#116
Best Month
🏆 2025-09
Worst Month
📉 2026-04
Best Months to Trade
📅 Sep, May, Jan
Best Days to Trade
📅 Tuesday, Wednesday
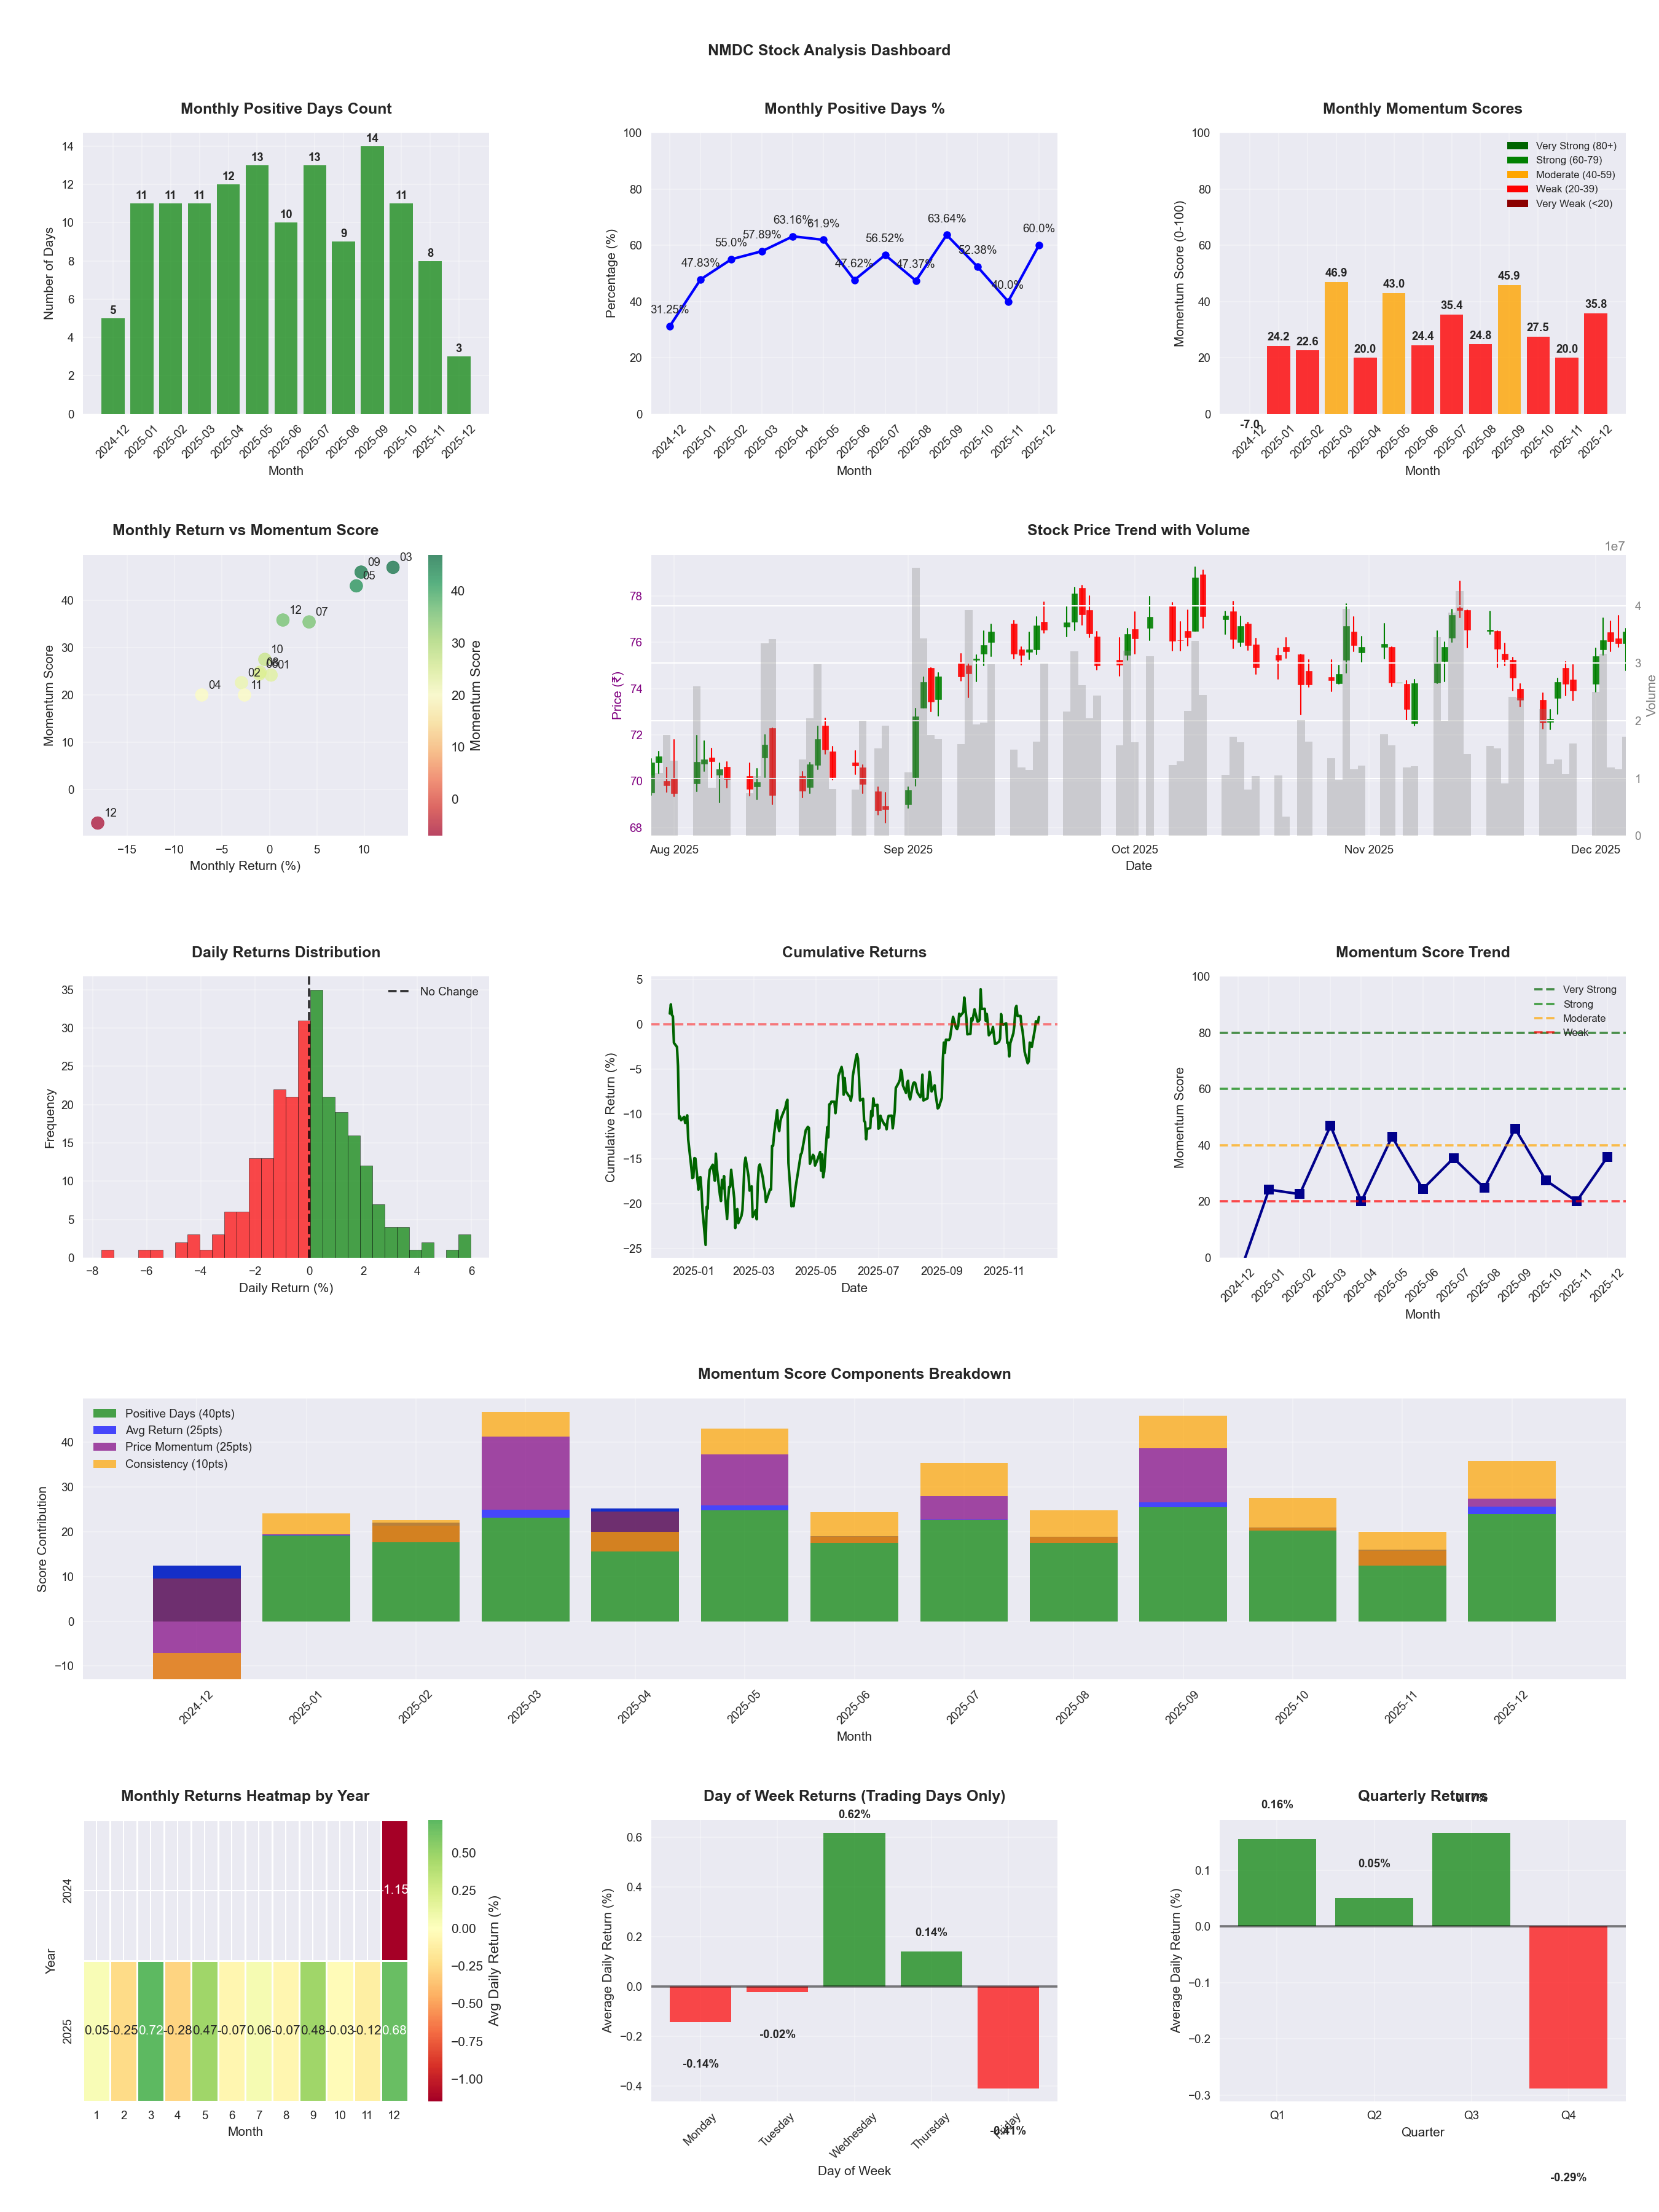
📊 Key Insights & Metrics
Symbol
📈 NMDC
Date
📅 2026-04-11
Volatility
🟡 1.76%
Win Rate
⚠️ 54.5%
Avg Daily Return
📈 +0.16%
Max Drawdown
📉 -11.37%
IBD RS Score
📊 88.0
Strong
Market Rank
#59
Best Month
🏆 2026-04
Worst Month
📉 2026-03
Best Months to Trade
📅 Apr, Dec, Sep
Best Days to Trade
📅 Wednesday, Tuesday
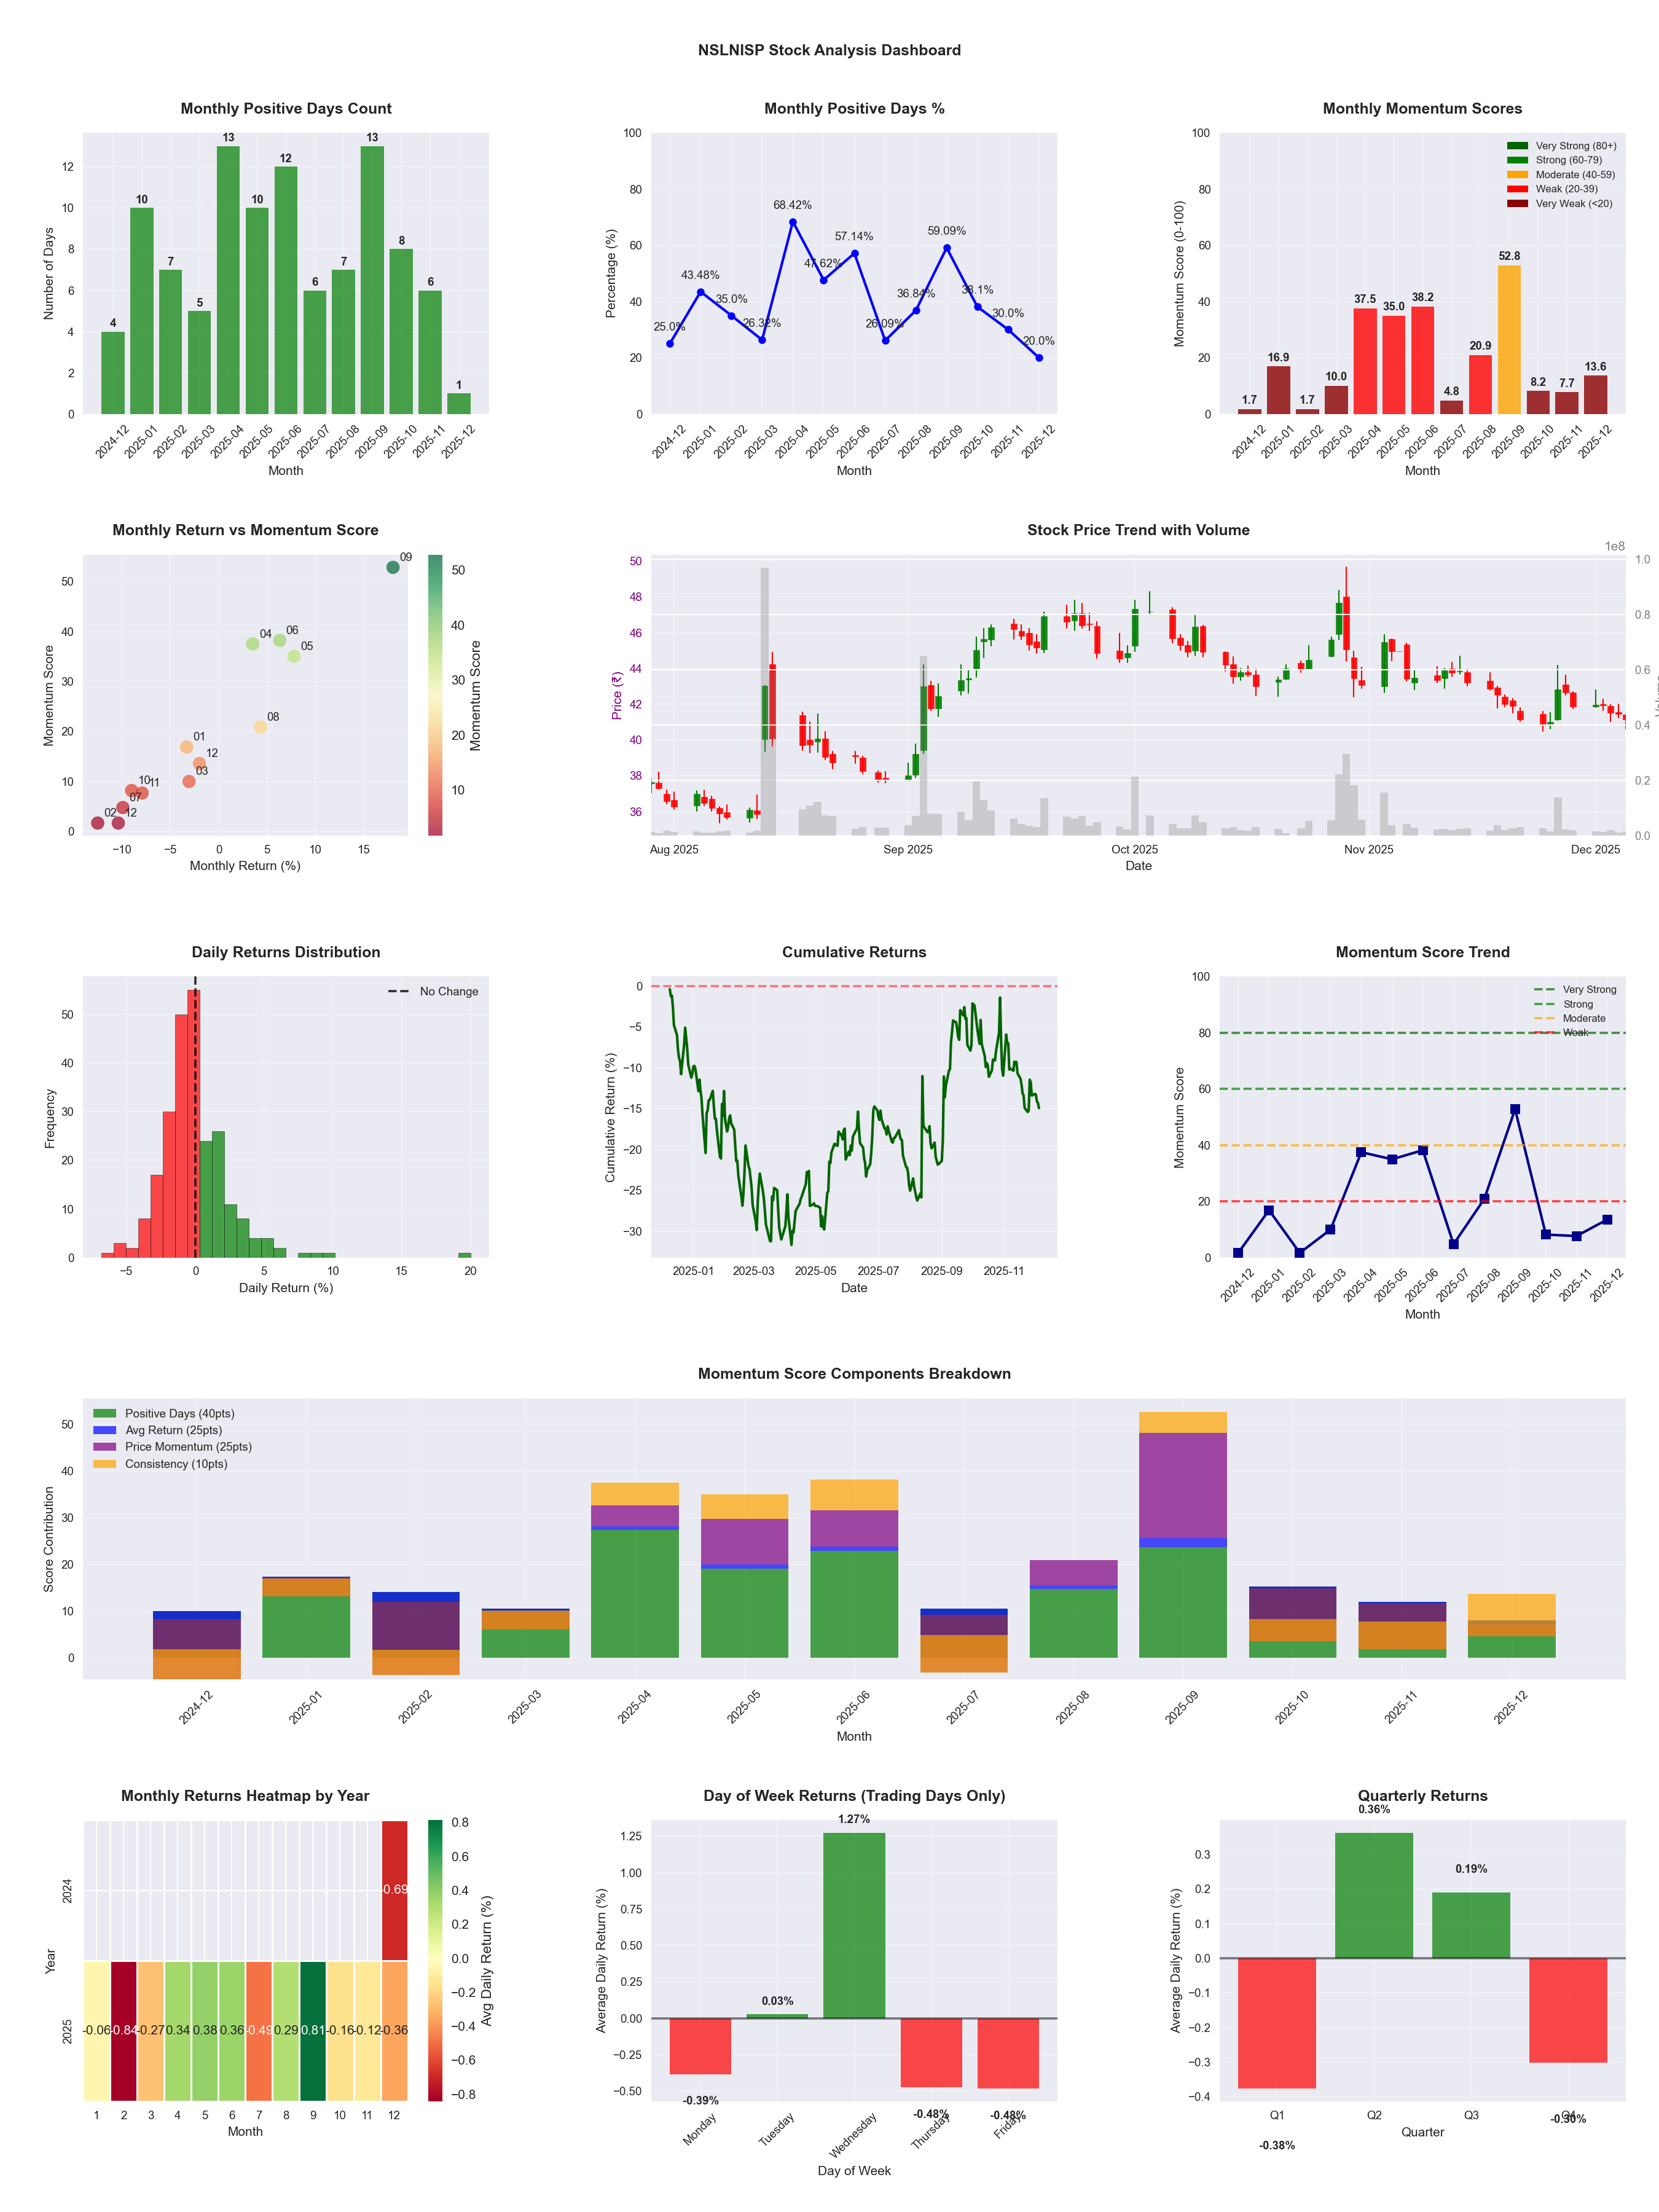
📊 Key Insights & Metrics
Symbol
📈 NSLNISP
Date
📅 2026-04-11
Volatility
🟡 2.56%
Risk Profile
⚠️ suitable for aggressive investors
Win Rate
⚠️ 46.8%
Avg Daily Return
📈 +0.10%
Max Drawdown
📉 -30.35%
IBD RS Score
📊 70.4
Strong
Market Rank
#146
Best Month
🏆 2026-04
Worst Month
📉 2026-03
Best Months to Trade
📅 Apr, Sep, May
Best Days to Trade
📅 Wednesday, Tuesday
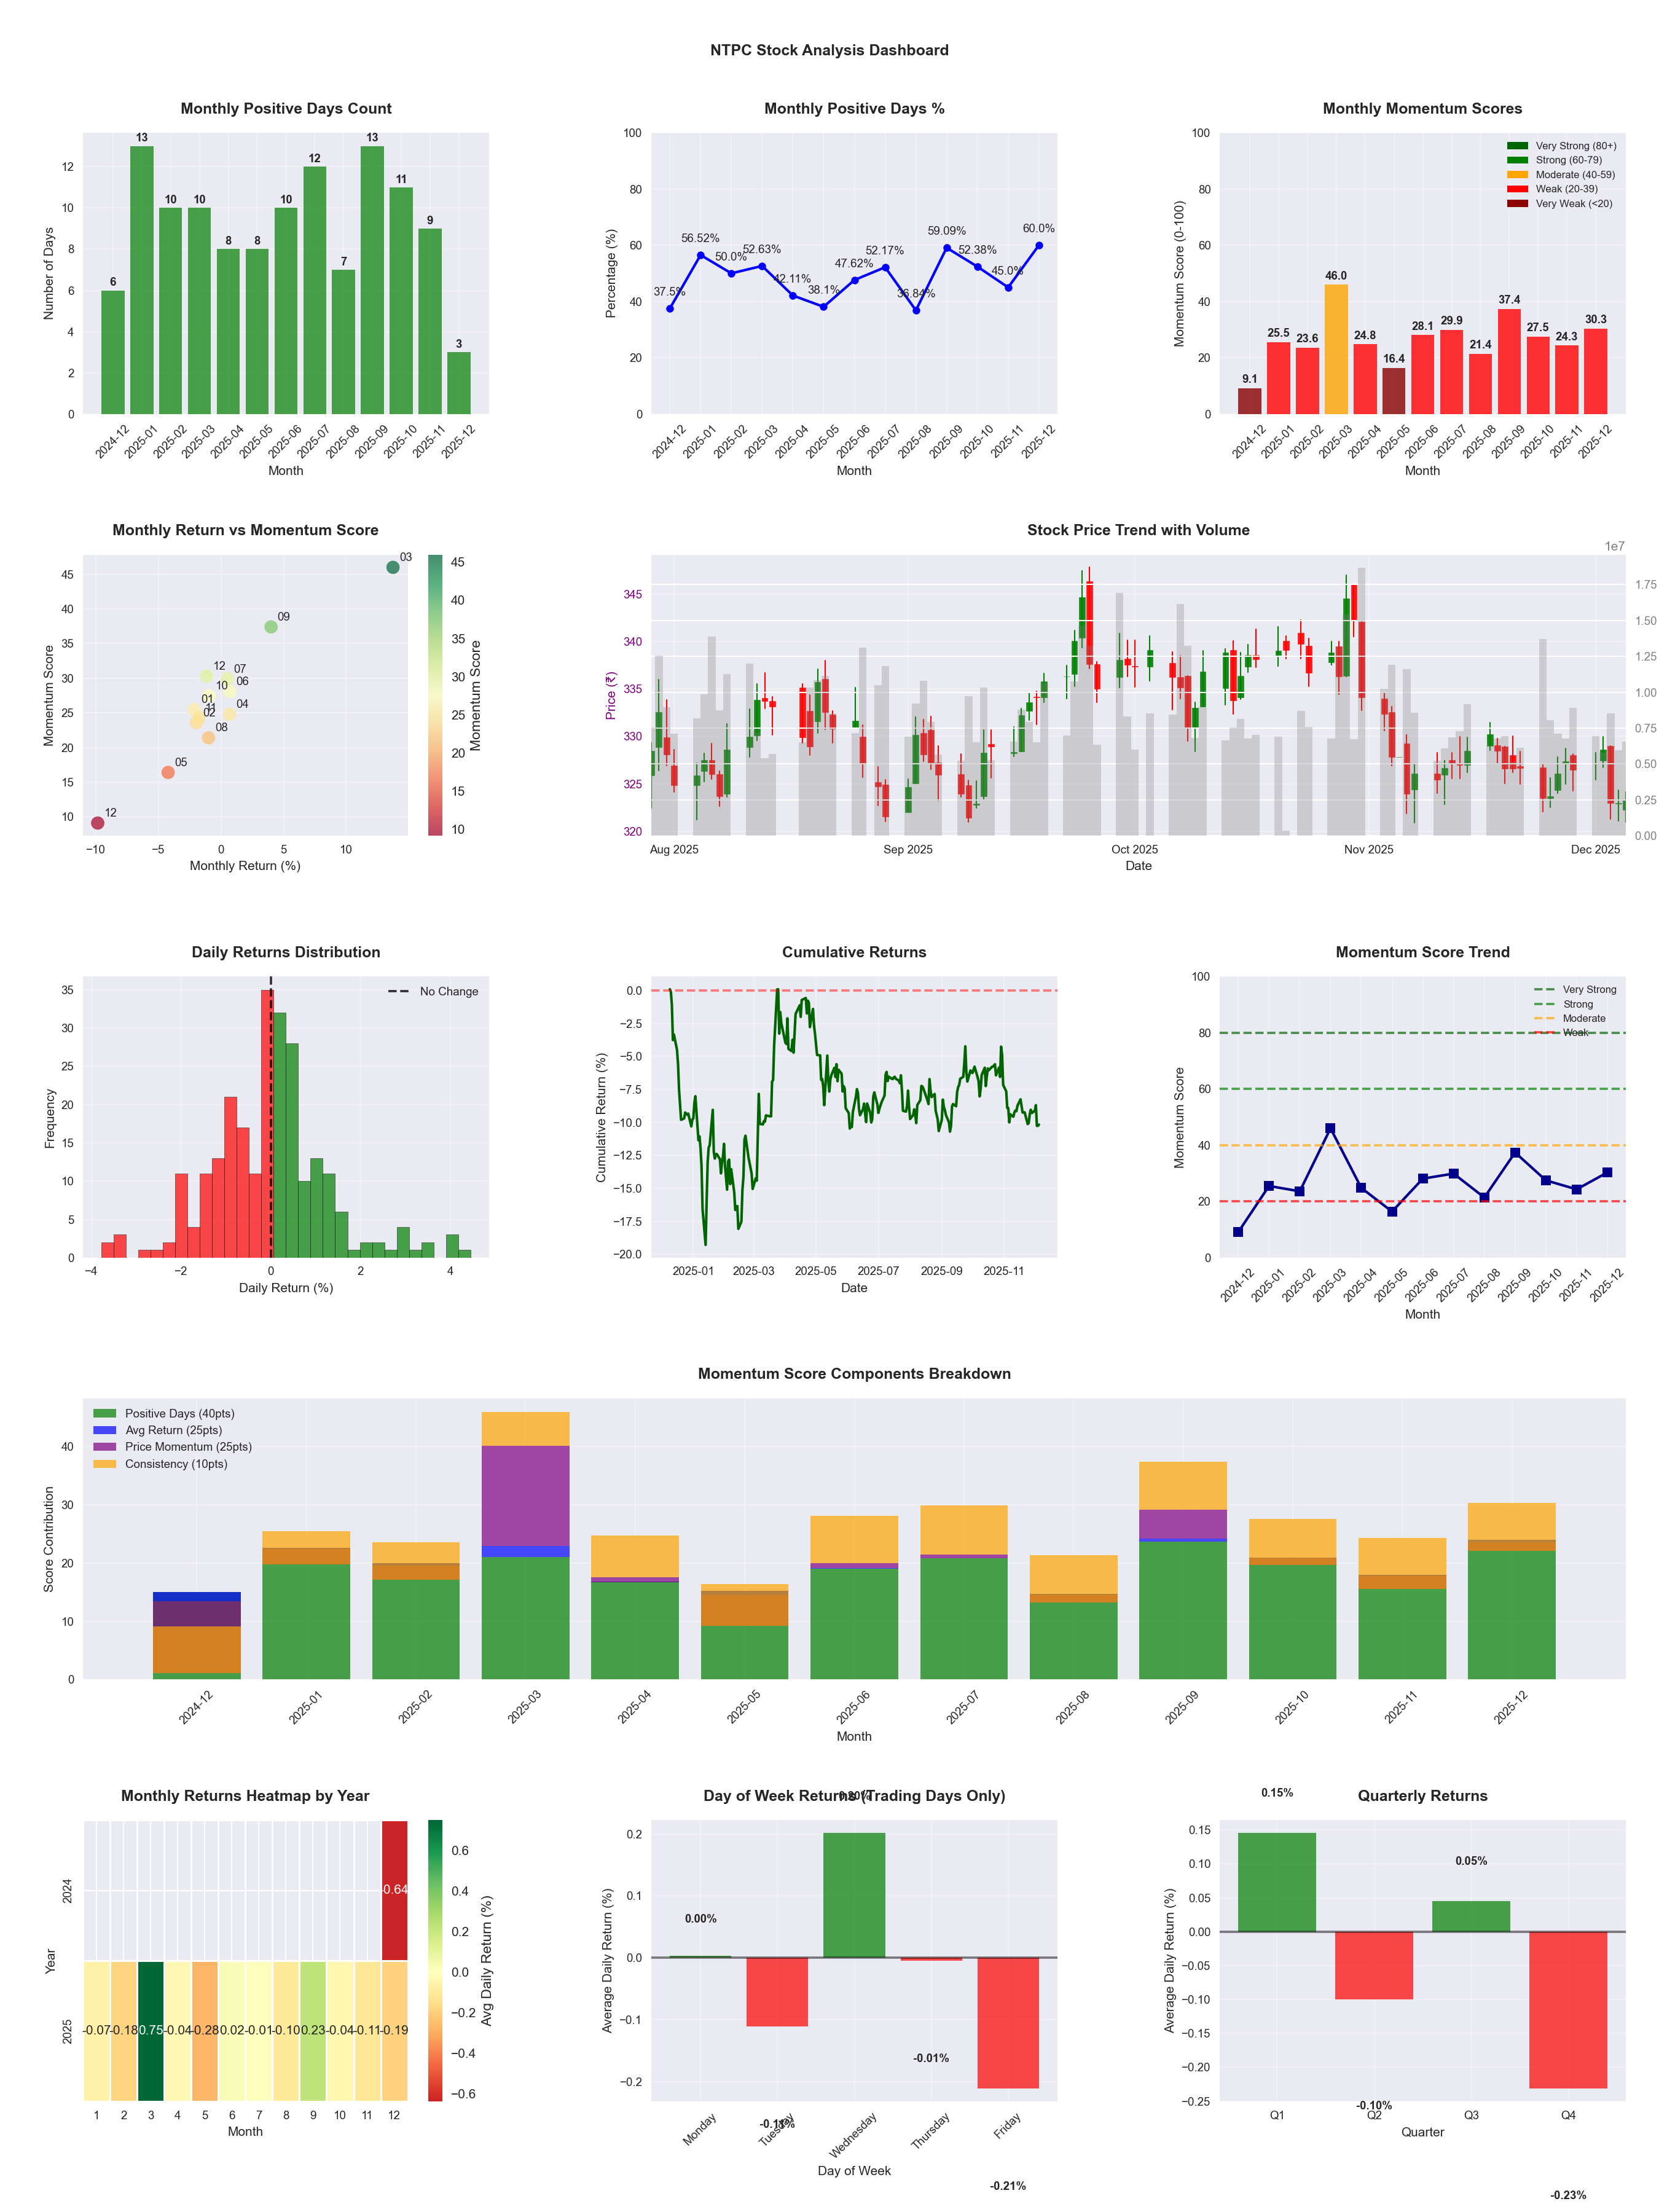
📊 Key Insights & Metrics
Symbol
📈 NTPC
Date
📅 2026-04-11
Volatility
🟢 1.15%
Win Rate
⚠️ 50.0%
Avg Daily Return
📈 +0.04%
Max Drawdown
📉 -11.00%
IBD RS Score
📊 80.3
Strong
Market Rank
#97
Best Month
🏆 2026-04
Worst Month
📉 2025-05
Best Months to Trade
📅 Feb, Jan, Sep
Best Days to Trade
📅 Wednesday, Tuesday
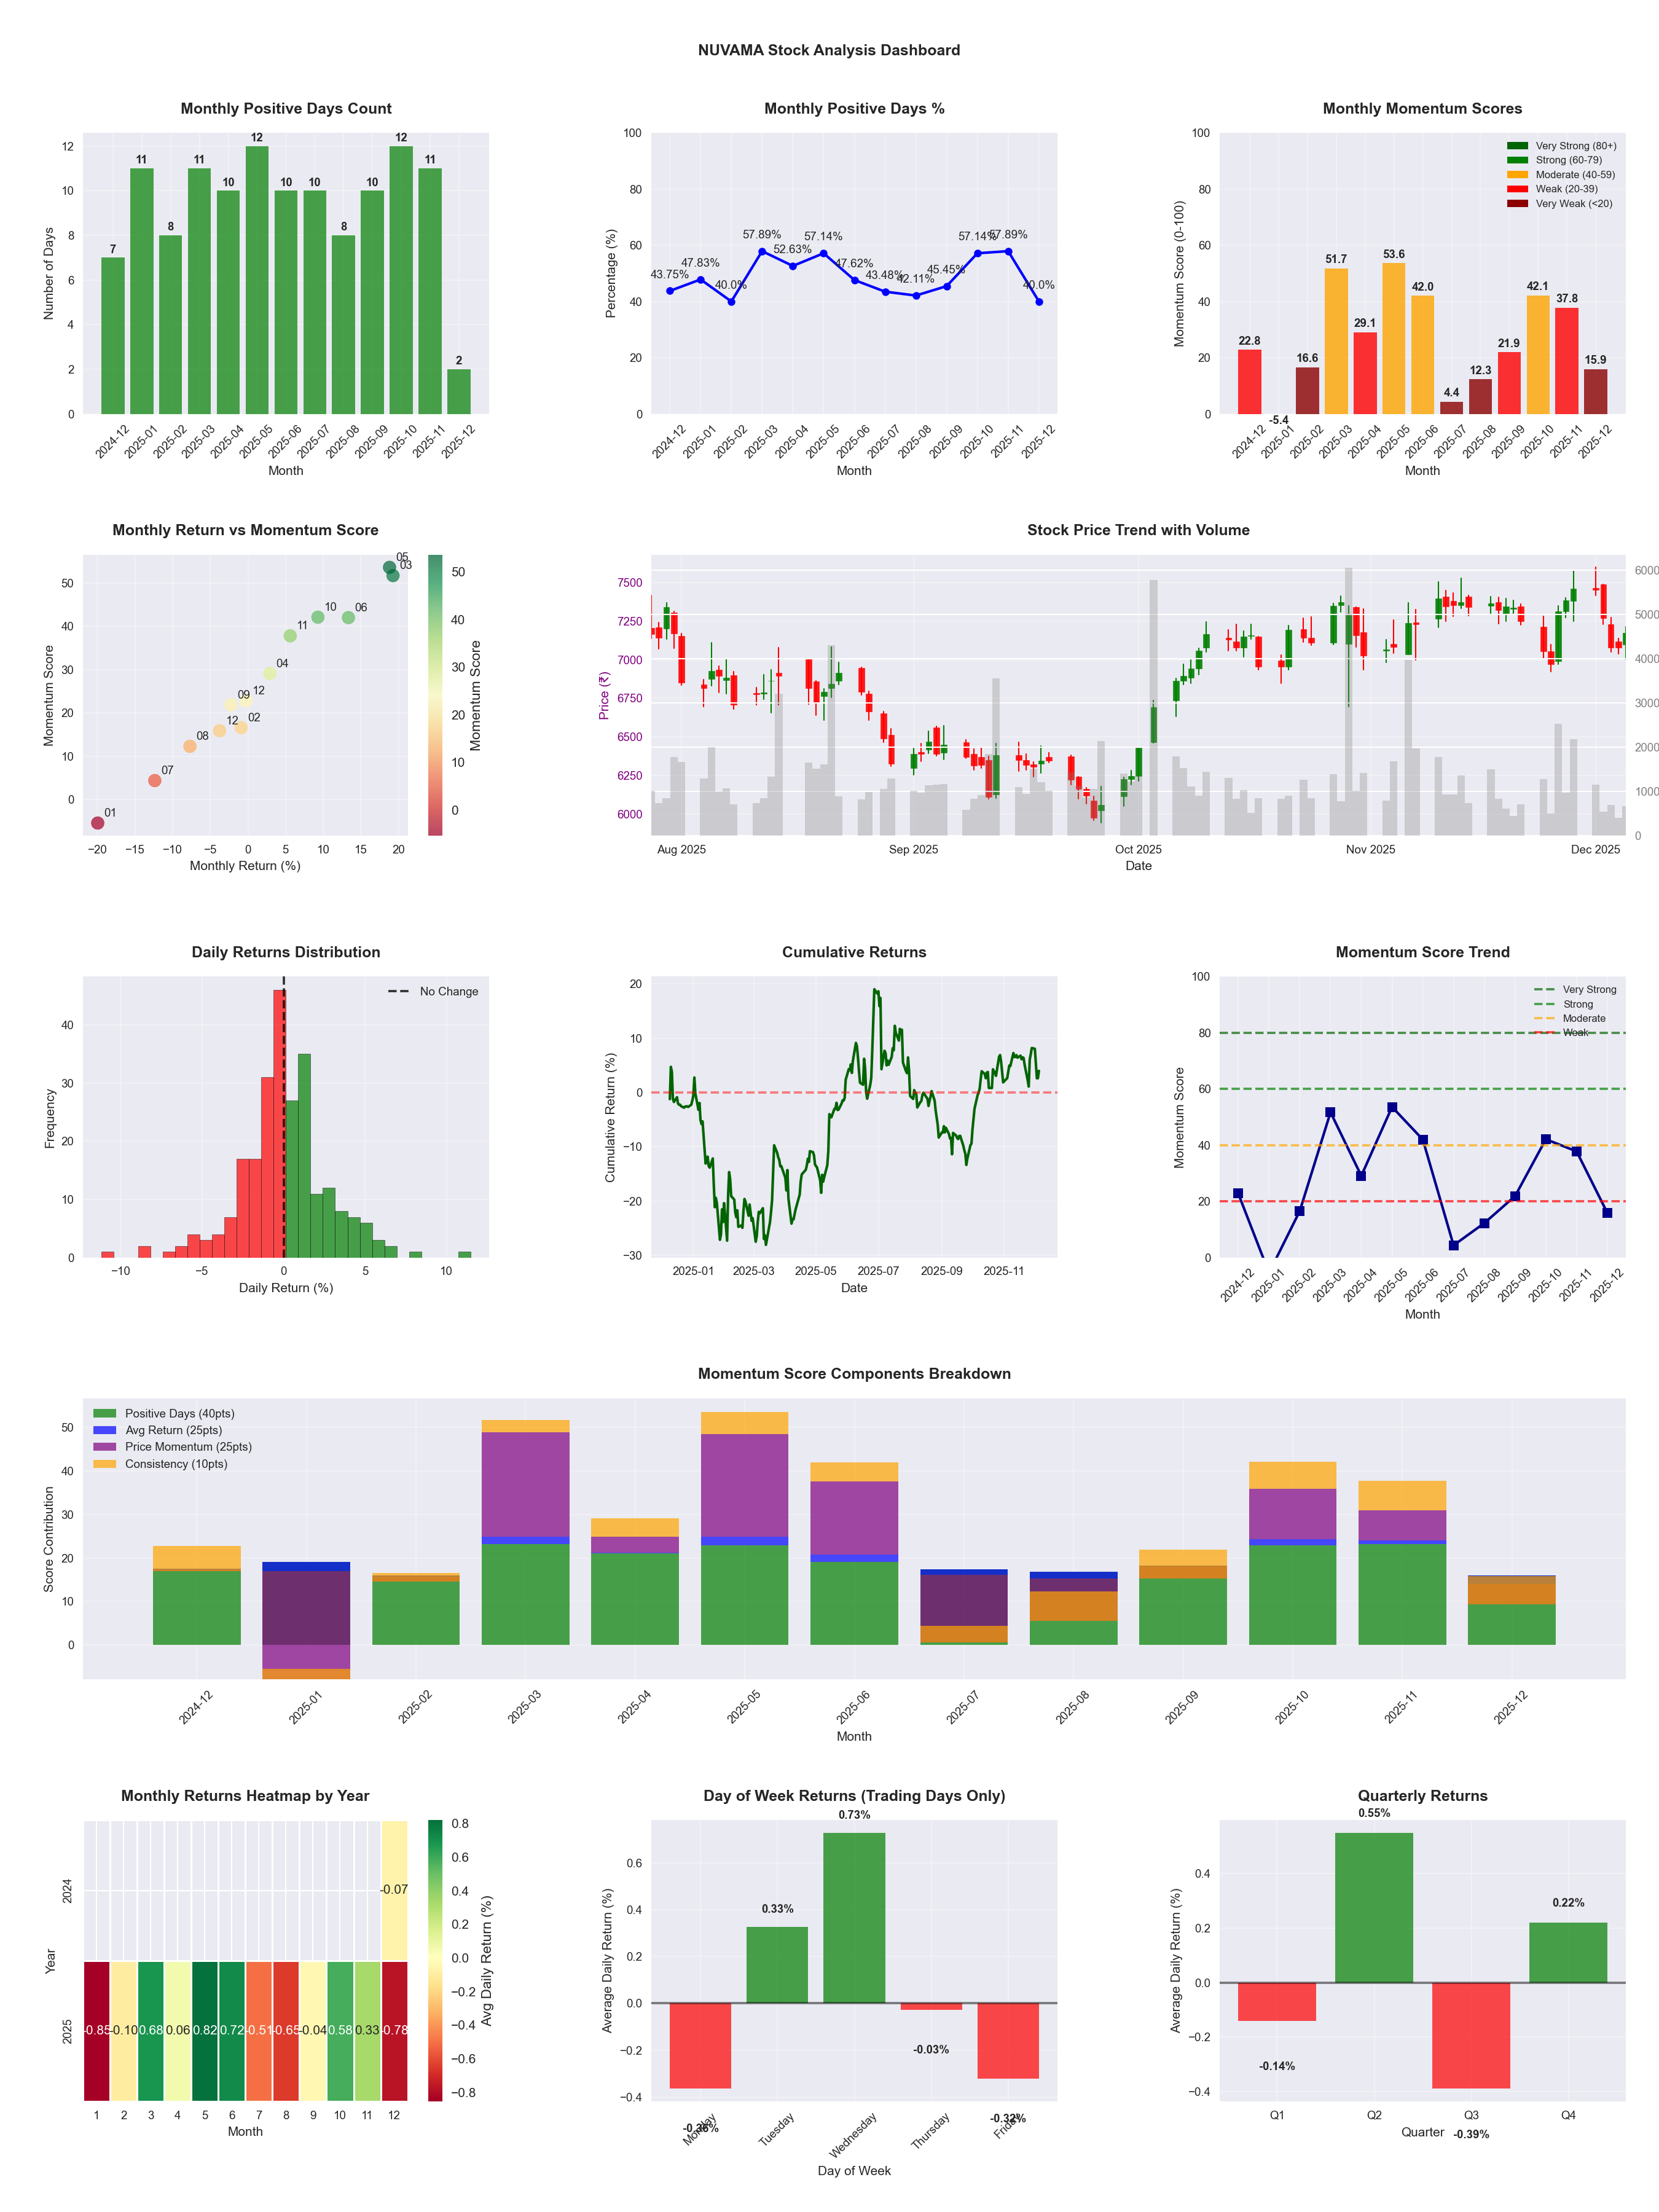
📊 Key Insights & Metrics
Symbol
📈 NUVAMA
Date
📅 2026-04-11
Volatility
🟡 2.32%
Risk Profile
⚠️ suitable for aggressive investors
Win Rate
⚠️ 49.0%
Avg Daily Return
📈 +0.14%
Max Drawdown
📉 -29.70%
IBD RS Score
📊 59.6
Average
Market Rank
#199
Best Month
🏆 2026-04
Worst Month
📉 2025-07
Best Months to Trade
📅 Apr, Jun, May
Best Days to Trade
📅 Wednesday, Tuesday
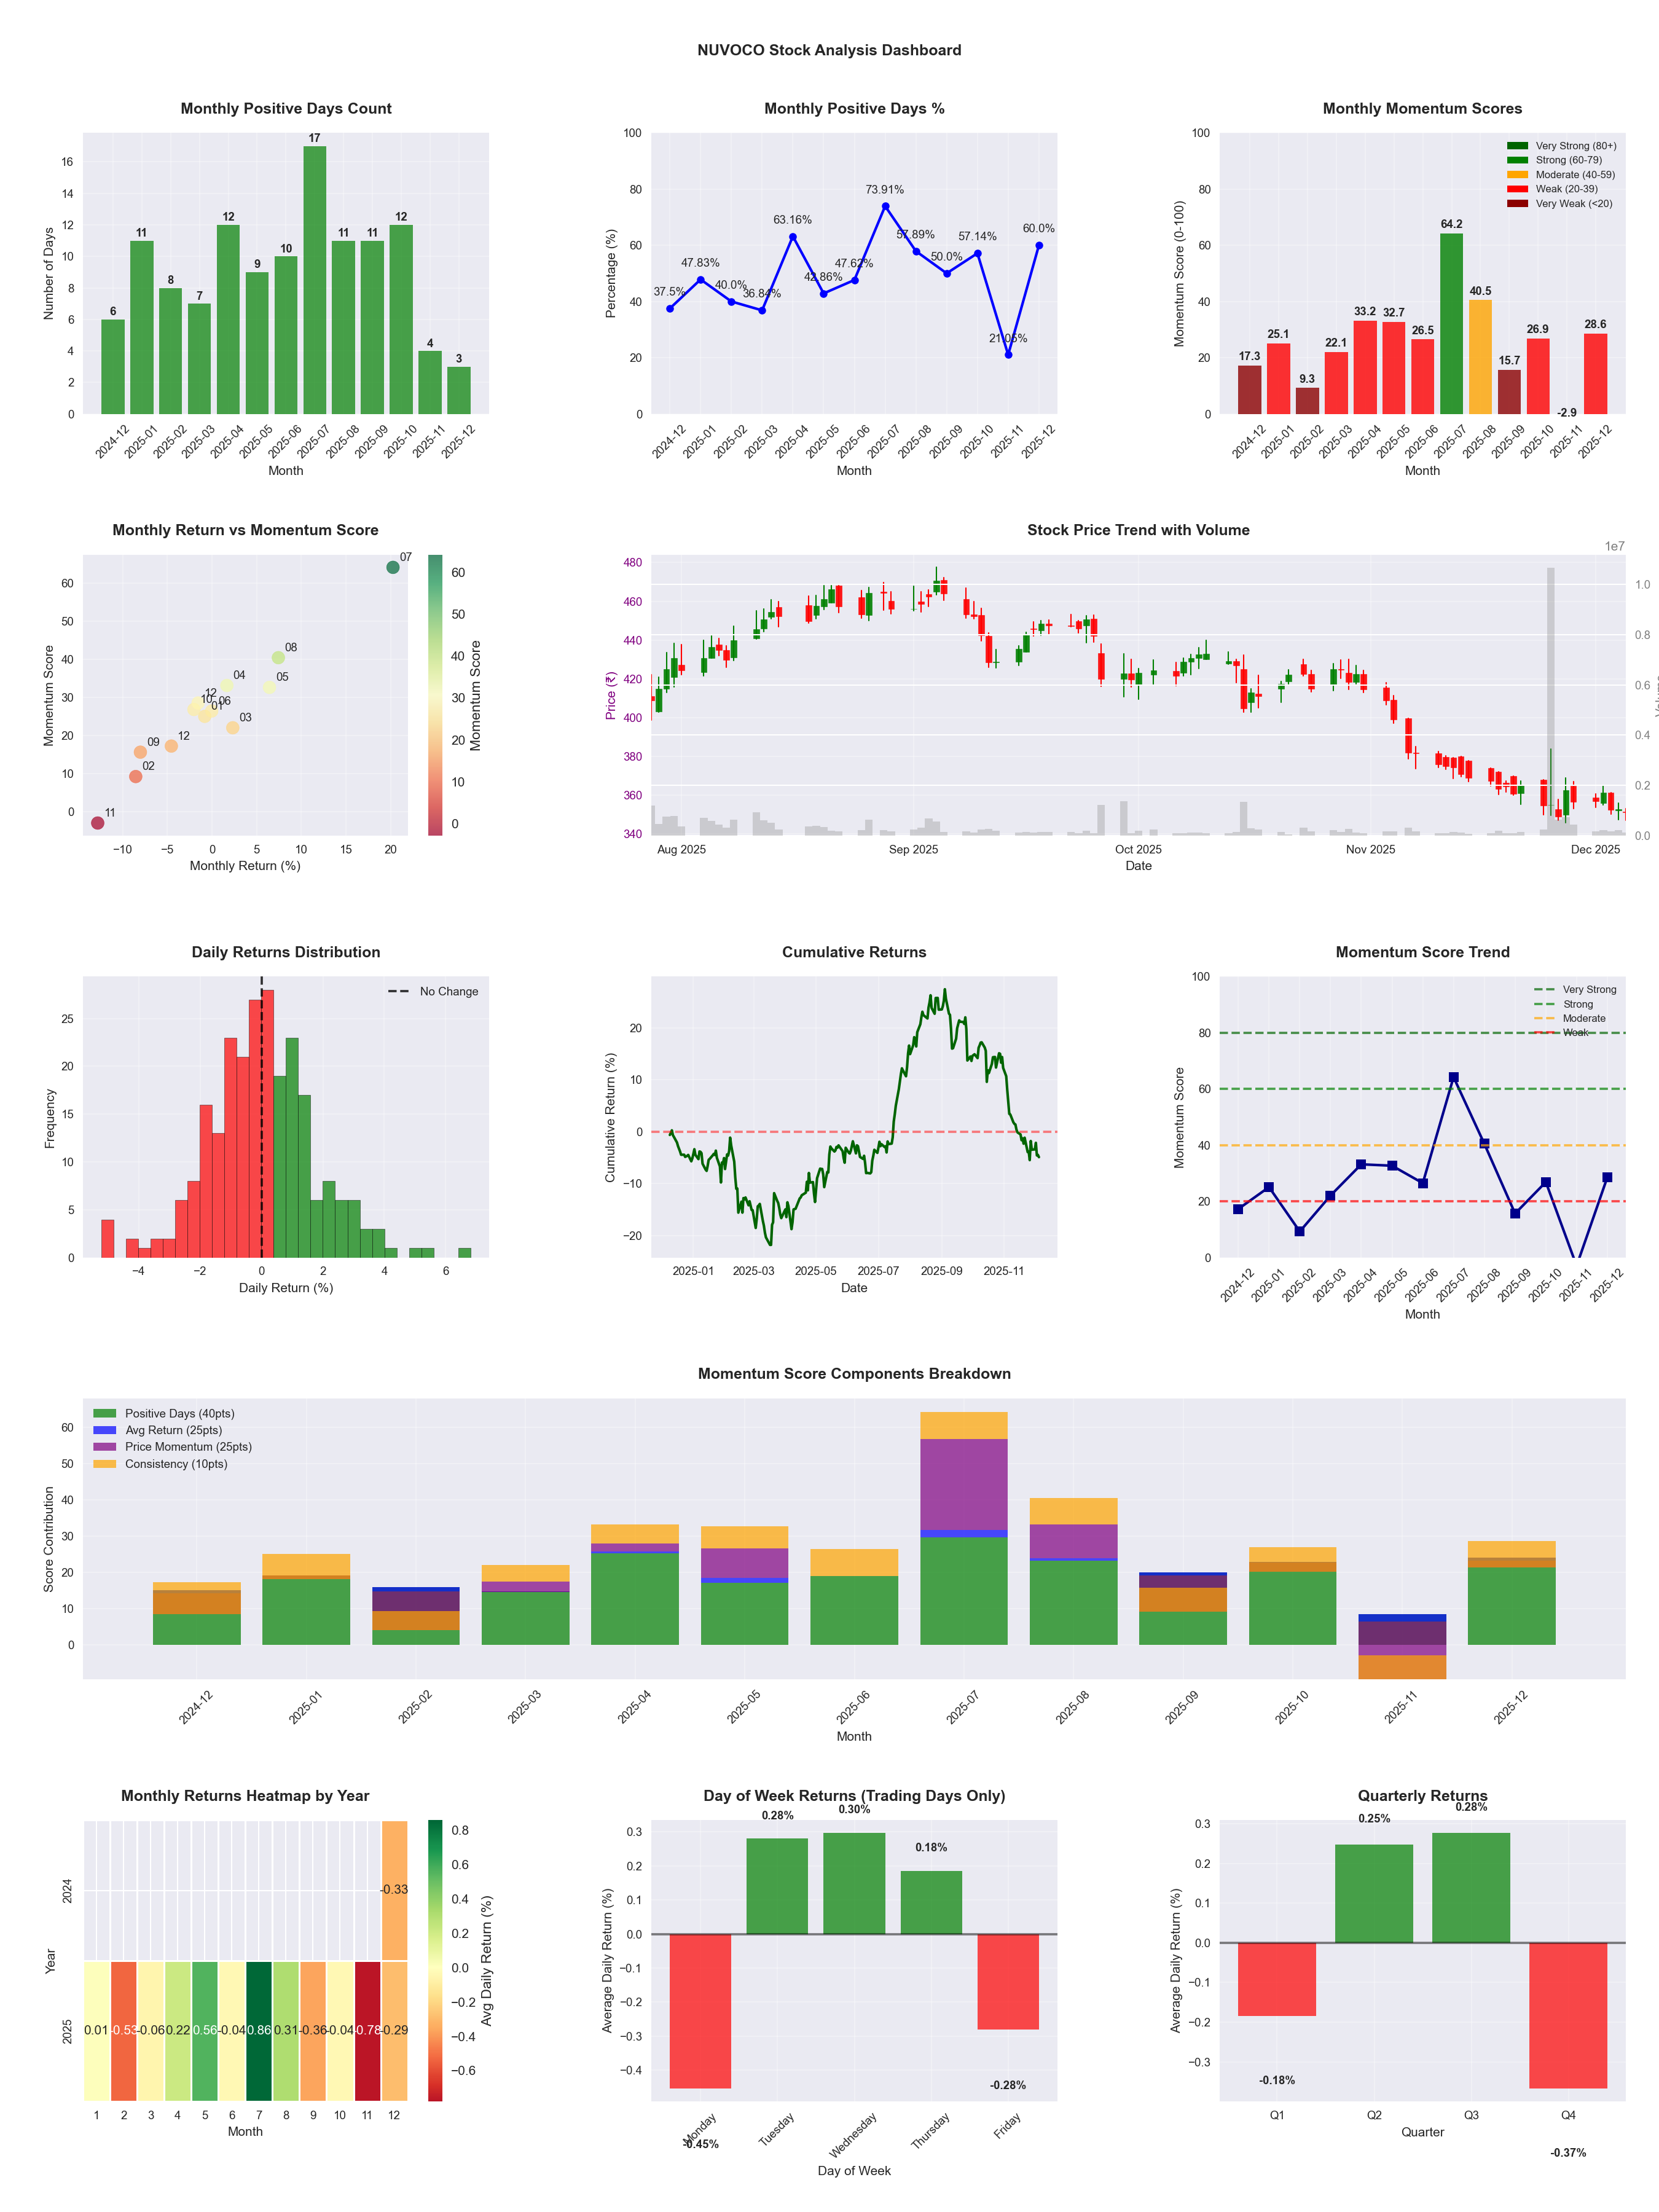
📊 Key Insights & Metrics
Symbol
📈 NUVOCO
Date
📅 2026-04-11
Volatility
🟡 1.81%
Win Rate
⚠️ 50.4%
Avg Daily Return
📈 +0.01%
Max Drawdown
📉 -40.27%
IBD RS Score
📊 30.0
Weak
Market Rank
#345
Best Month
🏆 2025-07
Best Months to Trade
📅 Jul, Apr, May
Best Days to Trade
📅 Wednesday, Tuesday
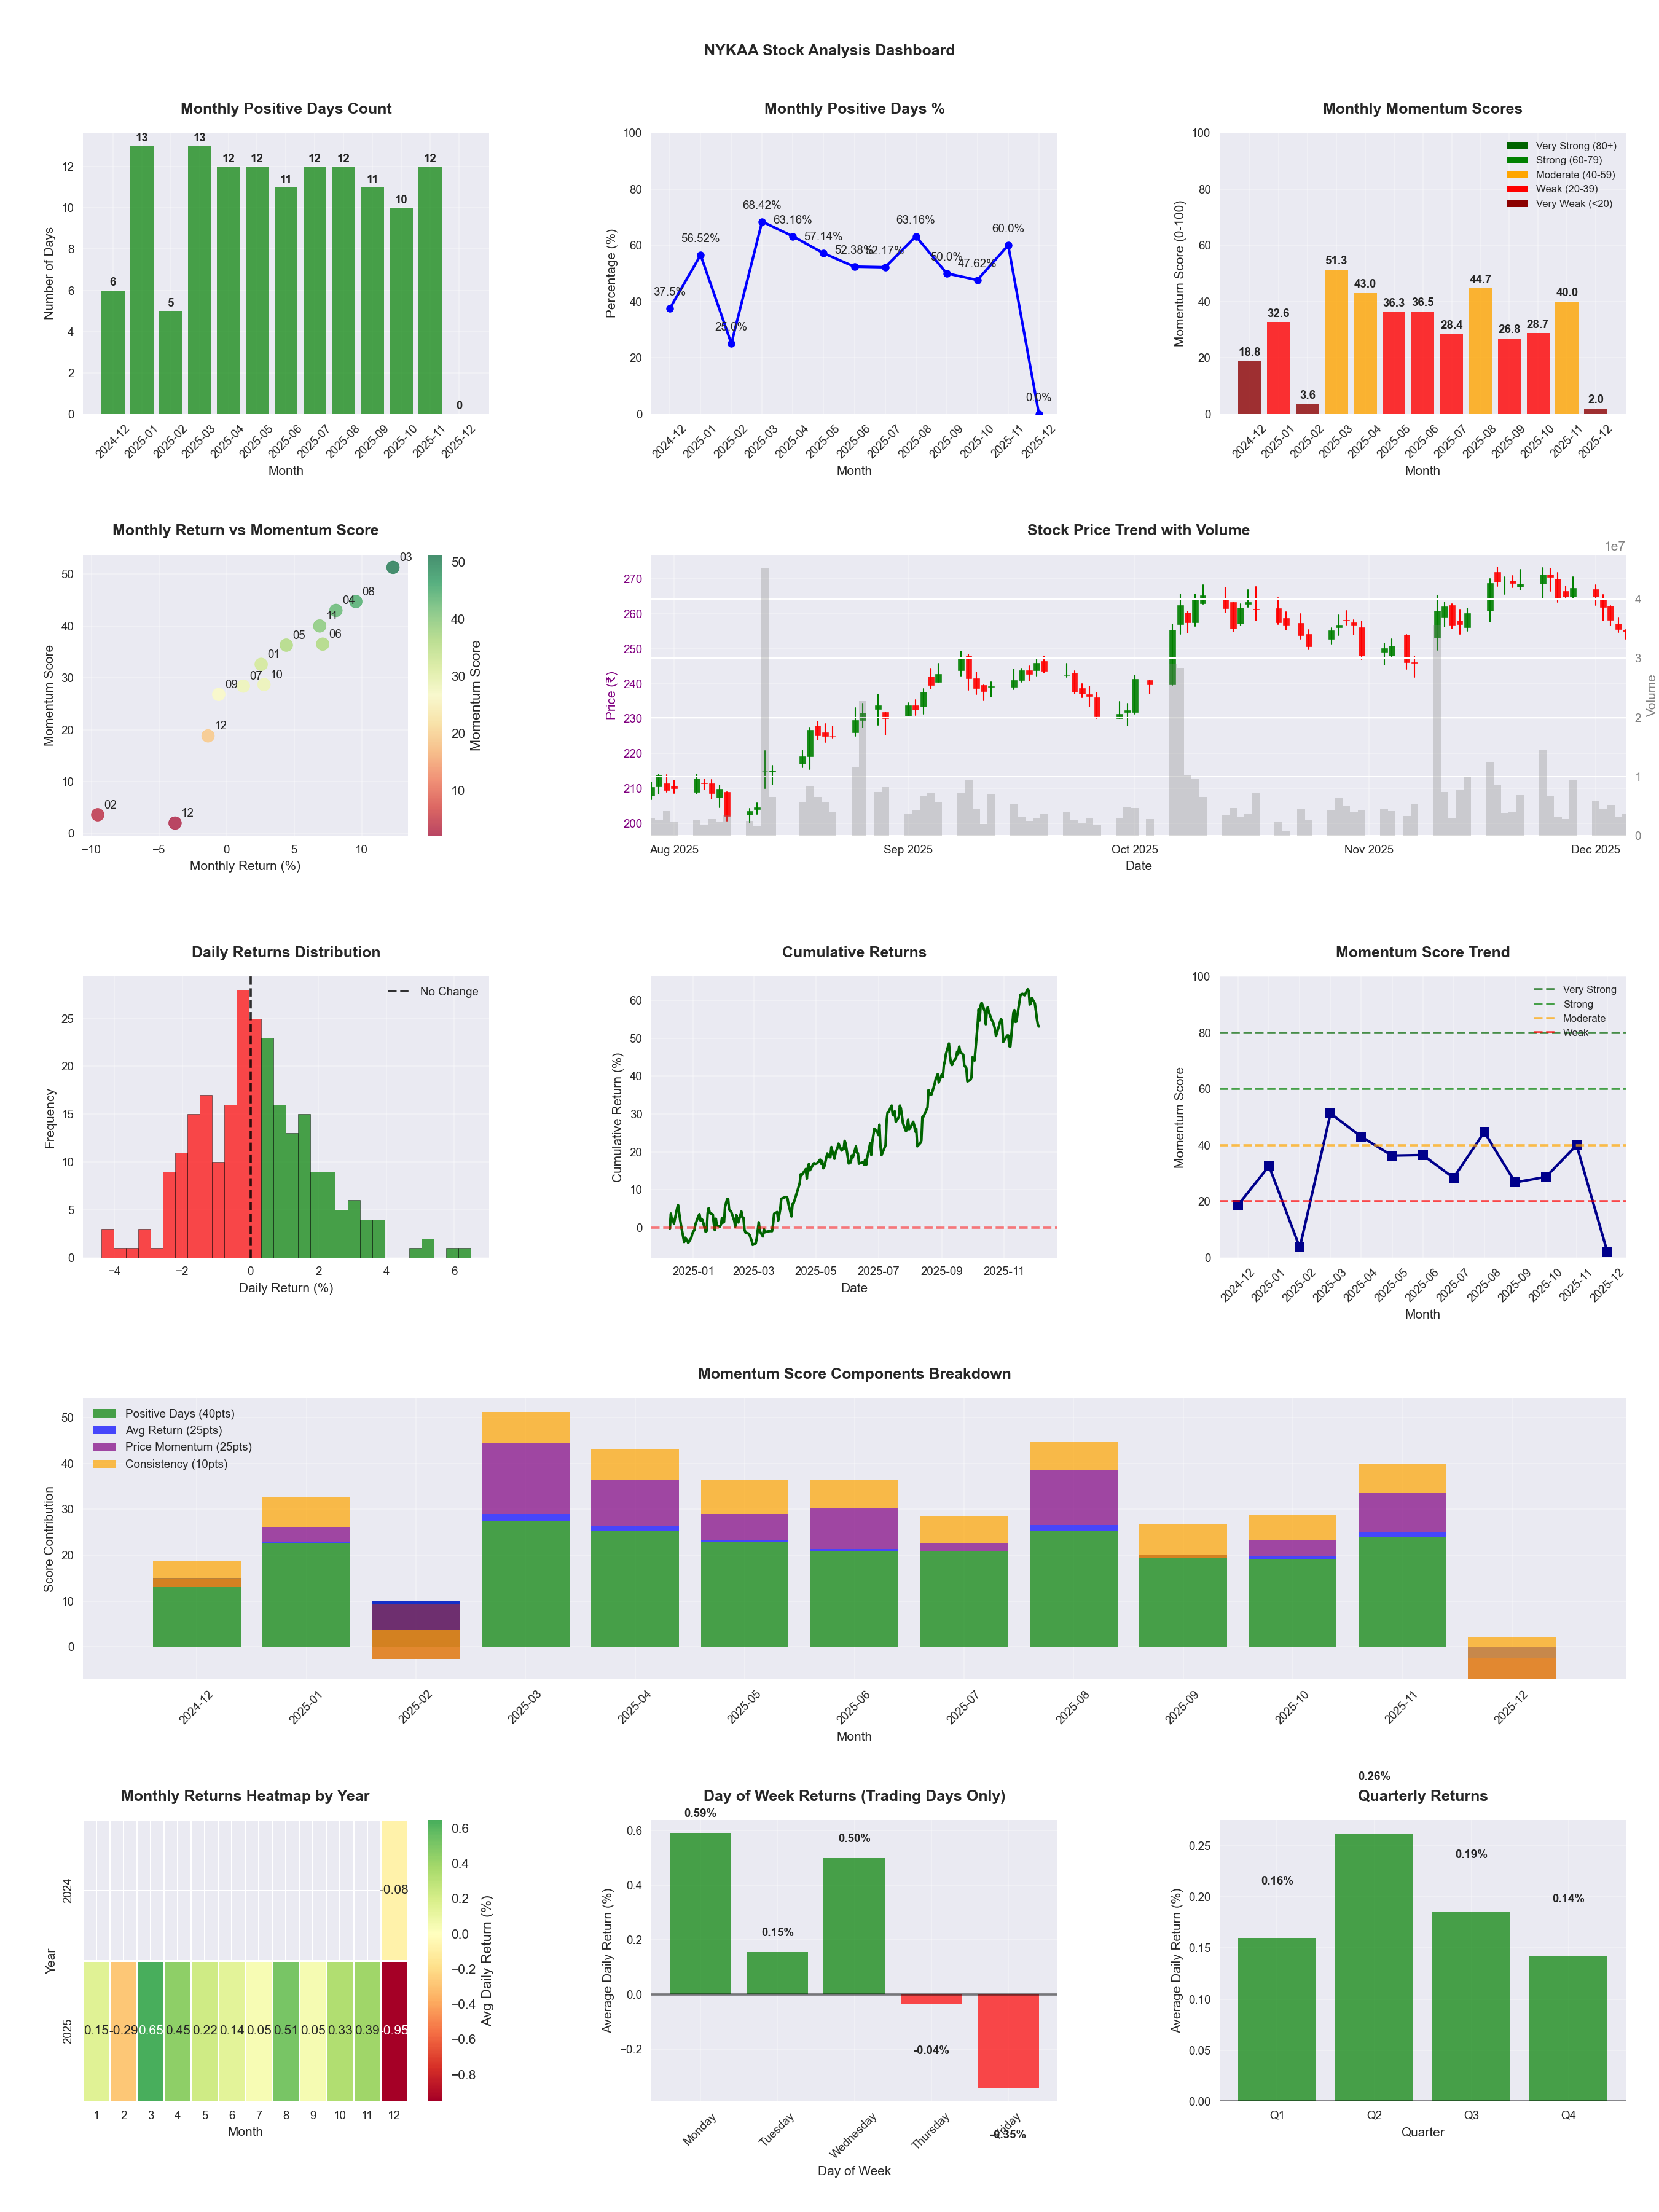
📊 Key Insights & Metrics
Symbol
📈 NYKAA
Date
📅 2026-04-11
Volatility
🟡 1.79%
Win Rate
⚠️ 53.2%
Avg Daily Return
📈 +0.16%
Max Drawdown
📉 -16.37%
IBD RS Score
📊 79.9
Strong
Market Rank
#99
Best Month
🏆 2026-04
Worst Month
📉 2026-01
Best Months to Trade
📅 Apr, Feb, Aug
Best Days to Trade
📅 Monday, Wednesday
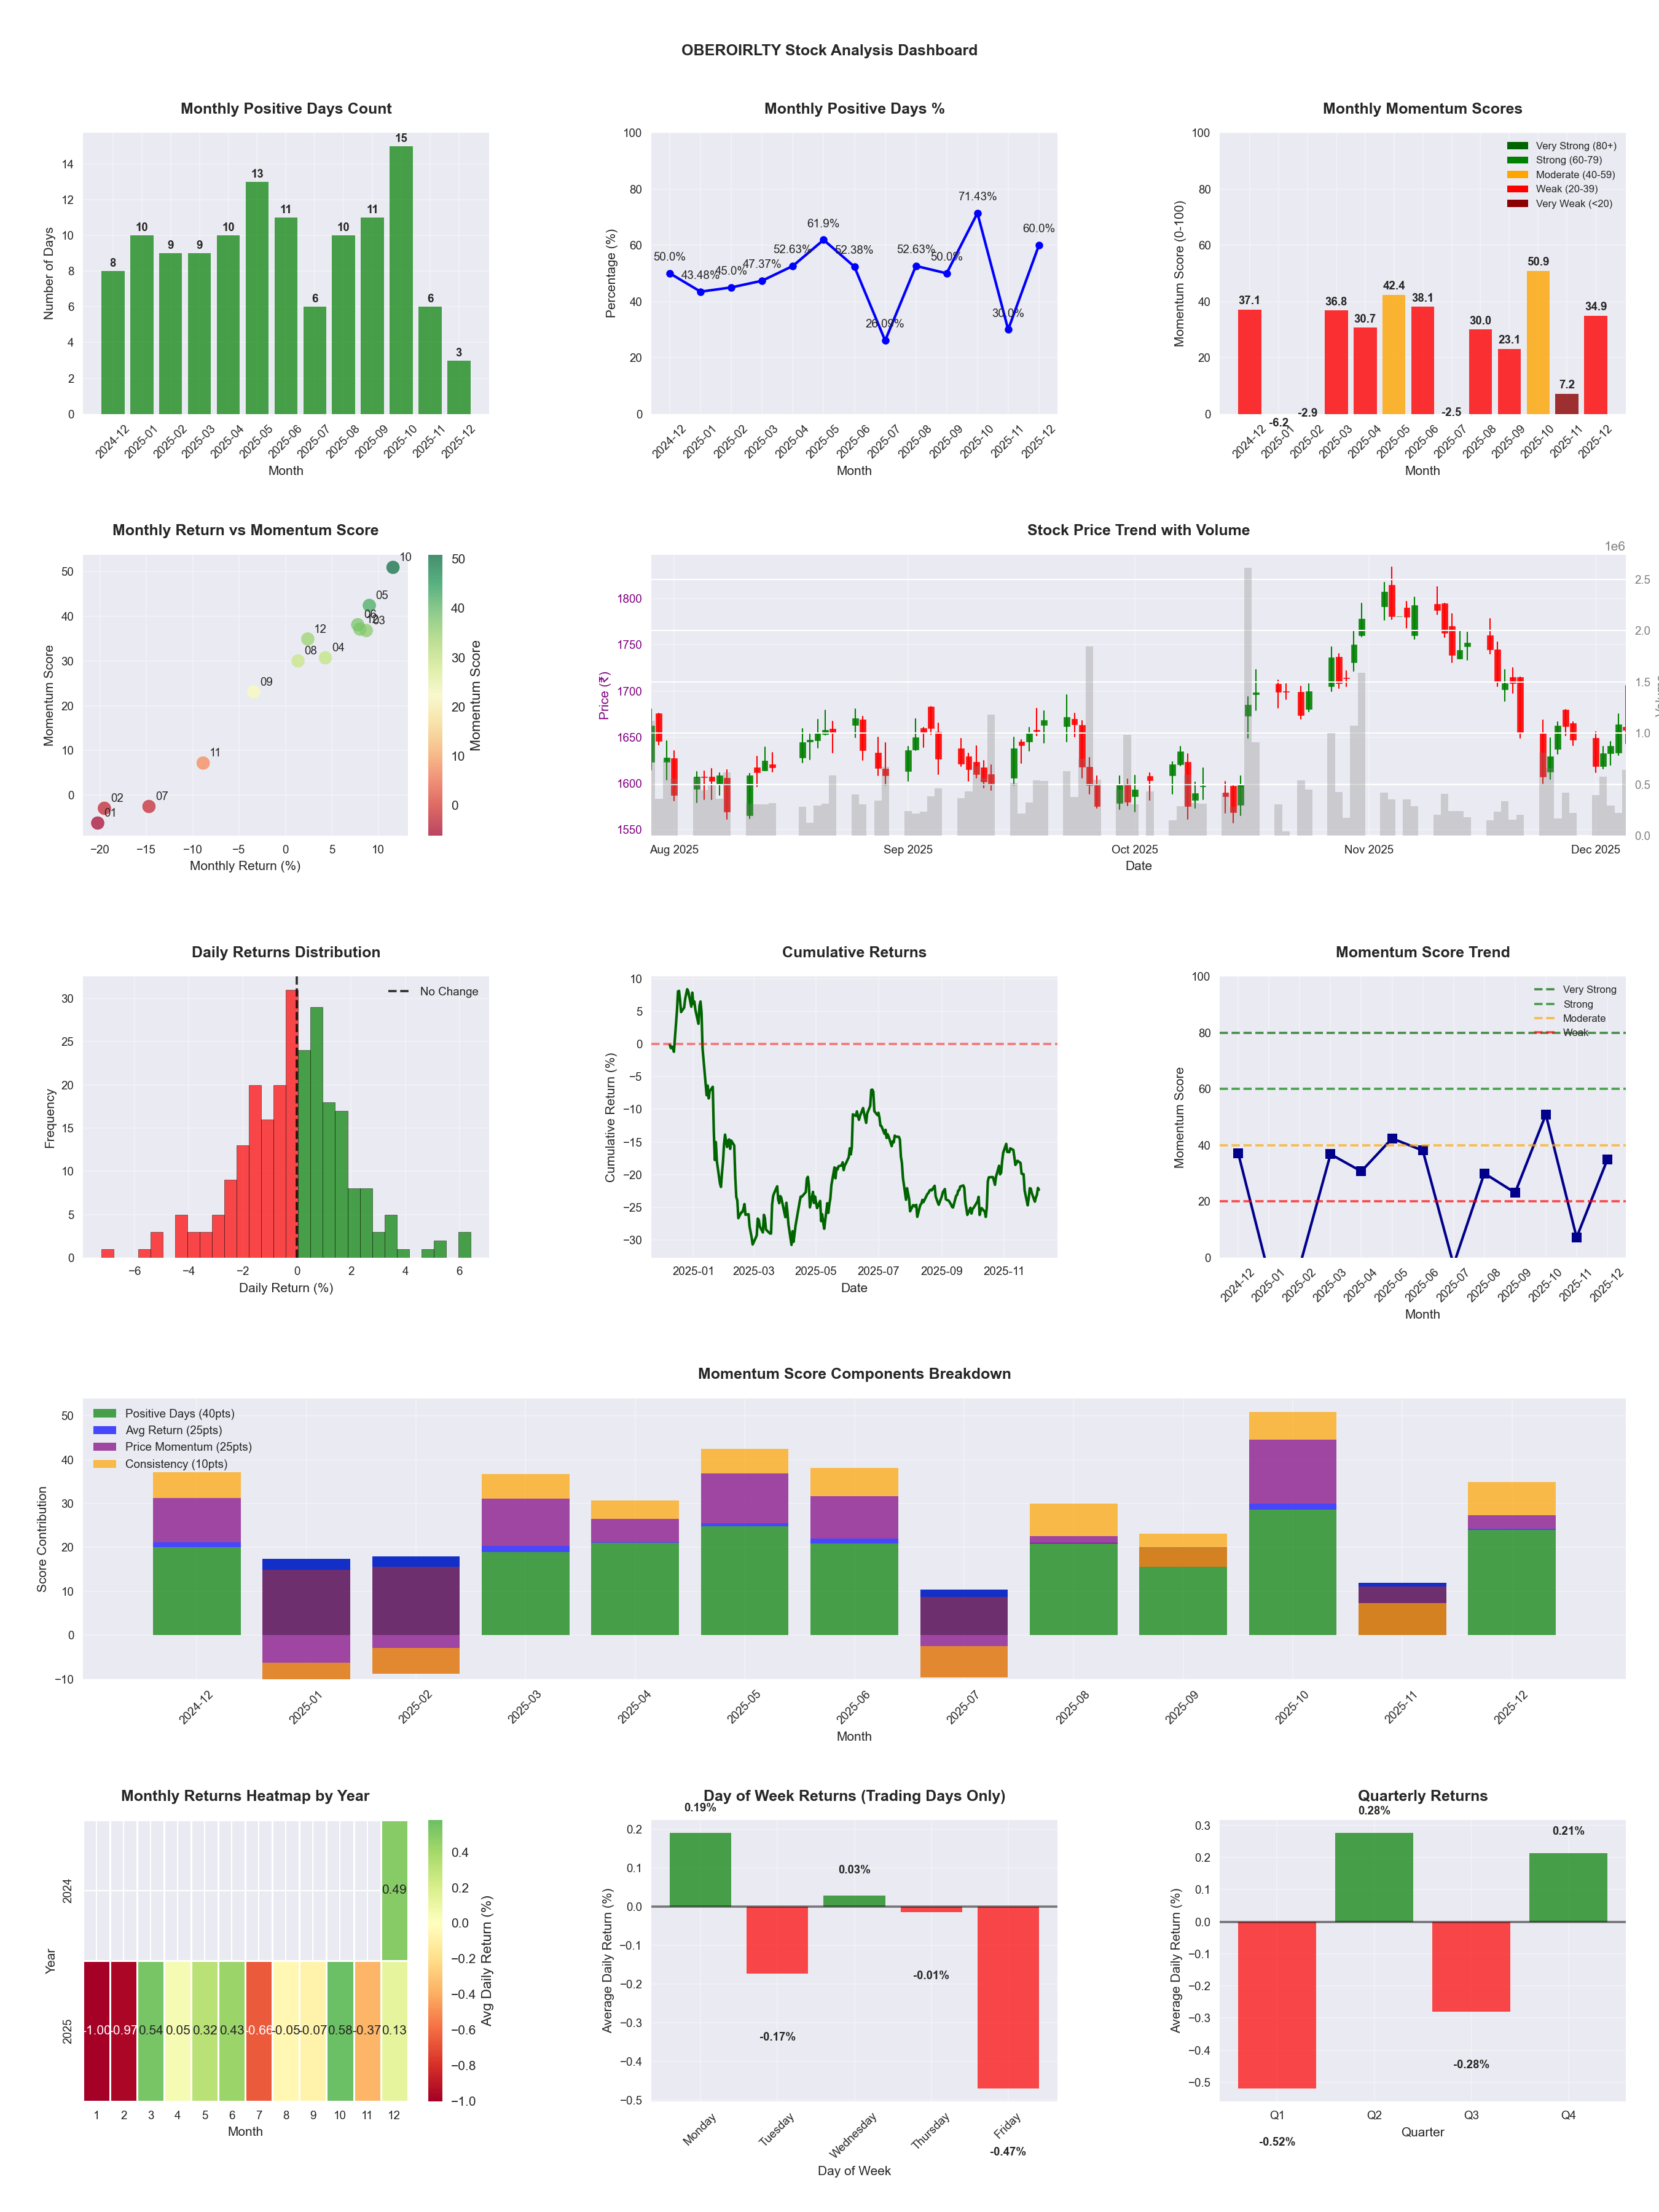
📊 Key Insights & Metrics
Symbol
📈 OBEROIRLTY
Date
📅 2026-04-11
Volatility
🟡 1.77%
Win Rate
⚠️ 49.2%
Avg Daily Return
📈 +0.05%
Max Drawdown
📉 -28.77%
IBD RS Score
📊 63.3
Average
Market Rank
#181
Best Month
🏆 2026-04
Best Months to Trade
📅 Apr, Oct, Jun
Best Days to Trade
📅 Thursday, Wednesday
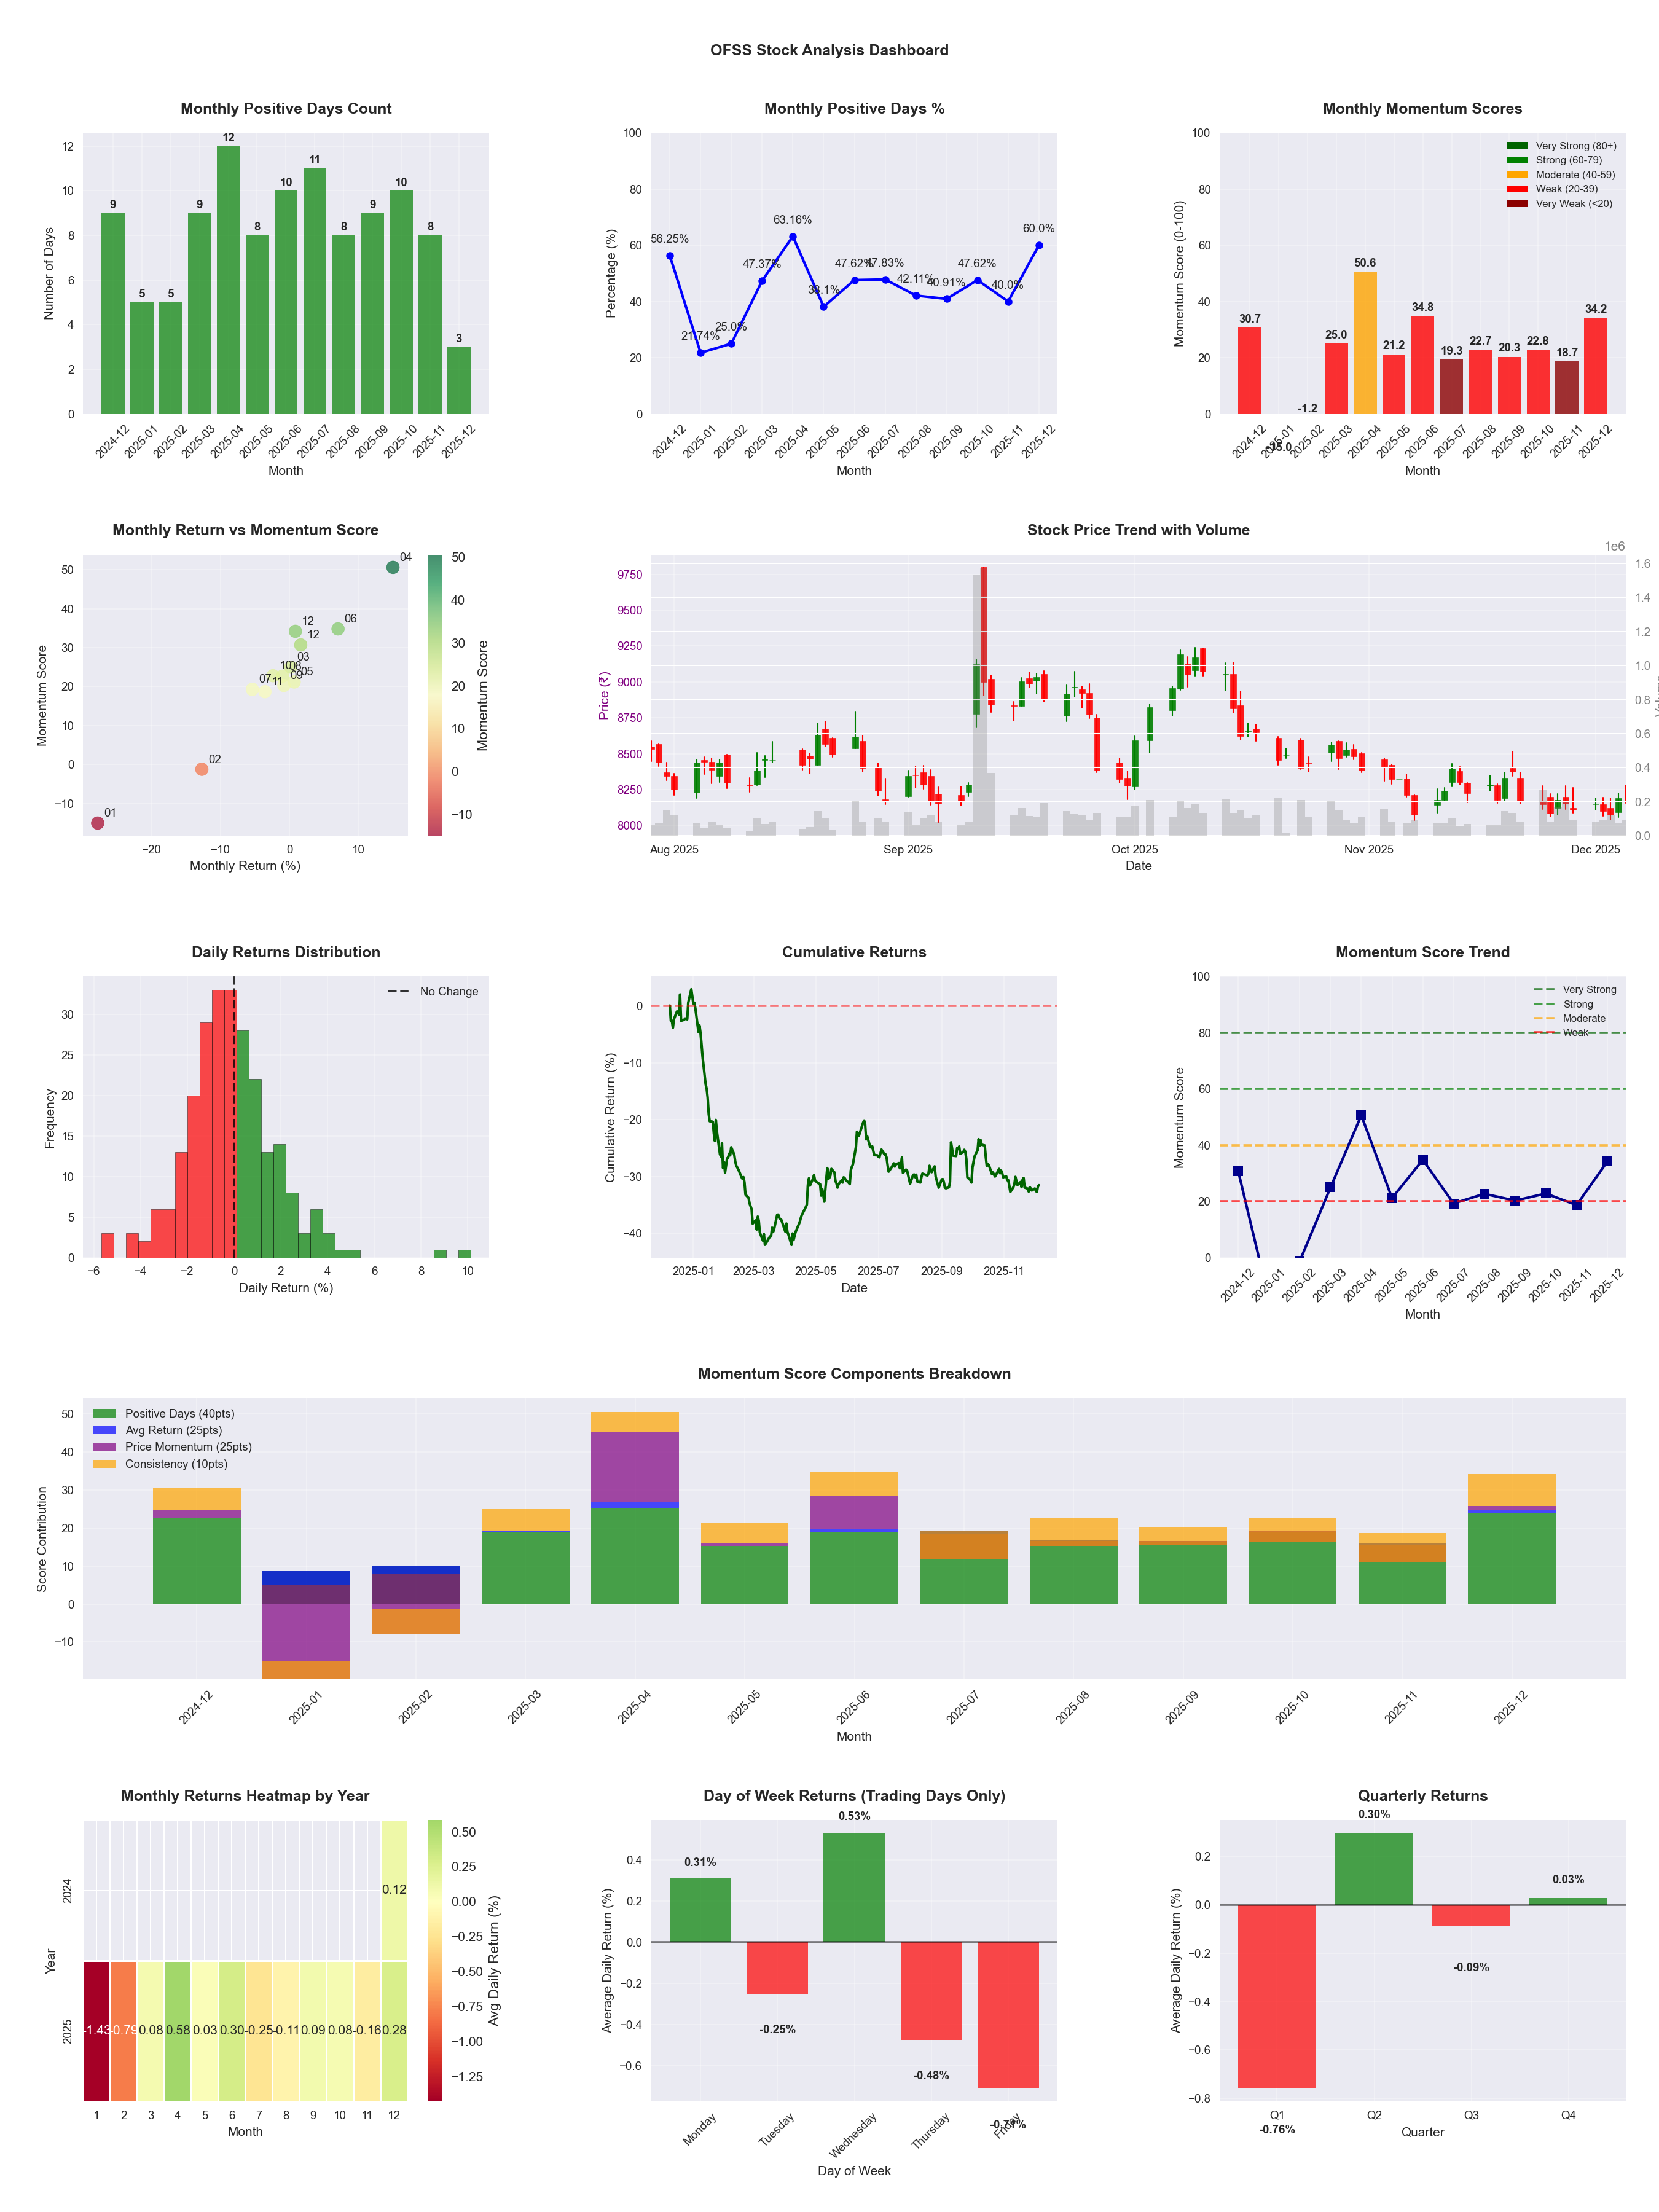
📊 Key Insights & Metrics
Symbol
📈 OFSS
Date
📅 2026-04-11
Volatility
🟡 1.92%
Win Rate
⚠️ 45.5%
Avg Daily Return
📈 +0.02%
Max Drawdown
📉 -34.24%
IBD RS Score
📊 38.7
Weak
Market Rank
#302
Best Month
🏆 2025-04
Worst Month
📉 2026-02
Best Months to Trade
📅 Apr, Jun, Sep
Best Days to Trade
📅 Wednesday, Monday
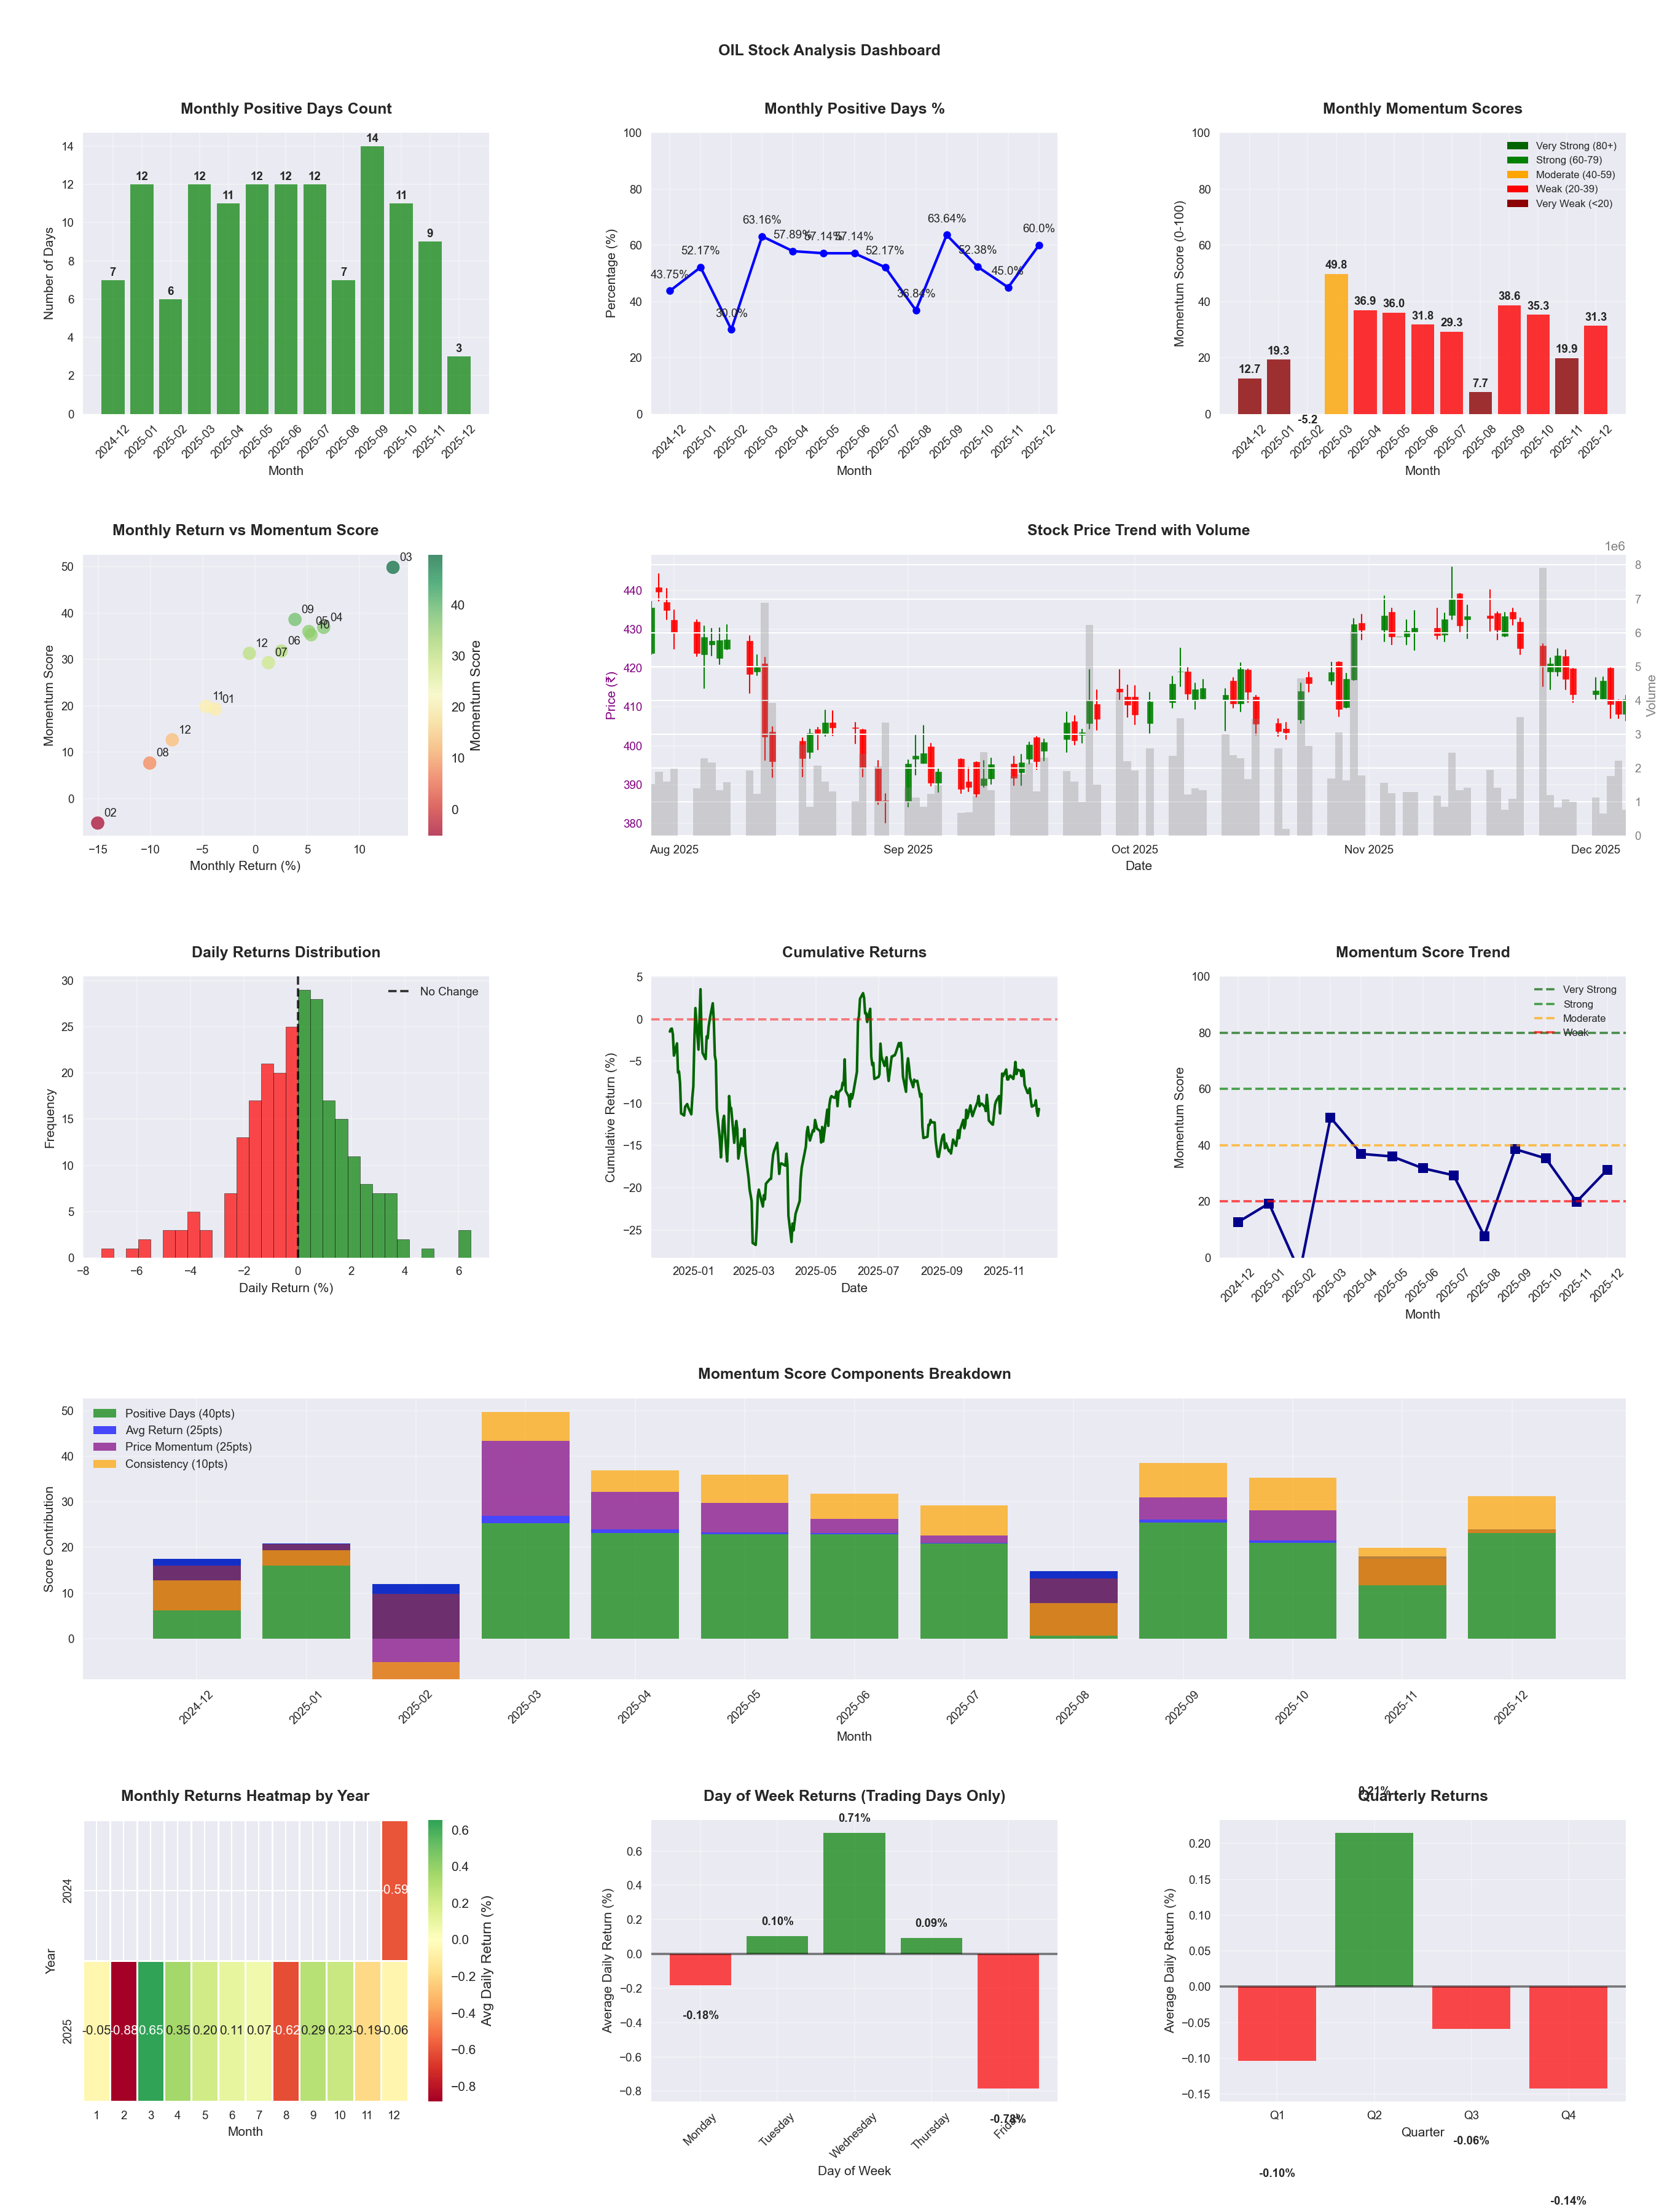
📊 Key Insights & Metrics
Symbol
📈 OIL
Date
📅 2026-04-11
Volatility
🟡 1.84%
Win Rate
⚠️ 51.6%
Avg Daily Return
📈 +0.14%
Max Drawdown
📉 -18.83%
IBD RS Score
📊 84.6
Strong
Market Rank
#76
Best Month
🏆 2025-04
Worst Month
📉 2025-08
Best Months to Trade
📅 Jan, Apr, Sep
Best Days to Trade
📅 Wednesday, Tuesday
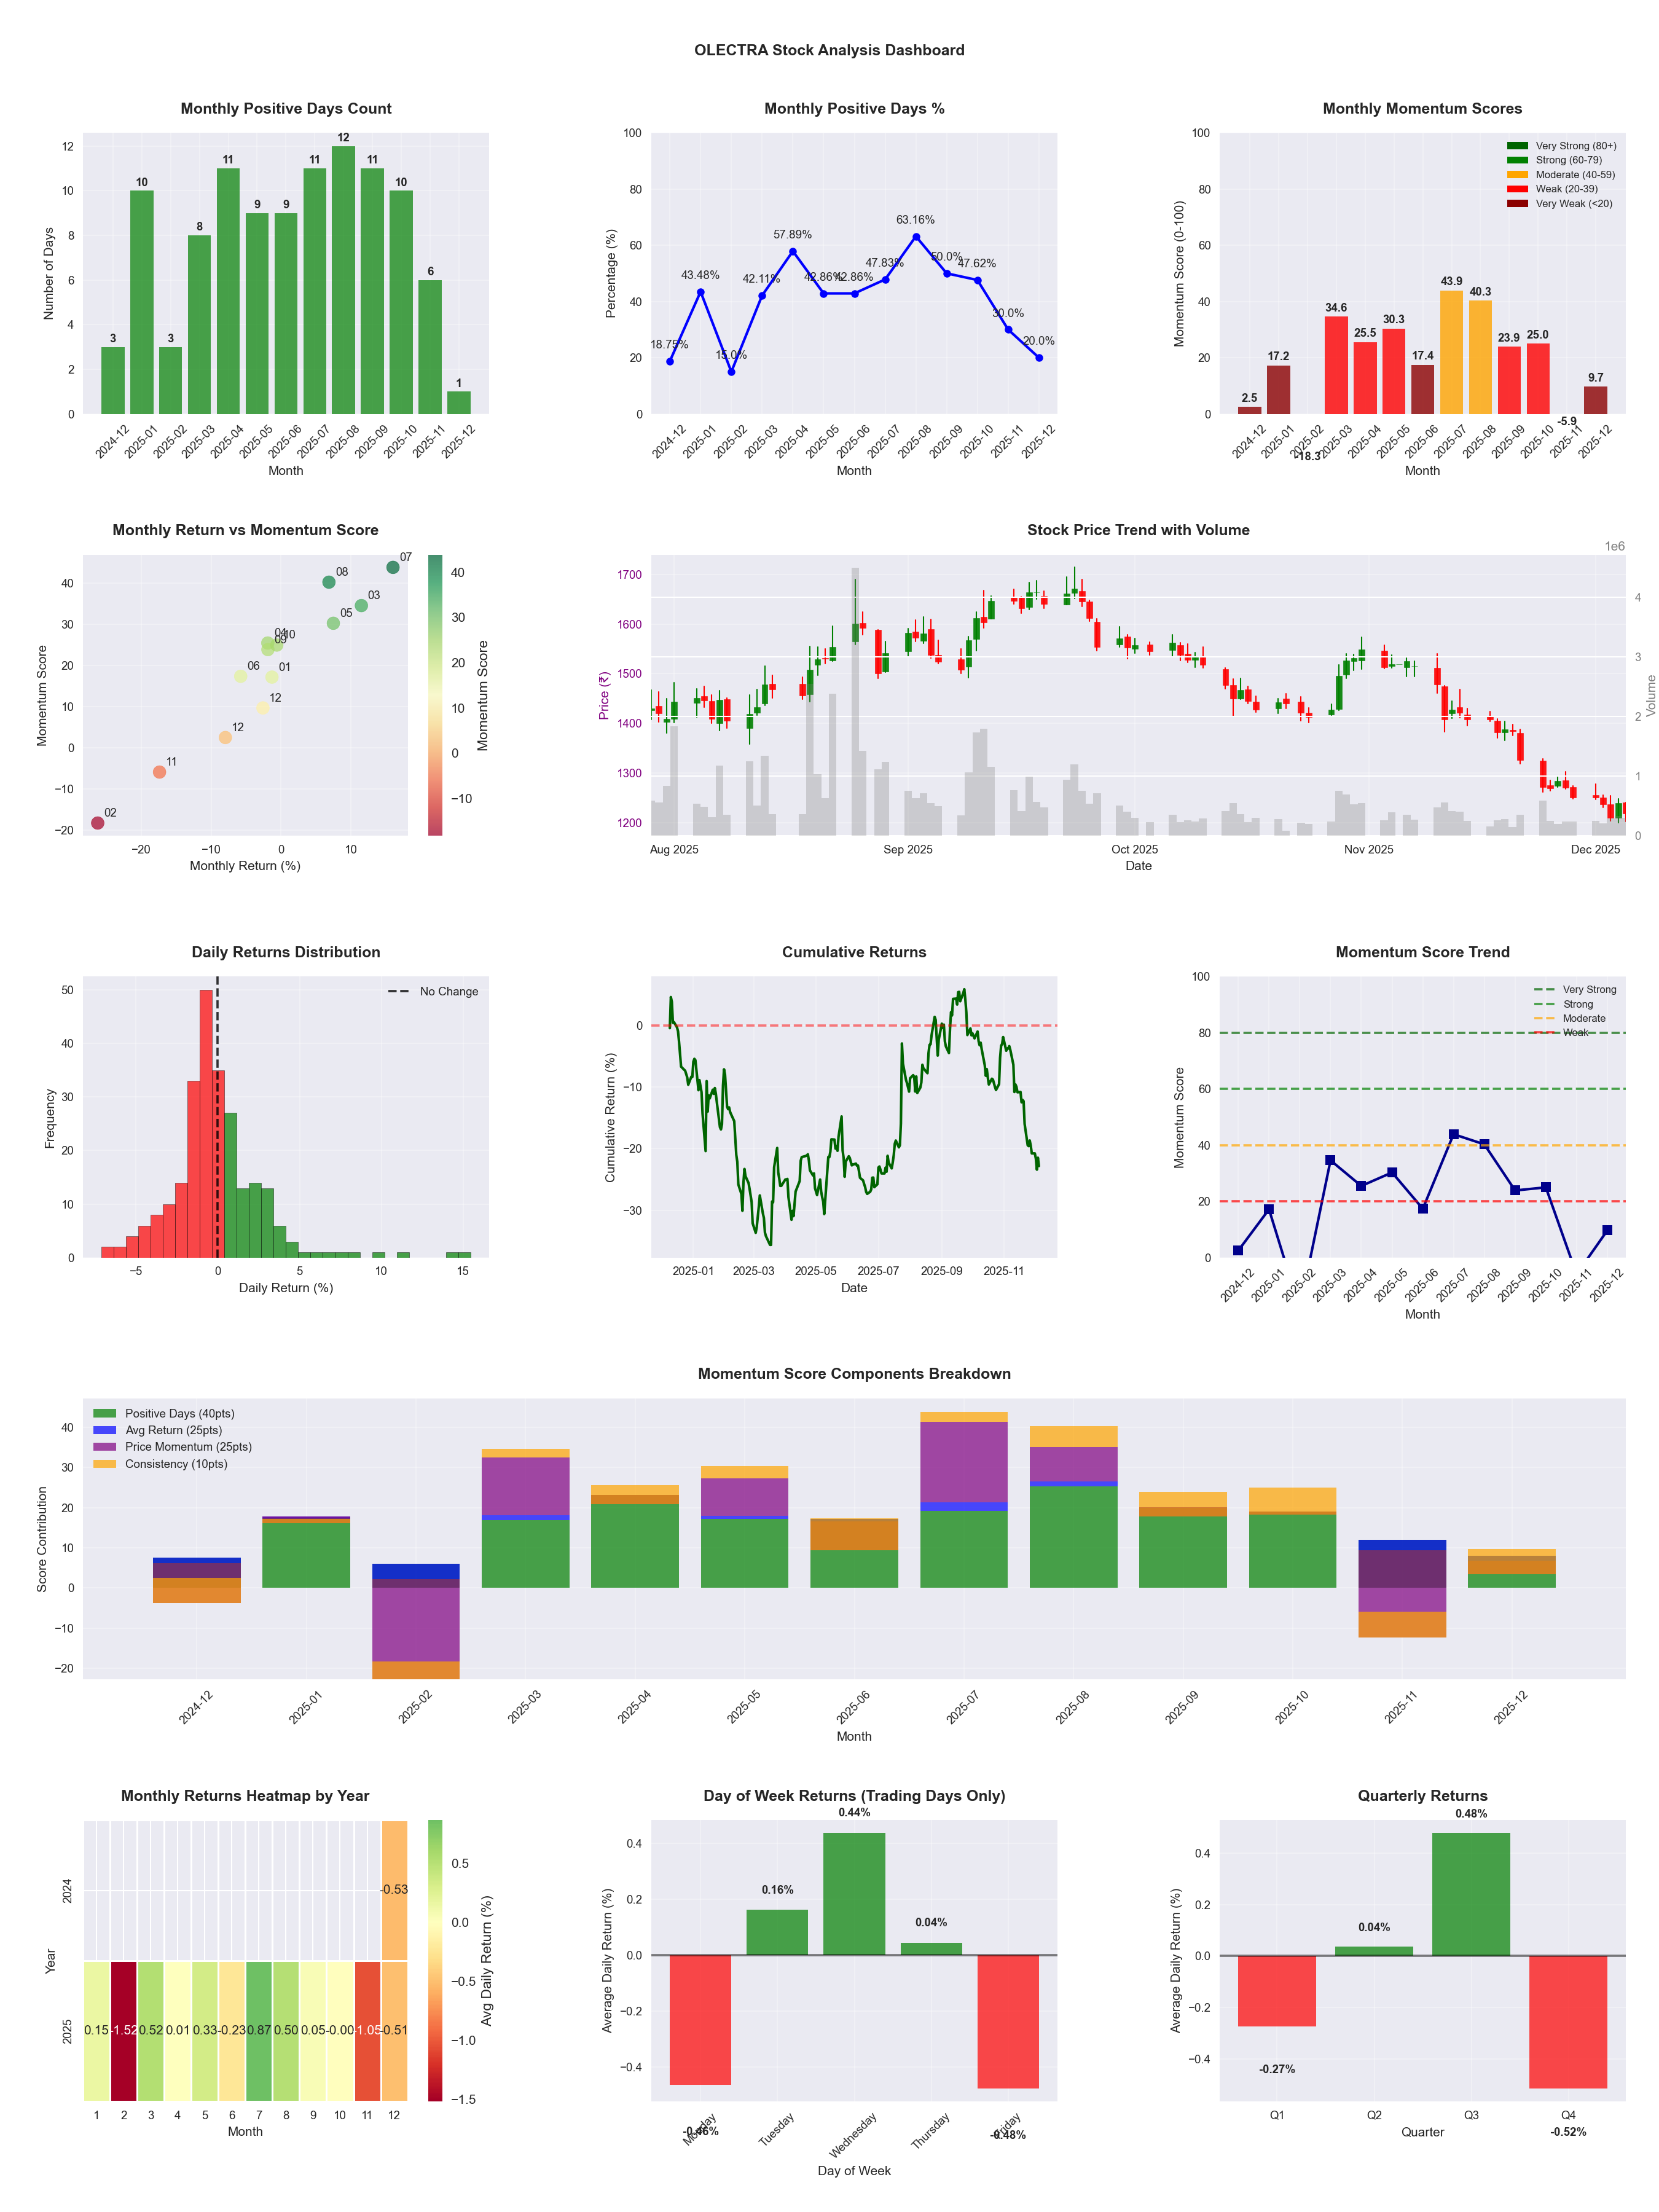
📊 Key Insights & Metrics
Symbol
📈 OLECTRA
Date
📅 2026-04-11
Volatility
🟡 2.89%
Risk Profile
⚠️ suitable for aggressive investors
Win Rate
⚠️ 45.5%
Avg Daily Return
📈 +0.05%
Max Drawdown
📉 -47.31%
IBD RS Score
📊 52.3
Average
Market Rank
#235
Best Month
🏆 2026-04
Best Months to Trade
📅 Apr, Jul, Aug
Best Days to Trade
📅 Wednesday, Tuesday
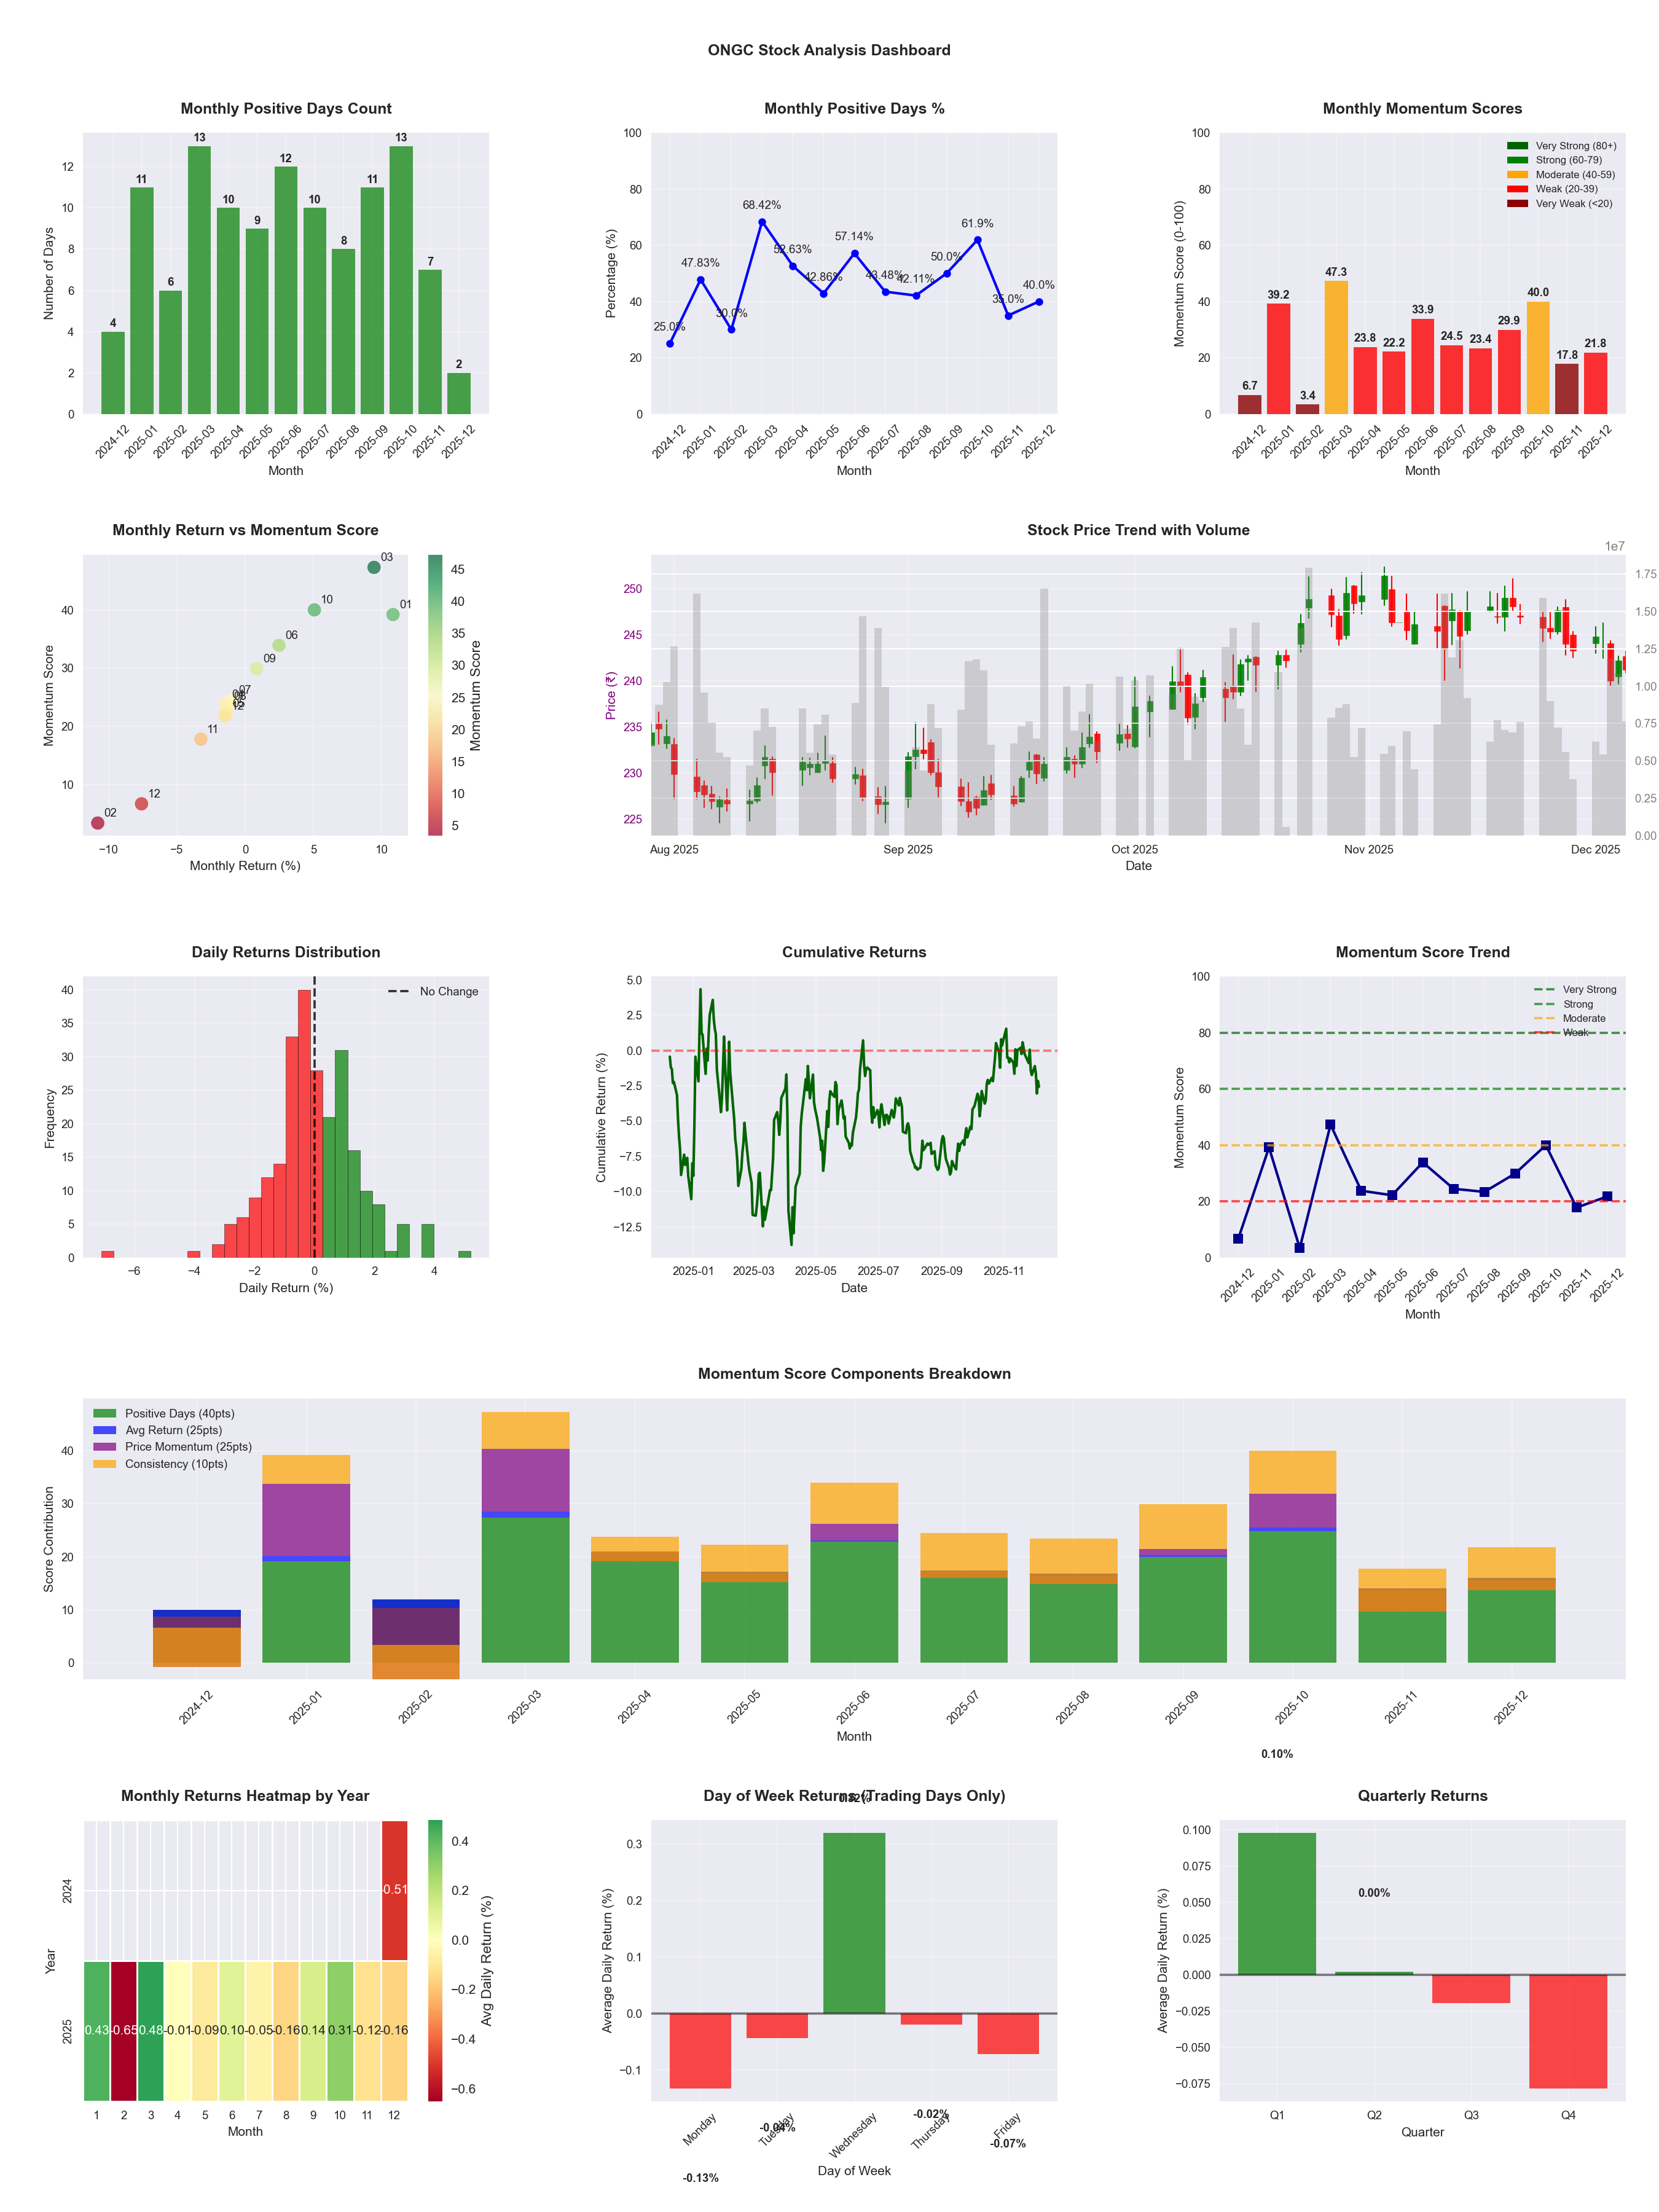
📊 Key Insights & Metrics
Symbol
📈 ONGC
Date
📅 2026-04-11
Volatility
🟢 1.37%
Win Rate
⚠️ 50.8%
Avg Daily Return
📈 +0.12%
Max Drawdown
📉 -9.44%
IBD RS Score
📊 91.9
Leader
Market Rank
#40
Best Month
🏆 2026-02
Worst Month
📉 2025-11
Best Months to Trade
📅 Jan, Apr, Feb
Best Days to Trade
📅 Wednesday, Thursday
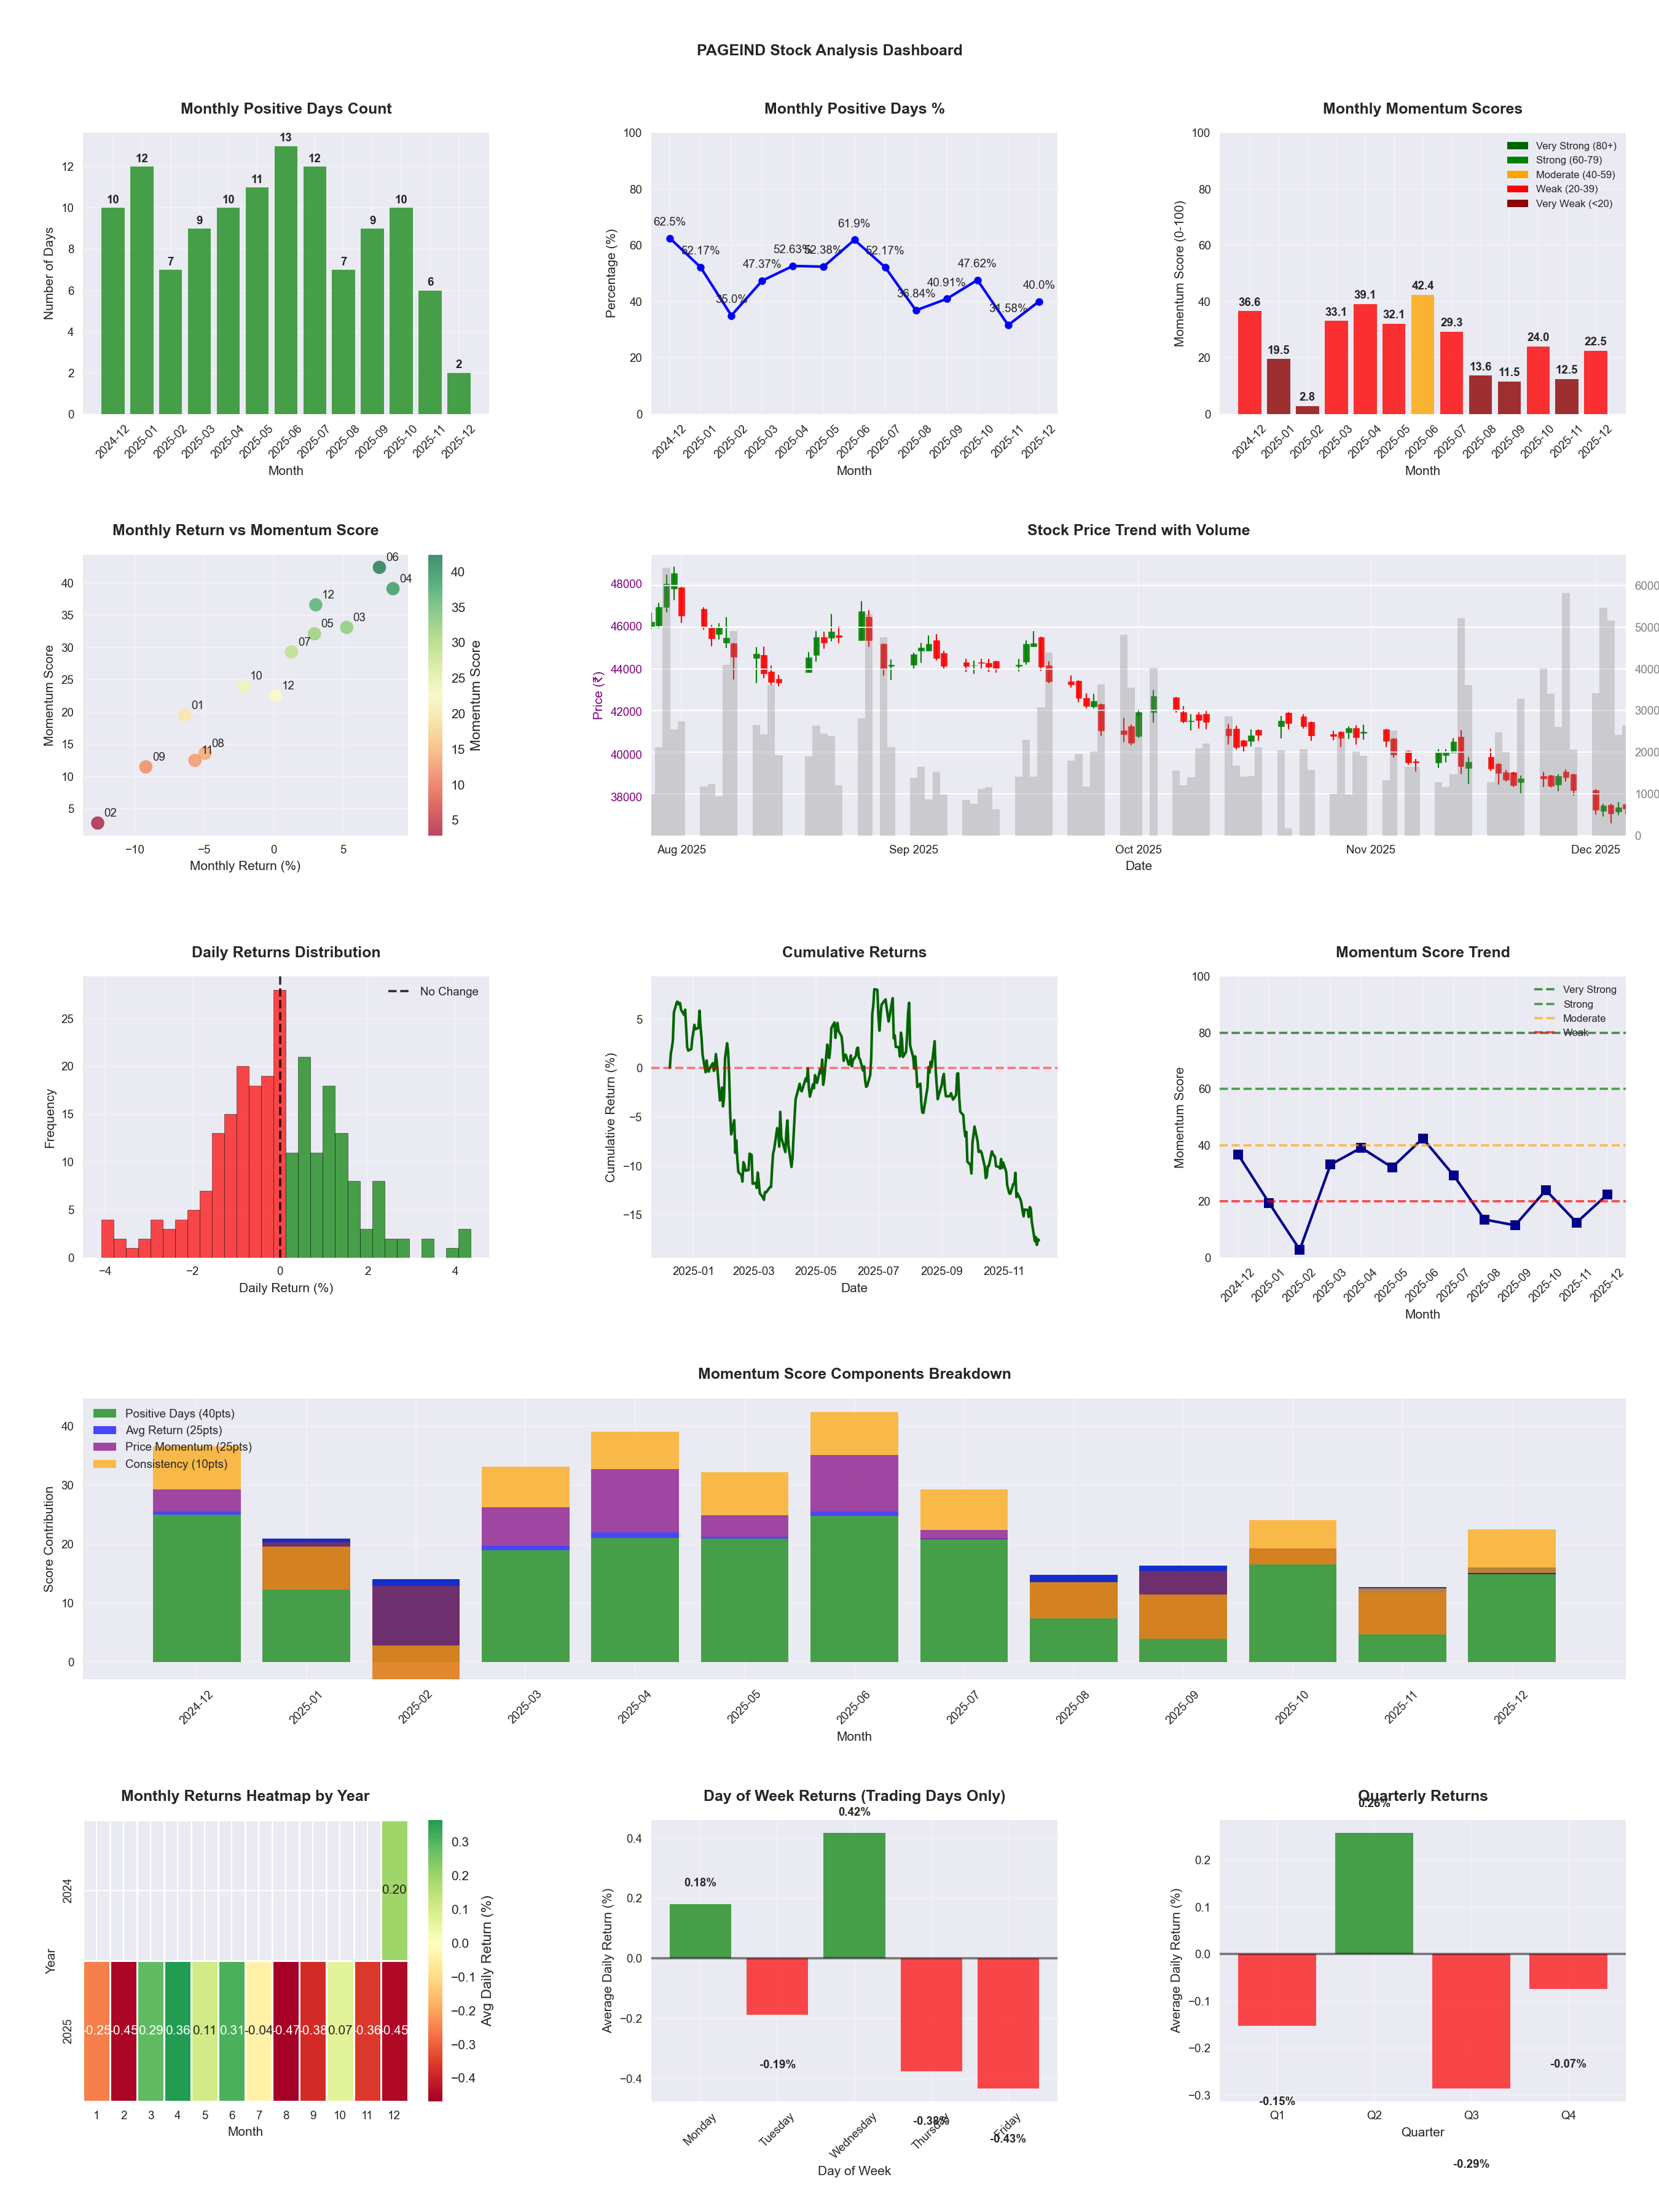
📊 Key Insights & Metrics
Symbol
📈 PAGEIND
Date
📅 2026-04-11
Volatility
🟢 1.43%
Win Rate
⚠️ 45.3%
Avg Daily Return
📉 -0.07%
Max Drawdown
📉 -38.29%
IBD RS Score
📊 39.1
Weak
Market Rank
#300
Best Month
🏆 2026-04
Worst Month
📉 2025-09
Best Months to Trade
📅 Apr, Jun, May
Best Days to Trade
📅 Wednesday, Monday
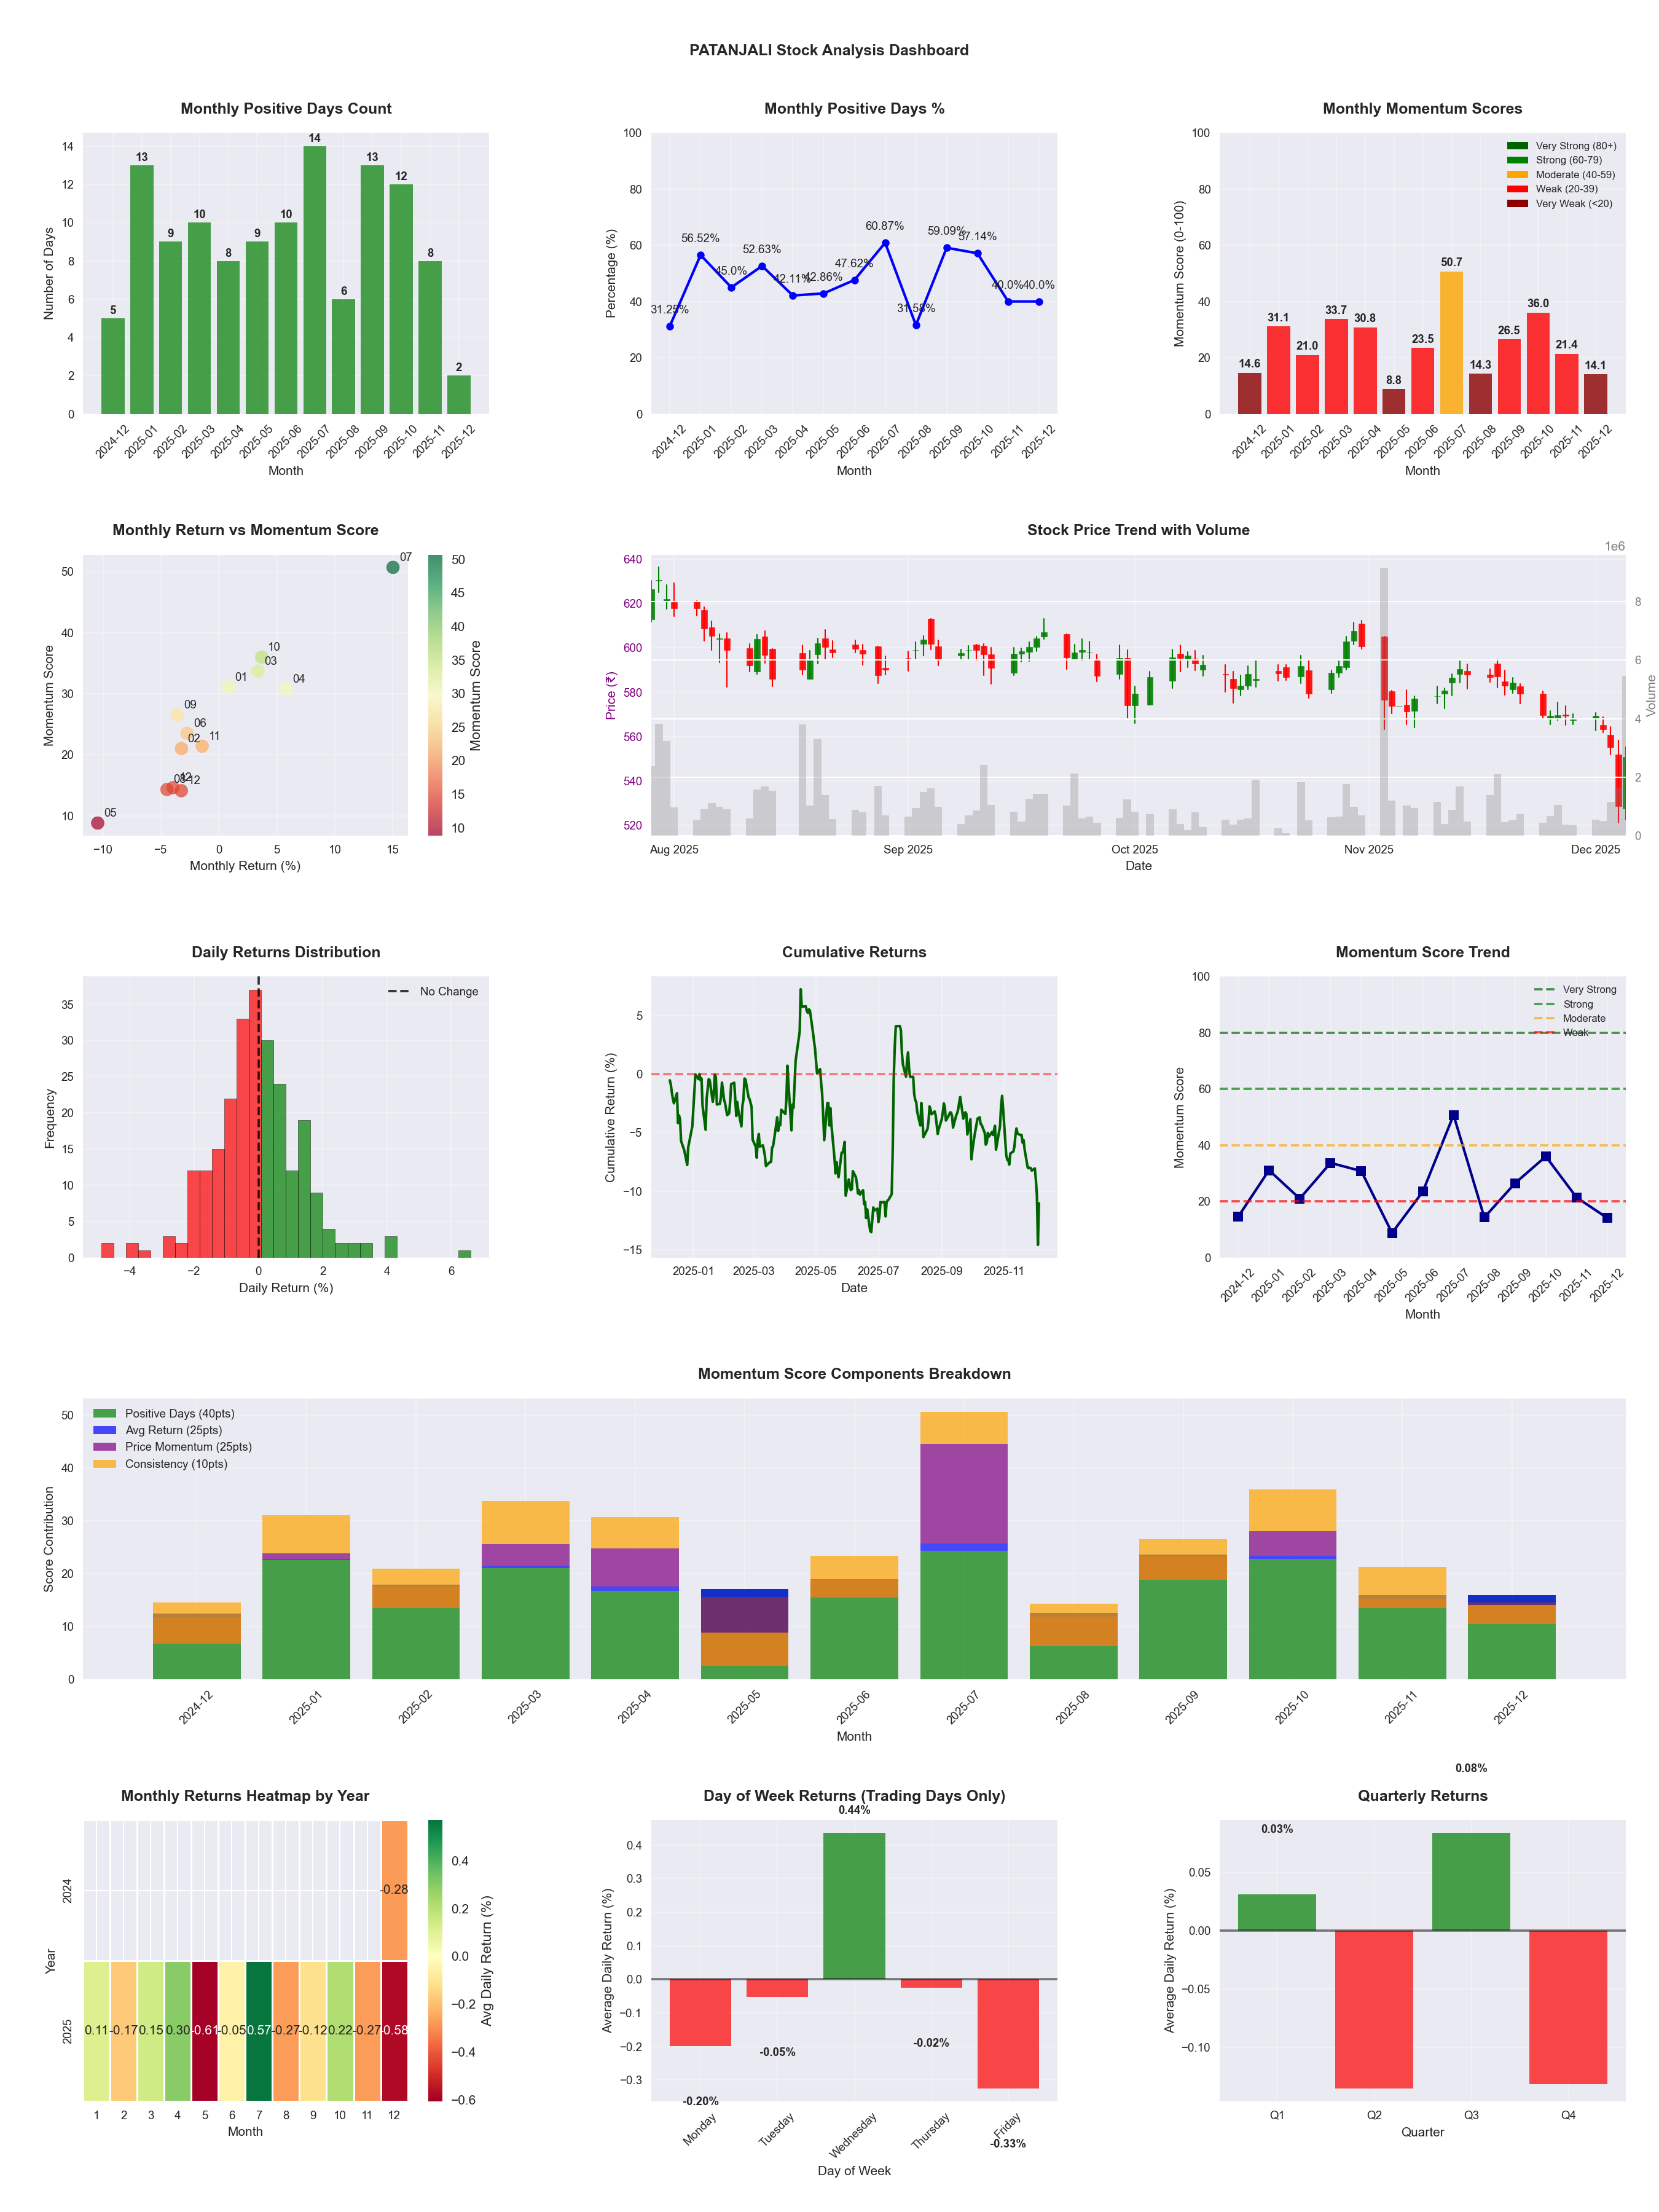
📊 Key Insights & Metrics
Symbol
📈 PATANJALI
Date
📅 2026-04-11
Volatility
🟢 1.47%
Win Rate
⚠️ 49.2%
Avg Daily Return
📉 -0.11%
Max Drawdown
📉 -30.79%
IBD RS Score
📊 14.0
Weak
Market Rank
#424
Best Month
🏆 2025-07
Worst Month
📉 2025-05
Best Months to Trade
📅 Jul, Oct, Apr
Best Days to Trade
📅 Wednesday, Tuesday
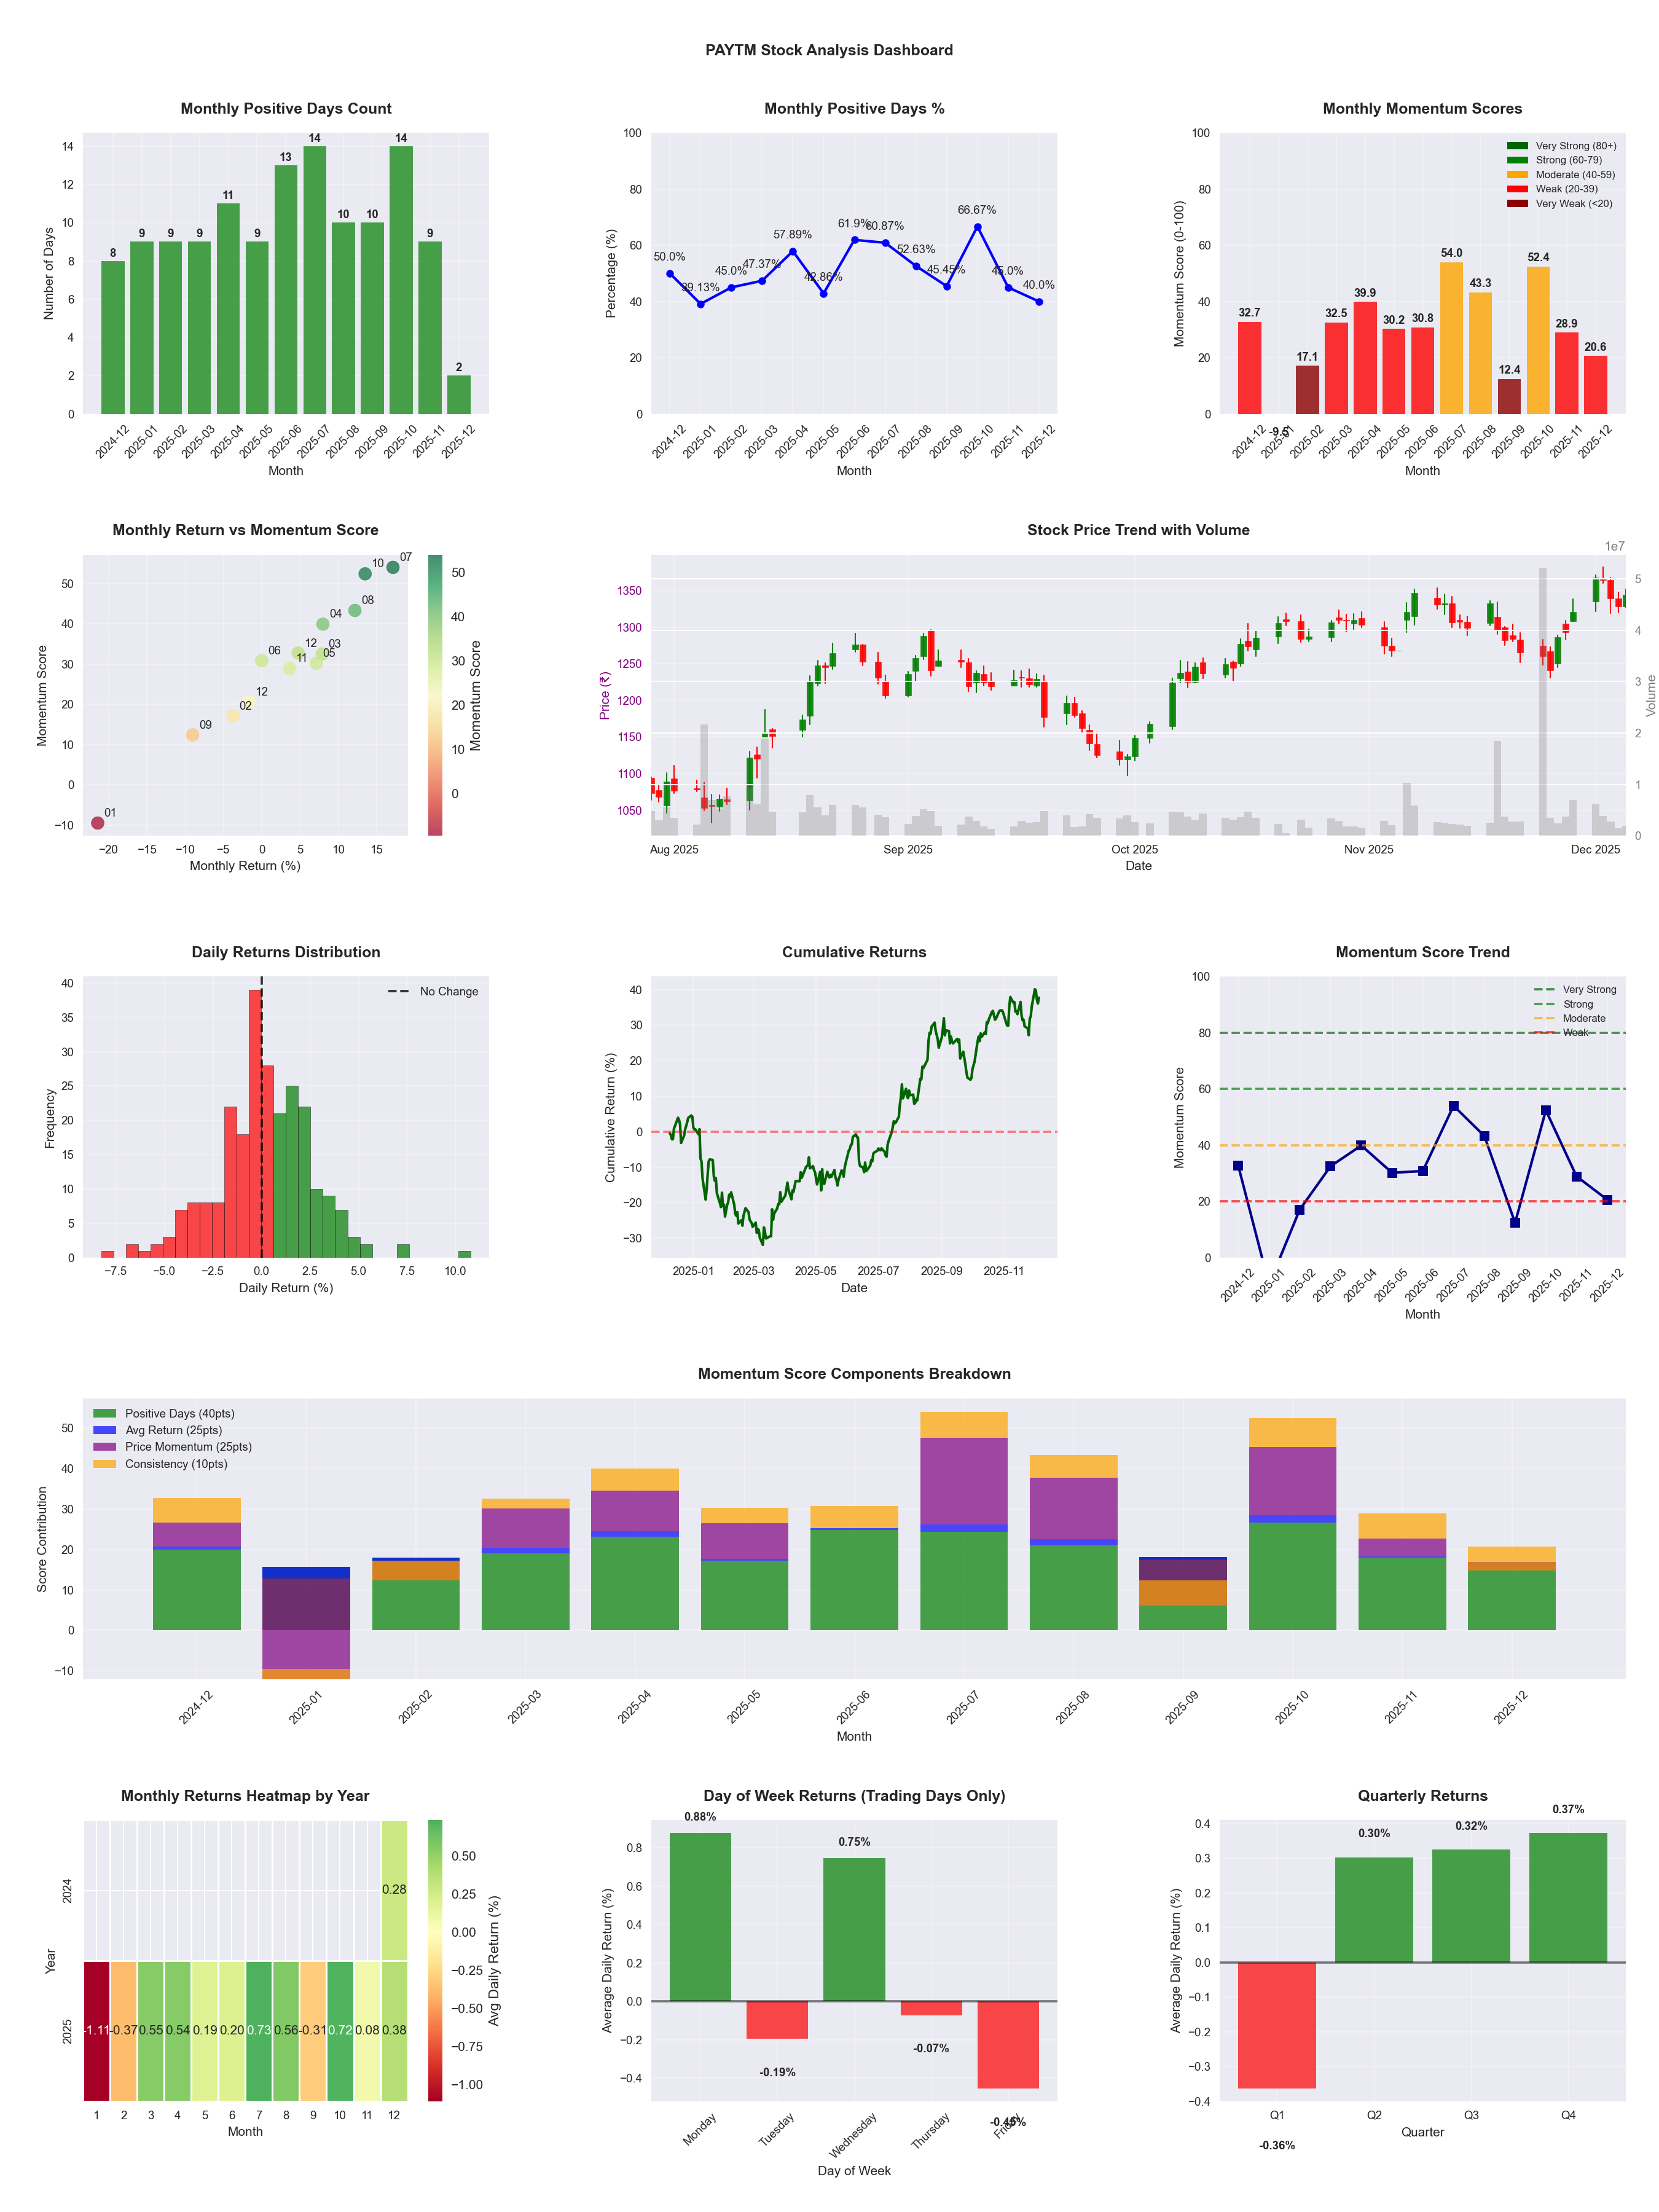
📊 Key Insights & Metrics
Symbol
📈 PAYTM
Date
📅 2026-04-11
Volatility
🟡 2.34%
Risk Profile
⚠️ suitable for aggressive investors
Win Rate
⚠️ 50.4%
Avg Daily Return
📈 +0.15%
Max Drawdown
📉 -29.89%
IBD RS Score
📊 66.5
Average
Market Rank
#165
Best Month
🏆 2025-07
Worst Month
📉 2026-01
Best Months to Trade
📅 Apr, Jul, Oct
Best Days to Trade
📅 Monday, Wednesday
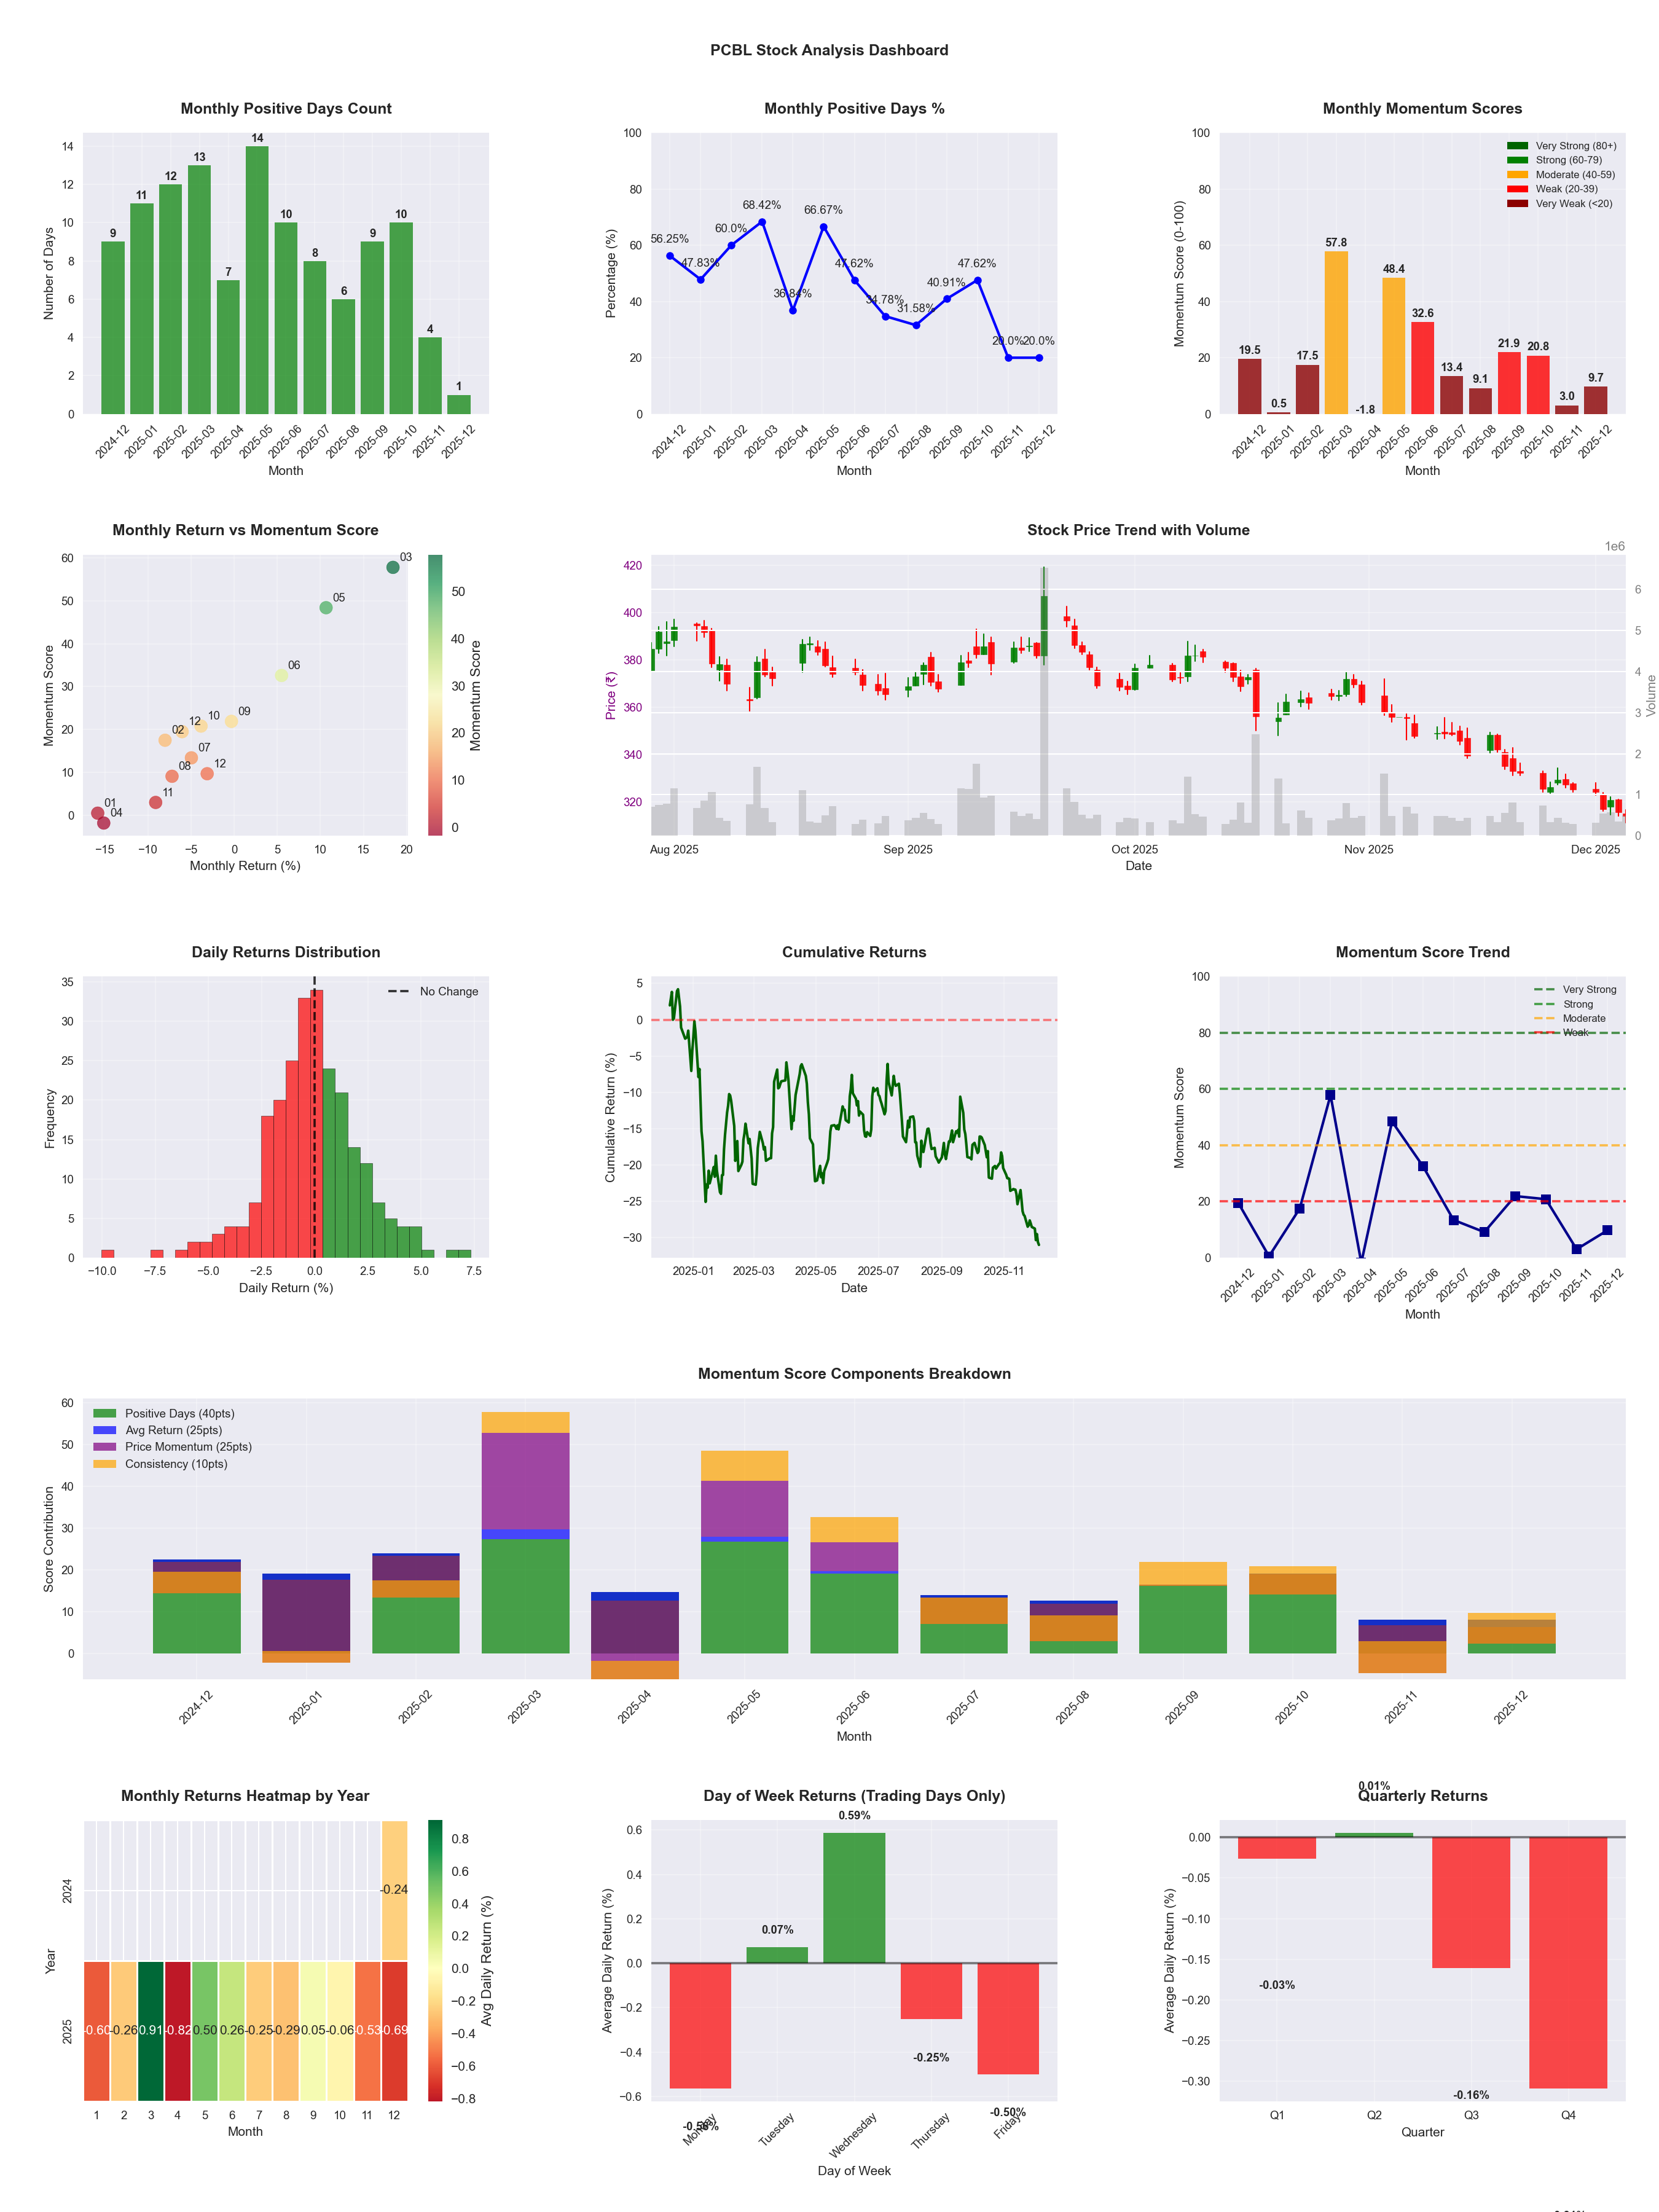
📊 Key Insights & Metrics
Symbol
📈 PCBL
Date
📅 2026-04-11
Volatility
🟡 2.62%
Risk Profile
⚠️ suitable for aggressive investors
Win Rate
⚠️ 40.2%
Avg Daily Return
📉 -0.13%
Max Drawdown
📉 -45.67%
IBD RS Score
📊 12.4
Weak
Market Rank
#432
Best Month
🏆 2026-04
Best Months to Trade
📅 Feb, May, Jun
Best Days to Trade
📅 Wednesday, Tuesday
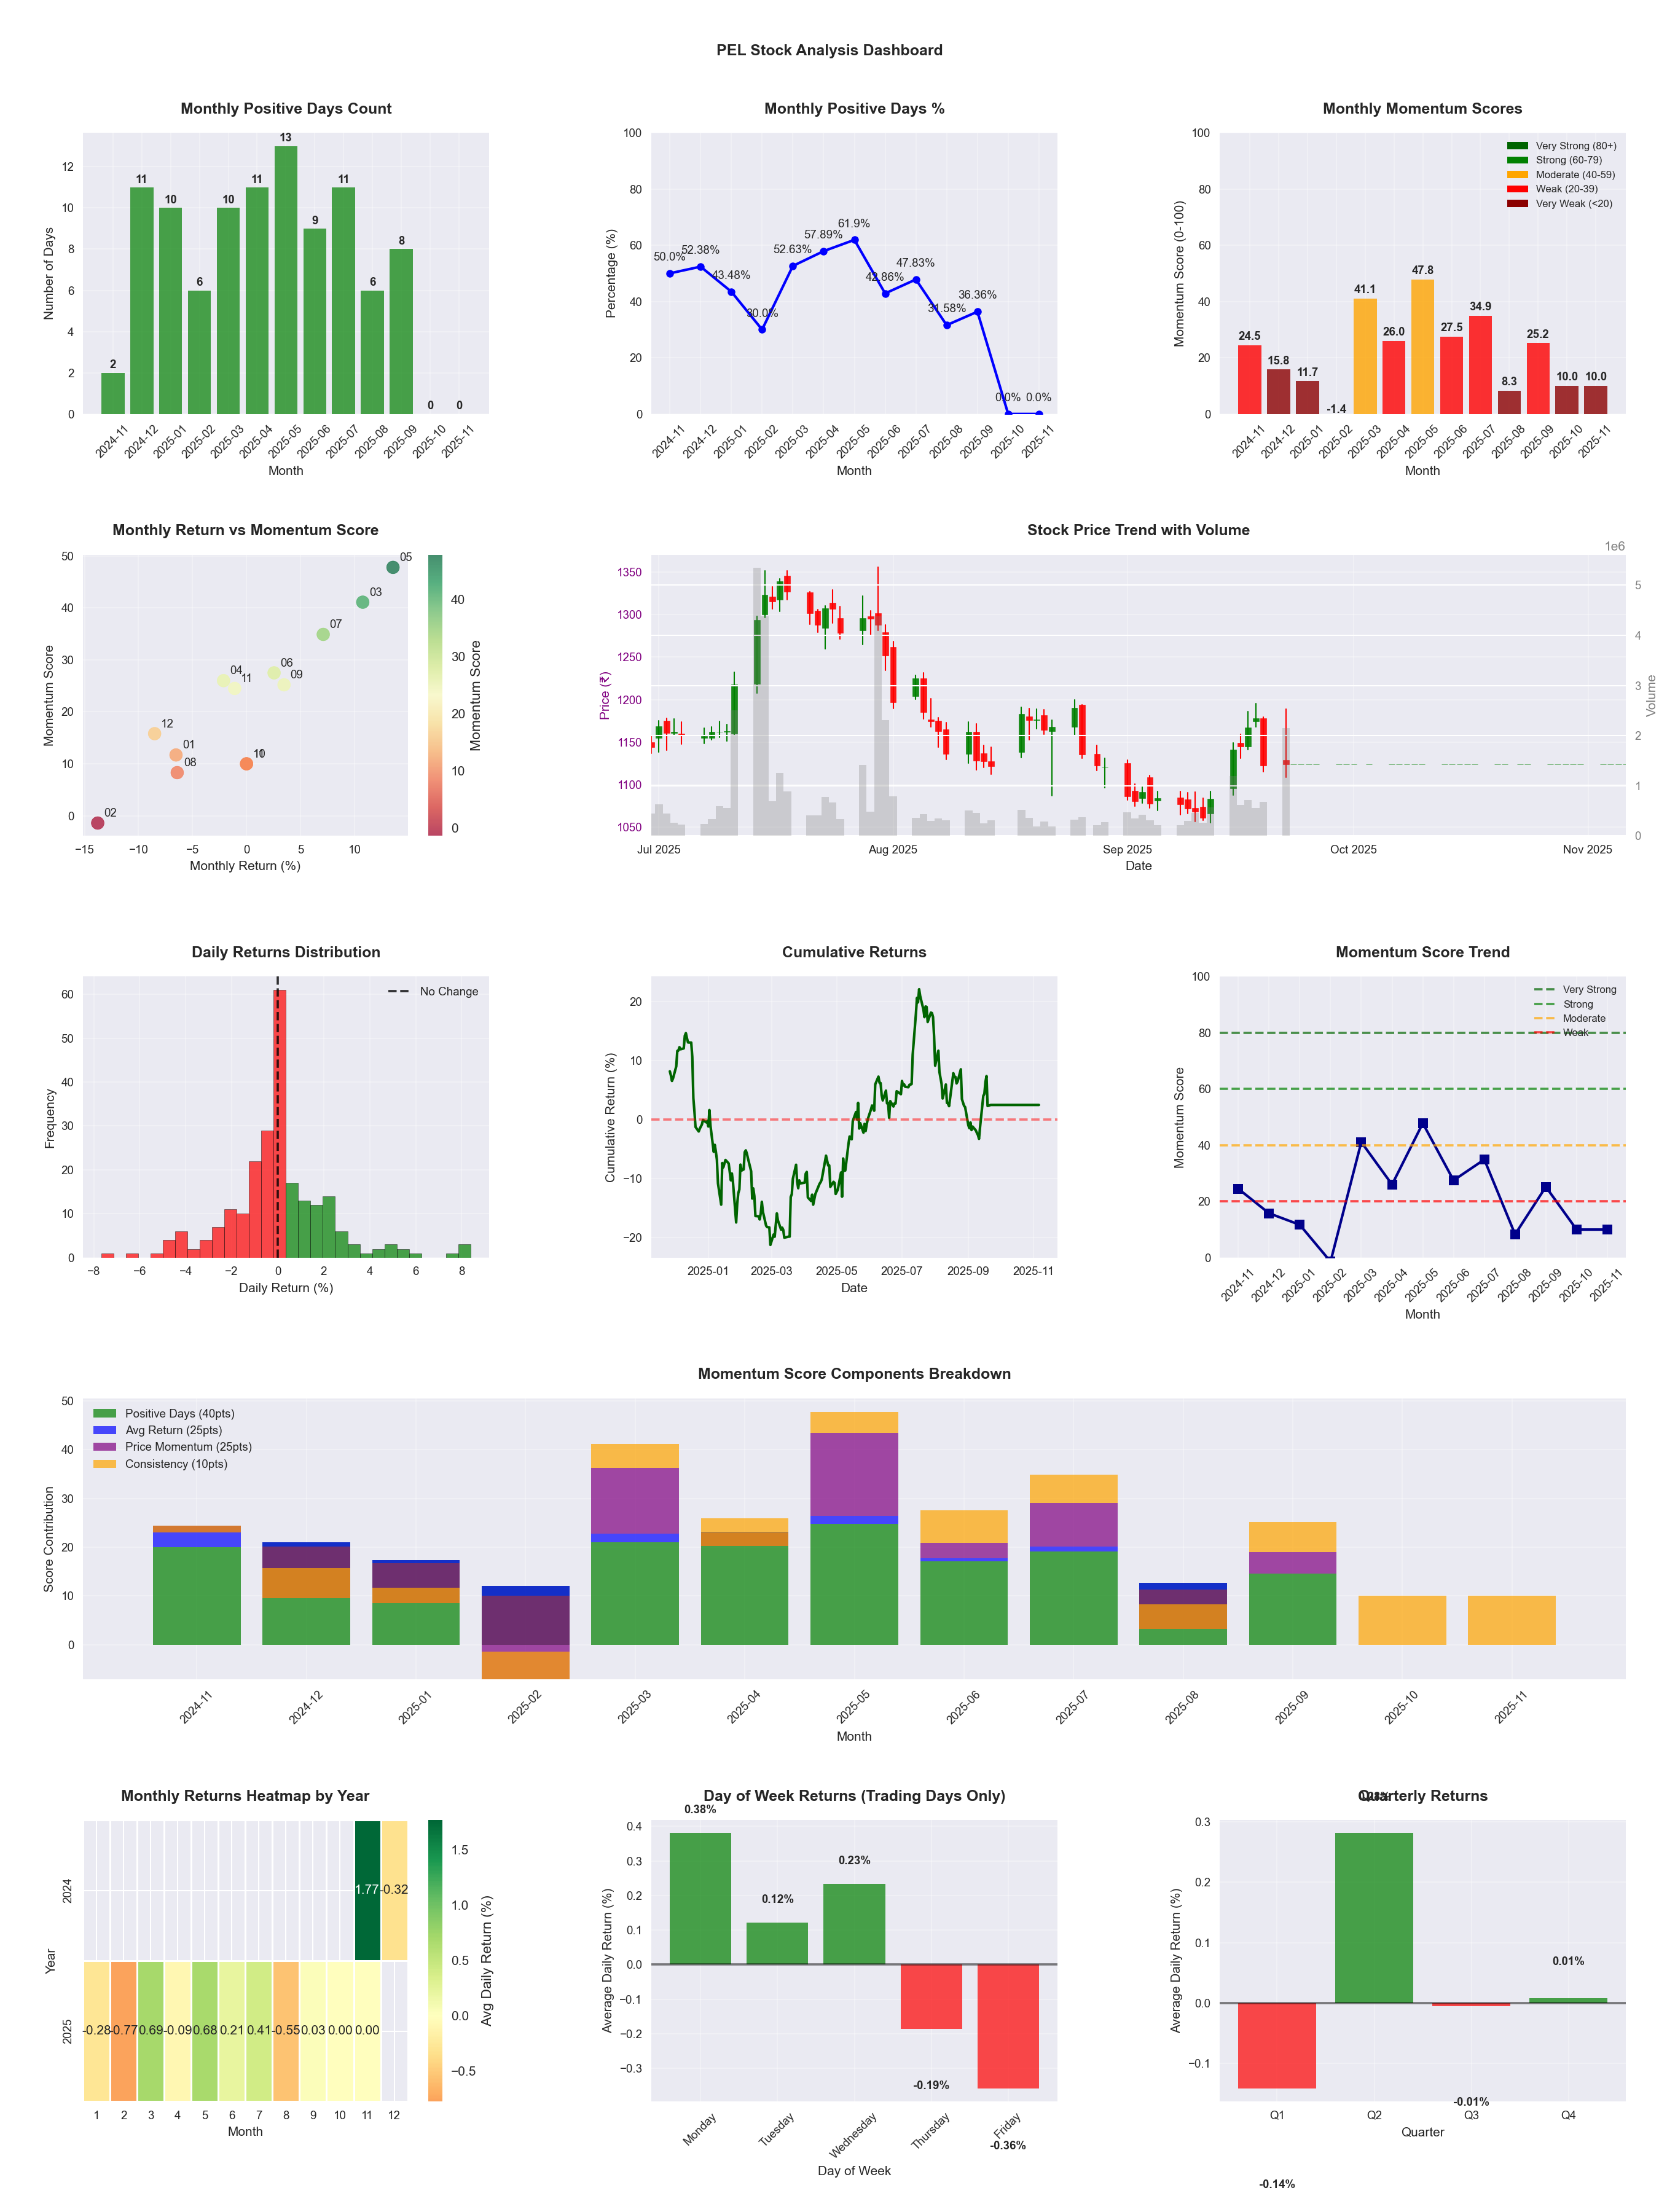
📊 Key Insights & Metrics
Symbol
📈 PEL
Date
📅 2025-11-23
Volatility
🟡 2.27%
Risk Profile
⚠️ suitable for aggressive investors
Win Rate
⚠️ 40.9%
Avg Daily Return
📈 +0.04%
Max Drawdown
📉 -31.30%
Best Month
🏆 2025-05
Best Months to Trade
📅 Nov, Mar, May
Best Days to Trade
📅 Monday, Wednesday
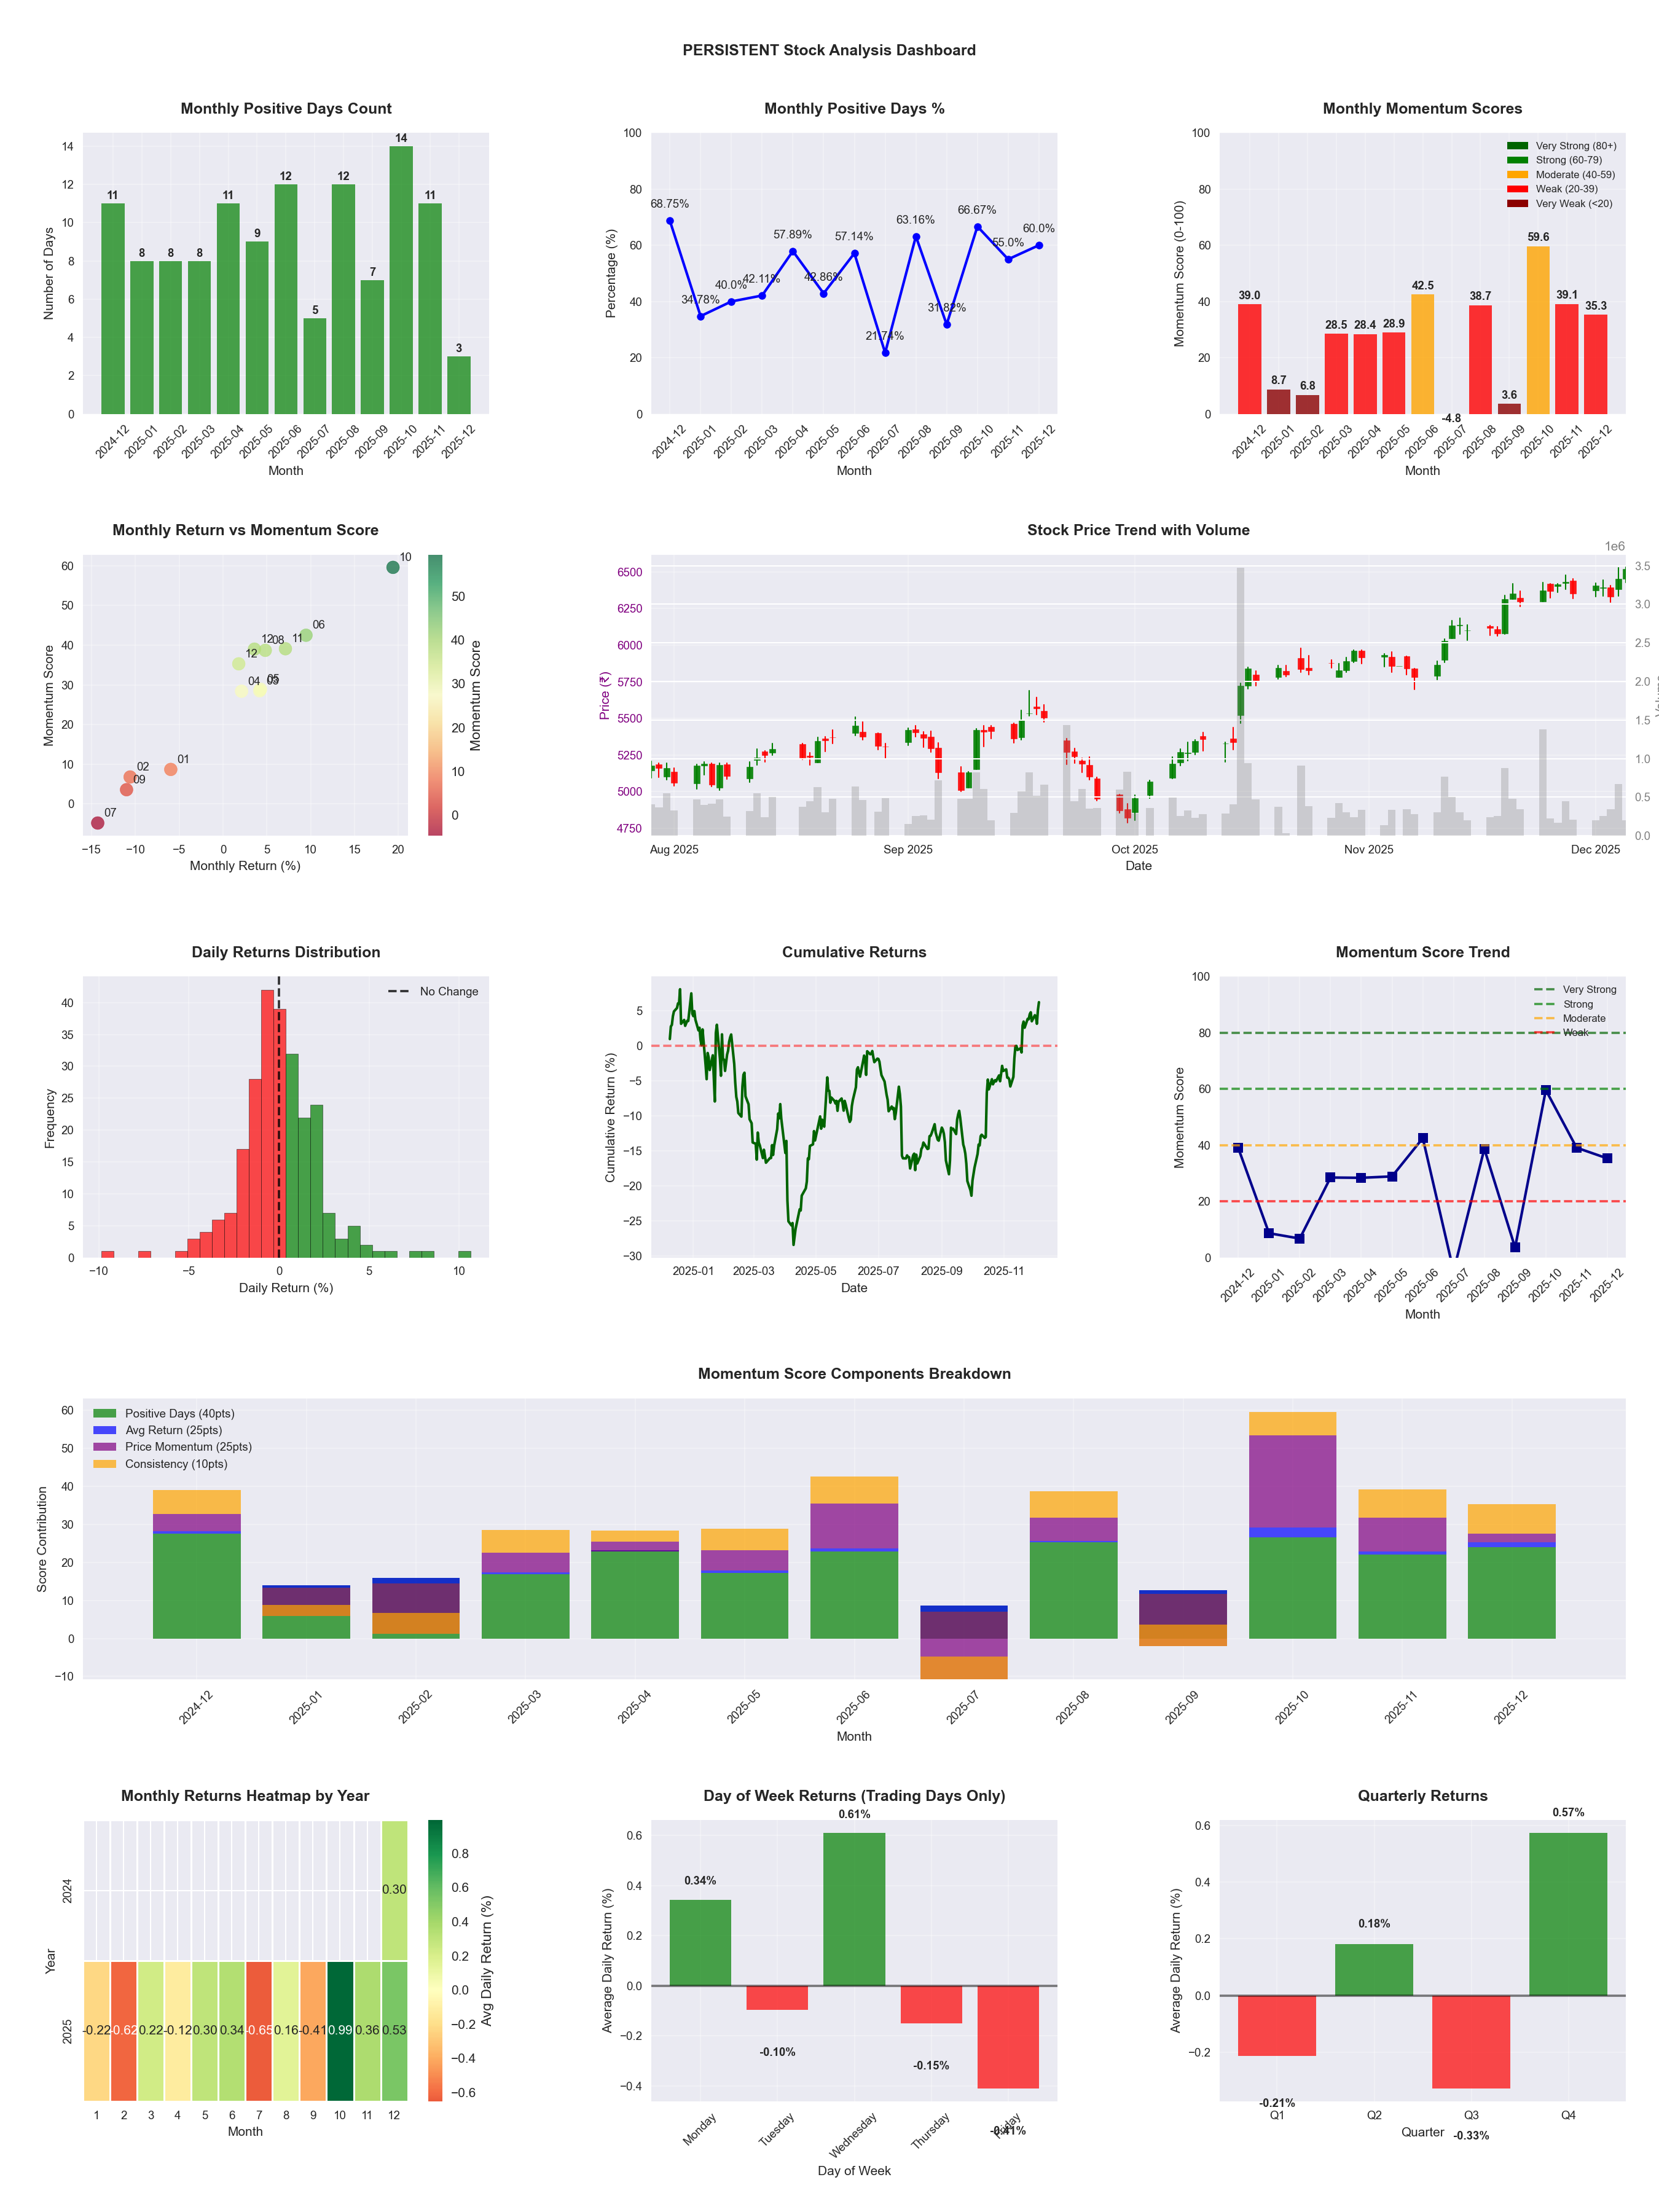
📊 Key Insights & Metrics
Symbol
📈 PERSISTENT
Date
📅 2026-04-11
Volatility
🟡 1.95%
Win Rate
⚠️ 48.4%
Avg Daily Return
📈 +0.09%
Max Drawdown
📉 -30.74%
IBD RS Score
📊 56.2
Average
Market Rank
#216
Best Month
🏆 2025-10
Best Months to Trade
📅 Apr, Oct, Nov
Best Days to Trade
📅 Monday, Wednesday
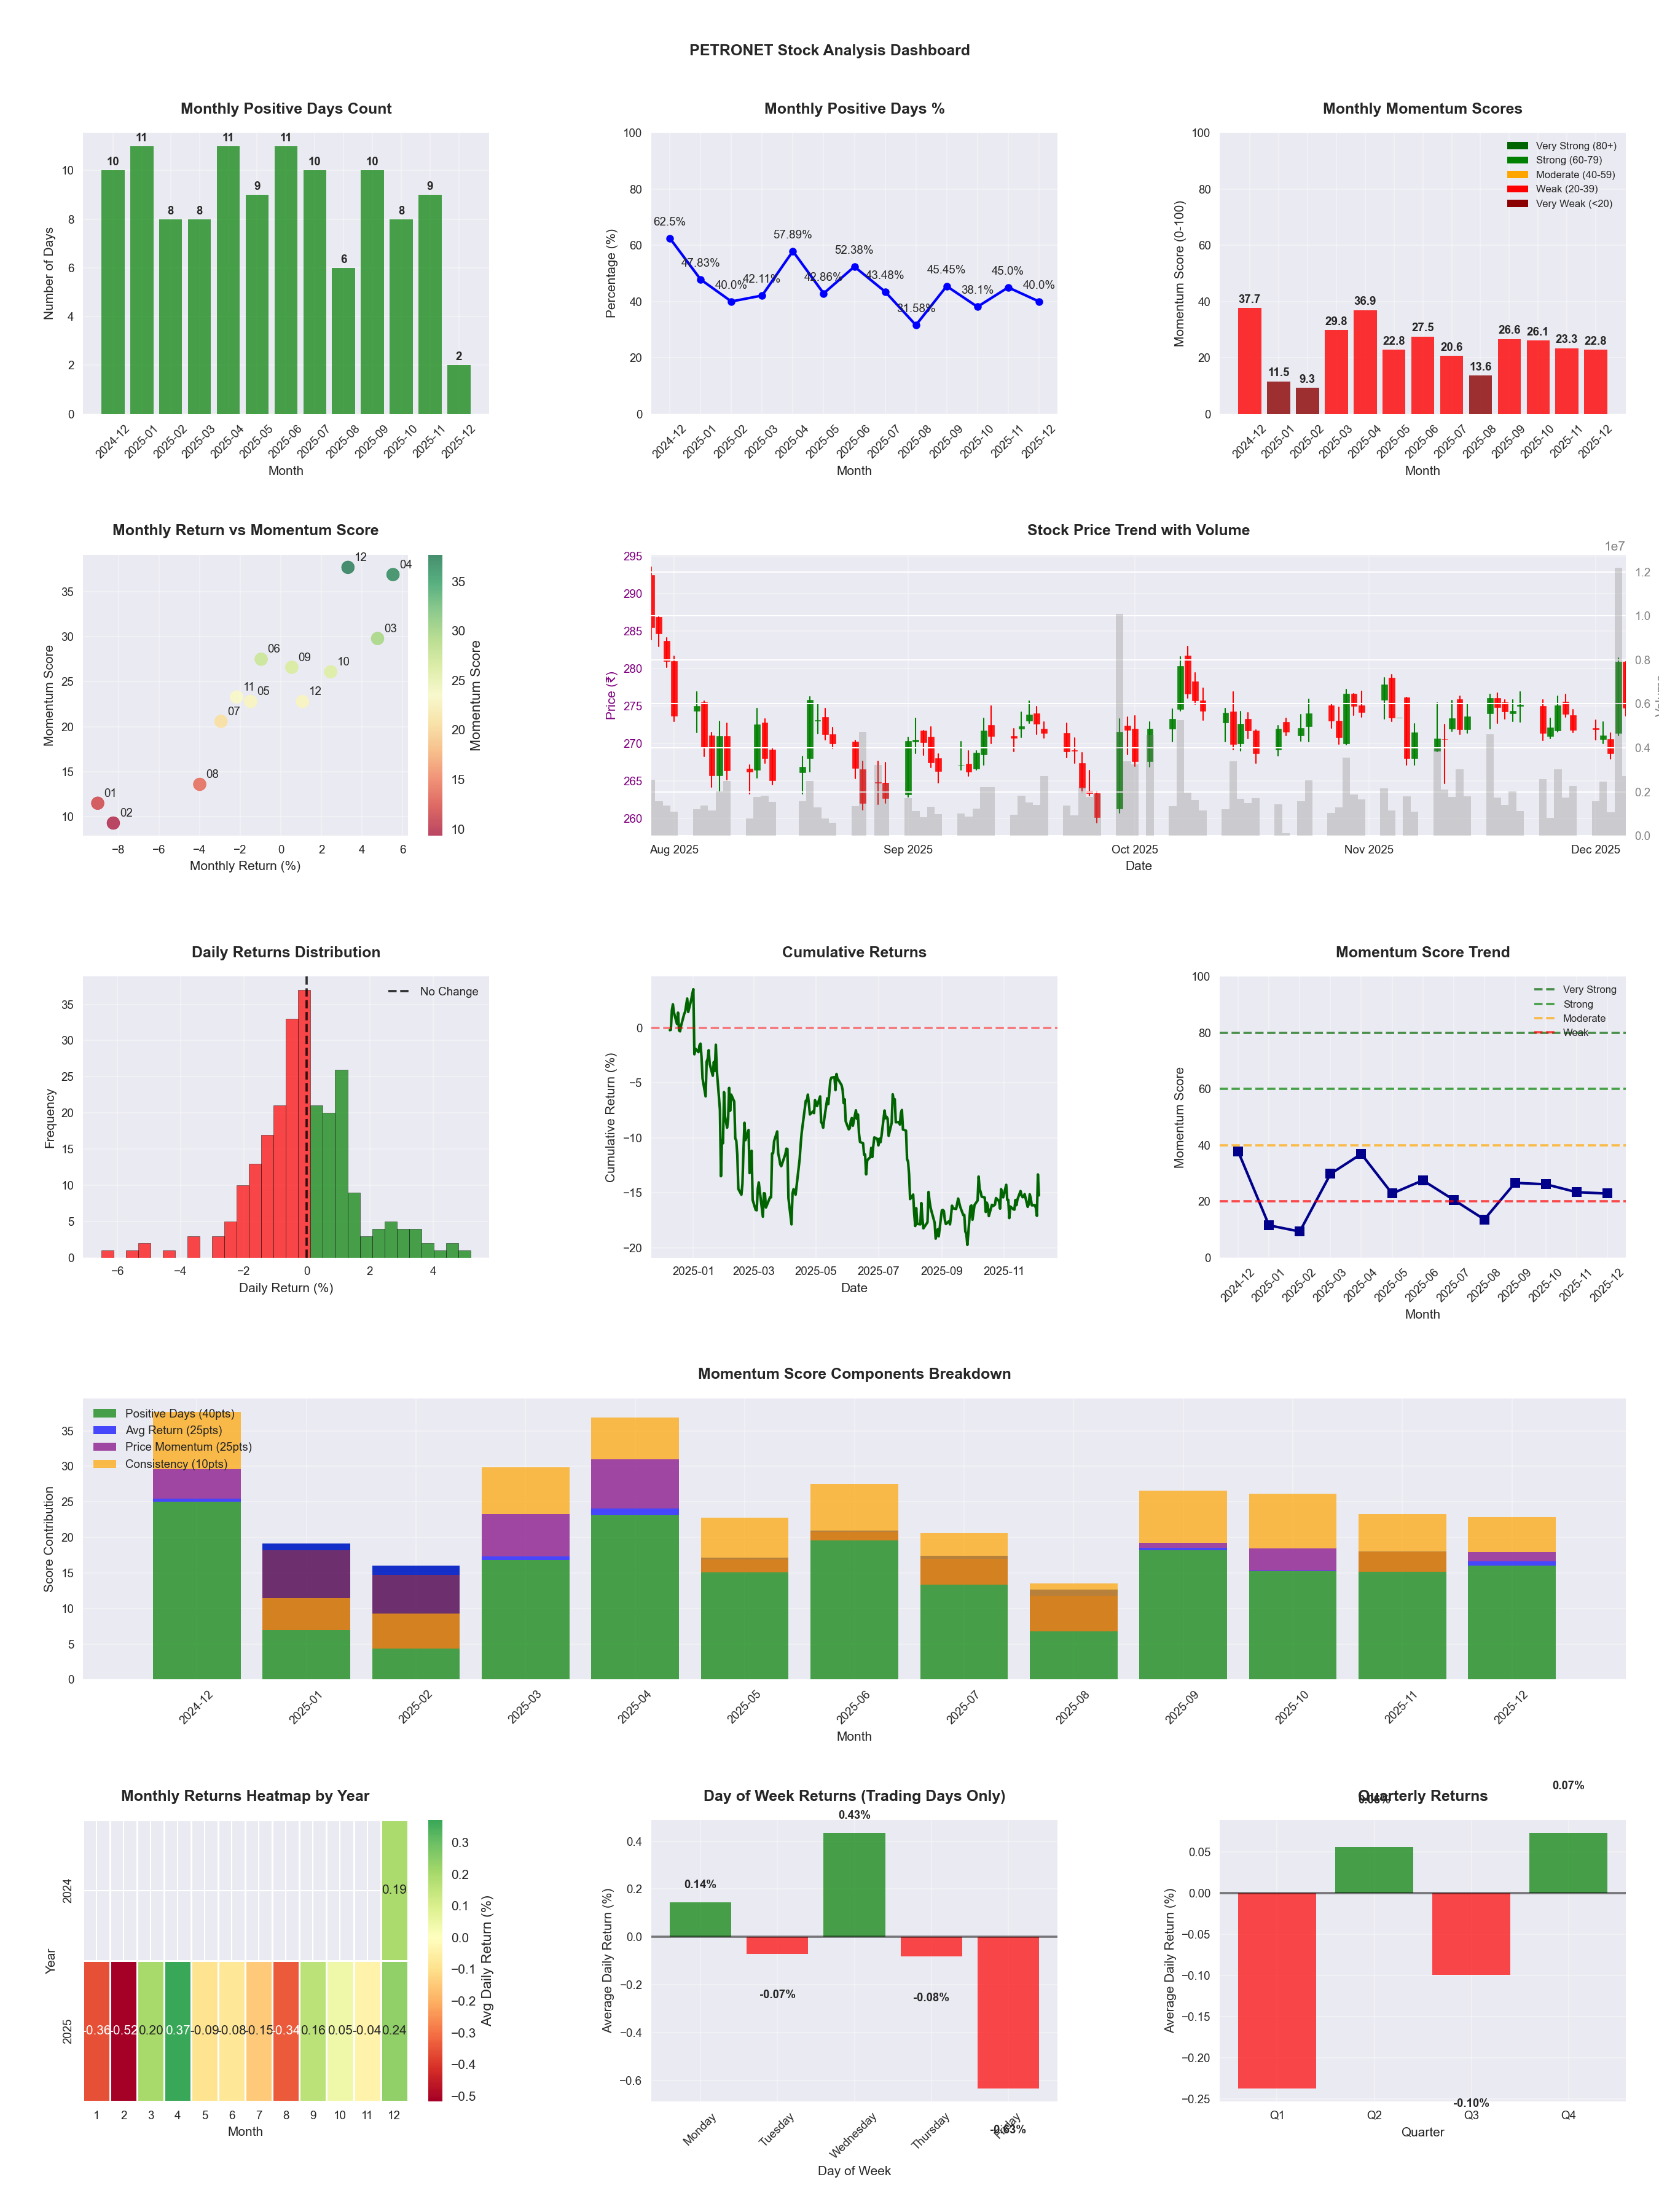
📊 Key Insights & Metrics
Symbol
📈 PETRONET
Date
📅 2026-04-11
Volatility
🟡 1.80%
Win Rate
⚠️ 48.4%
Avg Daily Return
📈 +0.01%
Max Drawdown
📉 -26.39%
IBD RS Score
📊 47.5
Weak
Market Rank
#259
Best Month
🏆 2026-02
Best Months to Trade
📅 Apr, Feb, Dec
Best Days to Trade
📅 Wednesday, Tuesday
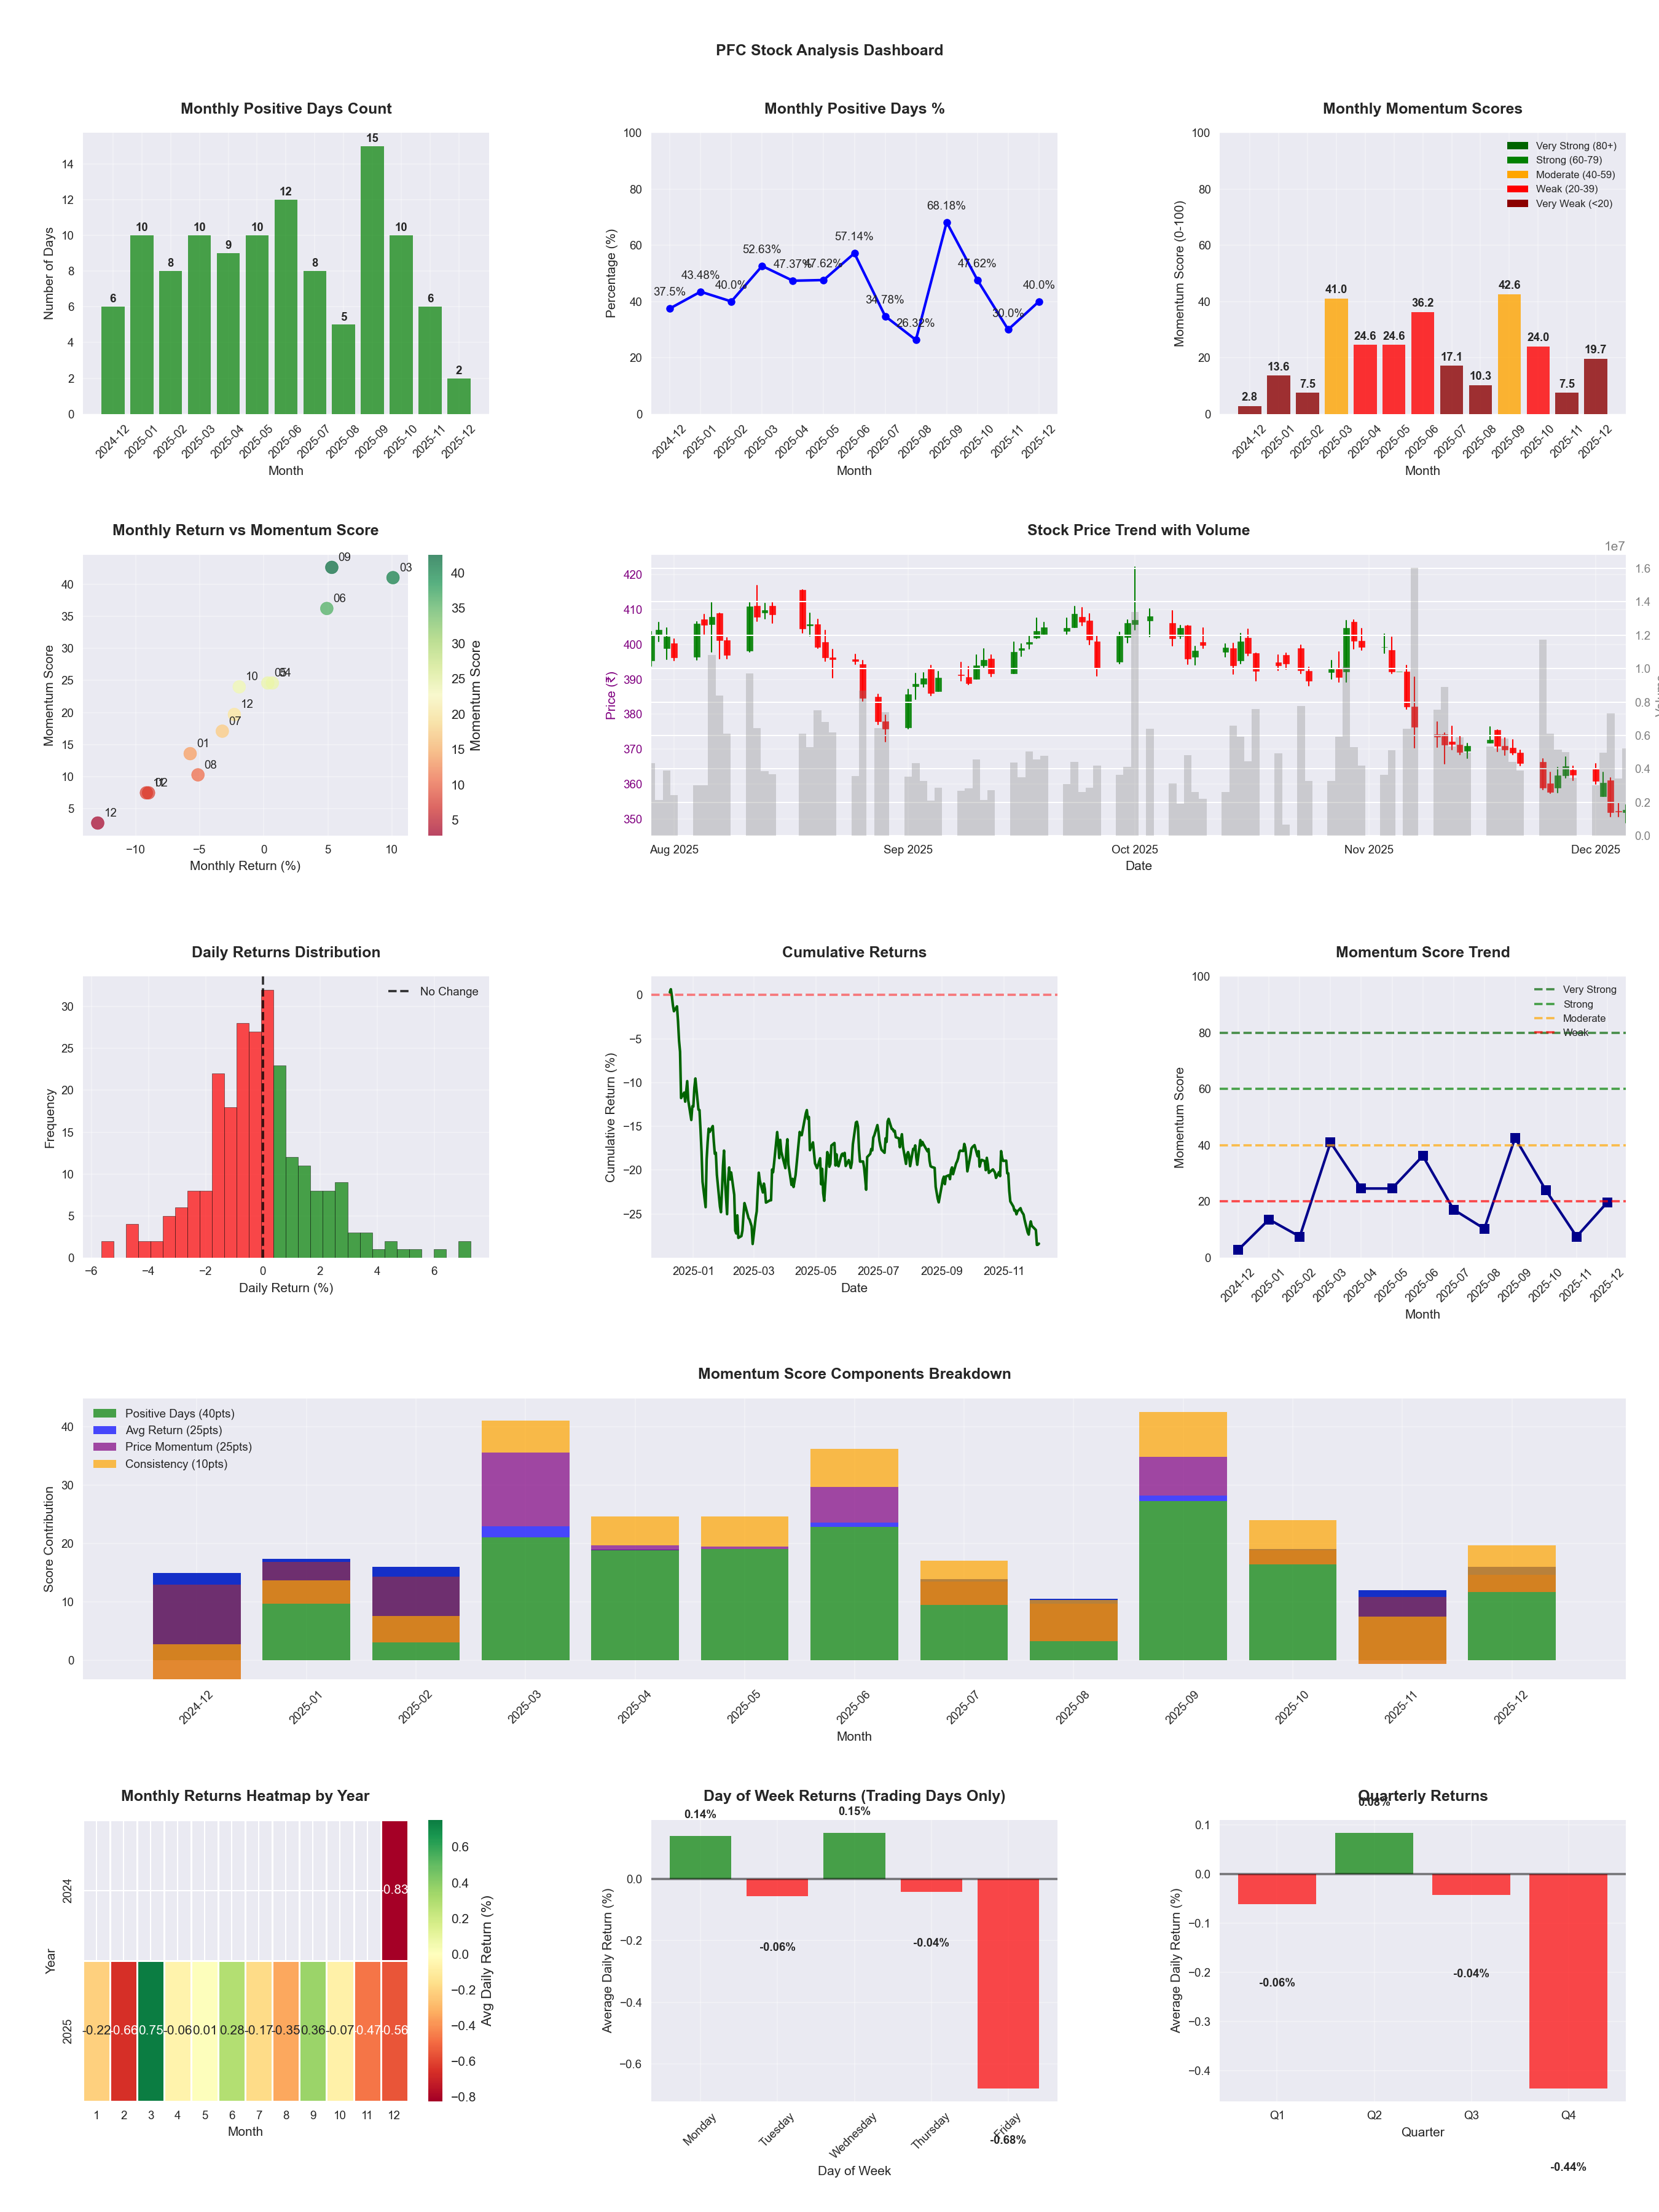
📊 Key Insights & Metrics
Symbol
📈 PFC
Date
📅 2026-04-11
Volatility
🟡 1.82%
Win Rate
⚠️ 49.2%
Avg Daily Return
📈 +0.07%
Max Drawdown
📉 -21.67%
IBD RS Score
📊 82.4
Strong
Market Rank
#87
Best Month
🏆 2026-04
Worst Month
📉 2025-11
Best Months to Trade
📅 Apr, Feb, Sep
Best Days to Trade
📅 Wednesday, Monday
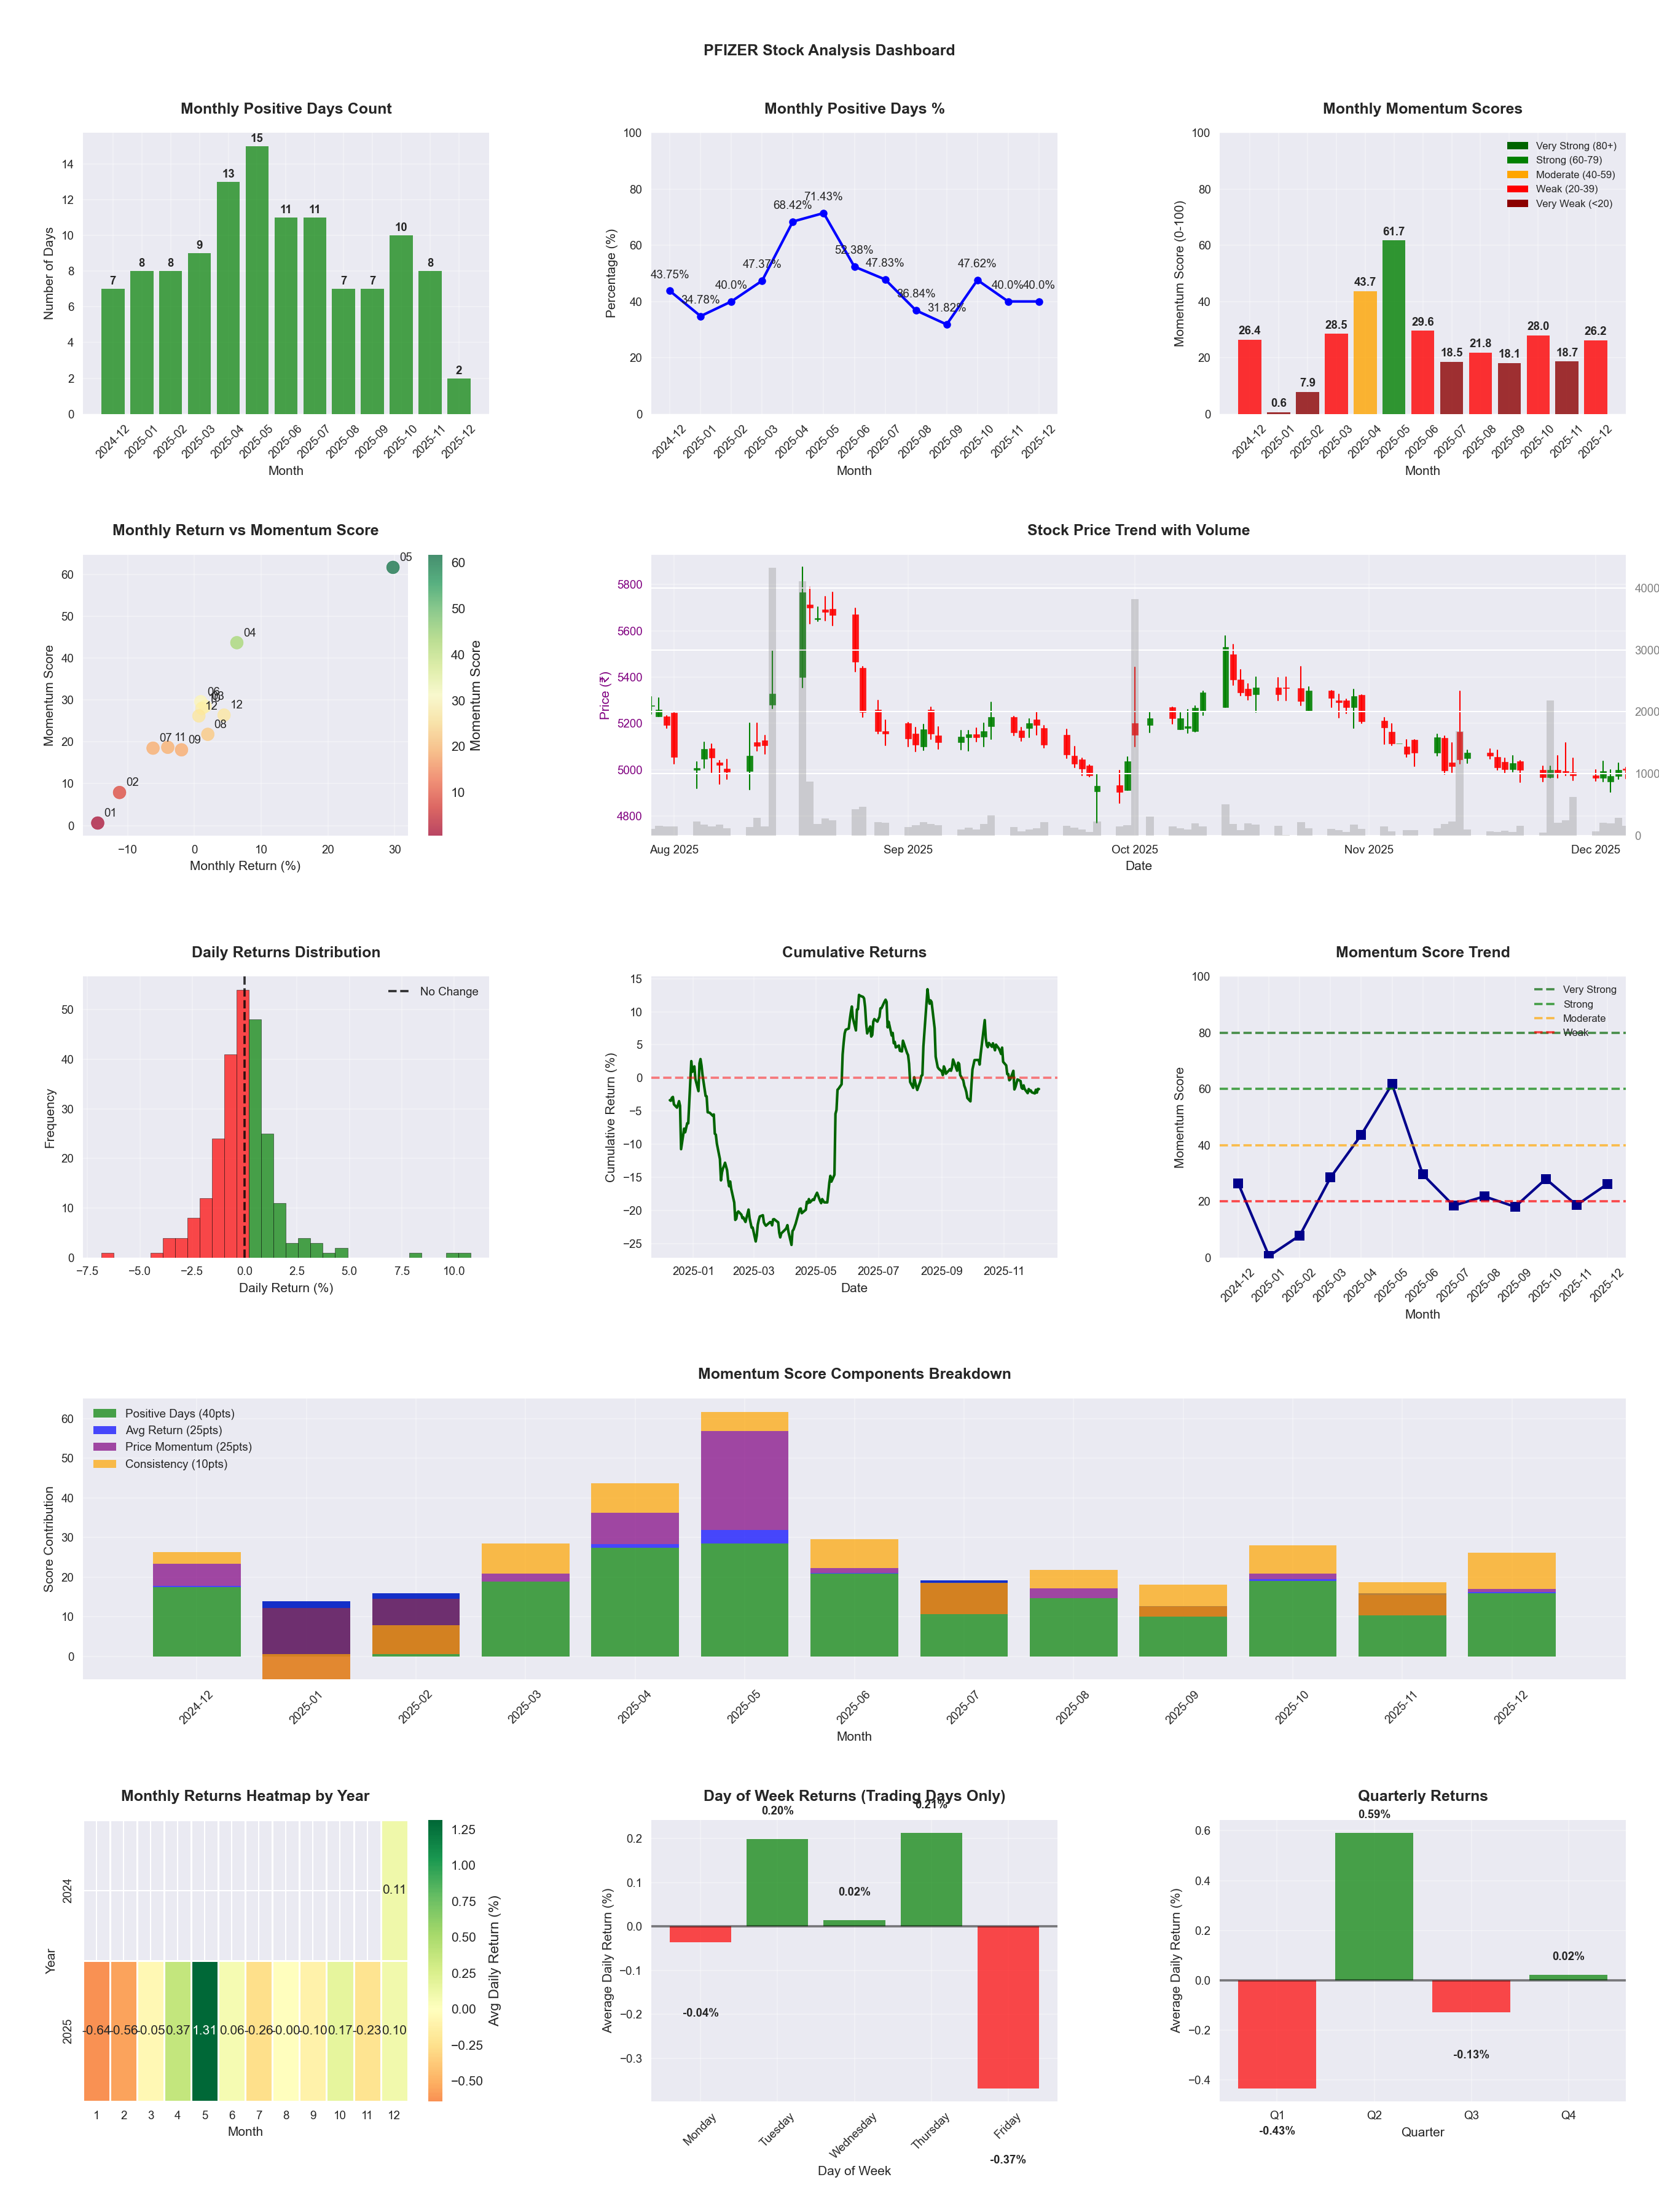
📊 Key Insights & Metrics
Symbol
📈 PFIZER
Date
📅 2026-04-11
Volatility
🟡 1.68%
Win Rate
⚠️ 46.8%
Avg Daily Return
📈 +0.10%
Max Drawdown
📉 -21.08%
IBD RS Score
📊 62.9
Average
Market Rank
#183
Best Month
🏆 2025-05
Worst Month
📉 2026-01
Best Months to Trade
📅 May, Feb, Apr
Best Days to Trade
📅 Tuesday, Wednesday
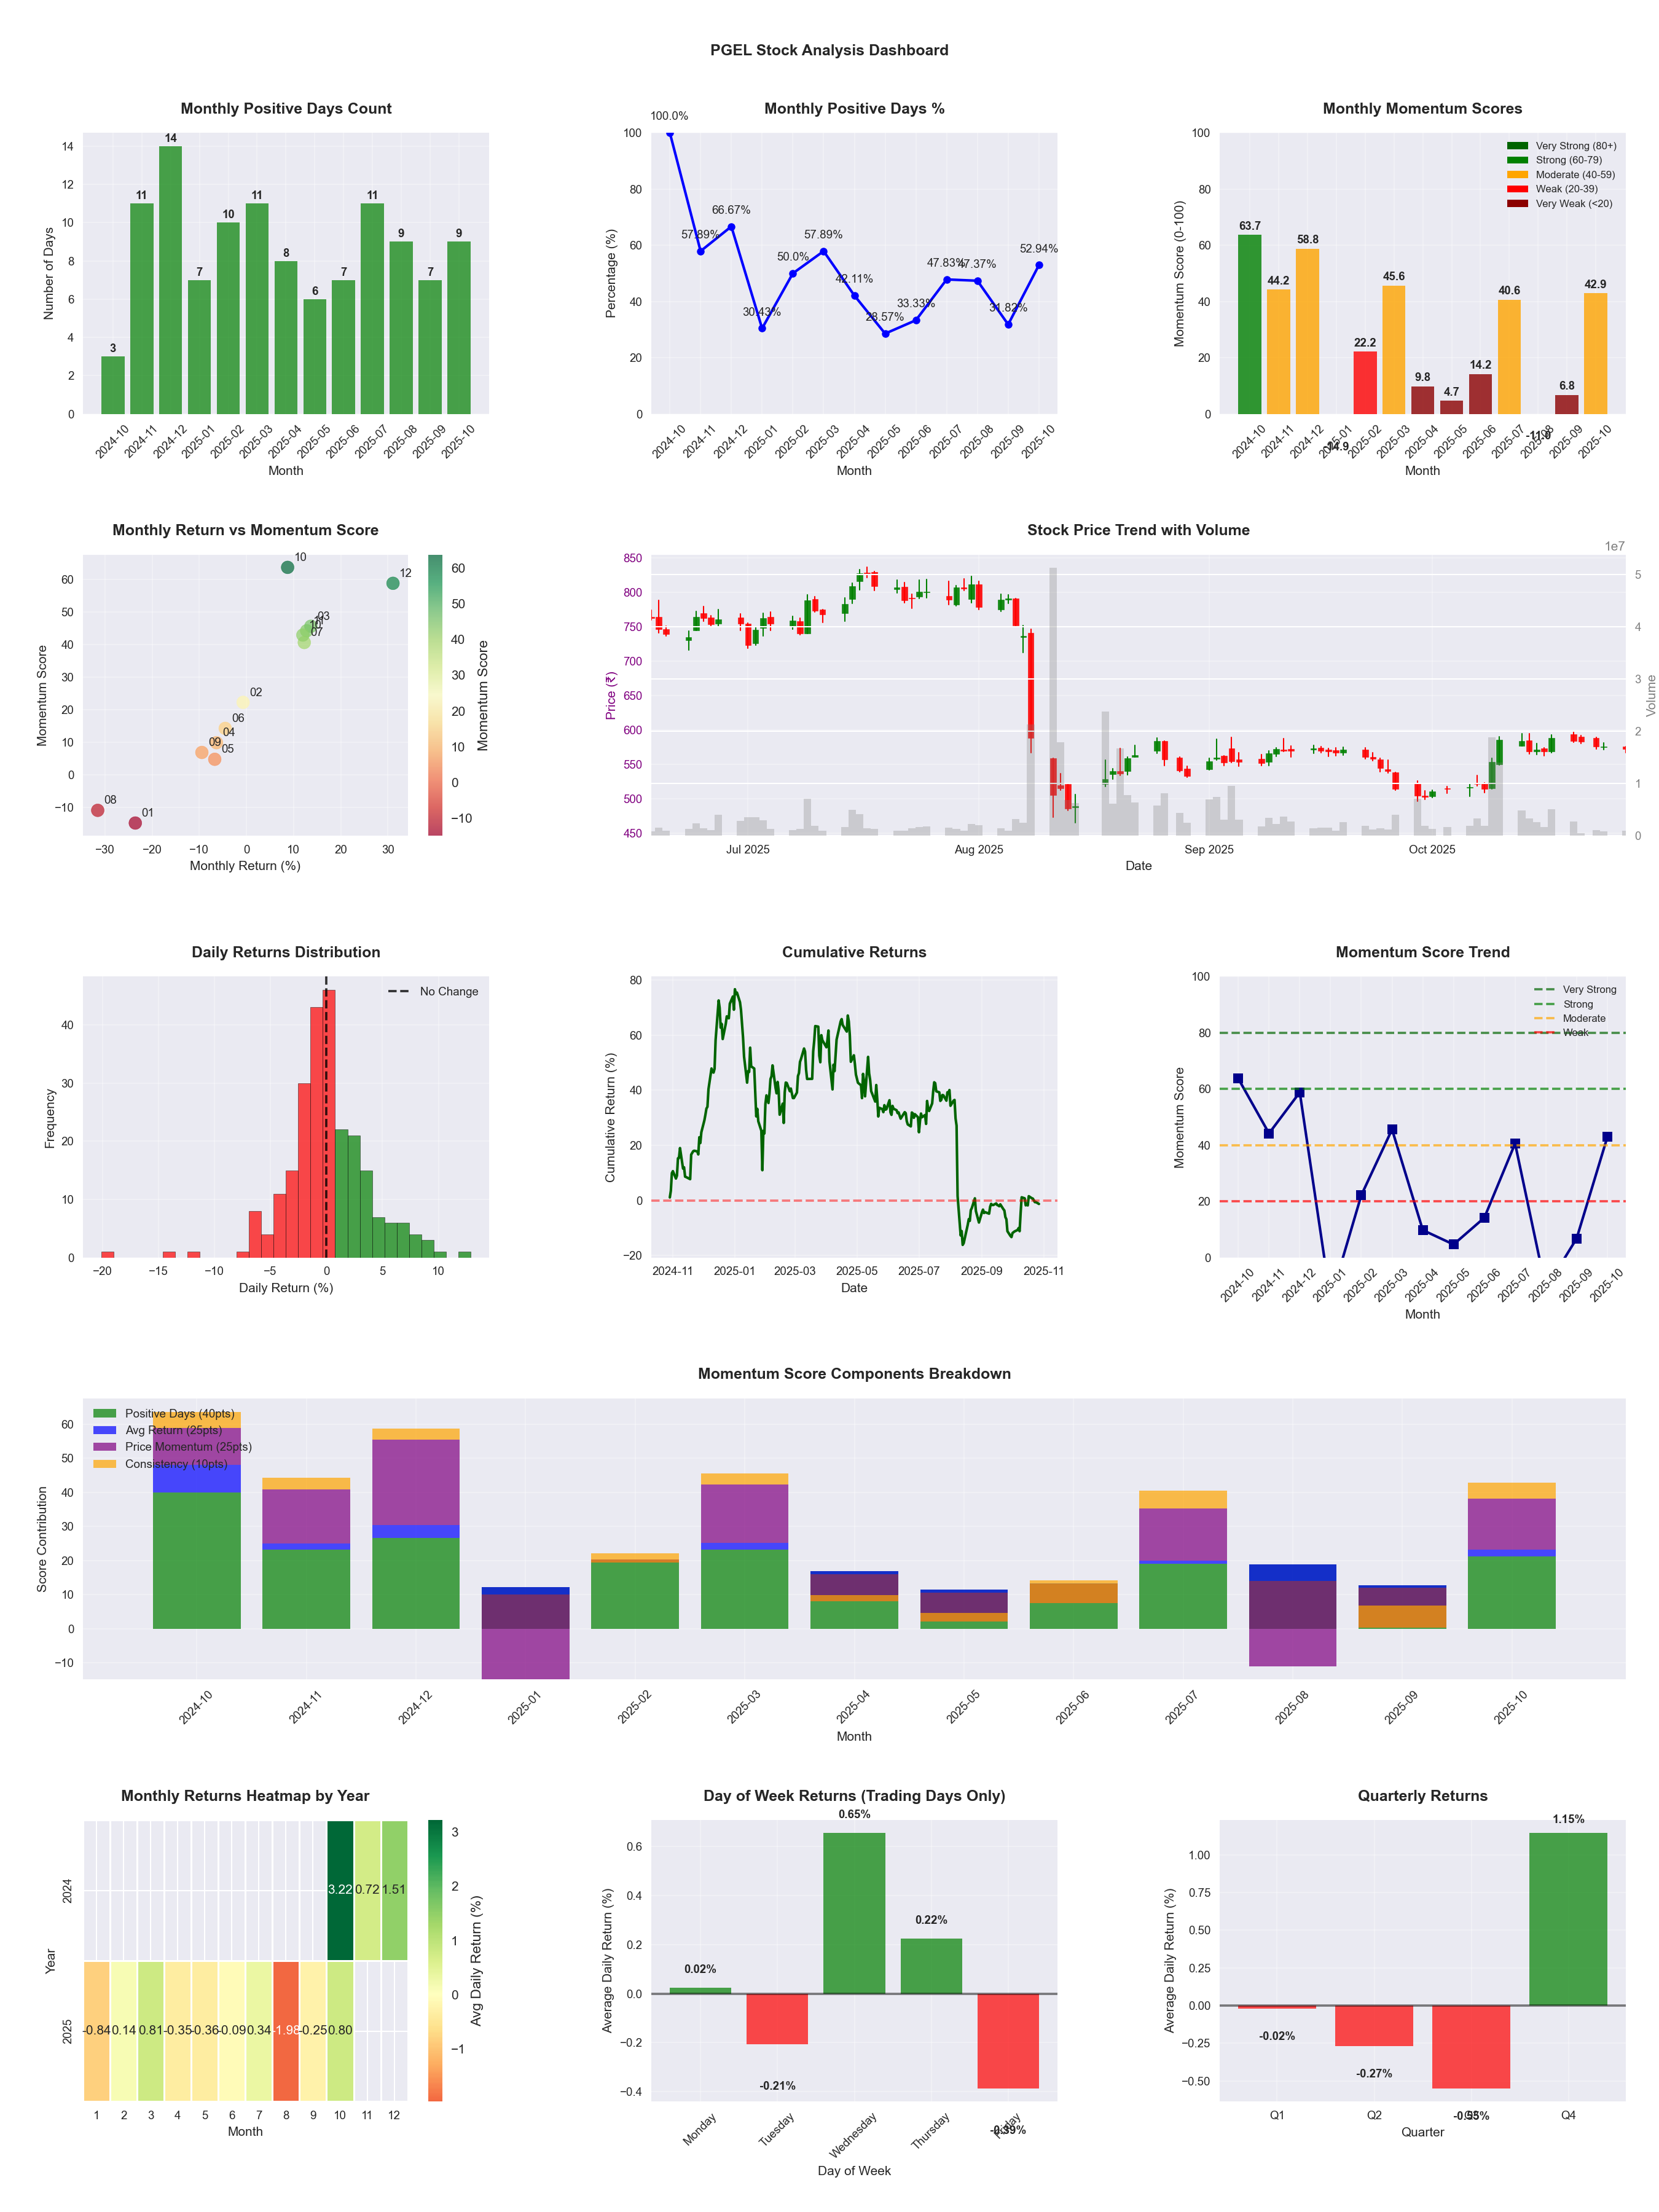
📊 Key Insights & Metrics
Symbol
📈 PGEL
Date
📅 2026-04-11
Volatility
🔴 3.23%
Risk Profile
⚠️ suitable for aggressive investors
Win Rate
⚠️ 43.1%
Avg Daily Return
📉 -0.20%
Max Drawdown
📉 -54.48%
IBD RS Score
📊 4.7
Weak
Market Rank
#470
Best Month
🏆 2026-02
Best Months to Trade
📅 Feb, Oct, Jul
Best Days to Trade
📅 Wednesday, Tuesday
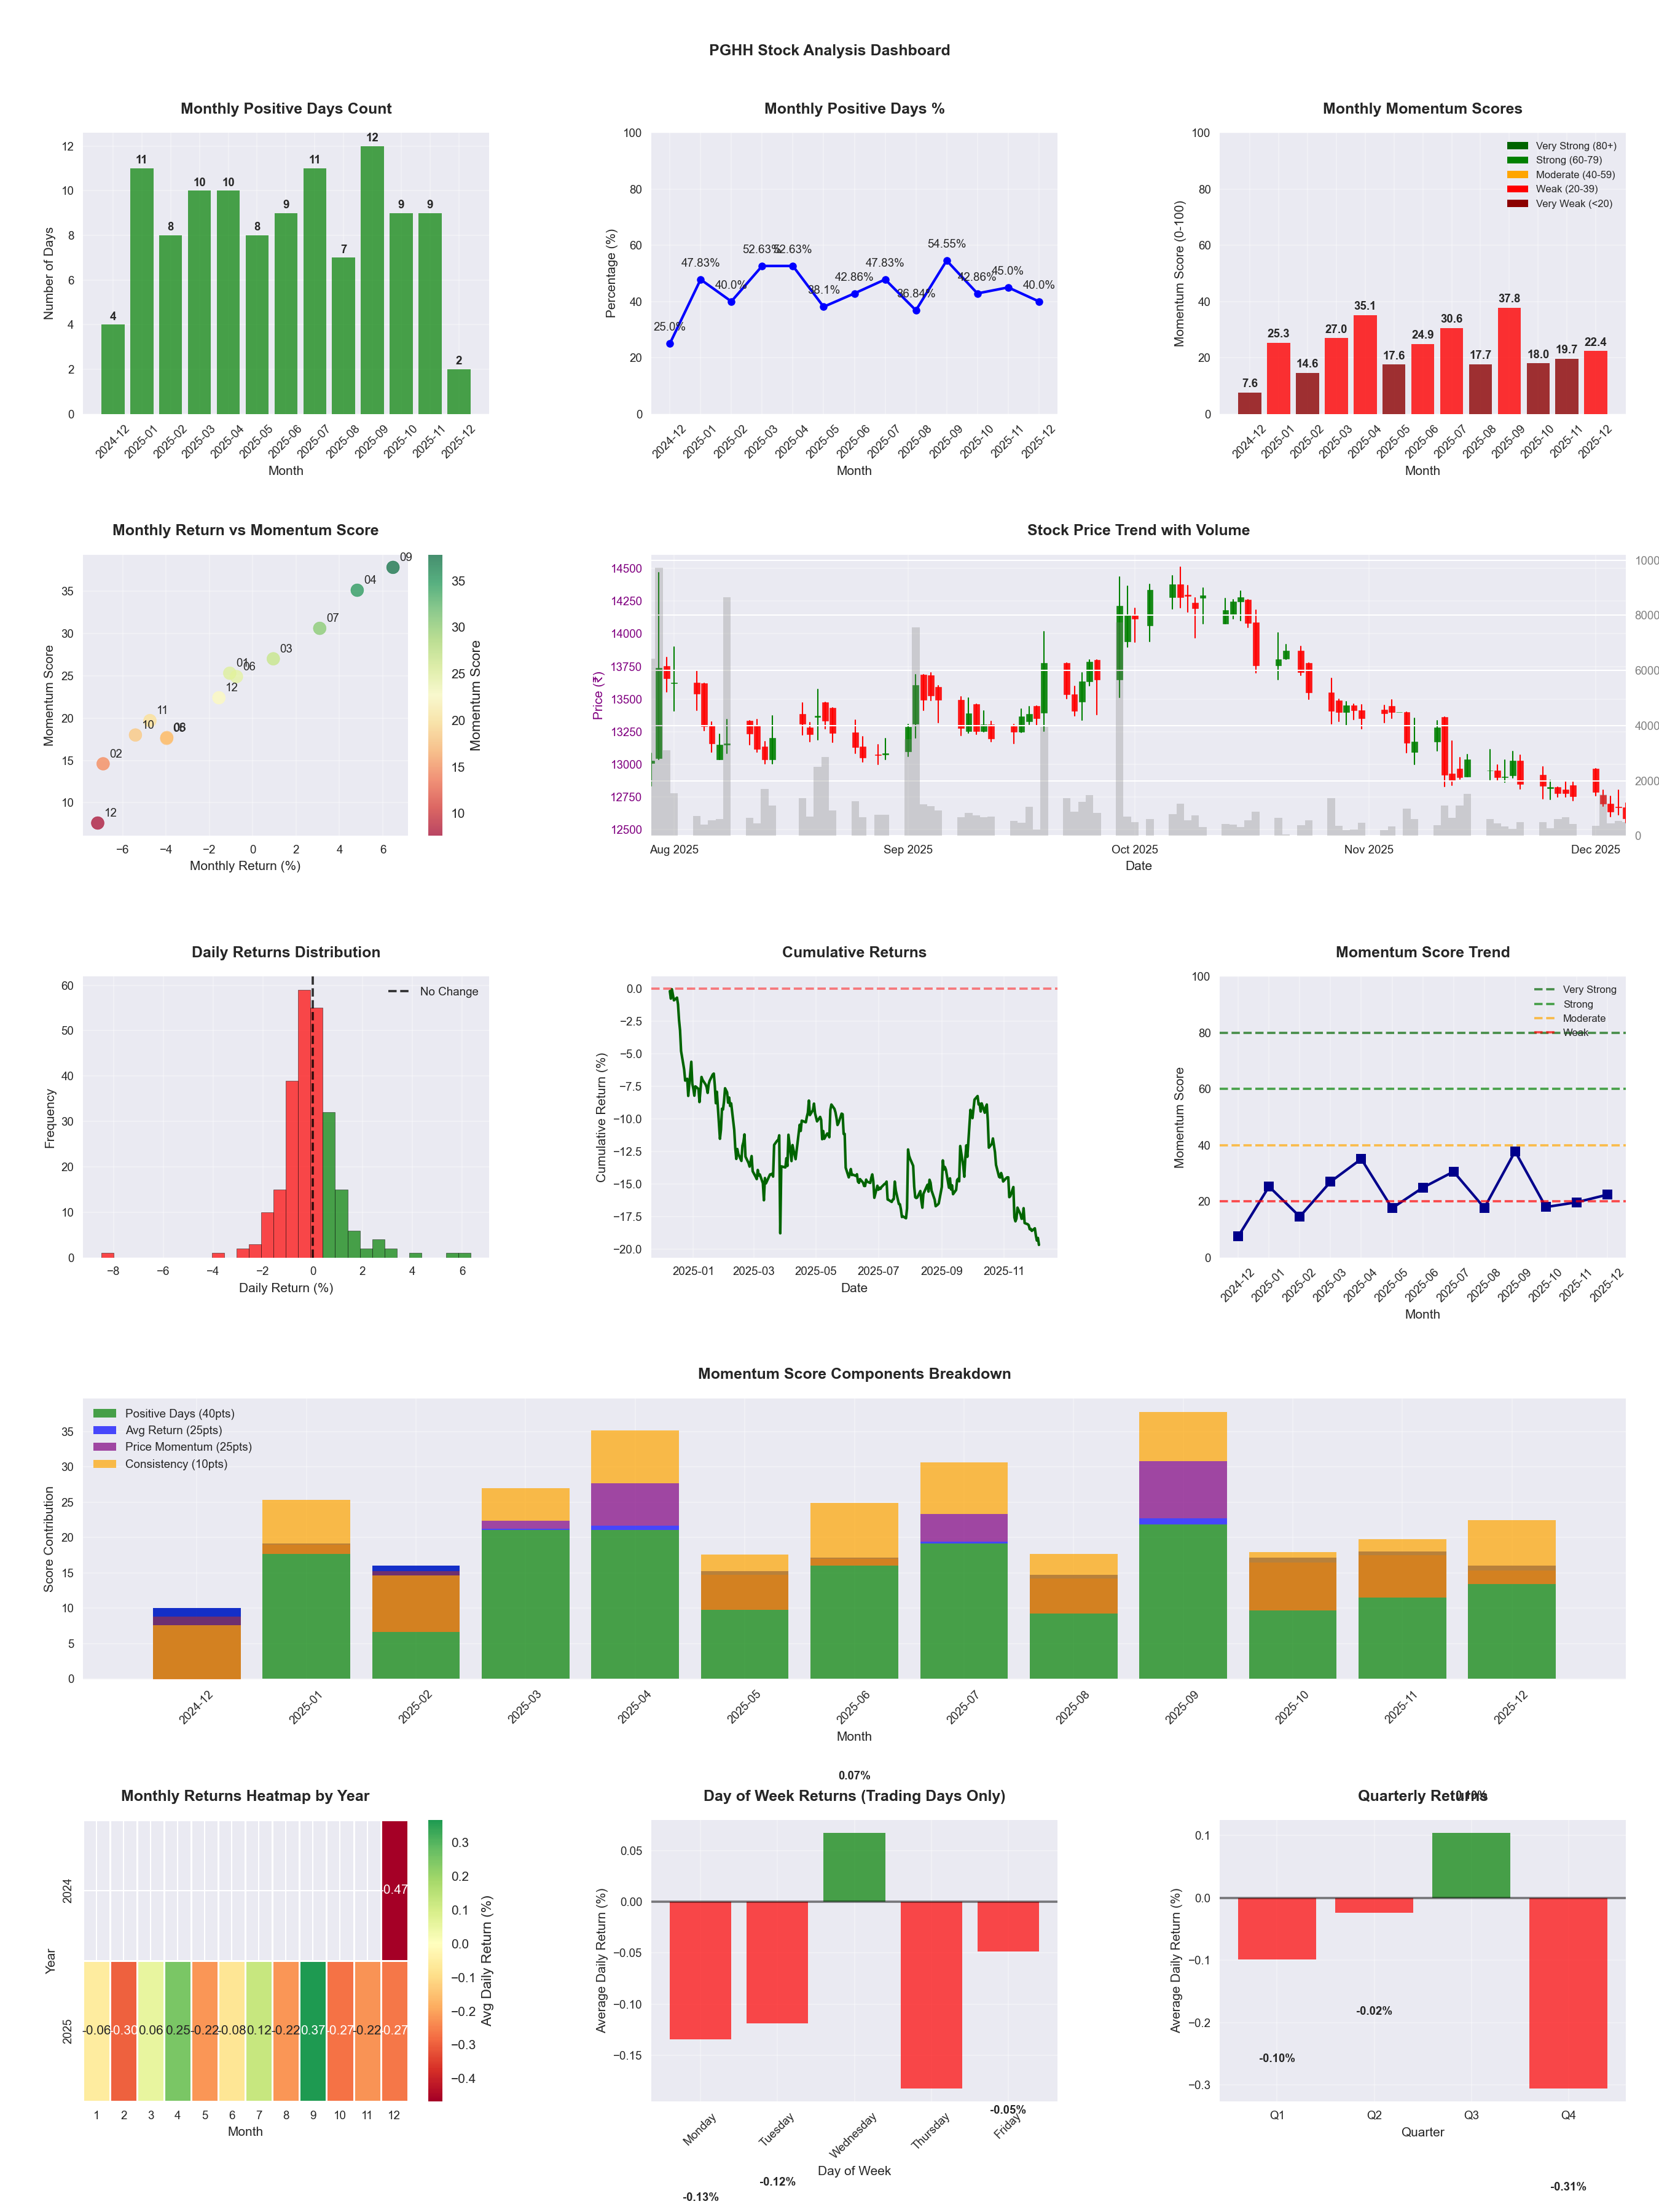
📊 Key Insights & Metrics
Symbol
📈 PGHH
Date
📅 2026-04-11
Volatility
🟢 1.17%
Win Rate
⚠️ 45.3%
Avg Daily Return
📉 -0.12%
Max Drawdown
📉 -35.40%
IBD RS Score
📊 7.3
Weak
Market Rank
#457
Best Month
🏆 2025-09
Best Months to Trade
📅 Apr, Sep, Jul
Best Days to Trade
📅 Wednesday, Tuesday
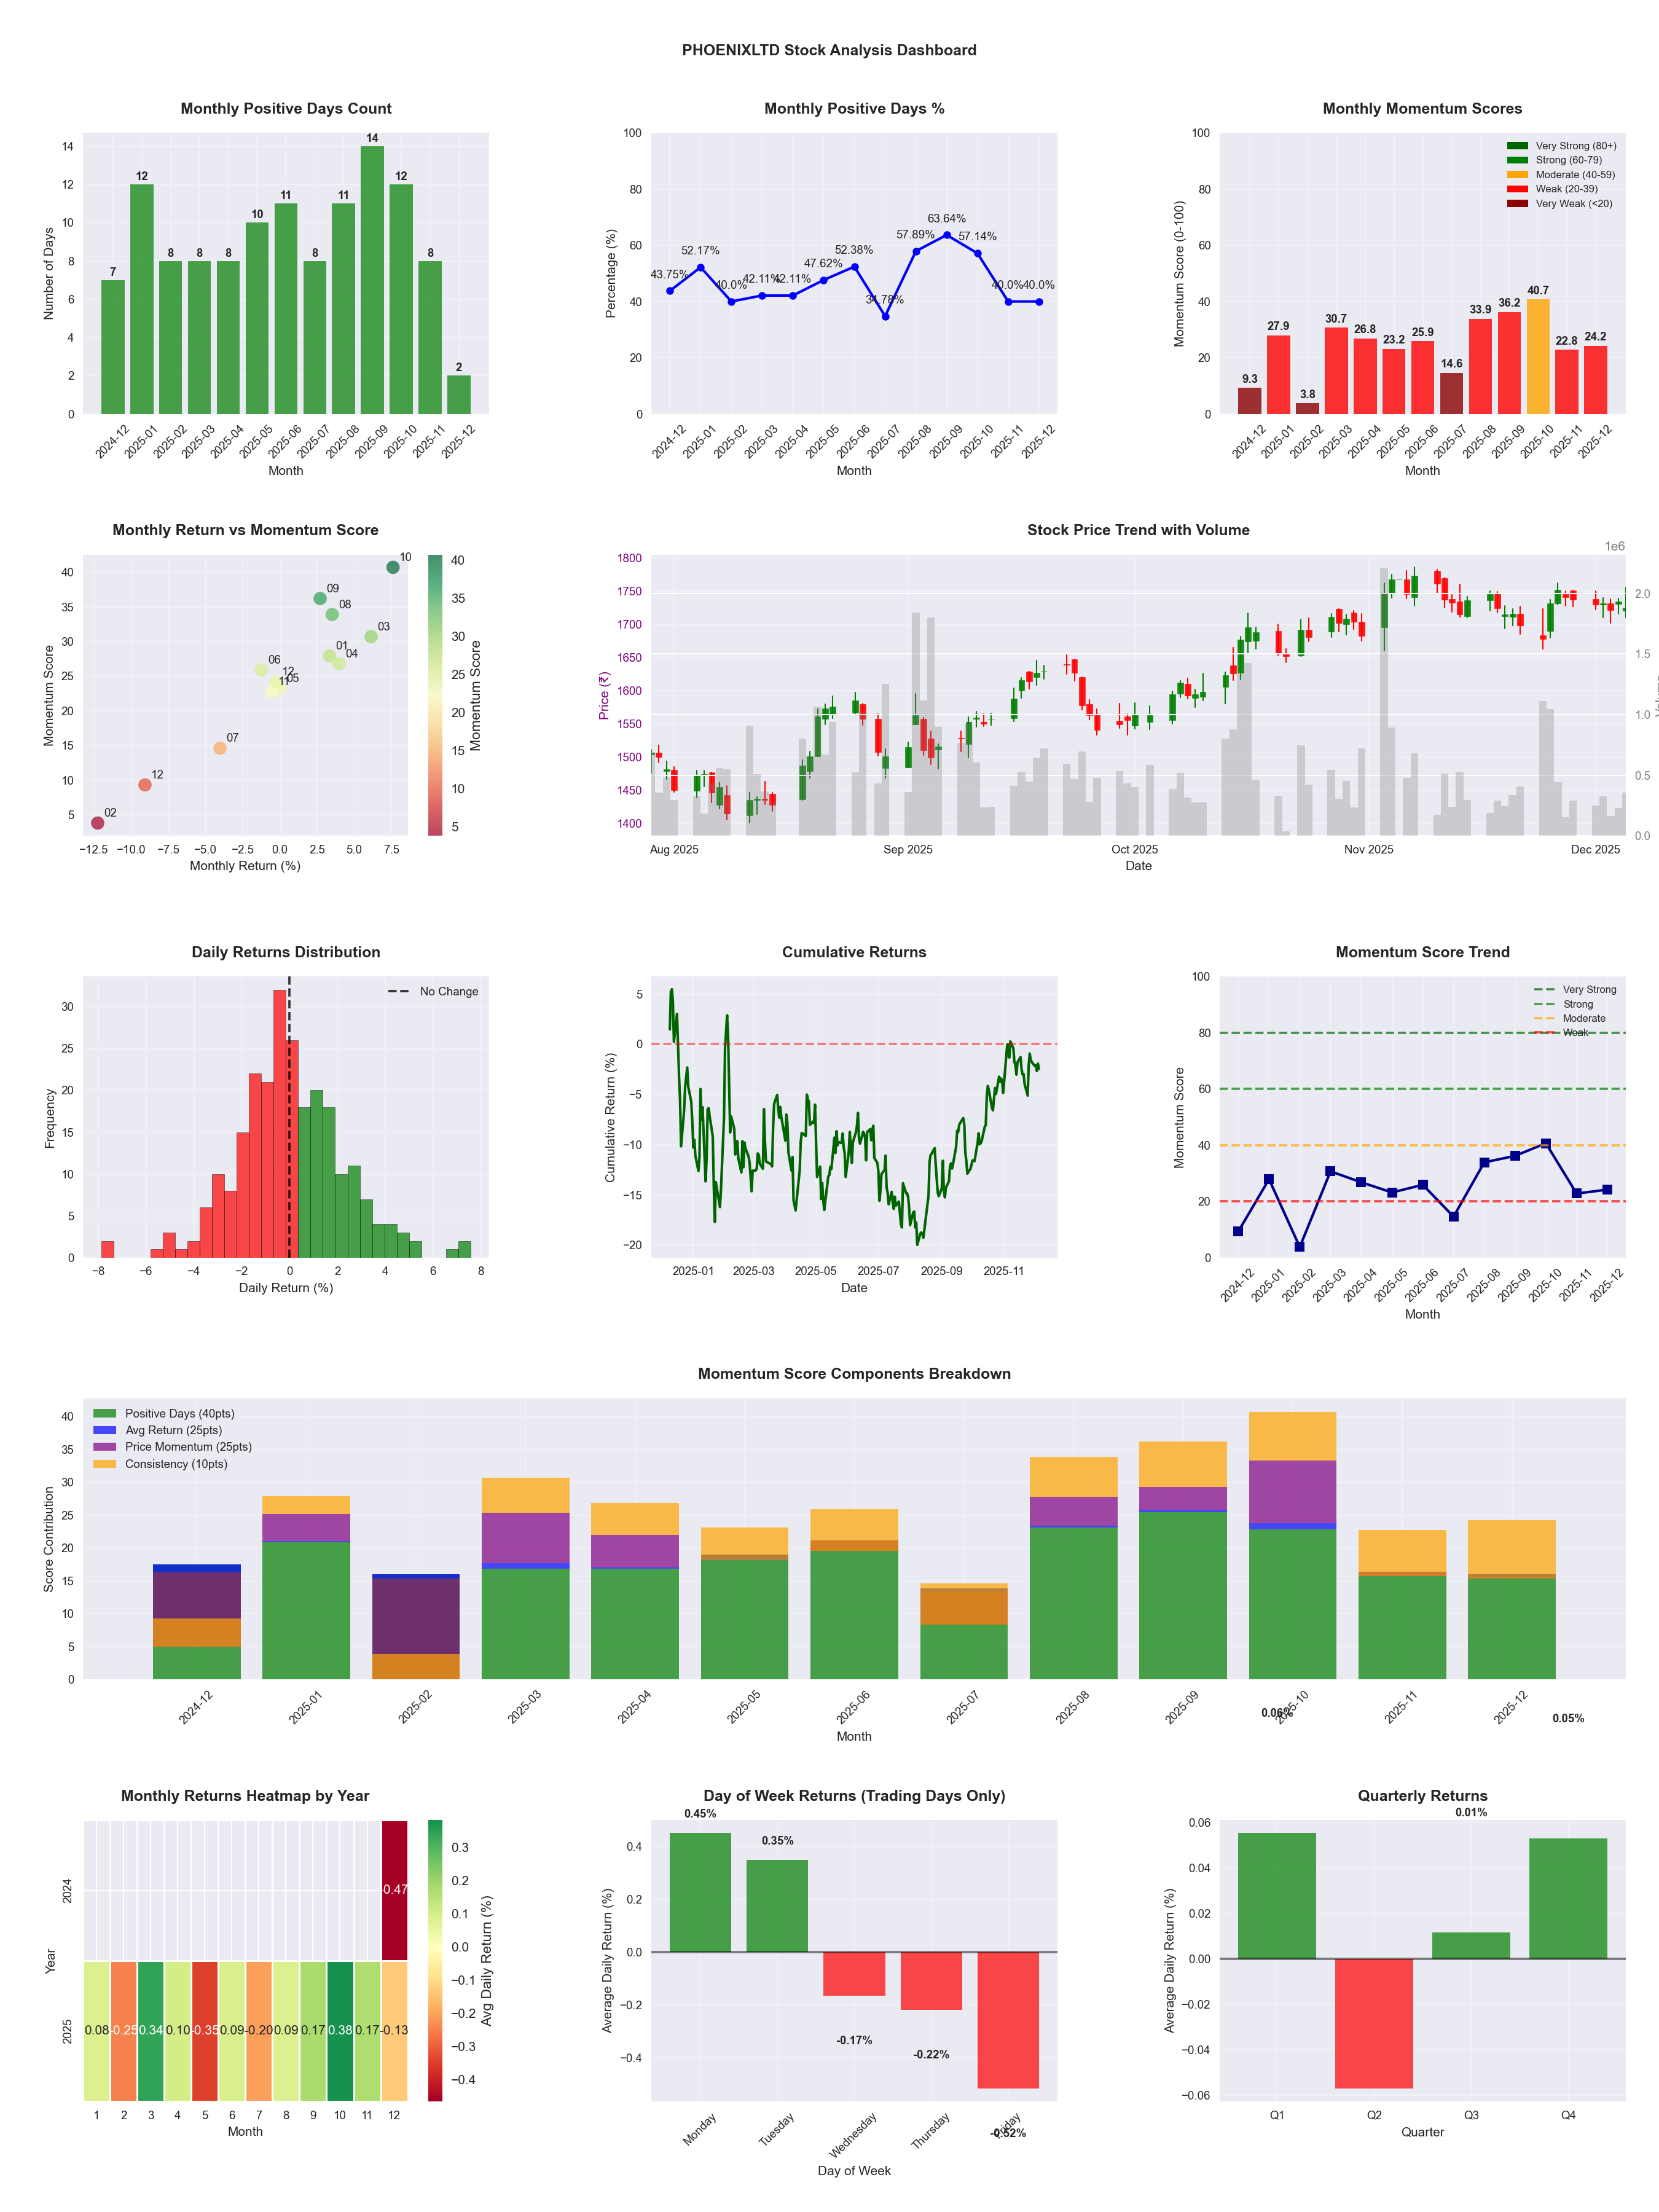
📊 Key Insights & Metrics
Symbol
📈 PHOENIXLTD
Date
📅 2026-04-11
Volatility
🟡 1.84%
Win Rate
⚠️ 51.0%
Avg Daily Return
📈 +0.09%
Max Drawdown
📉 -24.27%
IBD RS Score
📊 71.4
Strong
Market Rank
#141
Best Month
🏆 2026-04
Worst Month
📉 2026-01
Best Months to Trade
📅 Apr, Oct, Dec
Best Days to Trade
📅 Monday, Tuesday
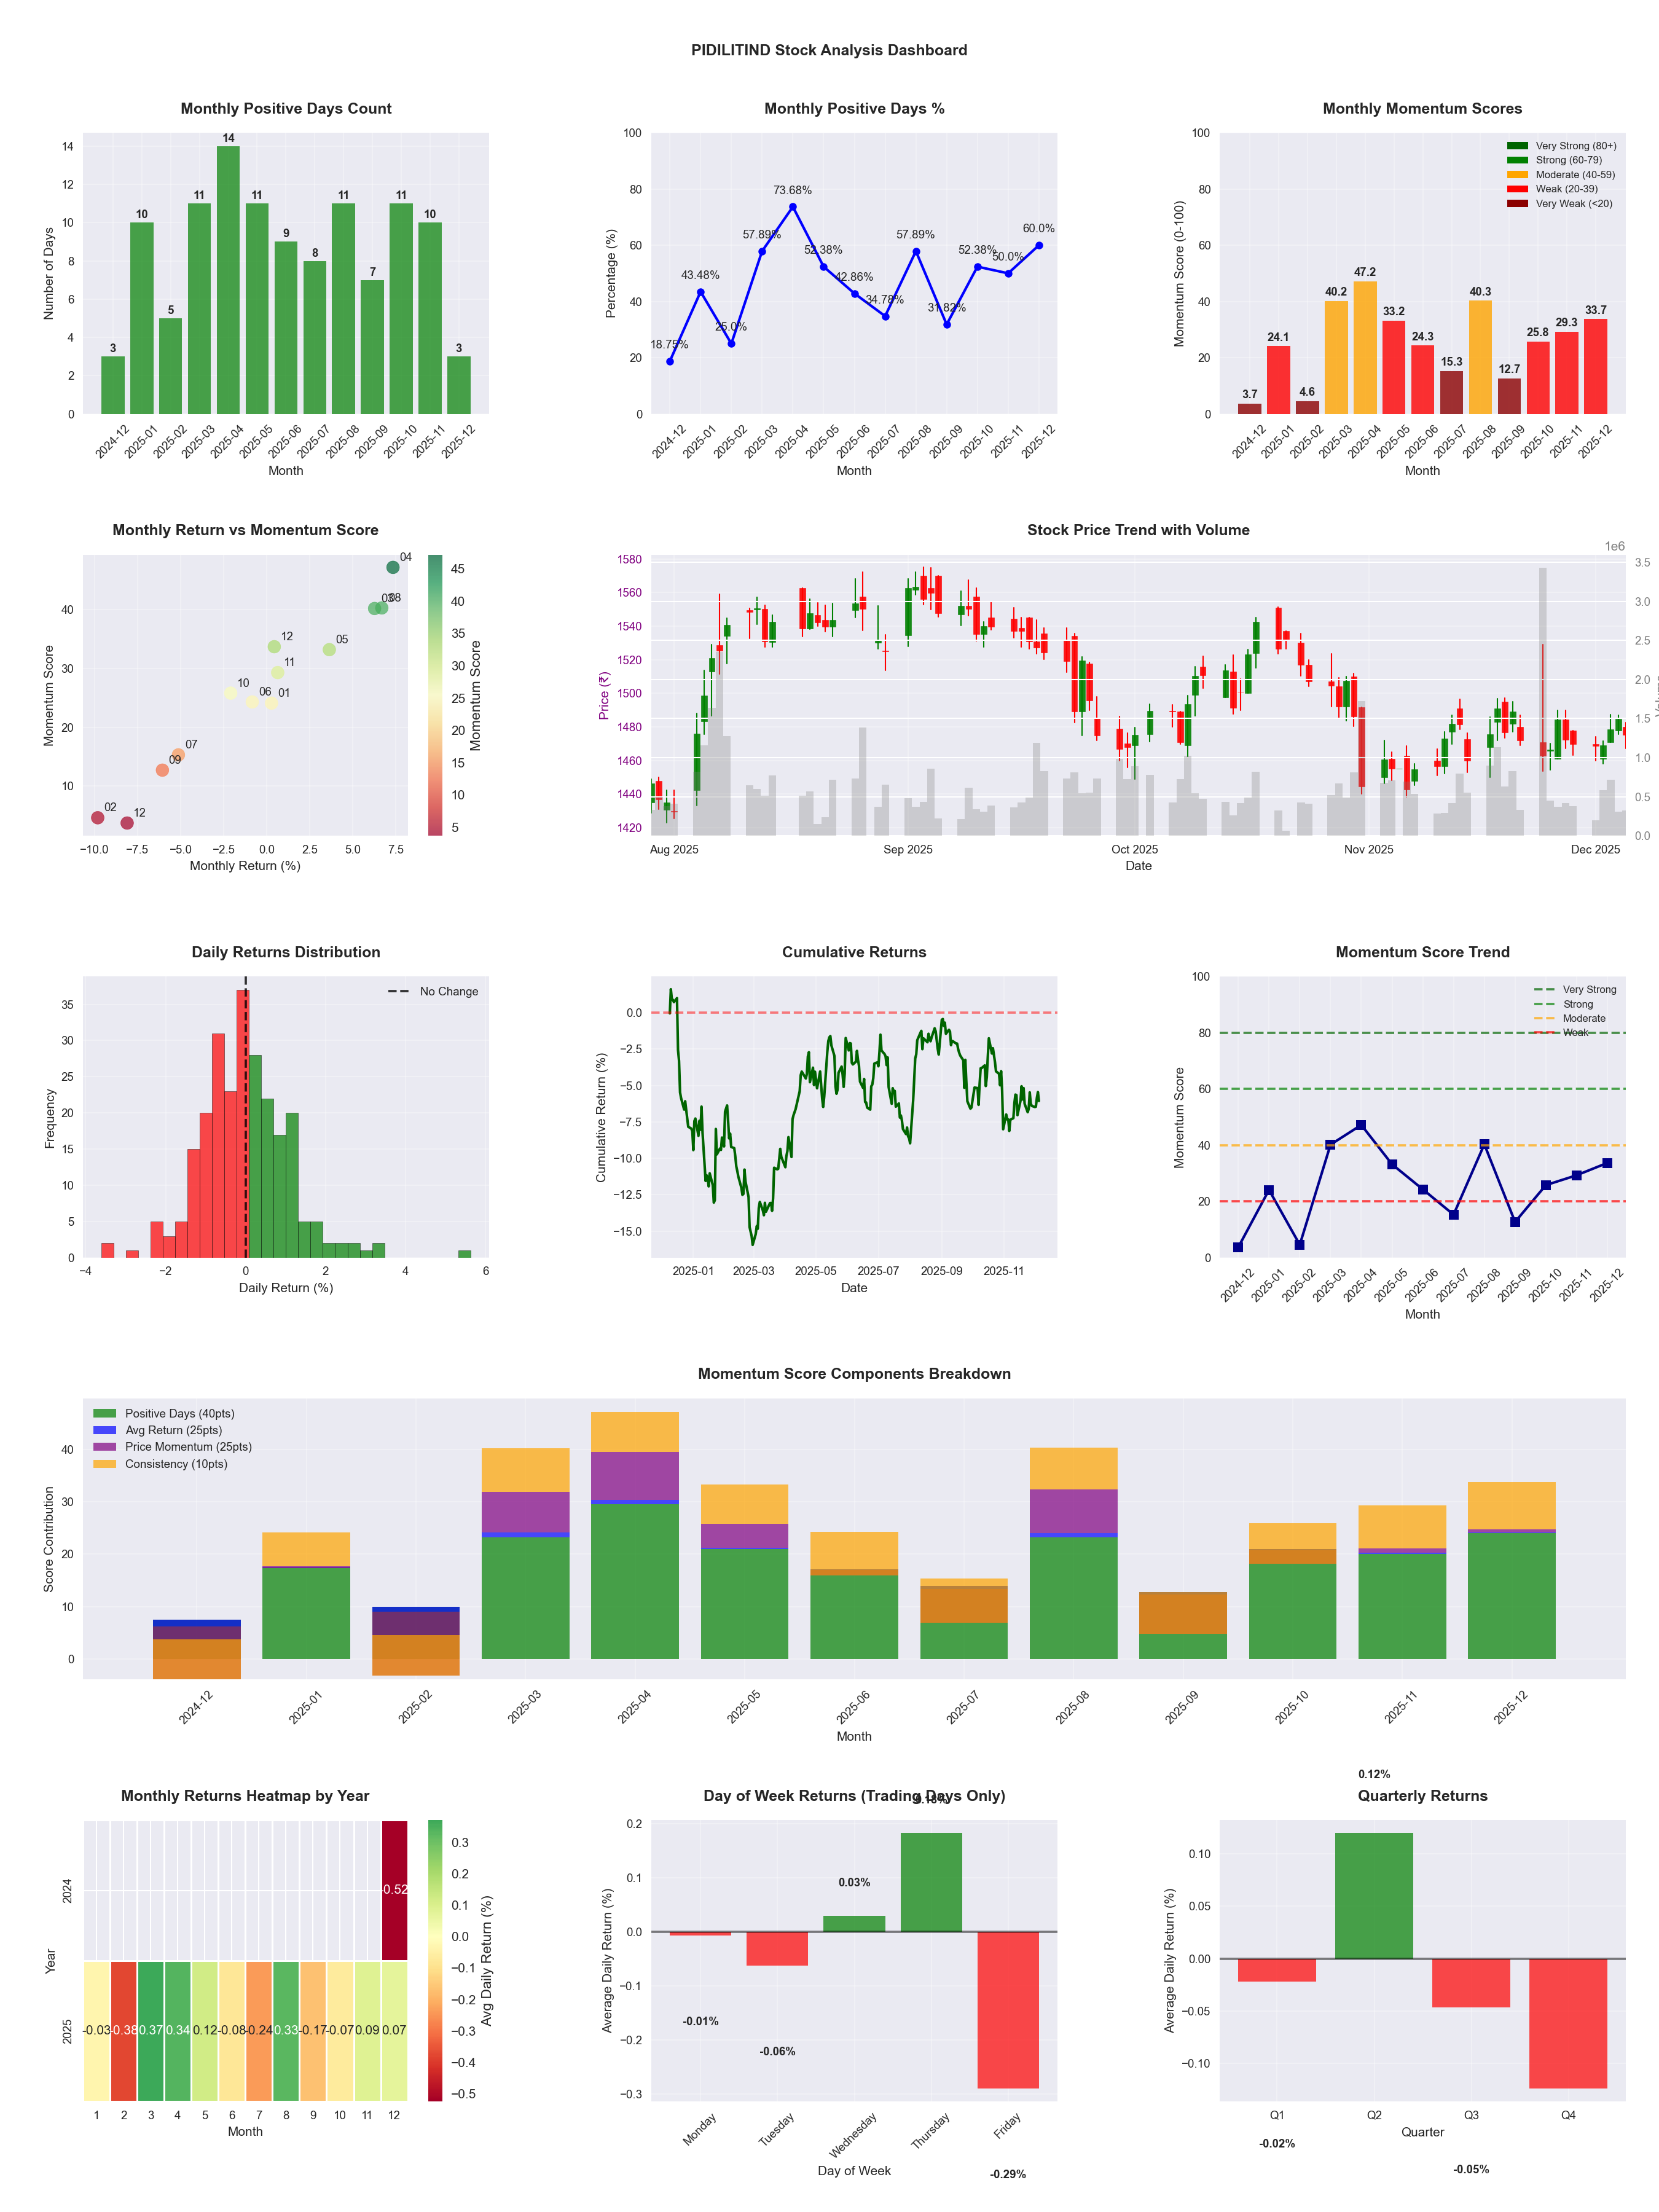
📊 Key Insights & Metrics
Symbol
📈 PIDILITIND
Date
📅 2026-04-11
Volatility
🟢 1.23%
Win Rate
⚠️ 48.4%
Avg Daily Return
📉 -0.02%
Max Drawdown
📉 -18.54%
IBD RS Score
📊 41.0
Weak
Market Rank
#291
Best Month
🏆 2026-04
Worst Month
📉 2026-03
Best Months to Trade
📅 Apr, Aug, Feb
Best Days to Trade
📅 Wednesday, Tuesday
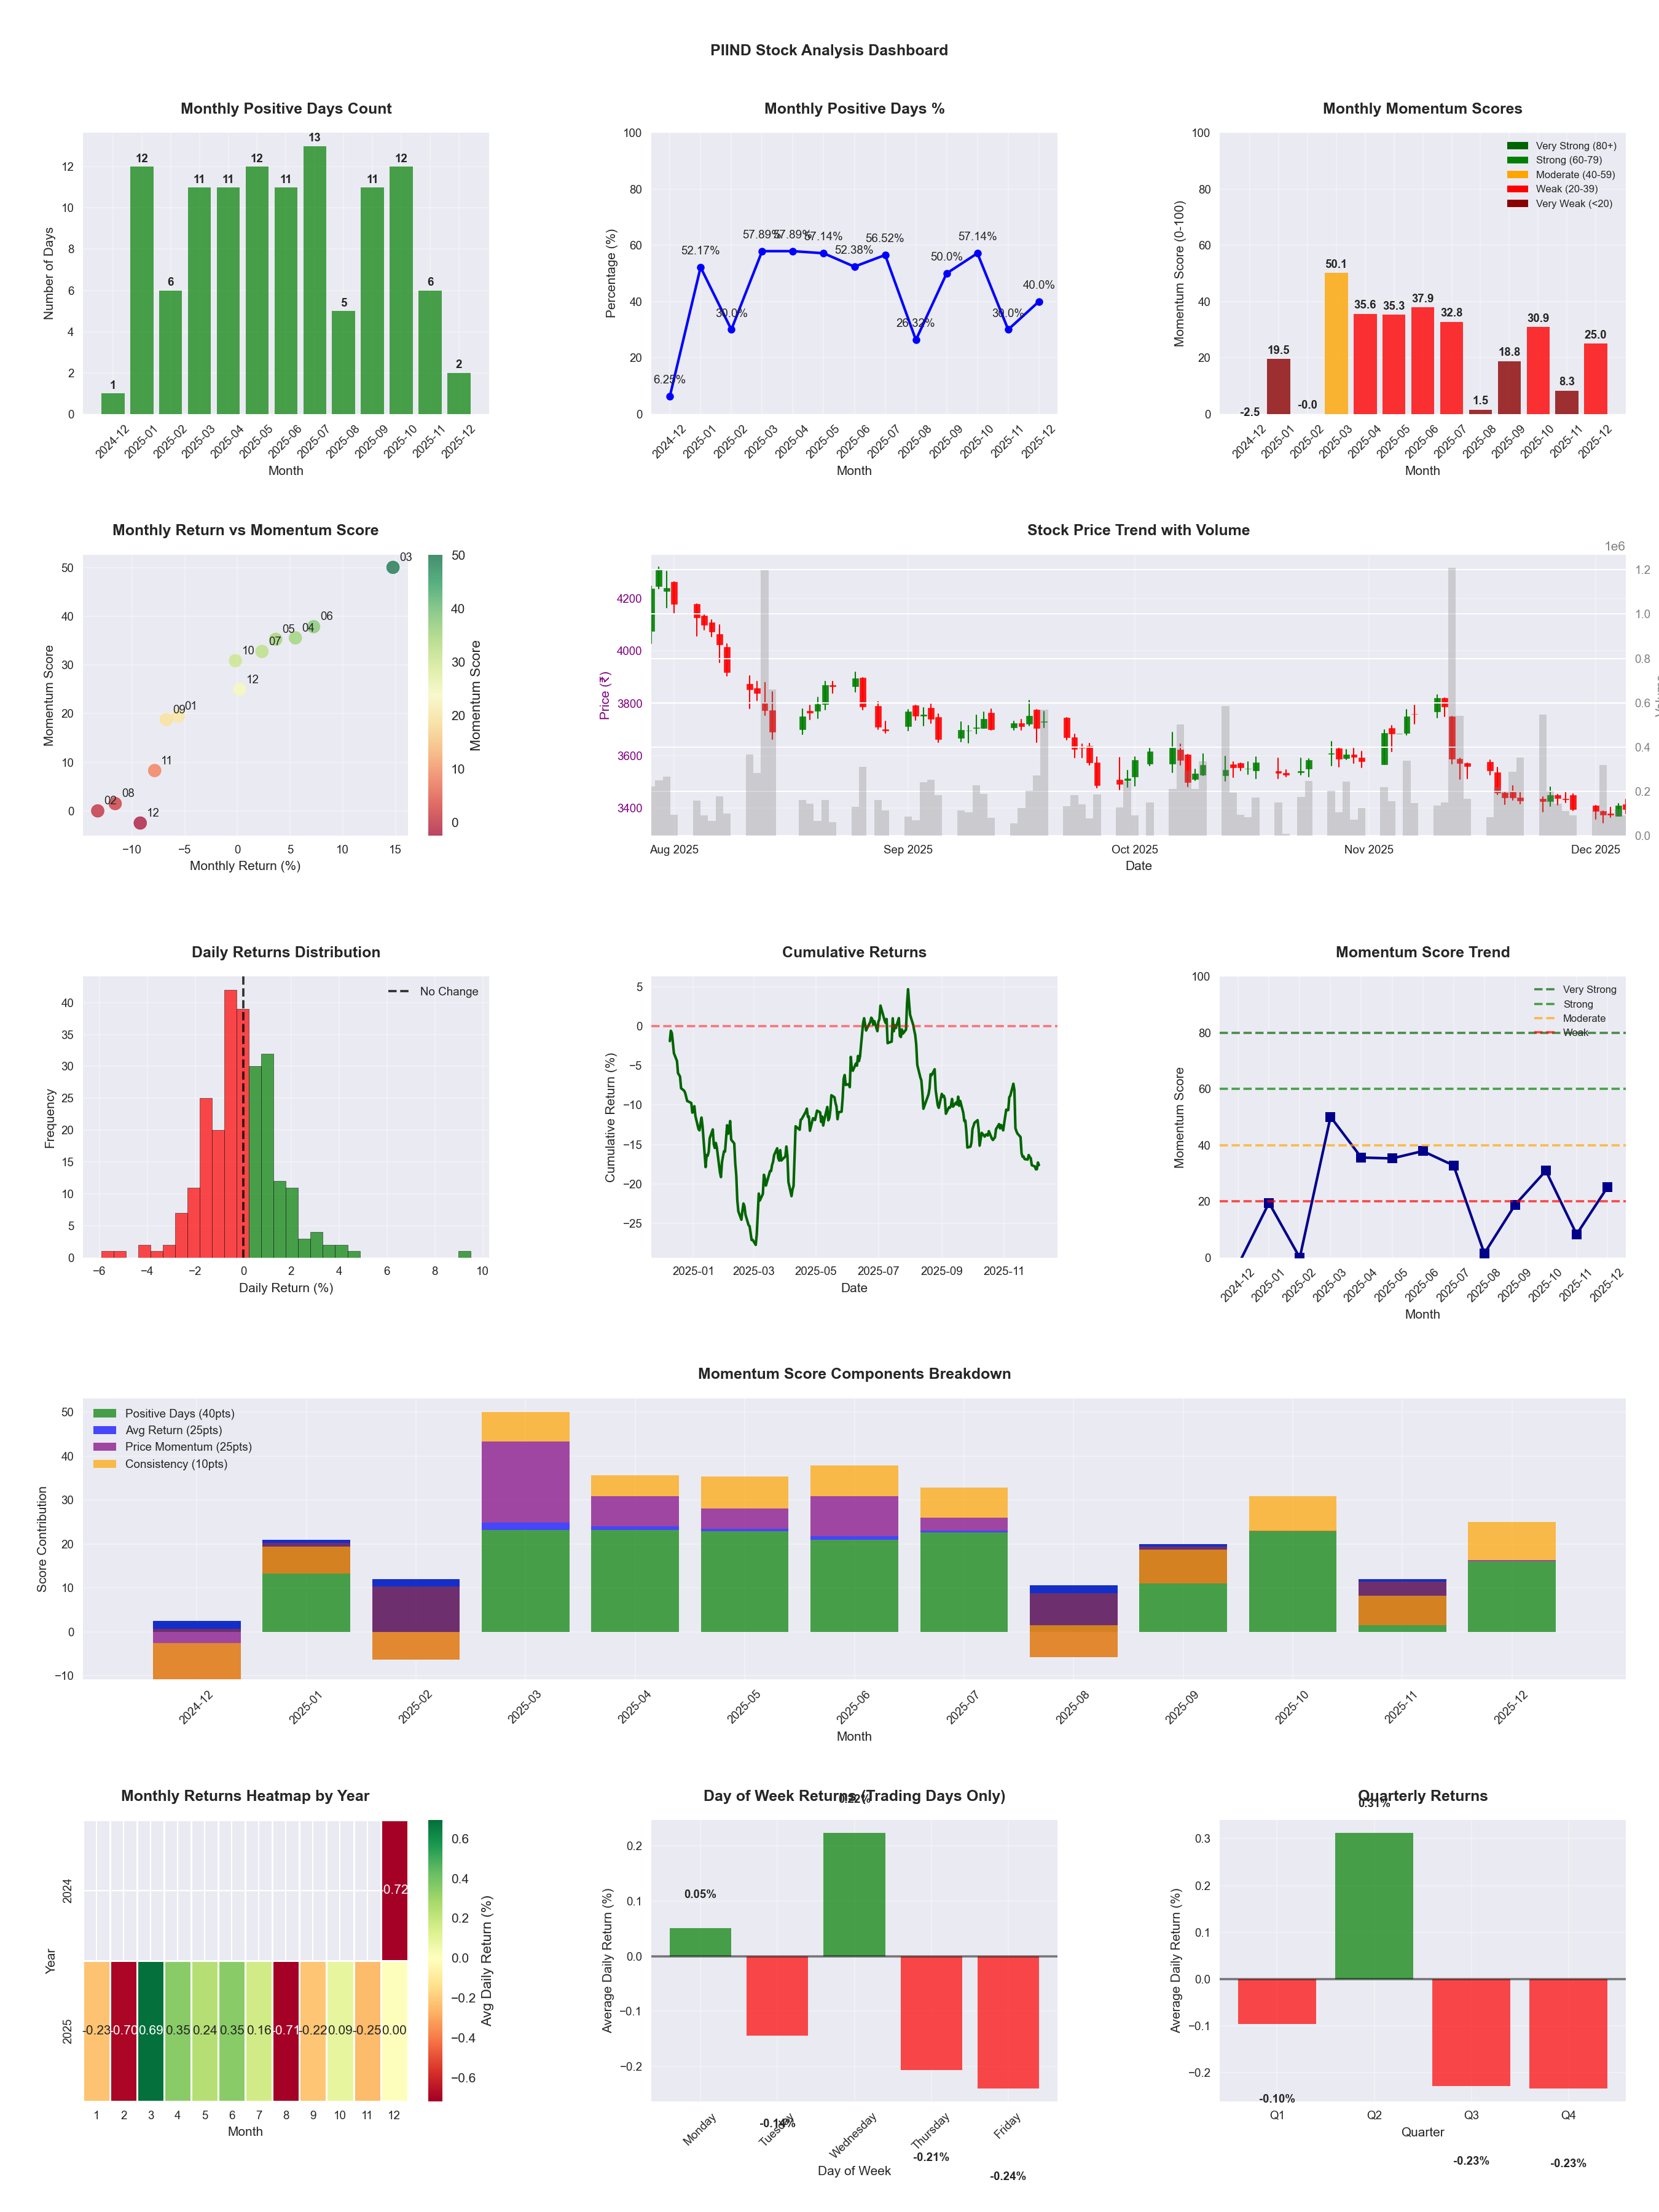
📊 Key Insights & Metrics
Symbol
📈 PIIND
Date
📅 2026-04-11
Volatility
🟢 1.49%
Win Rate
⚠️ 47.6%
Avg Daily Return
📉 -0.07%
Max Drawdown
📉 -36.87%
IBD RS Score
📊 23.3
Weak
Market Rank
#378
Best Month
🏆 2026-04
Worst Month
📉 2026-03
Best Months to Trade
📅 Apr, Jun, May
Best Days to Trade
📅 Wednesday, Monday
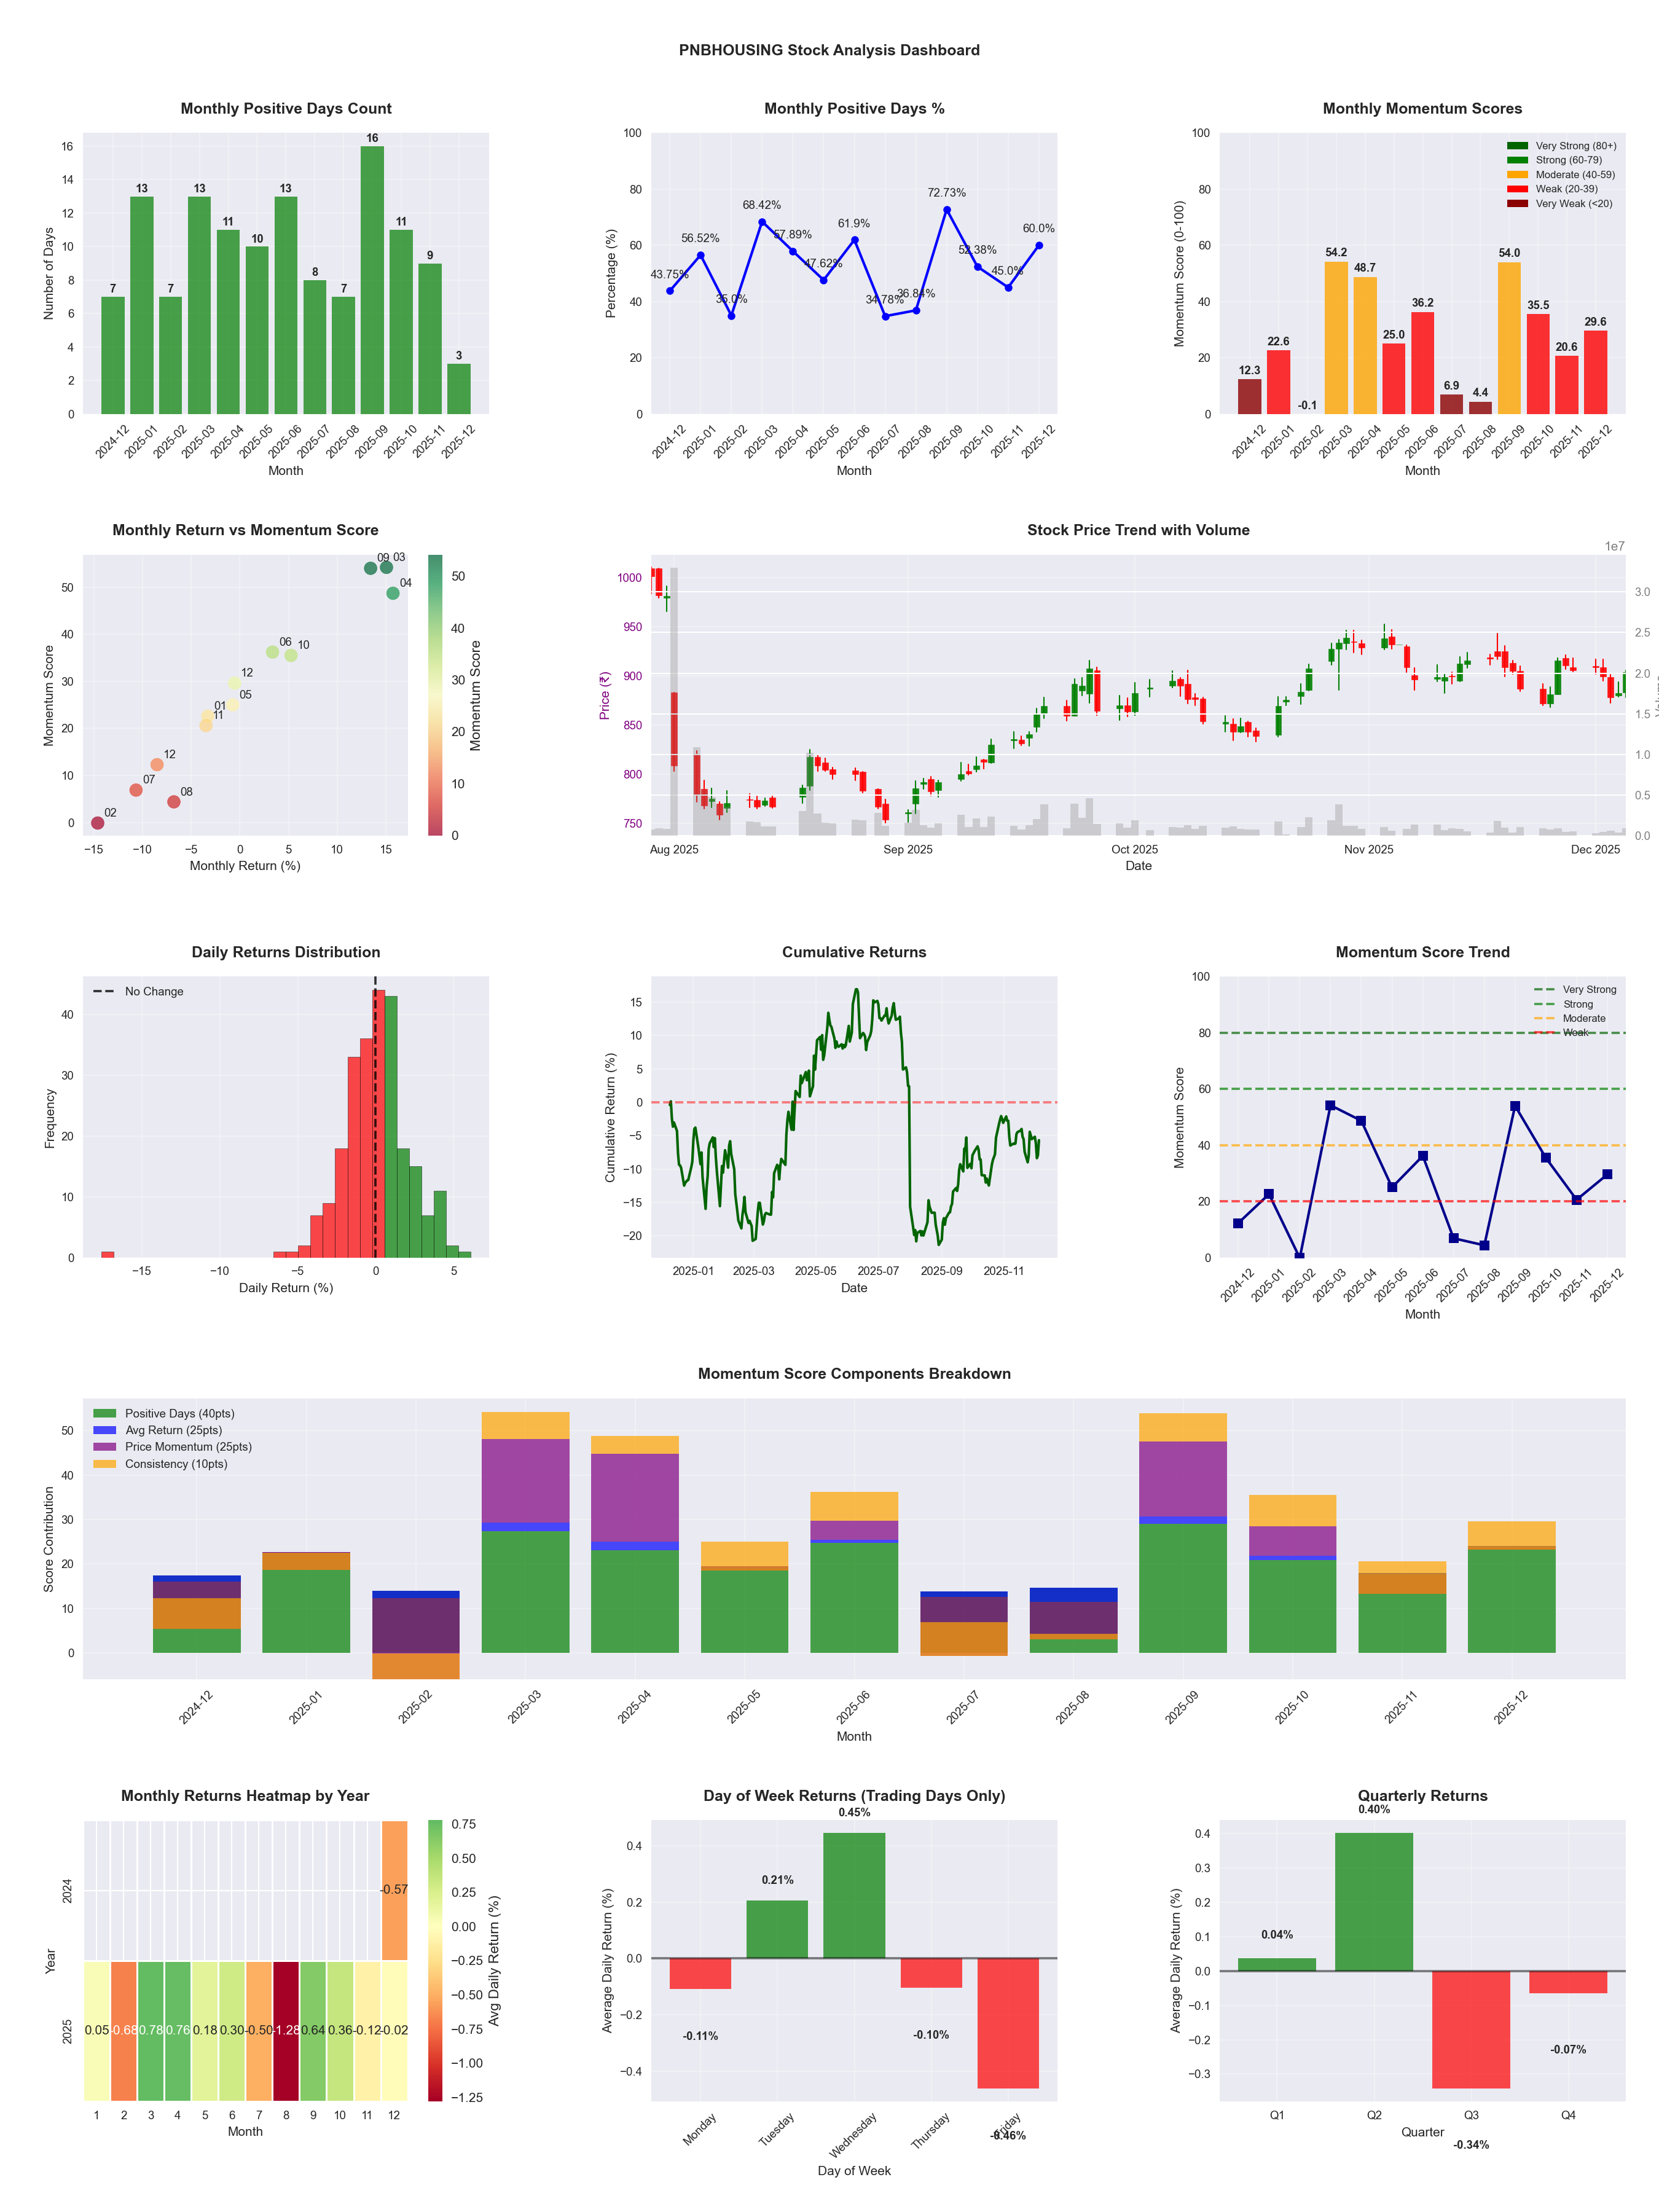
📊 Key Insights & Metrics
Symbol
📈 PNBHOUSING
Date
📅 2026-04-11
Volatility
🟡 2.27%
Risk Profile
⚠️ suitable for aggressive investors
Win Rate
⚠️ 50.8%
Avg Daily Return
📉 -0.02%
Max Drawdown
📉 -33.00%
IBD RS Score
📊 35.7
Weak
Market Rank
#317
Best Month
🏆 2025-09
Best Months to Trade
📅 Apr, Sep, Oct
Best Days to Trade
📅 Wednesday, Tuesday
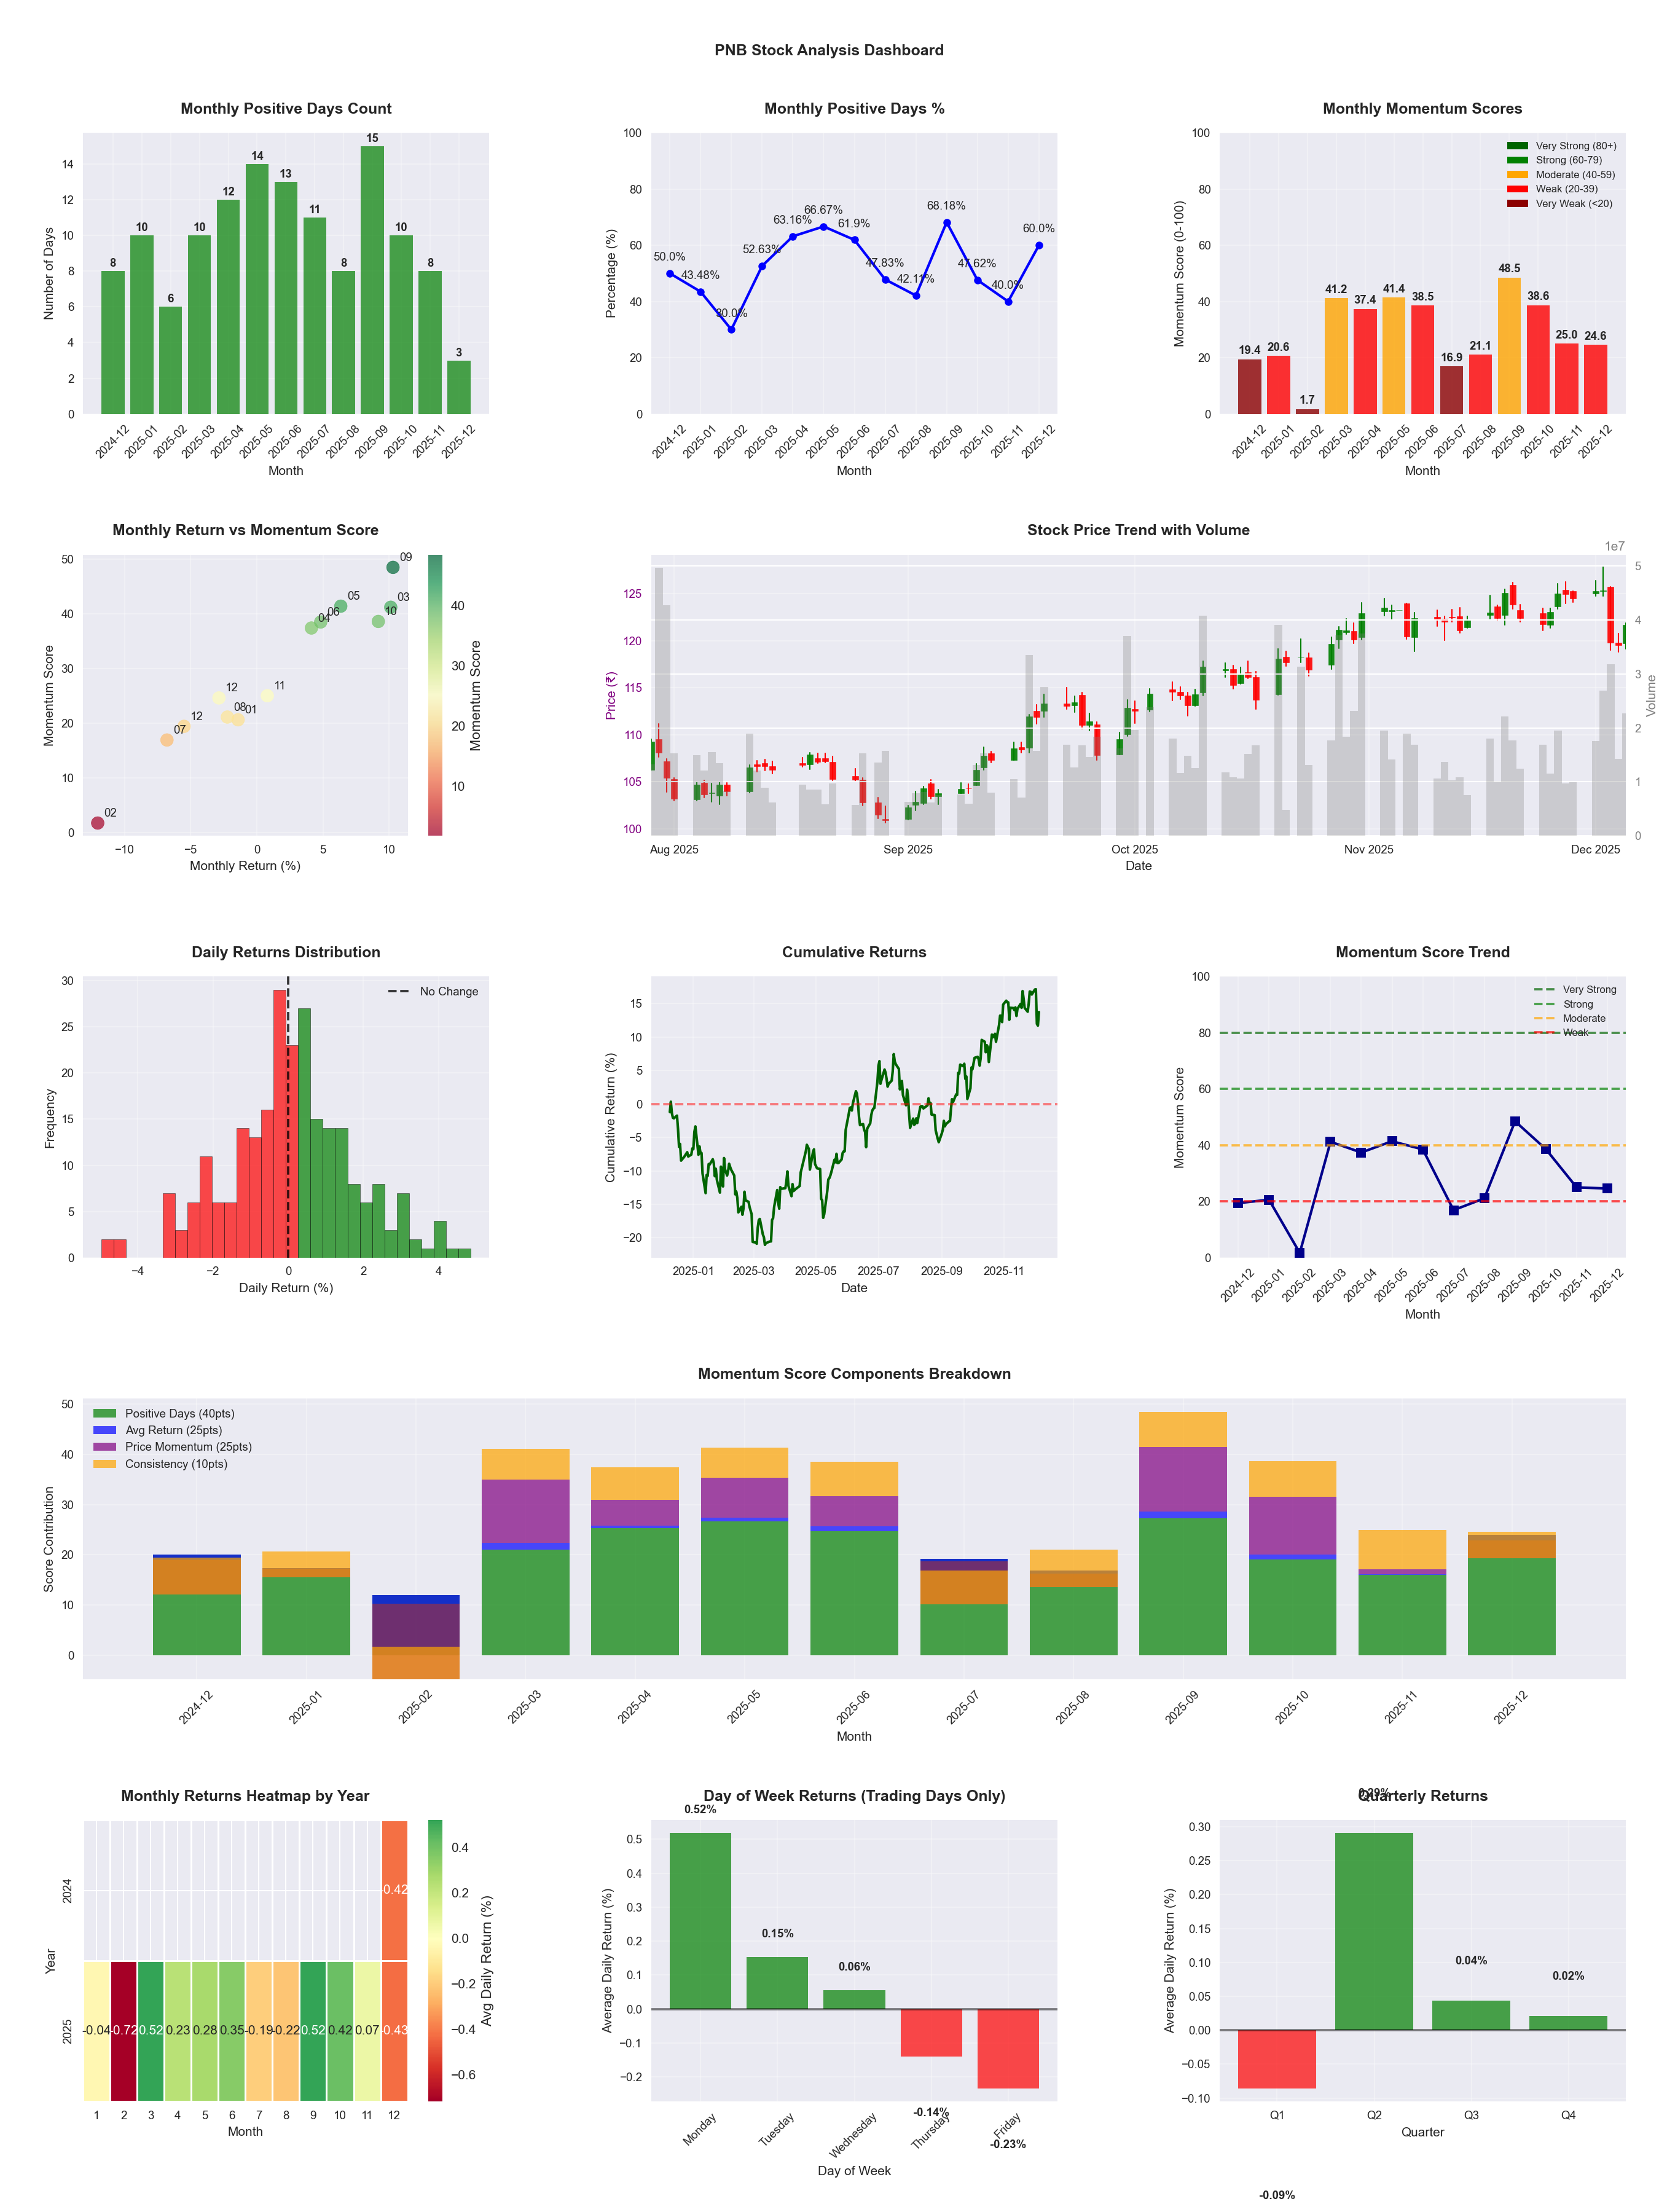
📊 Key Insights & Metrics
Symbol
📈 PNB
Date
📅 2026-04-11
Volatility
🟡 1.78%
Win Rate
⚠️ 54.9%
Avg Daily Return
📈 +0.09%
Max Drawdown
📉 -24.03%
IBD RS Score
📊 61.1
Average
Market Rank
#192
Best Month
🏆 2025-09
Best Months to Trade
📅 Apr, Sep, Oct
Best Days to Trade
📅 Wednesday, Monday
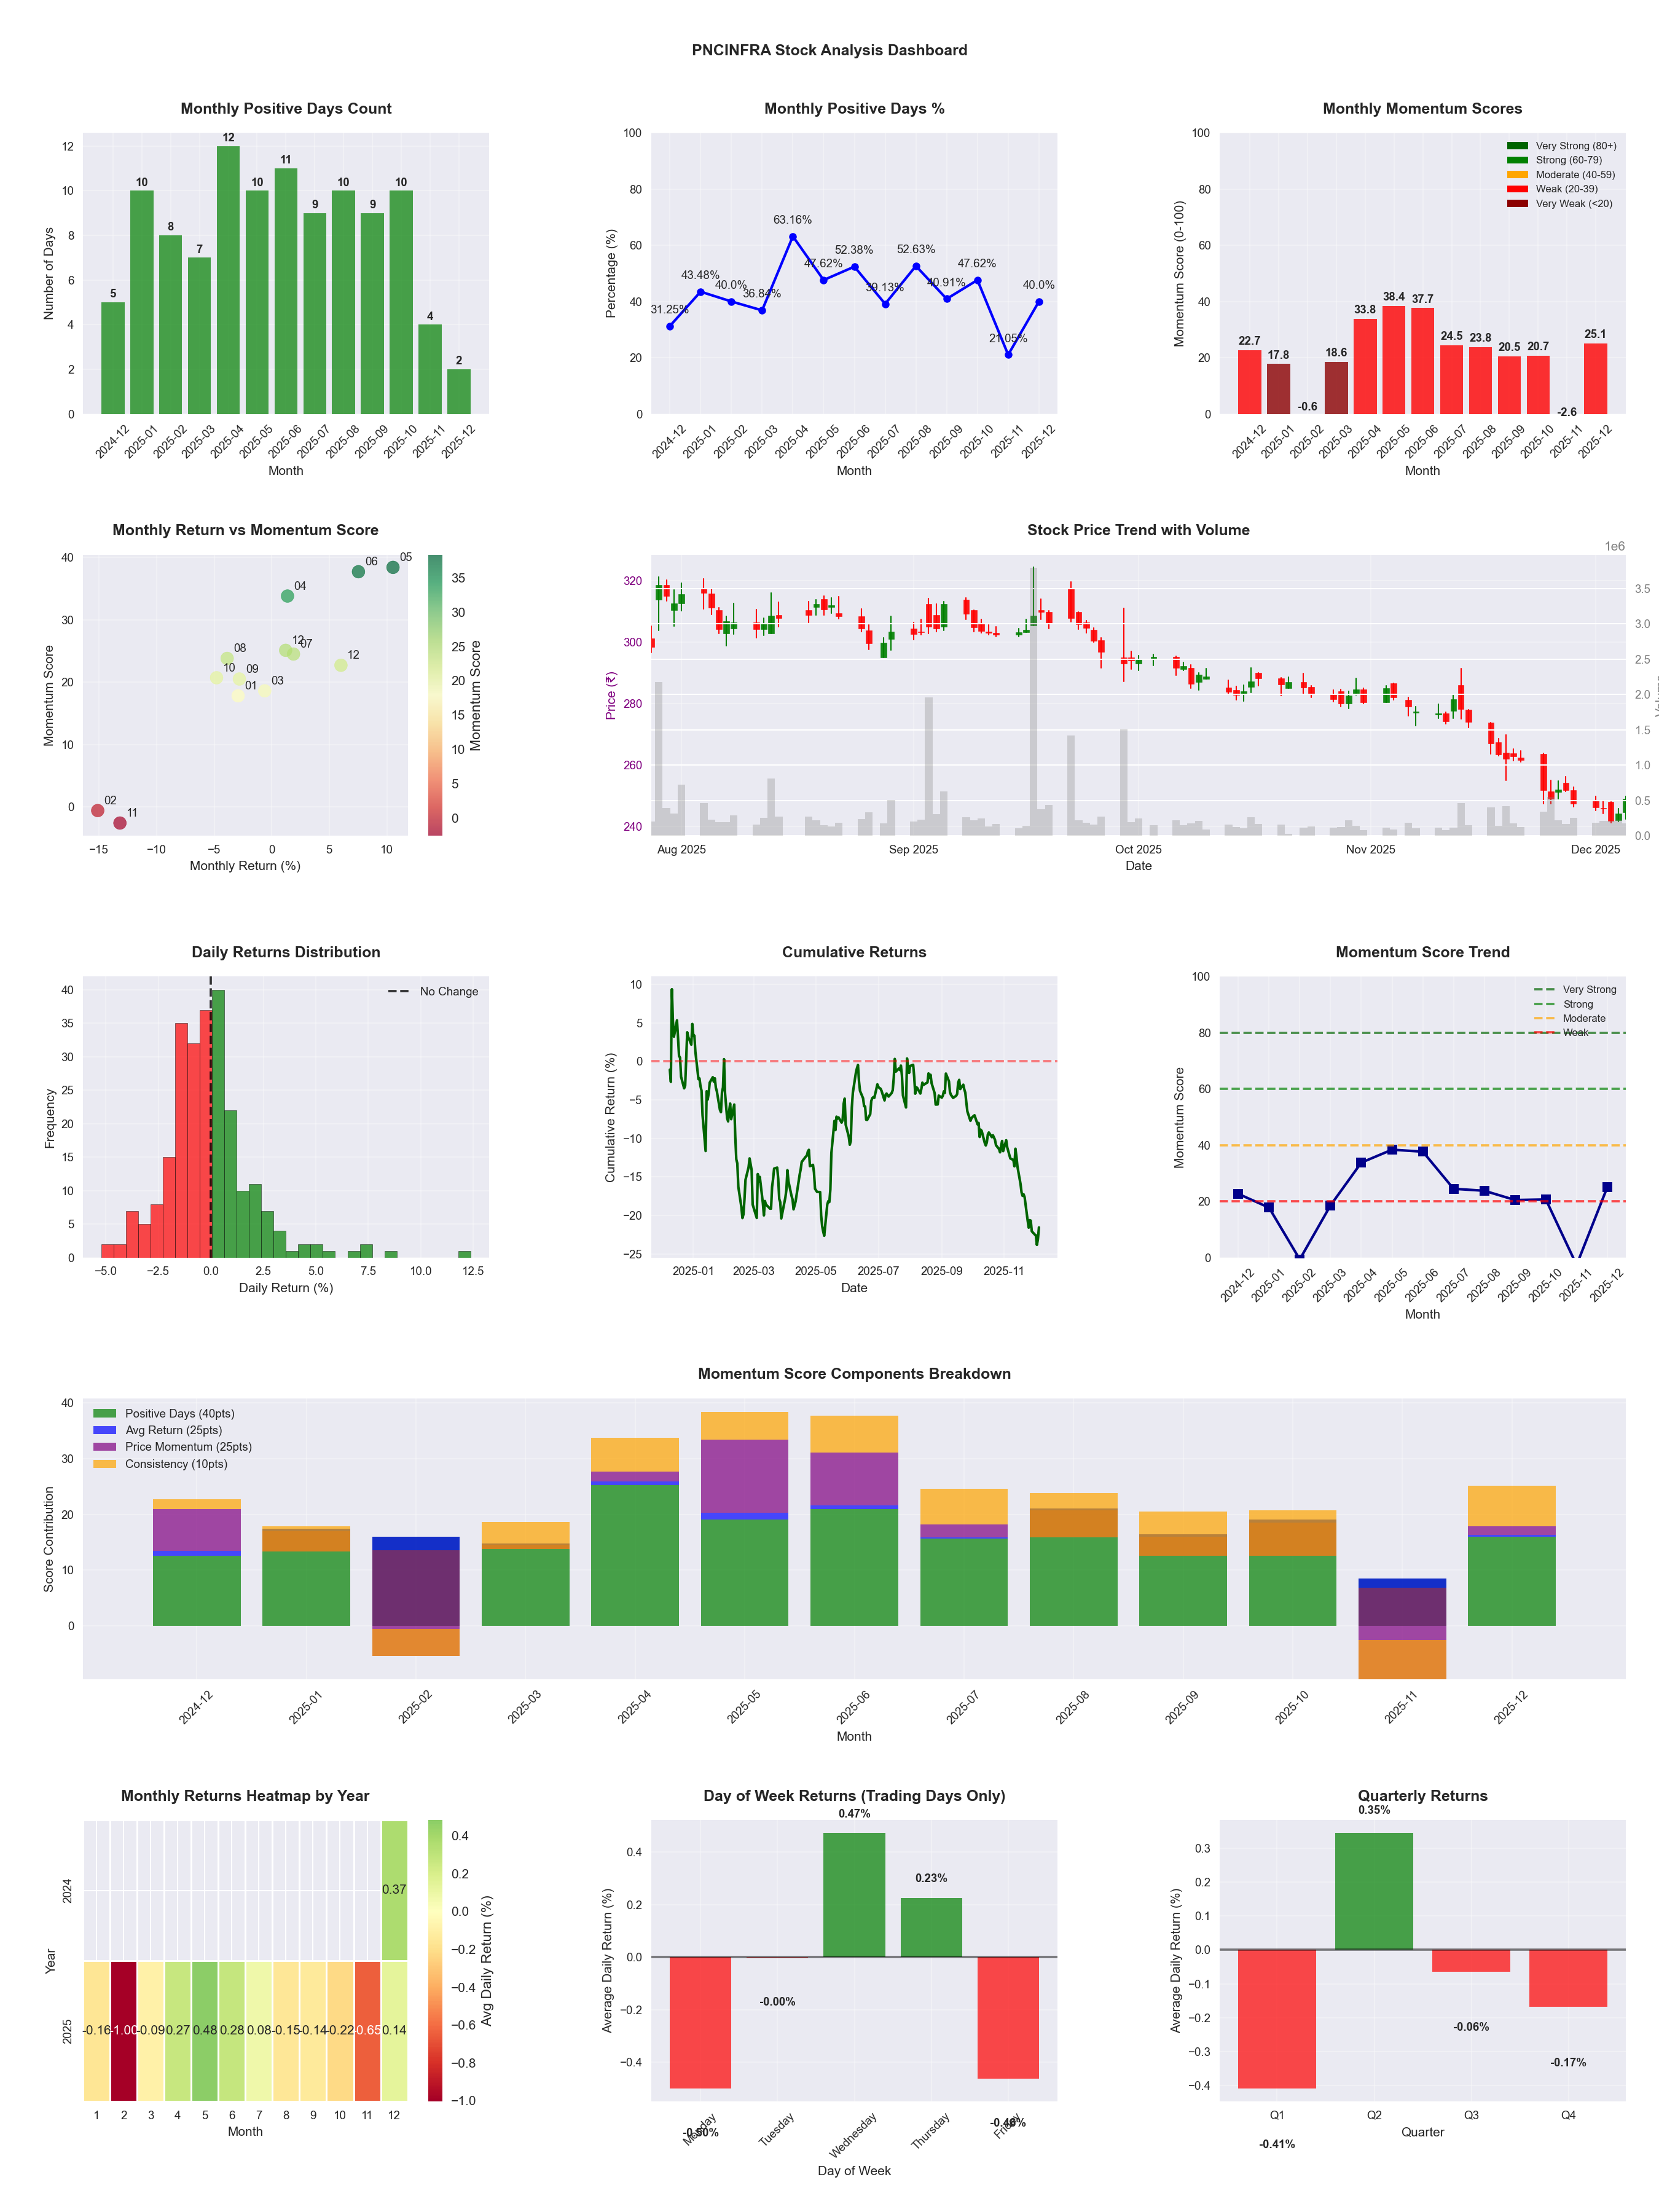
📊 Key Insights & Metrics
Symbol
📈 PNCINFRA
Date
📅 2026-03-21
Volatility
🟡 1.76%
Win Rate
⚠️ 41.7%
Avg Daily Return
📉 -0.14%
Max Drawdown
📉 -42.03%
Best Month
🏆 2025-05
Best Months to Trade
📅 May, Jun, Apr
Best Days to Trade
📅 Thursday, Tuesday
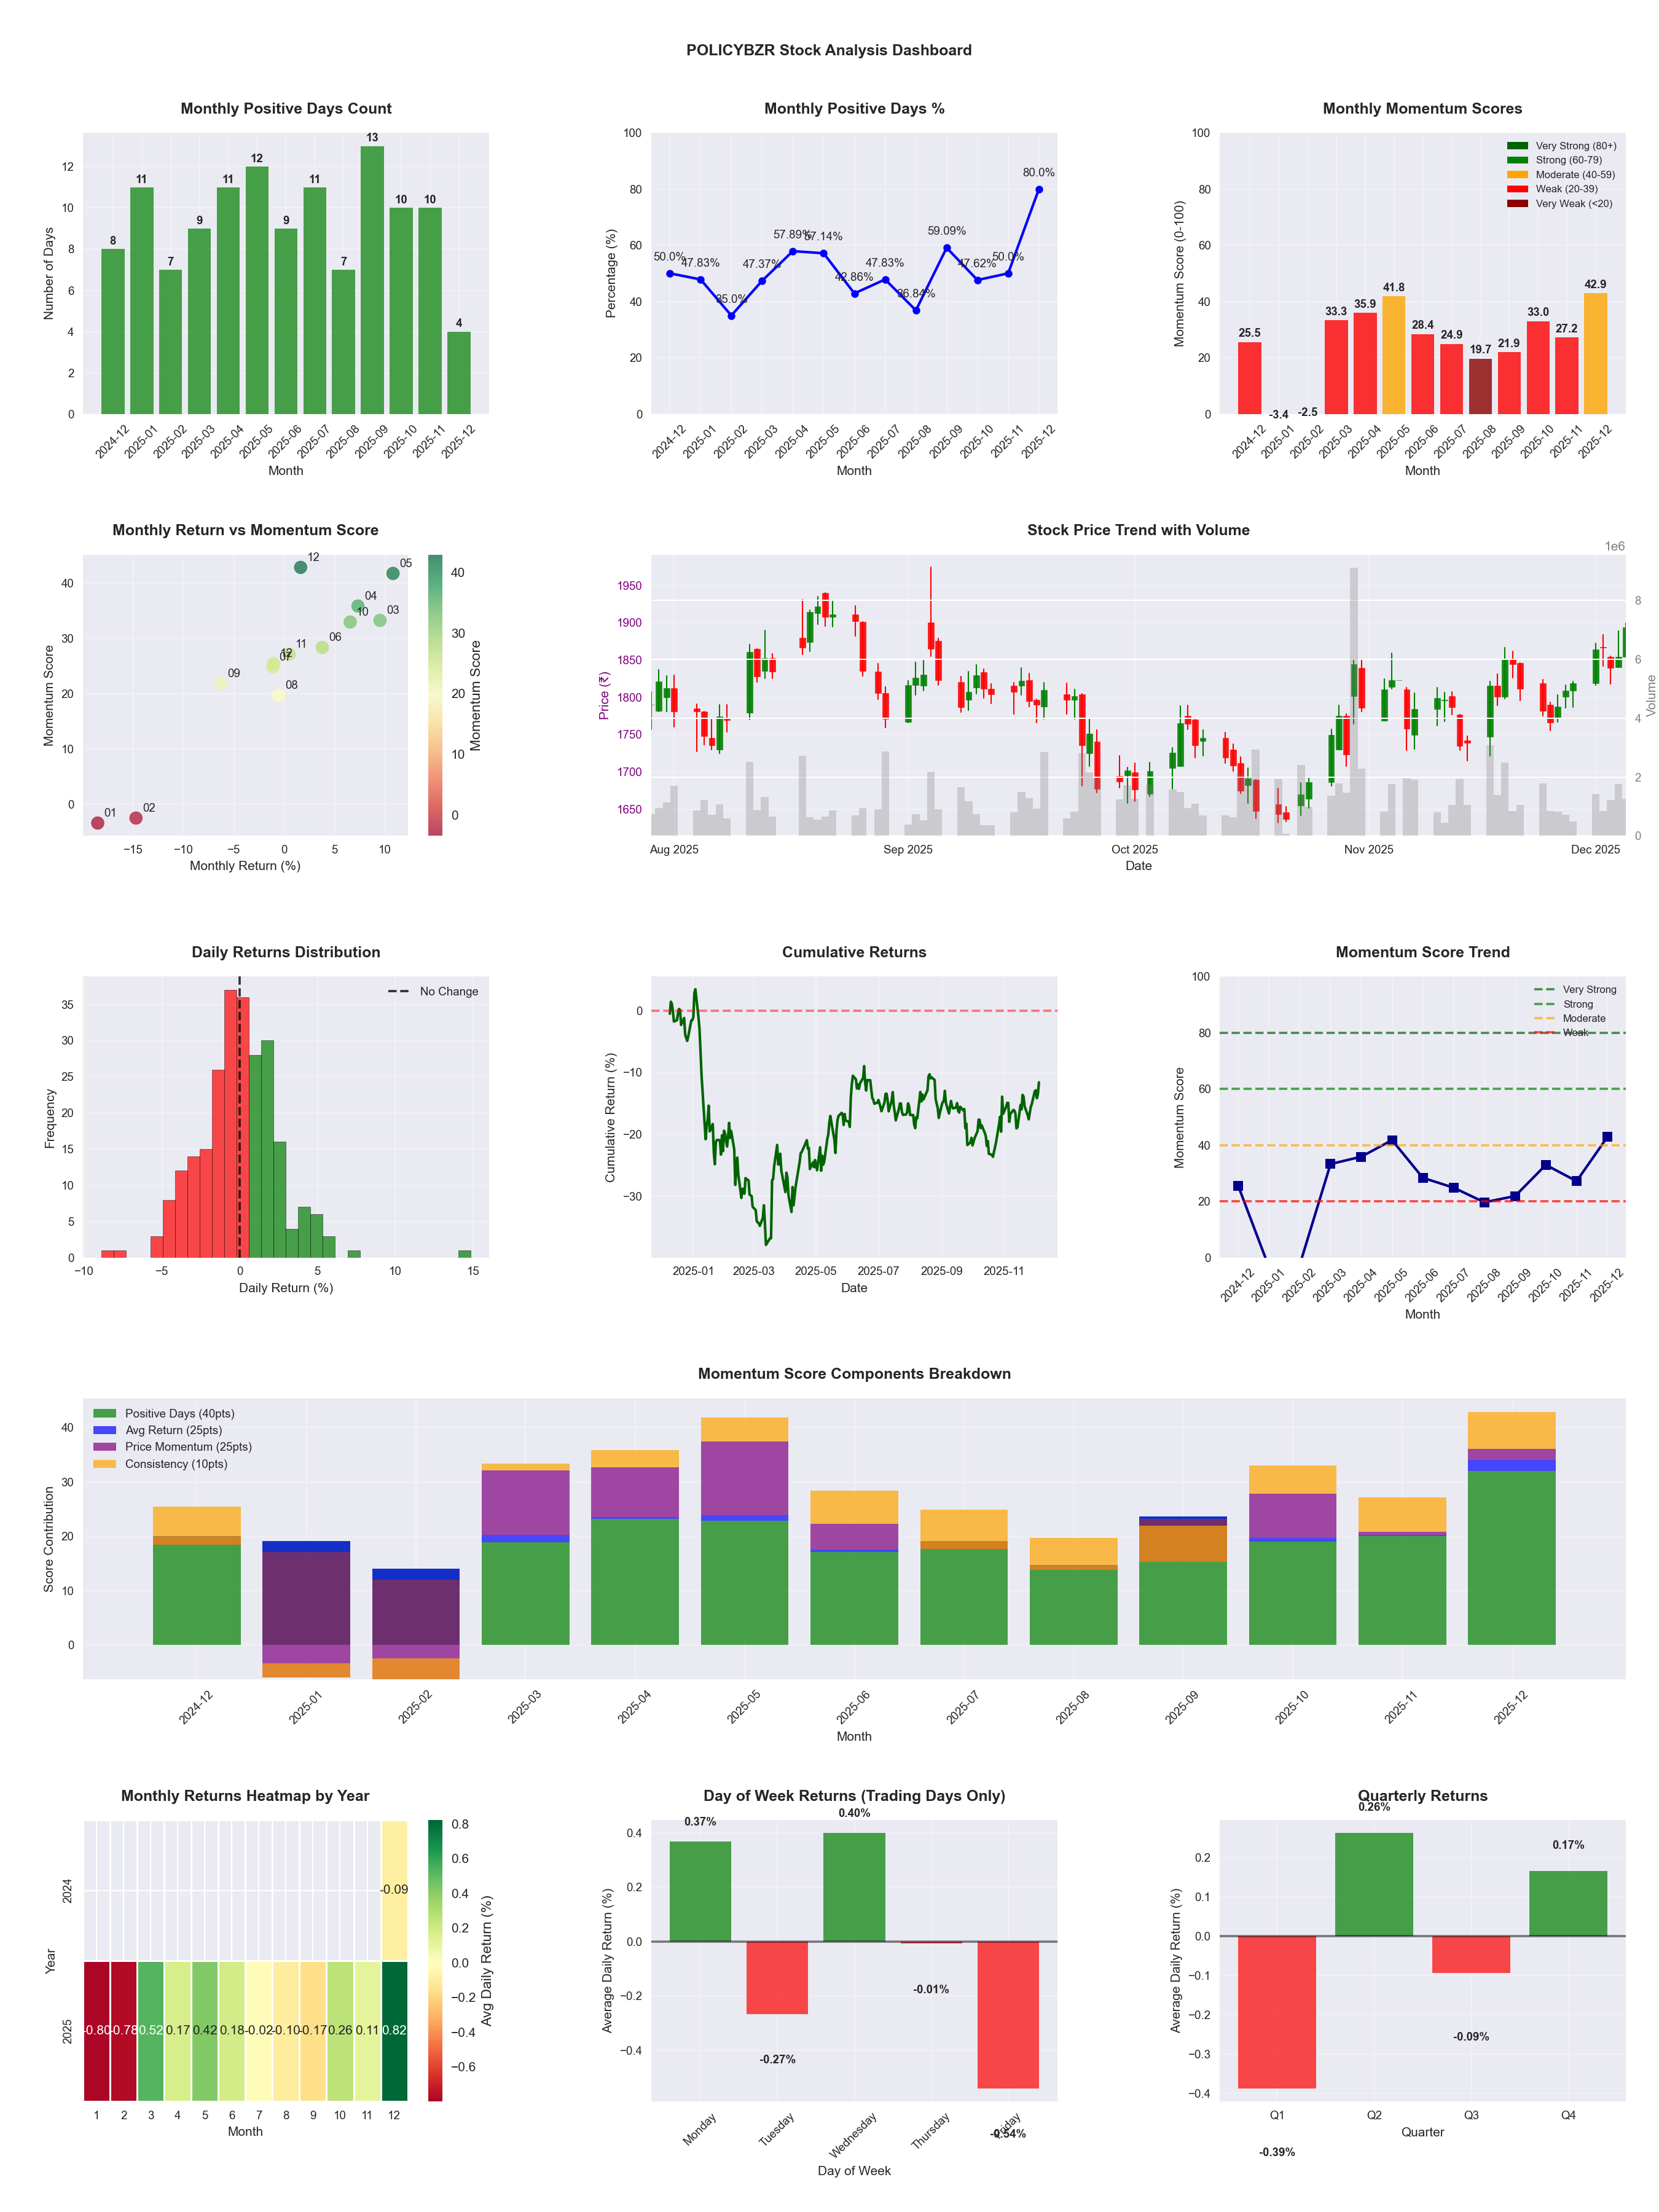
📊 Key Insights & Metrics
Symbol
📈 POLICYBZR
Date
📅 2026-04-11
Volatility
🟡 2.13%
Risk Profile
⚠️ suitable for aggressive investors
Win Rate
⚠️ 48.2%
Avg Daily Return
📈 +0.02%
Max Drawdown
📉 -27.10%
IBD RS Score
📊 32.3
Weak
Market Rank
#334
Best Month
🏆 2025-05
Worst Month
📉 2026-01
Best Months to Trade
📅 Apr, May, Oct
Best Days to Trade
📅 Monday, Thursday
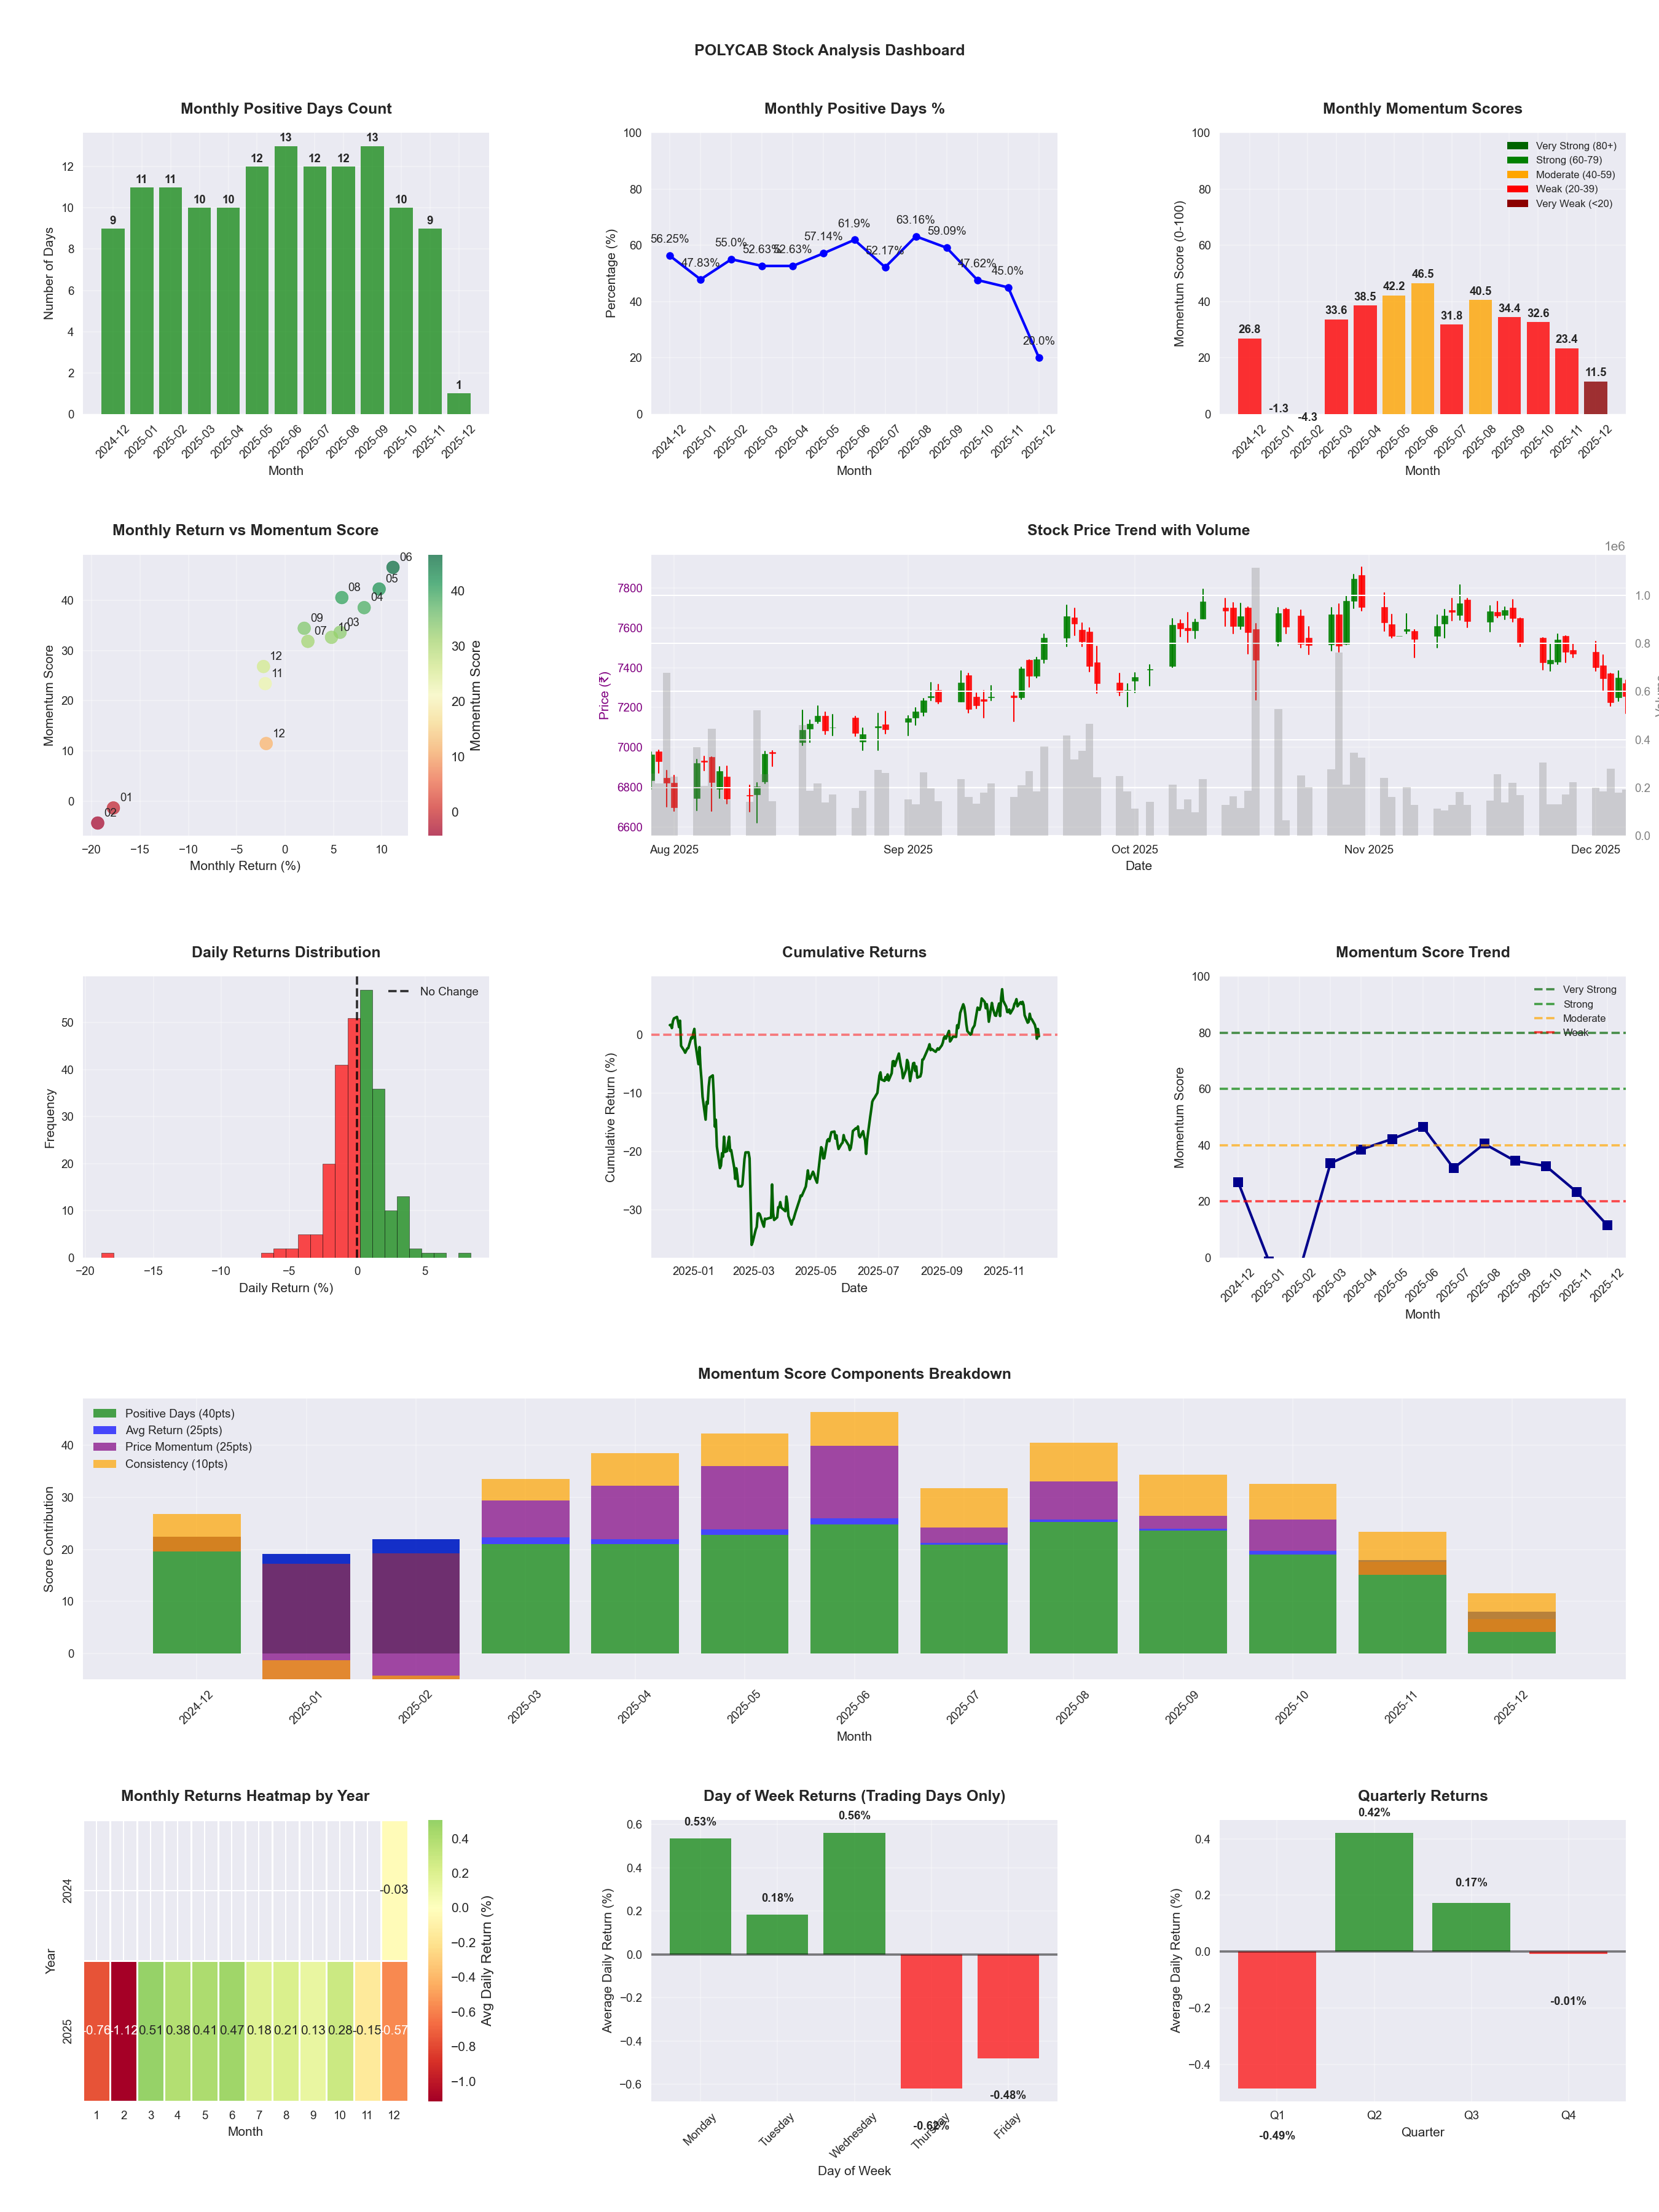
📊 Key Insights & Metrics
Symbol
📈 POLYCAB
Date
📅 2026-04-11
Volatility
🟡 1.79%
Win Rate
⚠️ 54.9%
Avg Daily Return
📈 +0.19%
Max Drawdown
📉 -21.08%
IBD RS Score
📊 79.7
Strong
Market Rank
#100
Best Month
🏆 2026-02
Best Months to Trade
📅 Apr, Feb, Jun
Best Days to Trade
📅 Monday, Wednesday
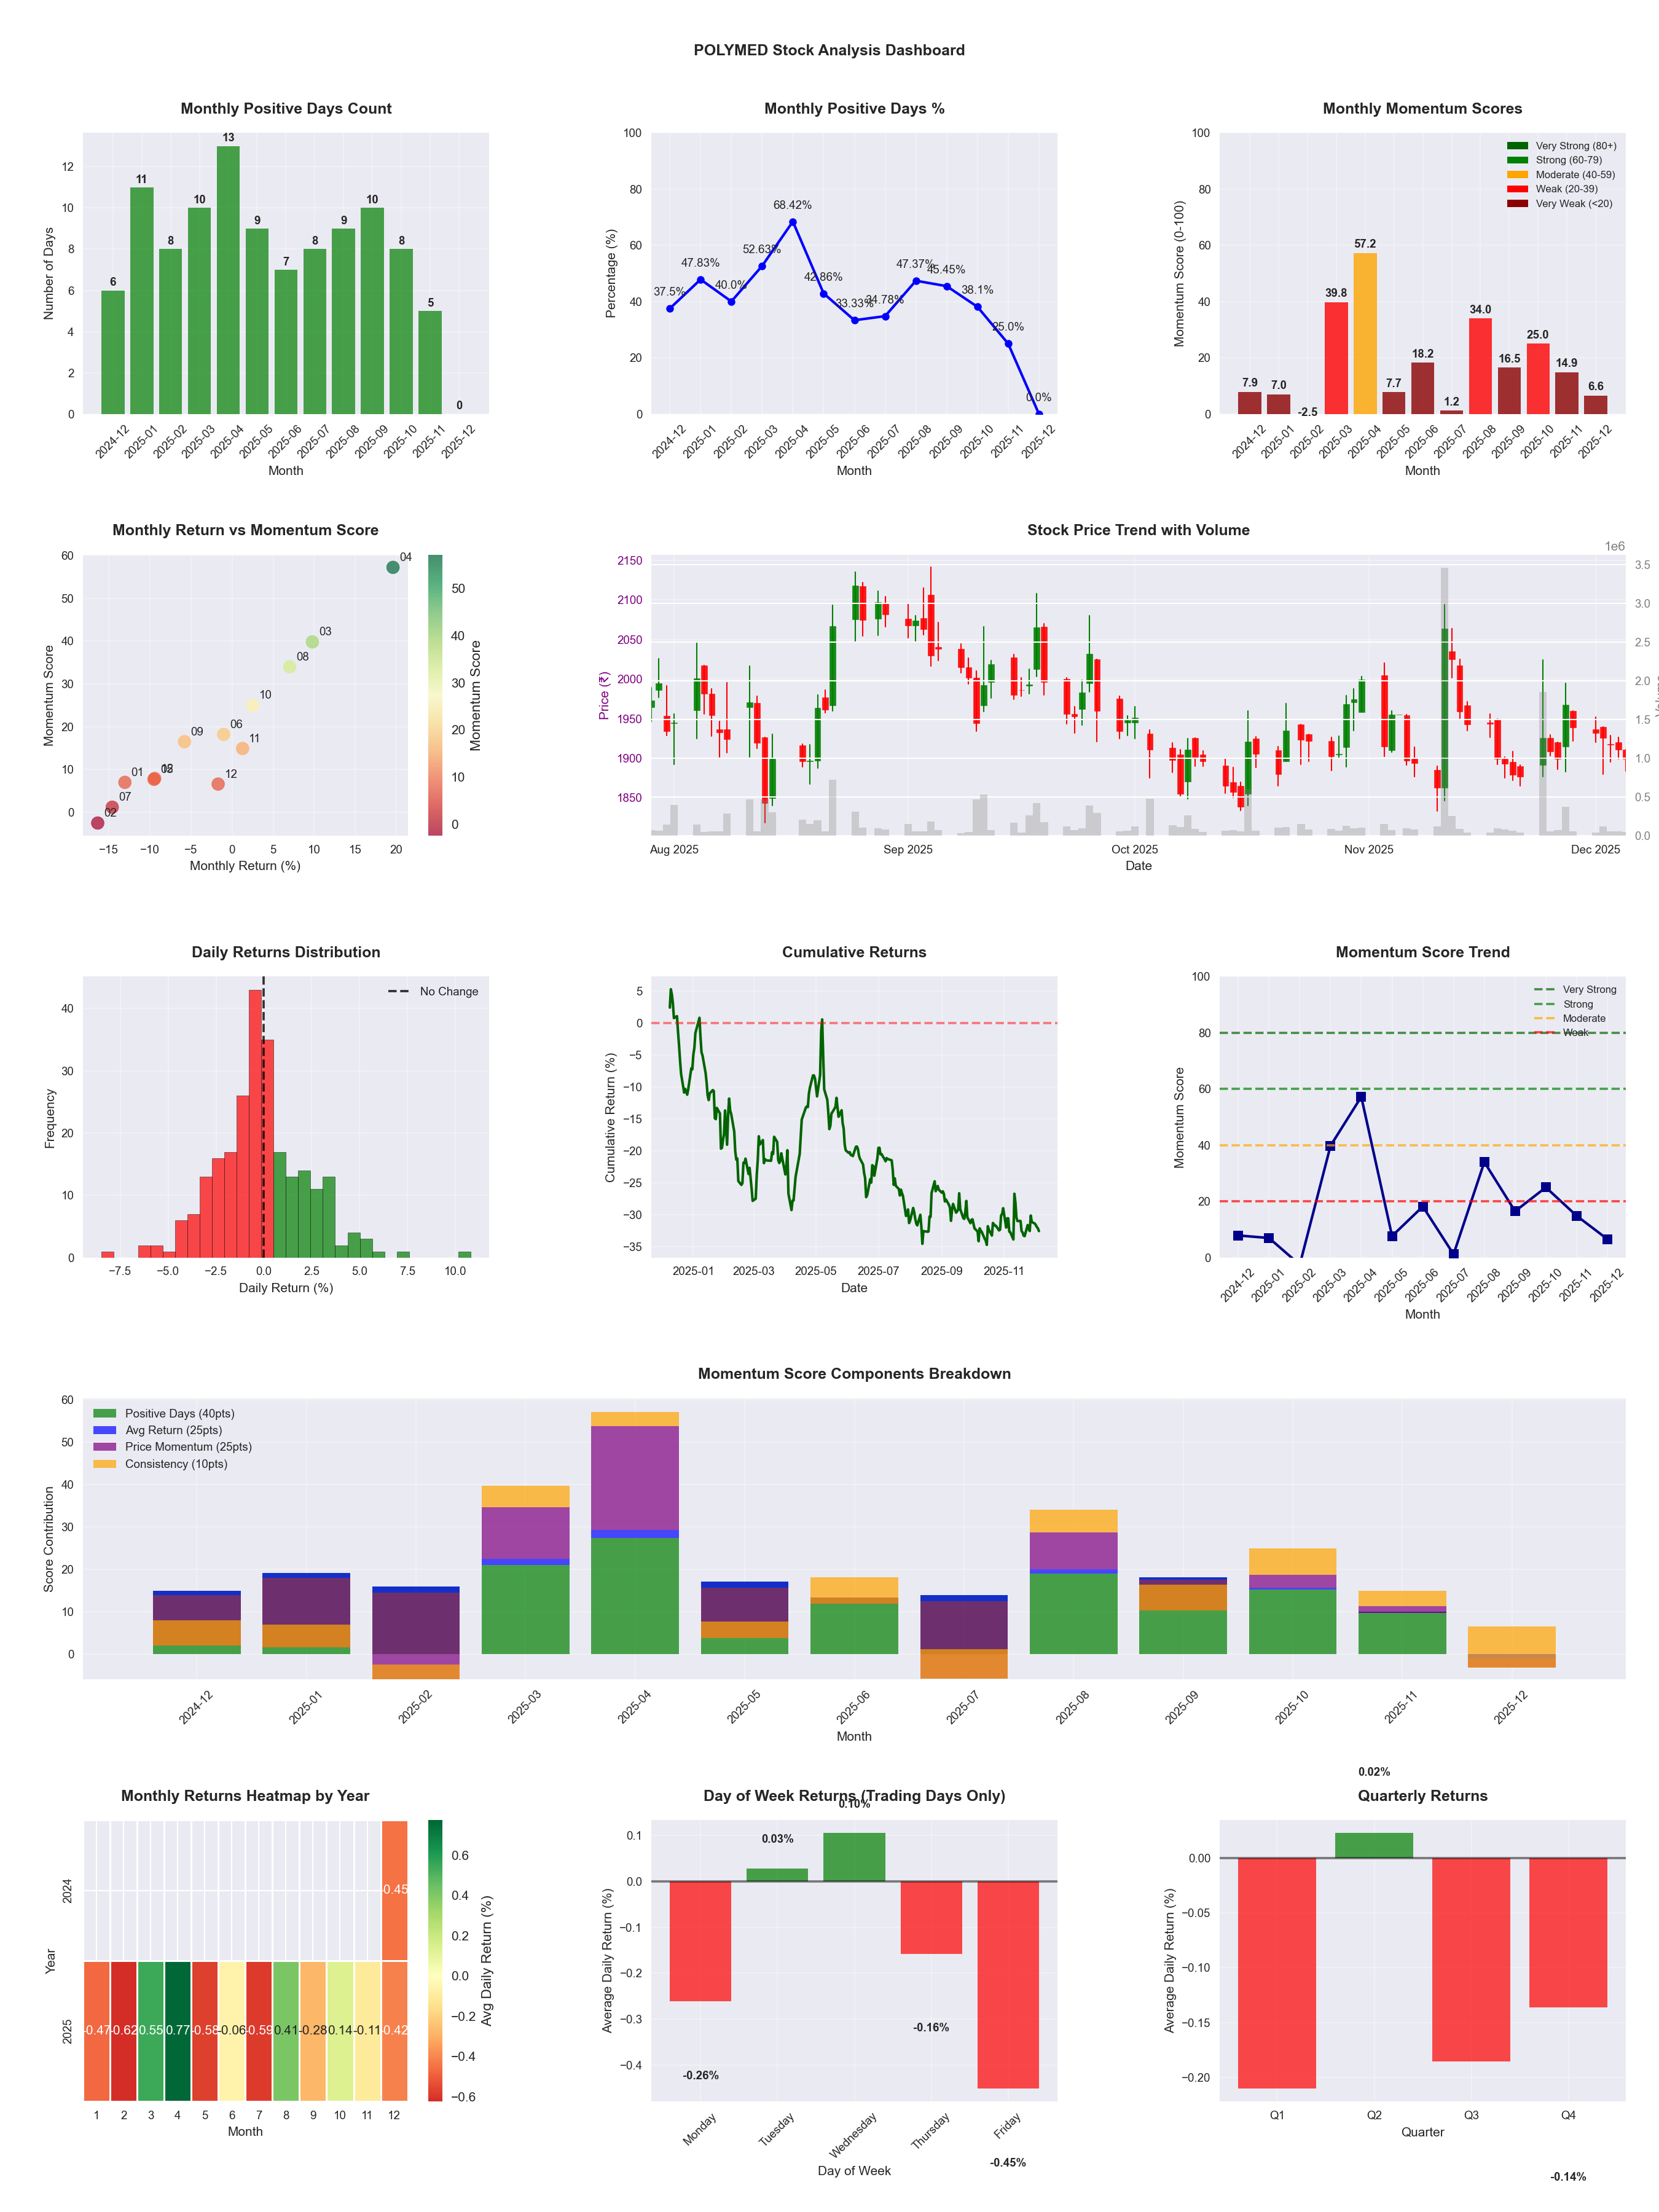
📊 Key Insights & Metrics
Symbol
📈 POLYMED
Date
📅 2026-04-11
Volatility
🟡 2.56%
Risk Profile
⚠️ suitable for aggressive investors
Win Rate
❌ 38.6%
Avg Daily Return
📉 -0.12%
Max Drawdown
📉 -57.92%
IBD RS Score
📊 6.5
Weak
Market Rank
#461
Best Month
🏆 2026-04
Best Months to Trade
📅 Apr, Aug, Oct
Best Days to Trade
📅 Tuesday, Wednesday
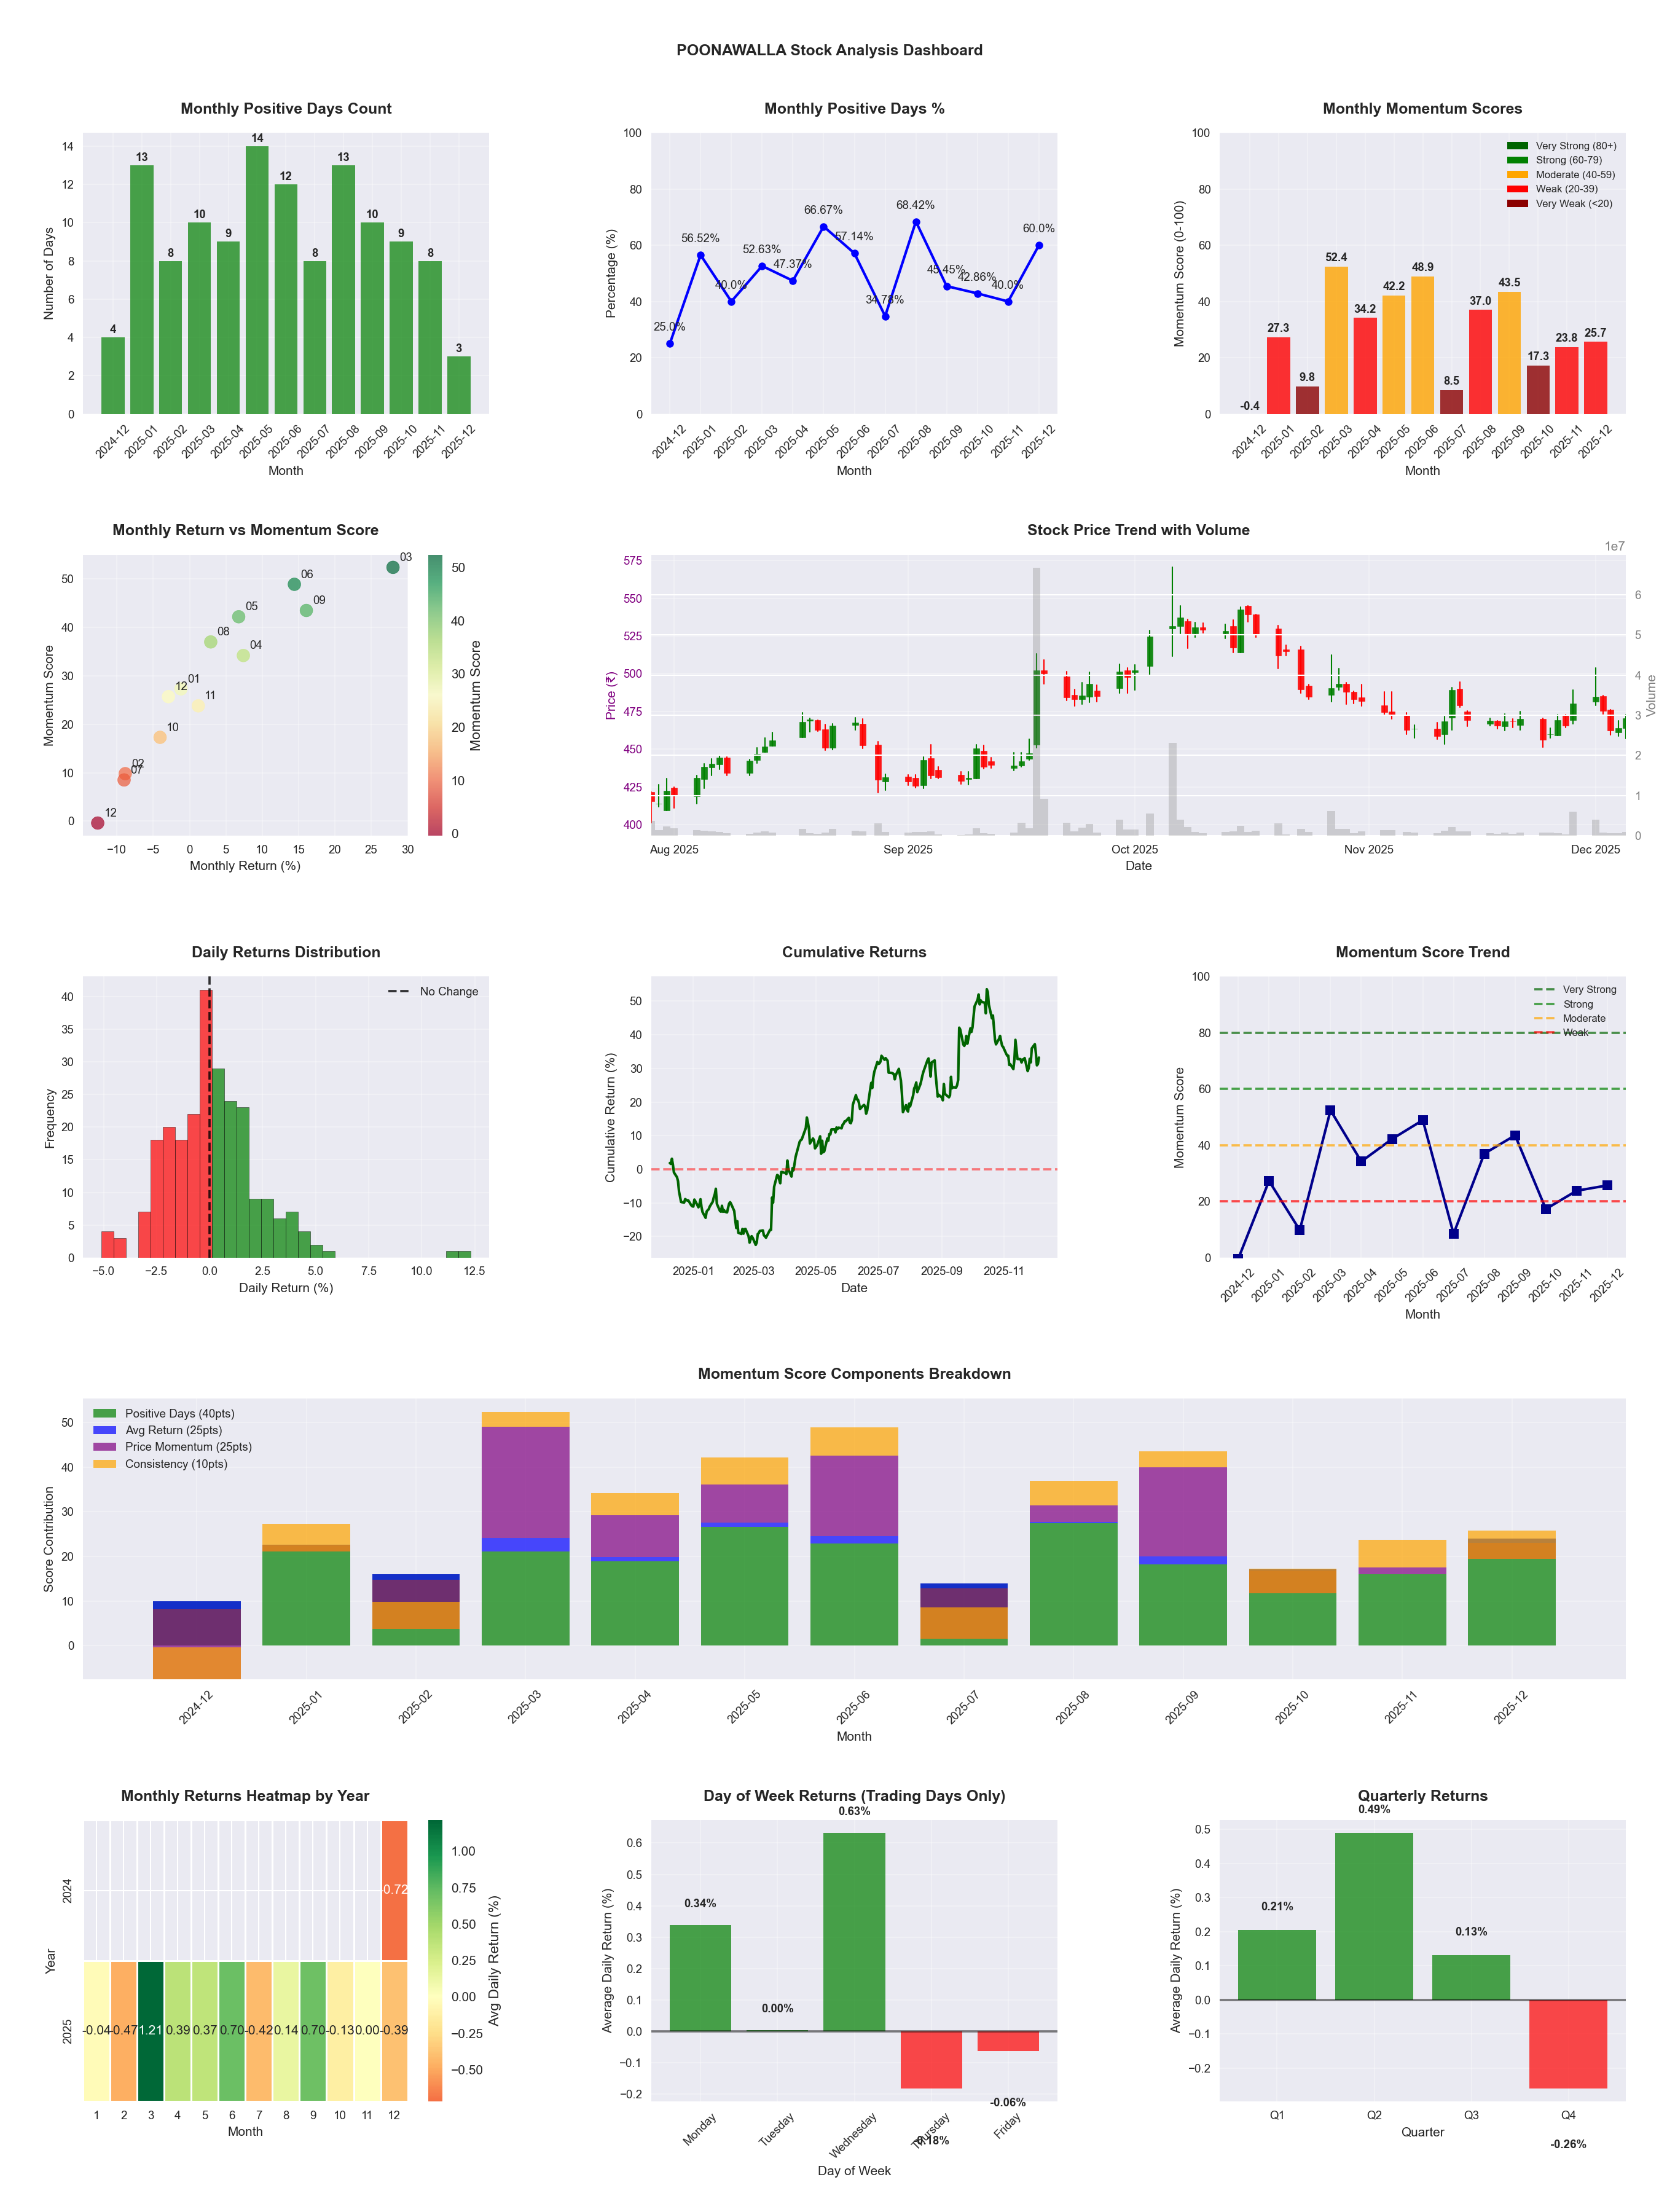
📊 Key Insights & Metrics
Symbol
📈 POONAWALLA
Date
📅 2026-04-11
Volatility
🟡 2.35%
Risk Profile
⚠️ suitable for aggressive investors
Win Rate
⚠️ 49.6%
Avg Daily Return
📈 +0.06%
Max Drawdown
📉 -32.09%
IBD RS Score
📊 33.7
Weak
Market Rank
#327
Best Month
🏆 2025-06
Best Months to Trade
📅 Jun, Feb, Sep
Best Days to Trade
📅 Wednesday, Monday
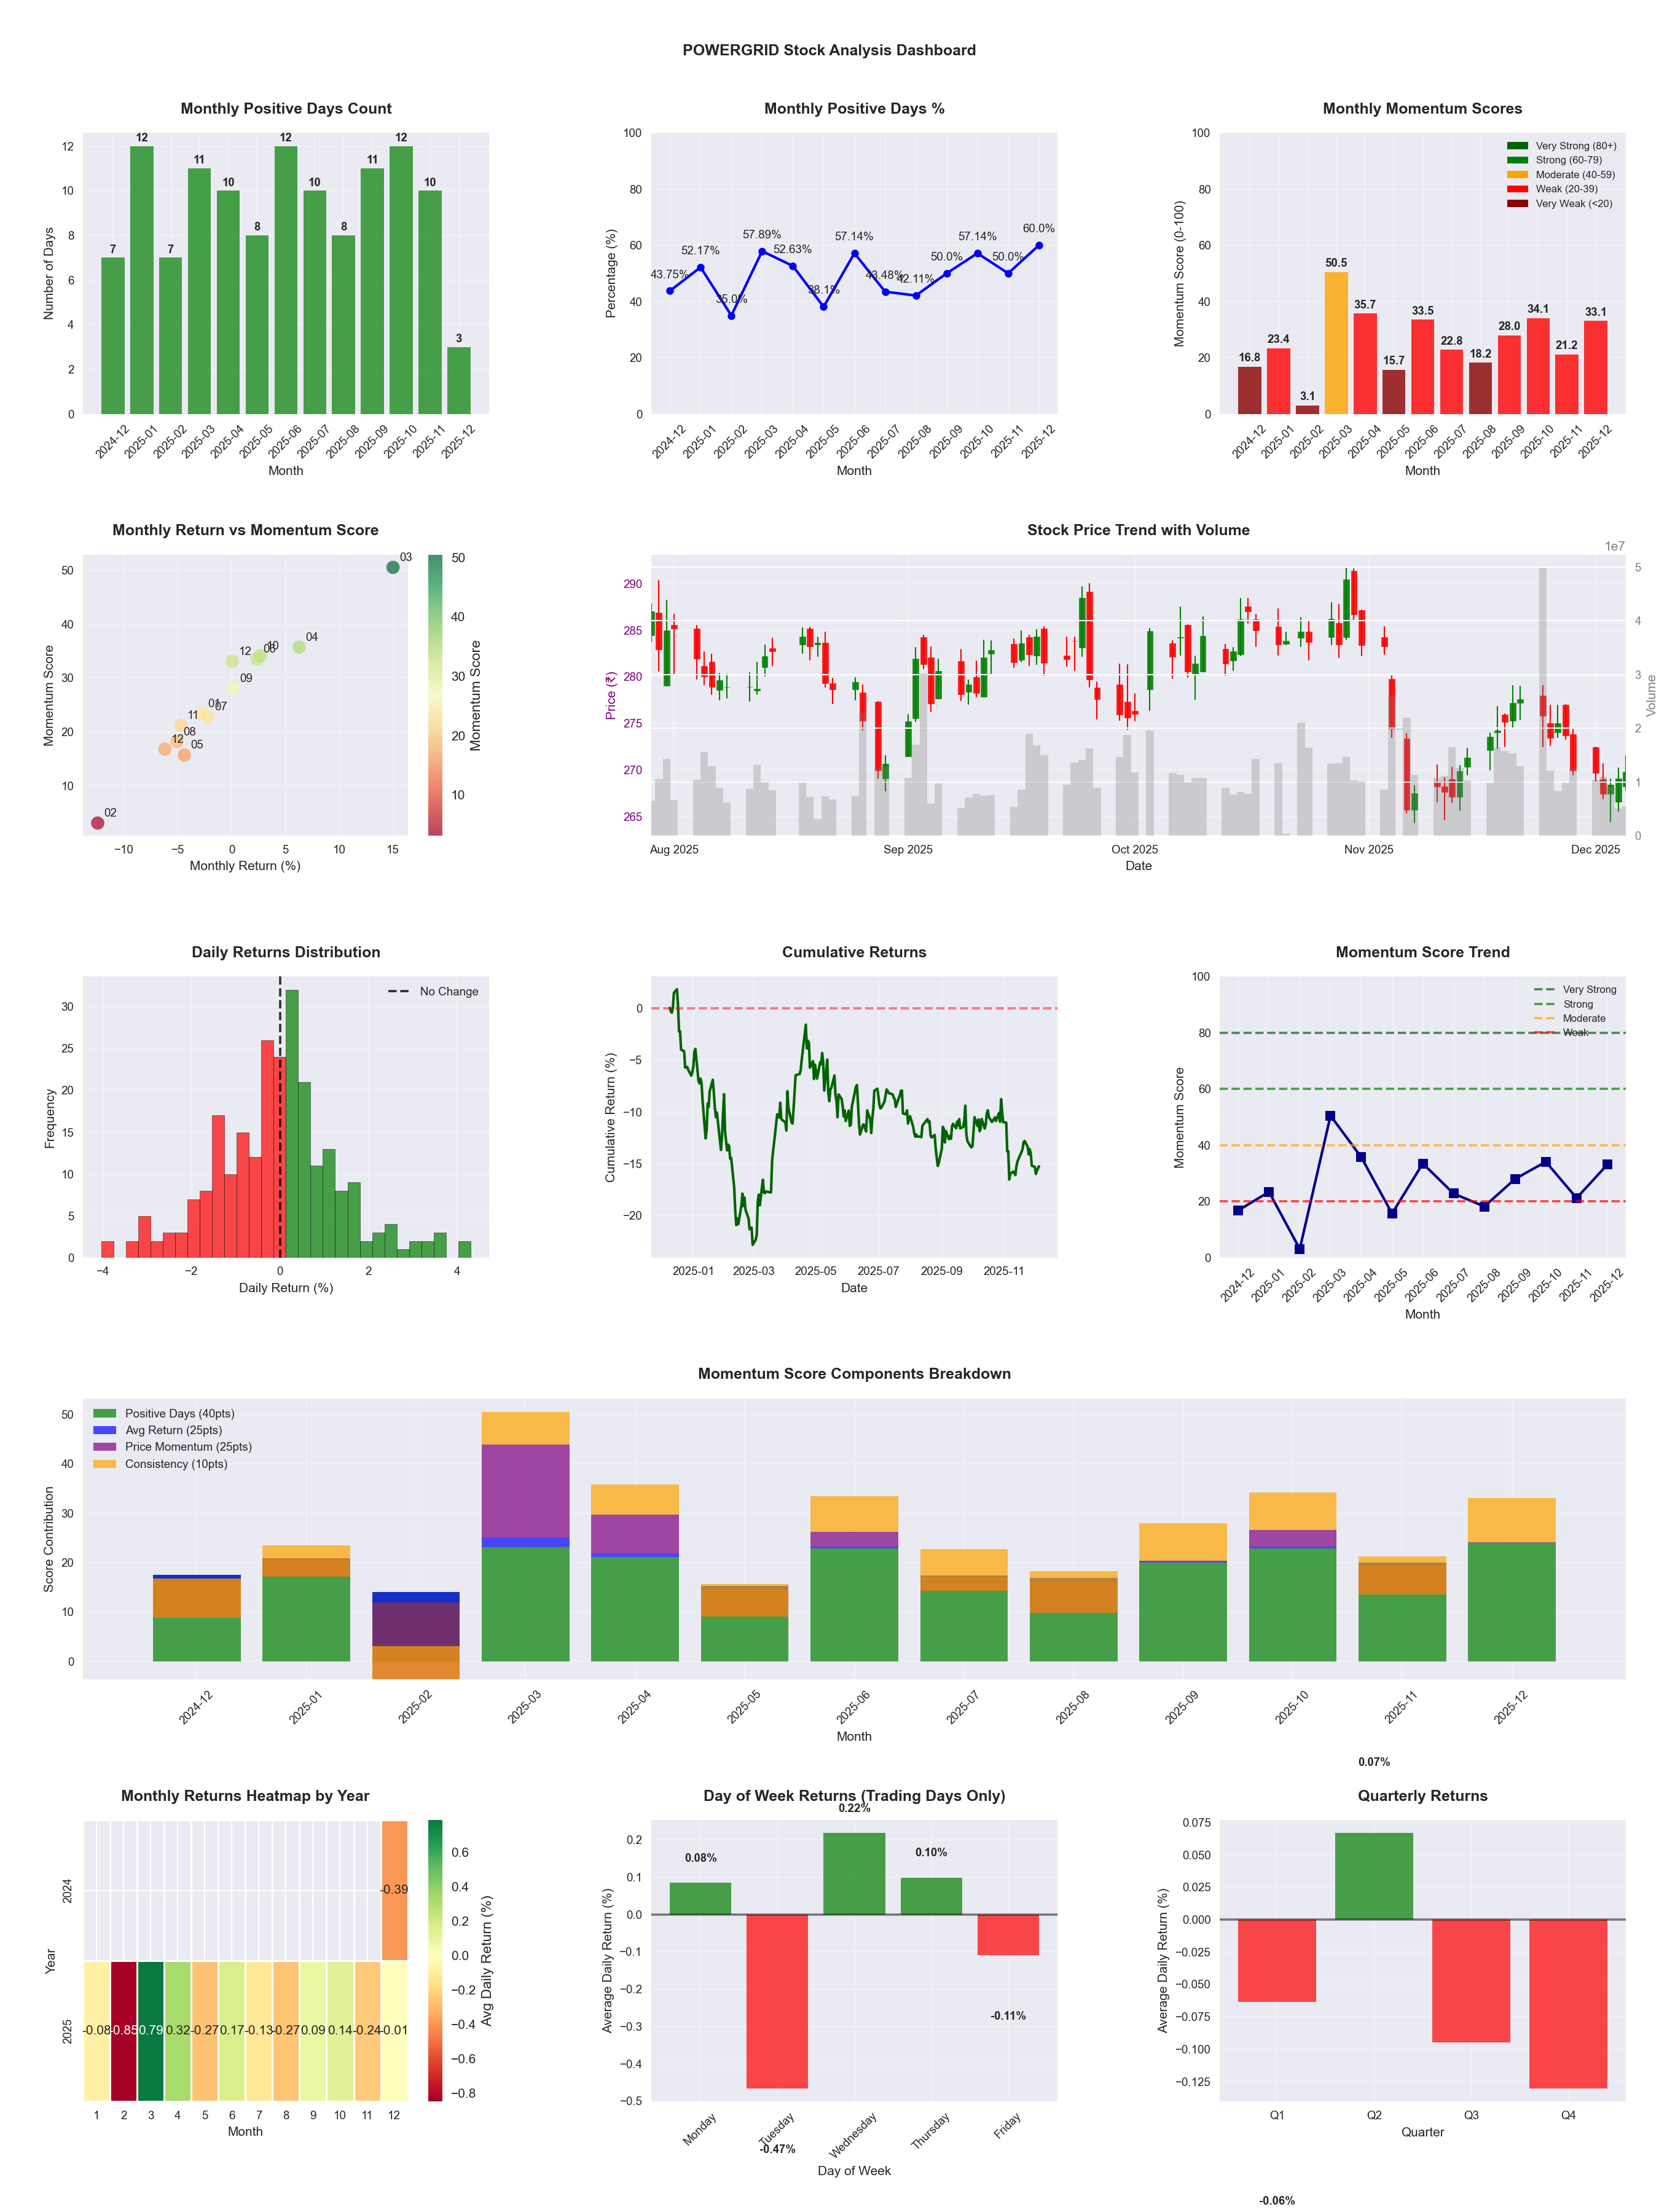
📊 Key Insights & Metrics
Symbol
📈 POWERGRID
Date
📅 2026-04-11
Volatility
🟢 1.31%
Win Rate
⚠️ 51.2%
Avg Daily Return
📈 +0.02%
Max Drawdown
📉 -18.92%
IBD RS Score
📊 77.5
Strong
Market Rank
#111
Best Month
🏆 2026-02
Worst Month
📉 2025-05
Best Months to Trade
📅 Feb, Apr, Jun
Best Days to Trade
📅 Monday, Wednesday
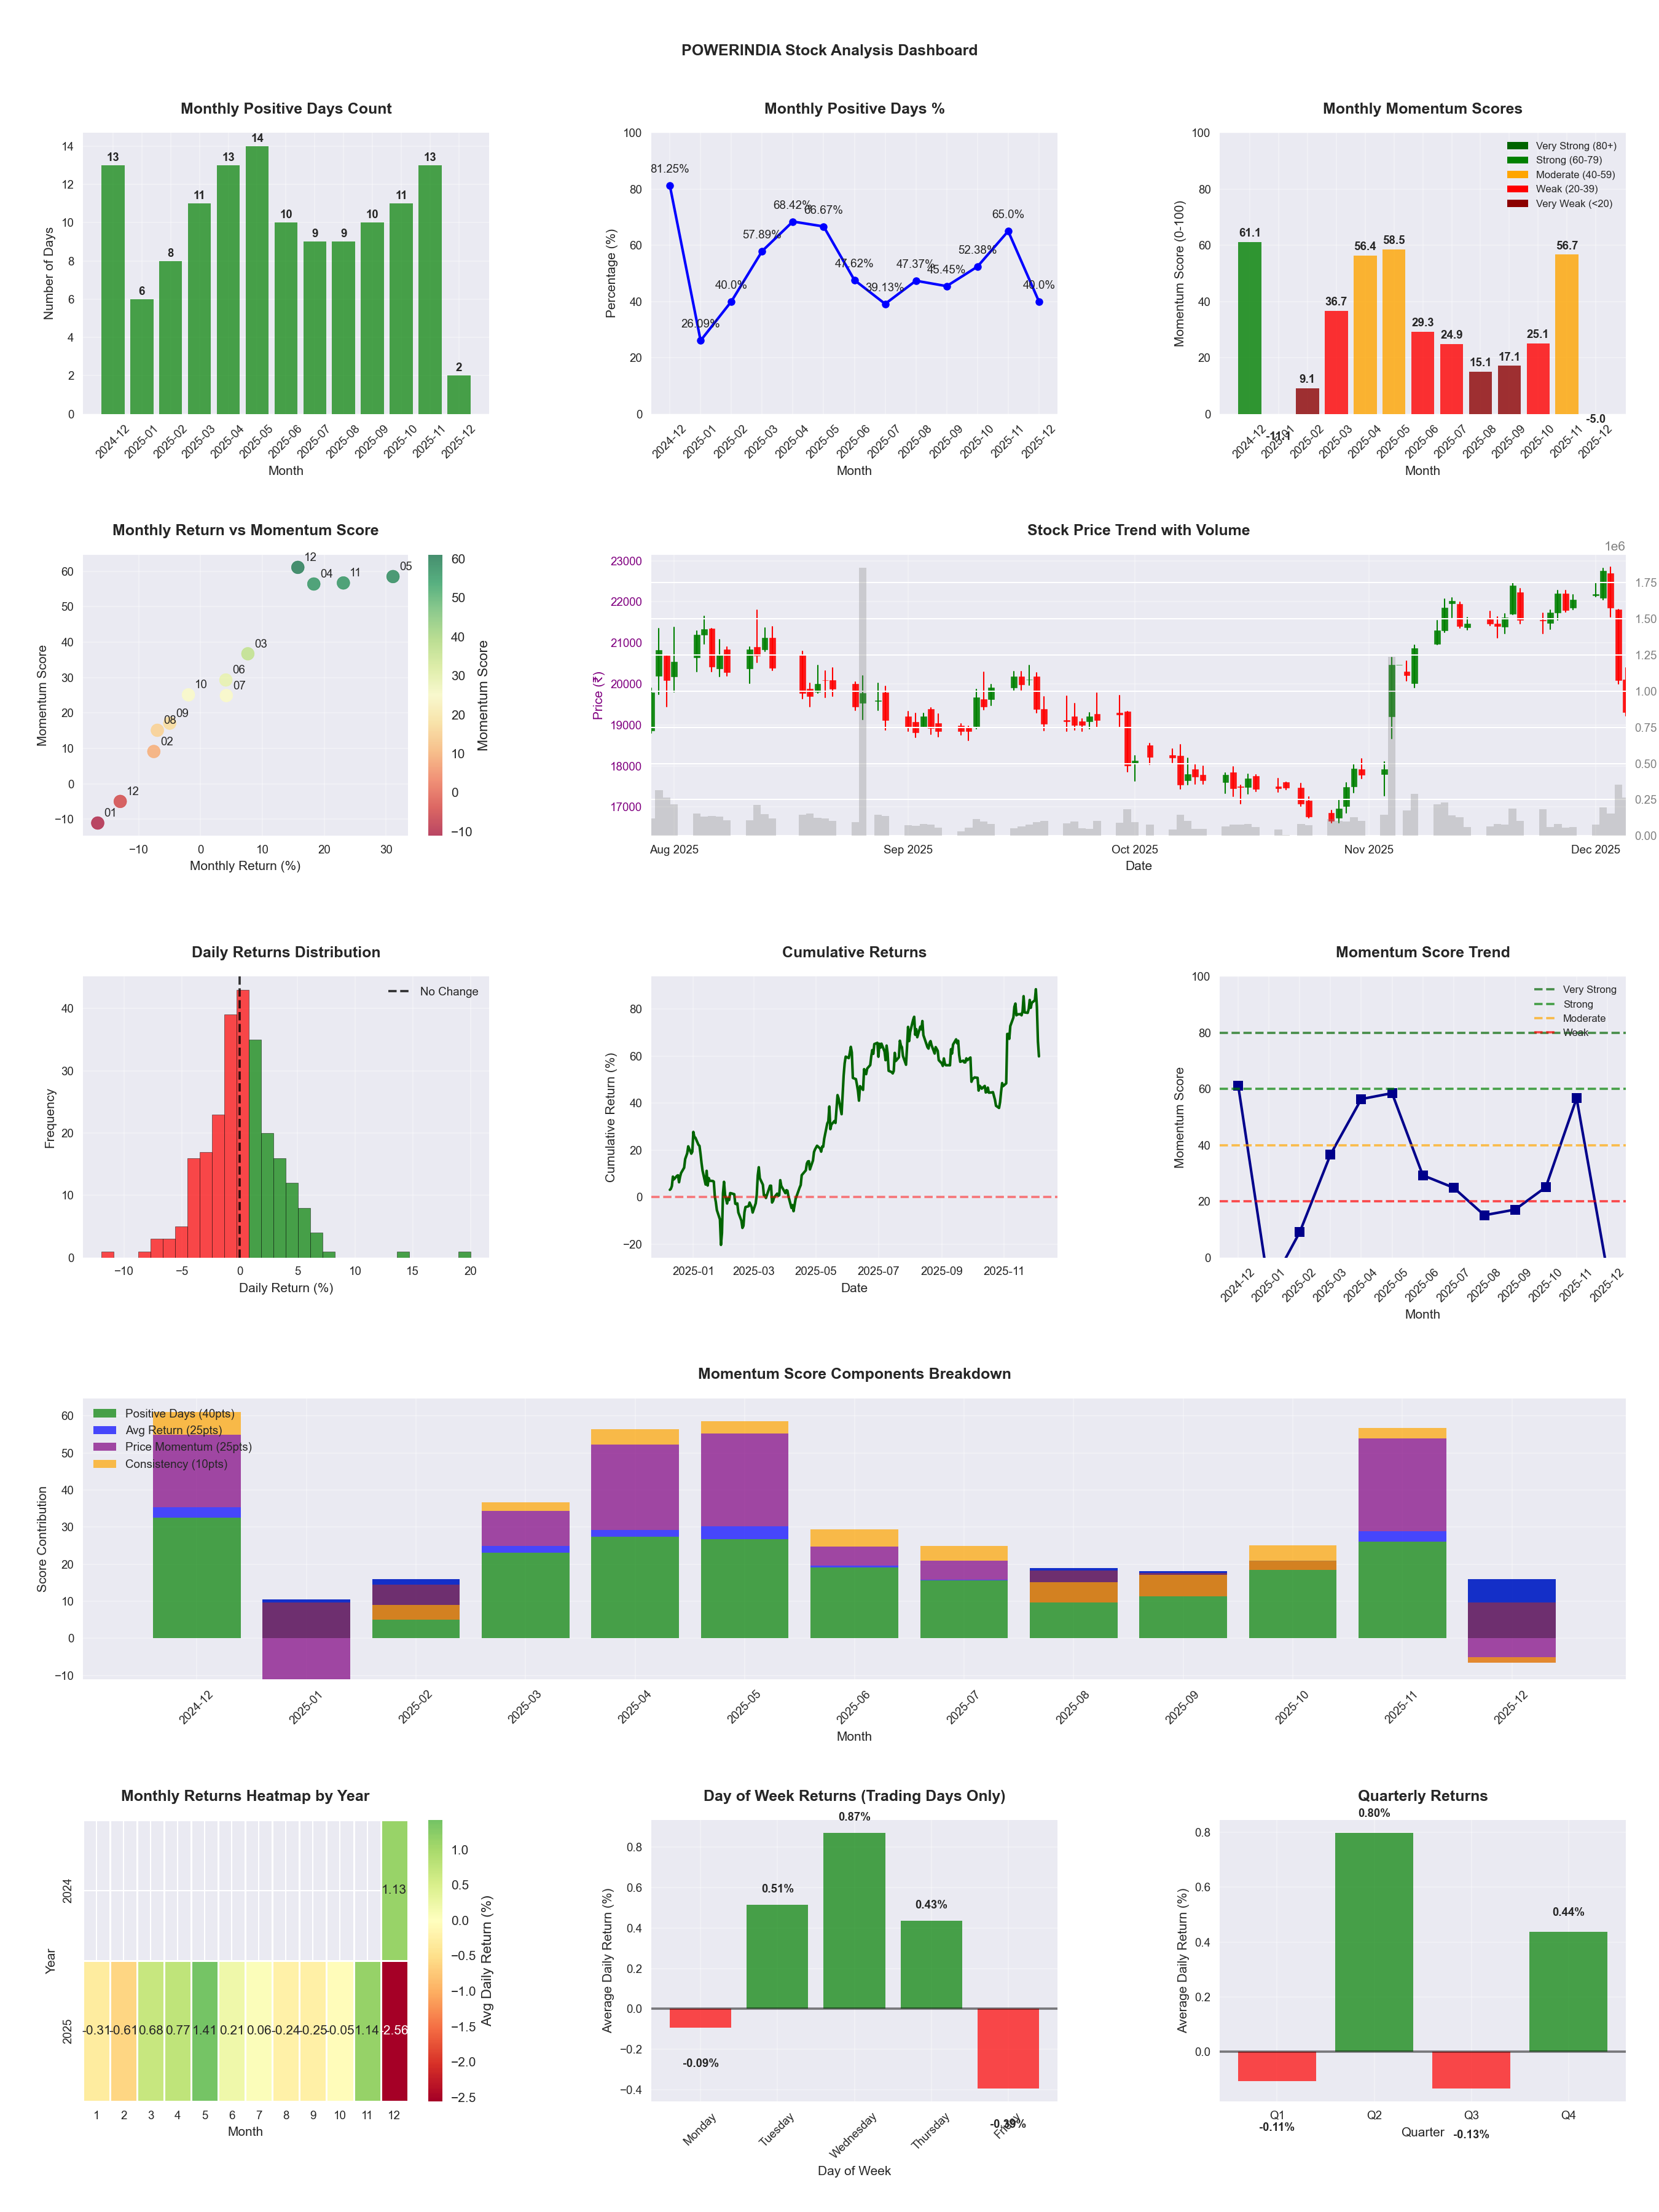
📊 Key Insights & Metrics
Symbol
📈 POWERINDIA
Date
📅 2026-04-11
Volatility
🟡 2.84%
Risk Profile
⚠️ suitable for aggressive investors
Win Rate
⚠️ 55.3%
Avg Daily Return
📈 +0.39%
Max Drawdown
📉 -28.75%
IBD RS Score
📊 99.4
Leader
Market Rank
#3
Best Month
🏆 2025-04
Best Months to Trade
📅 Apr, Feb, May
Best Days to Trade
📅 Wednesday, Tuesday
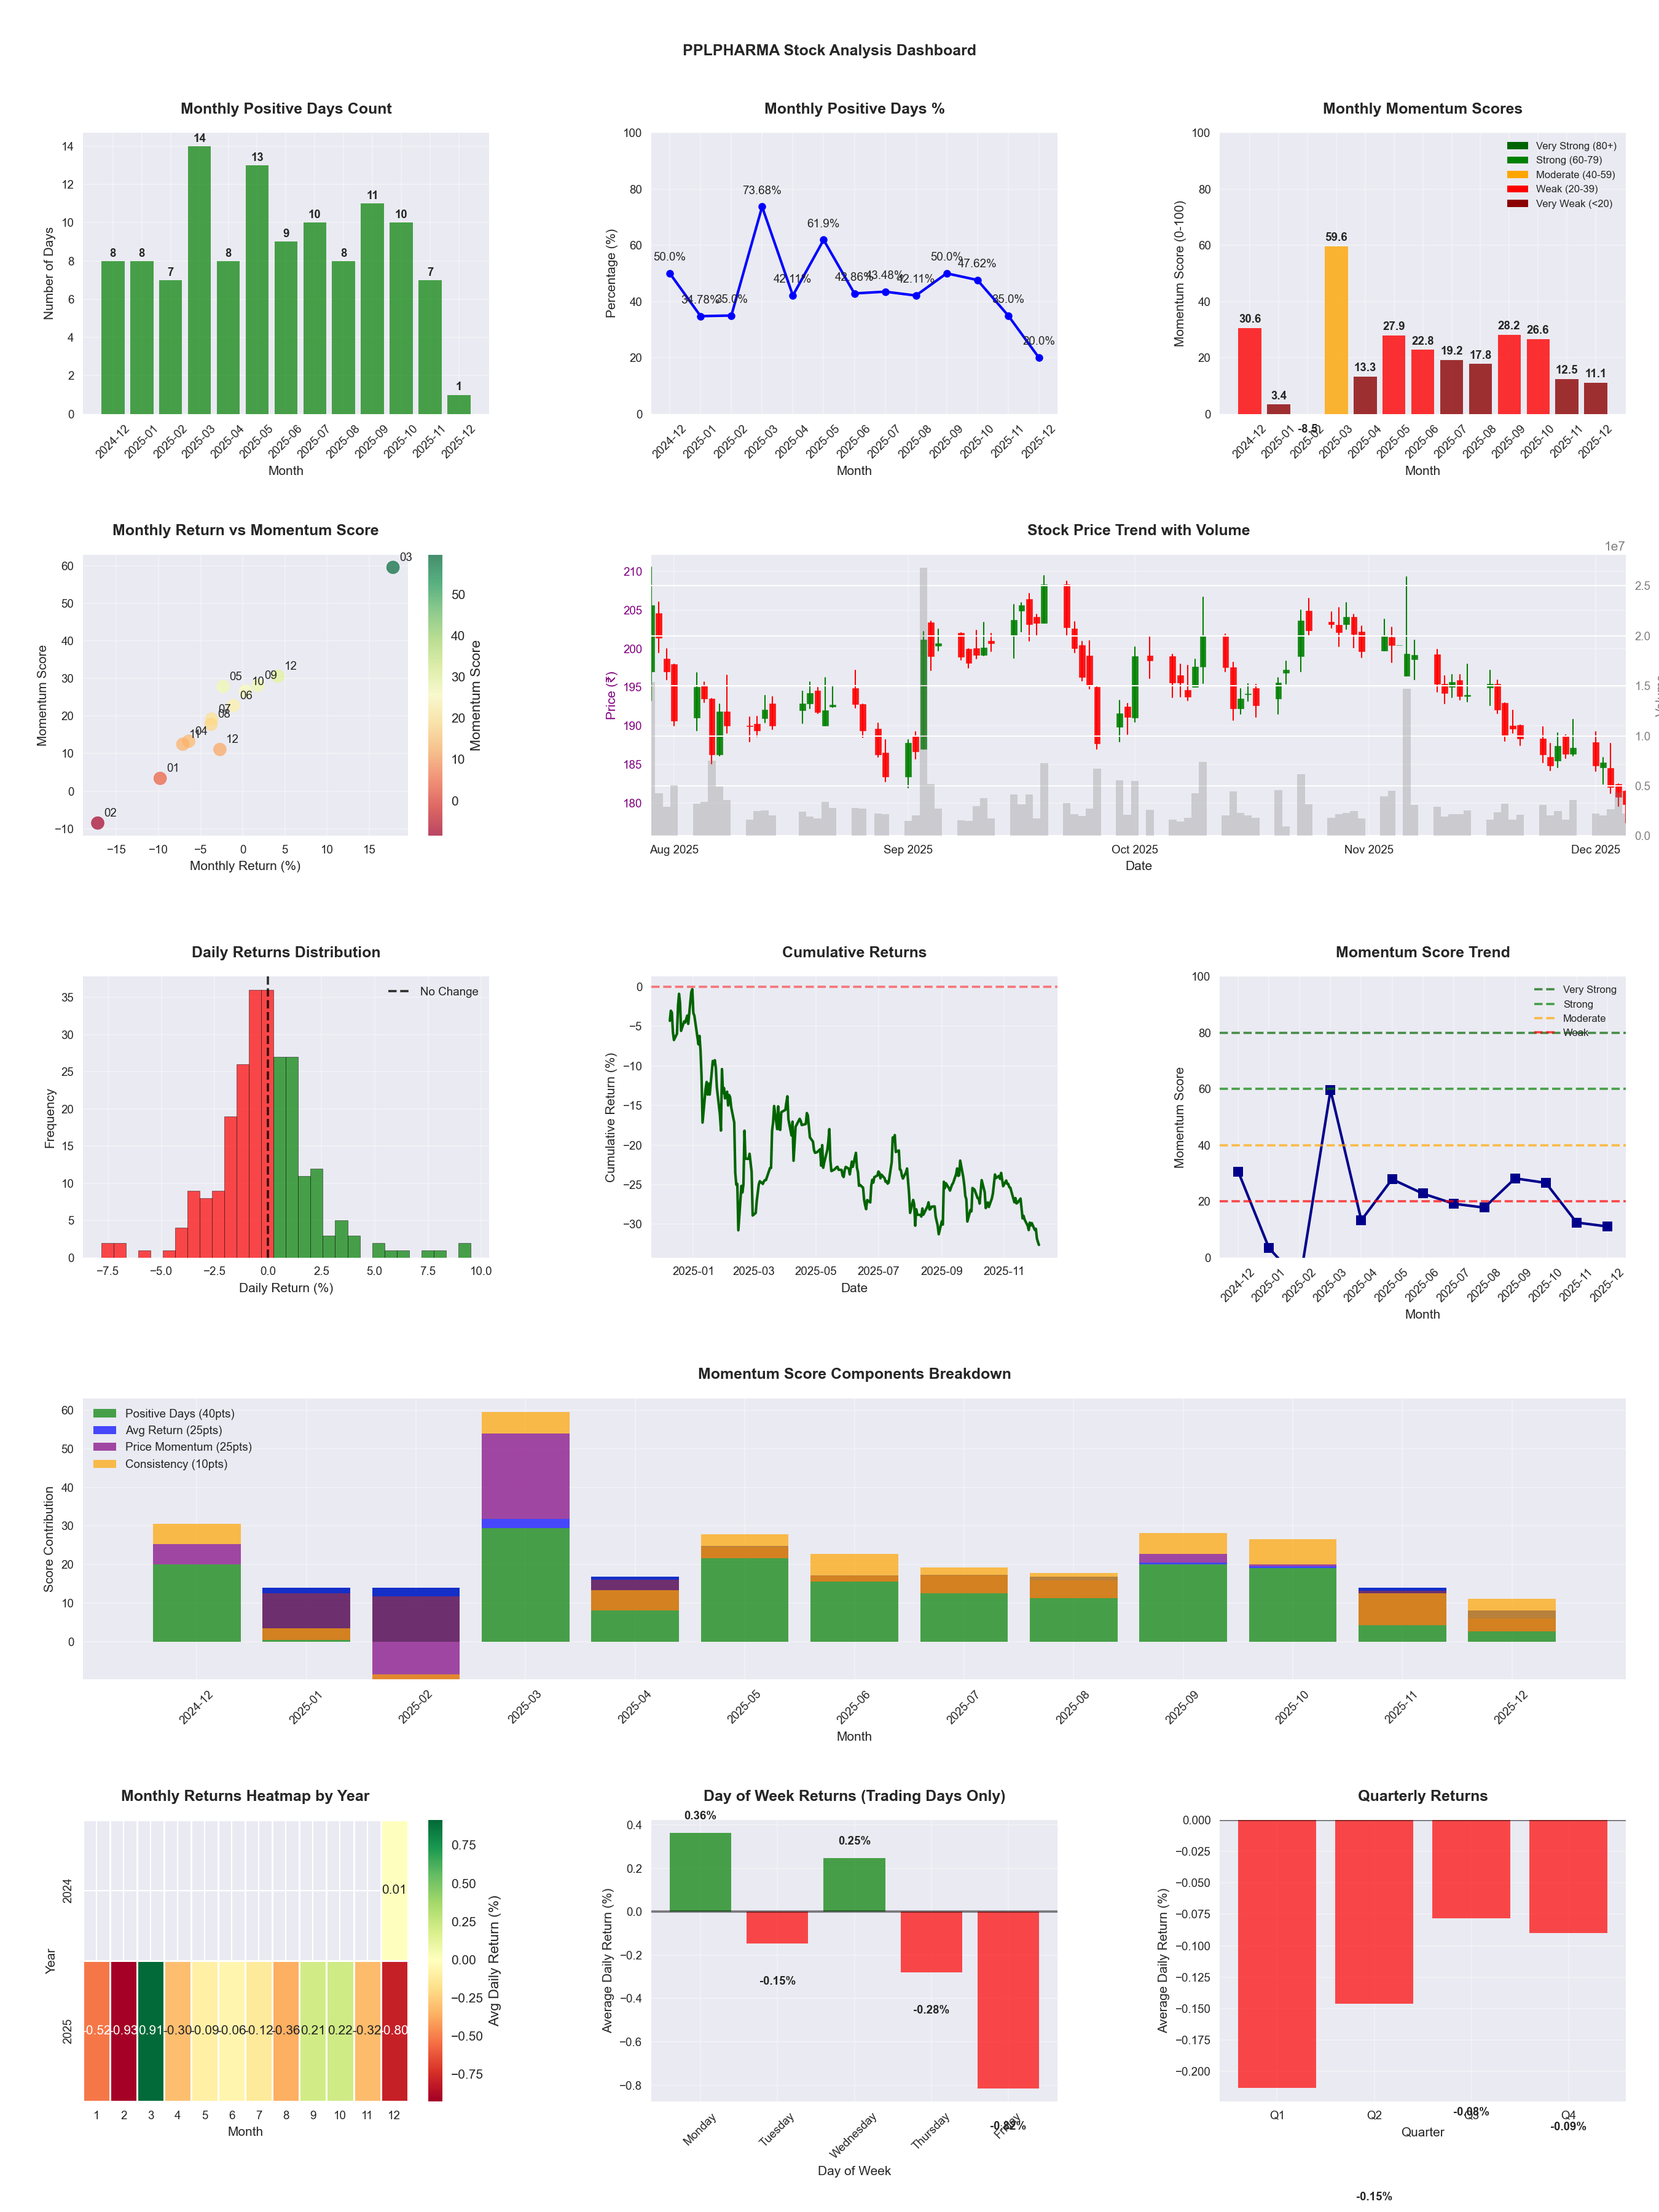
📊 Key Insights & Metrics
Symbol
📈 PPLPHARMA
Date
📅 2026-04-11
Volatility
🟡 1.82%
Win Rate
⚠️ 45.5%
Avg Daily Return
📉 -0.15%
Max Drawdown
📉 -40.59%
IBD RS Score
📊 8.9
Weak
Market Rank
#449
Best Month
🏆 2026-02
Worst Month
📉 2026-03
Best Months to Trade
📅 Oct, Sep, Apr
Best Days to Trade
📅 Wednesday, Monday
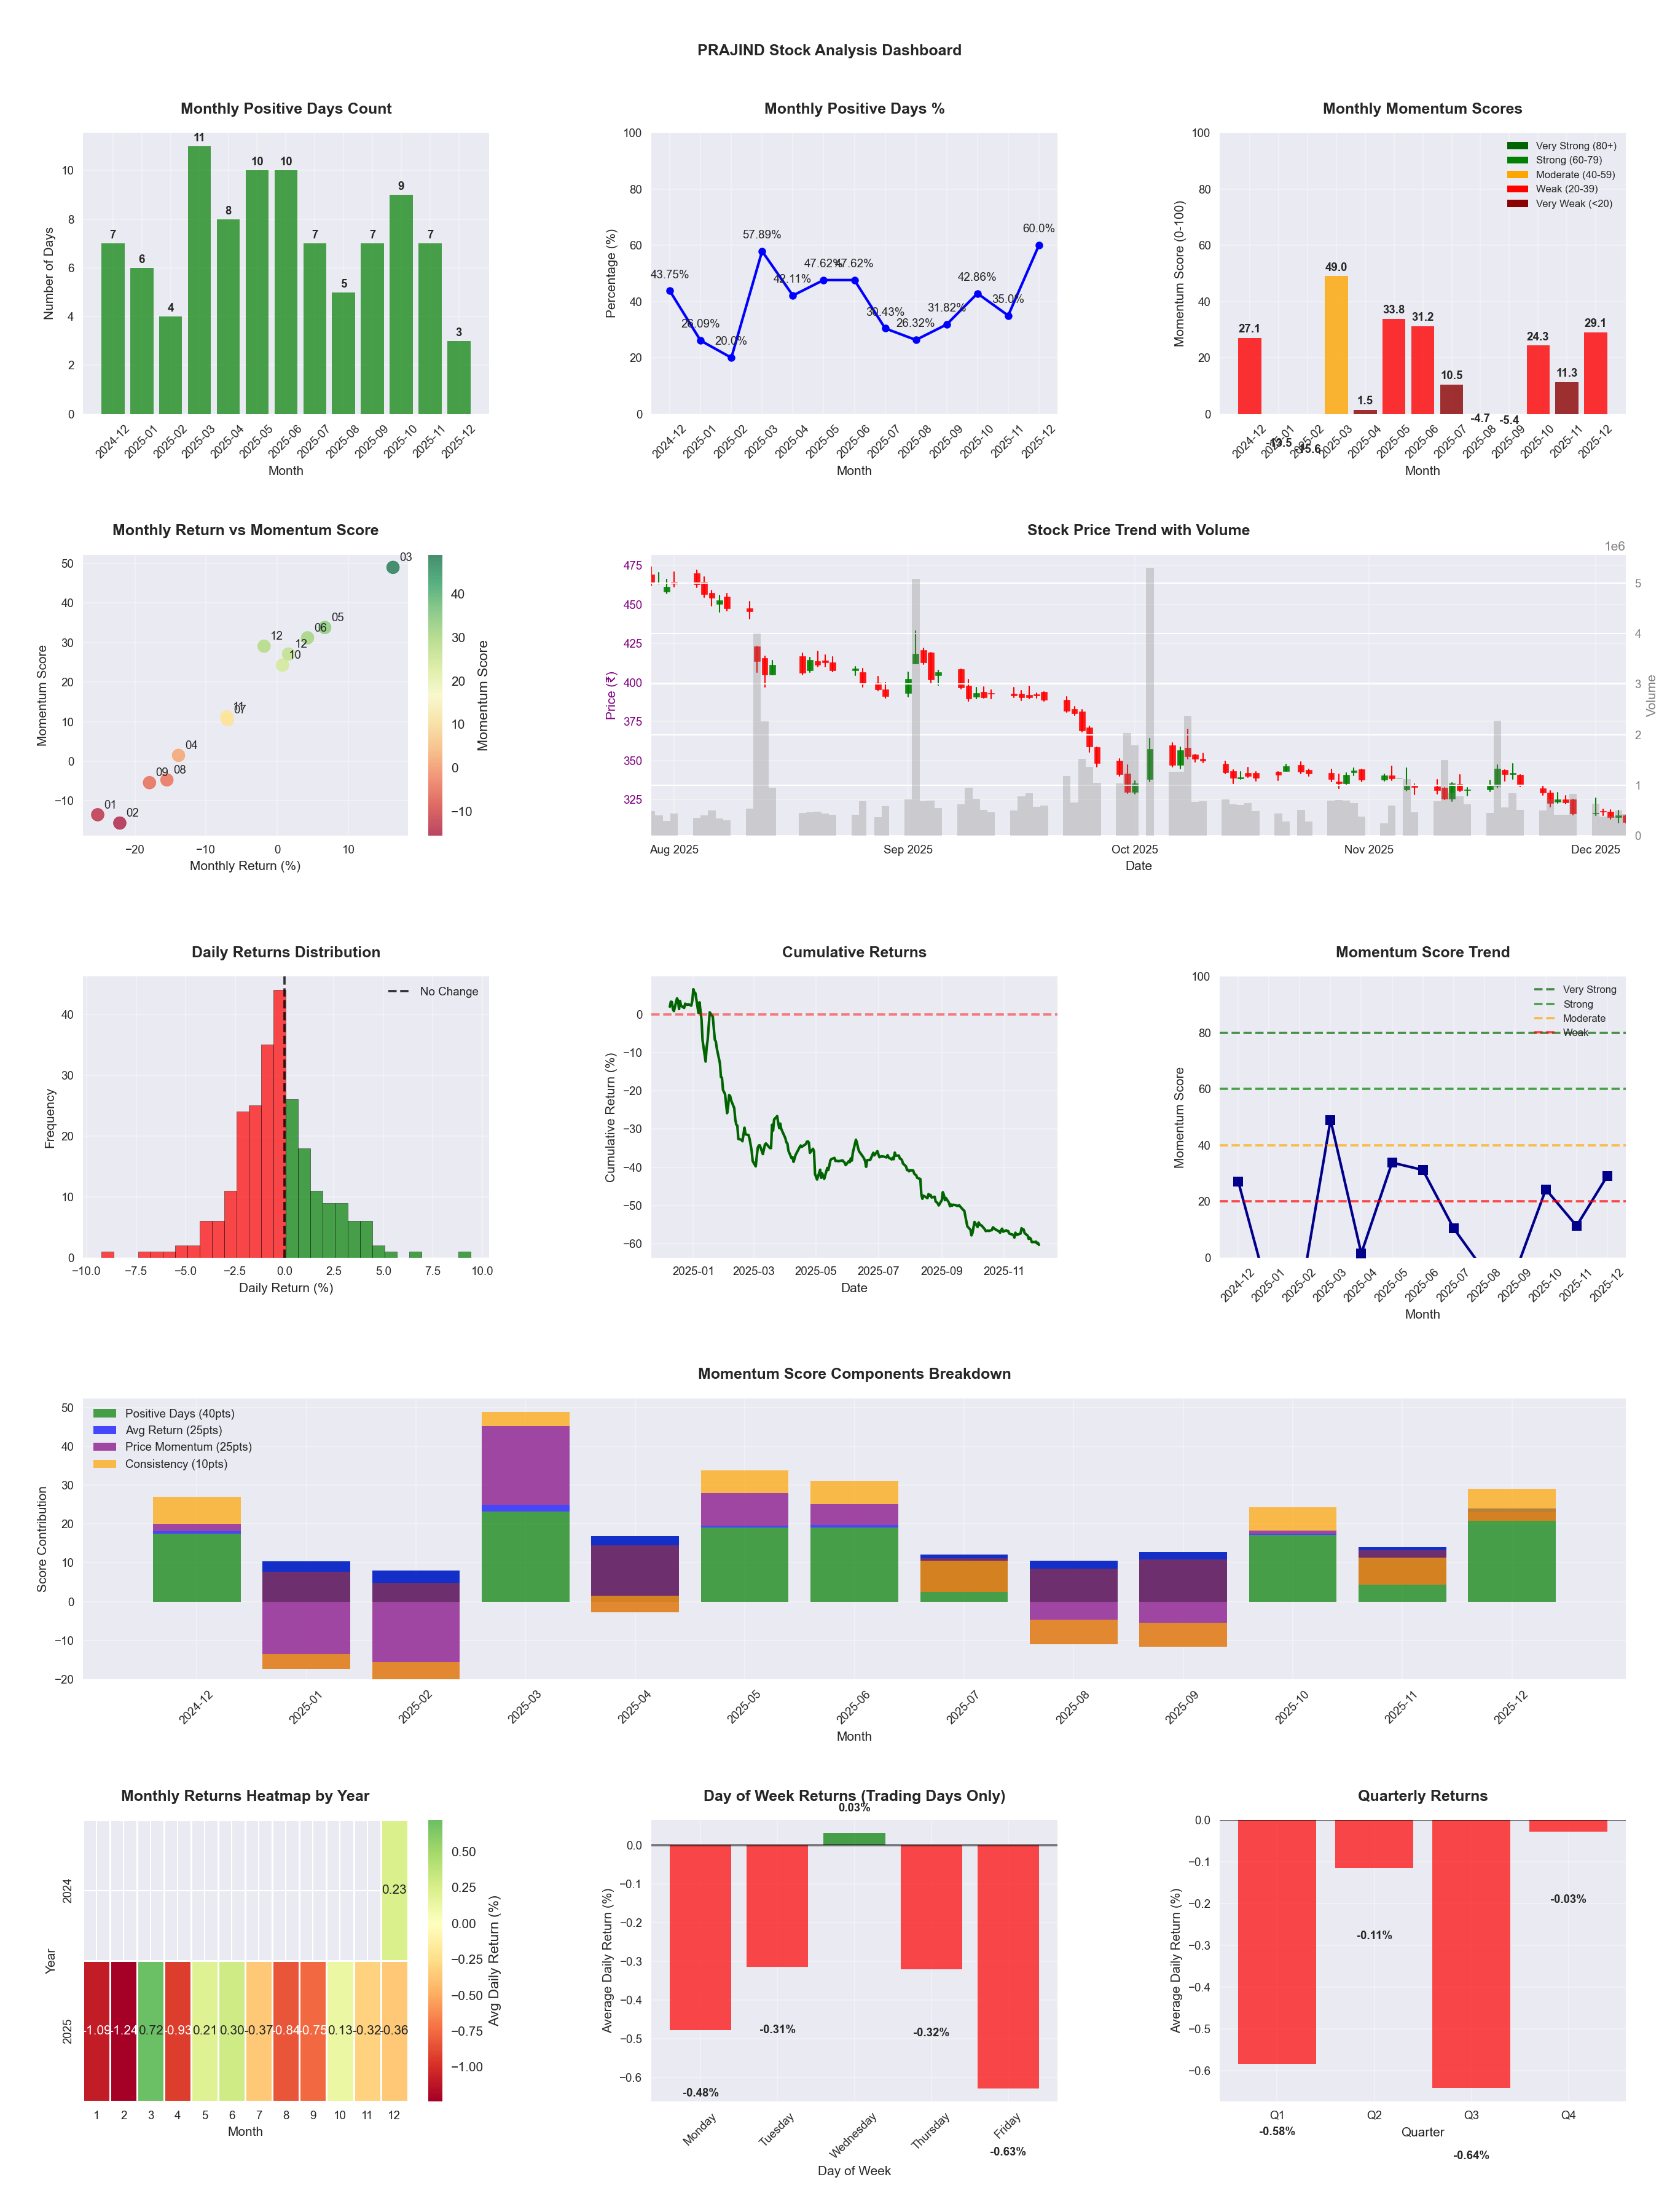
📊 Key Insights & Metrics
Symbol
📈 PRAJIND
Date
📅 2026-04-11
Volatility
🟡 2.49%
Risk Profile
⚠️ suitable for aggressive investors
Win Rate
⚠️ 41.9%
Avg Daily Return
📉 -0.12%
Max Drawdown
📉 -47.48%
IBD RS Score
📊 39.4
Weak
Market Rank
#299
Best Month
🏆 2026-04
Best Months to Trade
📅 Feb, Jun, May
Best Days to Trade
📅 Tuesday, Monday
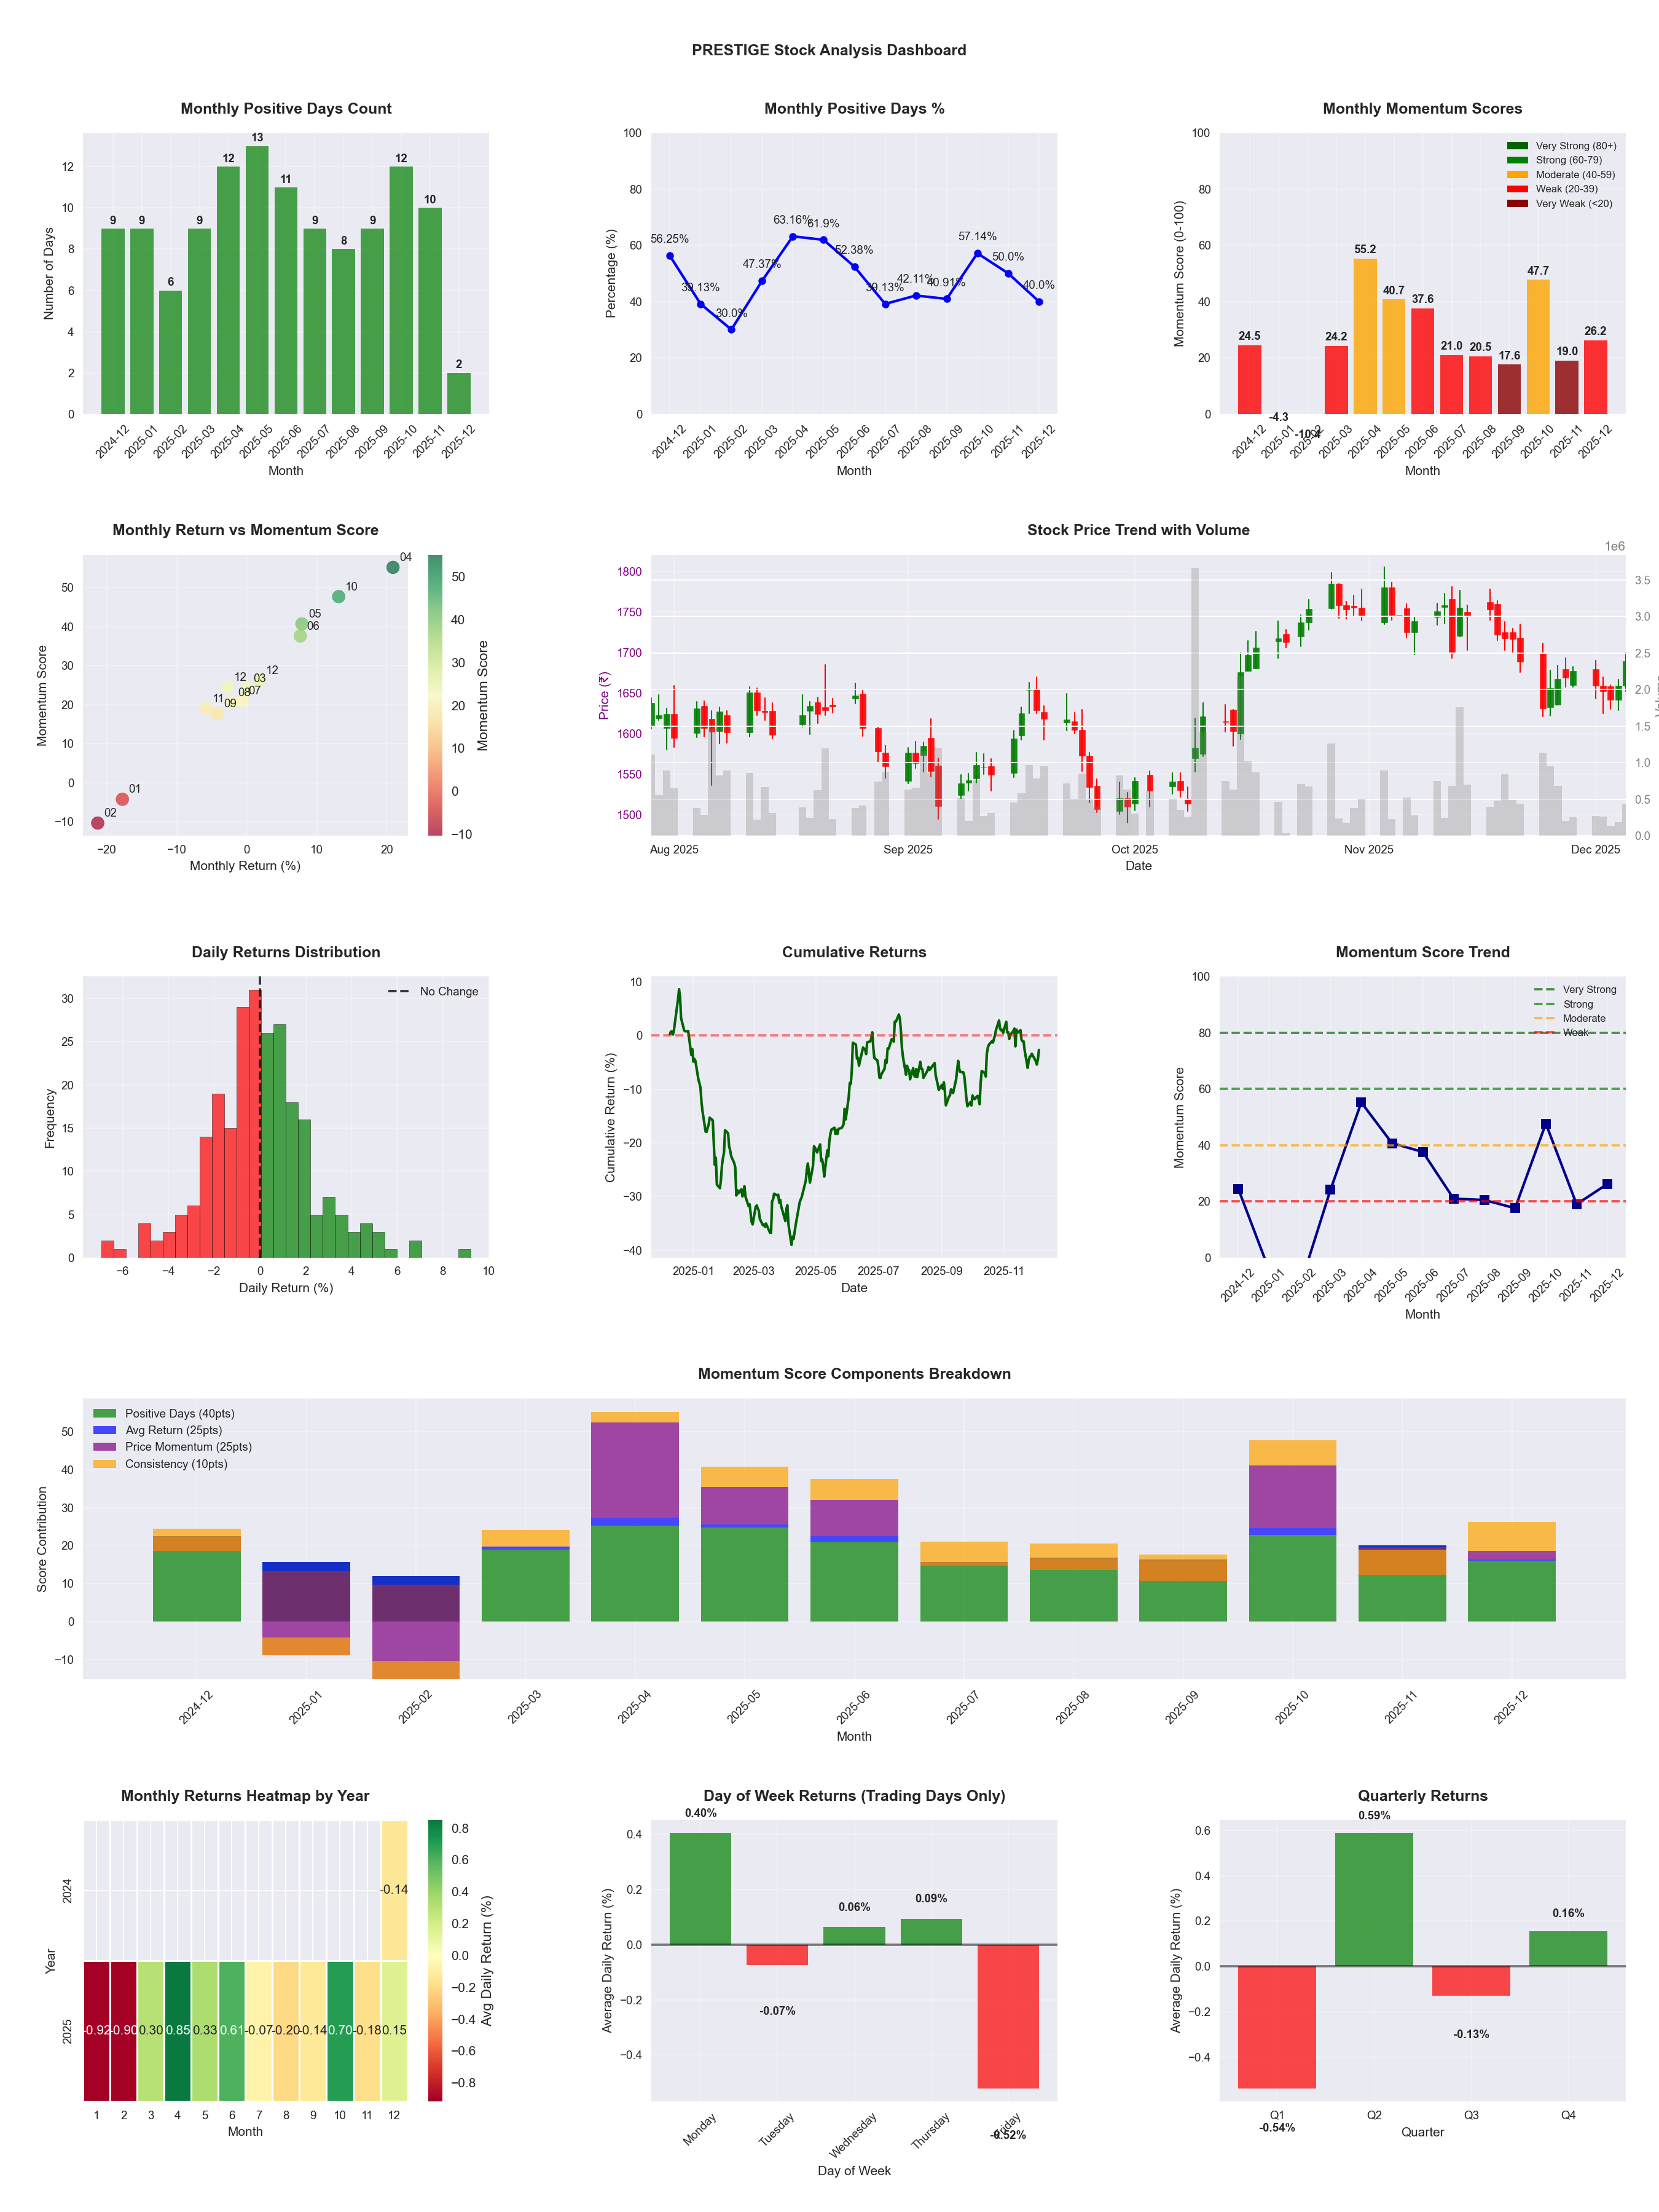
📊 Key Insights & Metrics
Symbol
📈 PRESTIGE
Date
📅 2026-04-11
Volatility
🟡 2.10%
Risk Profile
⚠️ suitable for aggressive investors
Win Rate
⚠️ 49.6%
Avg Daily Return
📈 +0.09%
Max Drawdown
📉 -37.56%
IBD RS Score
📊 31.8
Weak
Market Rank
#336
Best Month
🏆 2026-04
Best Months to Trade
📅 Apr, Oct, Jun
Best Days to Trade
📅 Monday, Wednesday
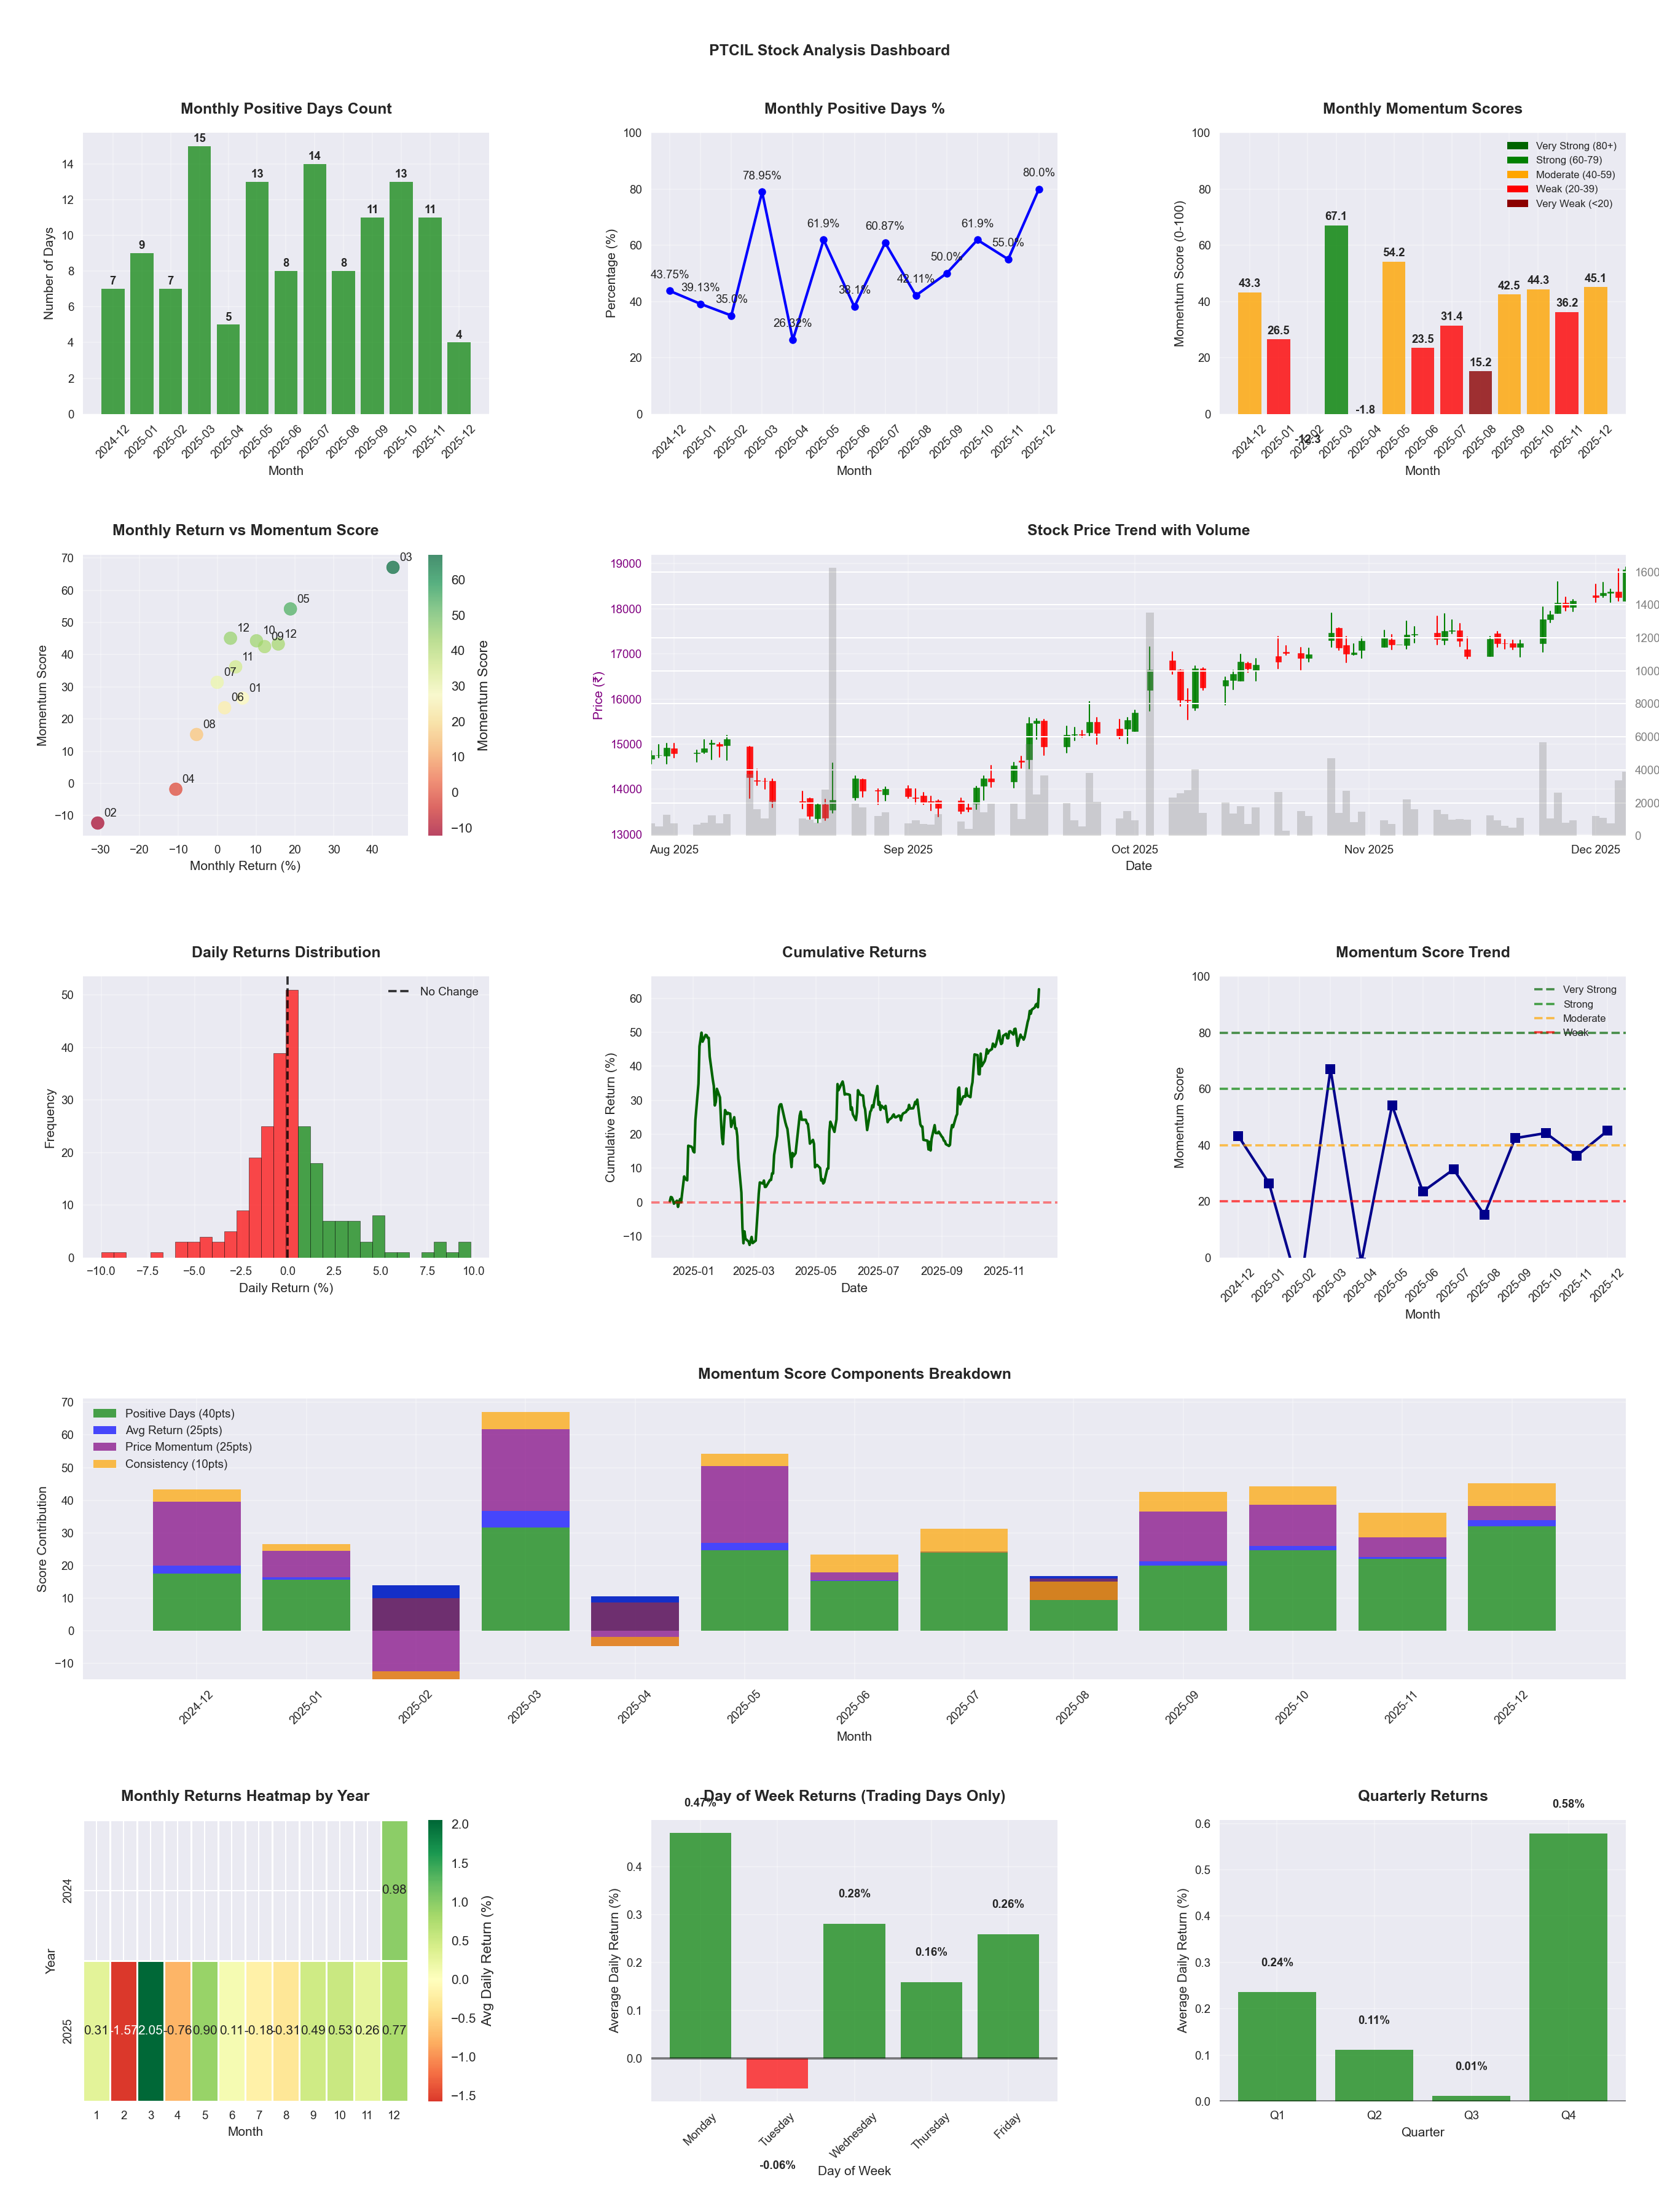
📊 Key Insights & Metrics
Symbol
📈 PTCIL
Date
📅 2026-04-11
Volatility
🟡 2.17%
Risk Profile
⚠️ suitable for aggressive investors
Win Rate
⚠️ 49.4%
Avg Daily Return
📈 +0.08%
Max Drawdown
📉 -23.21%
IBD RS Score
📊 55.4
Average
Market Rank
#220
Best Month
🏆 2025-05
Best Months to Trade
📅 May, Oct, Sep
Best Days to Trade
📅 Wednesday, Monday
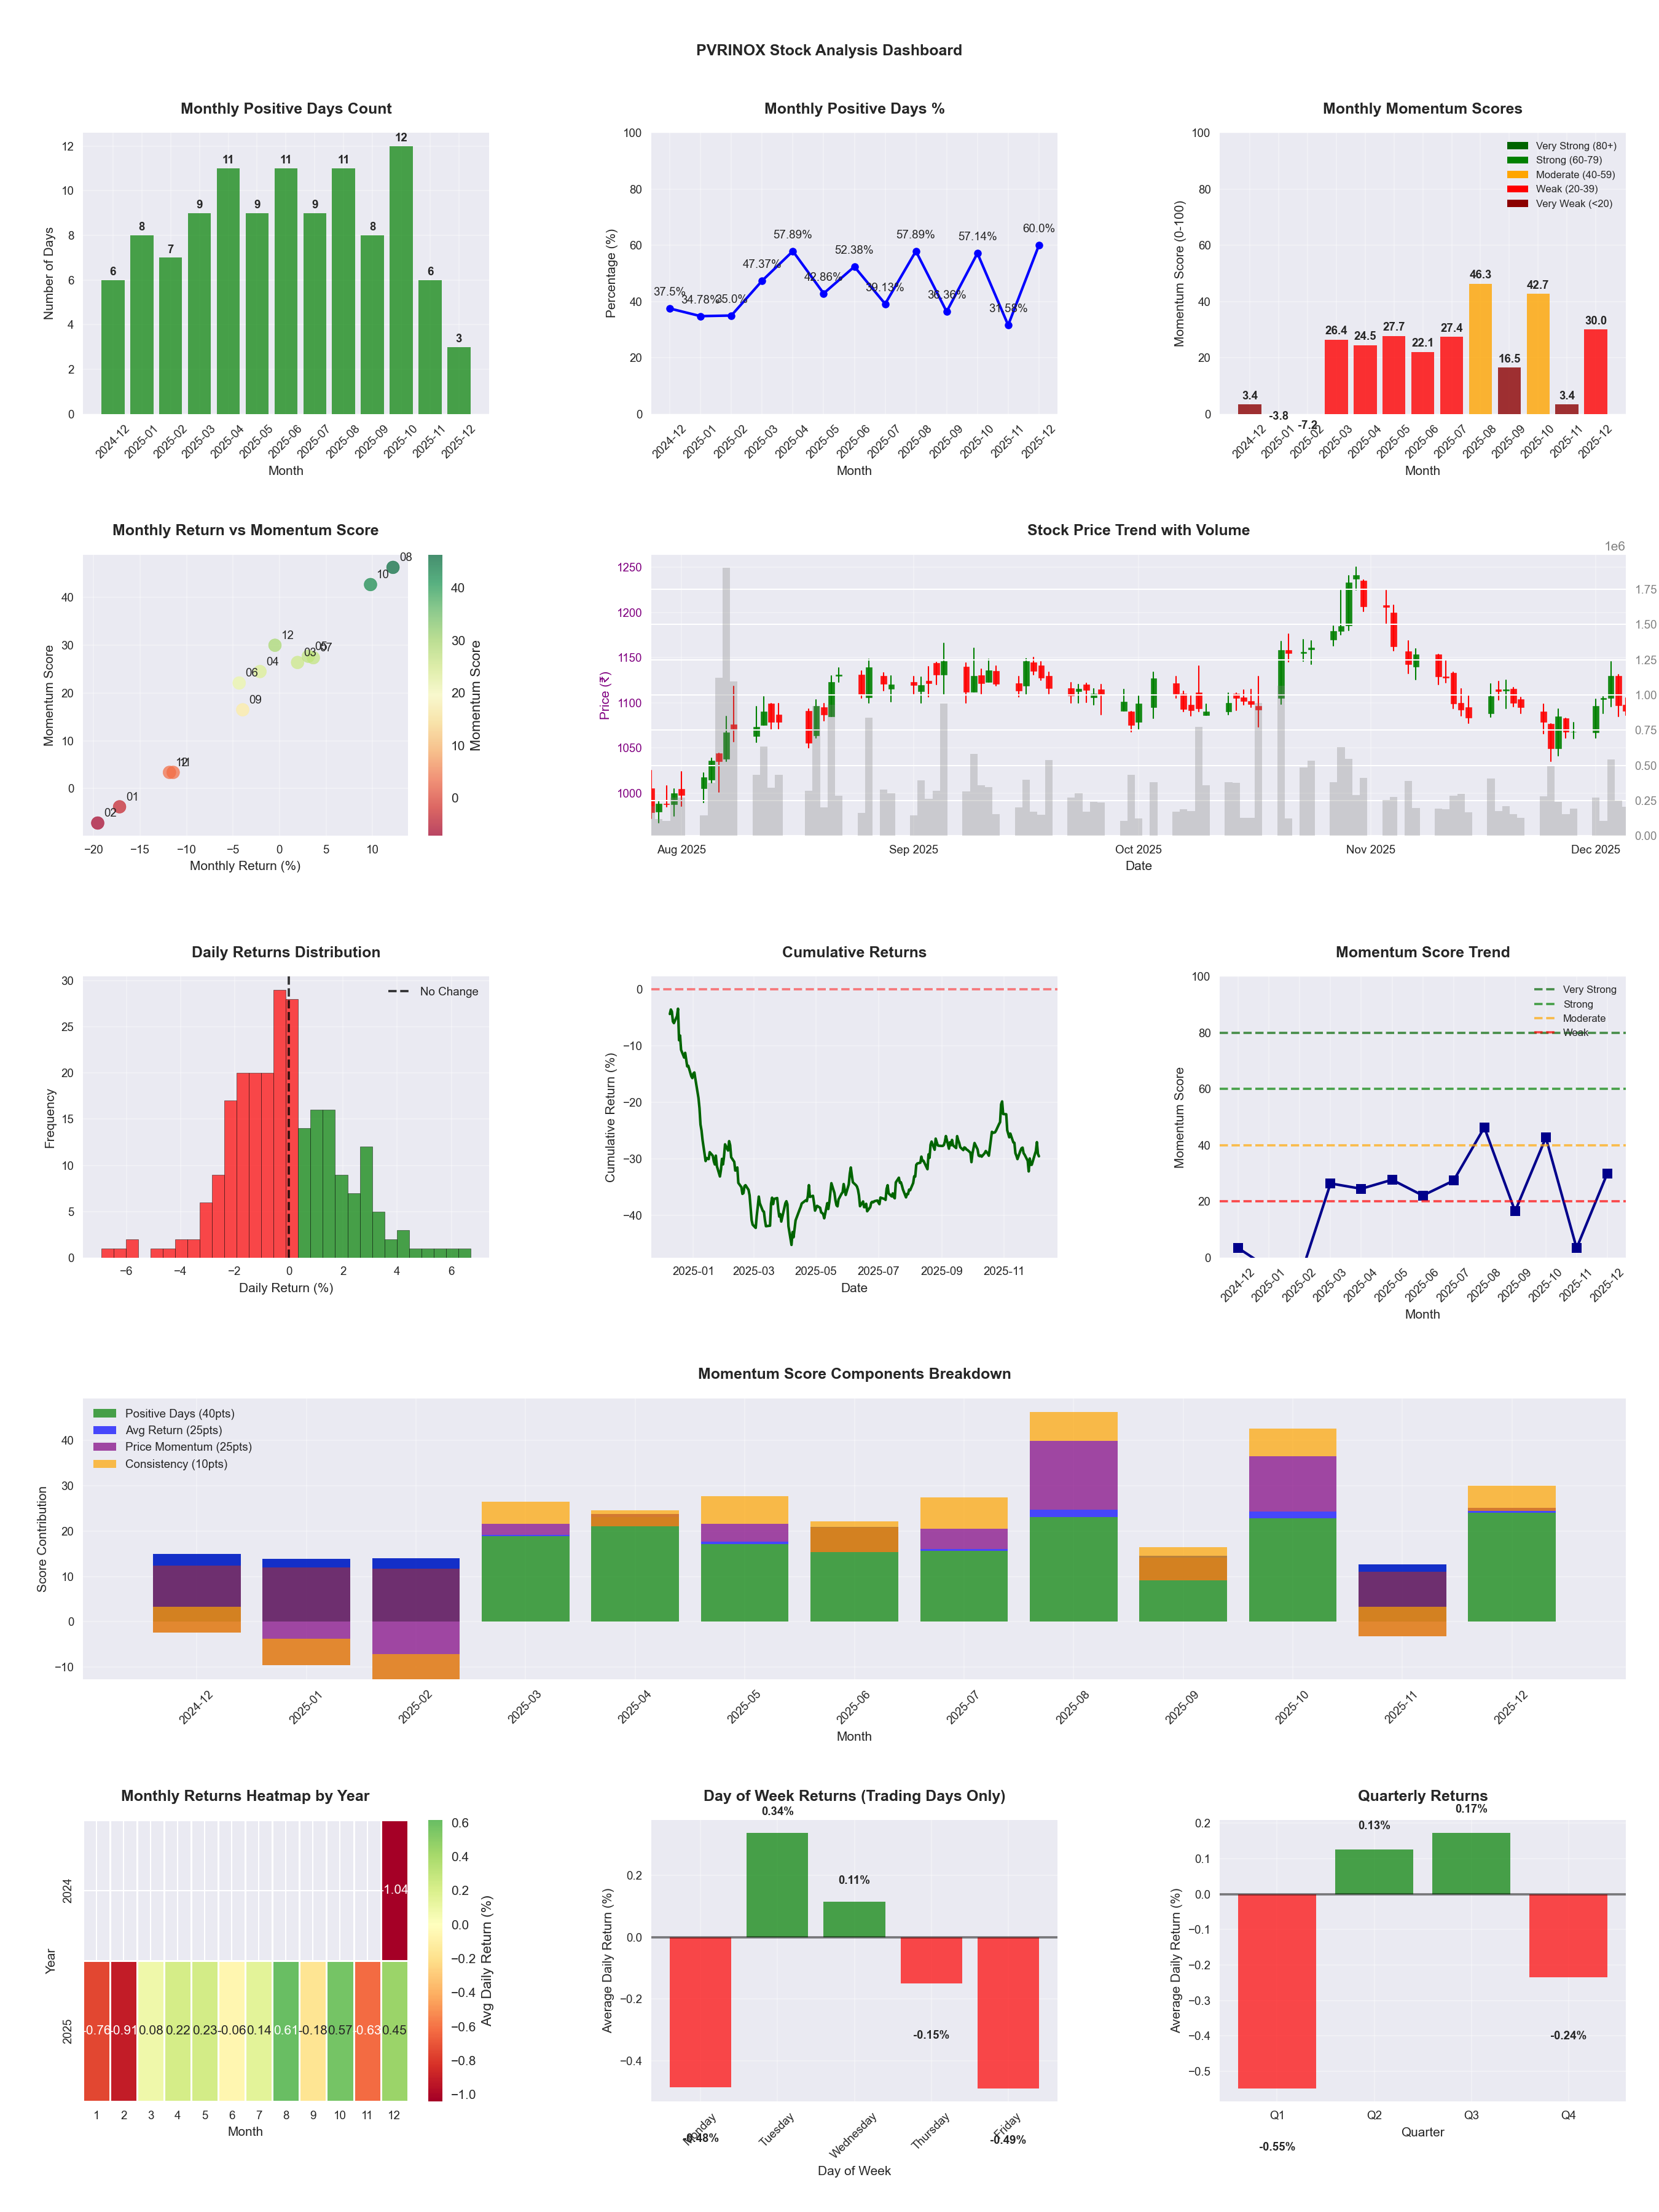
📊 Key Insights & Metrics
Symbol
📈 PVRINOX
Date
📅 2026-04-11
Volatility
🟡 1.83%
Win Rate
⚠️ 45.7%
Avg Daily Return
📈 +0.03%
Max Drawdown
📉 -25.98%
IBD RS Score
📊 48.1
Weak
Market Rank
#256
Best Month
🏆 2025-08
Worst Month
📉 2025-11
Best Months to Trade
📅 Aug, Oct, Apr
Best Days to Trade
📅 Tuesday, Wednesday
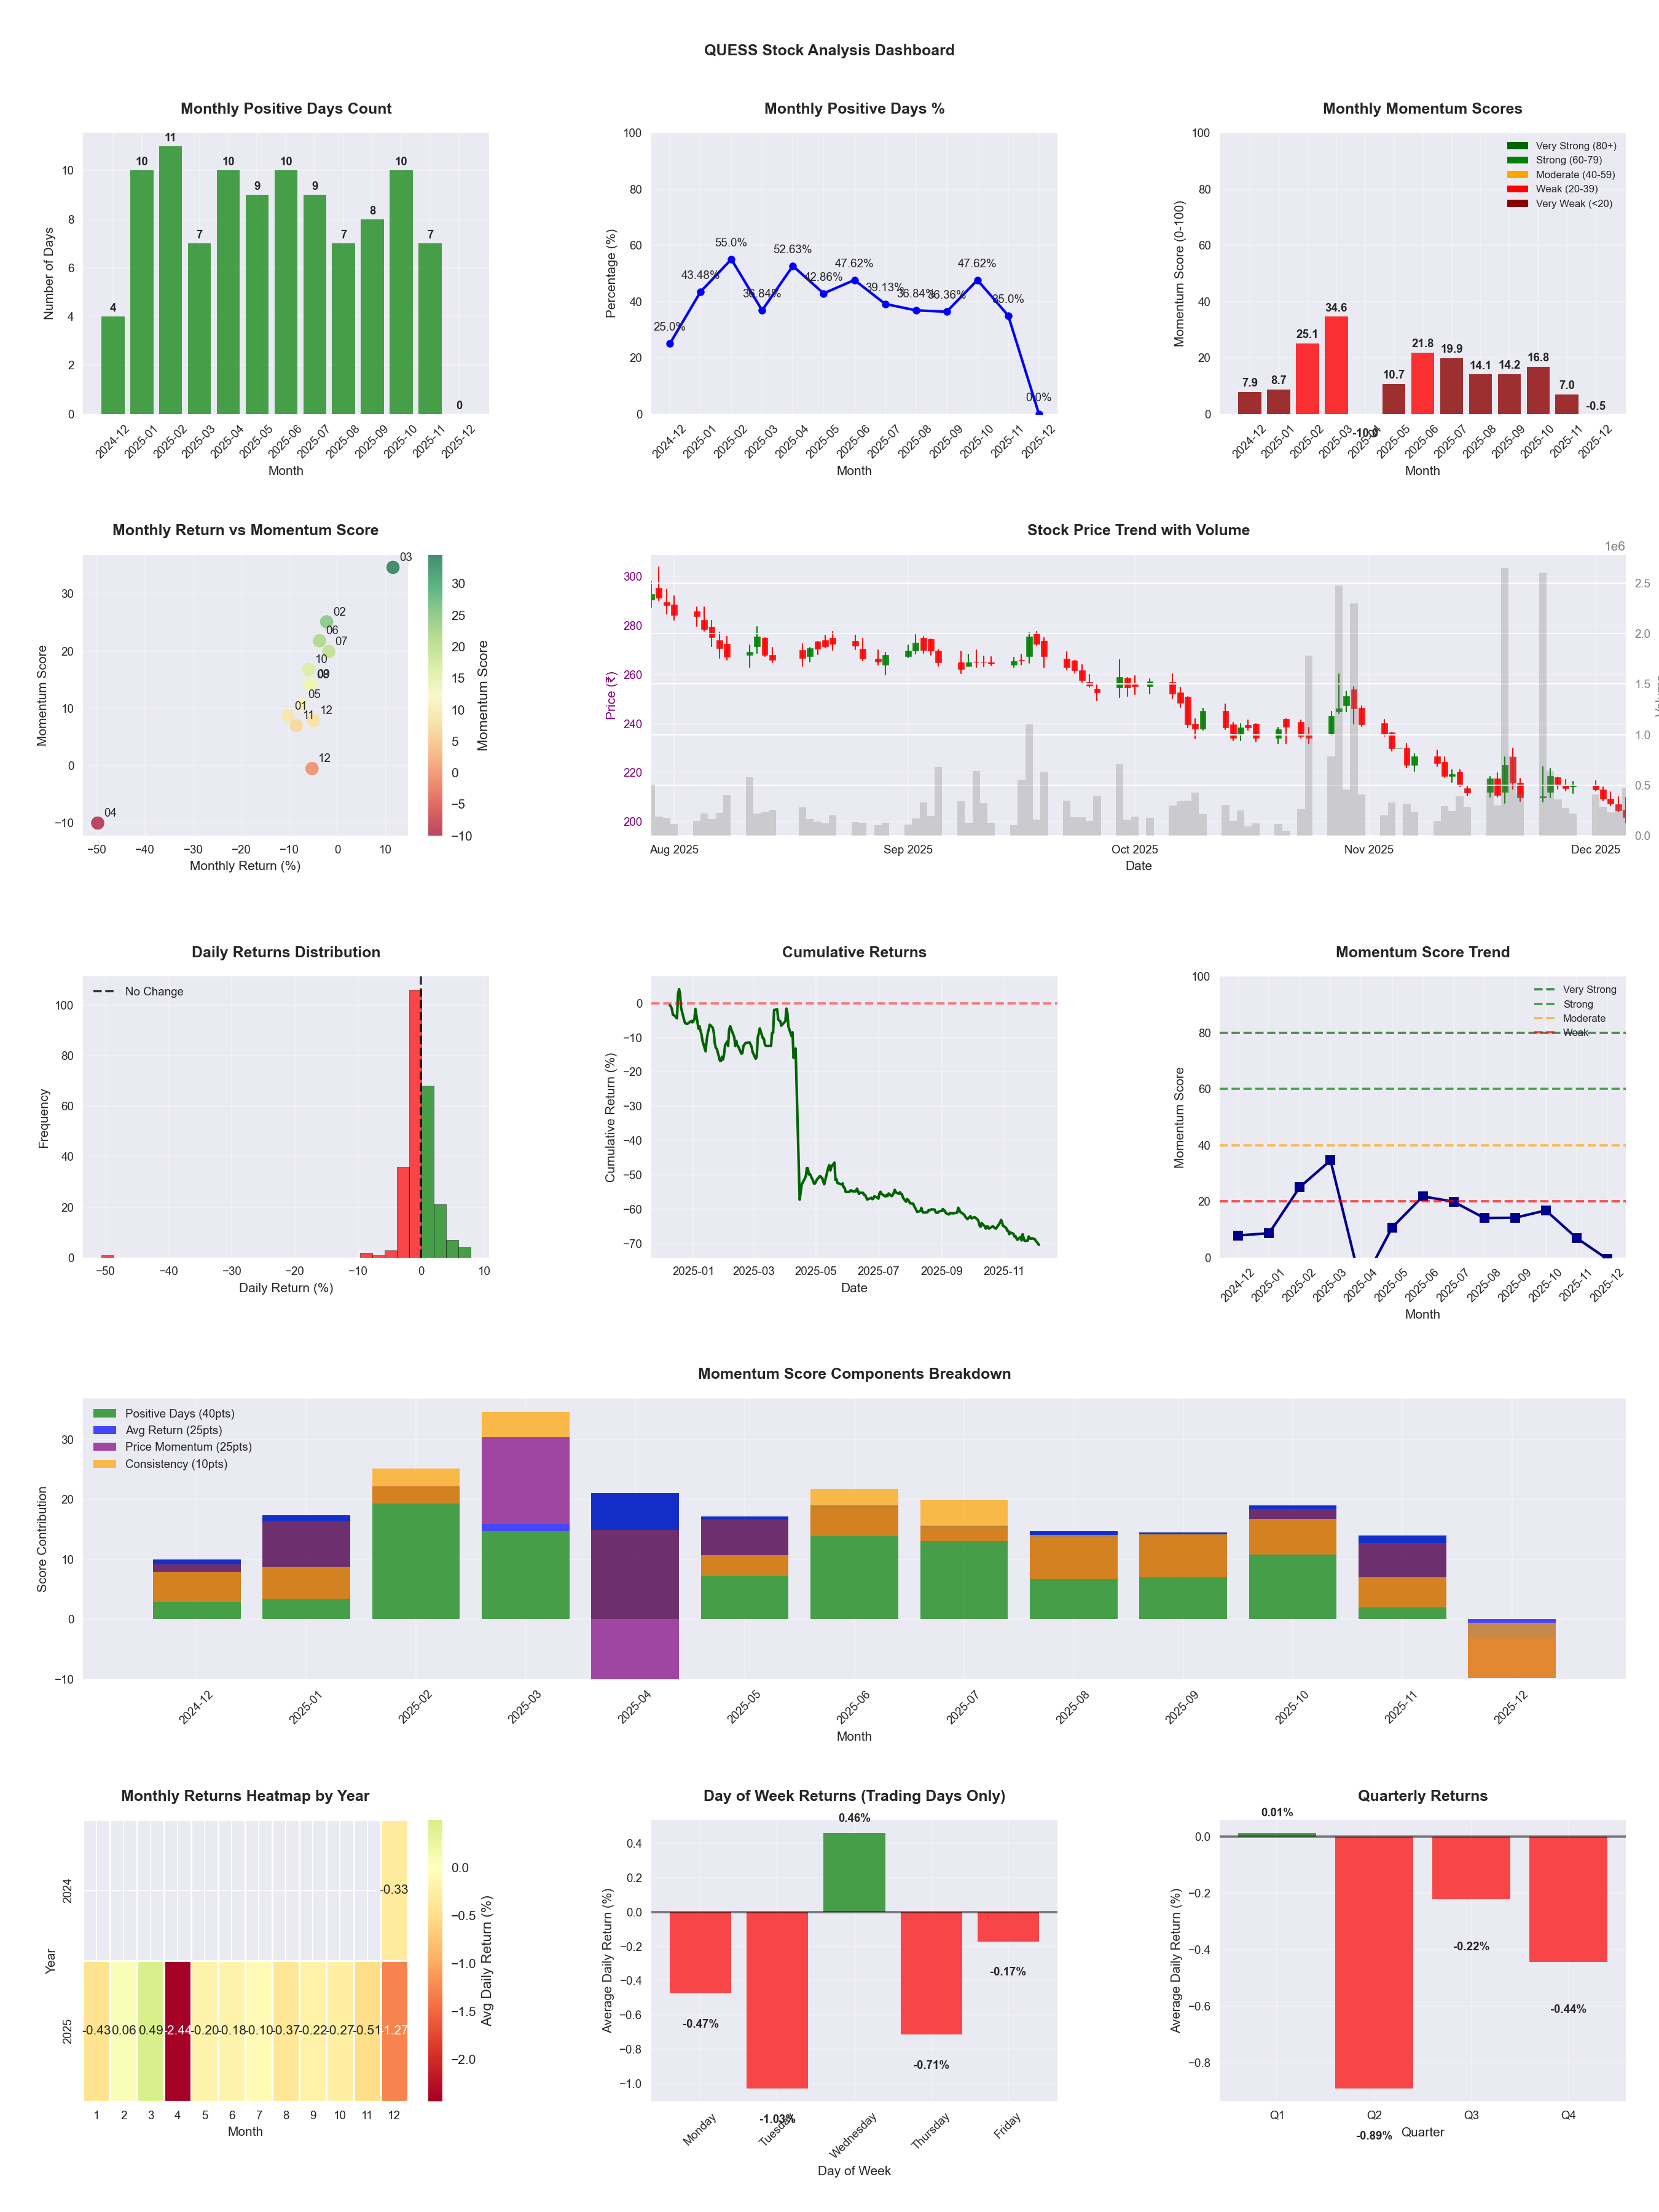
📊 Key Insights & Metrics
Symbol
📈 QUESS
Date
📅 2026-03-21
Volatility
🔴 3.83%
Risk Profile
⚠️ suitable for aggressive investors
Win Rate
⚠️ 42.9%
Avg Daily Return
📉 -0.42%
Max Drawdown
📉 -73.28%
Best Month
🏆 2026-01
Best Months to Trade
📅 Jan, Jul, Jun
Best Days to Trade
📅 Wednesday, Monday
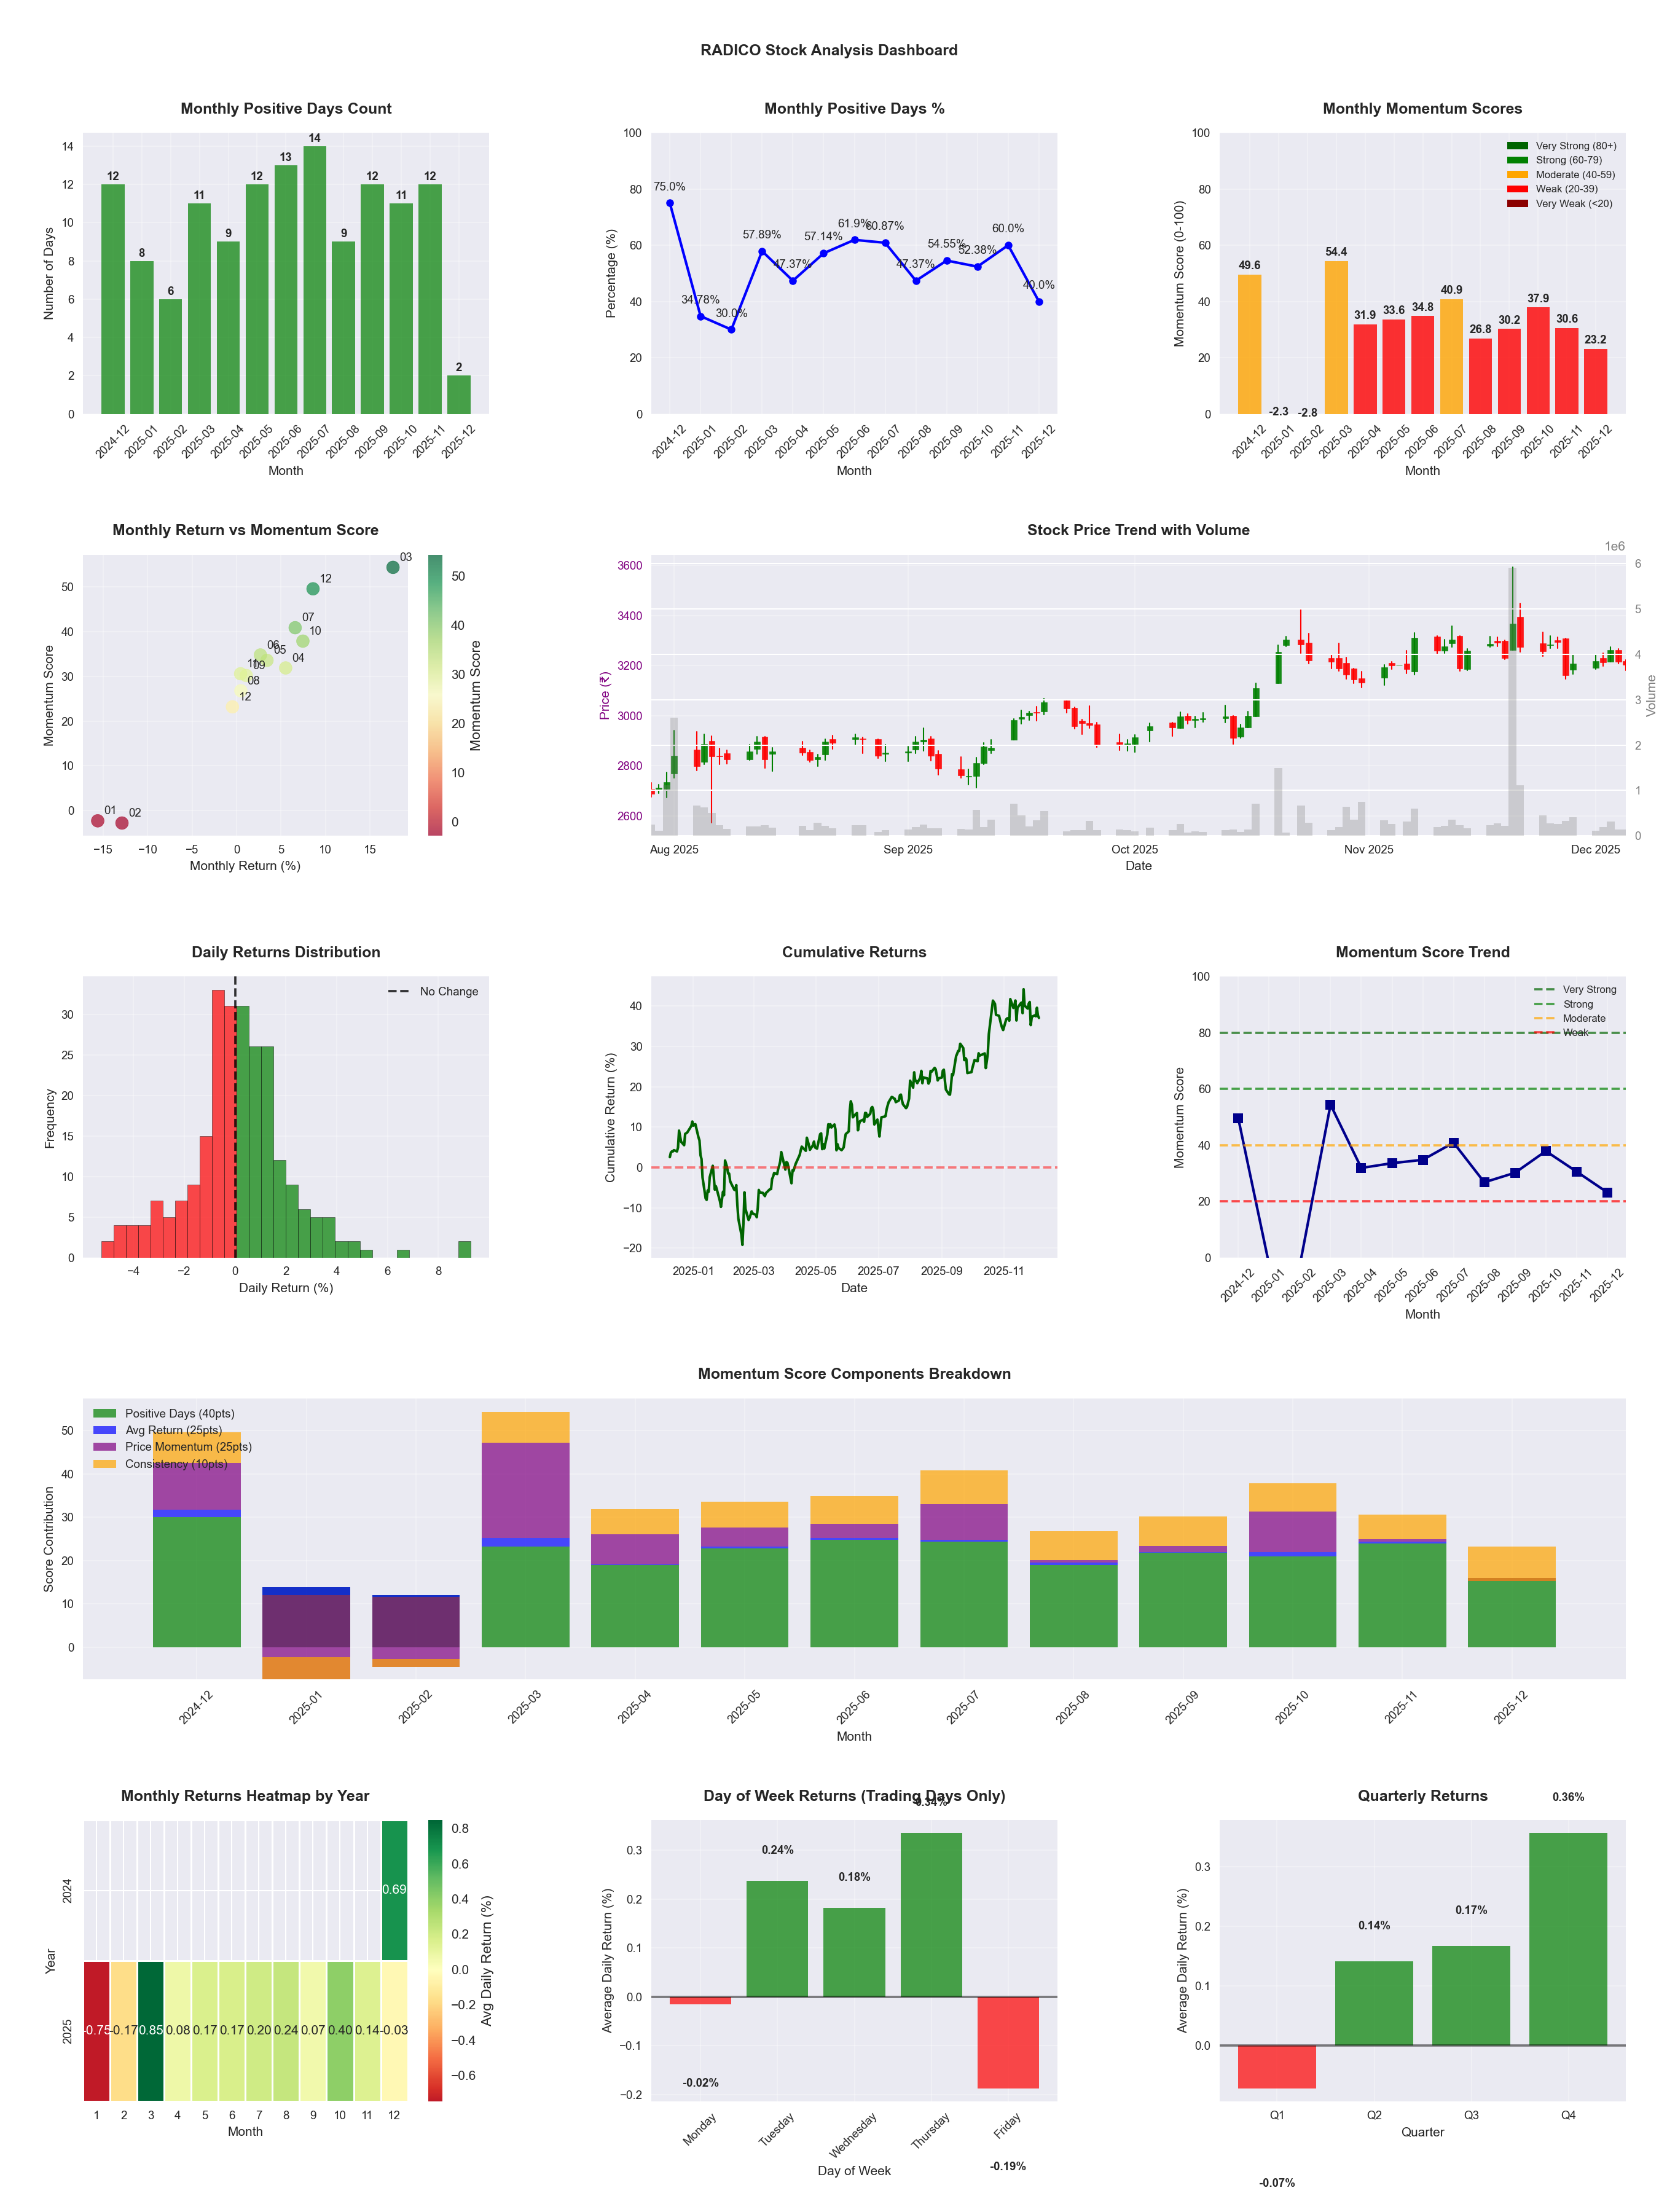
📊 Key Insights & Metrics
Symbol
📈 RADICO
Date
📅 2026-04-11
Volatility
🟡 2.03%
Risk Profile
⚠️ suitable for aggressive investors
Win Rate
⚠️ 52.6%
Avg Daily Return
📈 +0.09%
Max Drawdown
📉 -24.73%
IBD RS Score
📊 60.4
Average
Market Rank
#195
Best Month
🏆 2025-07
Best Months to Trade
📅 Apr, Oct, Aug
Best Days to Trade
📅 Tuesday, Monday
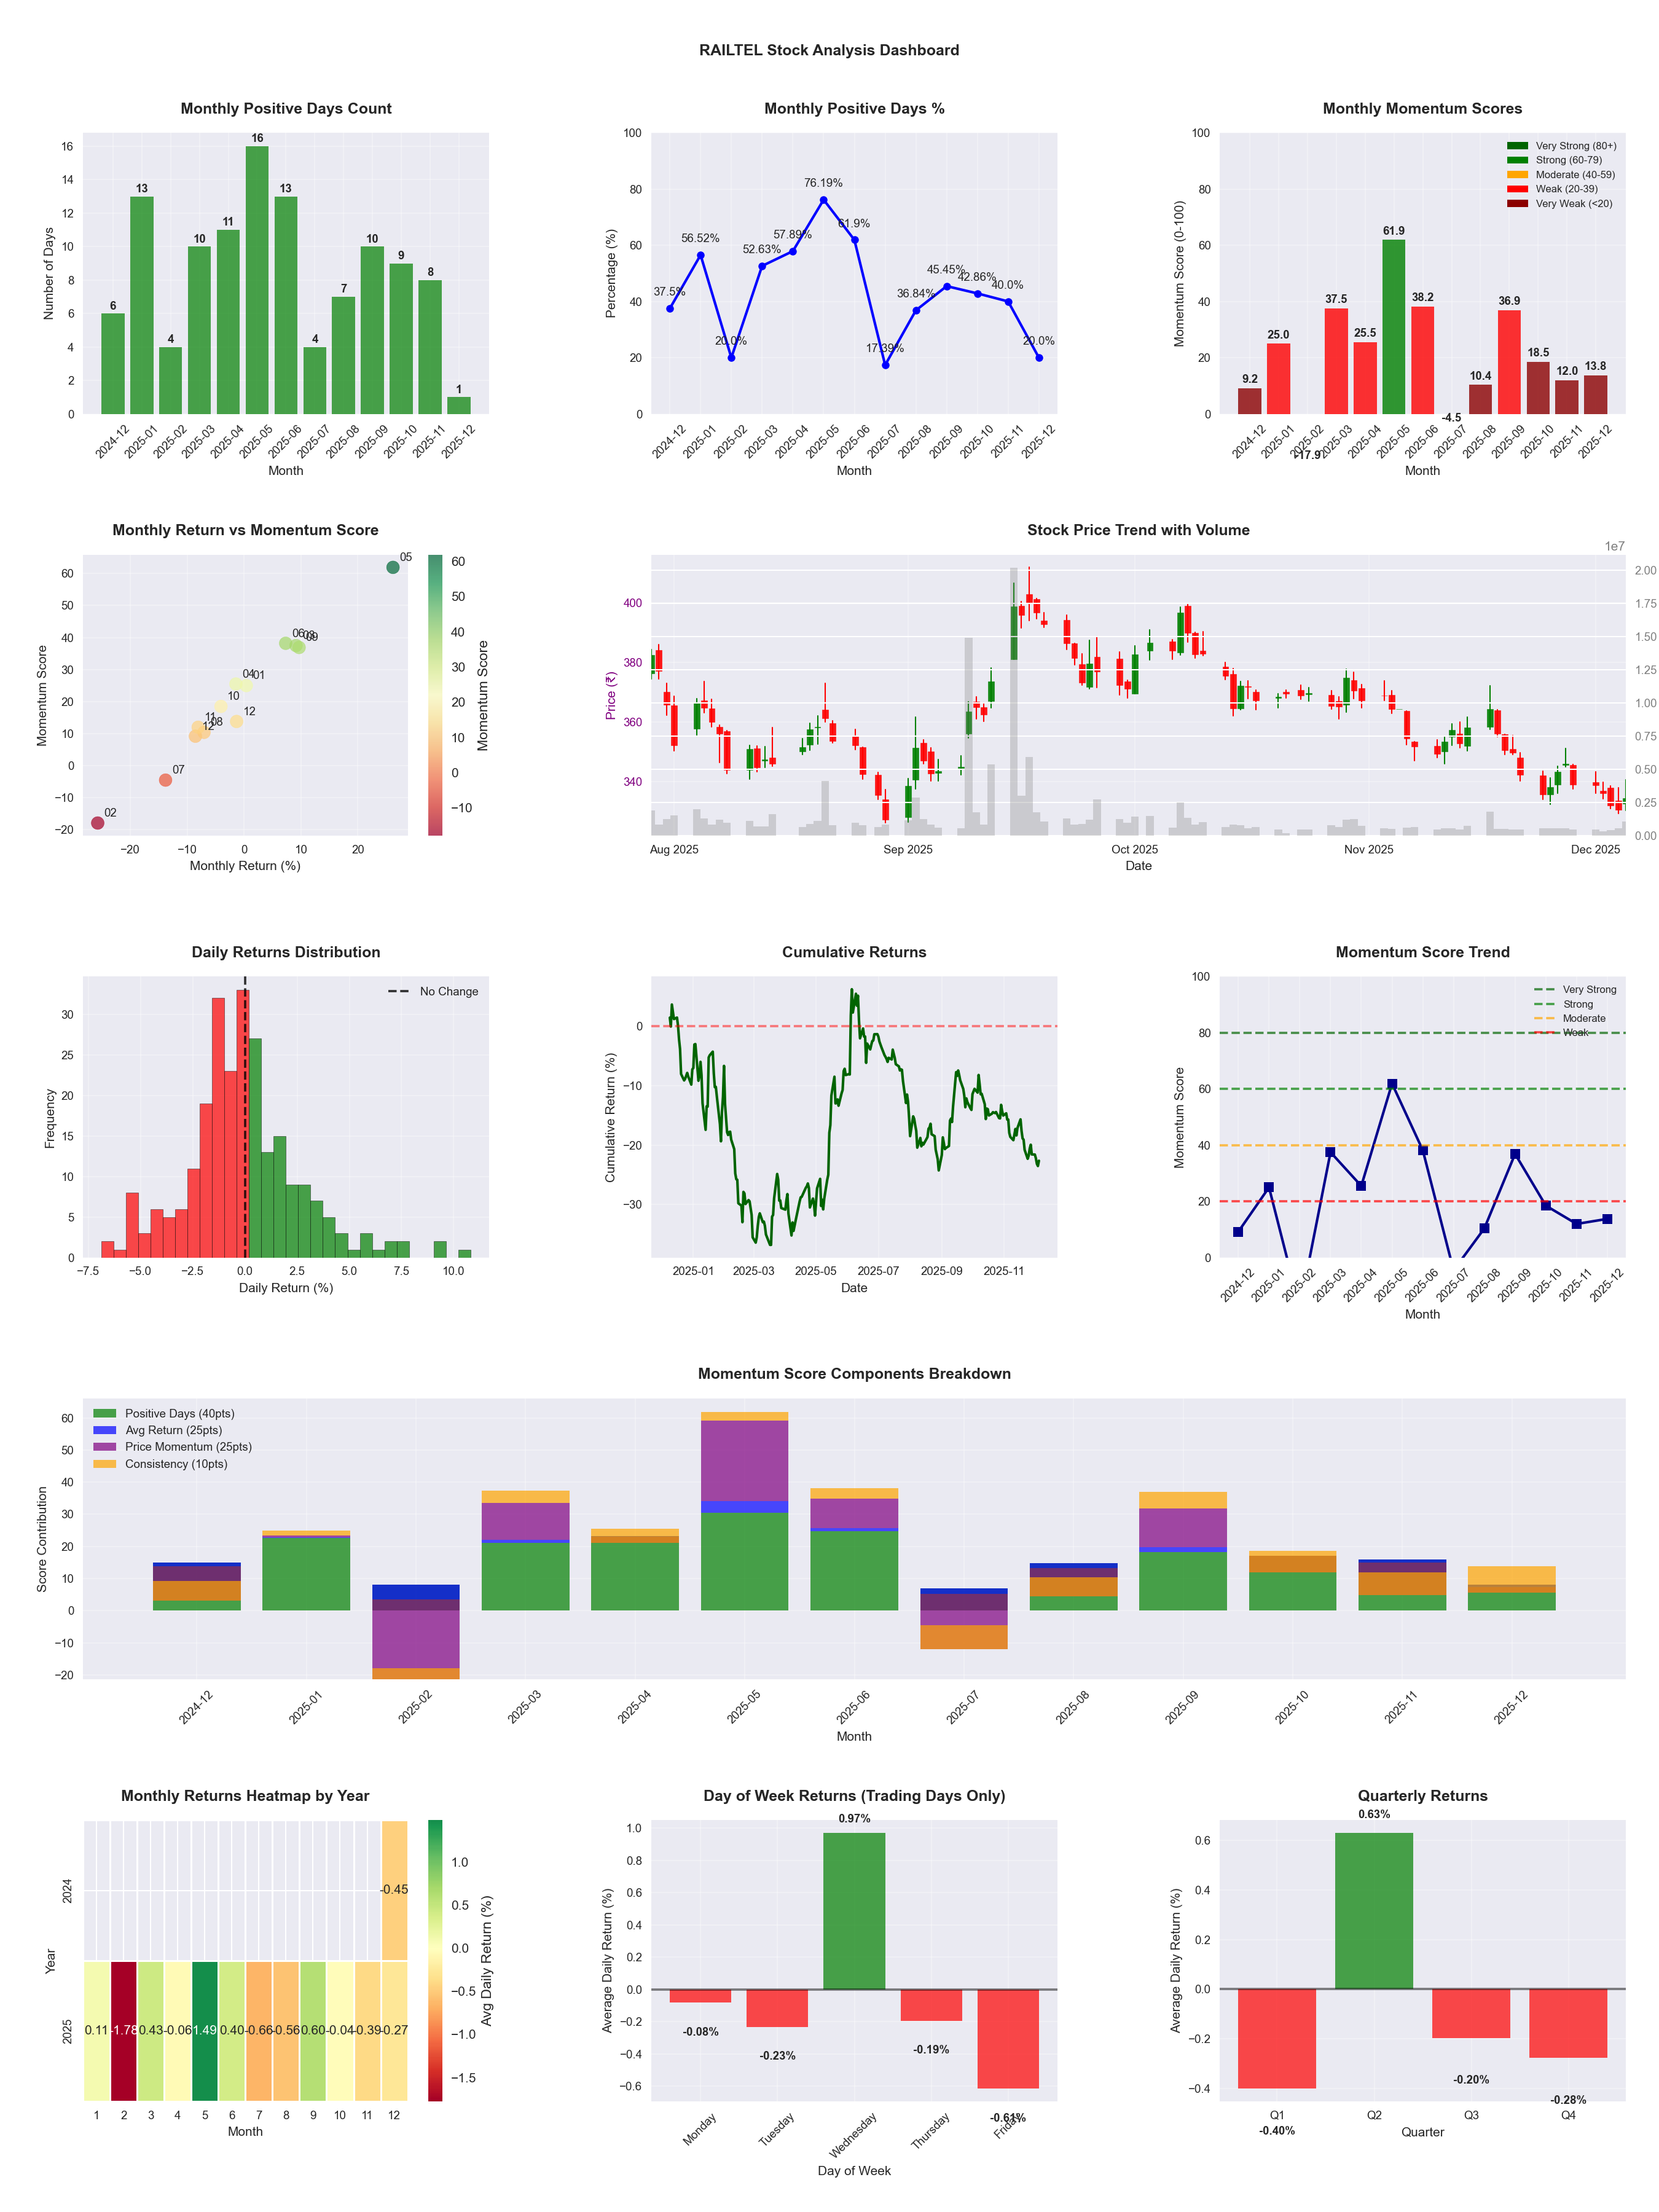
📊 Key Insights & Metrics
Symbol
📈 RAILTEL
Date
📅 2026-04-11
Volatility
🟡 2.59%
Risk Profile
⚠️ suitable for aggressive investors
Win Rate
⚠️ 44.3%
Avg Daily Return
📈 +0.03%
Max Drawdown
📉 -46.17%
IBD RS Score
📊 17.2
Weak
Market Rank
#408
Best Month
🏆 2025-05
Best Months to Trade
📅 May, Apr, Sep
Best Days to Trade
📅 Wednesday, Tuesday
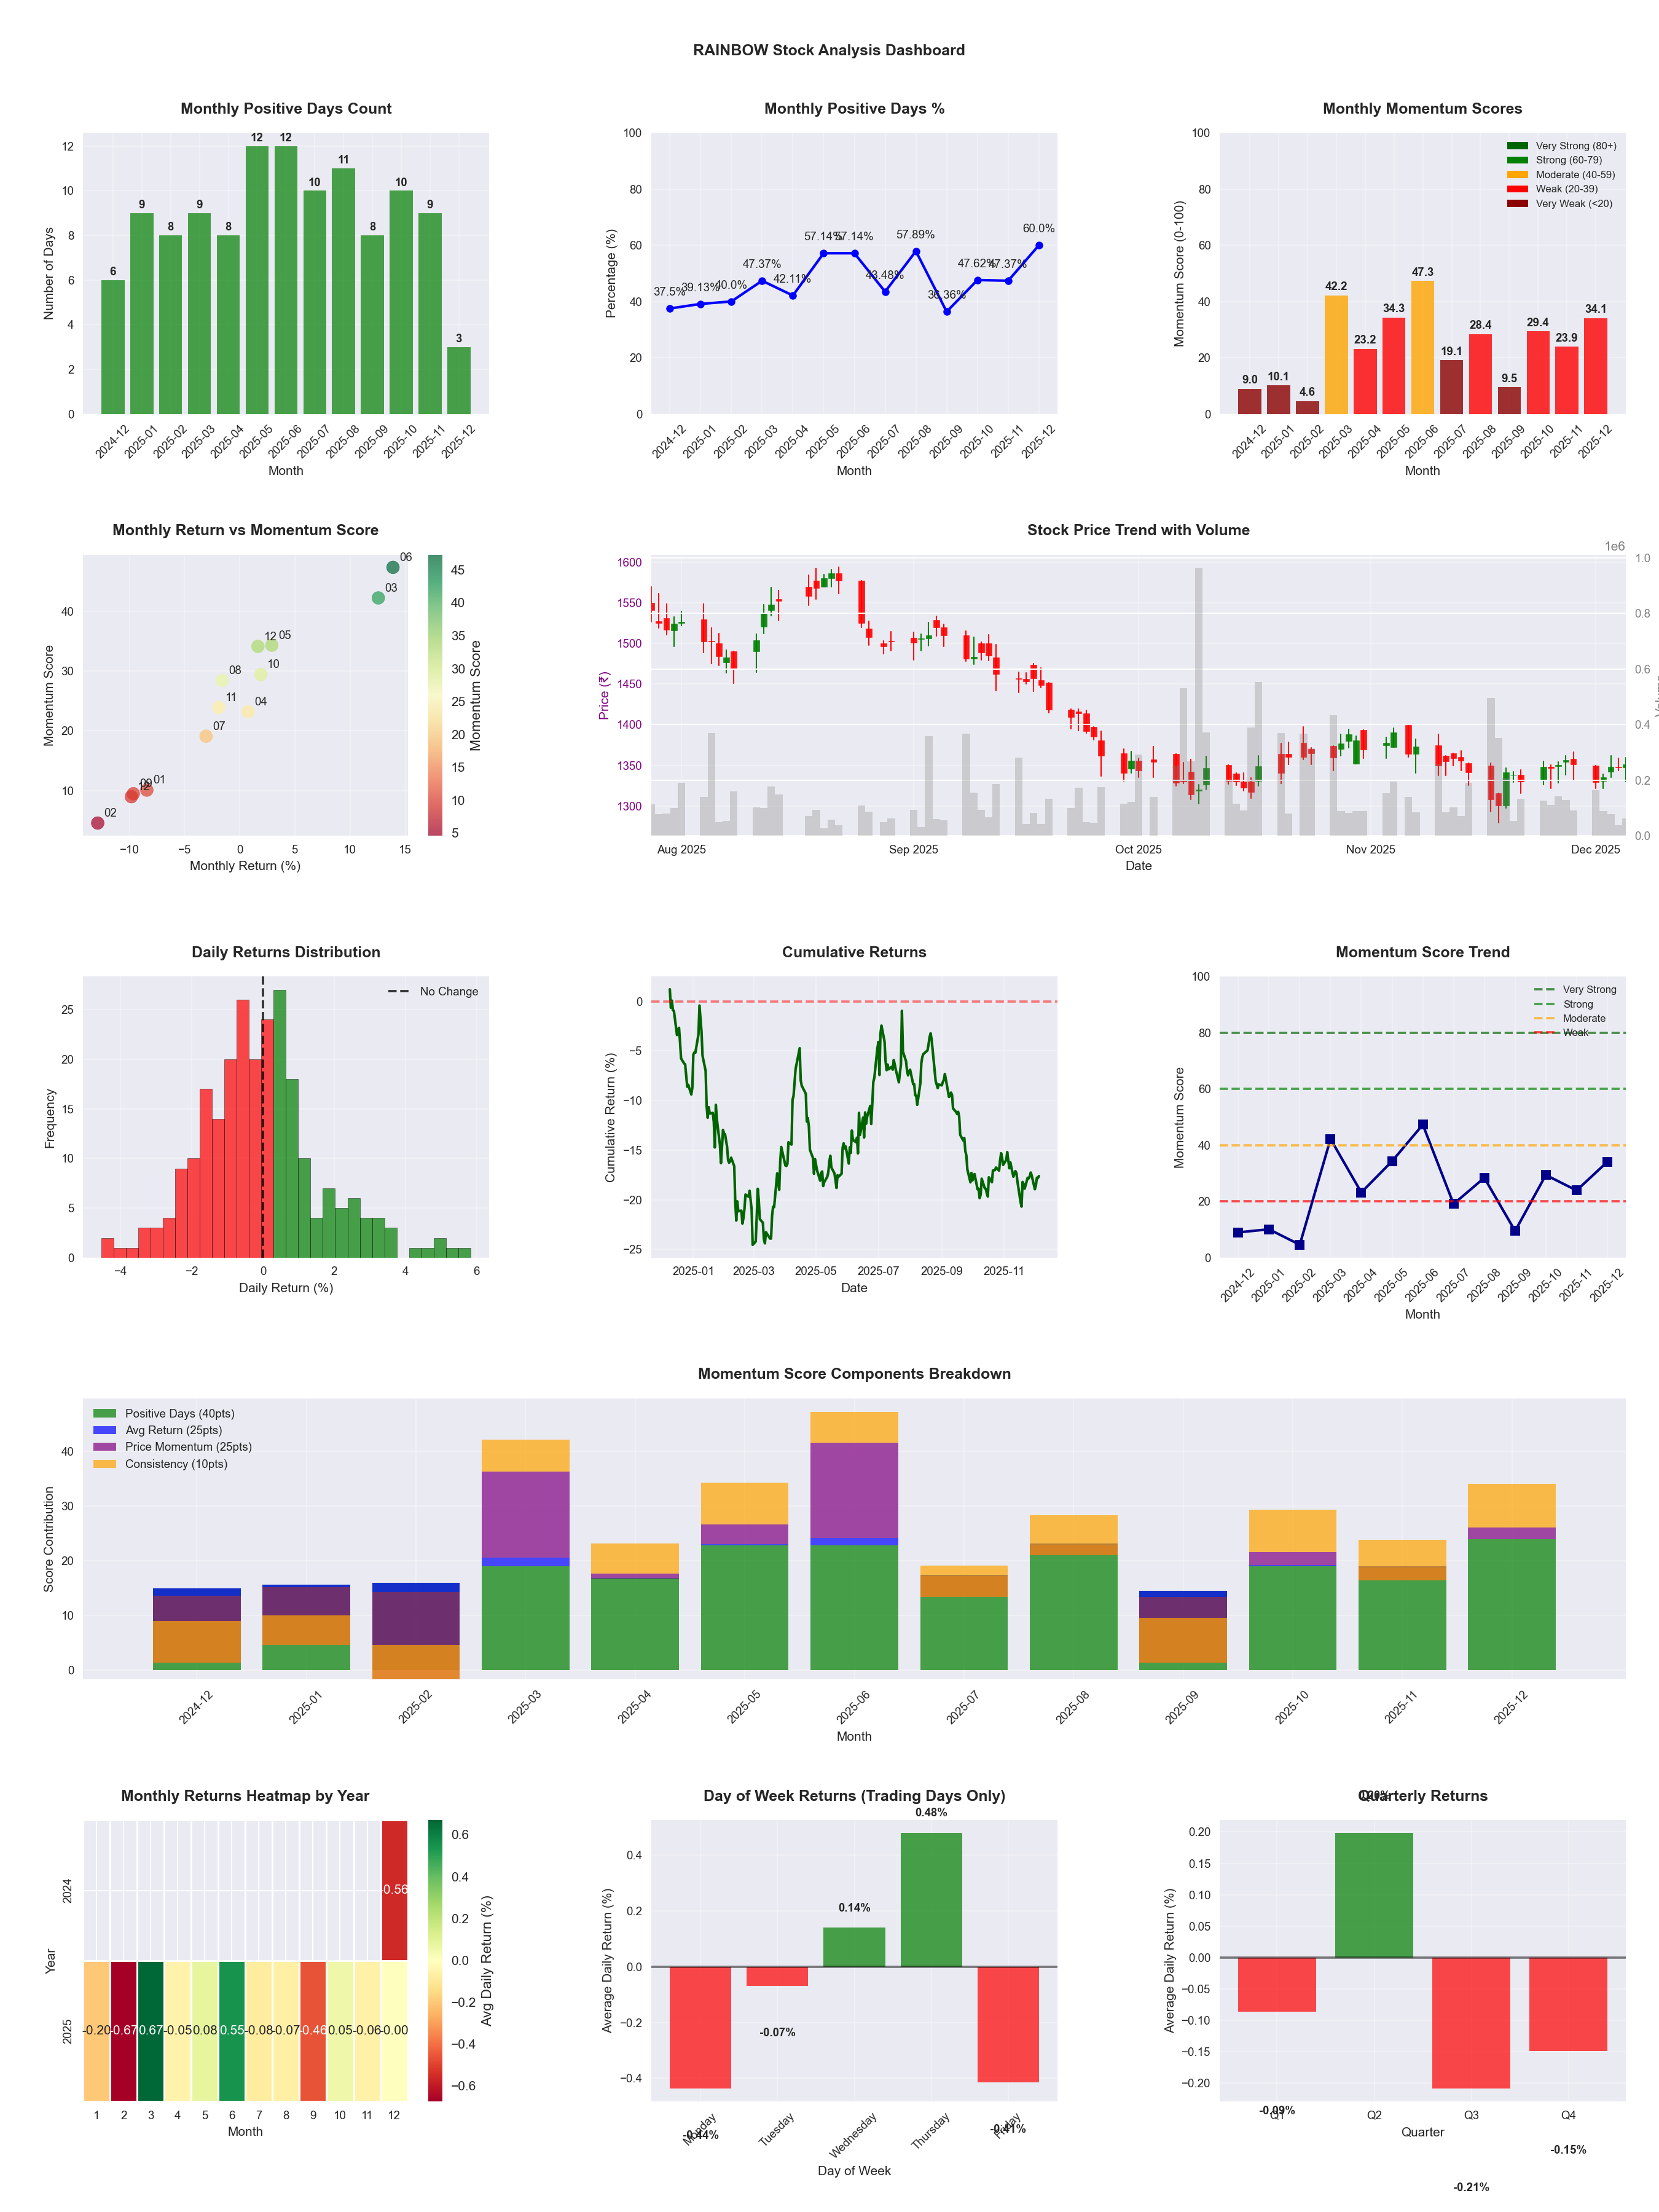
📊 Key Insights & Metrics
Symbol
📈 RAINBOW
Date
📅 2026-04-11
Volatility
🟡 1.59%
Win Rate
⚠️ 45.7%
Avg Daily Return
📉 -0.07%
Max Drawdown
📉 -32.03%
IBD RS Score
📊 39.8
Weak
Market Rank
#297
Best Month
🏆 2025-06
Best Months to Trade
📅 Jun, Feb, May
Best Days to Trade
📅 Wednesday, Tuesday
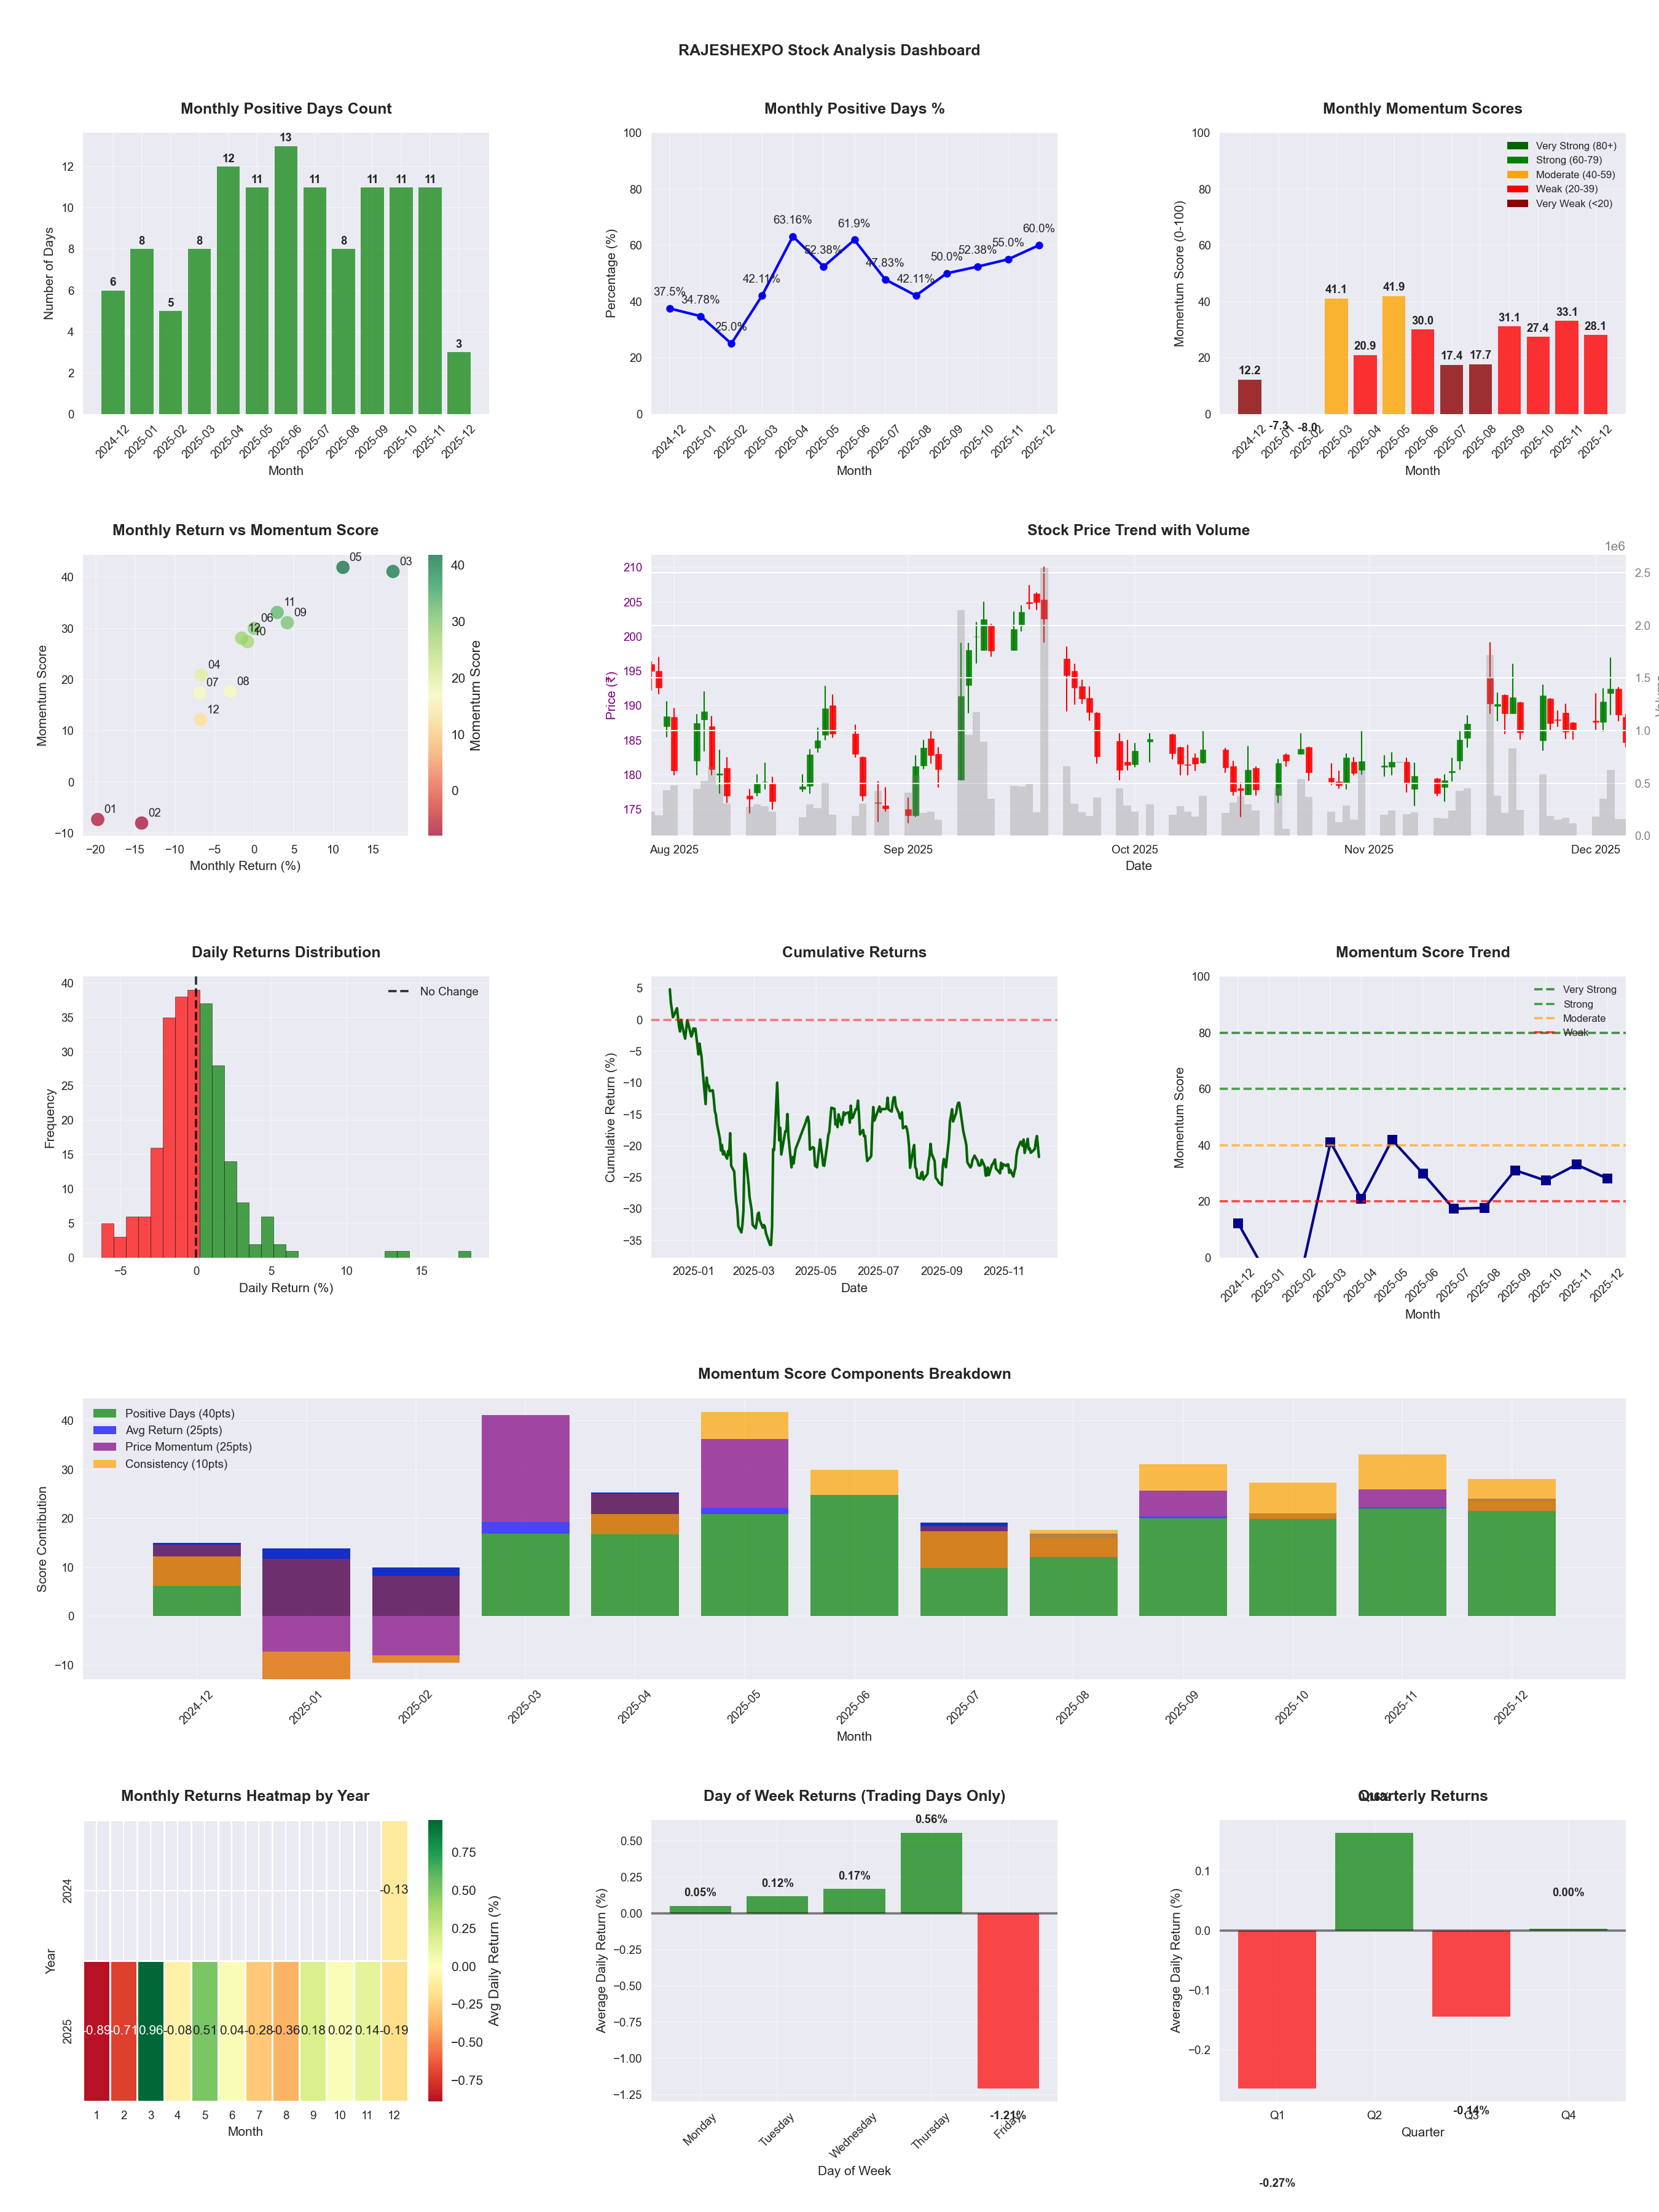
📊 Key Insights & Metrics
Symbol
📈 RAJESHEXPO
Date
📅 2026-03-21
Volatility
🟡 2.76%
Risk Profile
⚠️ suitable for aggressive investors
Win Rate
⚠️ 47.4%
Avg Daily Return
📉 -0.24%
Max Drawdown
📉 -59.24%
Best Month
🏆 2025-05
Best Months to Trade
📅 May, Sep, Nov
Best Days to Trade
📅 Monday, Wednesday
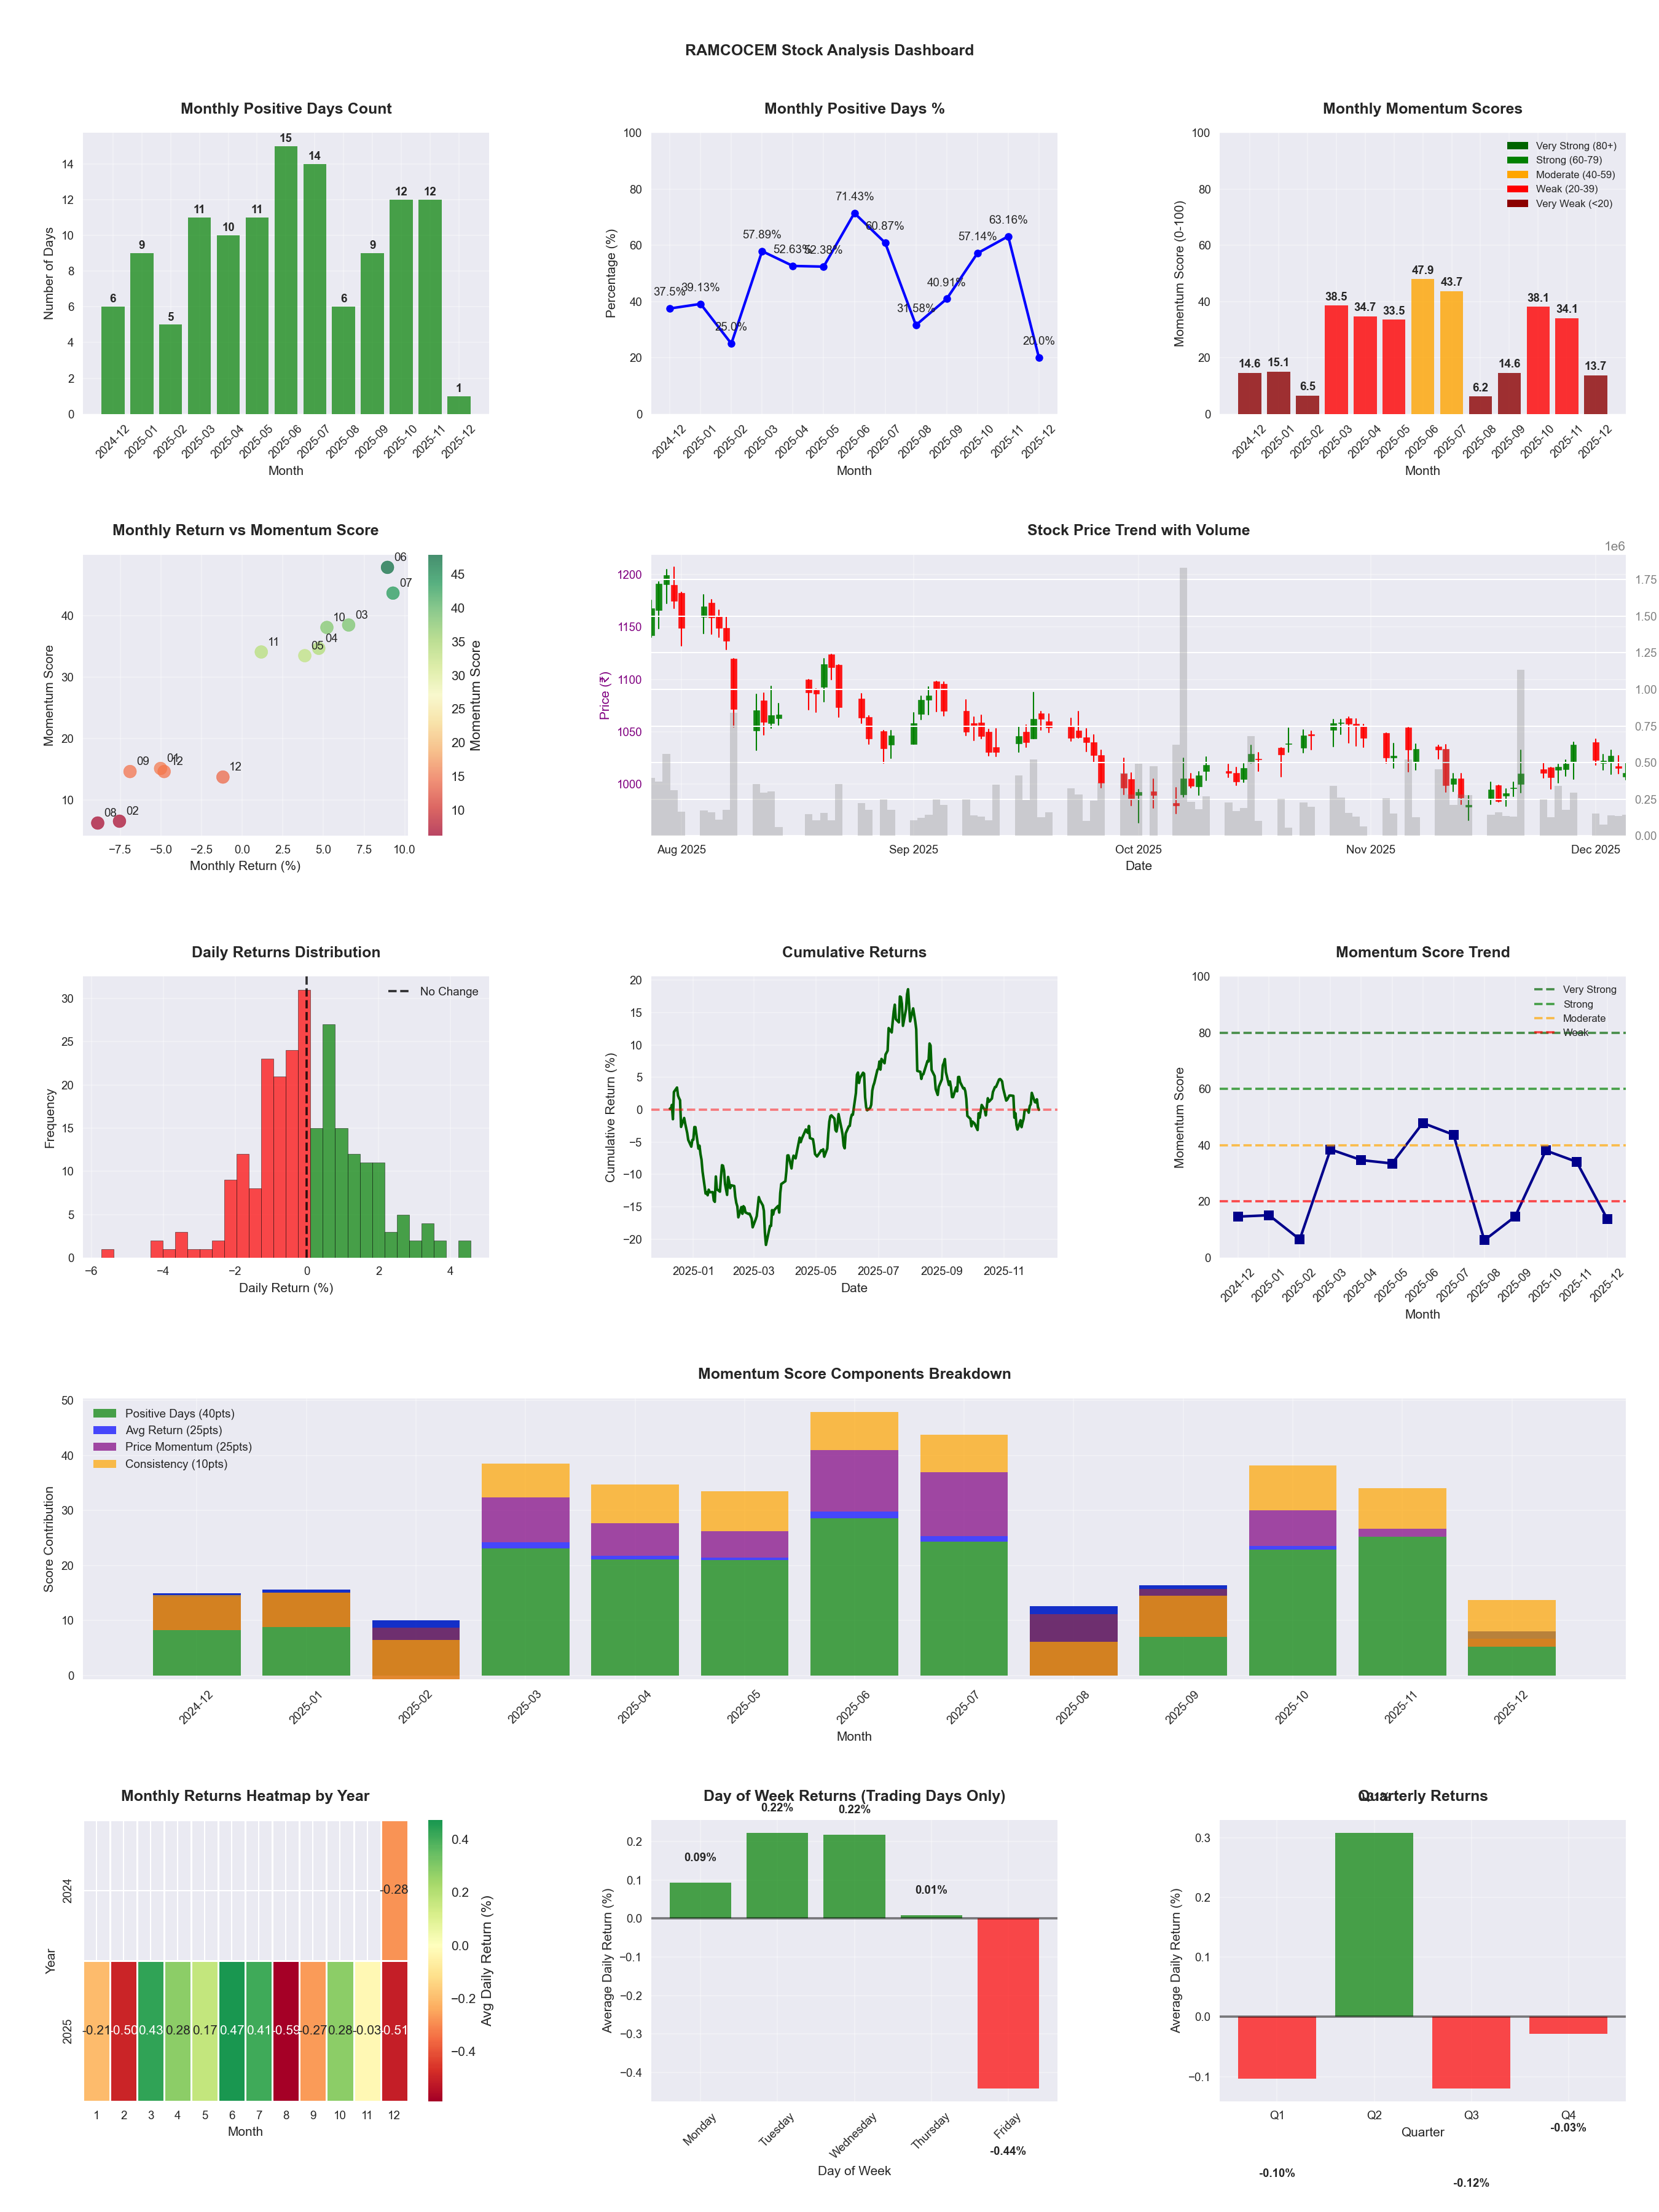
📊 Key Insights & Metrics
Symbol
📈 RAMCOCEM
Date
📅 2026-04-11
Volatility
🟡 1.61%
Win Rate
⚠️ 51.8%
Avg Daily Return
📈 +0.04%
Max Drawdown
📉 -28.01%
IBD RS Score
📊 49.3
Weak
Market Rank
#250
Best Month
🏆 2025-06
Best Months to Trade
📅 Jun, Apr, Jul
Best Days to Trade
📅 Wednesday, Tuesday
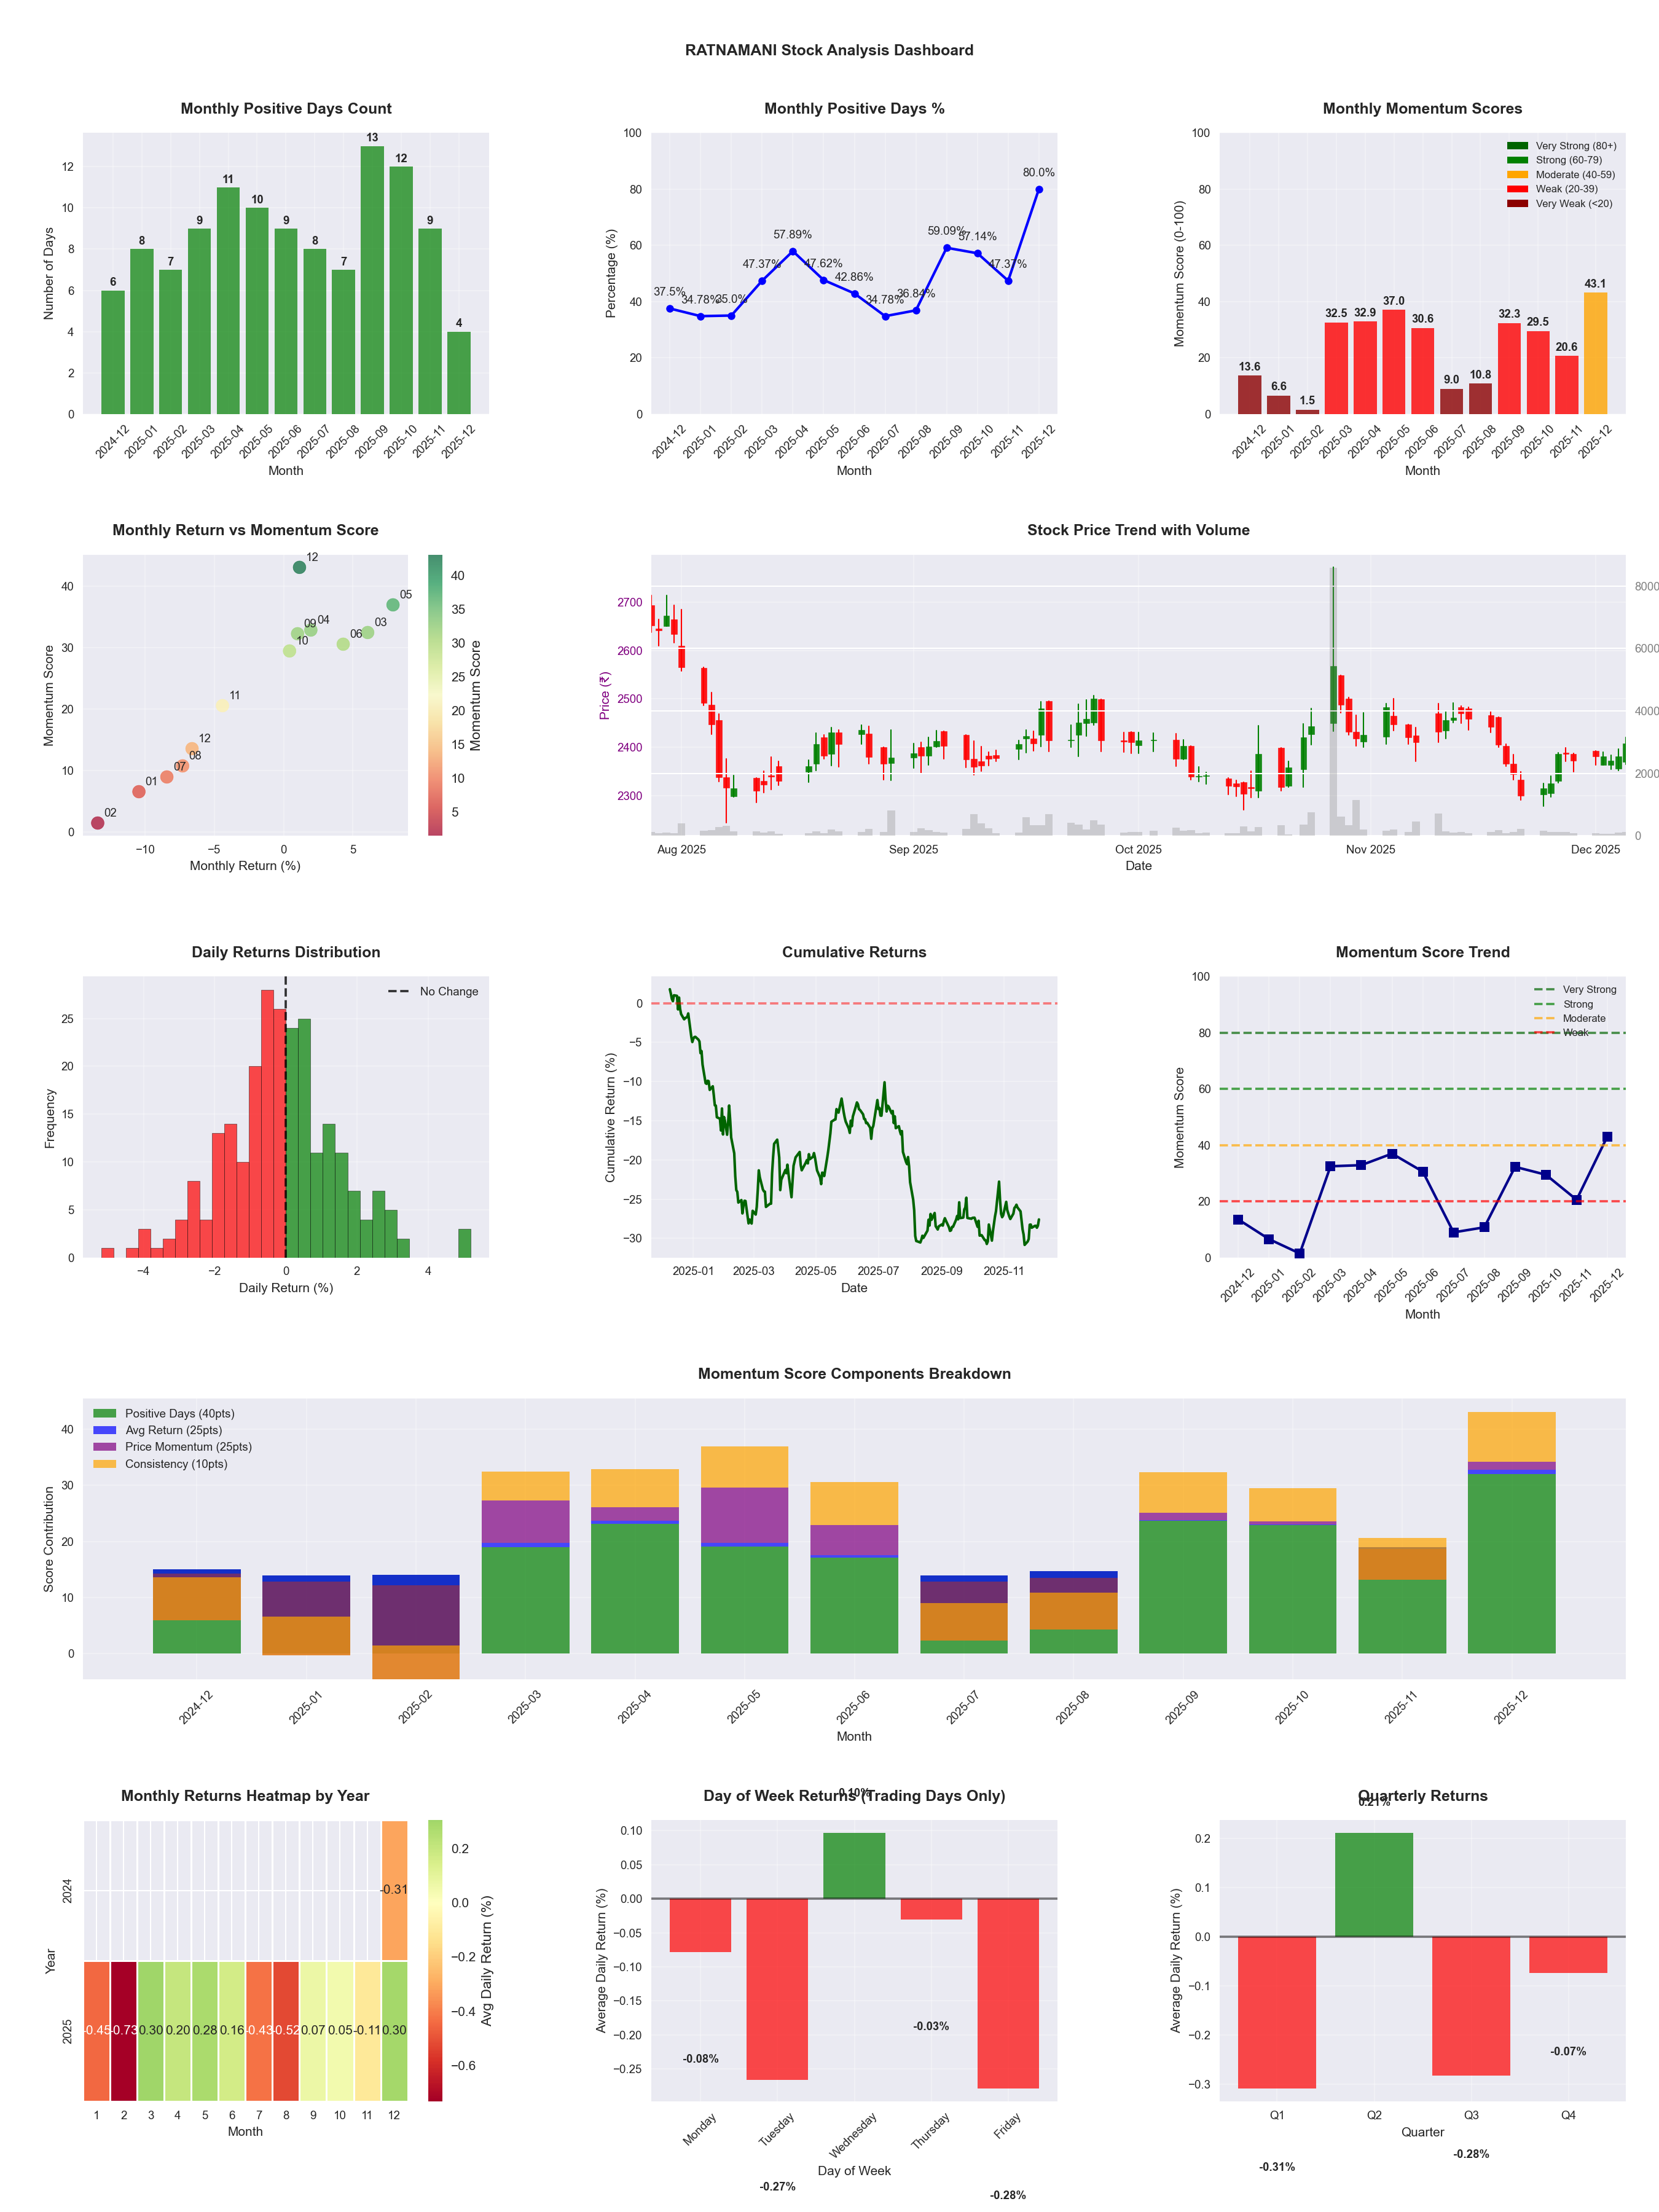
📊 Key Insights & Metrics
Symbol
📈 RATNAMANI
Date
📅 2026-03-21
Volatility
🟡 2.38%
Risk Profile
⚠️ suitable for aggressive investors
Win Rate
⚠️ 44.9%
Avg Daily Return
📉 -0.04%
Max Drawdown
📉 -34.88%
Best Month
🏆 2026-02
Worst Month
📉 2026-01
Best Months to Trade
📅 Feb, May, Apr
Best Days to Trade
📅 Thursday, Wednesday
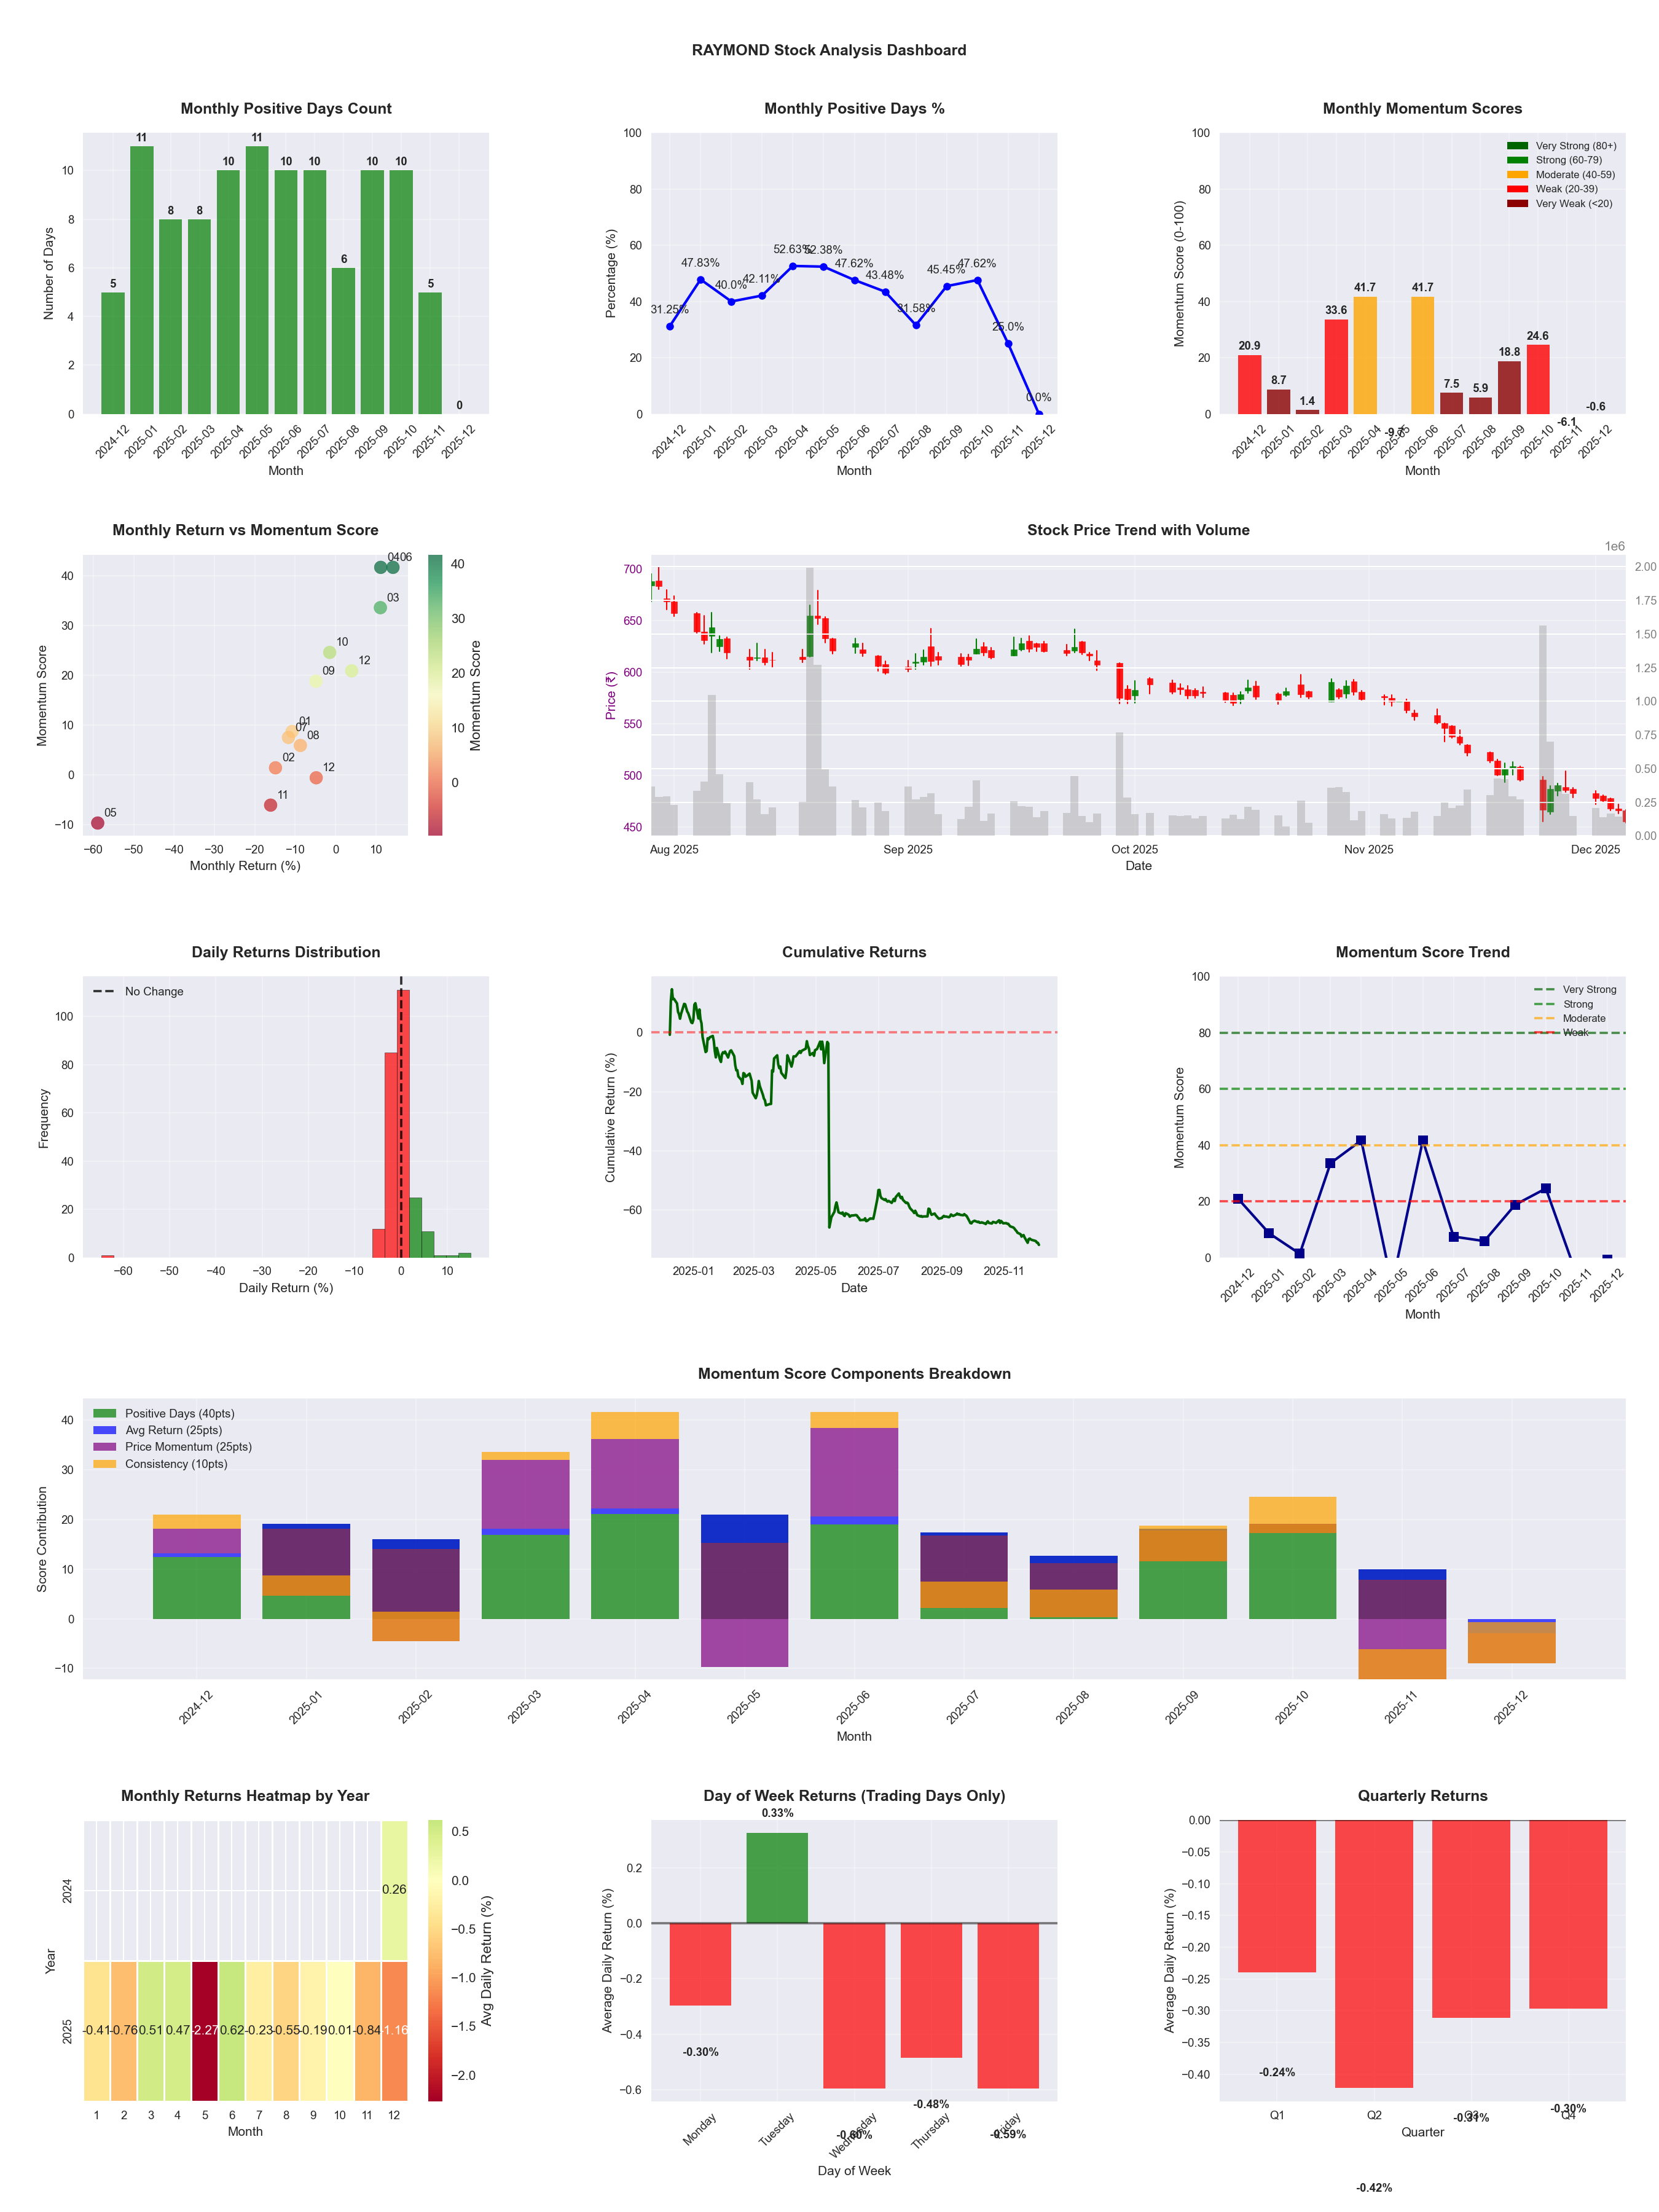
📊 Key Insights & Metrics
Symbol
📈 RAYMOND
Date
📅 2026-03-21
Volatility
🔴 4.74%
Risk Profile
⚠️ suitable for aggressive investors
Win Rate
⚠️ 41.7%
Avg Daily Return
📉 -0.37%
Max Drawdown
📉 -77.69%
Best Month
🏆 2025-04
Best Months to Trade
📅 Jun, Apr, Feb
Best Days to Trade
📅 Tuesday, Monday
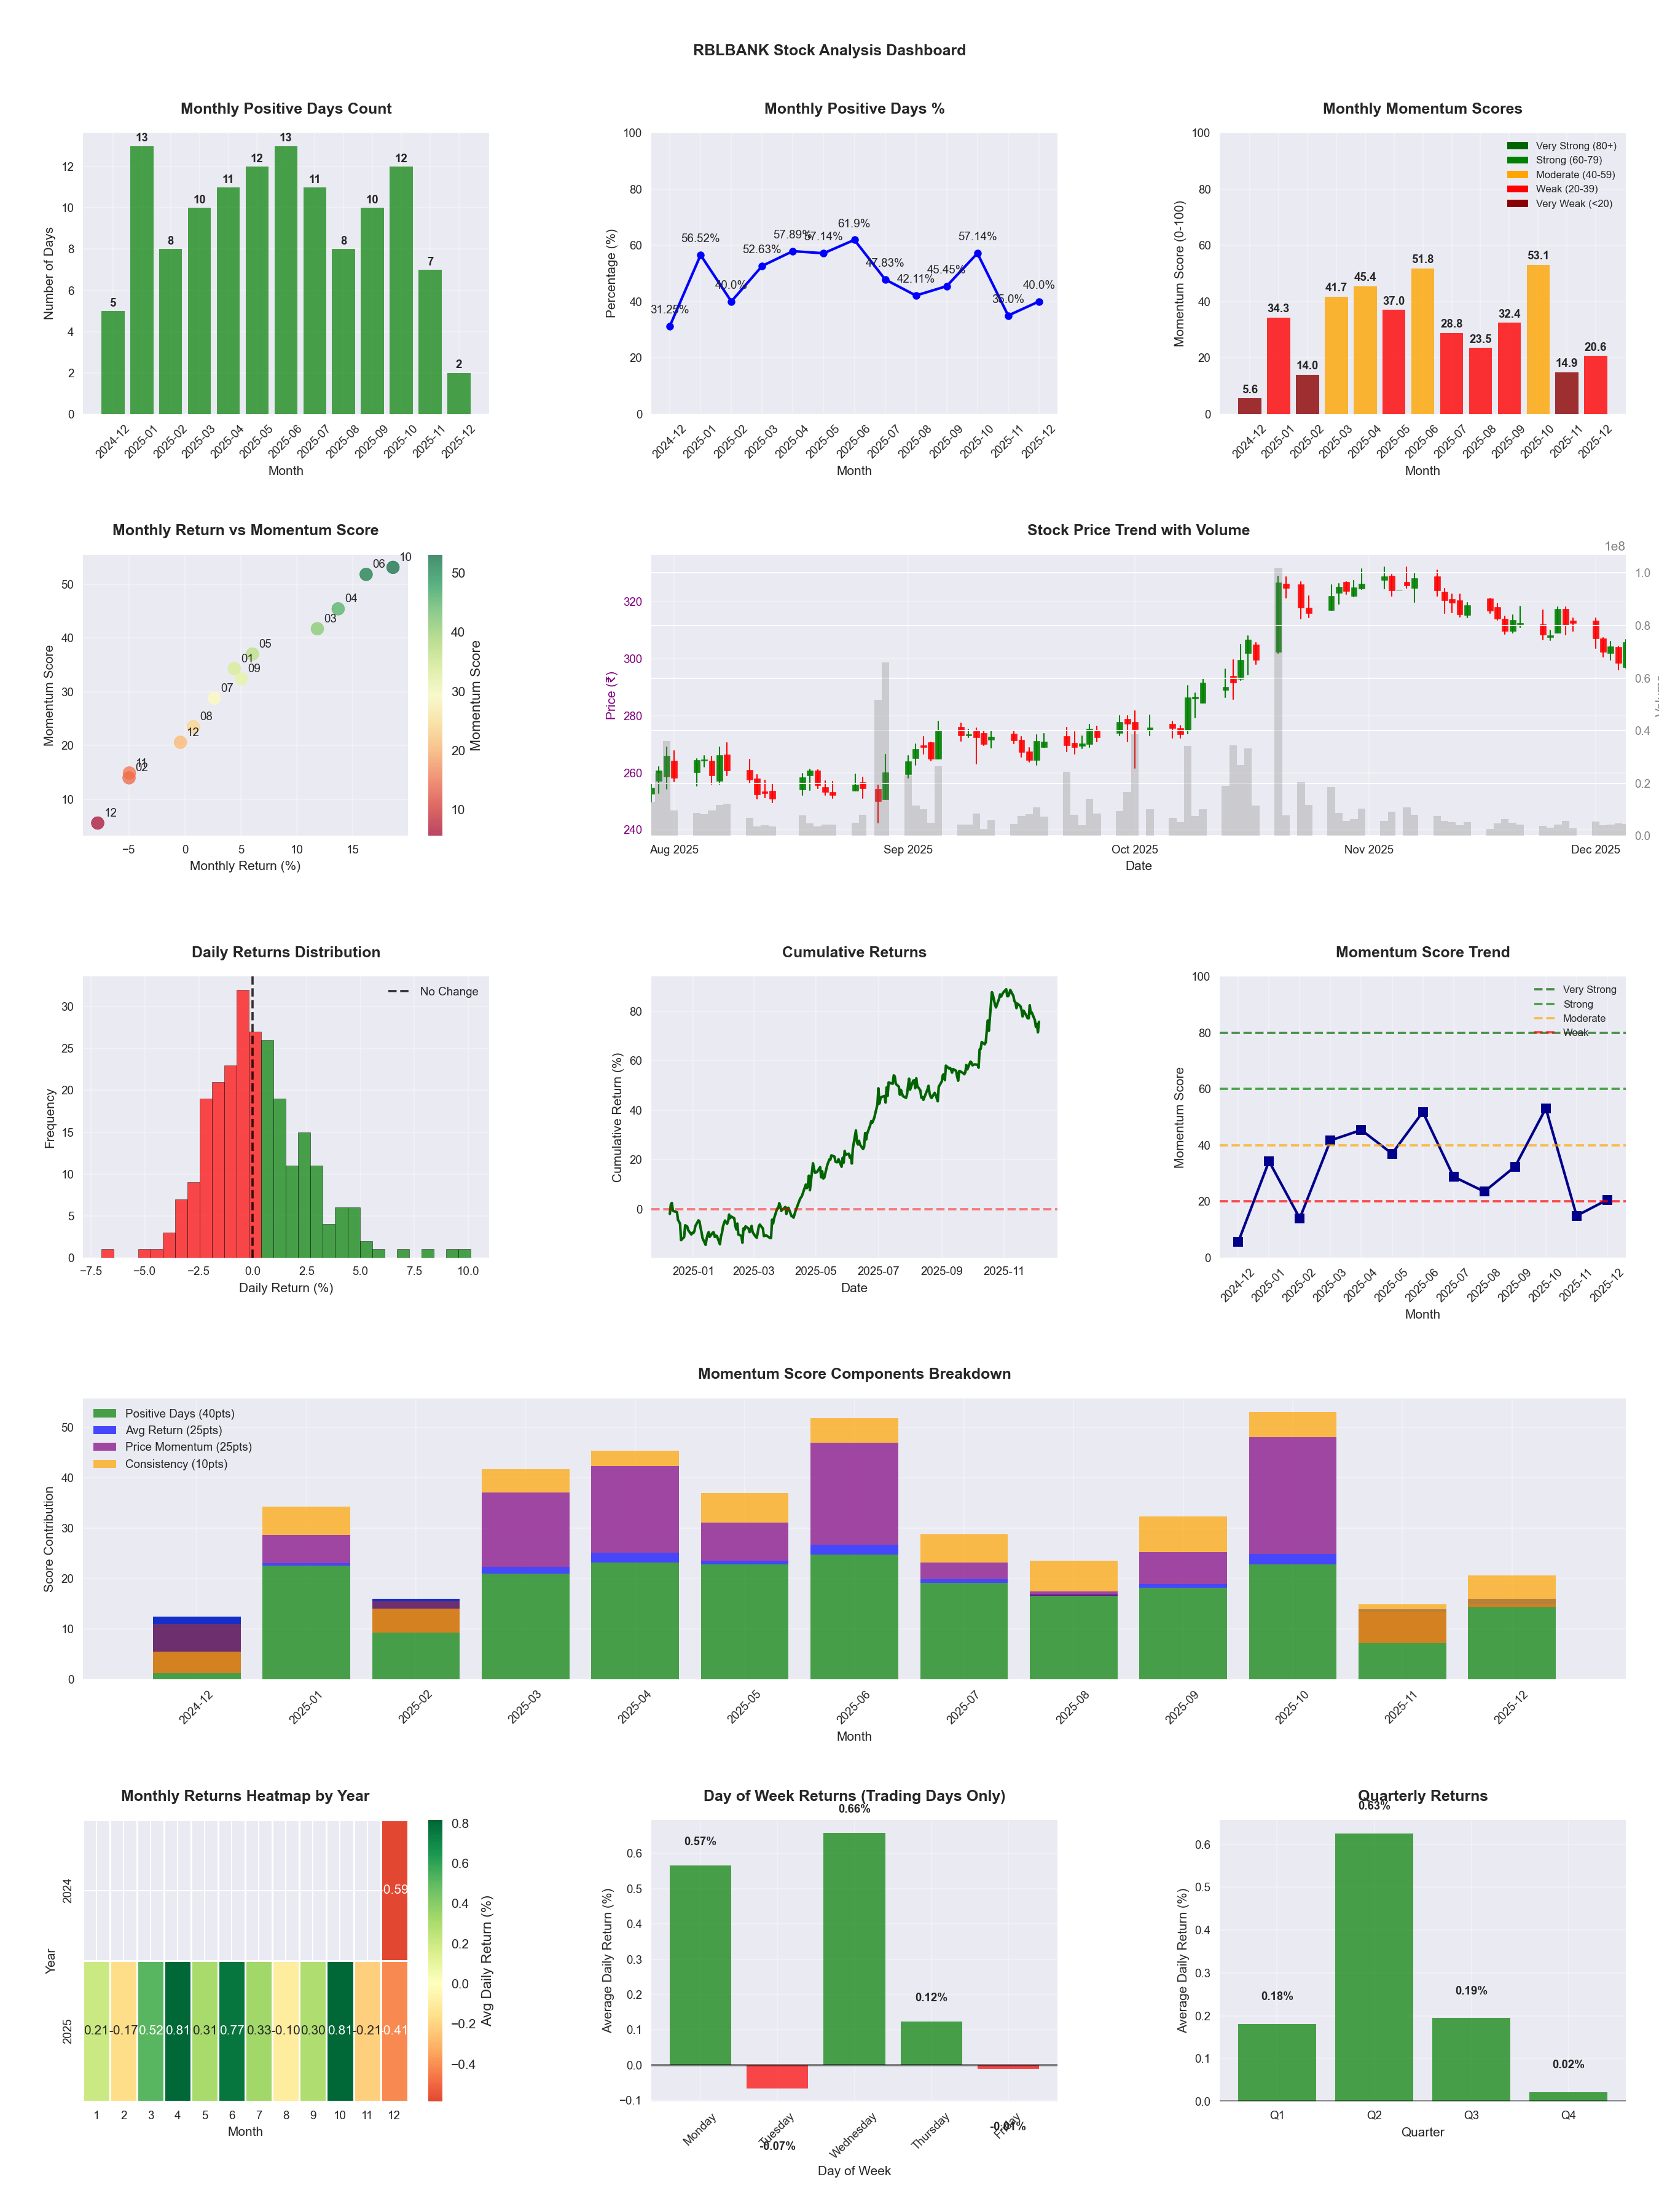
📊 Key Insights & Metrics
Symbol
📈 RBLBANK
Date
📅 2026-04-11
Volatility
🟡 2.18%
Risk Profile
⚠️ suitable for aggressive investors
Win Rate
⚠️ 50.8%
Avg Daily Return
📈 +0.28%
Max Drawdown
📉 -13.01%
IBD RS Score
📊 91.5
Leader
Market Rank
#42
Best Month
🏆 2025-10
Worst Month
📉 2026-03
Best Months to Trade
📅 Apr, Oct, Jun
Best Days to Trade
📅 Wednesday, Monday
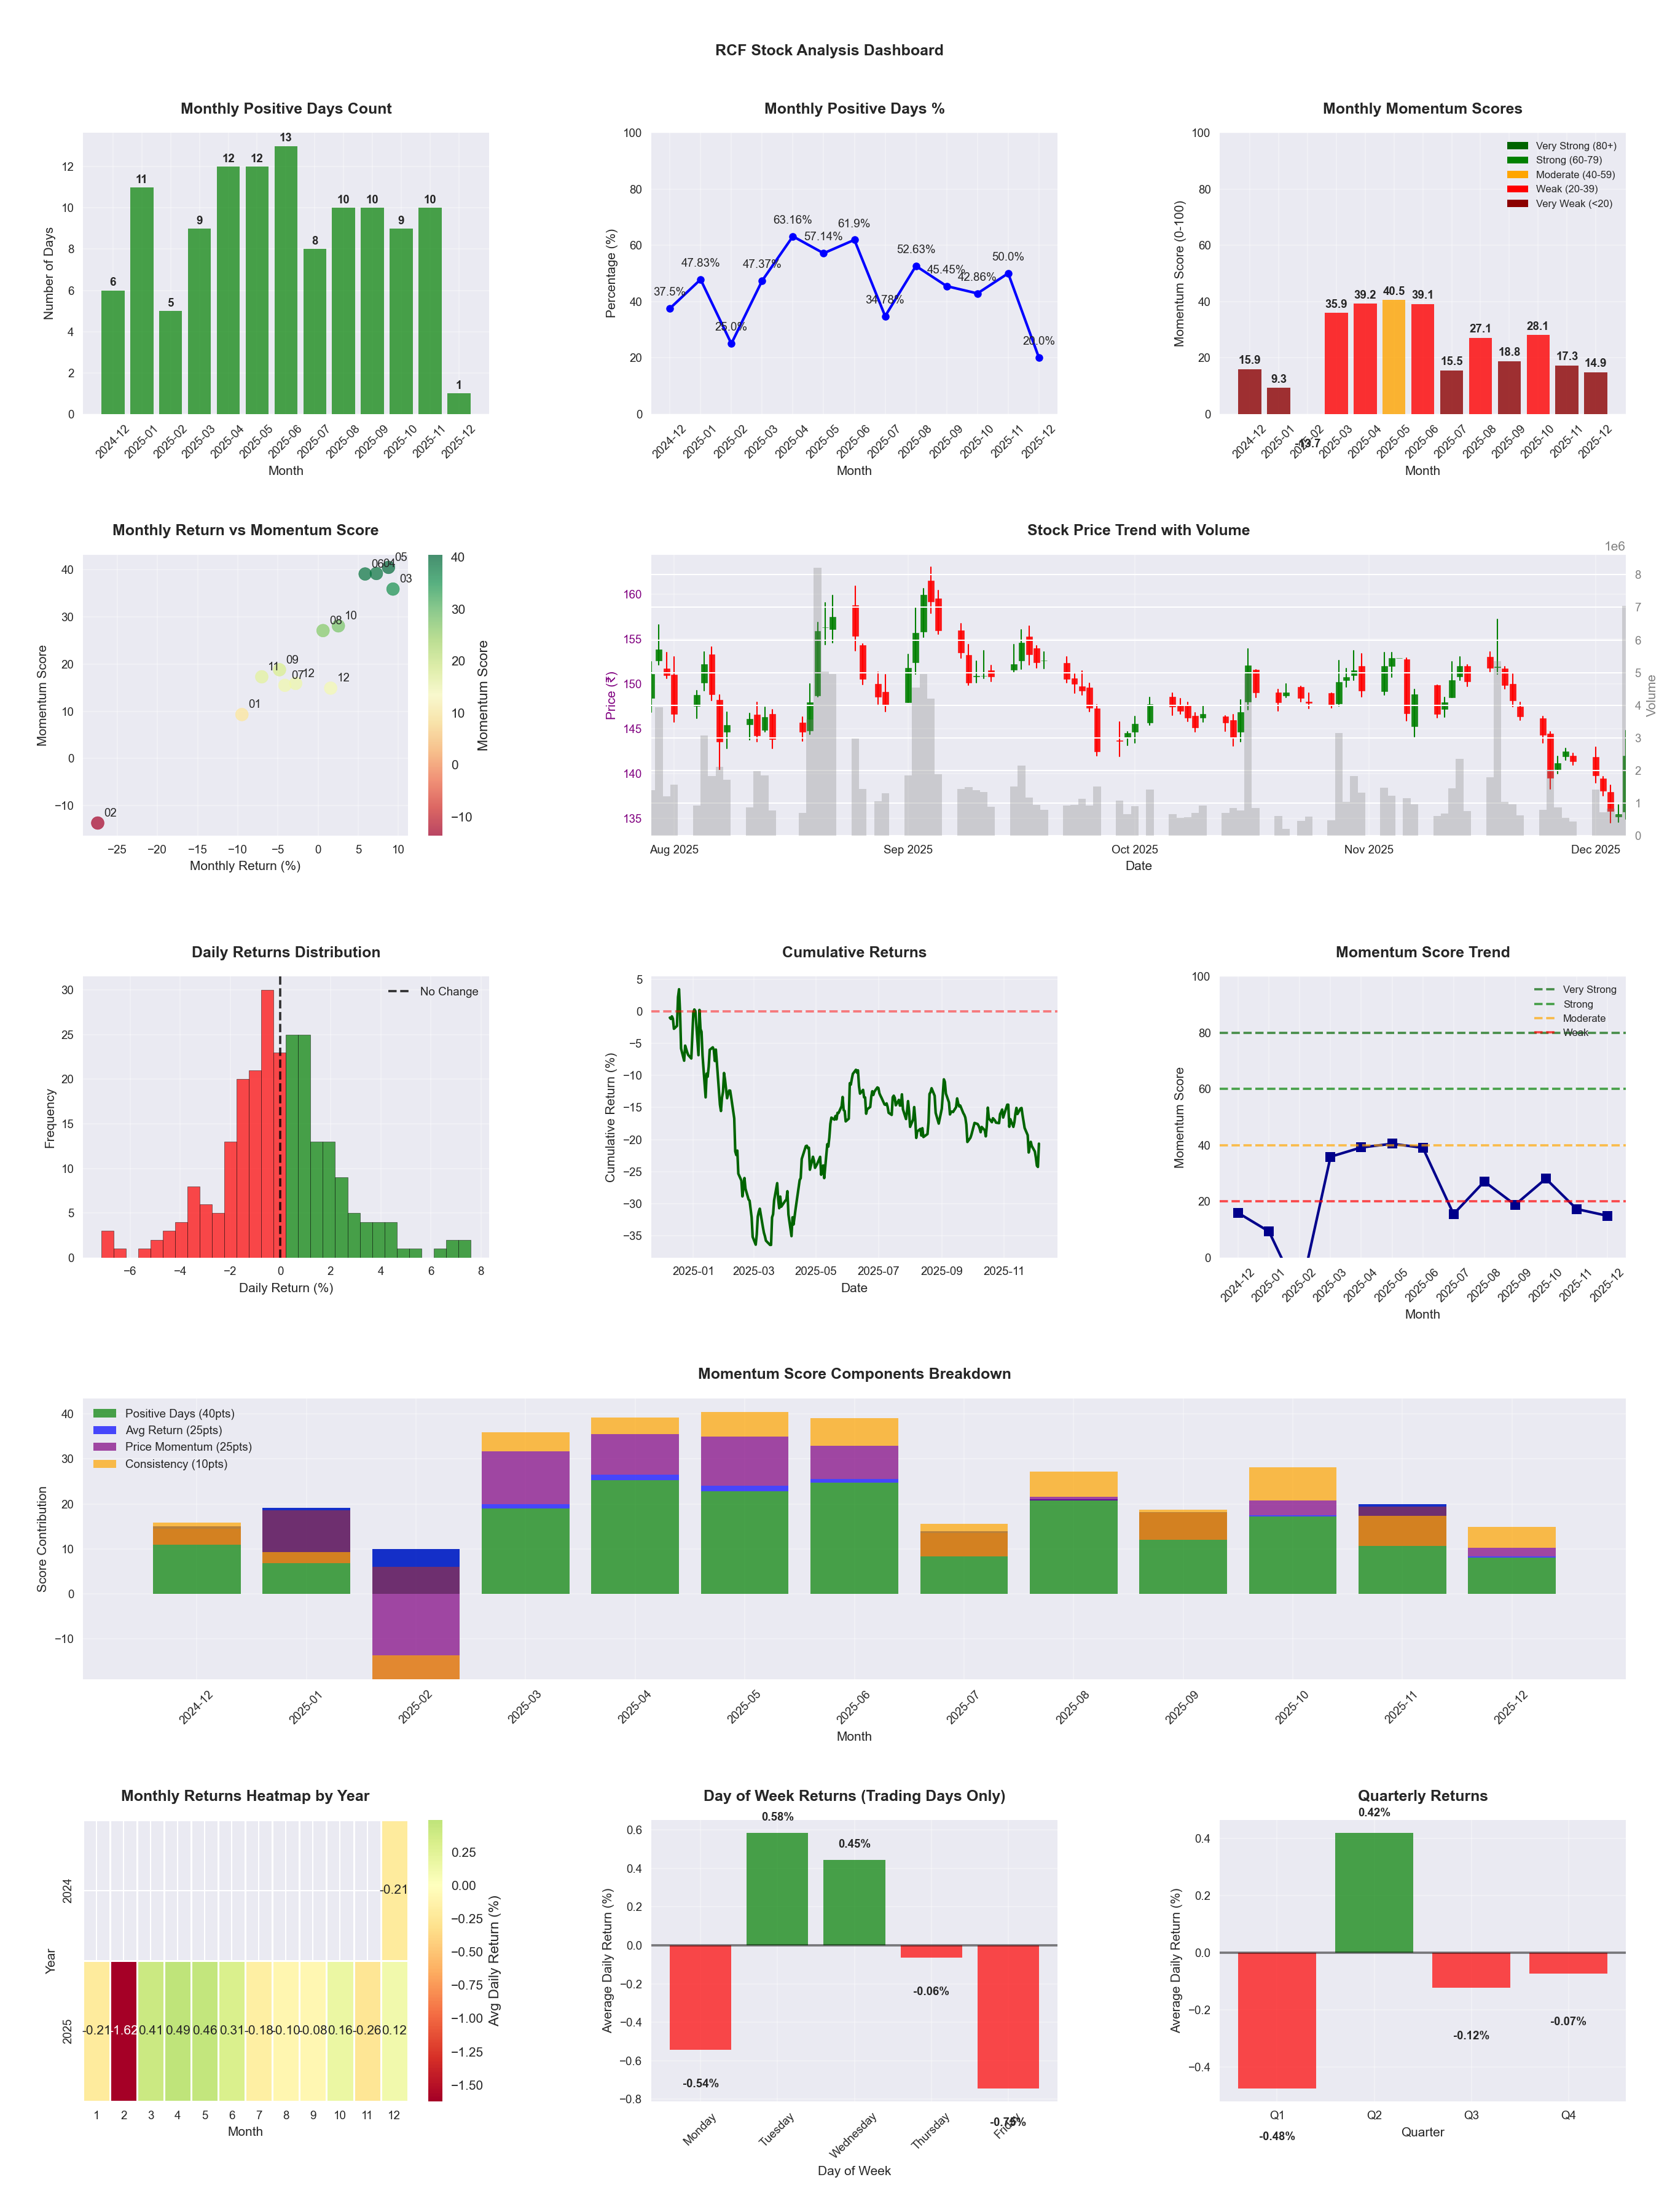
📊 Key Insights & Metrics
Symbol
📈 RCF
Date
📅 2026-04-11
Volatility
🟡 2.32%
Risk Profile
⚠️ suitable for aggressive investors
Win Rate
⚠️ 48.4%
Avg Daily Return
📈 +0.04%
Max Drawdown
📉 -33.90%
IBD RS Score
📊 41.2
Weak
Market Rank
#290
Best Month
🏆 2026-04
Best Months to Trade
📅 Apr, May, Jun
Best Days to Trade
📅 Tuesday, Wednesday
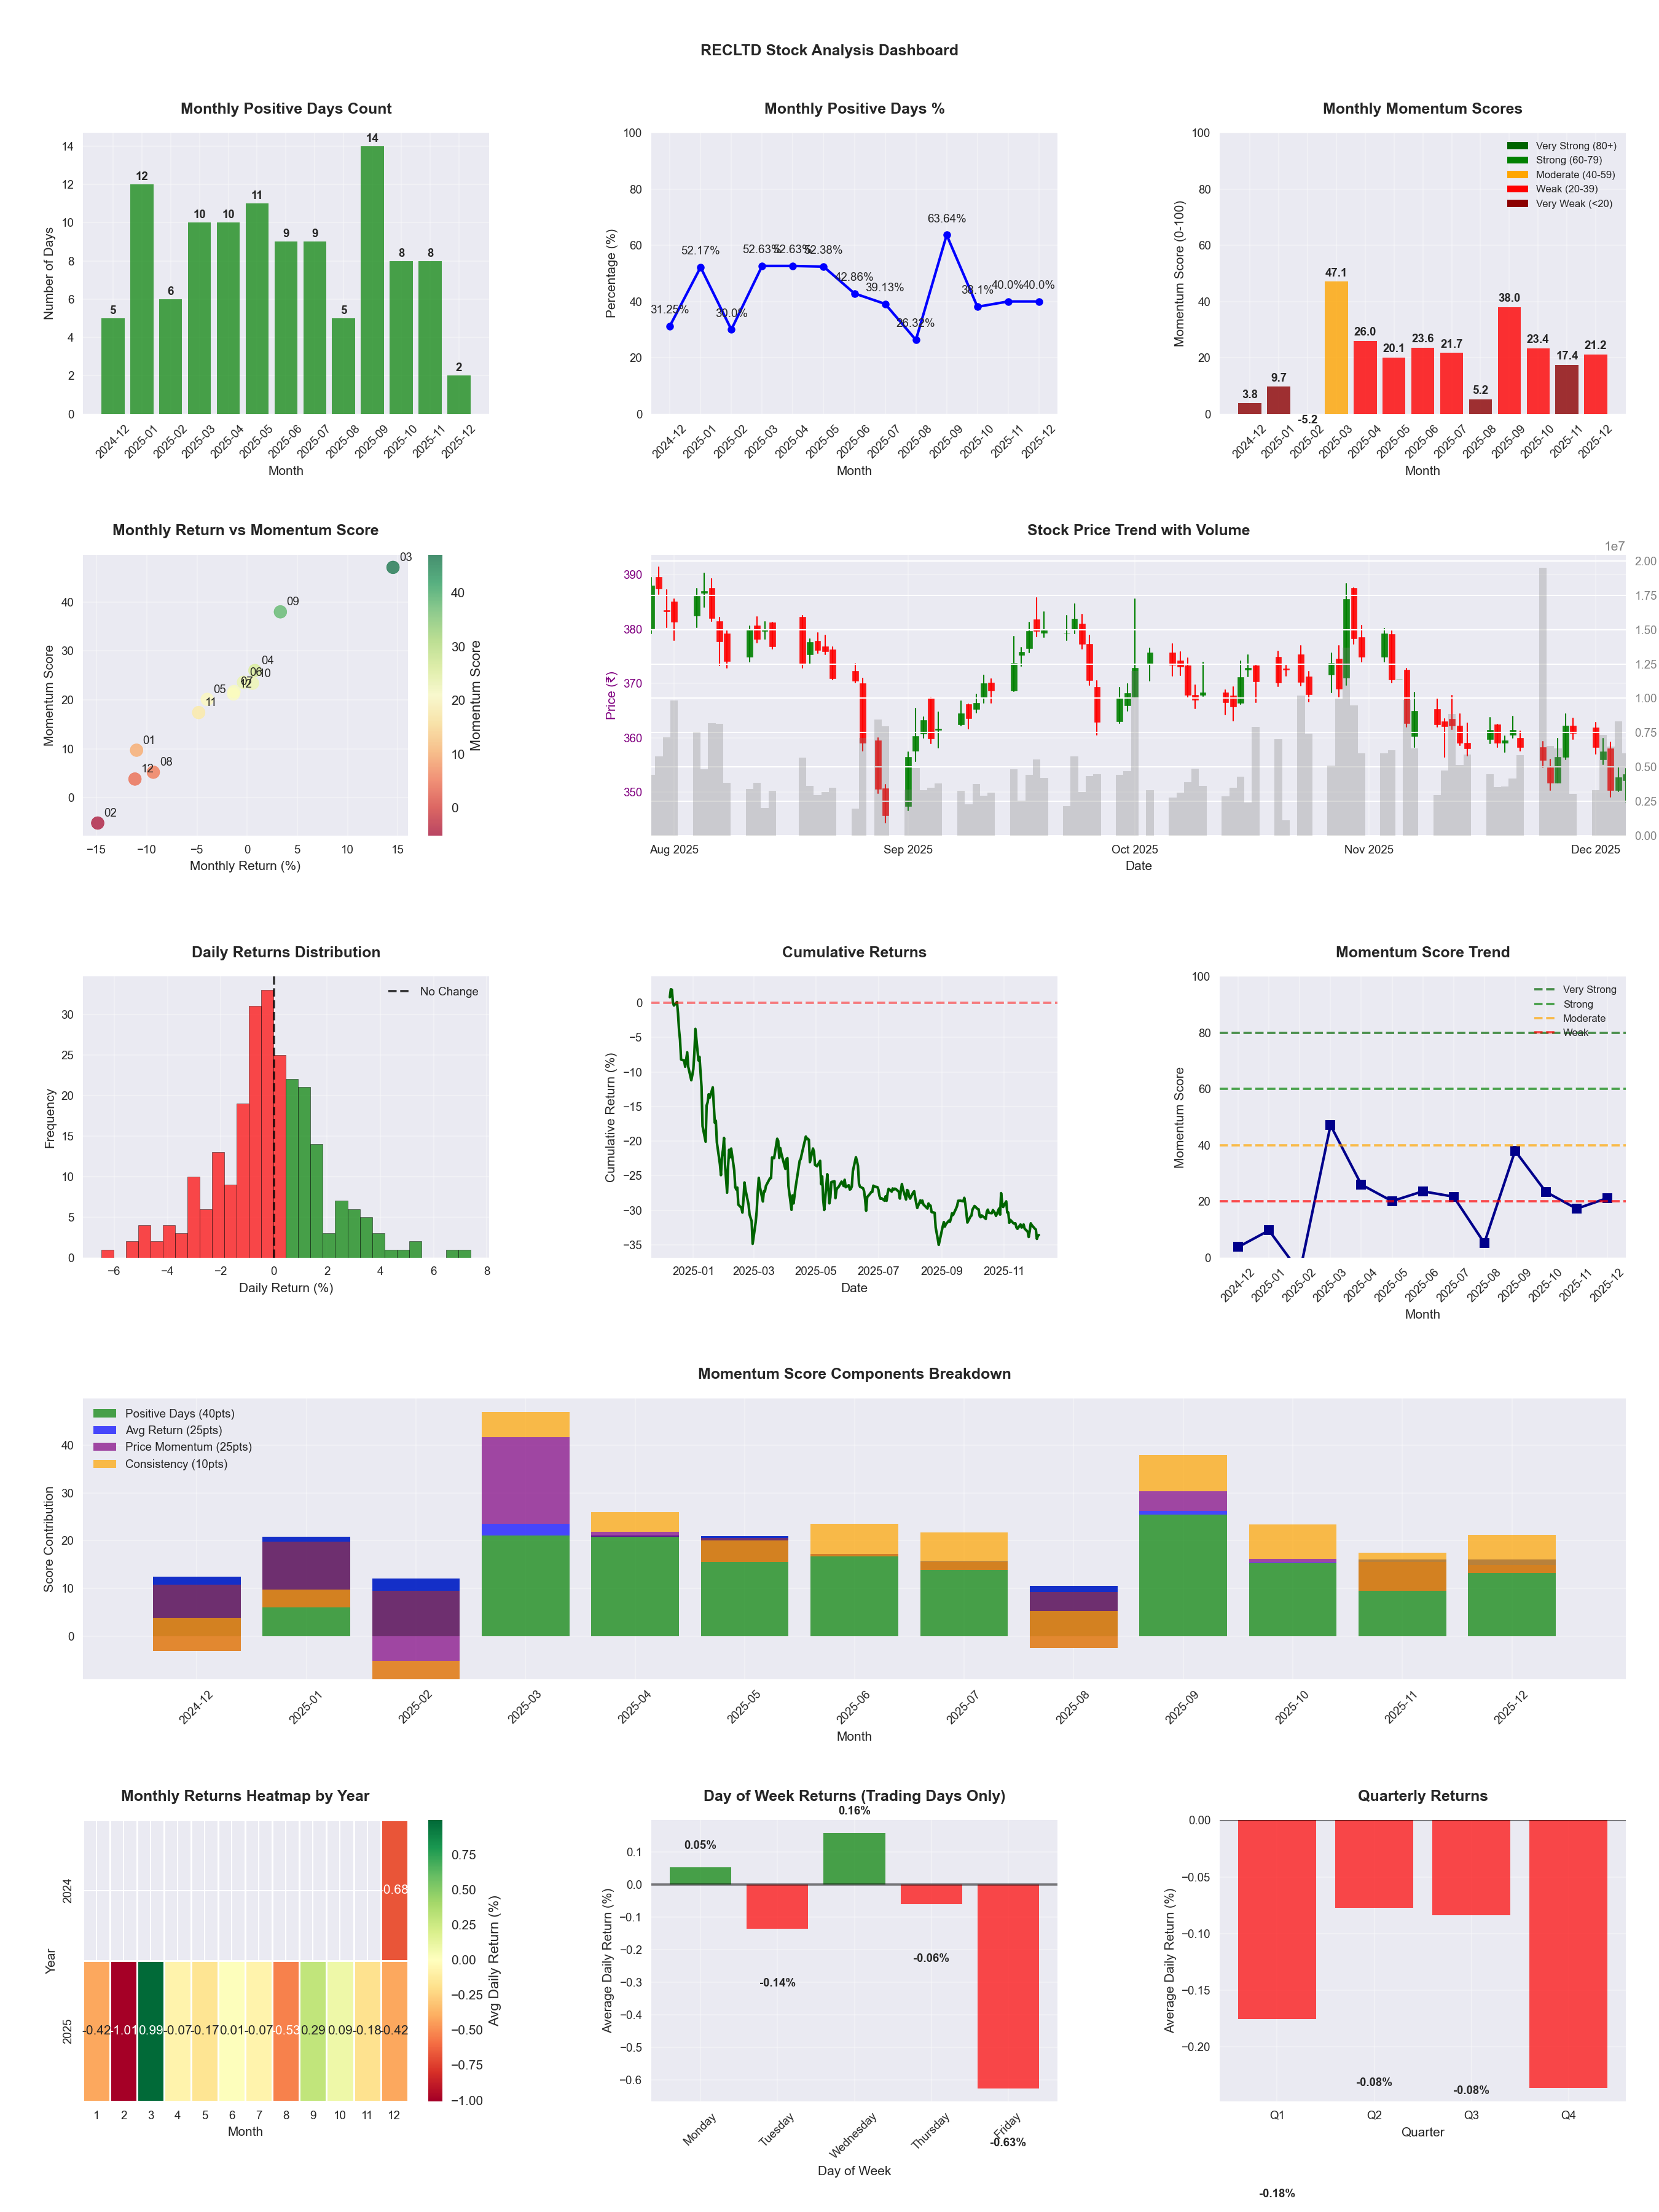
📊 Key Insights & Metrics
Symbol
📈 RECLTD
Date
📅 2026-04-11
Volatility
🟡 1.81%
Win Rate
⚠️ 48.0%
Avg Daily Return
📉 -0.02%
Max Drawdown
📉 -27.34%
IBD RS Score
📊 50.5
Average
Market Rank
#244
Best Month
🏆 2026-04
Worst Month
📉 2025-08
Best Months to Trade
📅 Apr, Sep, Jan
Best Days to Trade
📅 Wednesday, Monday
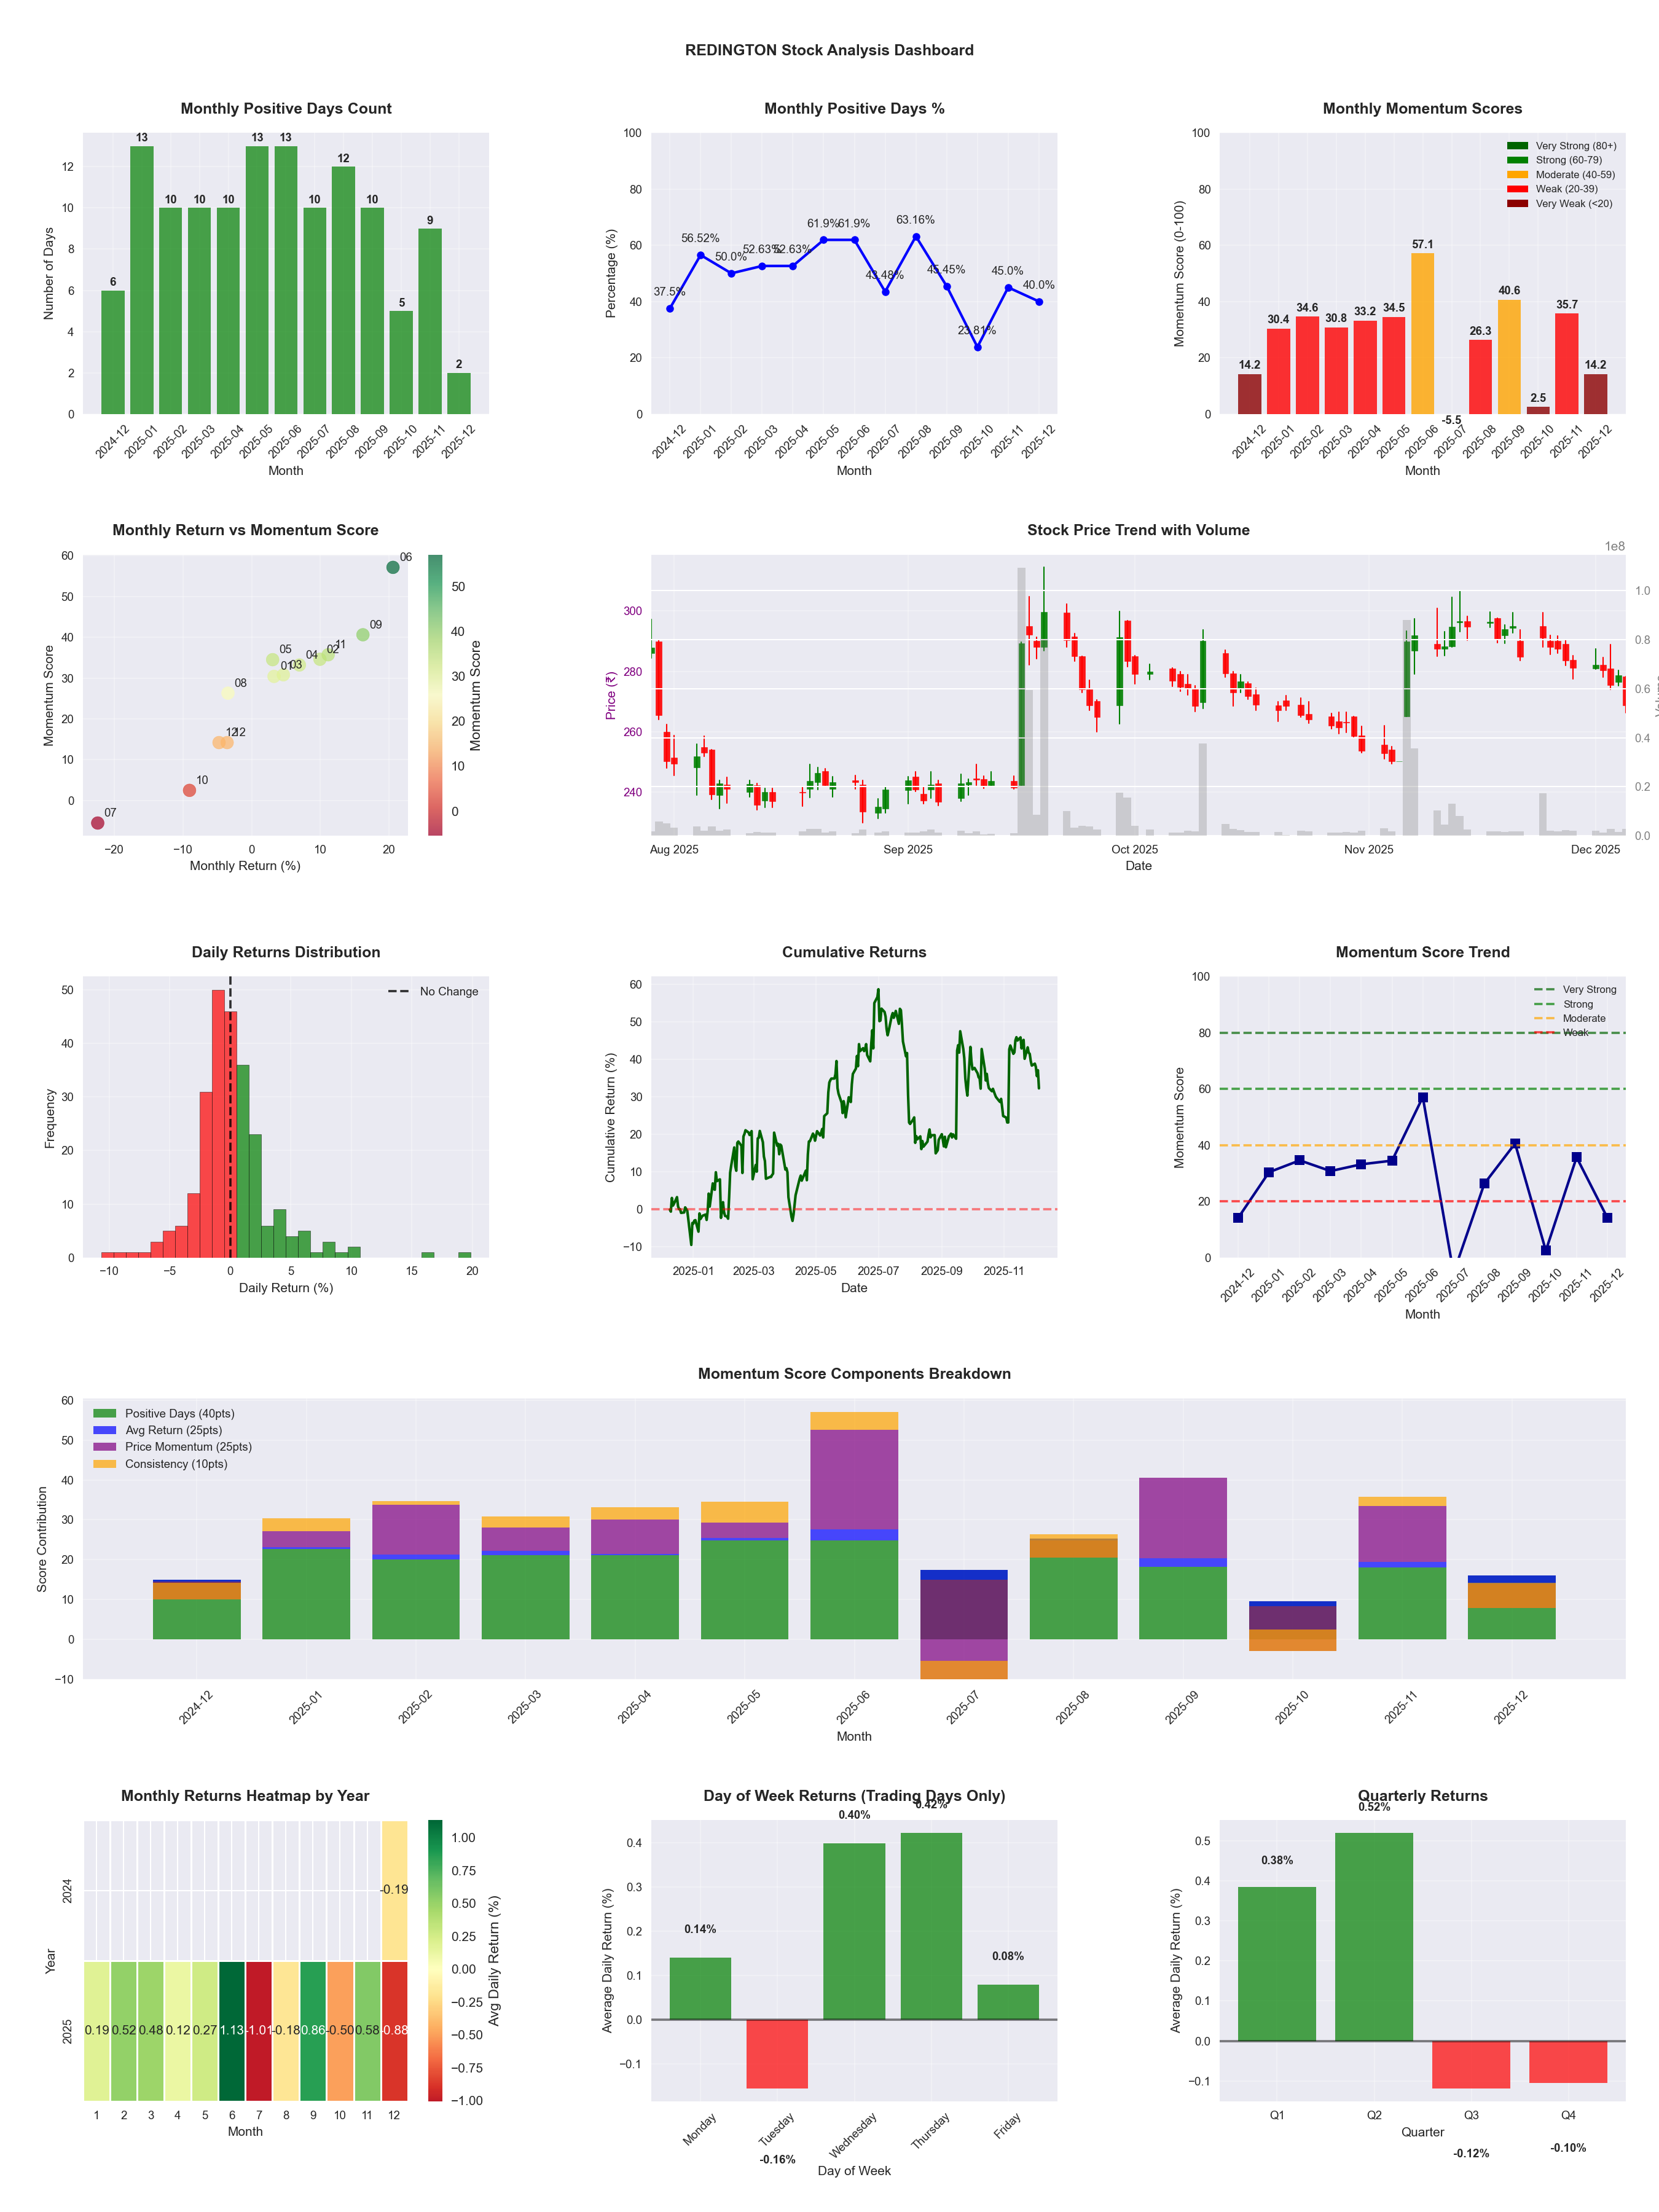
📊 Key Insights & Metrics
Symbol
📈 REDINGTON
Date
📅 2026-04-11
Volatility
🔴 3.16%
Risk Profile
⚠️ suitable for aggressive investors
Win Rate
⚠️ 48.4%
Avg Daily Return
📈 +0.07%
Max Drawdown
📉 -38.00%
IBD RS Score
📊 19.1
Weak
Market Rank
#399
Best Month
🏆 2025-06
Best Months to Trade
📅 Apr, Jun, Sep
Best Days to Trade
📅 Tuesday, Friday
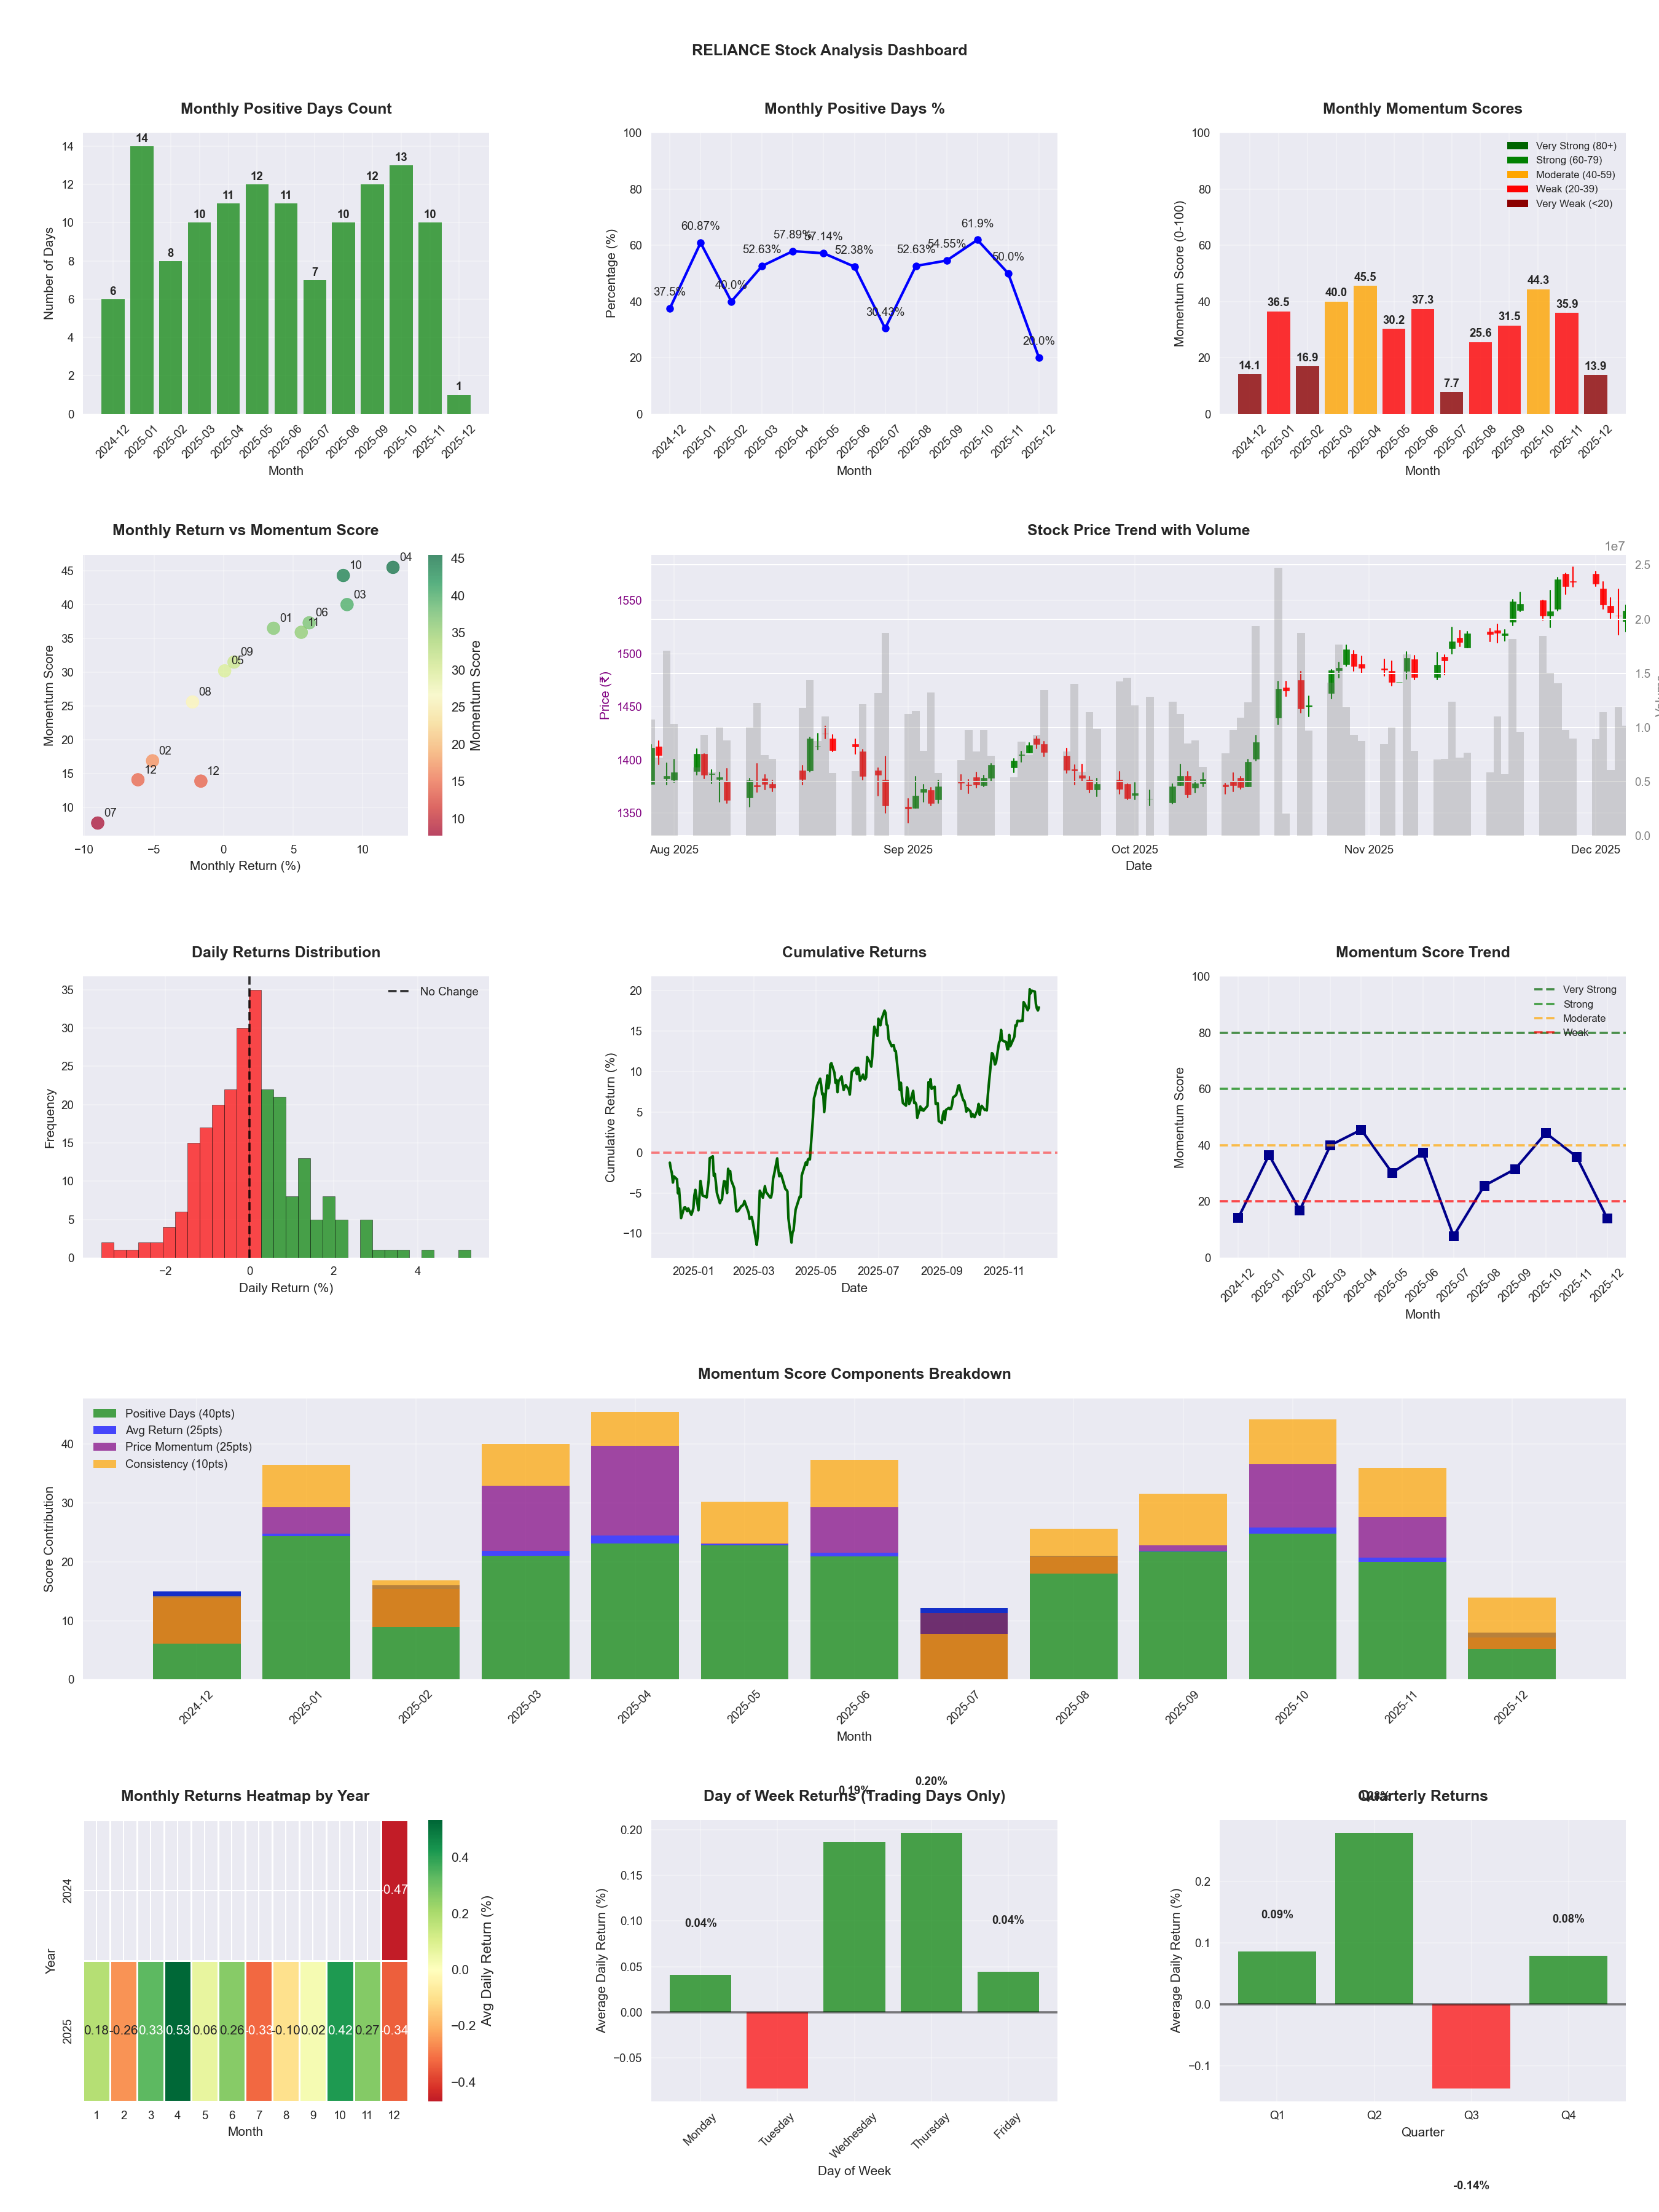
📊 Key Insights & Metrics
Symbol
📈 RELIANCE
Date
📅 2026-04-11
Volatility
🟢 1.28%
Win Rate
⚠️ 50.8%
Avg Daily Return
📈 +0.05%
Max Drawdown
📉 -18.07%
IBD RS Score
📊 54.0
Average
Market Rank
#227
Best Month
🏆 2025-04
Worst Month
📉 2026-01
Best Months to Trade
📅 Apr, Oct, Nov
Best Days to Trade
📅 Wednesday, Monday
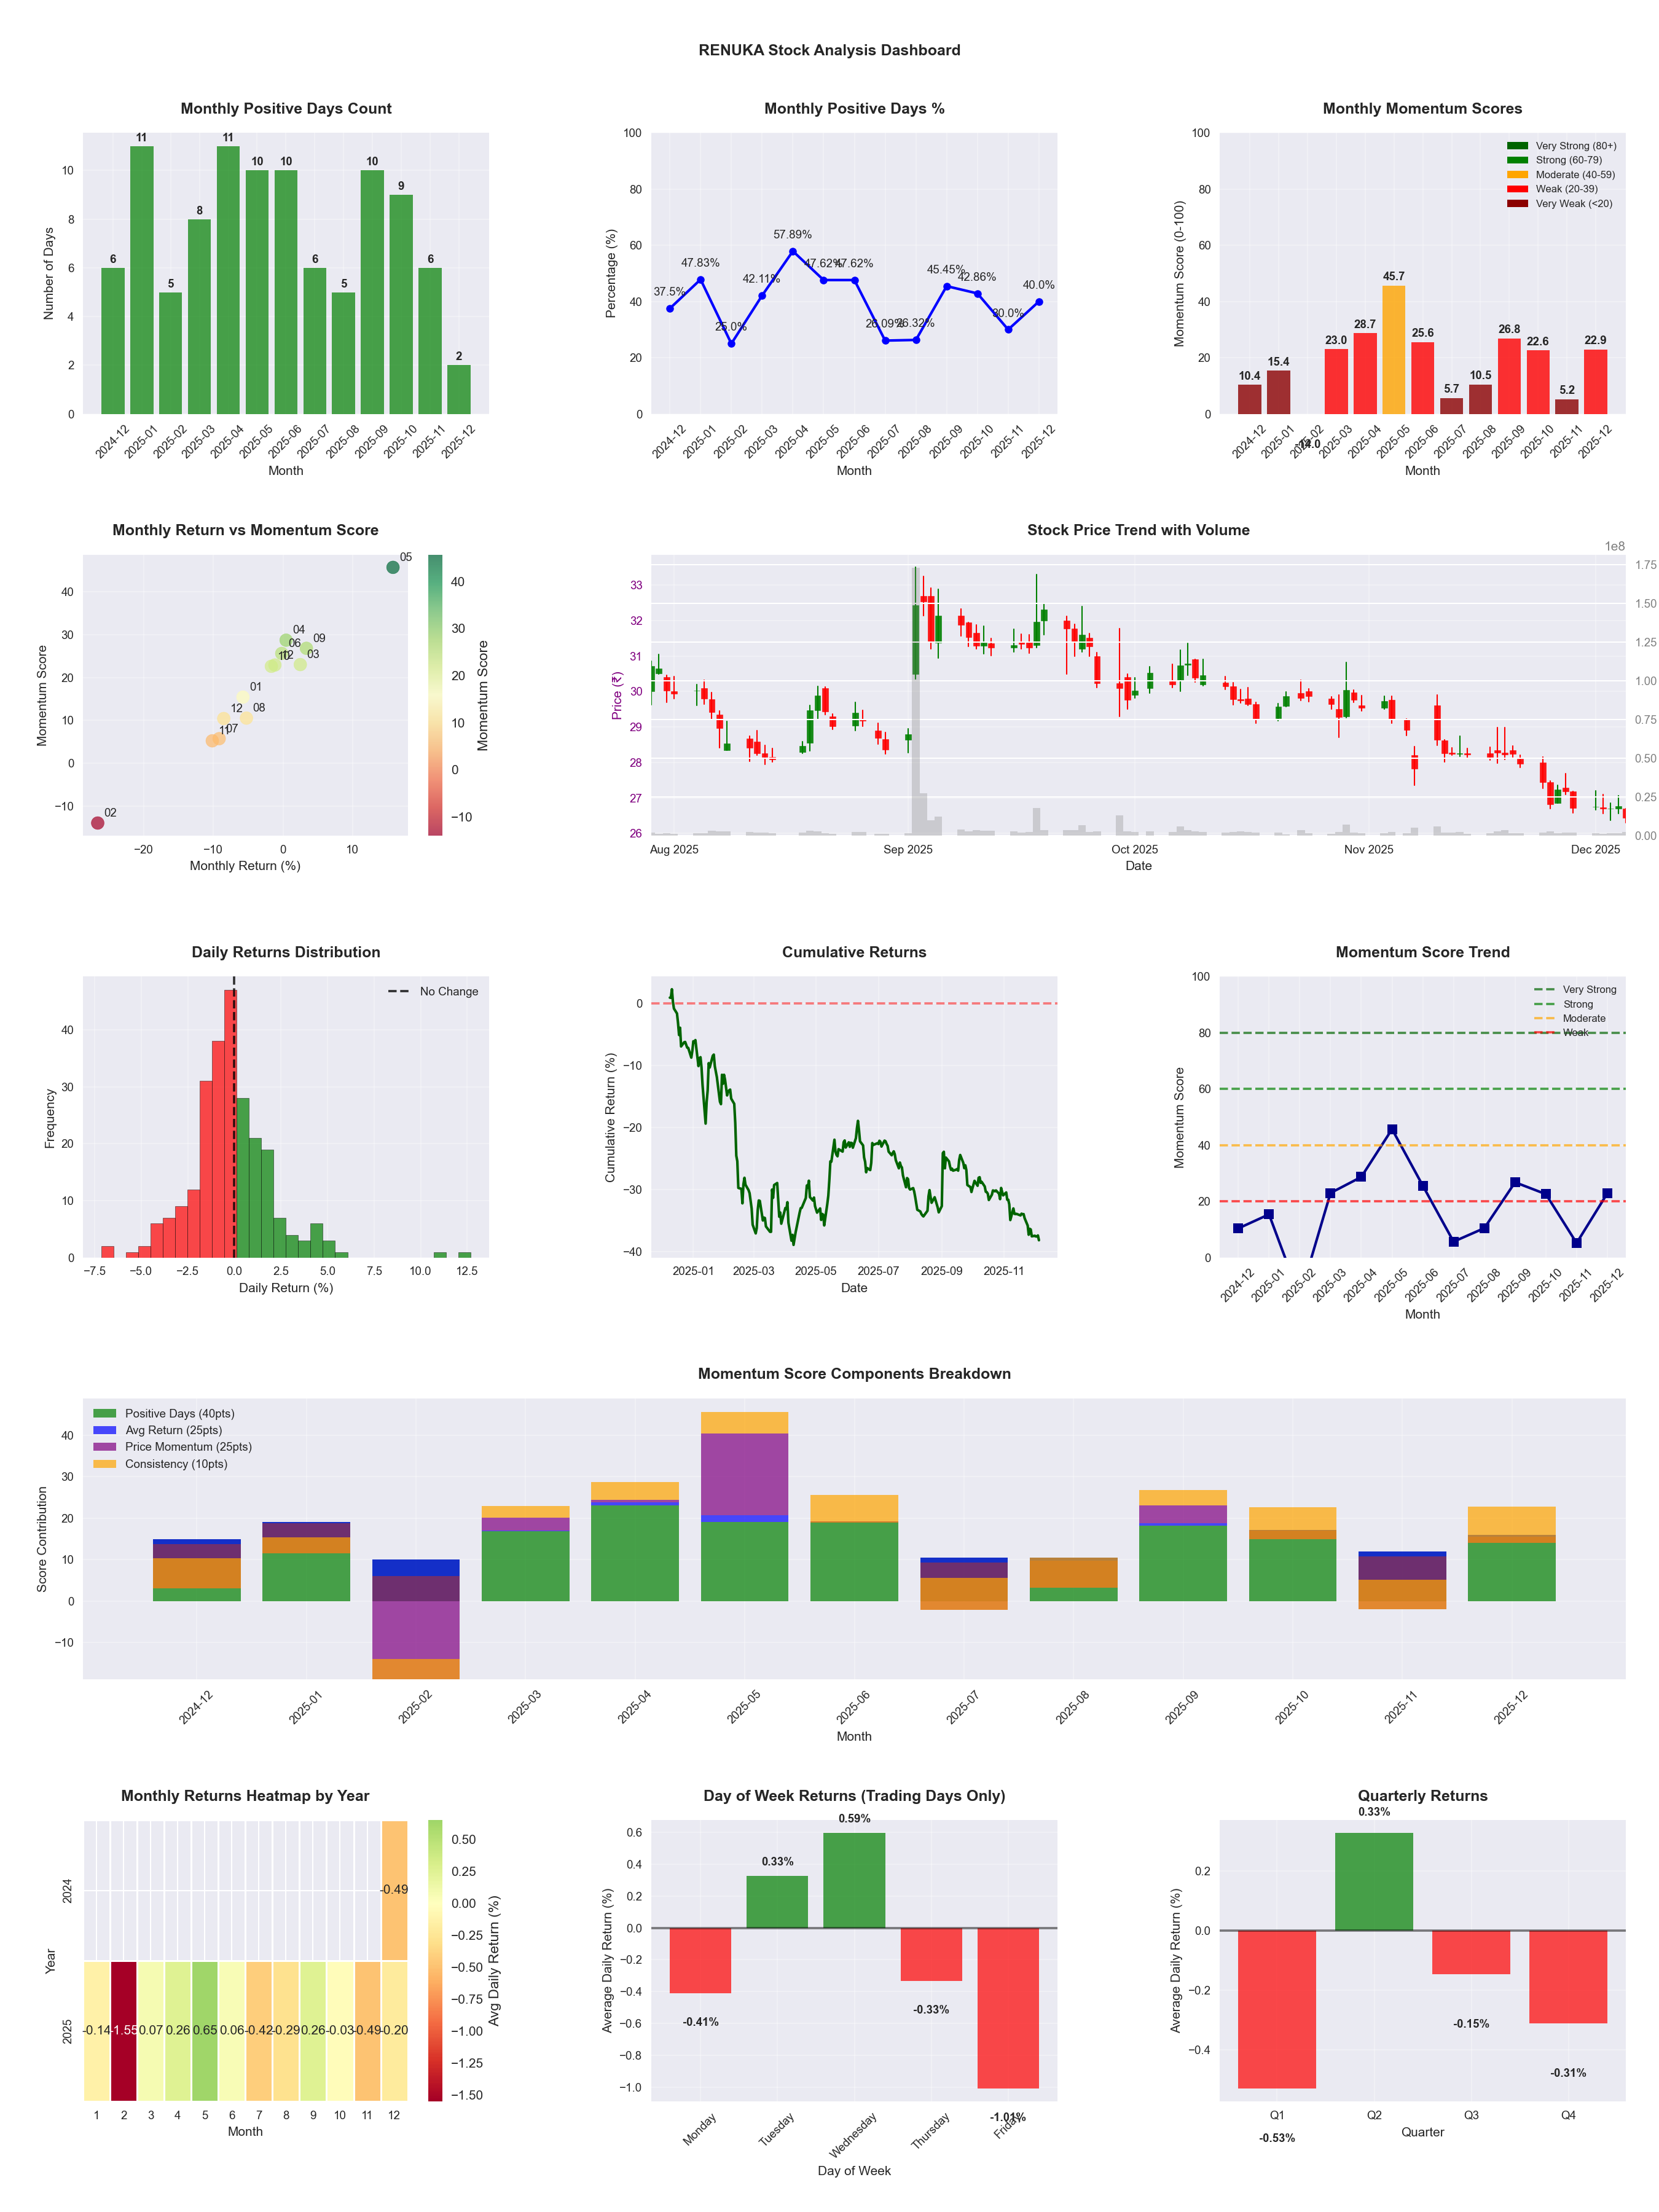
📊 Key Insights & Metrics
Symbol
📈 RENUKA
Date
📅 2026-03-21
Volatility
🟡 2.12%
Risk Profile
⚠️ suitable for aggressive investors
Win Rate
⚠️ 41.3%
Avg Daily Return
📉 -0.06%
Max Drawdown
📉 -33.50%
Best Month
🏆 2025-05
Worst Month
📉 2025-03
Best Months to Trade
📅 May, Apr, Sep
Best Days to Trade
📅 Tuesday, Wednesday
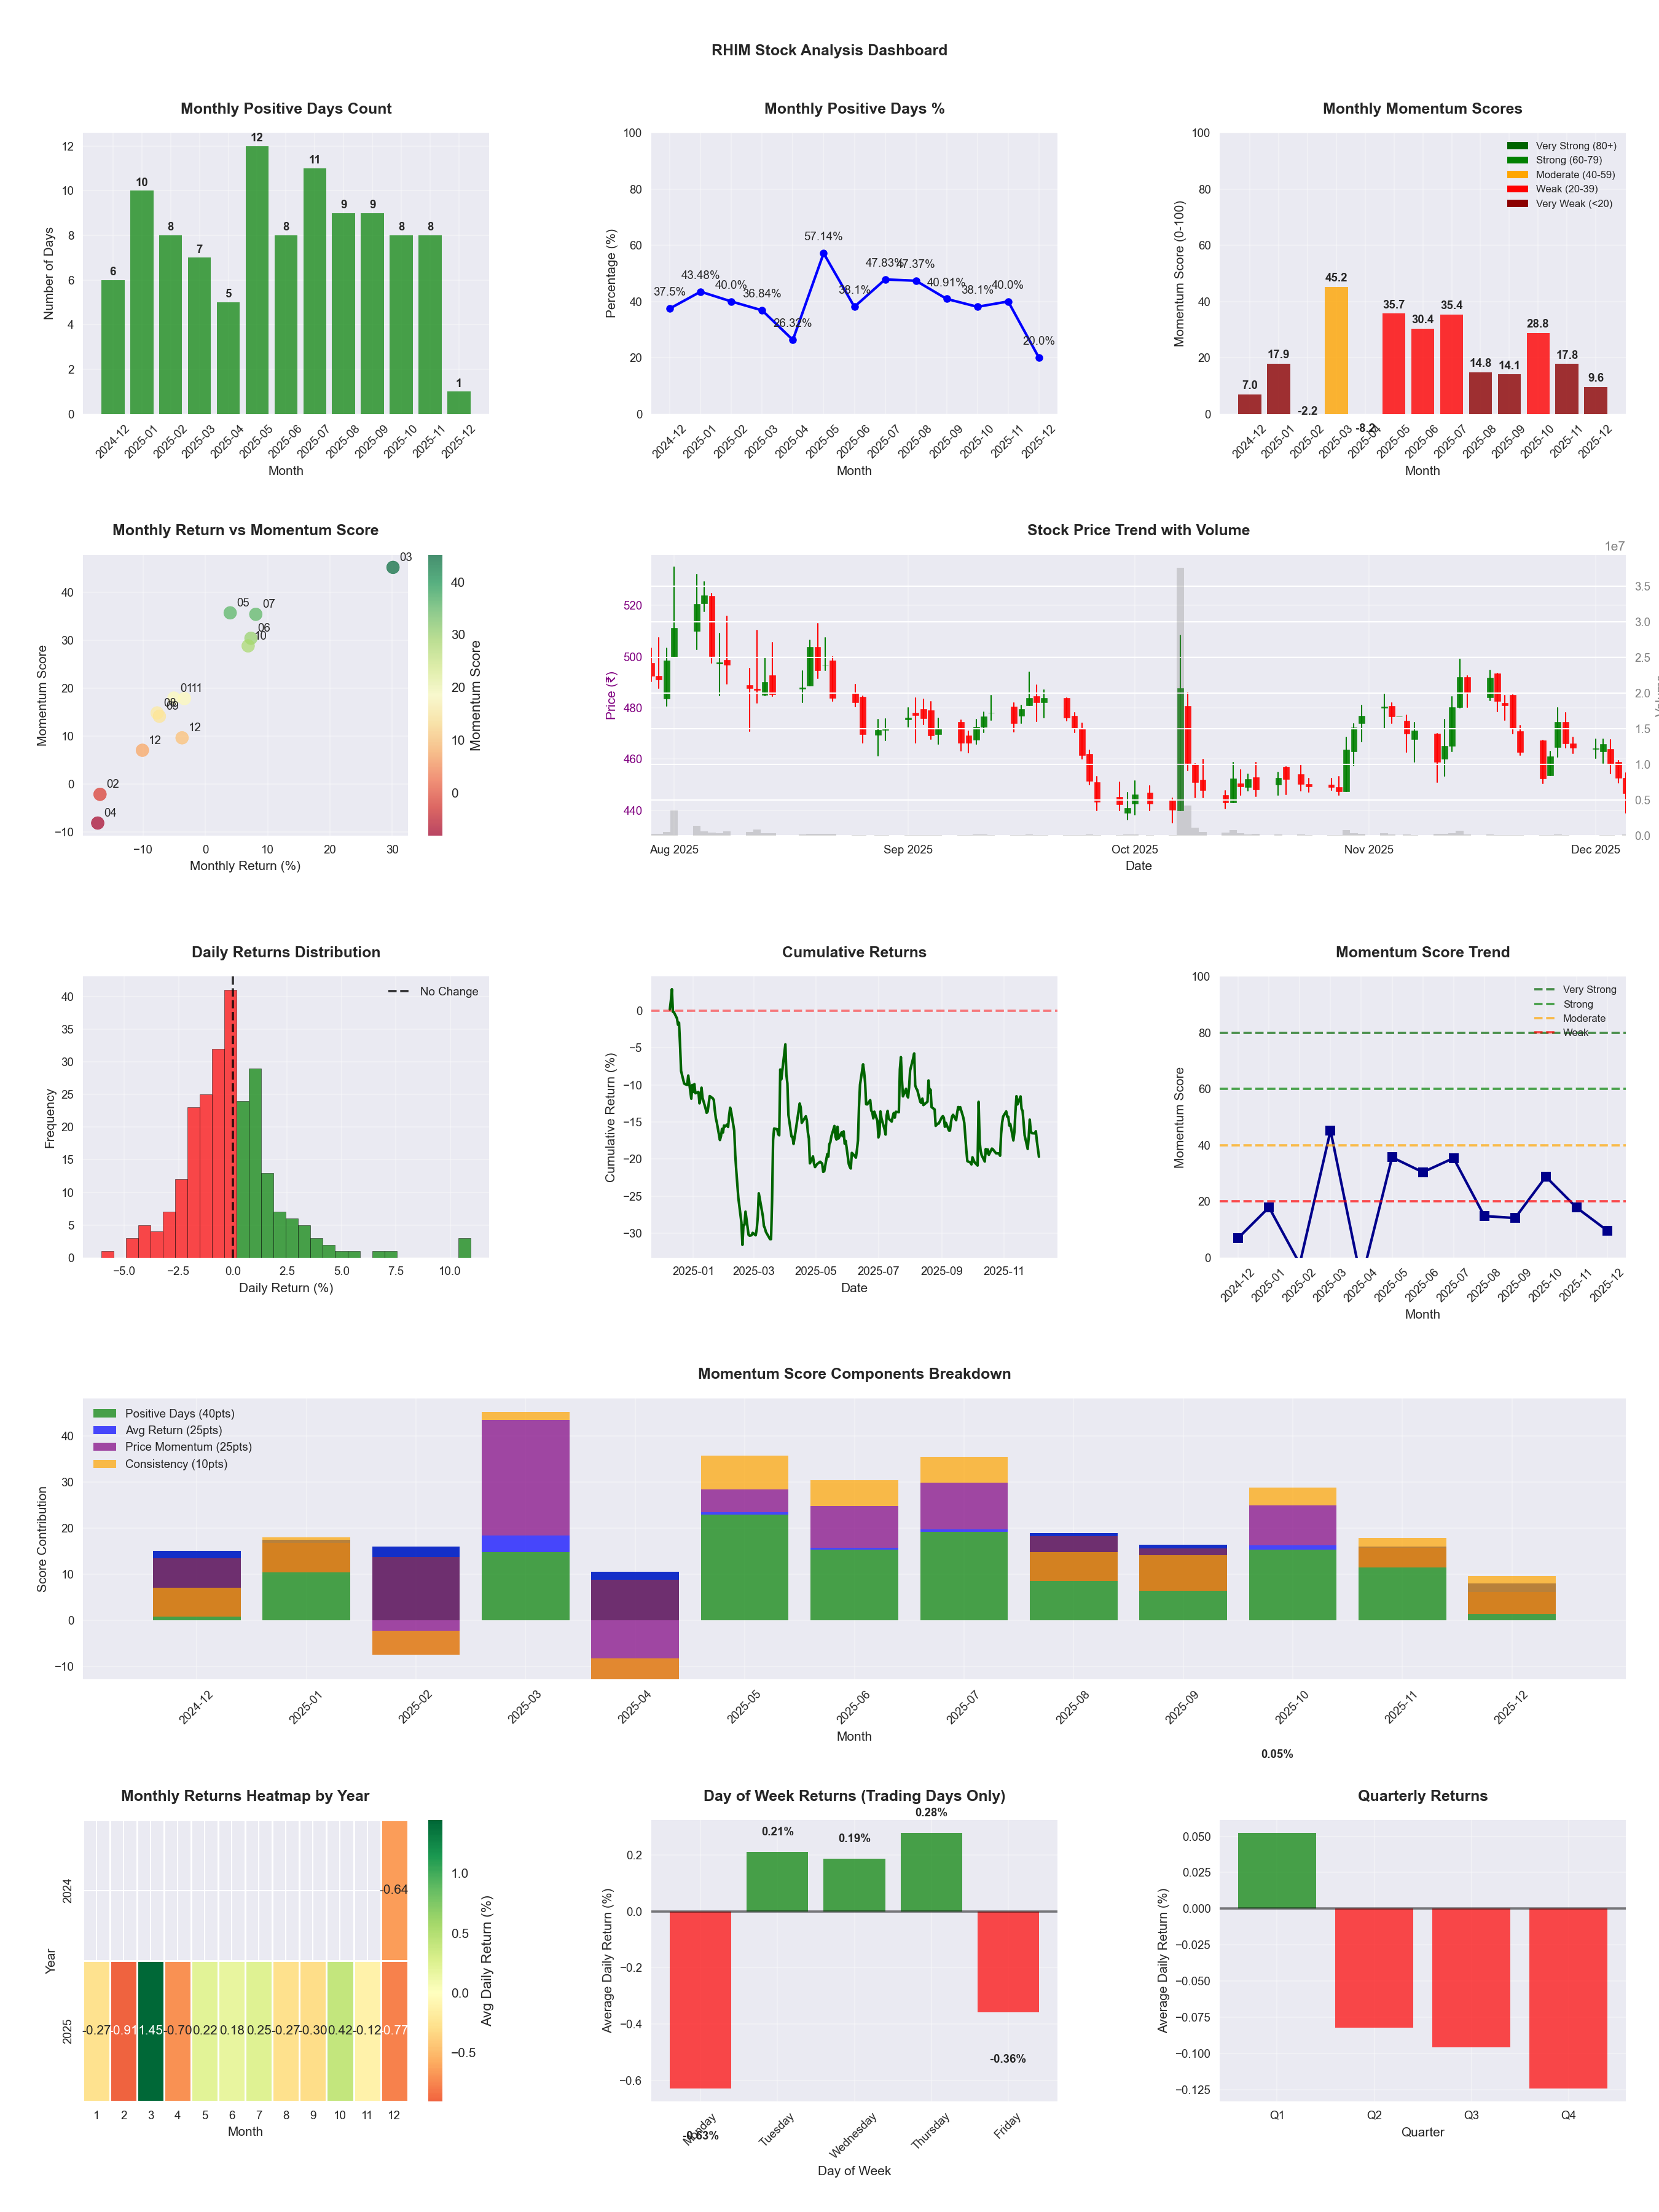
📊 Key Insights & Metrics
Symbol
📈 RHIM
Date
📅 2026-04-11
Volatility
🟡 2.30%
Risk Profile
⚠️ suitable for aggressive investors
Win Rate
⚠️ 43.1%
Avg Daily Return
📉 -0.05%
Max Drawdown
📉 -36.25%
IBD RS Score
📊 24.7
Weak
Market Rank
#371
Best Month
🏆 2026-04
Best Months to Trade
📅 Apr, Oct, Jul
Best Days to Trade
📅 Tuesday, Wednesday
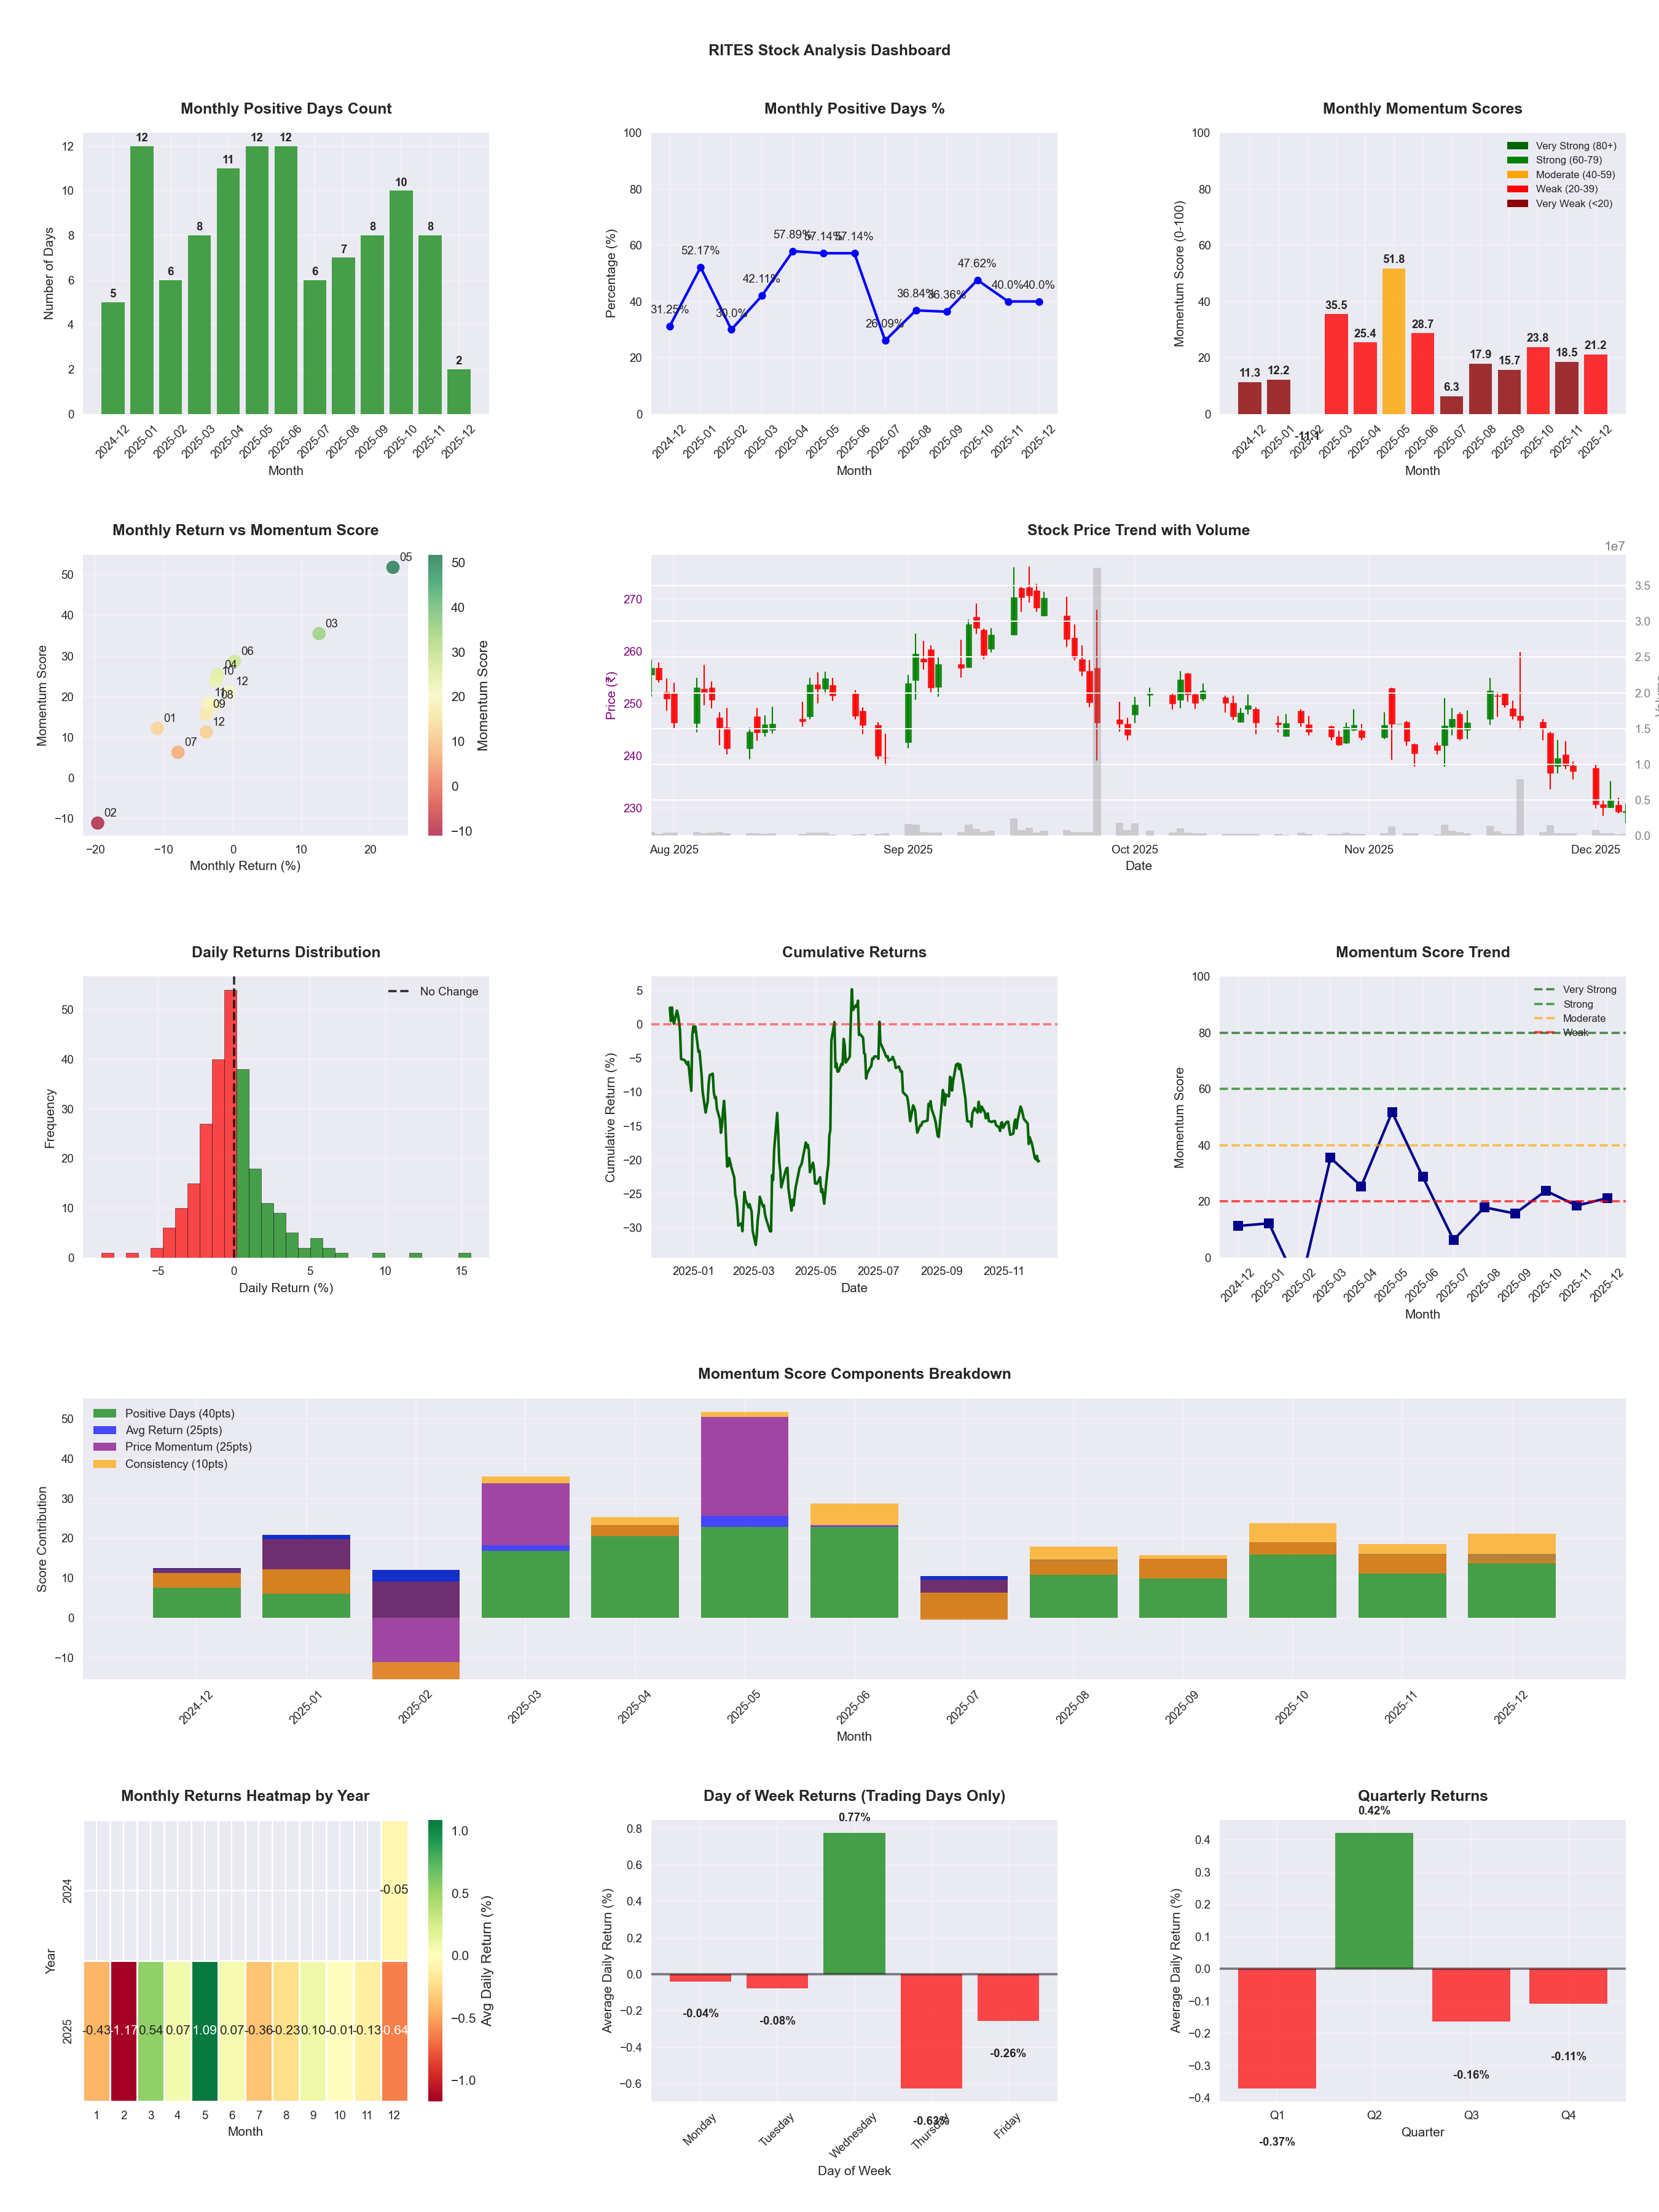
📊 Key Insights & Metrics
Symbol
📈 RITES
Date
📅 2026-04-11
Volatility
🟡 2.26%
Risk Profile
⚠️ suitable for aggressive investors
Win Rate
⚠️ 46.3%
Avg Daily Return
📈 +0.01%
Max Drawdown
📉 -41.39%
IBD RS Score
📊 29.0
Weak
Market Rank
#350
Best Month
🏆 2026-04
Worst Month
📉 2026-03
Best Months to Trade
📅 May, Apr, Dec
Best Days to Trade
📅 Wednesday, Monday
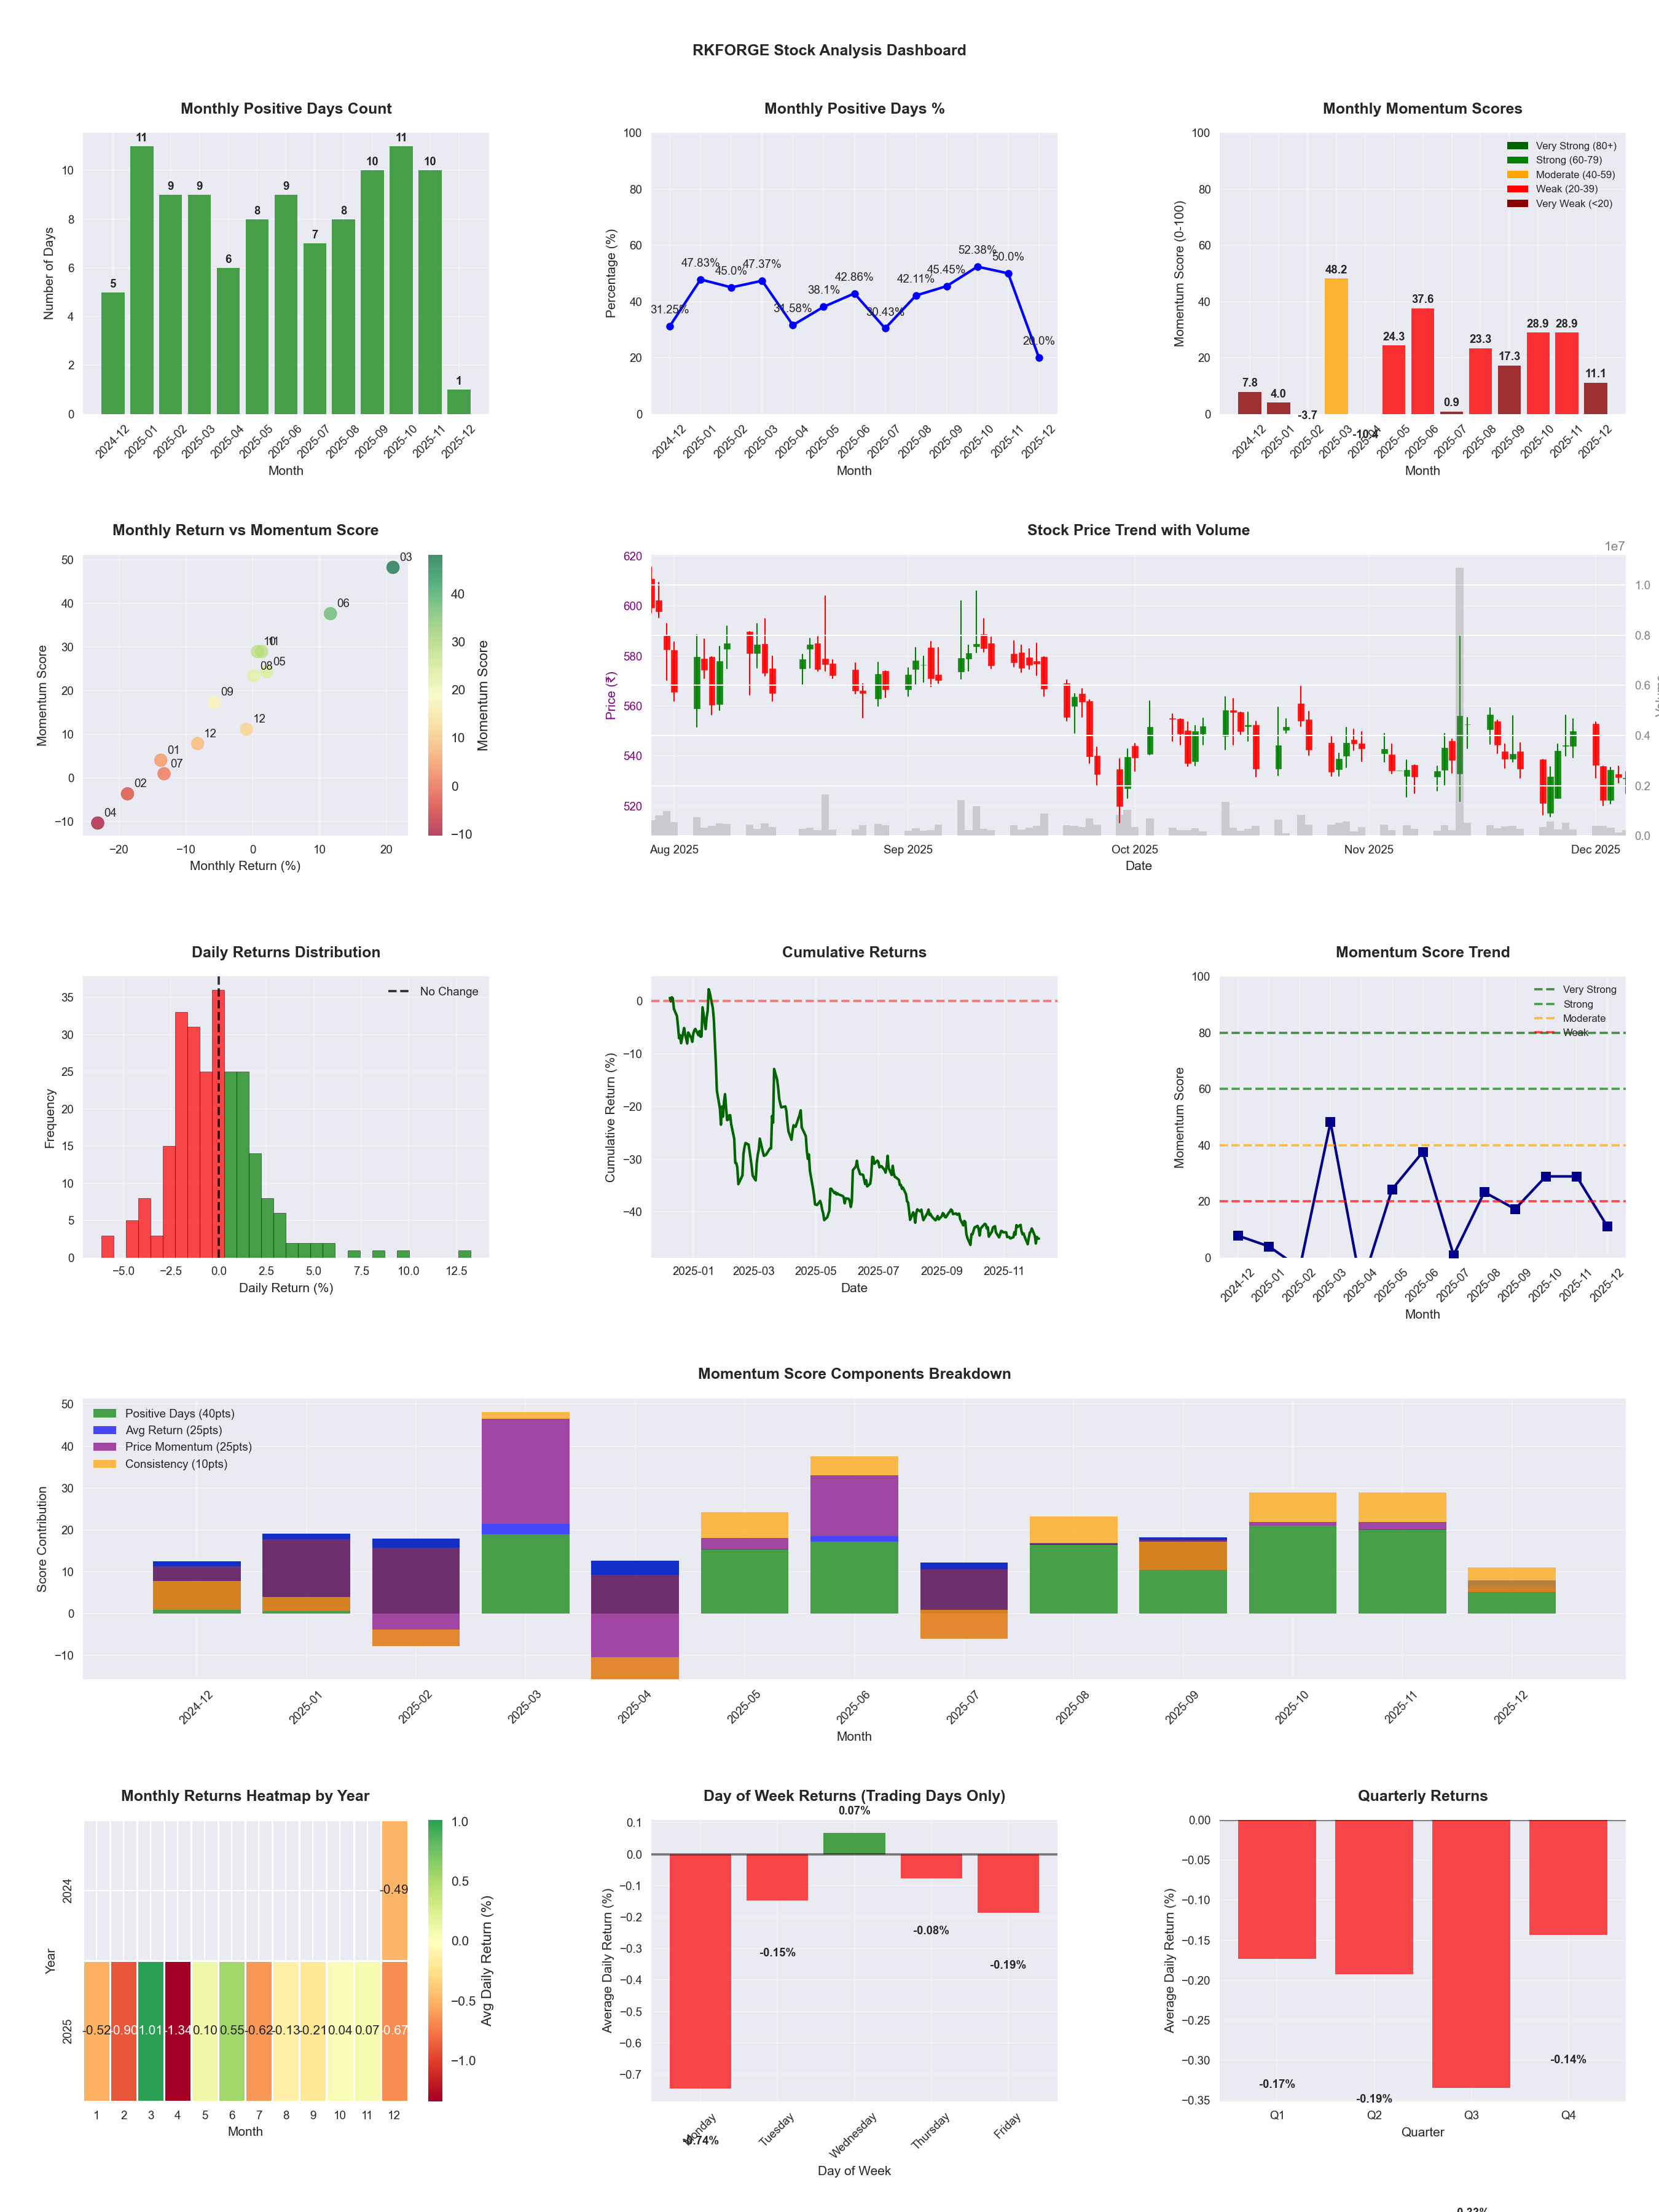
📊 Key Insights & Metrics
Symbol
📈 RKFORGE
Date
📅 2026-04-11
Volatility
🟡 2.20%
Risk Profile
⚠️ suitable for aggressive investors
Win Rate
⚠️ 41.5%
Avg Daily Return
📉 -0.10%
Max Drawdown
📉 -39.65%
IBD RS Score
📊 48.5
Weak
Market Rank
#254
Best Month
🏆 2026-04
Best Months to Trade
📅 Jun, Feb, May
Best Days to Trade
📅 Tuesday, Thursday
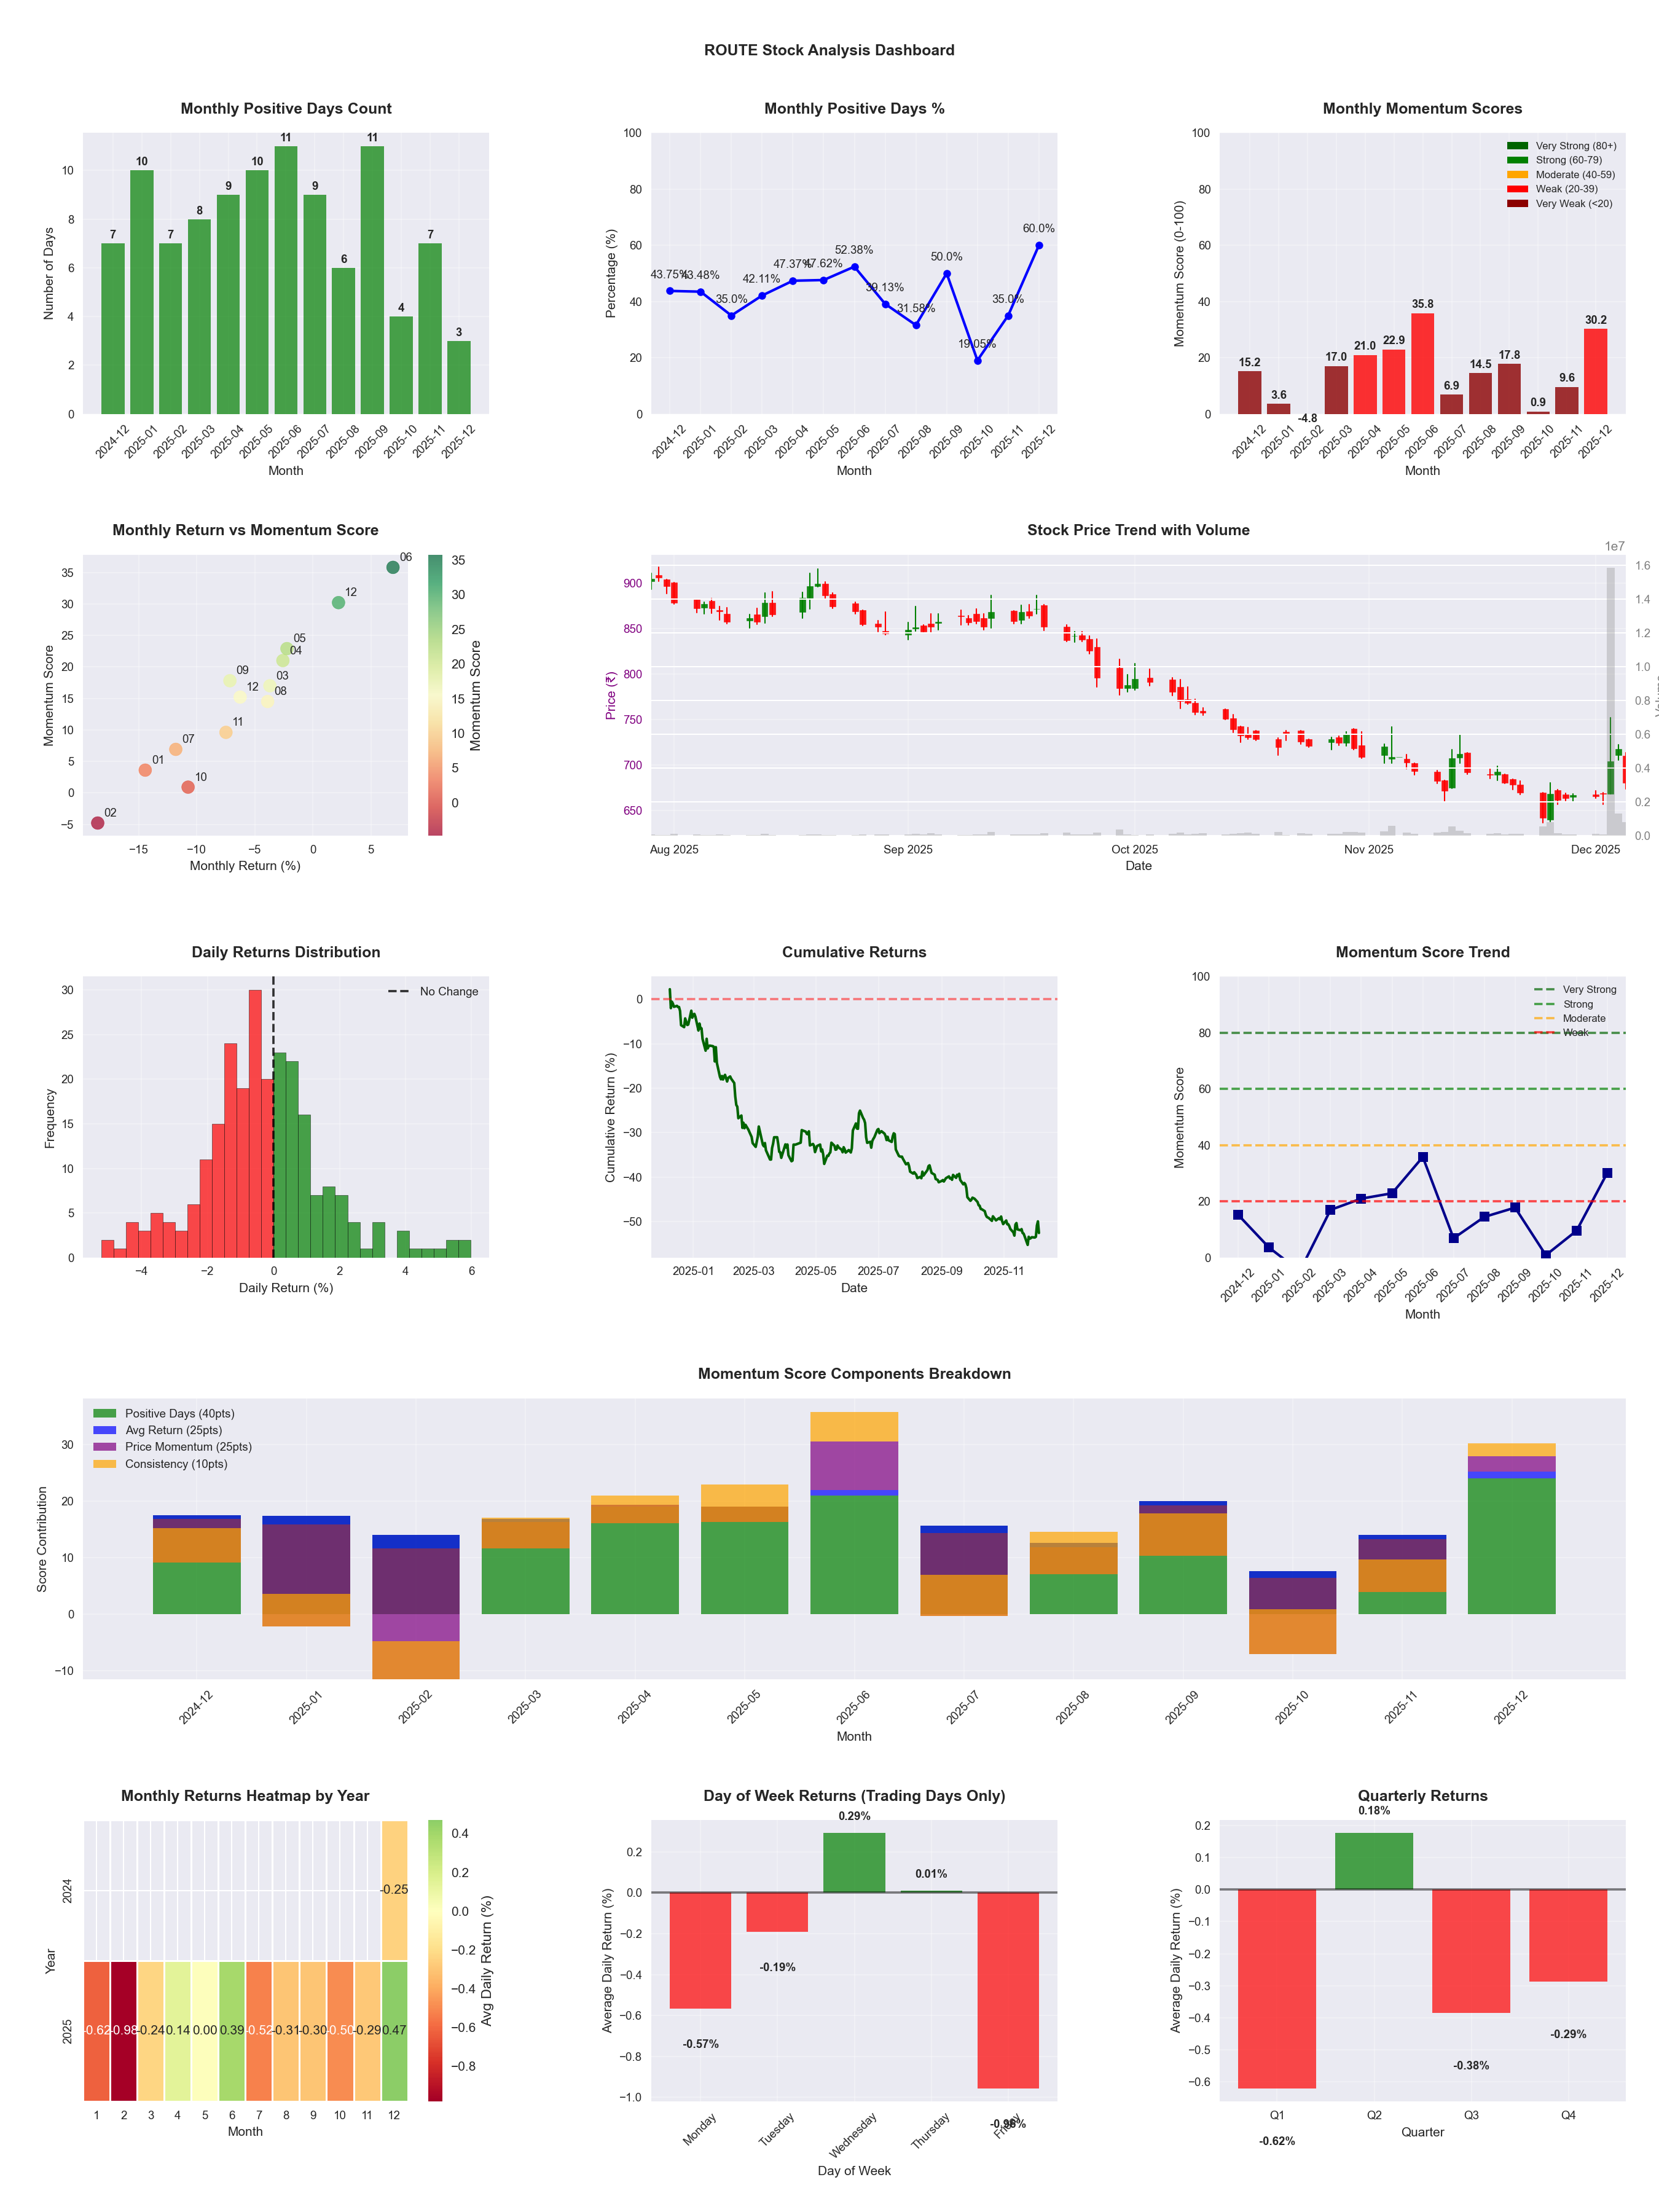
📊 Key Insights & Metrics
Symbol
📈 ROUTE
Date
📅 2026-03-21
Volatility
🟡 2.00%
Win Rate
❌ 36.8%
Avg Daily Return
📉 -0.28%
Max Drawdown
📉 -58.37%
Best Month
🏆 2025-06
Best Months to Trade
📅 Jun, Dec, Apr
Best Days to Trade
📅 Wednesday, Thursday
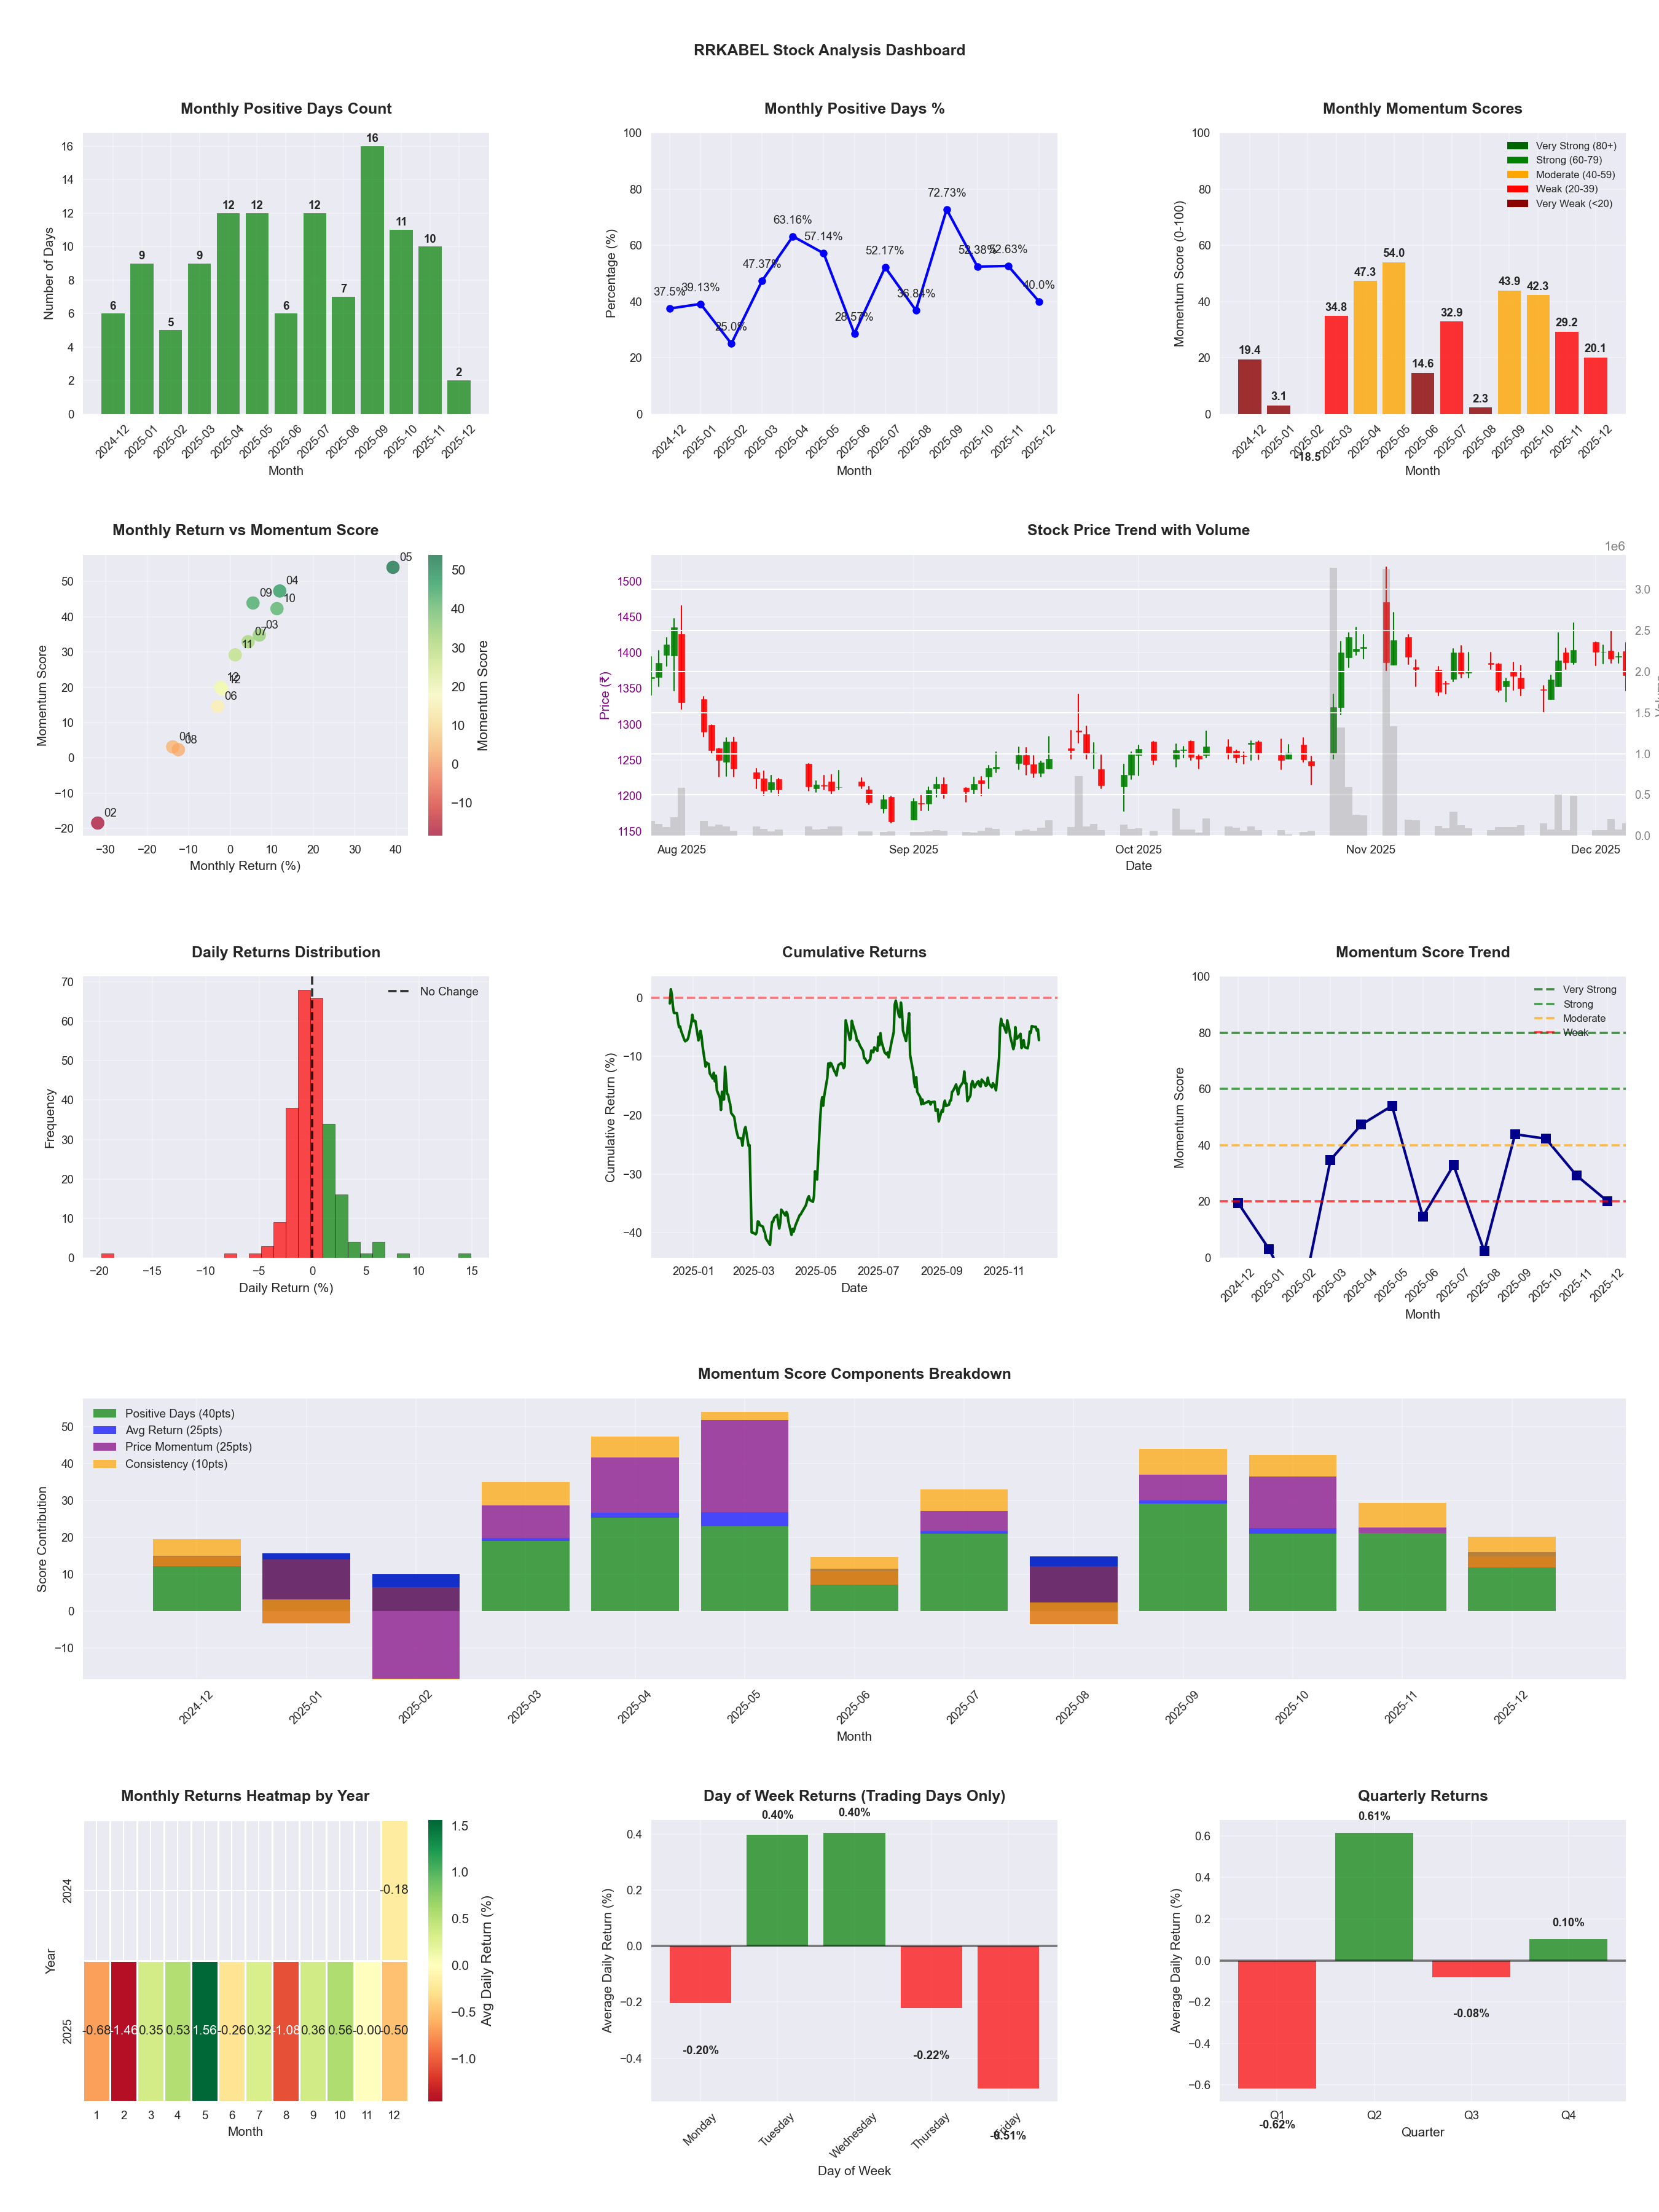
📊 Key Insights & Metrics
Symbol
📈 RRKABEL
Date
📅 2026-04-11
Volatility
🟡 2.24%
Risk Profile
⚠️ suitable for aggressive investors
Win Rate
⚠️ 51.8%
Avg Daily Return
📈 +0.20%
Max Drawdown
📉 -20.66%
IBD RS Score
📊 76.1
Strong
Market Rank
#118
Best Month
🏆 2025-04
Best Months to Trade
📅 May, Apr, Feb
Best Days to Trade
📅 Wednesday, Tuesday
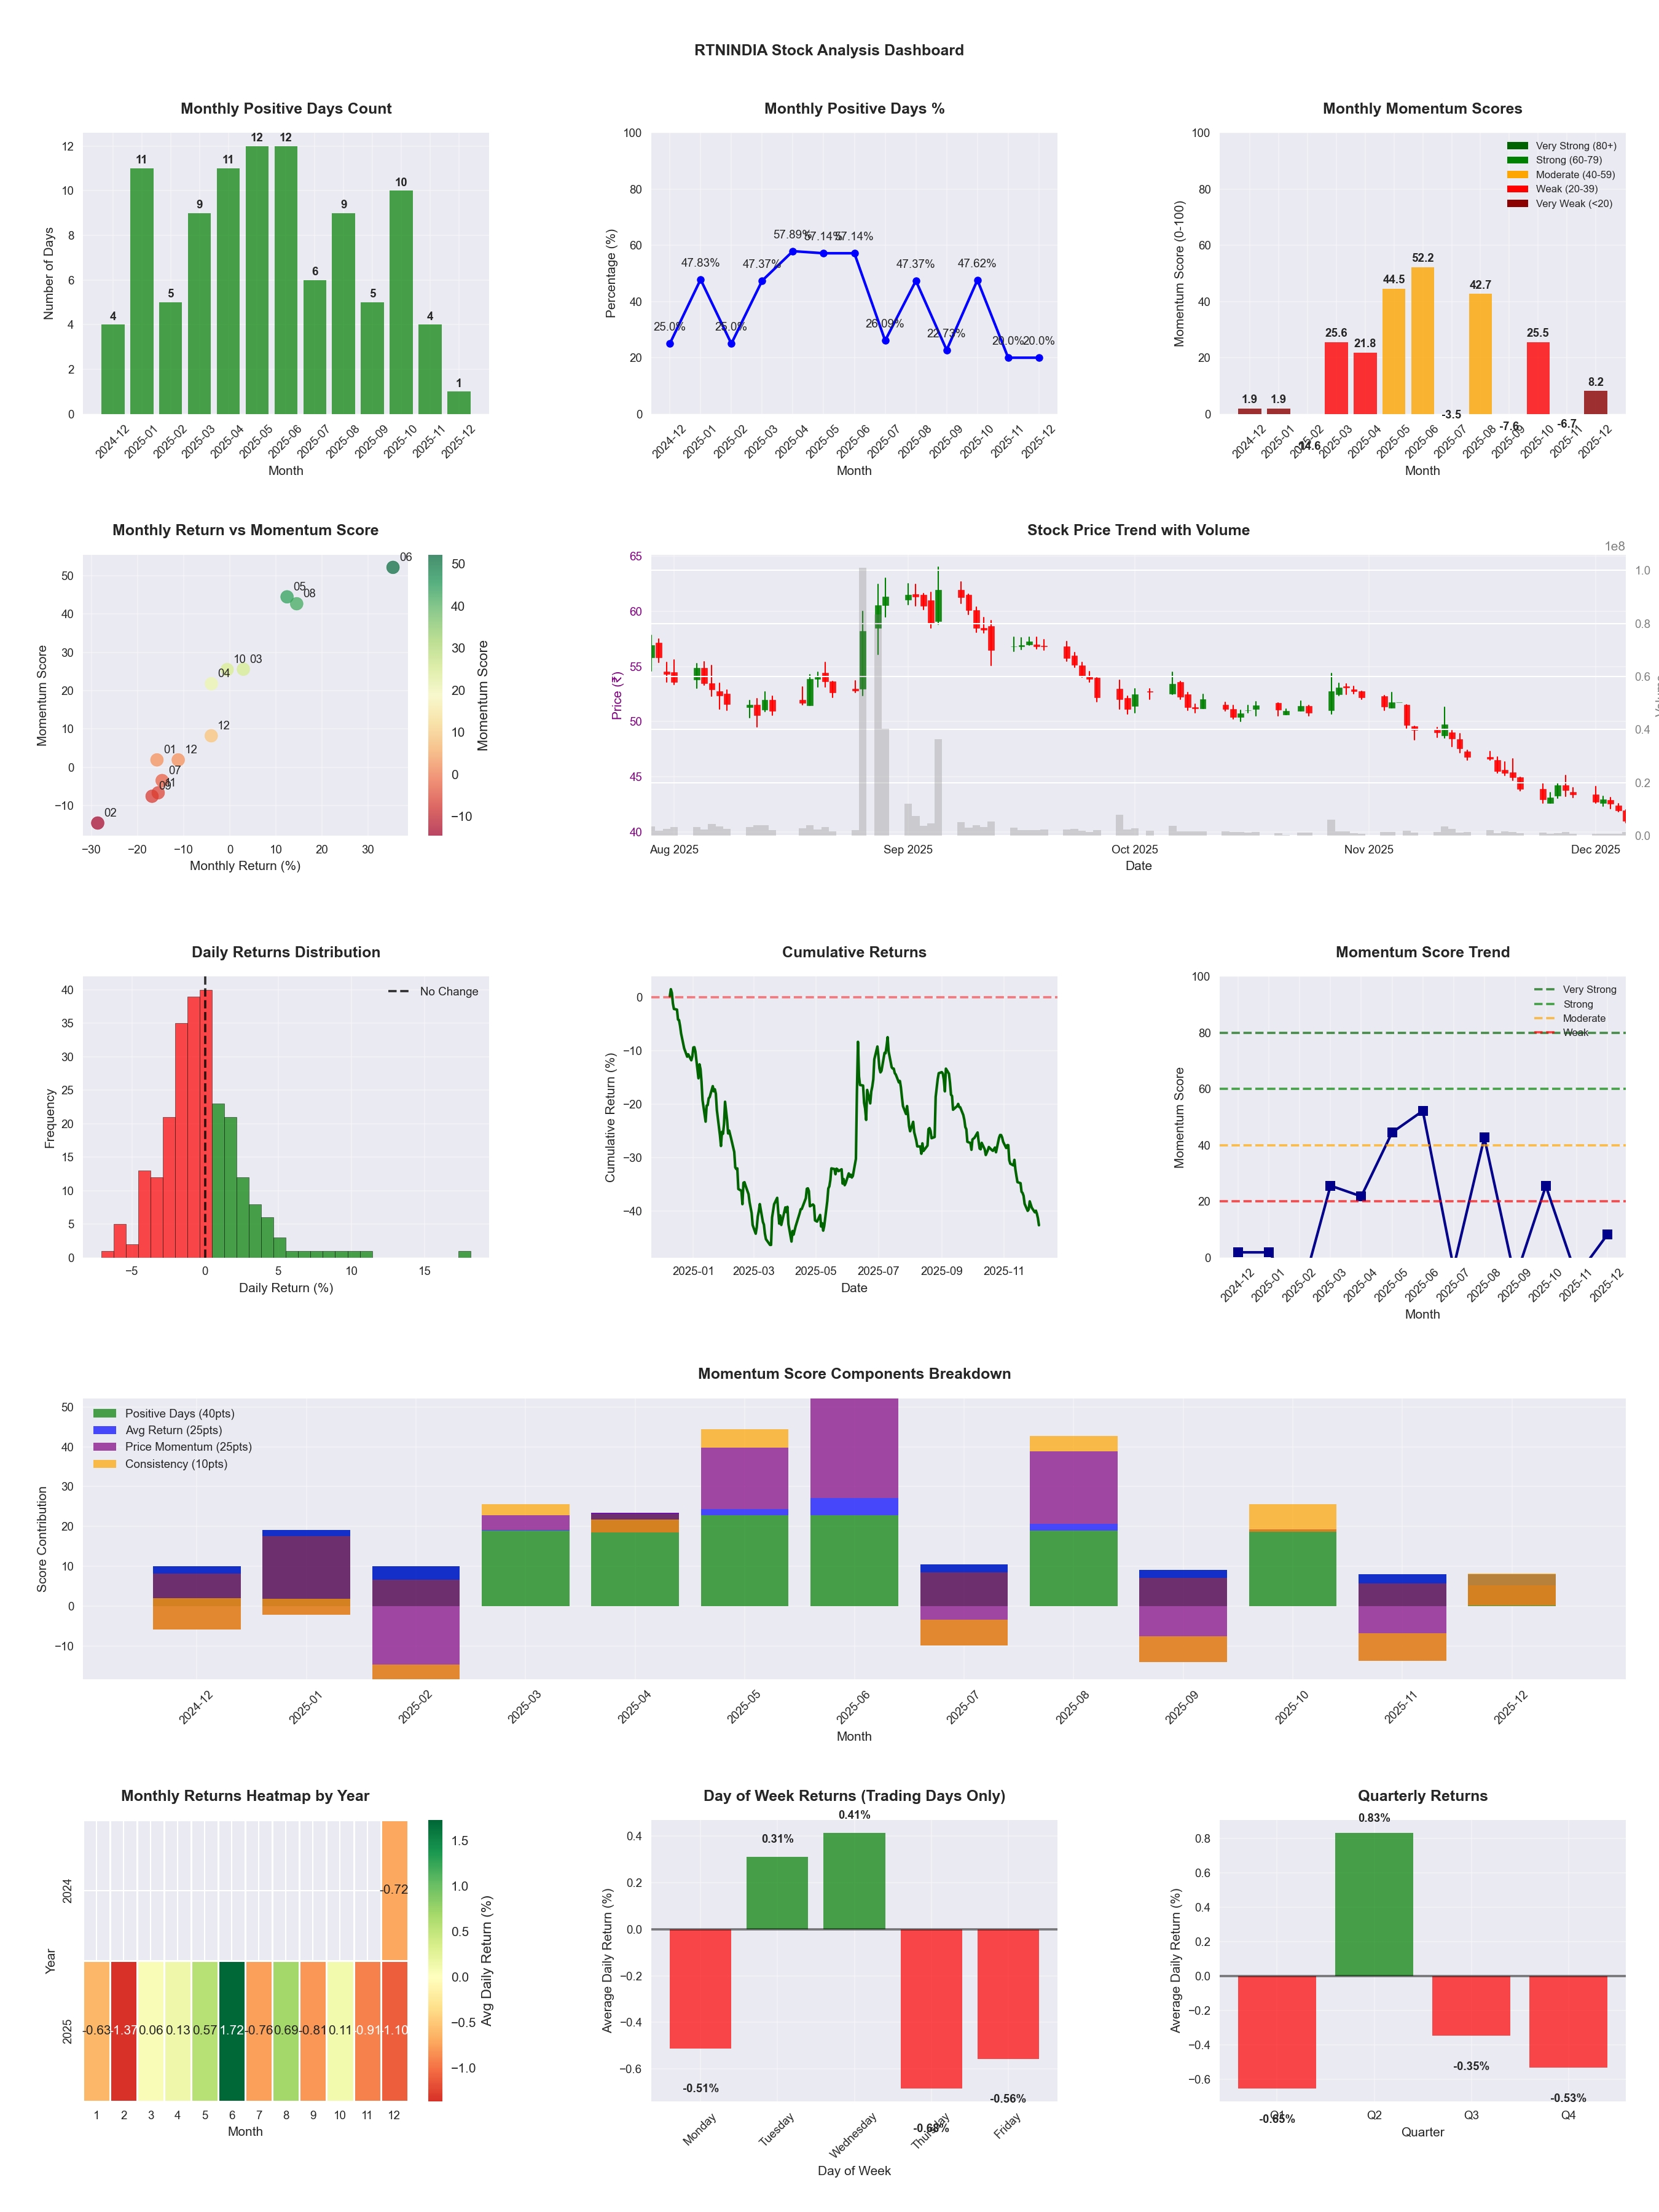
📊 Key Insights & Metrics
Symbol
📈 RTNINDIA
Date
📅 2026-03-21
Volatility
🟡 2.98%
Risk Profile
⚠️ suitable for aggressive investors
Win Rate
❌ 38.9%
Avg Daily Return
📉 -0.16%
Max Drawdown
📉 -62.50%
Best Month
🏆 2025-06
Best Months to Trade
📅 Jun, Aug, May
Best Days to Trade
📅 Tuesday, Monday
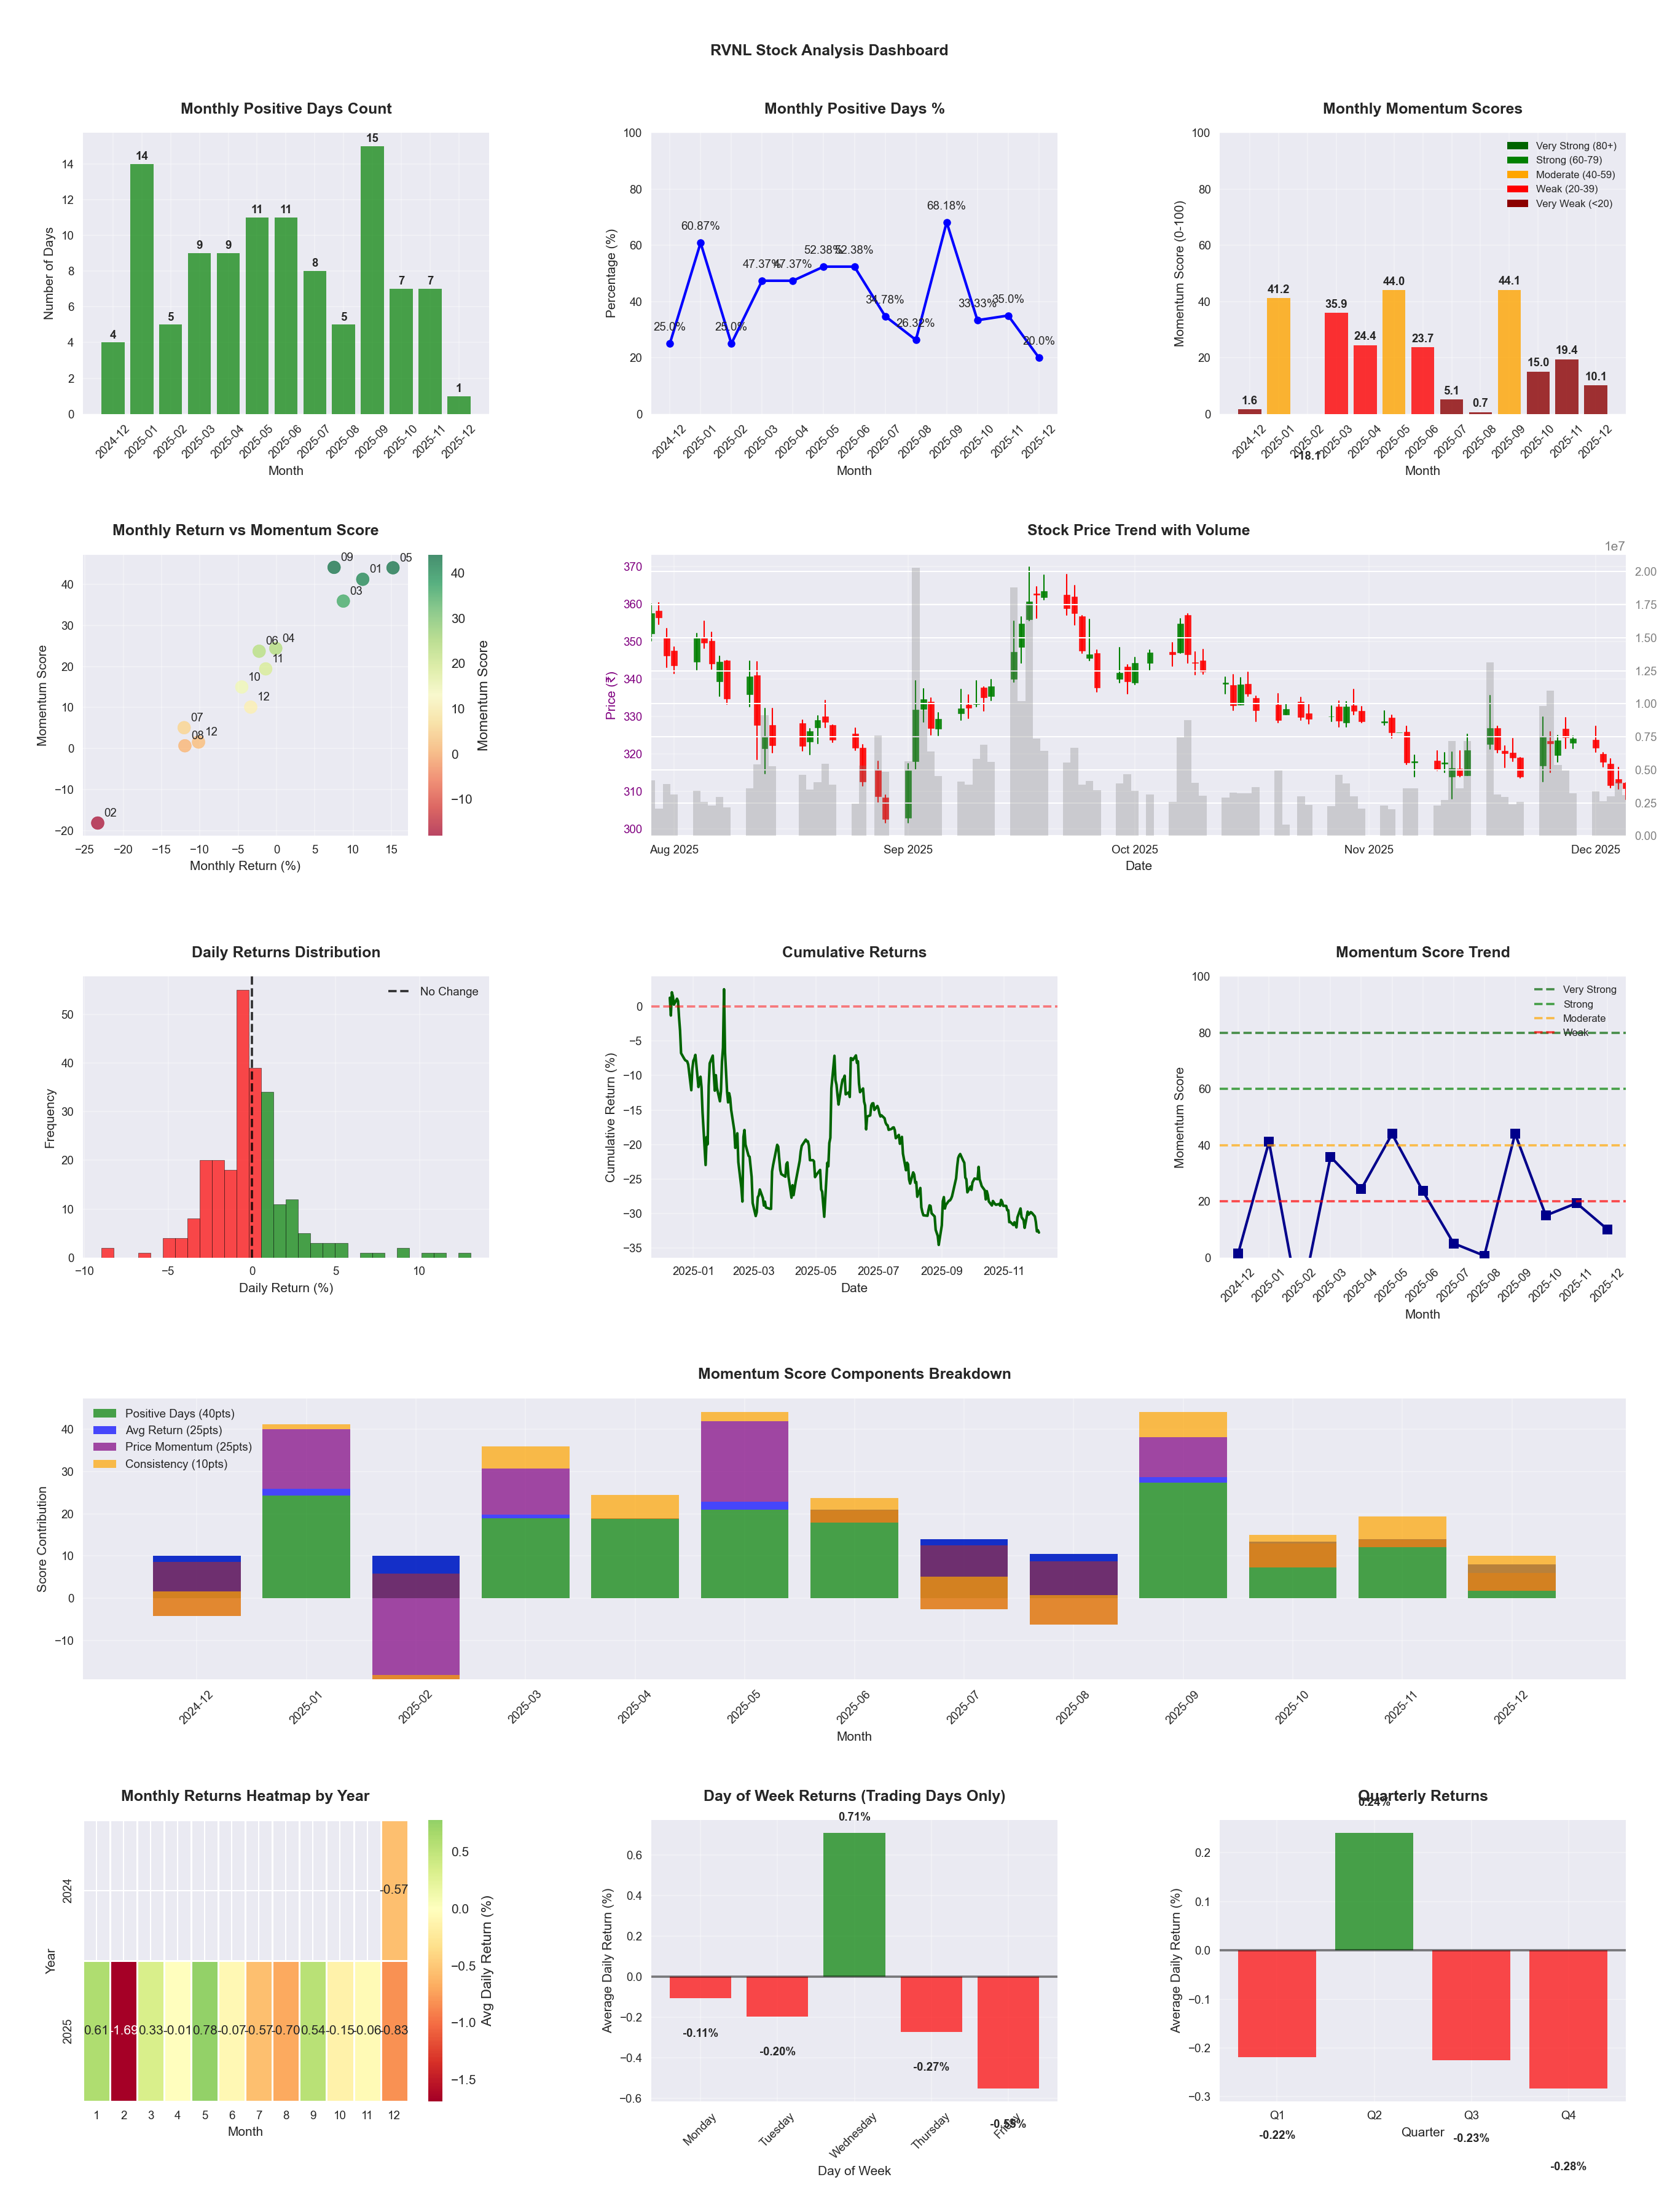
📊 Key Insights & Metrics
Symbol
📈 RVNL
Date
📅 2026-04-11
Volatility
🟡 2.37%
Risk Profile
⚠️ suitable for aggressive investors
Win Rate
⚠️ 42.7%
Avg Daily Return
📉 -0.06%
Max Drawdown
📉 -41.69%
IBD RS Score
📊 12.6
Weak
Market Rank
#431
Best Month
🏆 2025-09
Best Months to Trade
📅 May, Apr, Sep
Best Days to Trade
📅 Wednesday, Monday
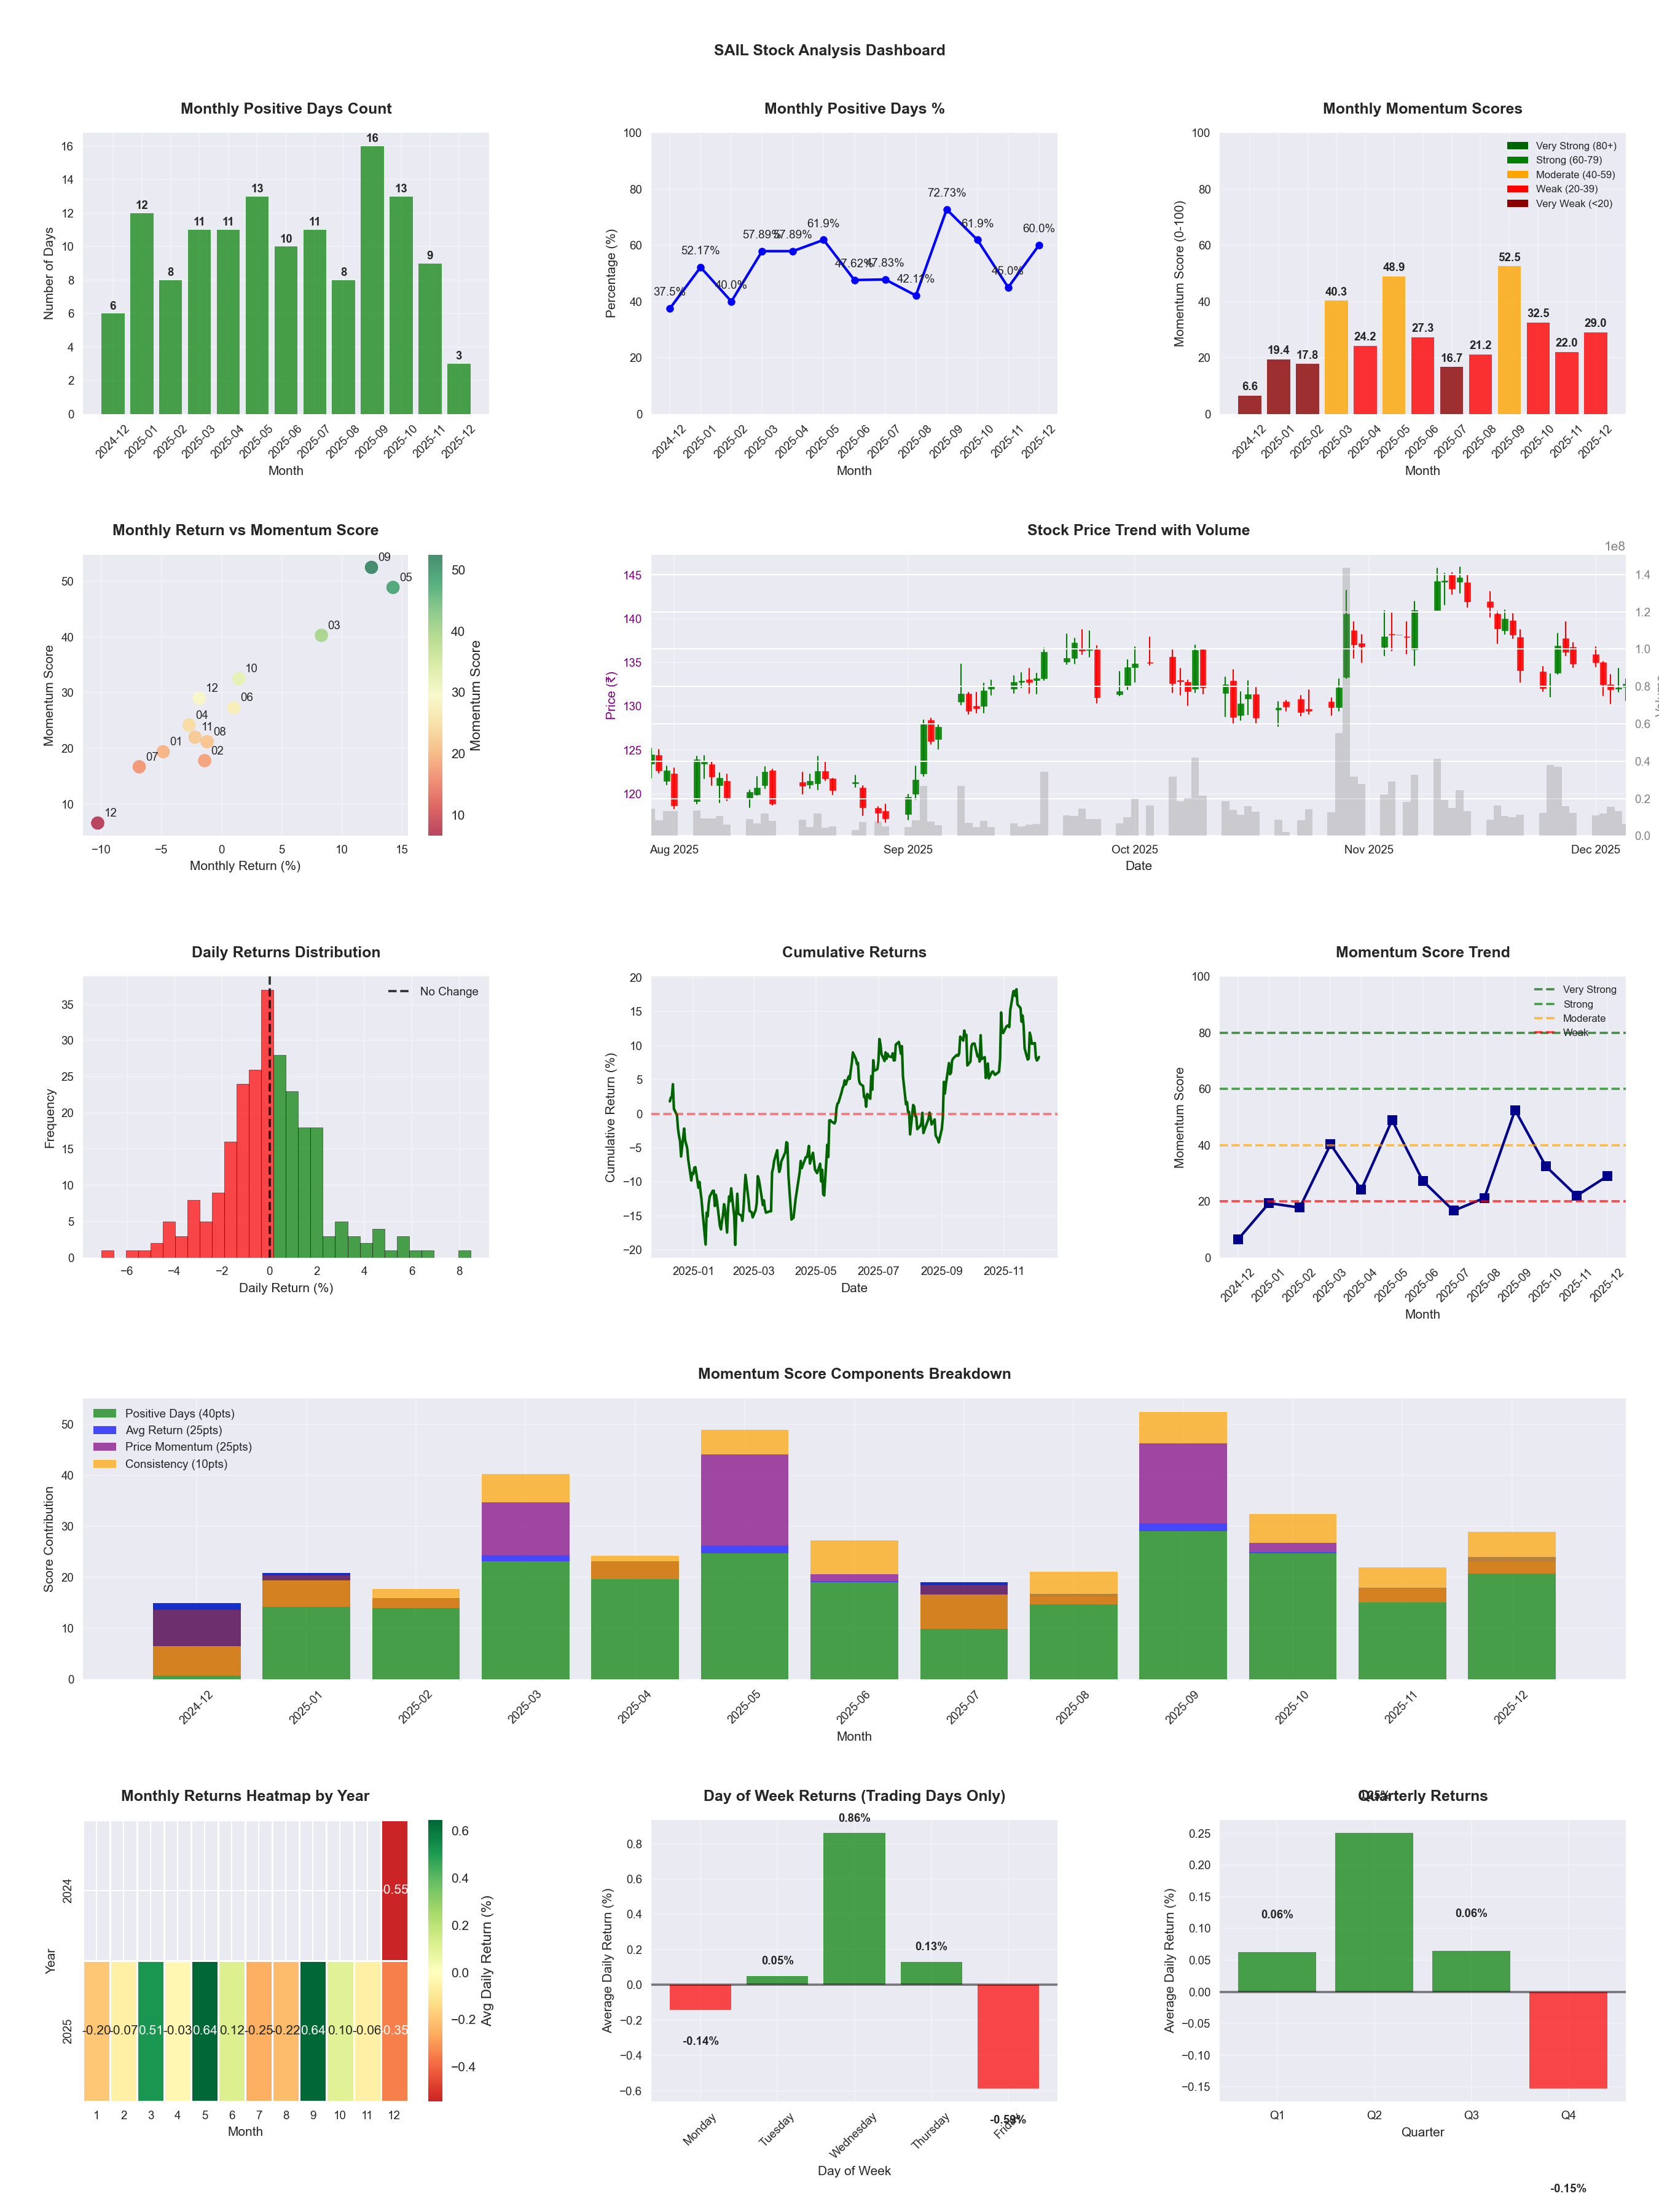
📊 Key Insights & Metrics
Symbol
📈 SAIL
Date
📅 2026-04-11
Volatility
🟡 2.10%
Risk Profile
⚠️ suitable for aggressive investors
Win Rate
⚠️ 55.7%
Avg Daily Return
📈 +0.20%
Max Drawdown
📉 -13.69%
IBD RS Score
📊 92.3
Leader
Market Rank
#38
Best Month
🏆 2025-09
Worst Month
📉 2026-03
Best Months to Trade
📅 Apr, Sep, May
Best Days to Trade
📅 Wednesday, Monday
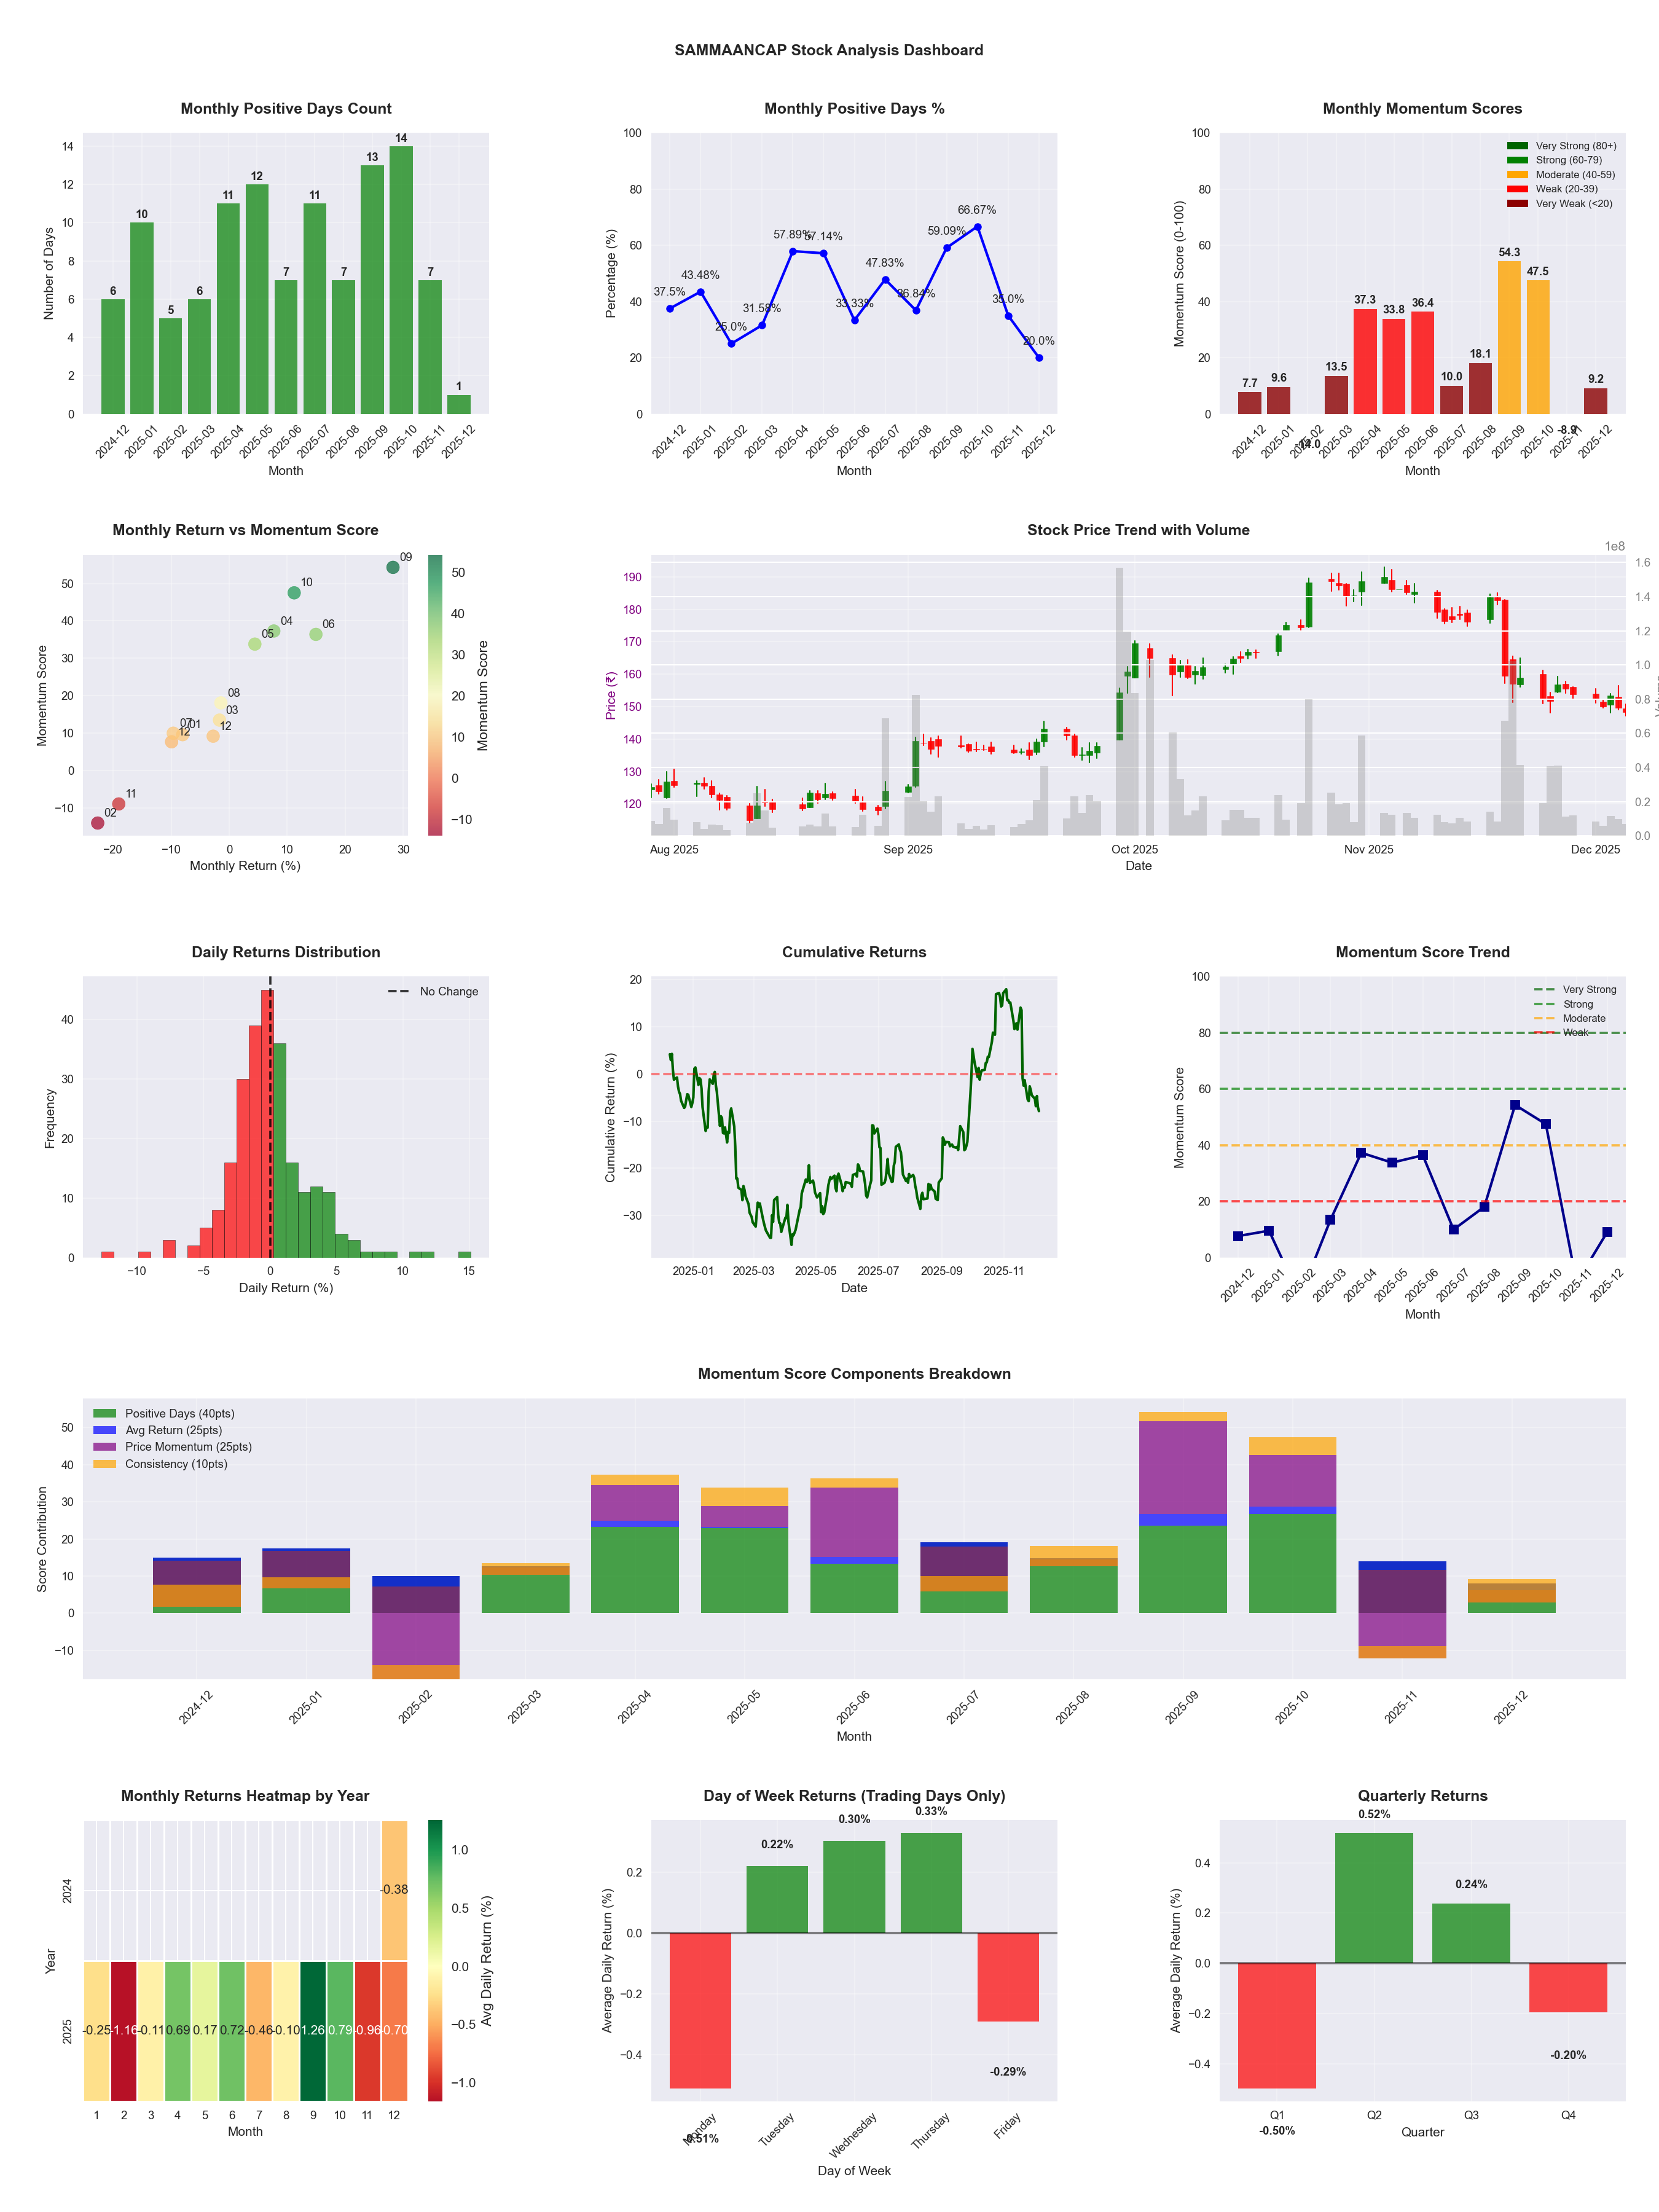
📊 Key Insights & Metrics
Symbol
📈 SAMMAANCAP
Date
📅 2026-04-11
Volatility
🟡 2.81%
Risk Profile
⚠️ suitable for aggressive investors
Win Rate
⚠️ 50.0%
Avg Daily Return
📈 +0.19%
Max Drawdown
📉 -31.55%
IBD RS Score
📊 81.5
Strong
Market Rank
#91
Best Month
🏆 2025-09
Best Months to Trade
📅 Sep, Apr, Oct
Best Days to Trade
📅 Wednesday, Tuesday
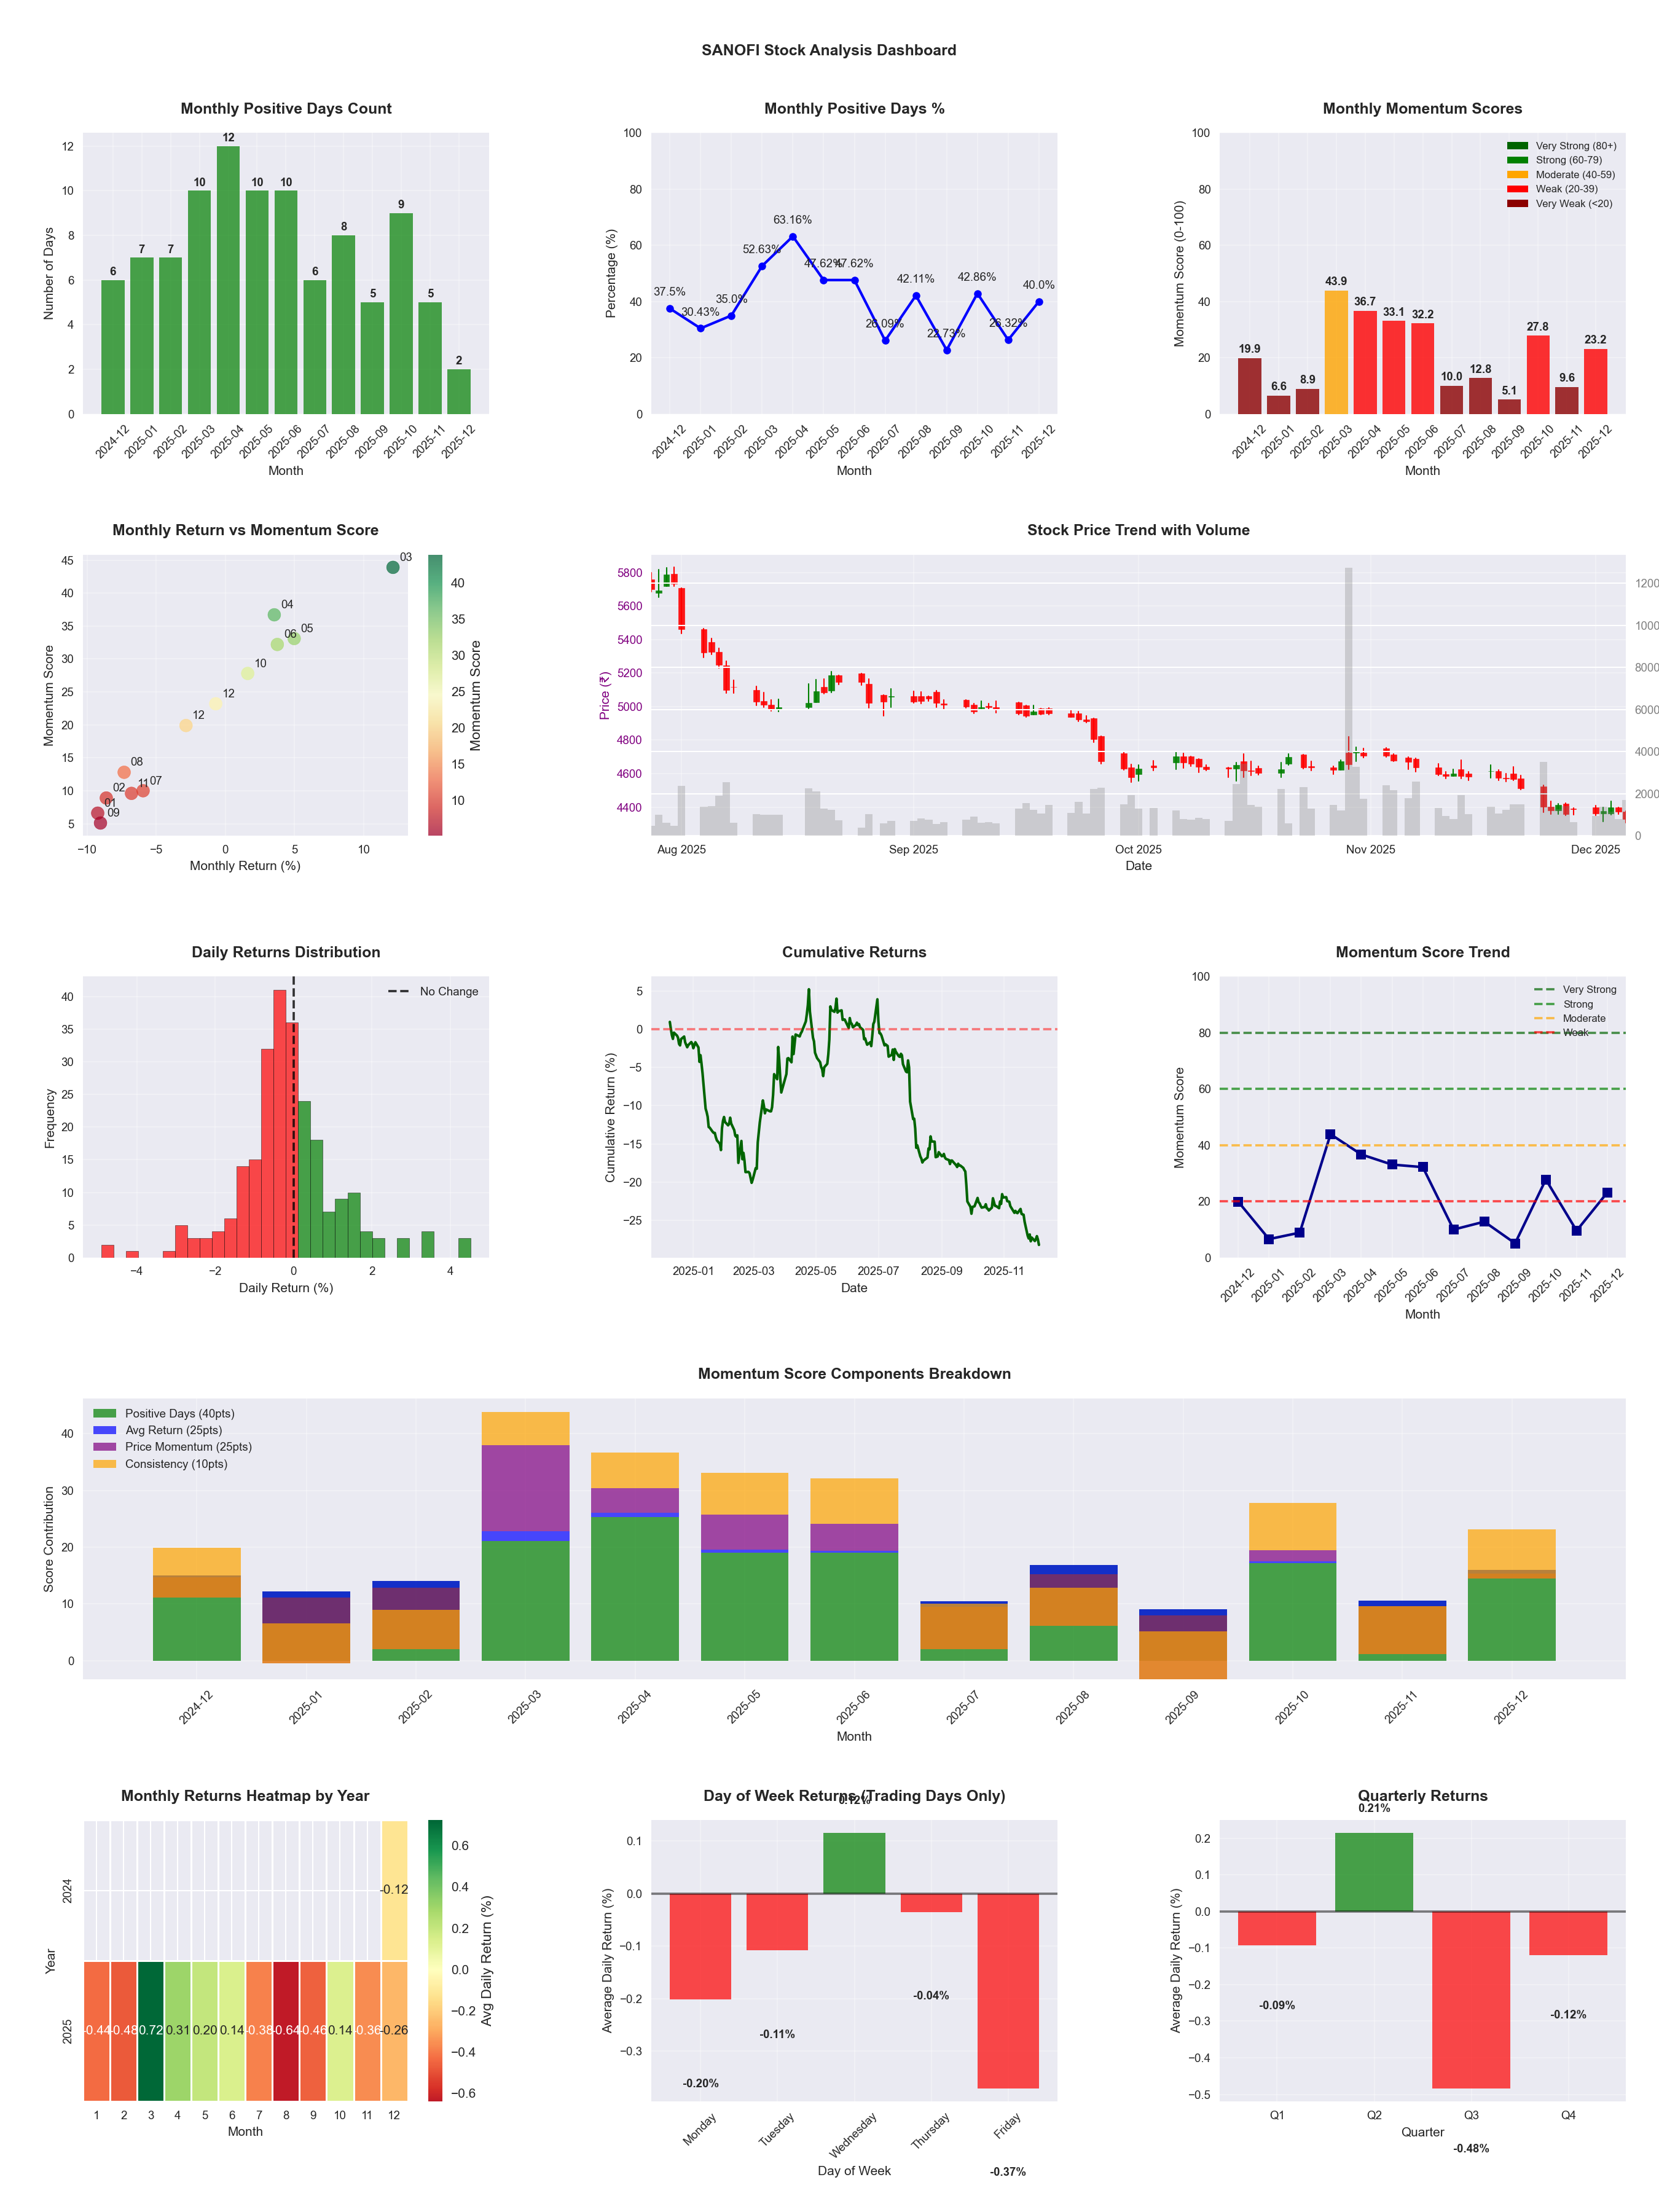
📊 Key Insights & Metrics
Symbol
📈 SANOFI
Date
📅 2026-03-21
Volatility
🟢 1.24%
Win Rate
❌ 37.4%
Avg Daily Return
📉 -0.20%
Max Drawdown
📉 -46.68%
Best Month
🏆 2025-04
Best Months to Trade
📅 Apr, May, Jun
Best Days to Trade
📅 Tuesday, Wednesday
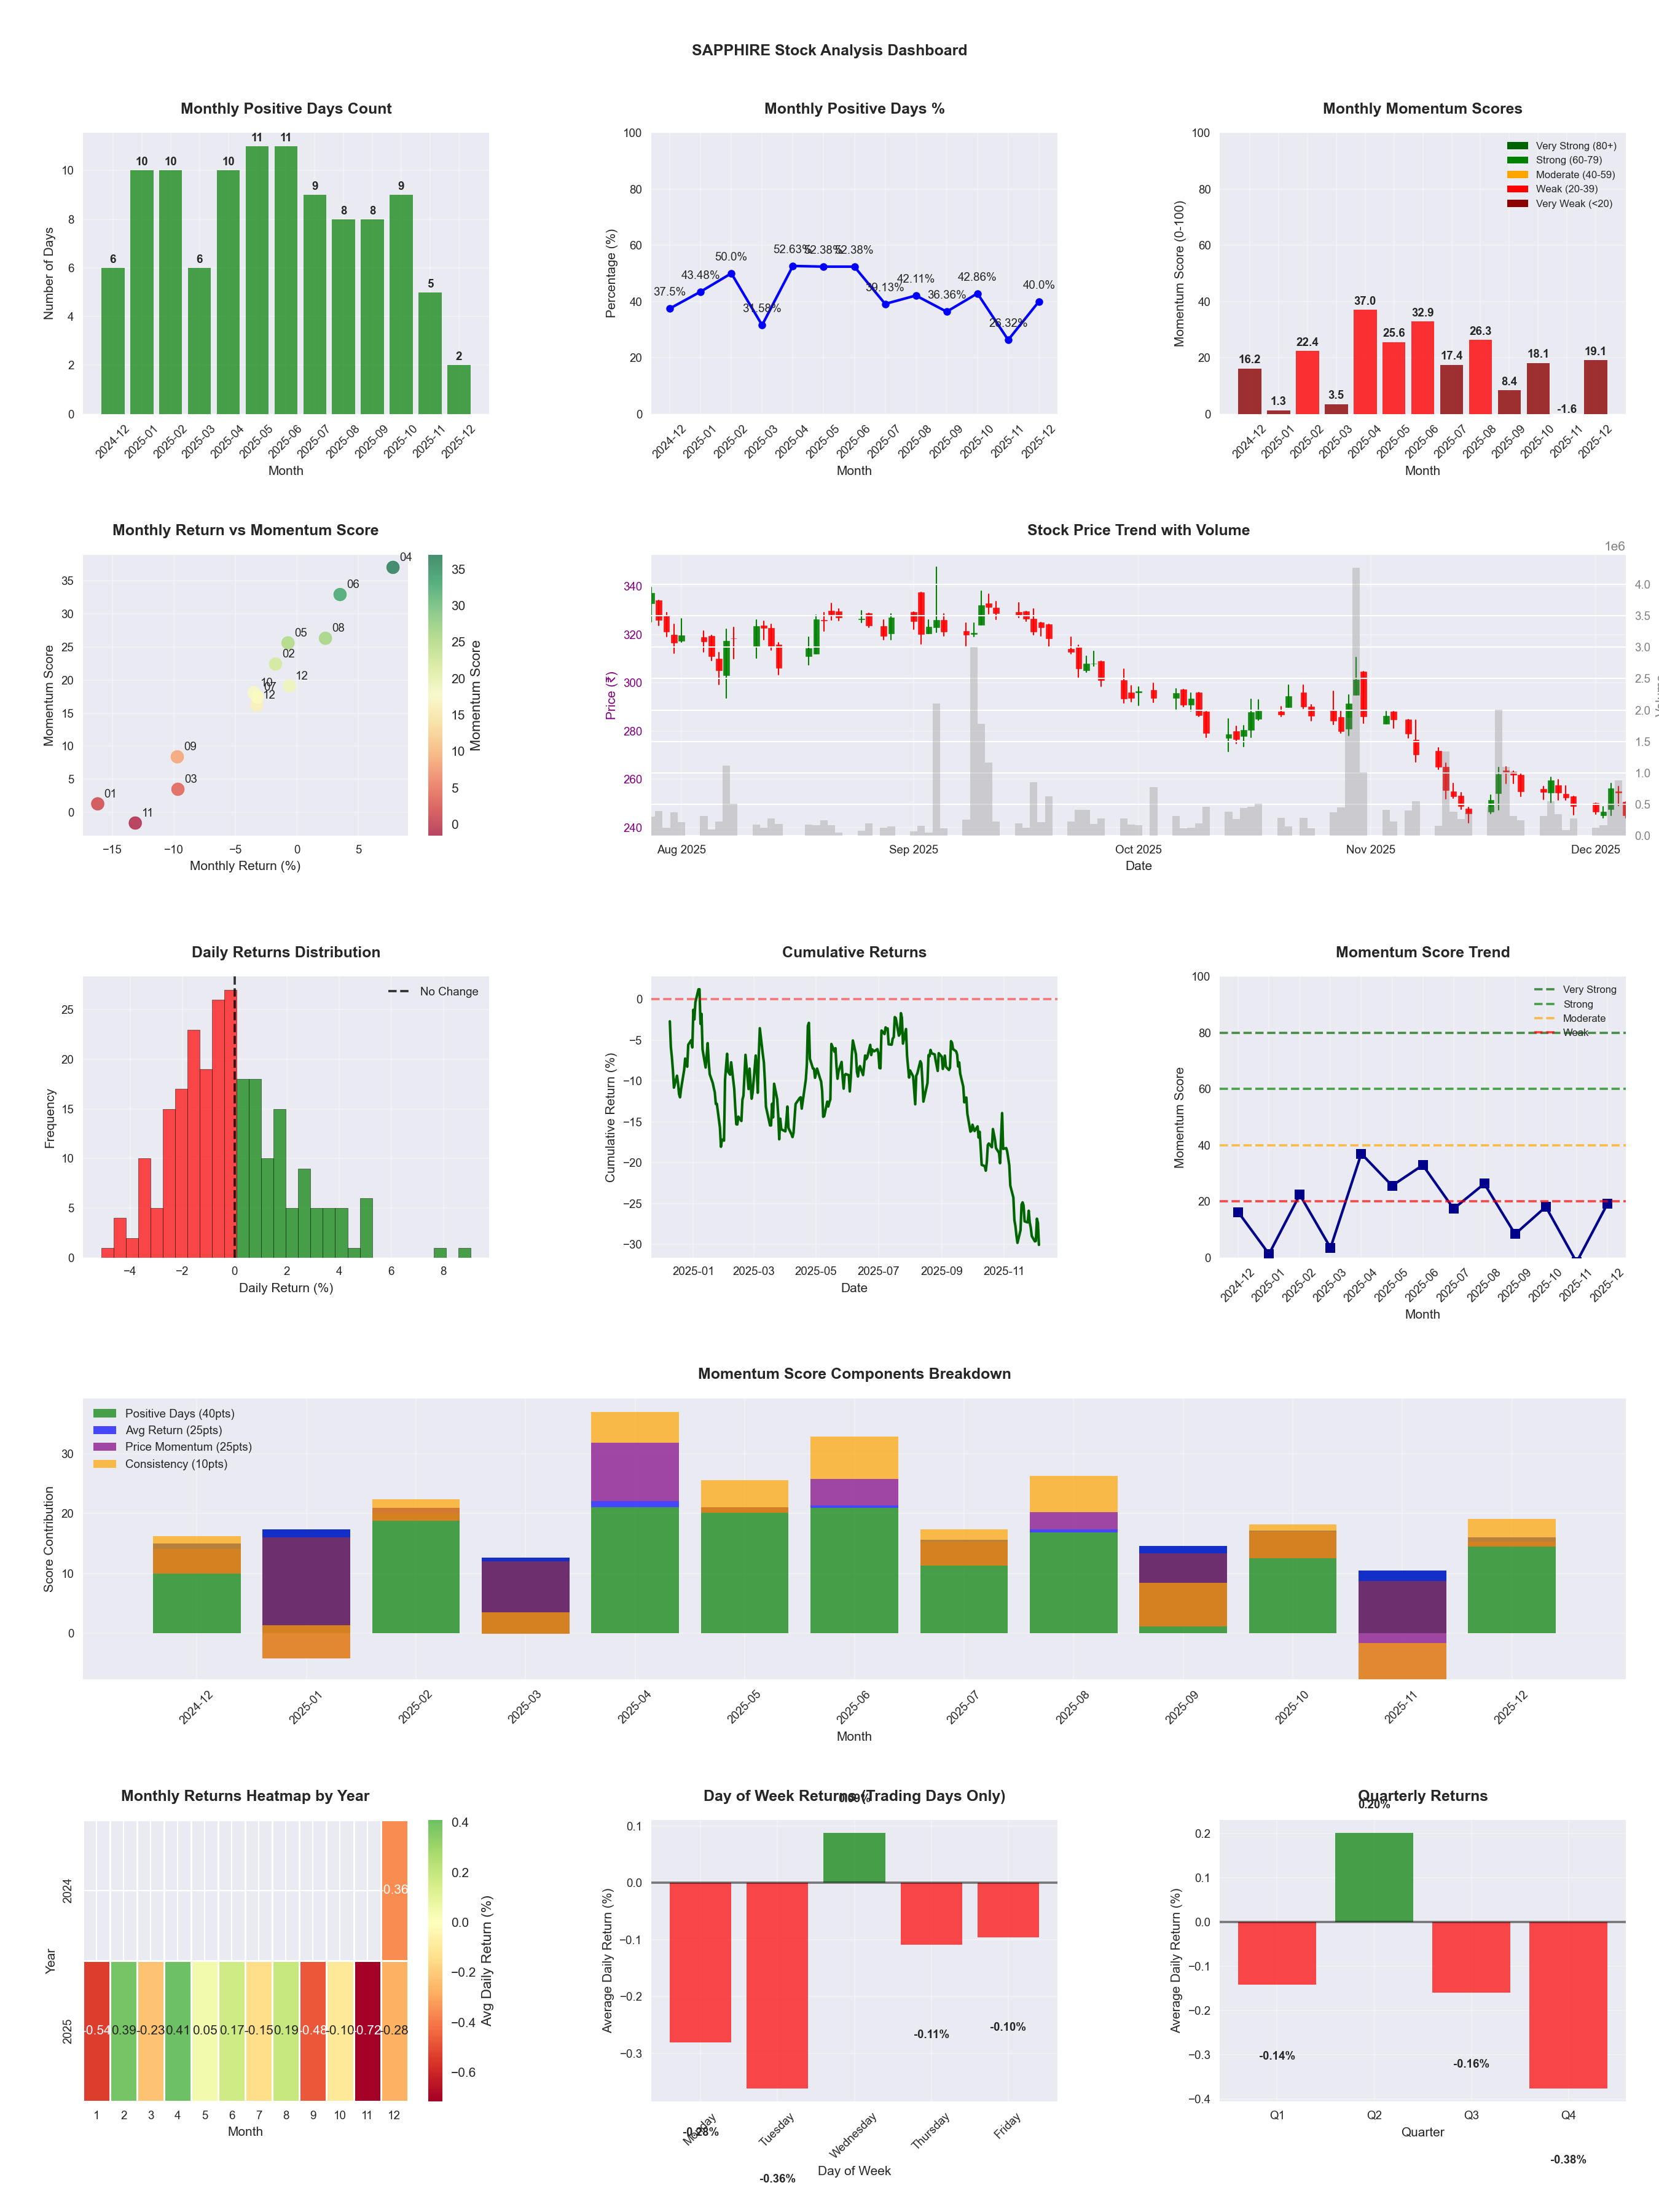
📊 Key Insights & Metrics
Symbol
📈 SAPPHIRE
Date
📅 2026-04-11
Volatility
🟡 2.39%
Risk Profile
⚠️ suitable for aggressive investors
Win Rate
⚠️ 41.5%
Avg Daily Return
📉 -0.21%
Max Drawdown
📉 -56.30%
IBD RS Score
📊 2.0
Weak
Market Rank
#483
Best Month
🏆 2026-04
Best Months to Trade
📅 Apr, Feb, Aug
Best Days to Trade
📅 Wednesday, Tuesday
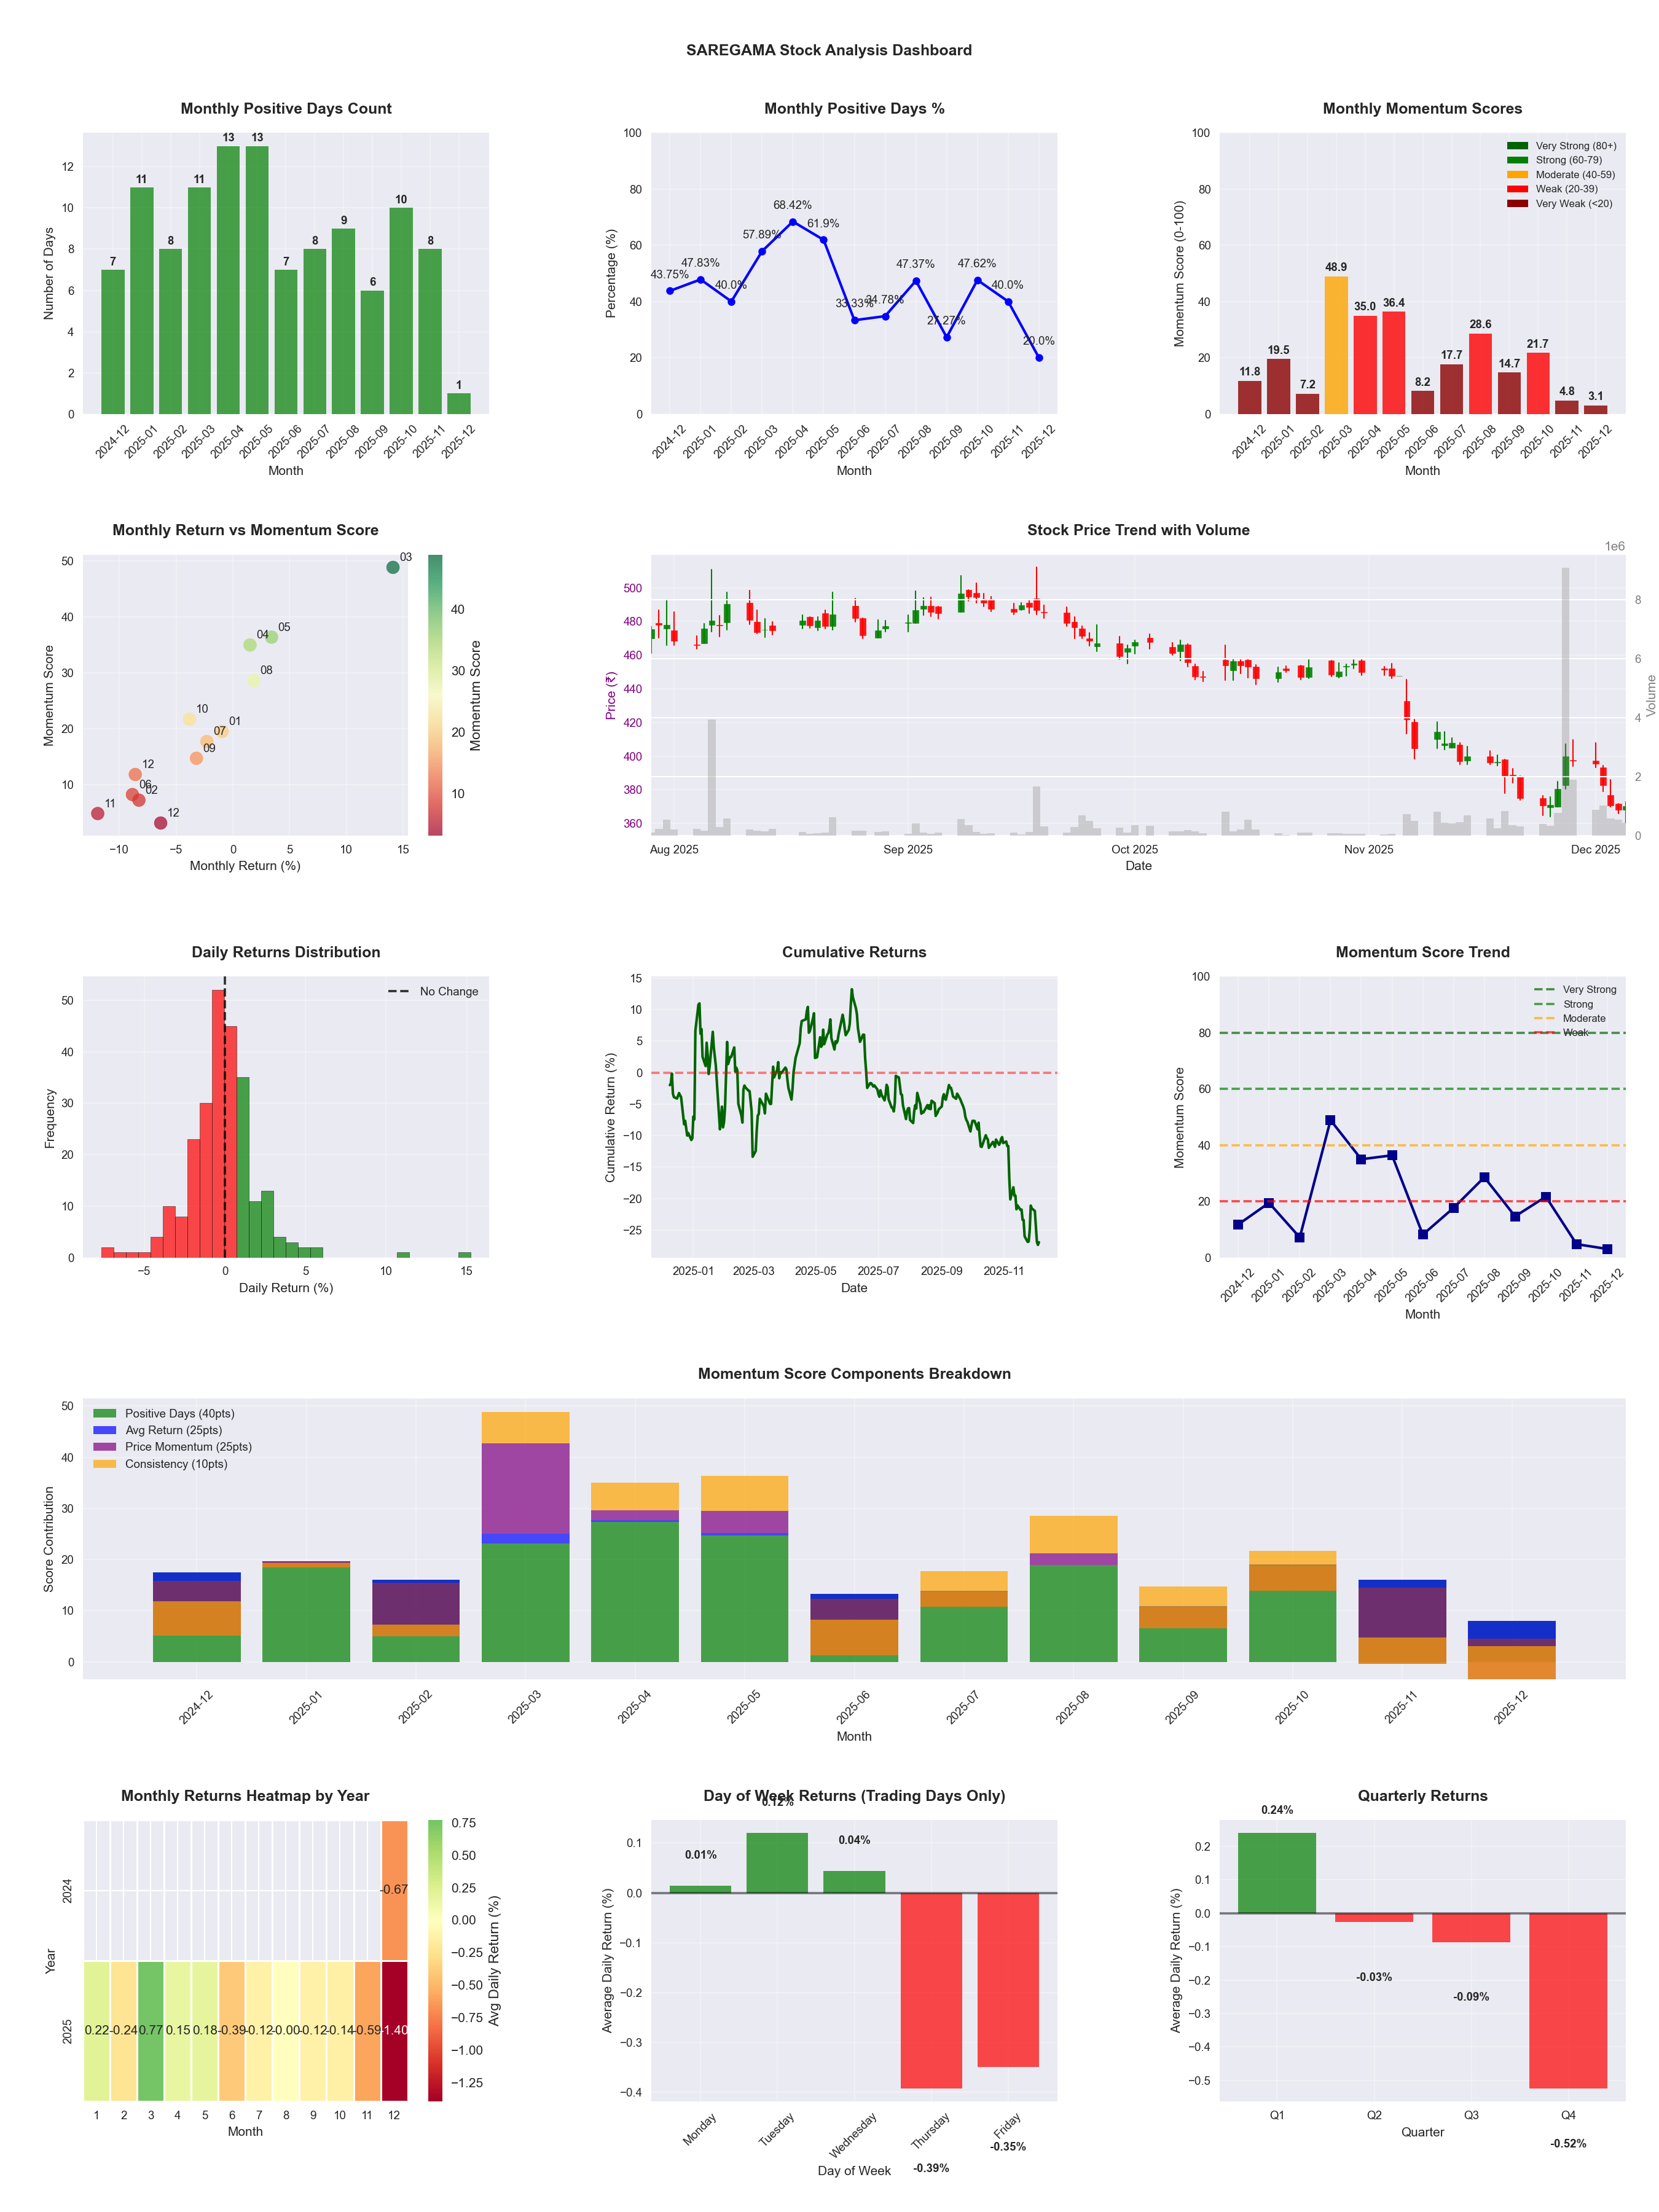
📊 Key Insights & Metrics
Symbol
📈 SAREGAMA
Date
📅 2026-04-11
Volatility
🟡 2.04%
Risk Profile
⚠️ suitable for aggressive investors
Win Rate
⚠️ 42.9%
Avg Daily Return
📉 -0.16%
Max Drawdown
📉 -45.77%
IBD RS Score
📊 9.3
Weak
Market Rank
#447
Best Month
🏆 2025-05
Worst Month
📉 2025-12
Best Months to Trade
📅 Apr, May, Aug
Best Days to Trade
📅 Wednesday, Monday
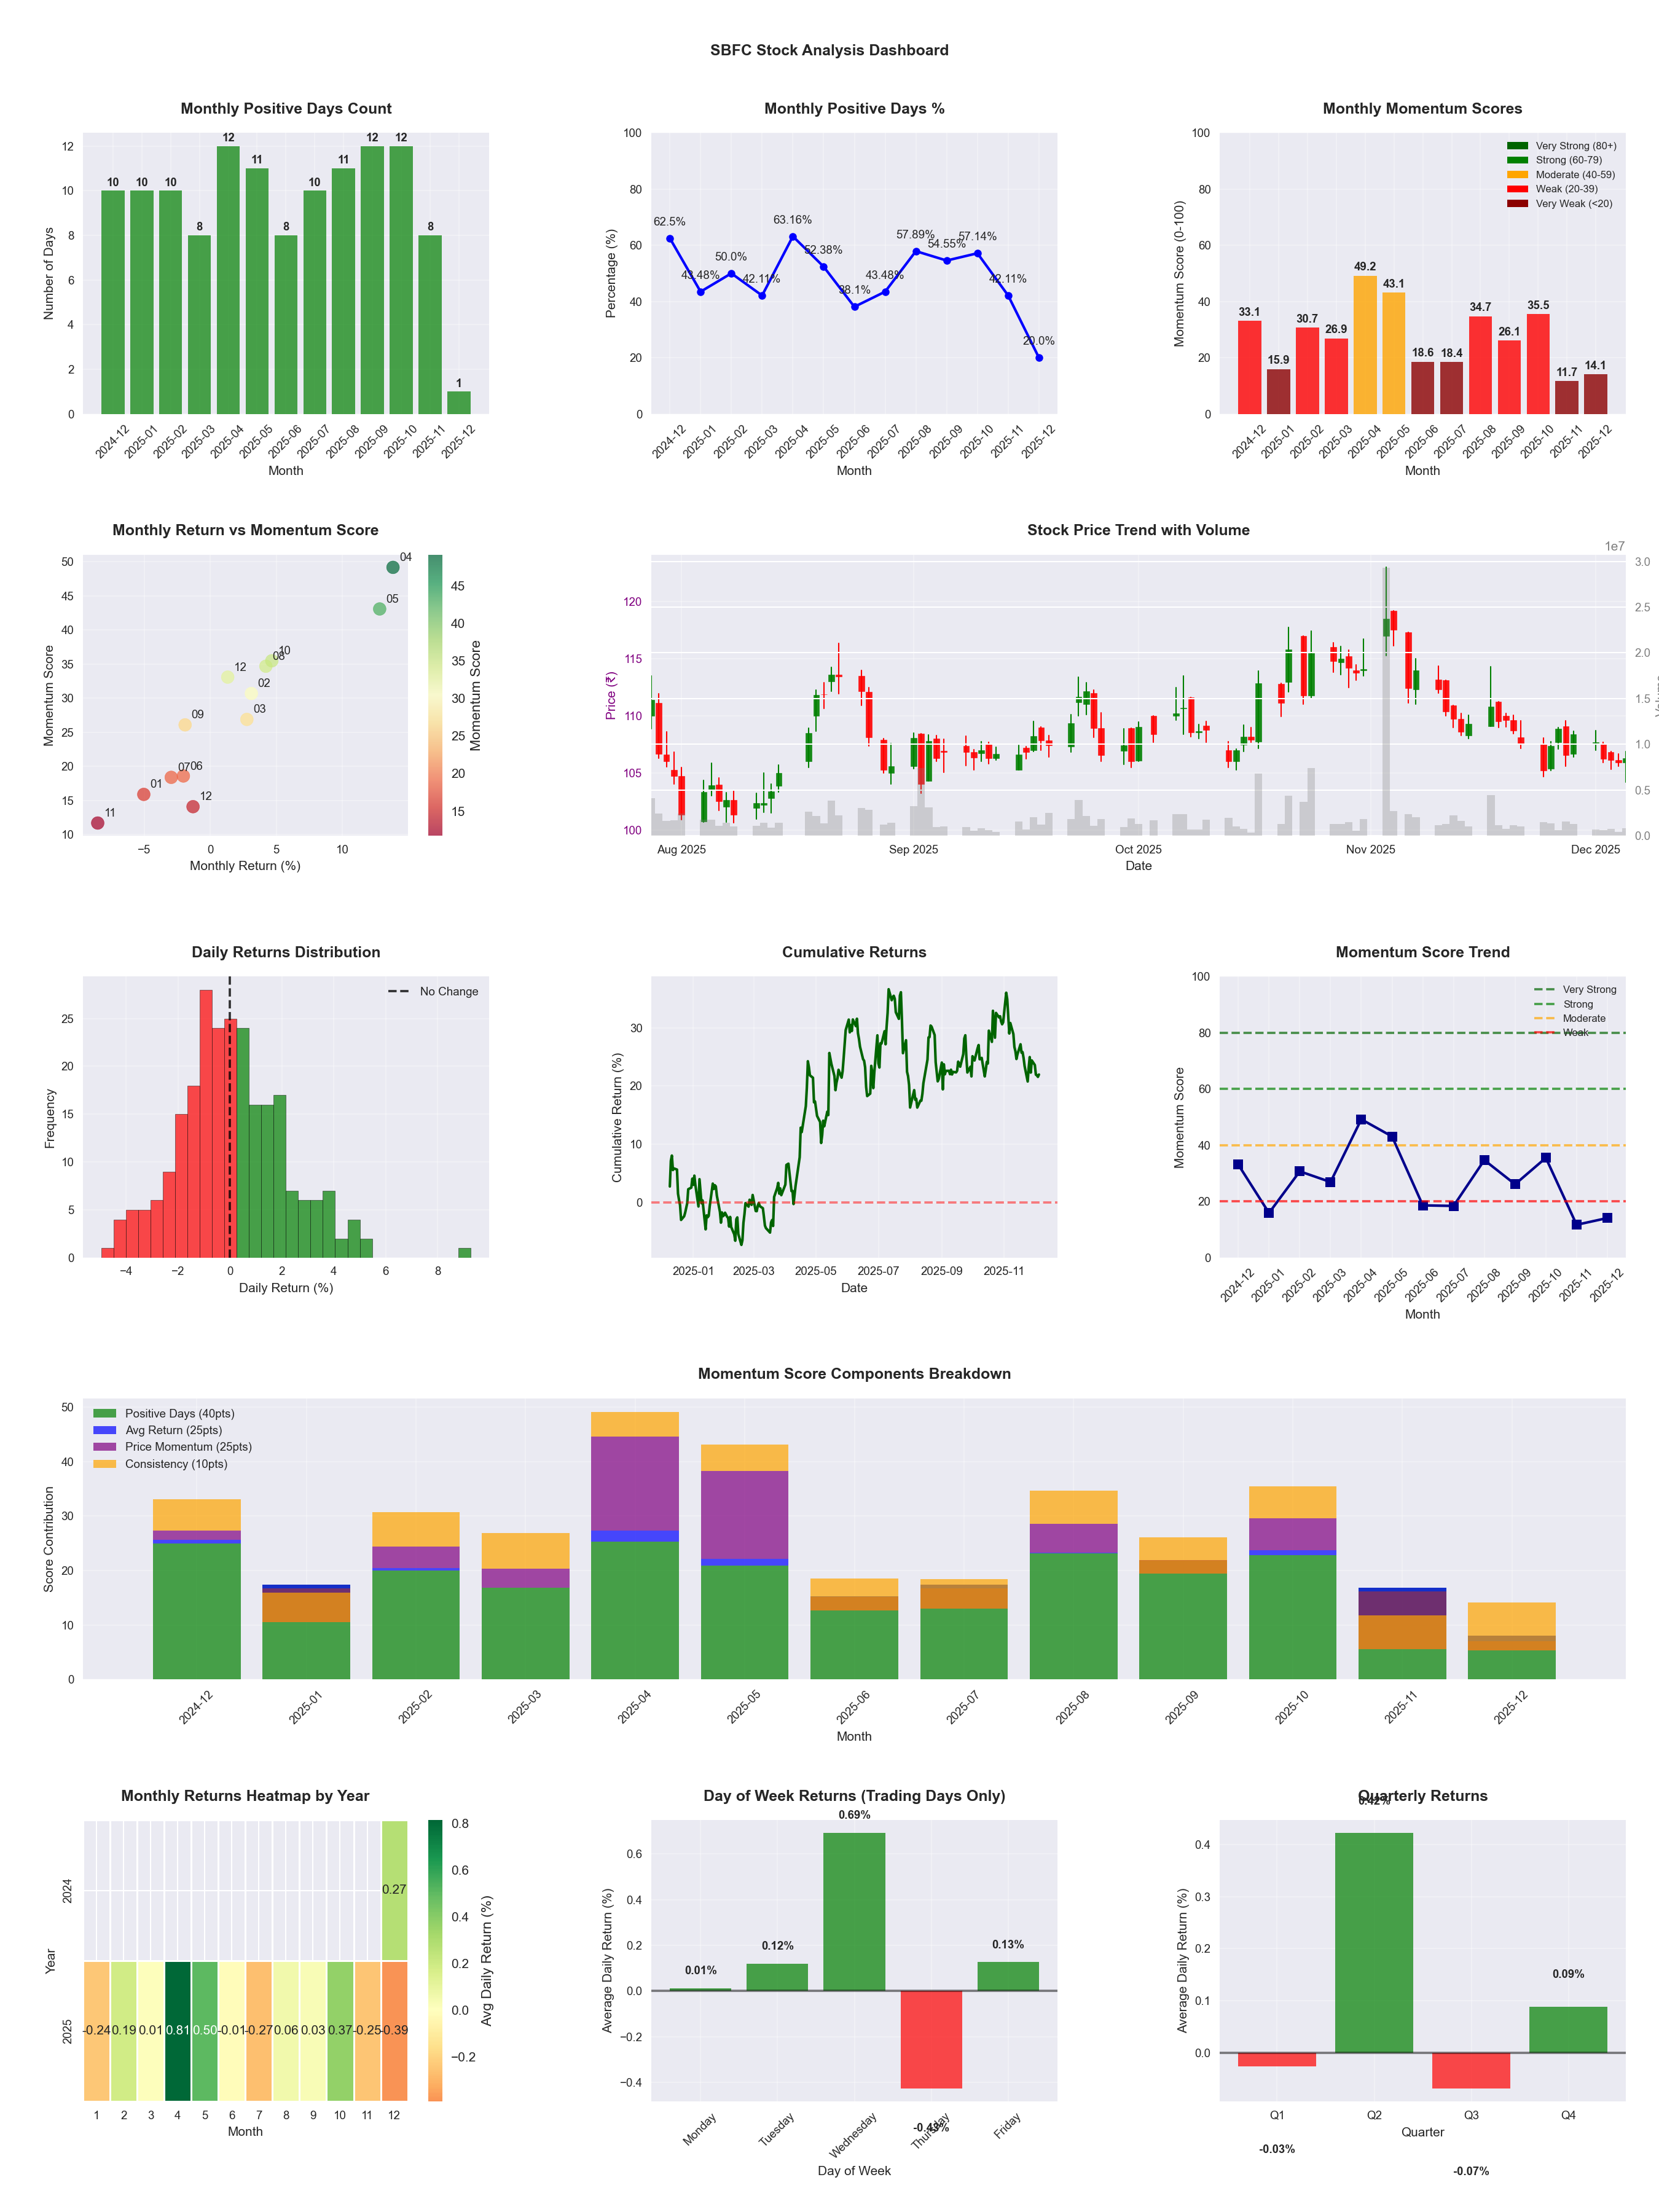
📊 Key Insights & Metrics
Symbol
📈 SBFC
Date
📅 2026-04-11
Volatility
🟡 2.19%
Risk Profile
⚠️ suitable for aggressive investors
Win Rate
⚠️ 49.0%
Avg Daily Return
📈 +0.04%
Max Drawdown
📉 -31.99%
IBD RS Score
📊 32.5
Weak
Market Rank
#333
Best Month
🏆 2026-04
Best Months to Trade
📅 Apr, May, Feb
Best Days to Trade
📅 Wednesday, Monday
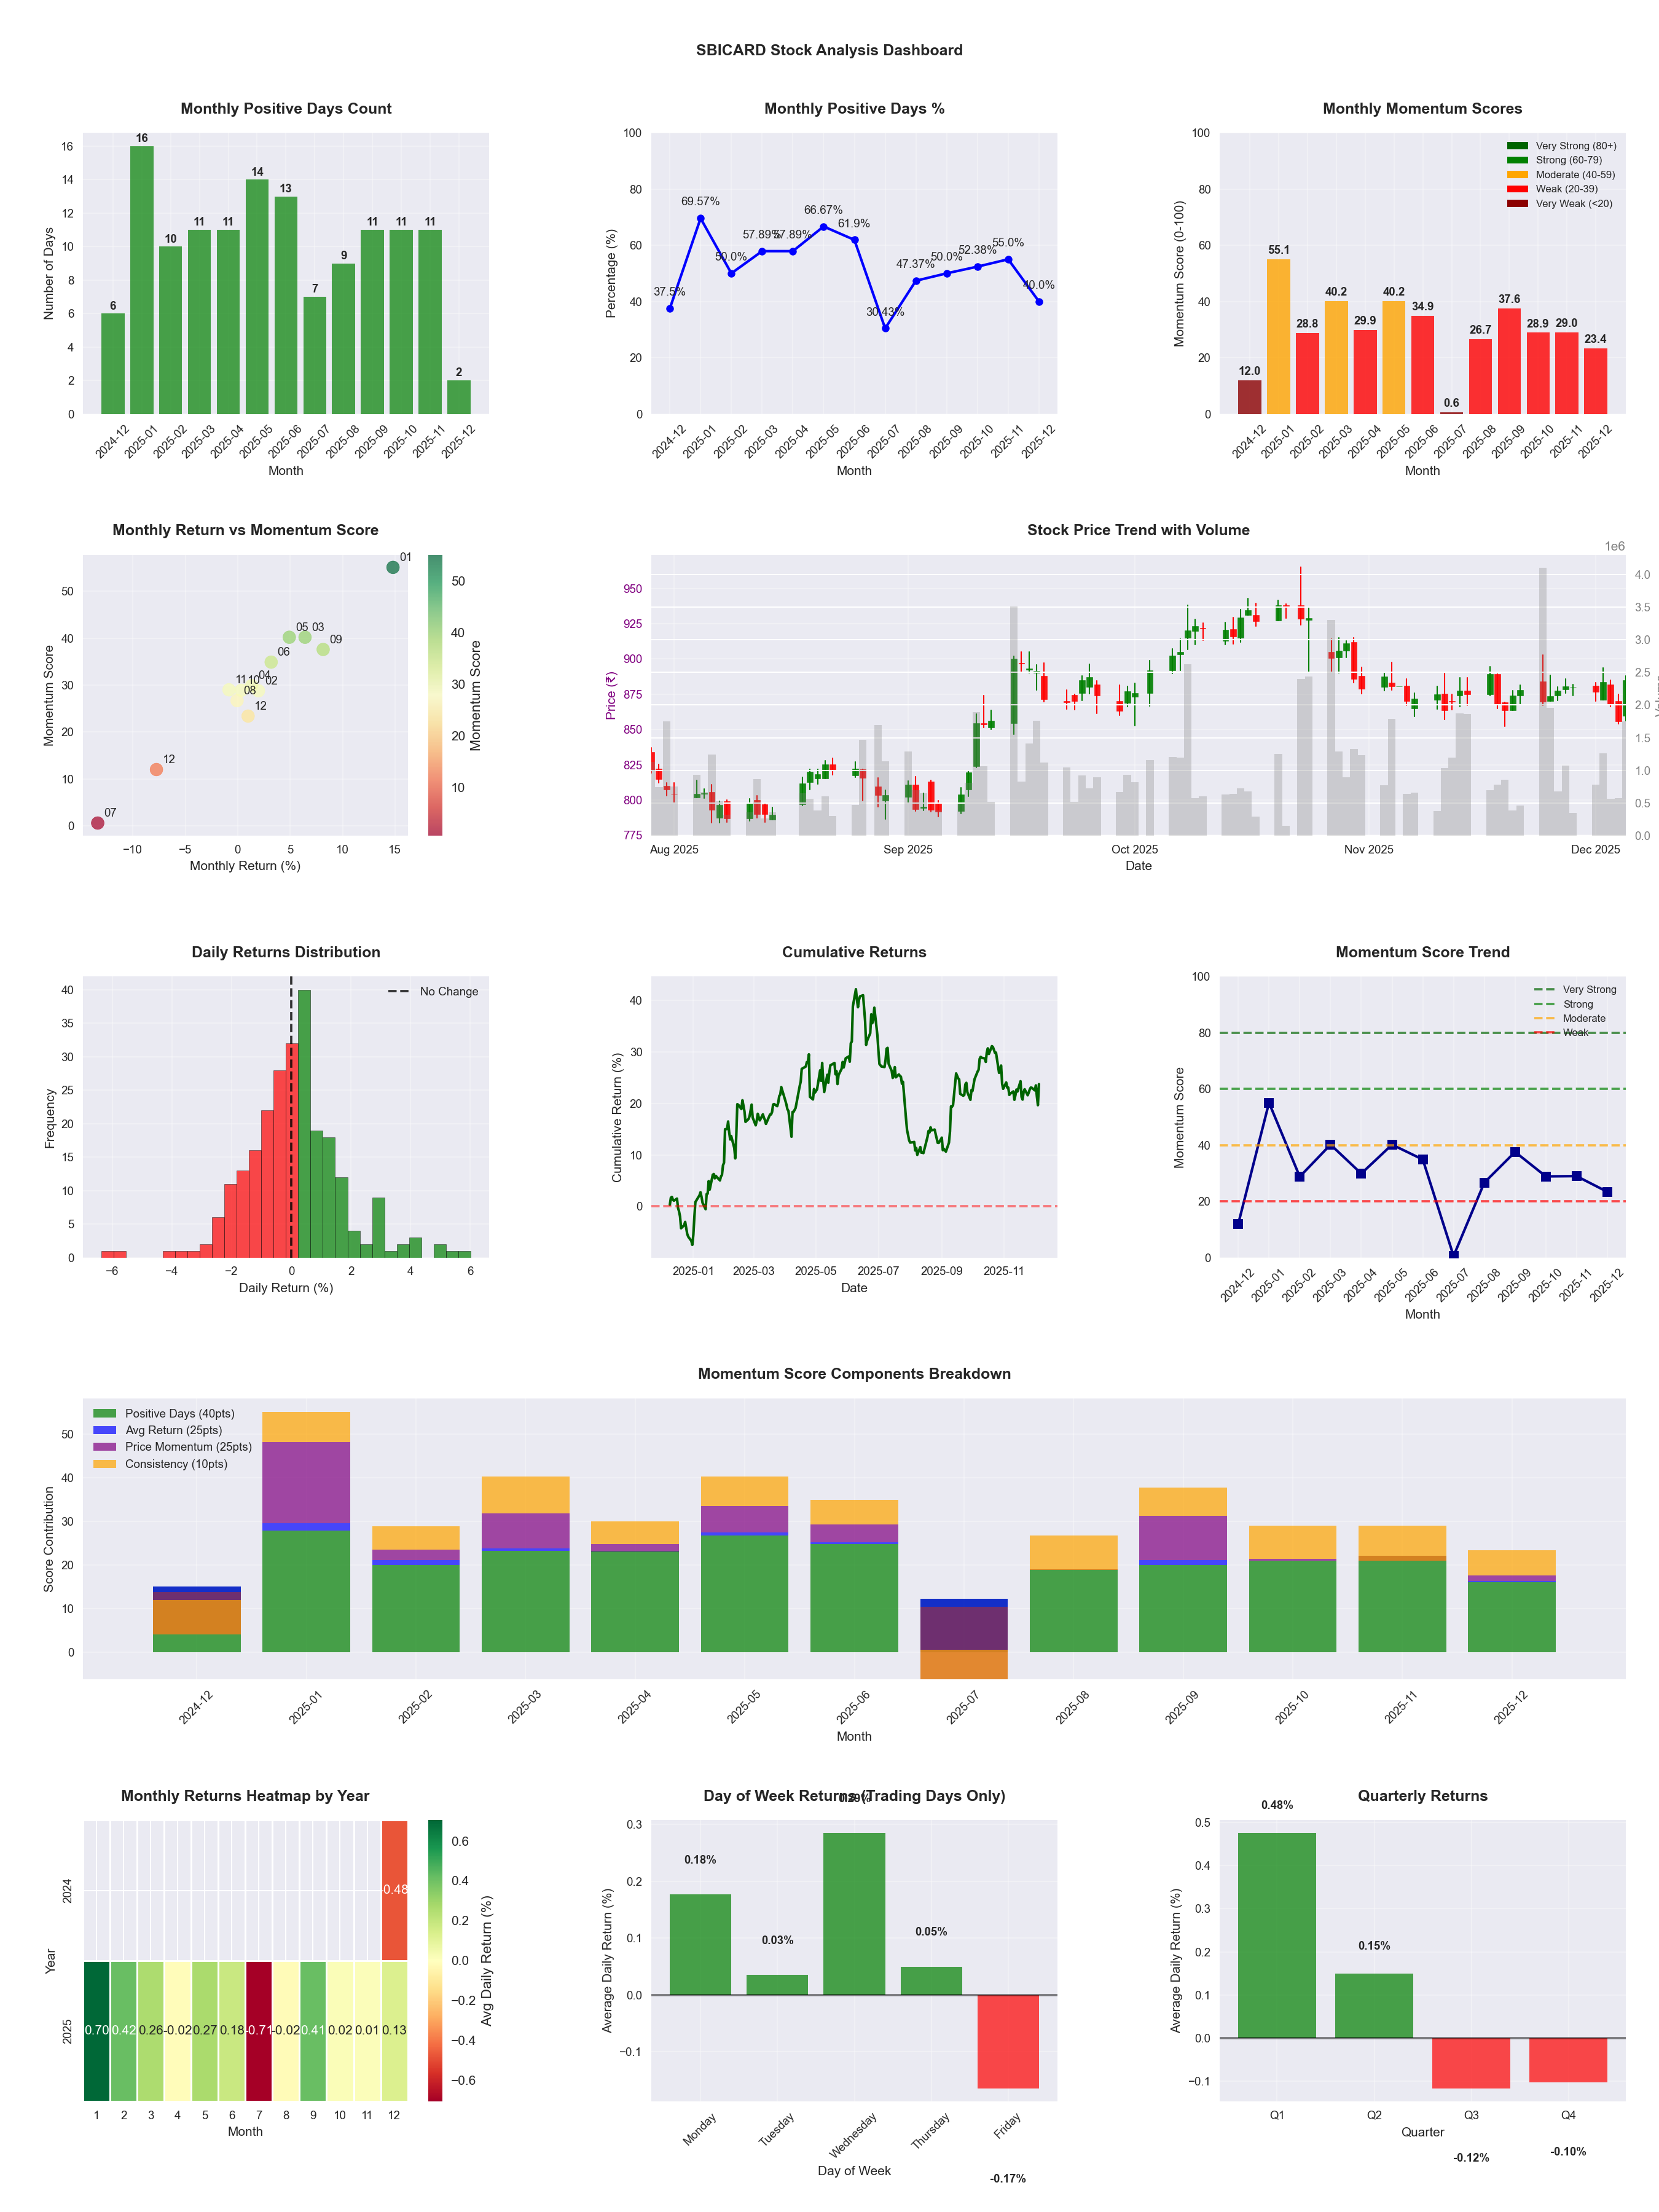
📊 Key Insights & Metrics
Symbol
📈 SBICARD
Date
📅 2026-04-11
Volatility
🟡 1.73%
Win Rate
⚠️ 48.8%
Avg Daily Return
📉 -0.08%
Max Drawdown
📉 -37.33%
IBD RS Score
📊 9.1
Weak
Market Rank
#448
Best Month
🏆 2026-04
Best Months to Trade
📅 Apr, Sep, May
Best Days to Trade
📅 Wednesday, Tuesday
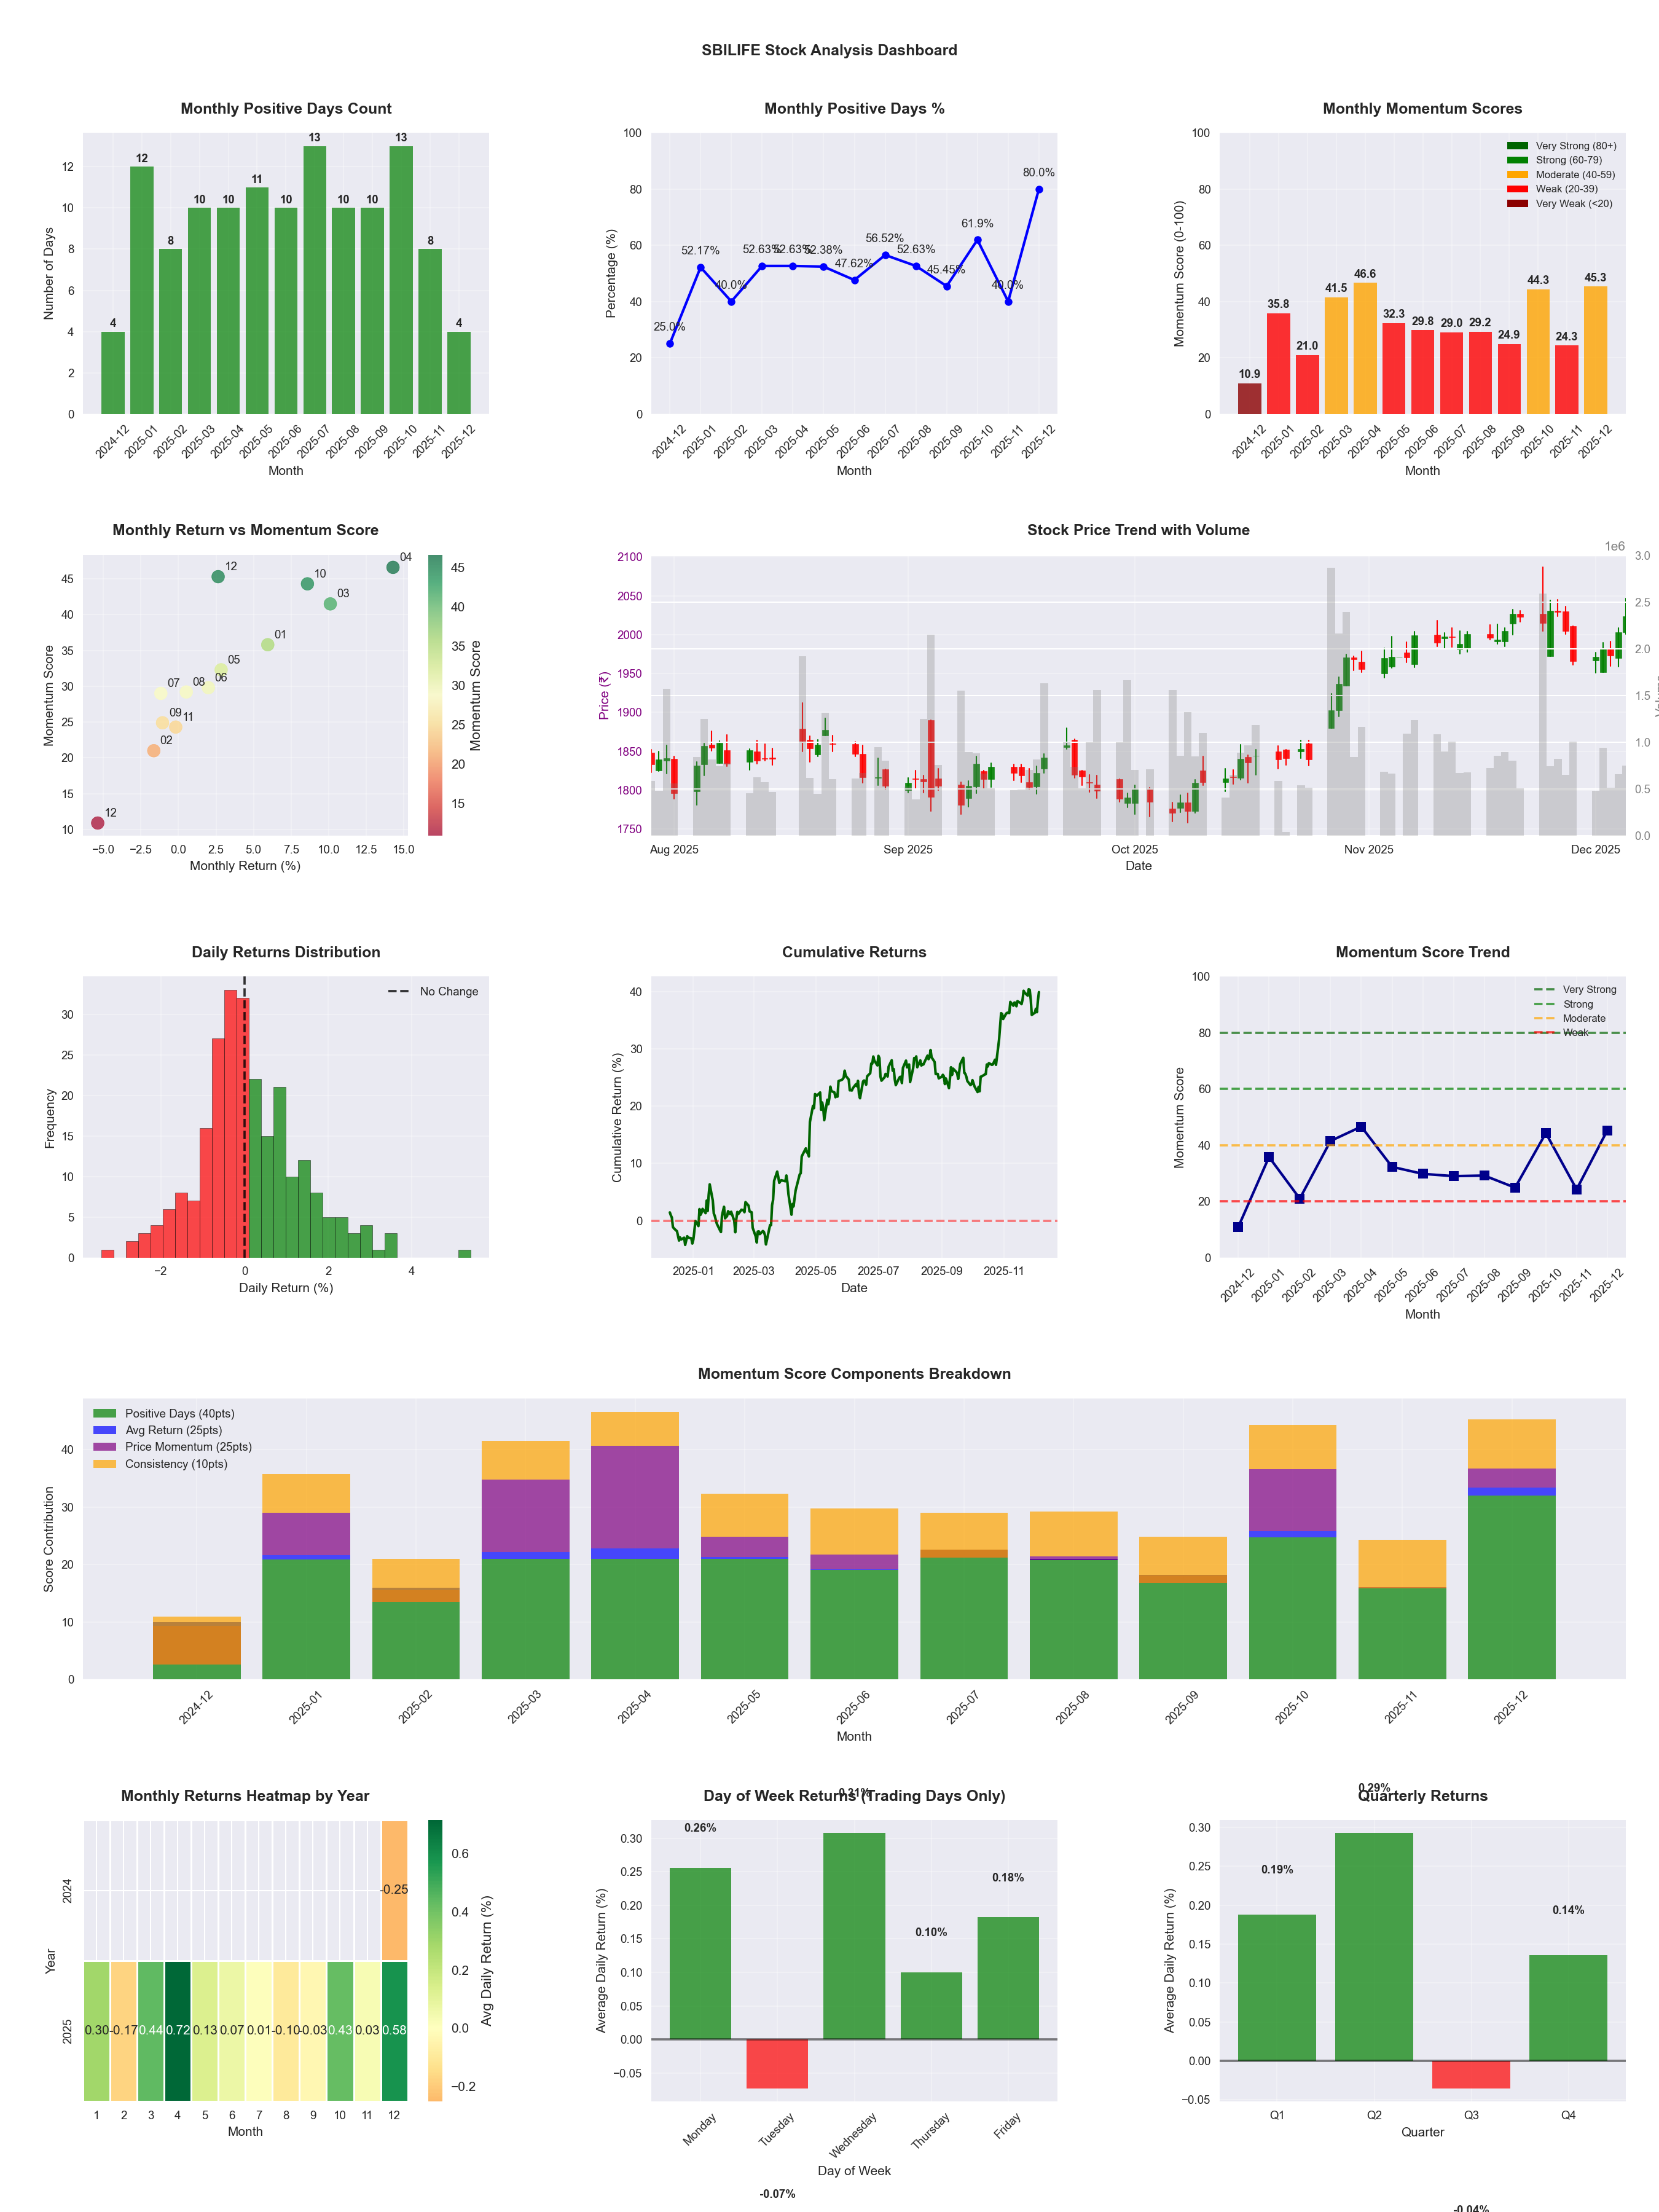
📊 Key Insights & Metrics
Symbol
📈 SBILIFE
Date
📅 2026-04-11
Volatility
🟢 1.24%
Win Rate
⚠️ 52.9%
Avg Daily Return
📈 +0.10%
Max Drawdown
📉 -15.79%
IBD RS Score
📊 69.0
Average
Market Rank
#153
Best Month
🏆 2025-04
Worst Month
📉 2026-03
Best Months to Trade
📅 Apr, Oct, Dec
Best Days to Trade
📅 Monday, Wednesday
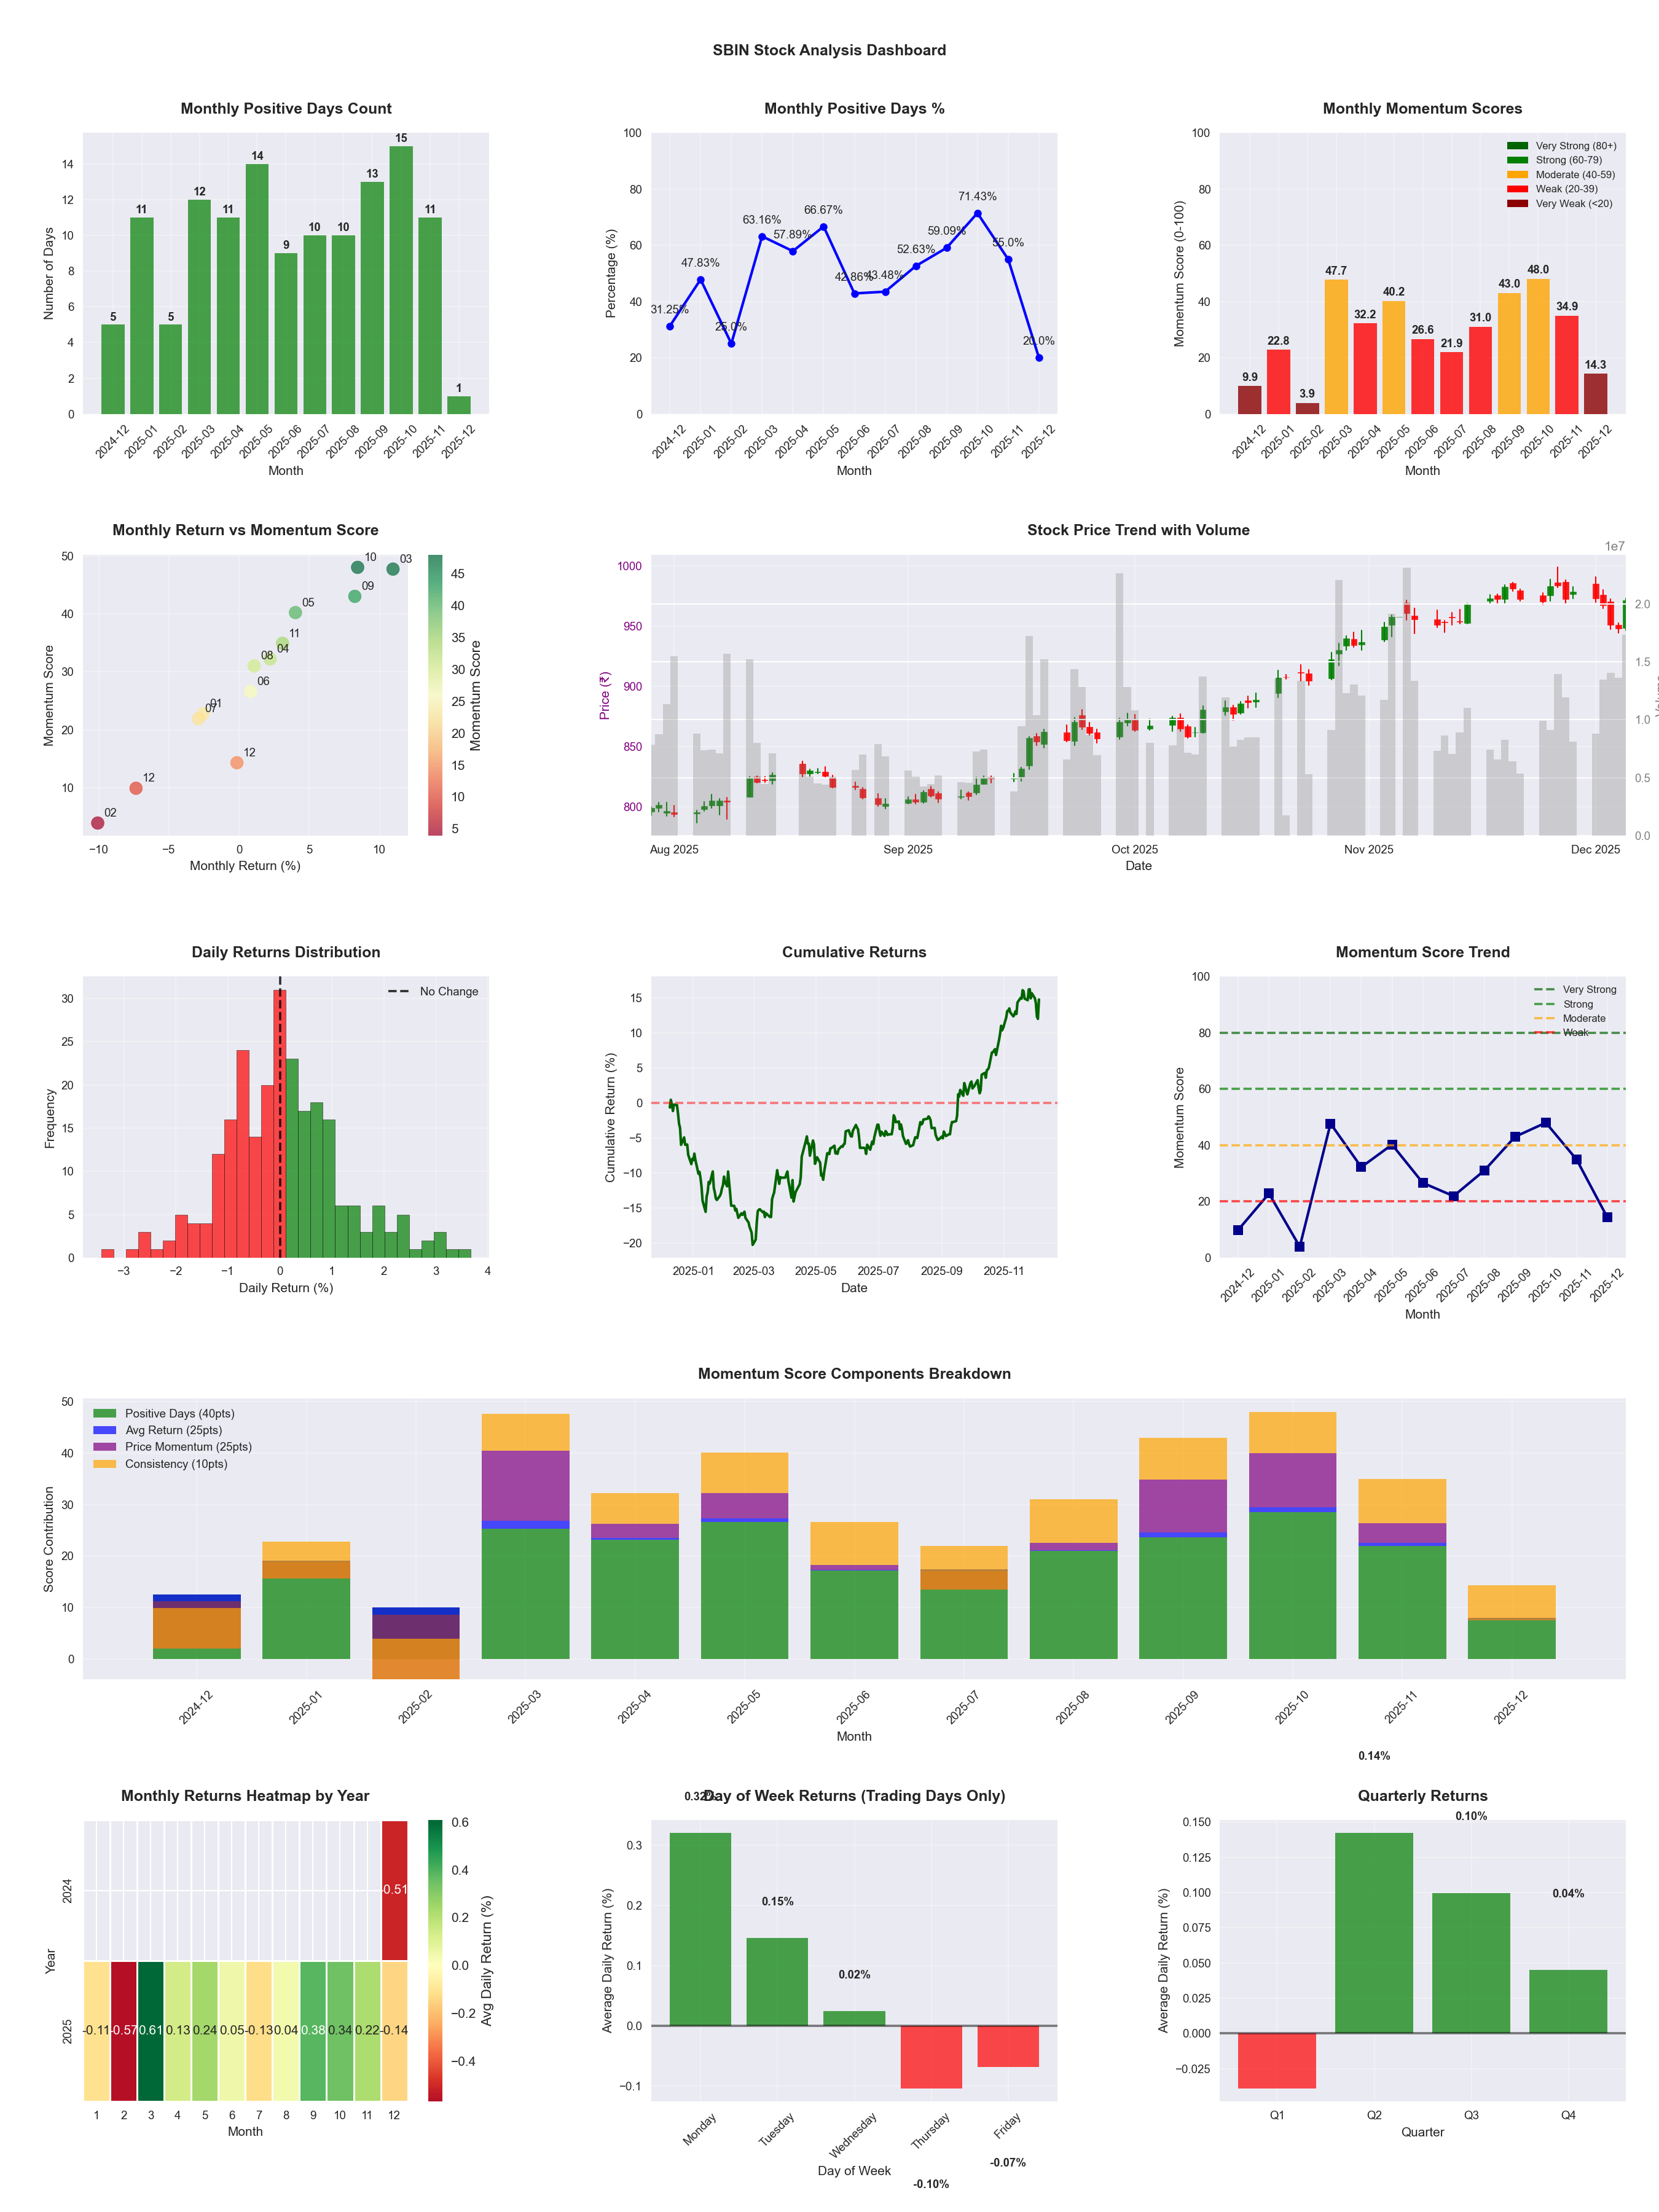
📊 Key Insights & Metrics
Symbol
📈 SBIN
Date
📅 2026-04-11
Volatility
🟢 1.33%
Win Rate
⚠️ 54.5%
Avg Daily Return
📈 +0.16%
Max Drawdown
📉 -20.23%
IBD RS Score
📊 88.8
Strong
Market Rank
#55
Best Month
🏆 2026-02
Best Months to Trade
📅 Apr, Feb, Jan
Best Days to Trade
📅 Wednesday, Monday
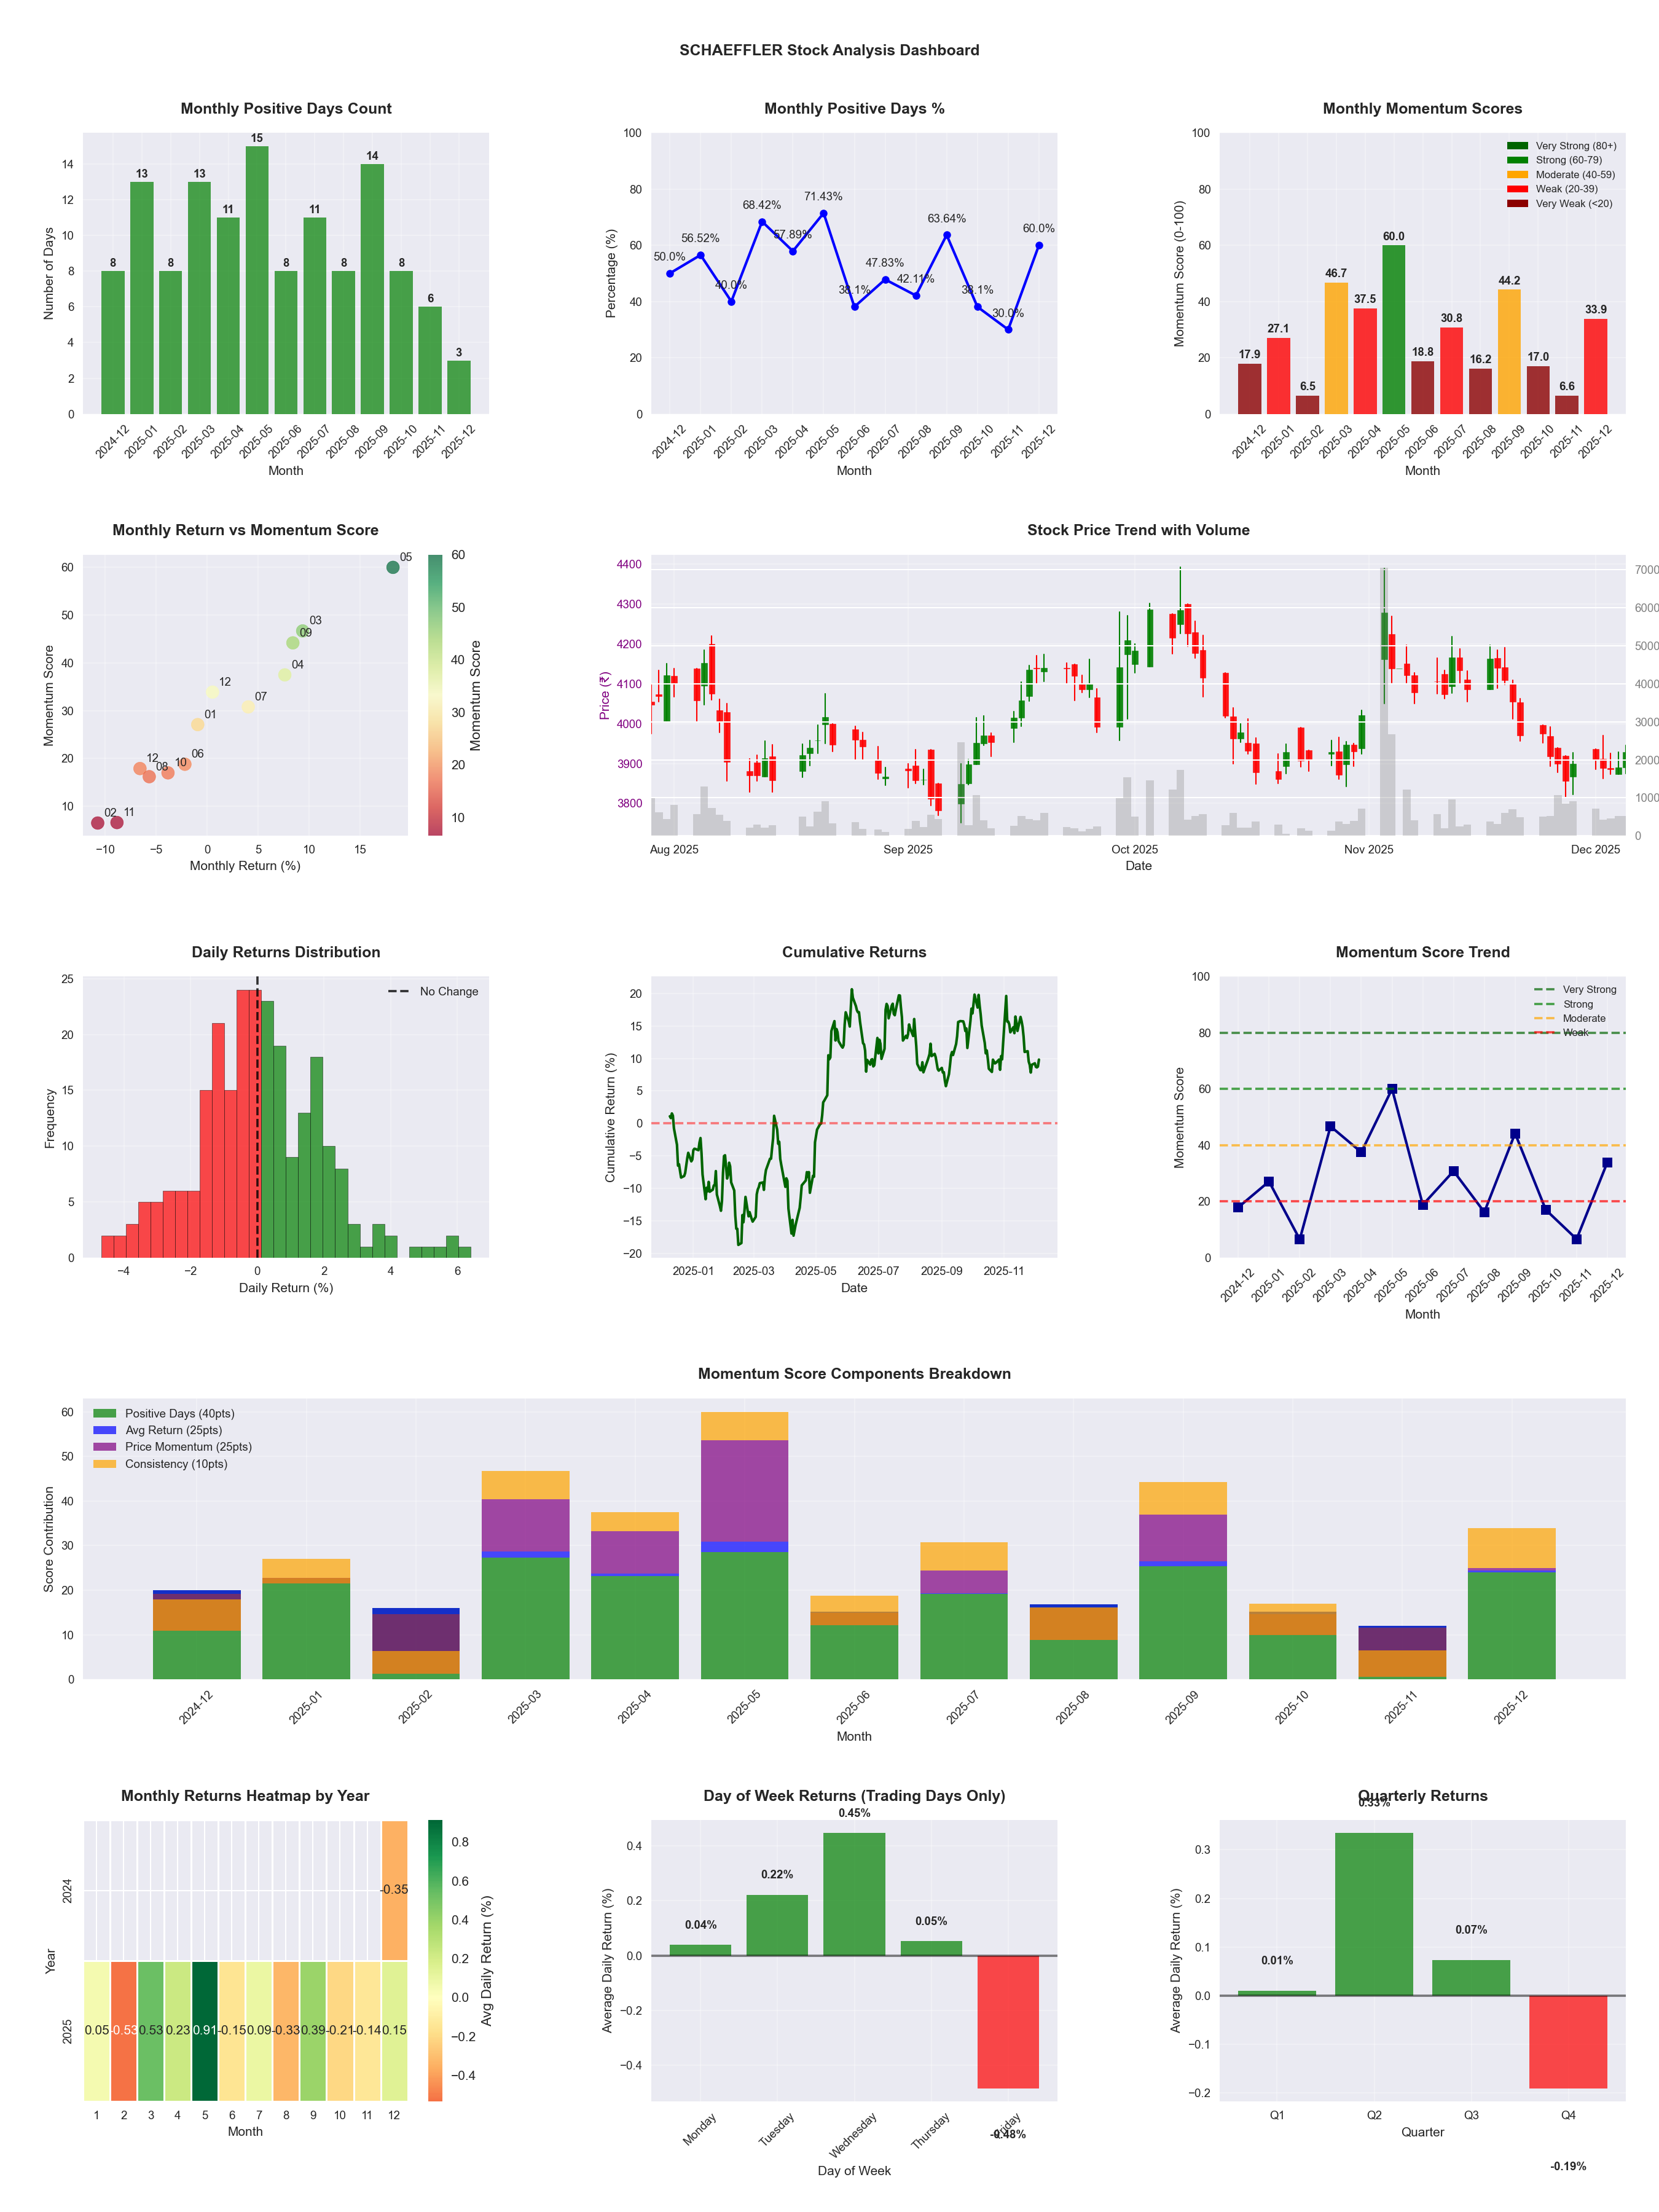
📊 Key Insights & Metrics
Symbol
📈 SCHAEFFLER
Date
📅 2026-04-11
Volatility
🟡 1.92%
Win Rate
⚠️ 51.2%
Avg Daily Return
📈 +0.12%
Max Drawdown
📉 -17.44%
IBD RS Score
📊 69.2
Average
Market Rank
#152
Best Month
🏆 2025-05
Worst Month
📉 2026-03
Best Months to Trade
📅 Feb, May, Apr
Best Days to Trade
📅 Wednesday, Tuesday
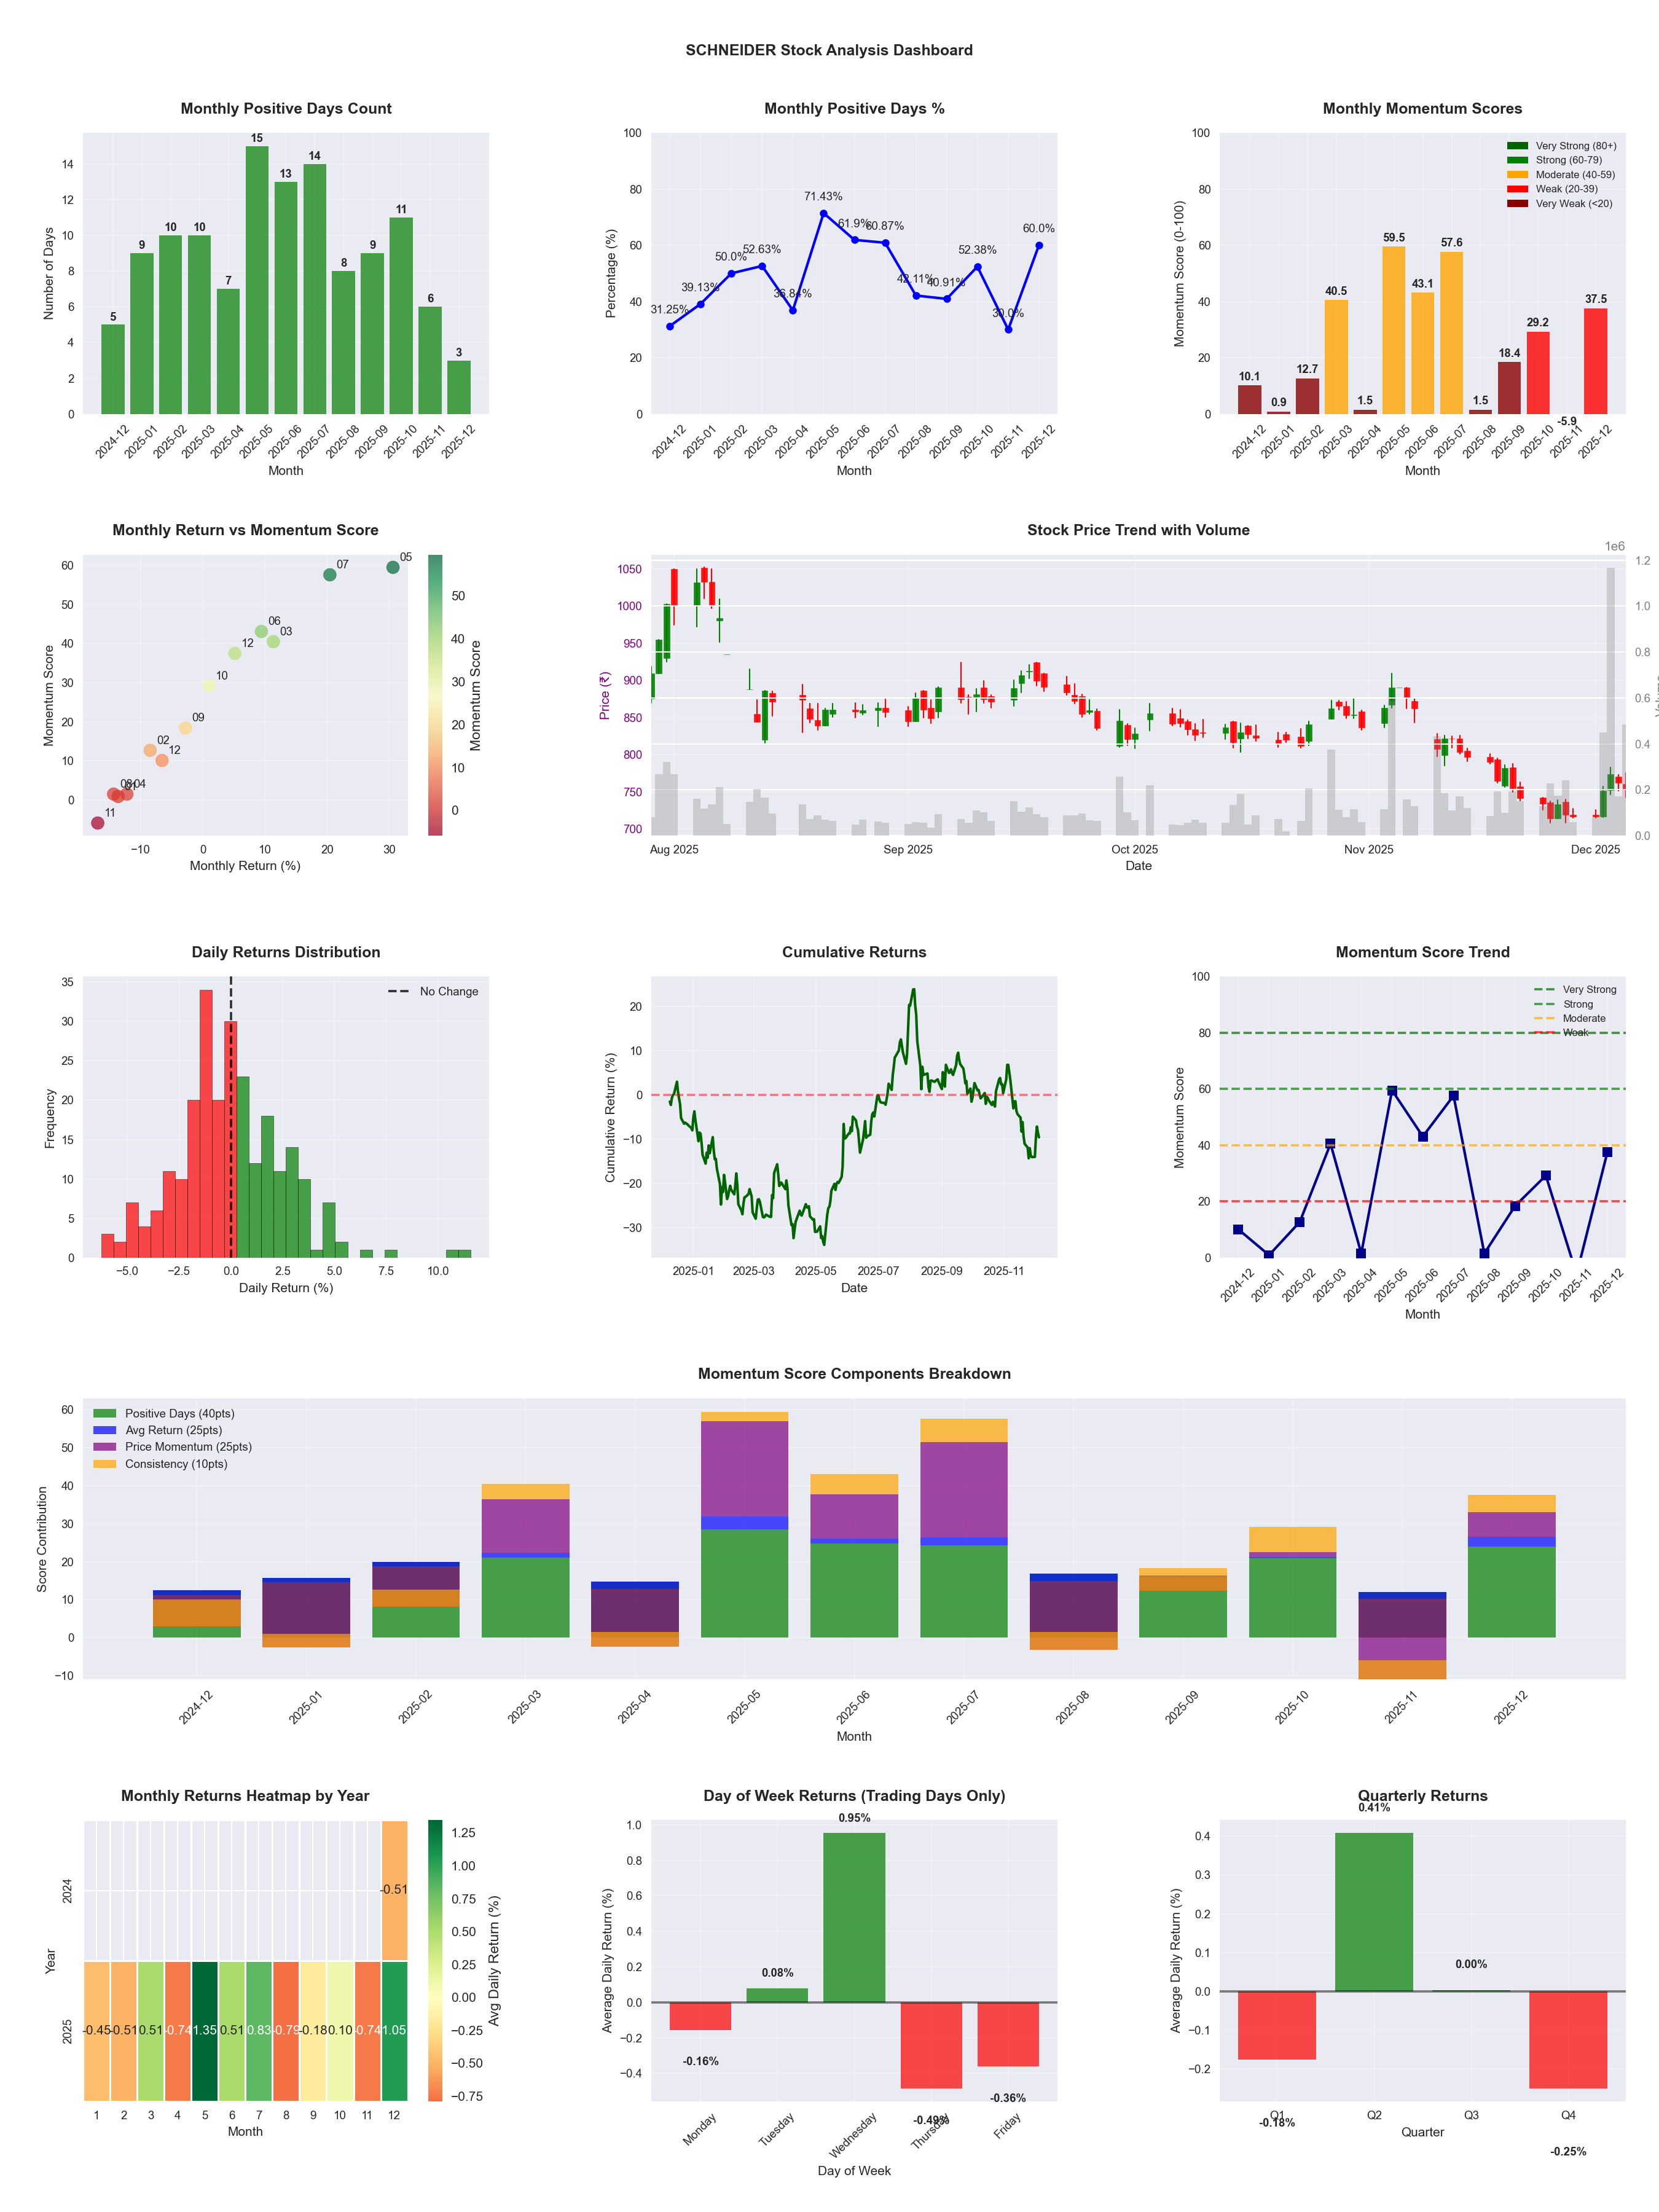
📊 Key Insights & Metrics
Symbol
📈 SCHNEIDER
Date
📅 2026-04-11
Volatility
🟡 2.68%
Risk Profile
⚠️ suitable for aggressive investors
Win Rate
⚠️ 49.2%
Avg Daily Return
📈 +0.25%
Max Drawdown
📉 -43.90%
IBD RS Score
📊 98.0
Leader
Market Rank
#10
Best Month
🏆 2026-04
Best Months to Trade
📅 Feb, May, Apr
Best Days to Trade
📅 Wednesday, Tuesday
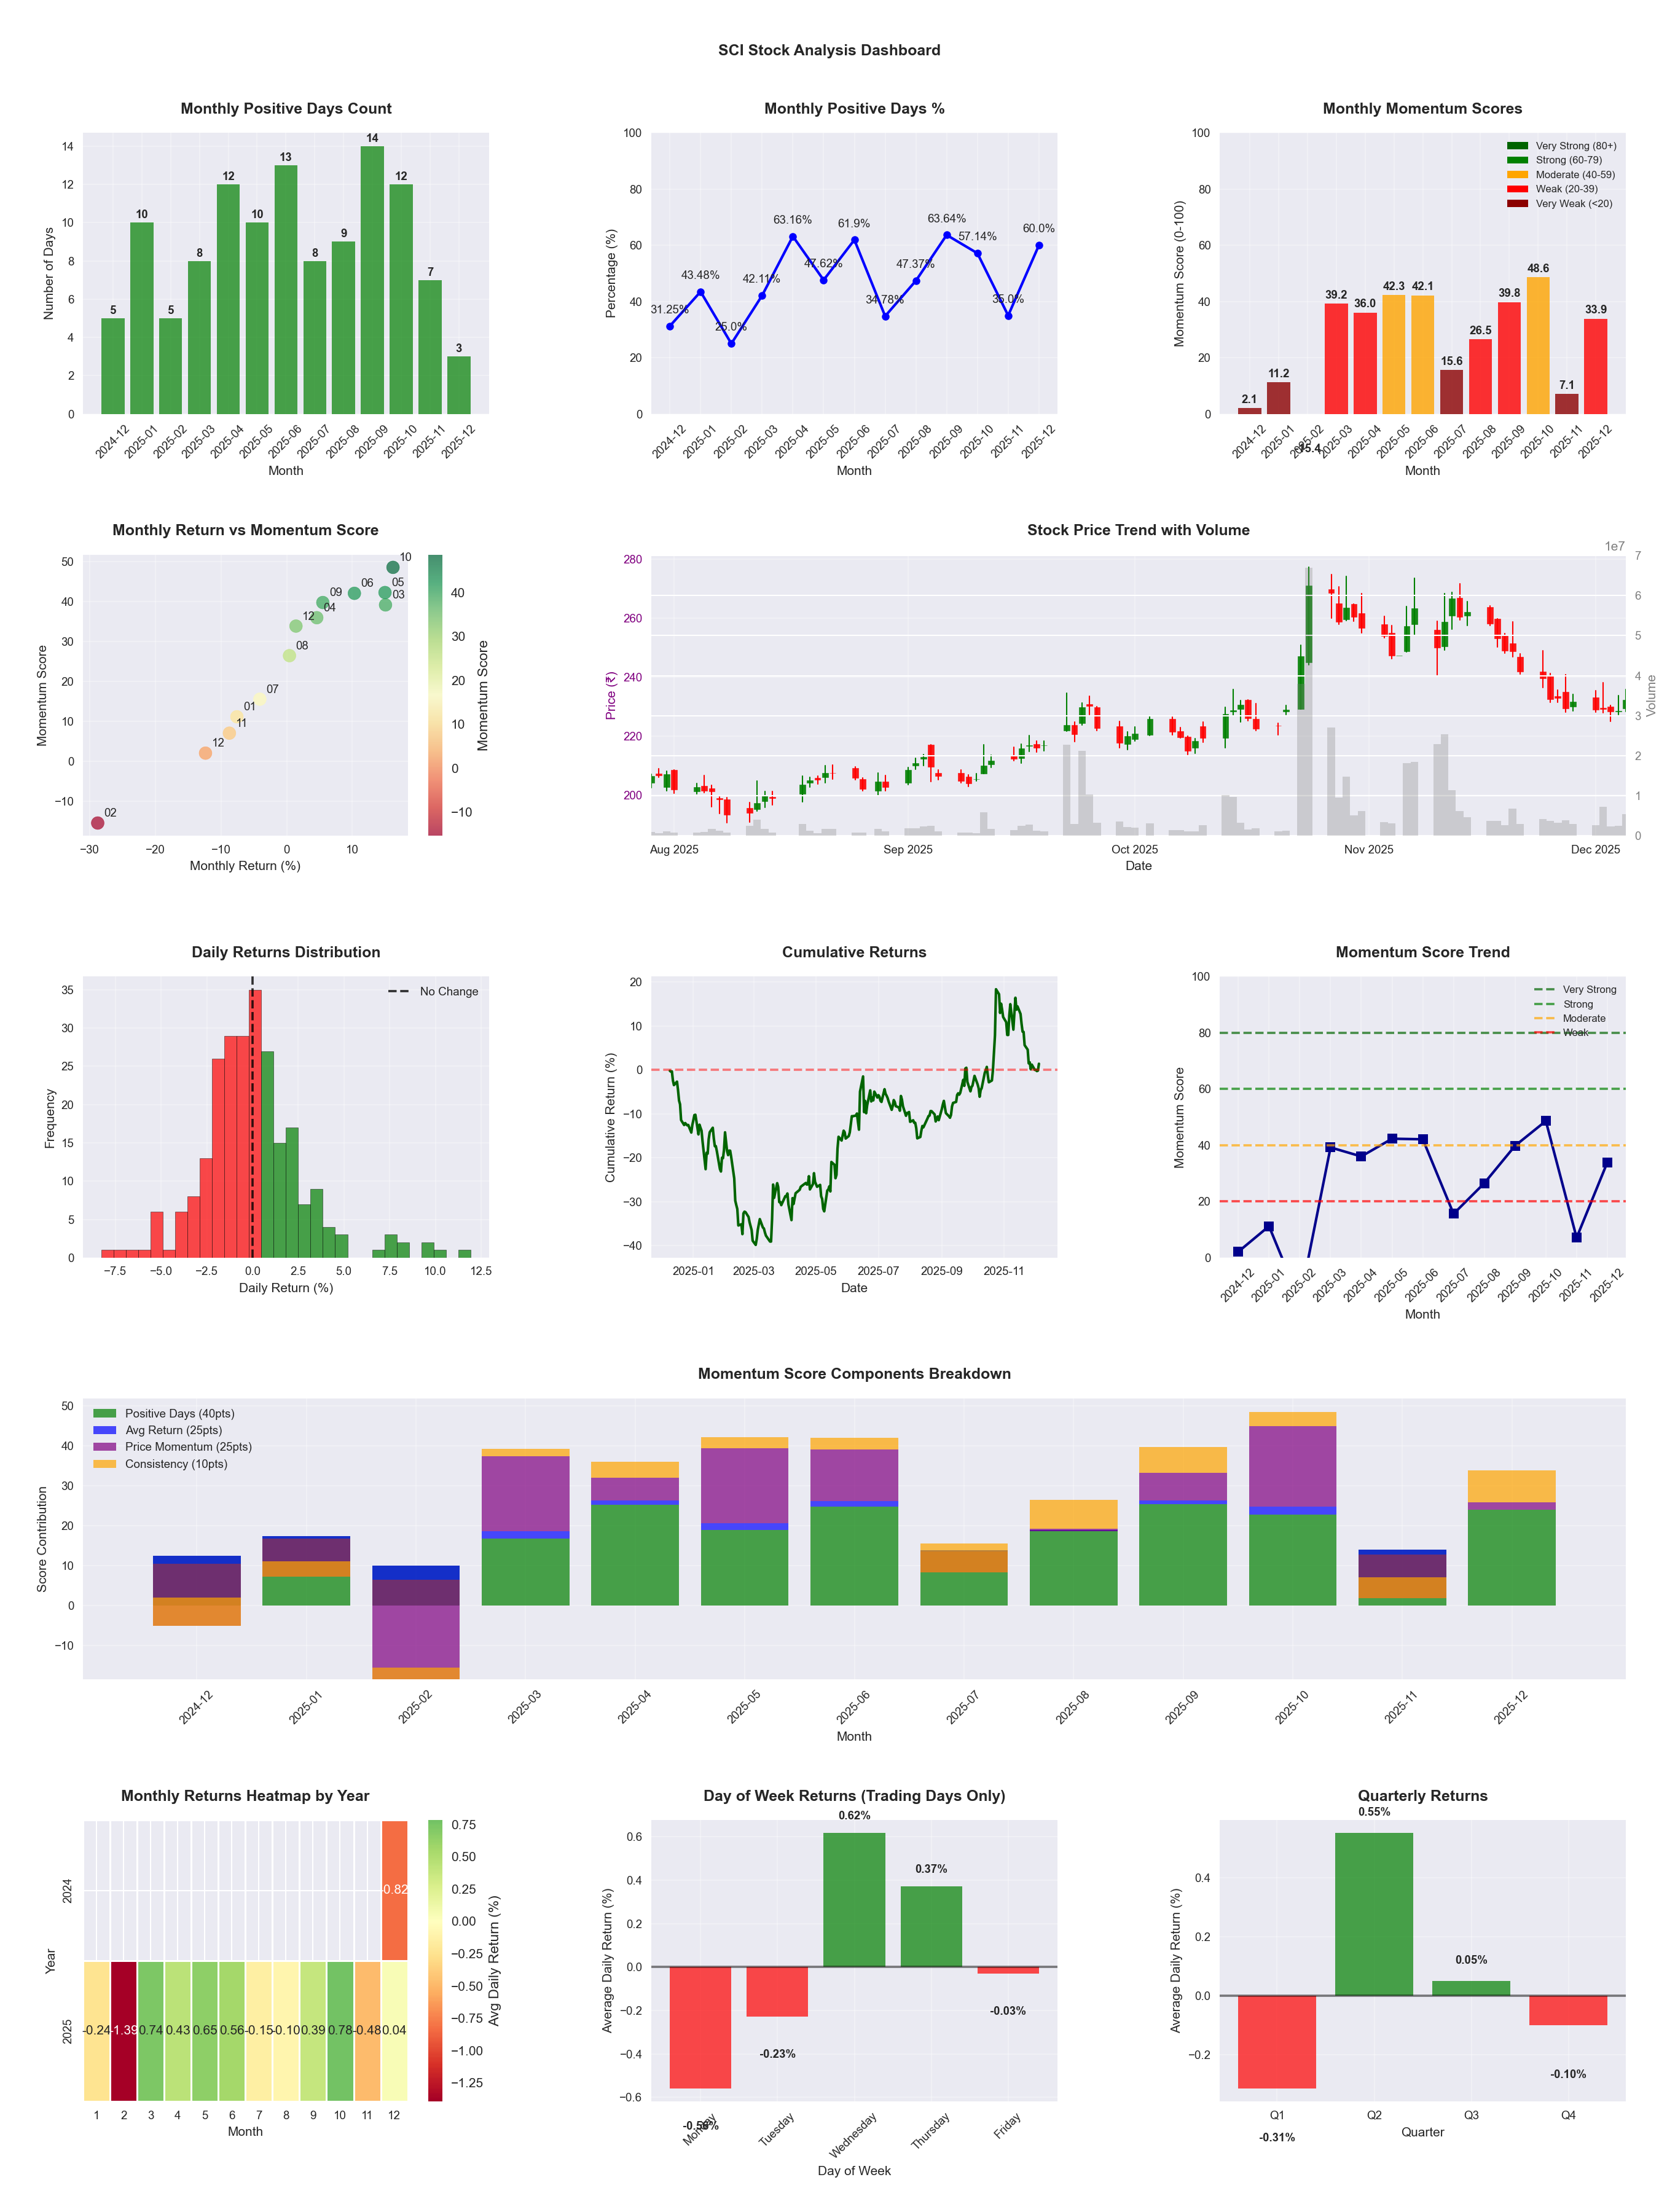
📊 Key Insights & Metrics
Symbol
📈 SCI
Date
📅 2026-04-11
Volatility
🟡 2.84%
Risk Profile
⚠️ suitable for aggressive investors
Win Rate
⚠️ 52.0%
Avg Daily Return
📈 +0.20%
Max Drawdown
📉 -25.59%
IBD RS Score
📊 89.0
Strong
Market Rank
#54
Best Month
🏆 2026-02
Best Months to Trade
📅 Feb, Apr, Oct
Best Days to Trade
📅 Wednesday, Monday
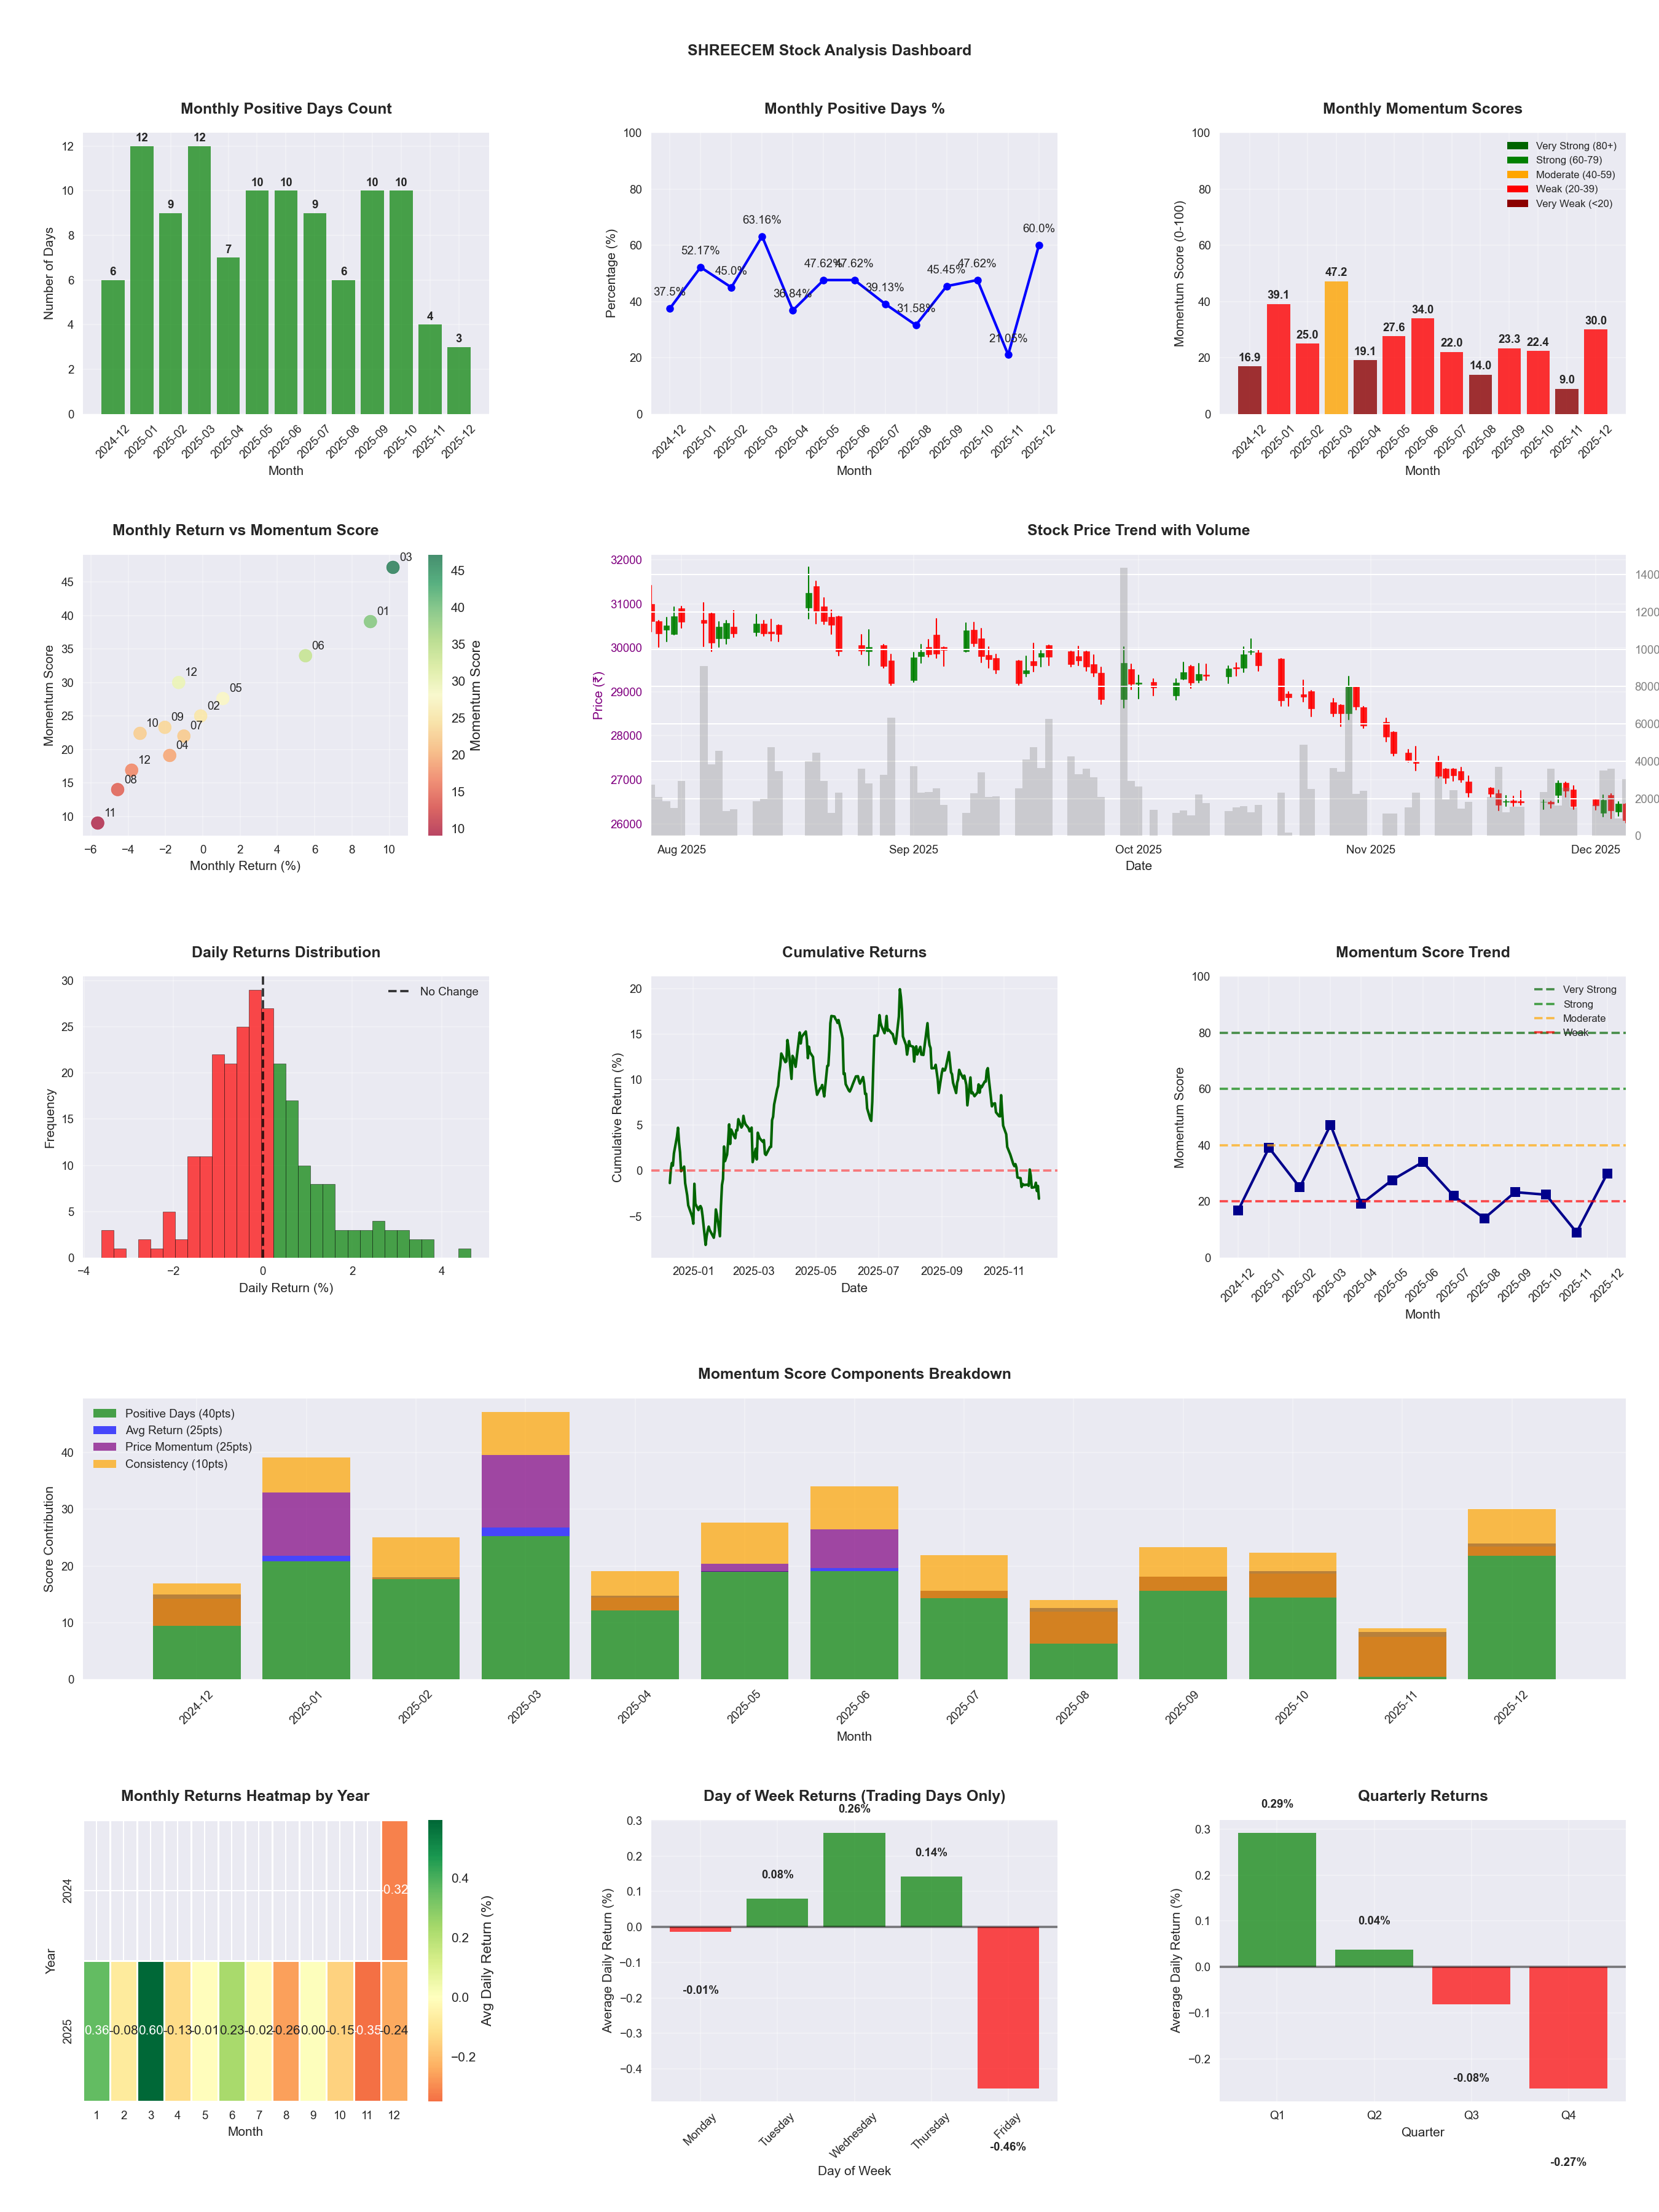
📊 Key Insights & Metrics
Symbol
📈 SHREECEM
Date
📅 2026-04-11
Volatility
🟢 1.31%
Win Rate
⚠️ 45.1%
Avg Daily Return
📉 -0.08%
Max Drawdown
📉 -29.54%
IBD RS Score
📊 23.5
Weak
Market Rank
#377
Best Month
🏆 2026-04
Worst Month
📉 2026-03
Best Months to Trade
📅 Apr, Jun, Jan
Best Days to Trade
📅 Wednesday, Monday
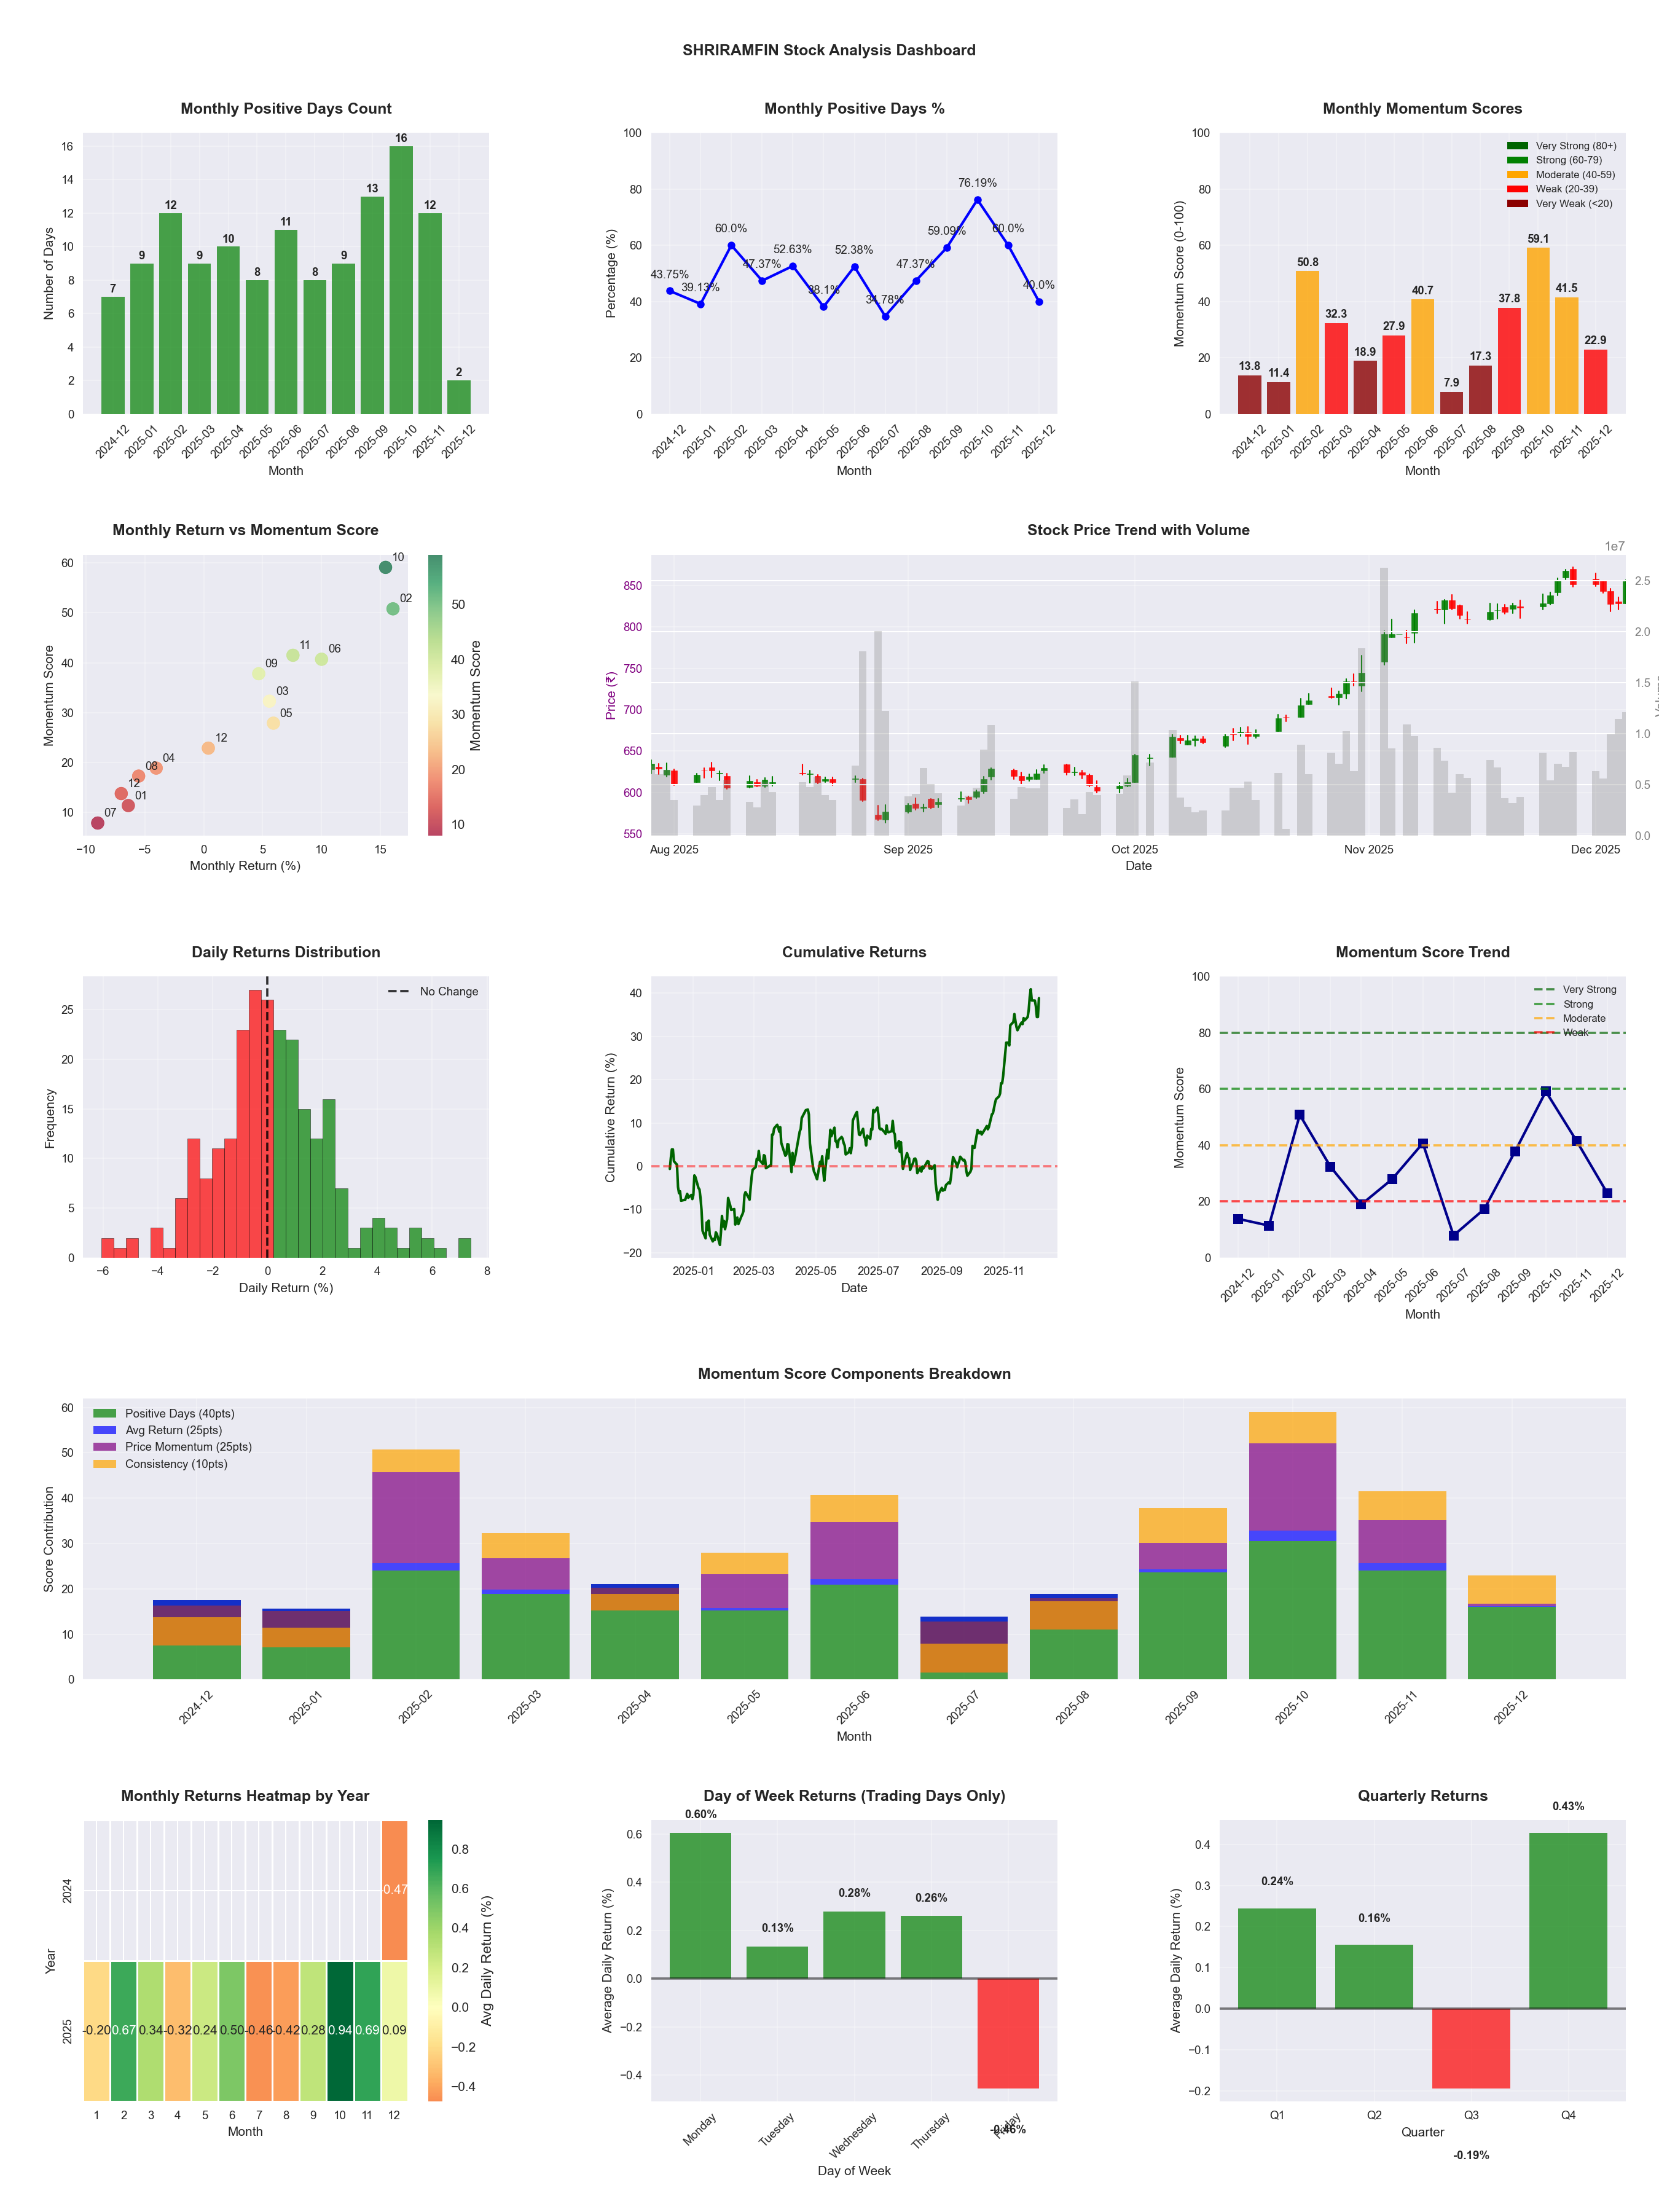
📊 Key Insights & Metrics
Symbol
📈 SHRIRAMFIN
Date
📅 2026-04-11
Volatility
🟡 2.30%
Risk Profile
⚠️ suitable for aggressive investors
Win Rate
⚠️ 51.6%
Avg Daily Return
📈 +0.22%
Max Drawdown
📉 -21.05%
IBD RS Score
📊 95.7
Leader
Market Rank
#21
Best Month
🏆 2025-10
Best Months to Trade
📅 Oct, Apr, Dec
Best Days to Trade
📅 Monday, Wednesday
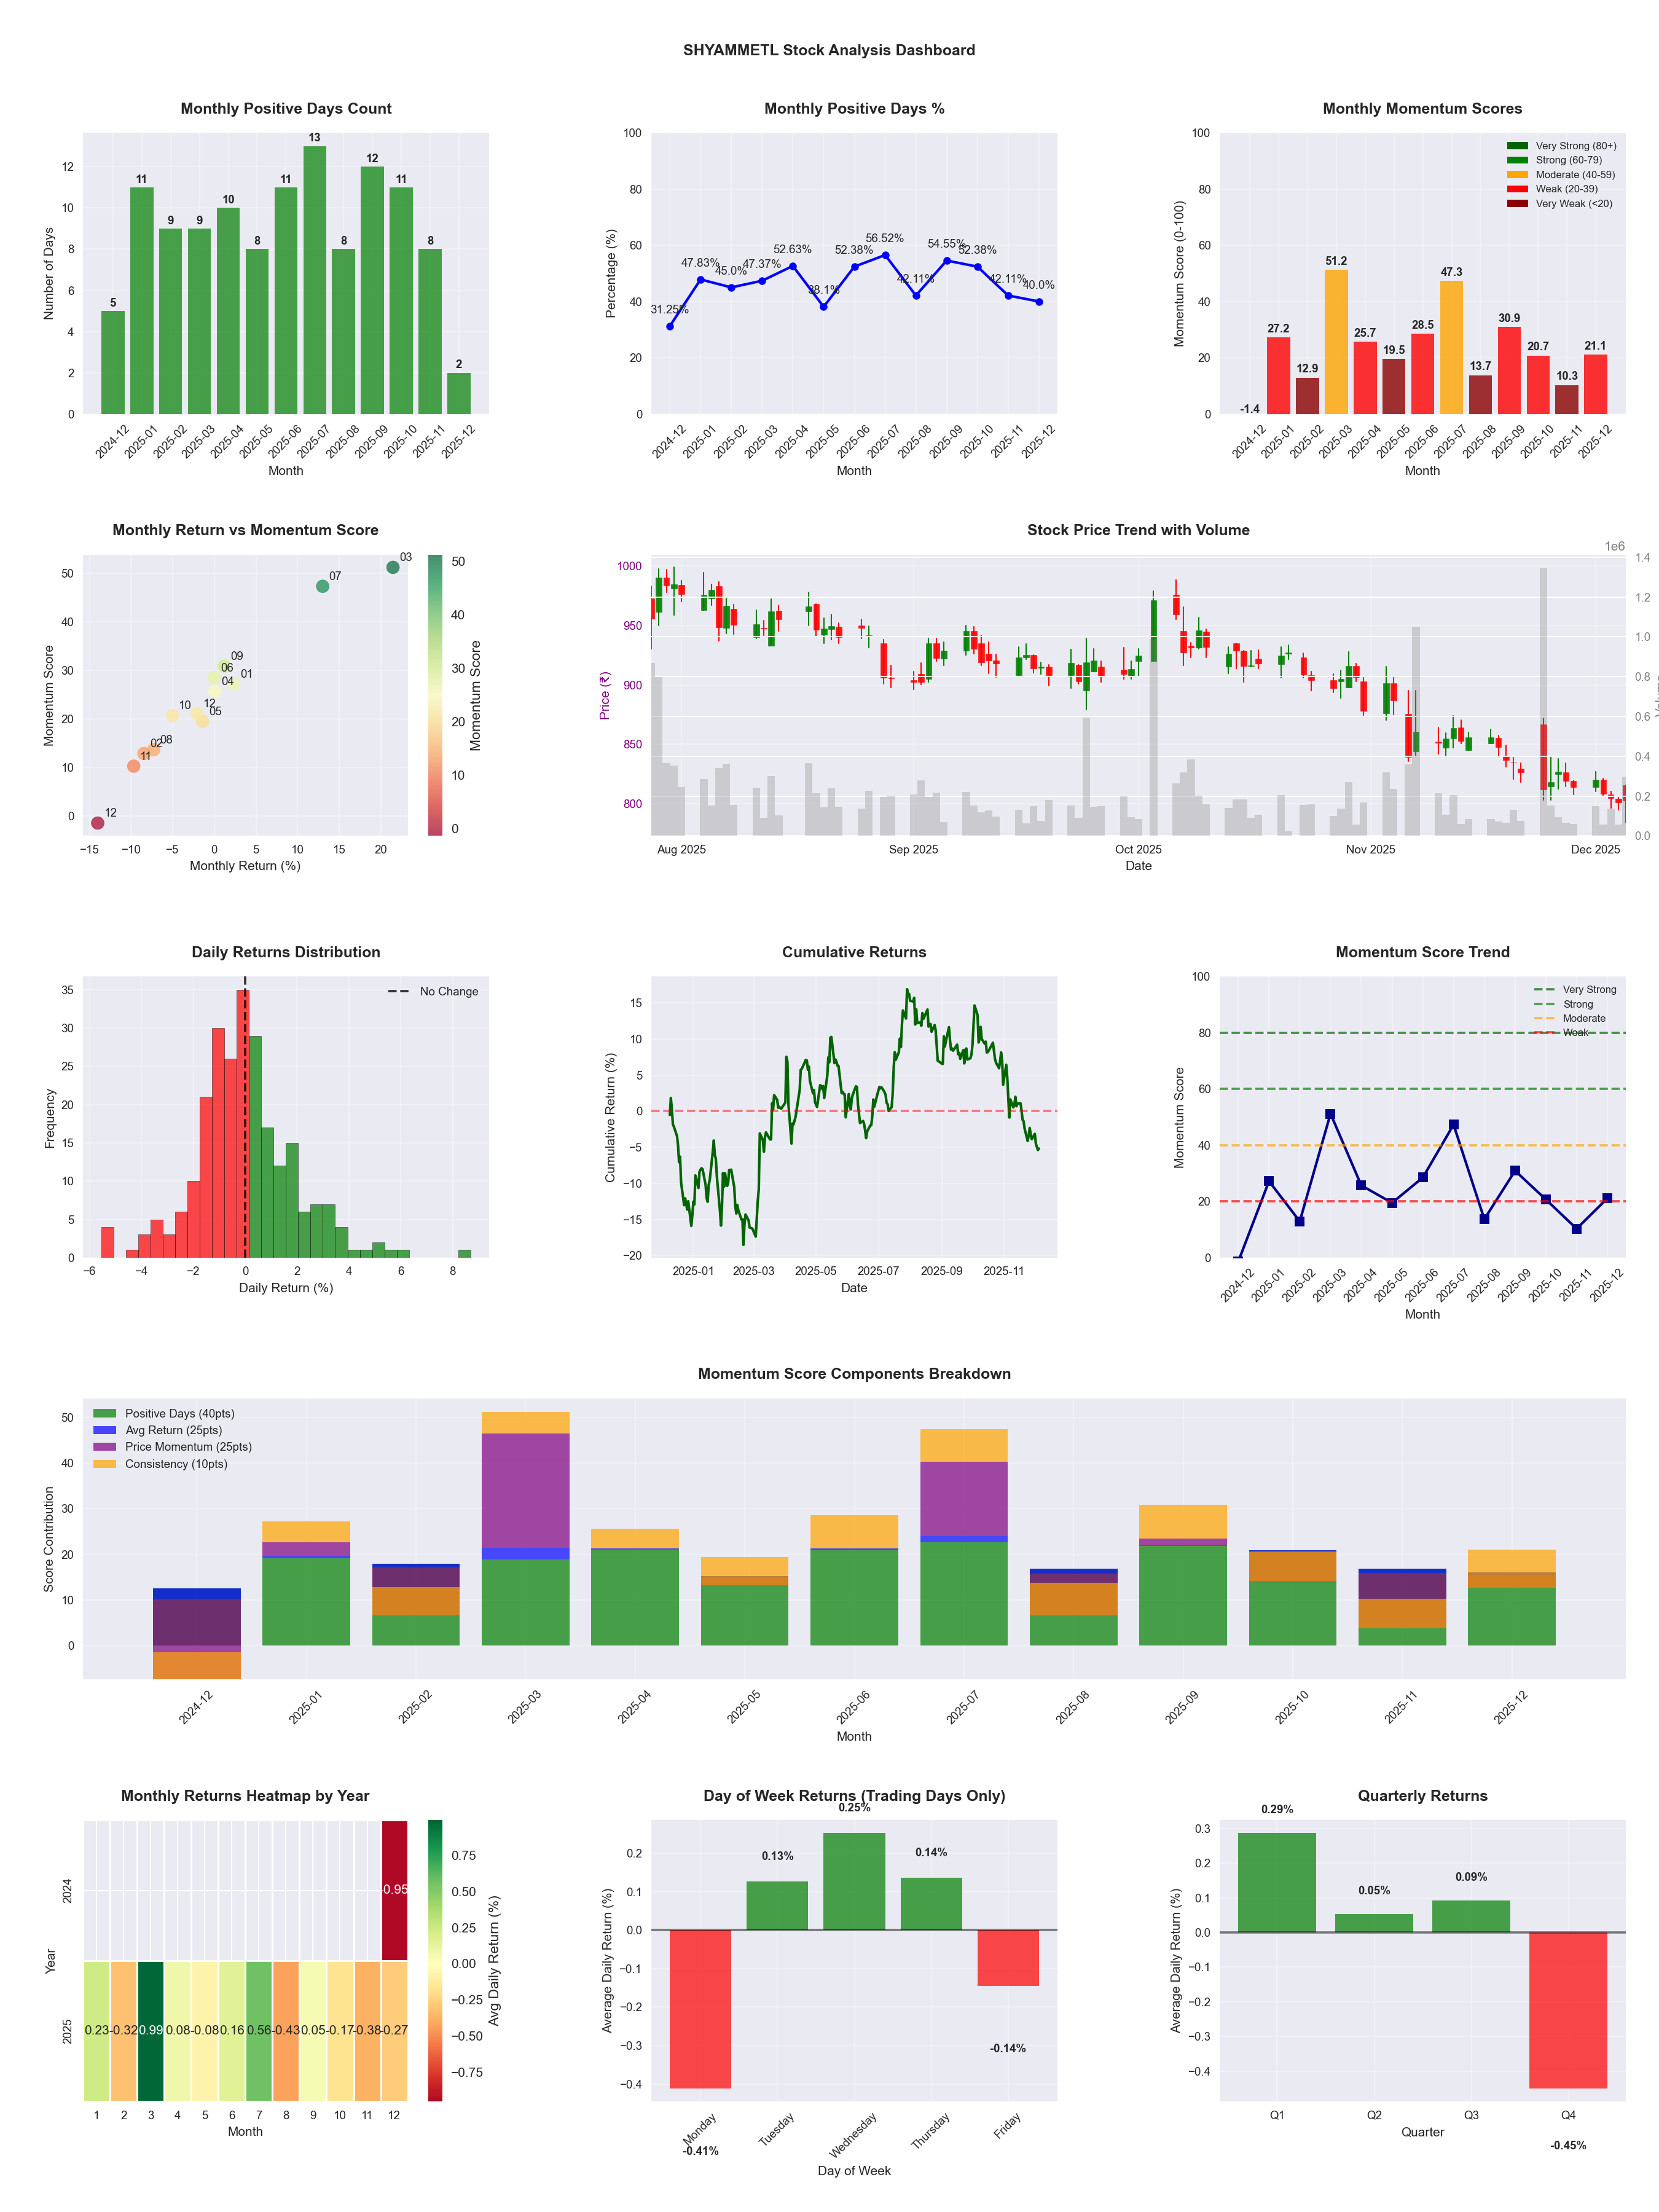
📊 Key Insights & Metrics
Symbol
📈 SHYAMMETL
Date
📅 2026-04-11
Volatility
🟡 1.68%
Win Rate
⚠️ 48.4%
Avg Daily Return
📈 +0.01%
Max Drawdown
📉 -23.07%
IBD RS Score
📊 59.8
Average
Market Rank
#198
Best Month
🏆 2025-07
Worst Month
📉 2026-03
Best Months to Trade
📅 Apr, Jul, Dec
Best Days to Trade
📅 Tuesday, Wednesday
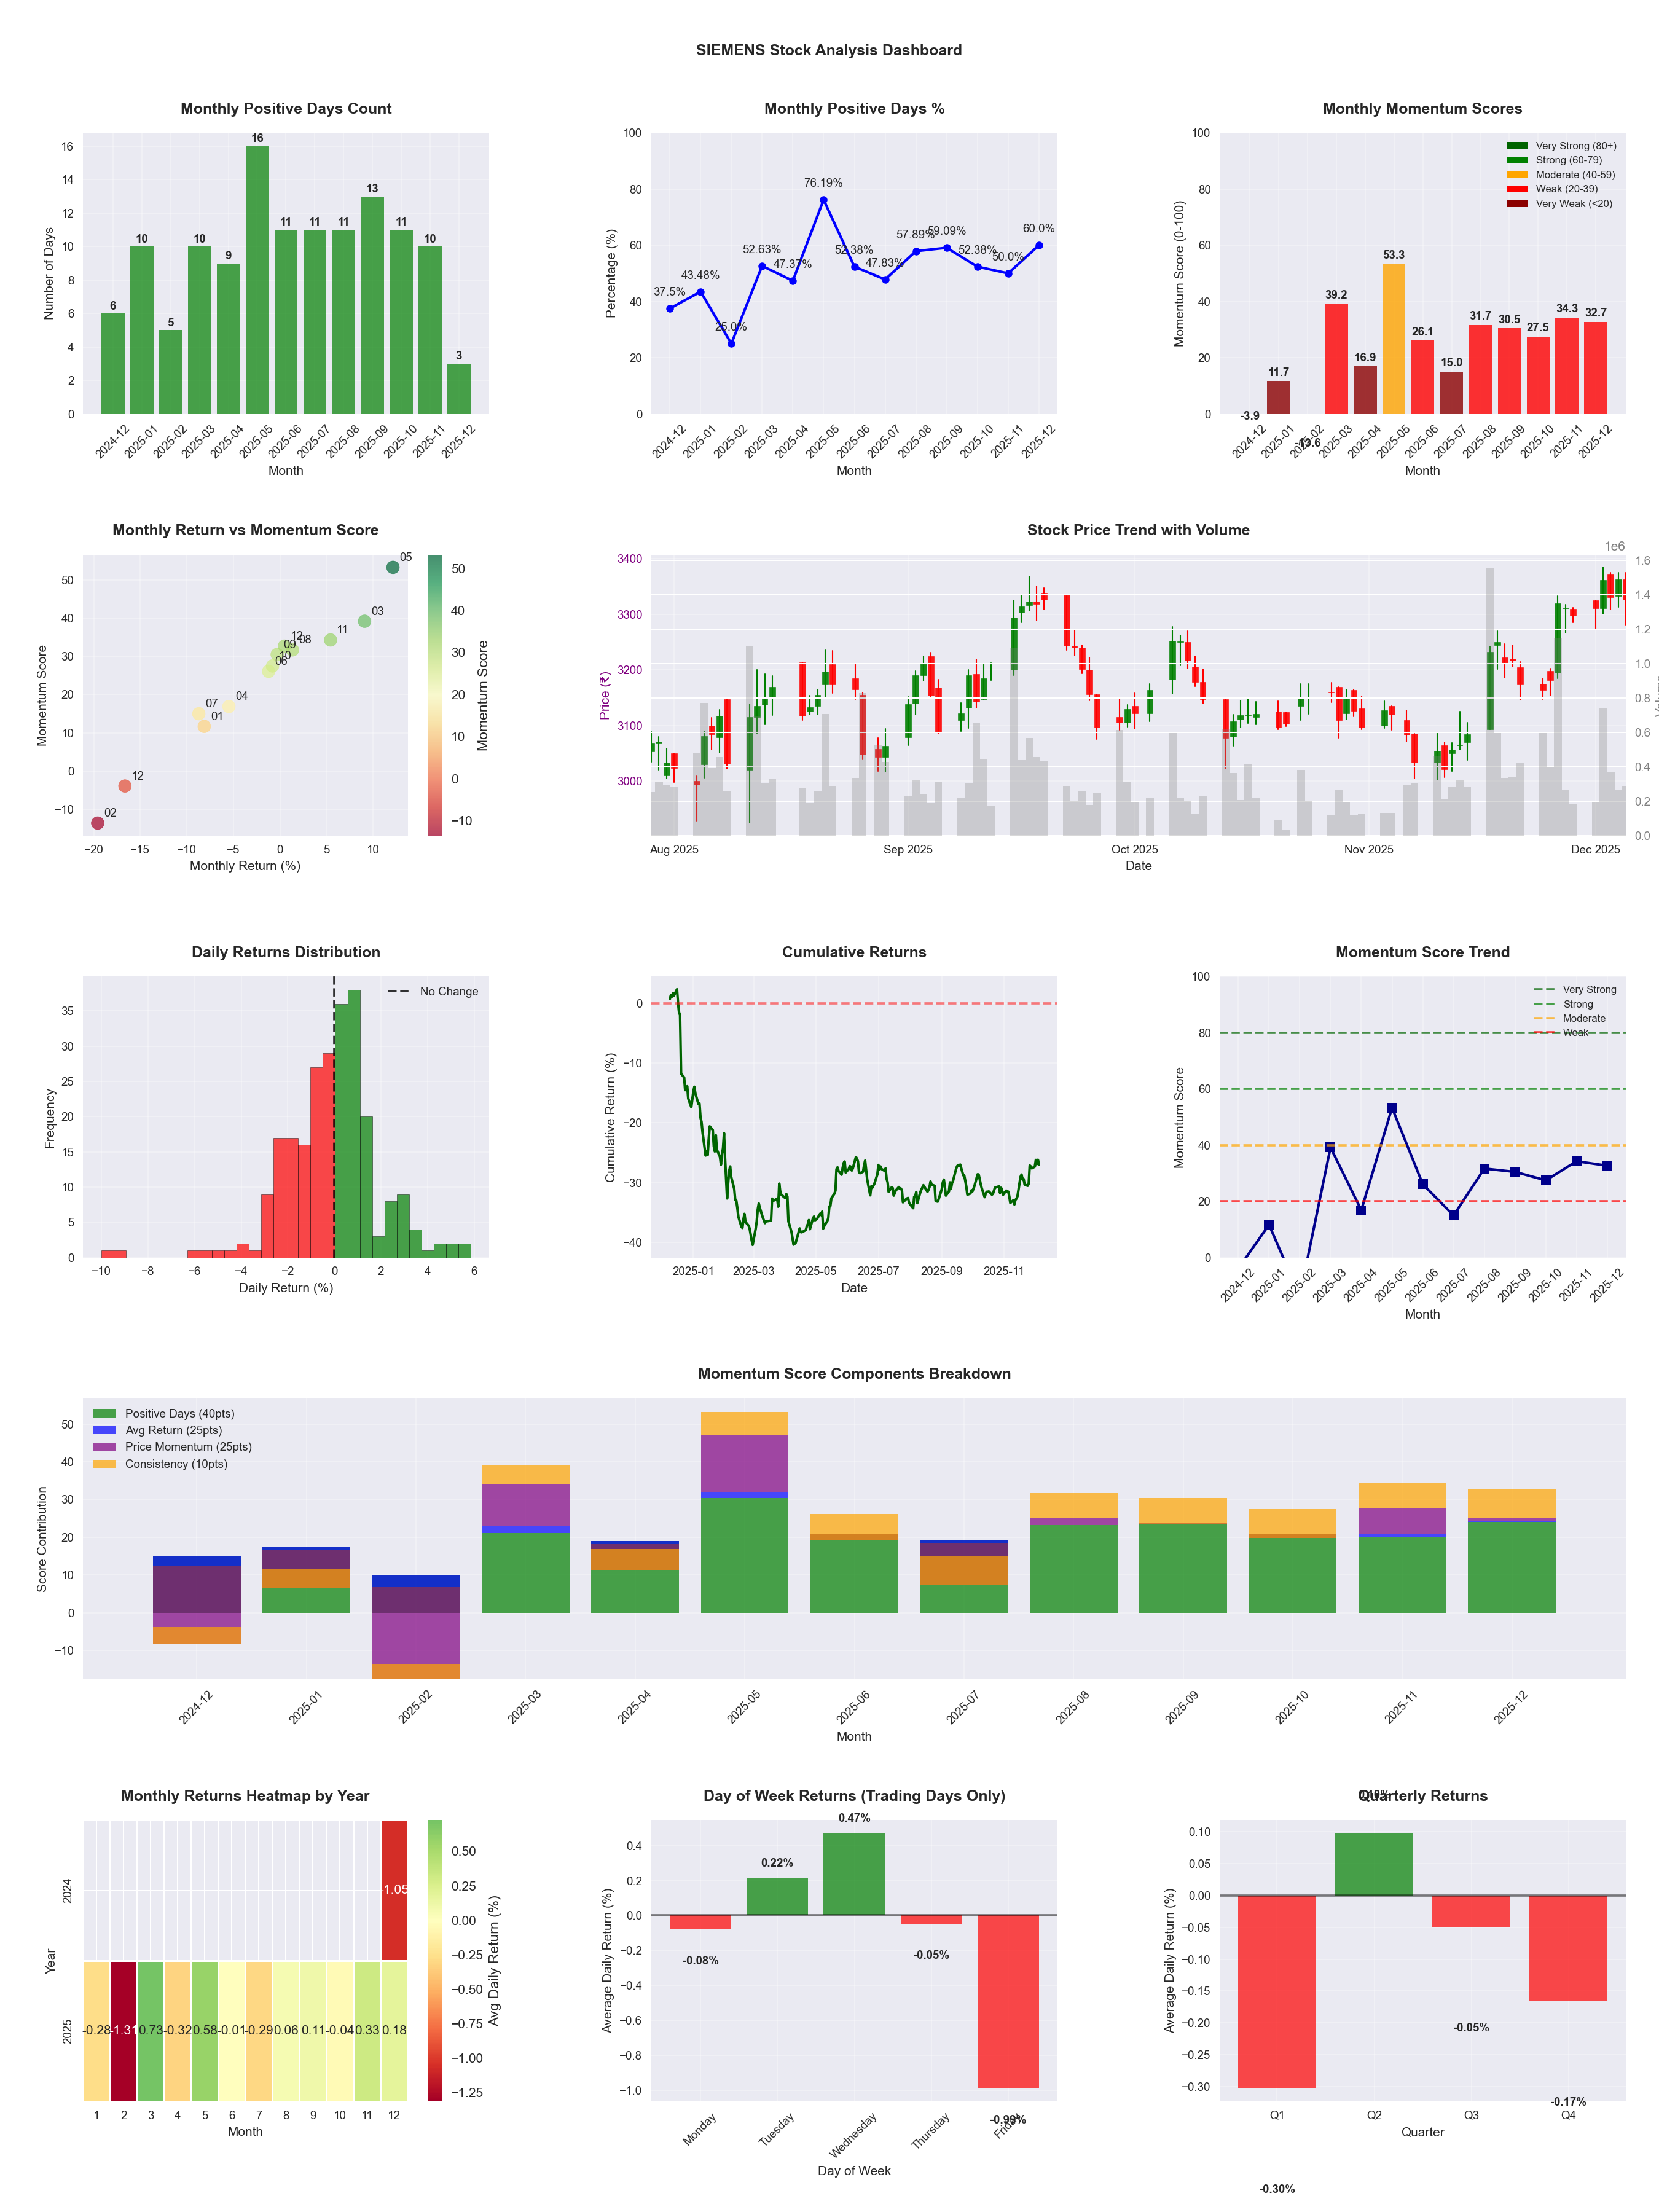
📊 Key Insights & Metrics
Symbol
📈 SIEMENS
Date
📅 2026-04-11
Volatility
🟡 1.78%
Win Rate
⚠️ 56.7%
Avg Daily Return
📈 +0.10%
Max Drawdown
📉 -15.80%
IBD RS Score
📊 80.1
Strong
Market Rank
#98
Best Month
🏆 2026-04
Worst Month
📉 2026-03
Best Months to Trade
📅 Apr, May, Feb
Best Days to Trade
📅 Wednesday, Tuesday
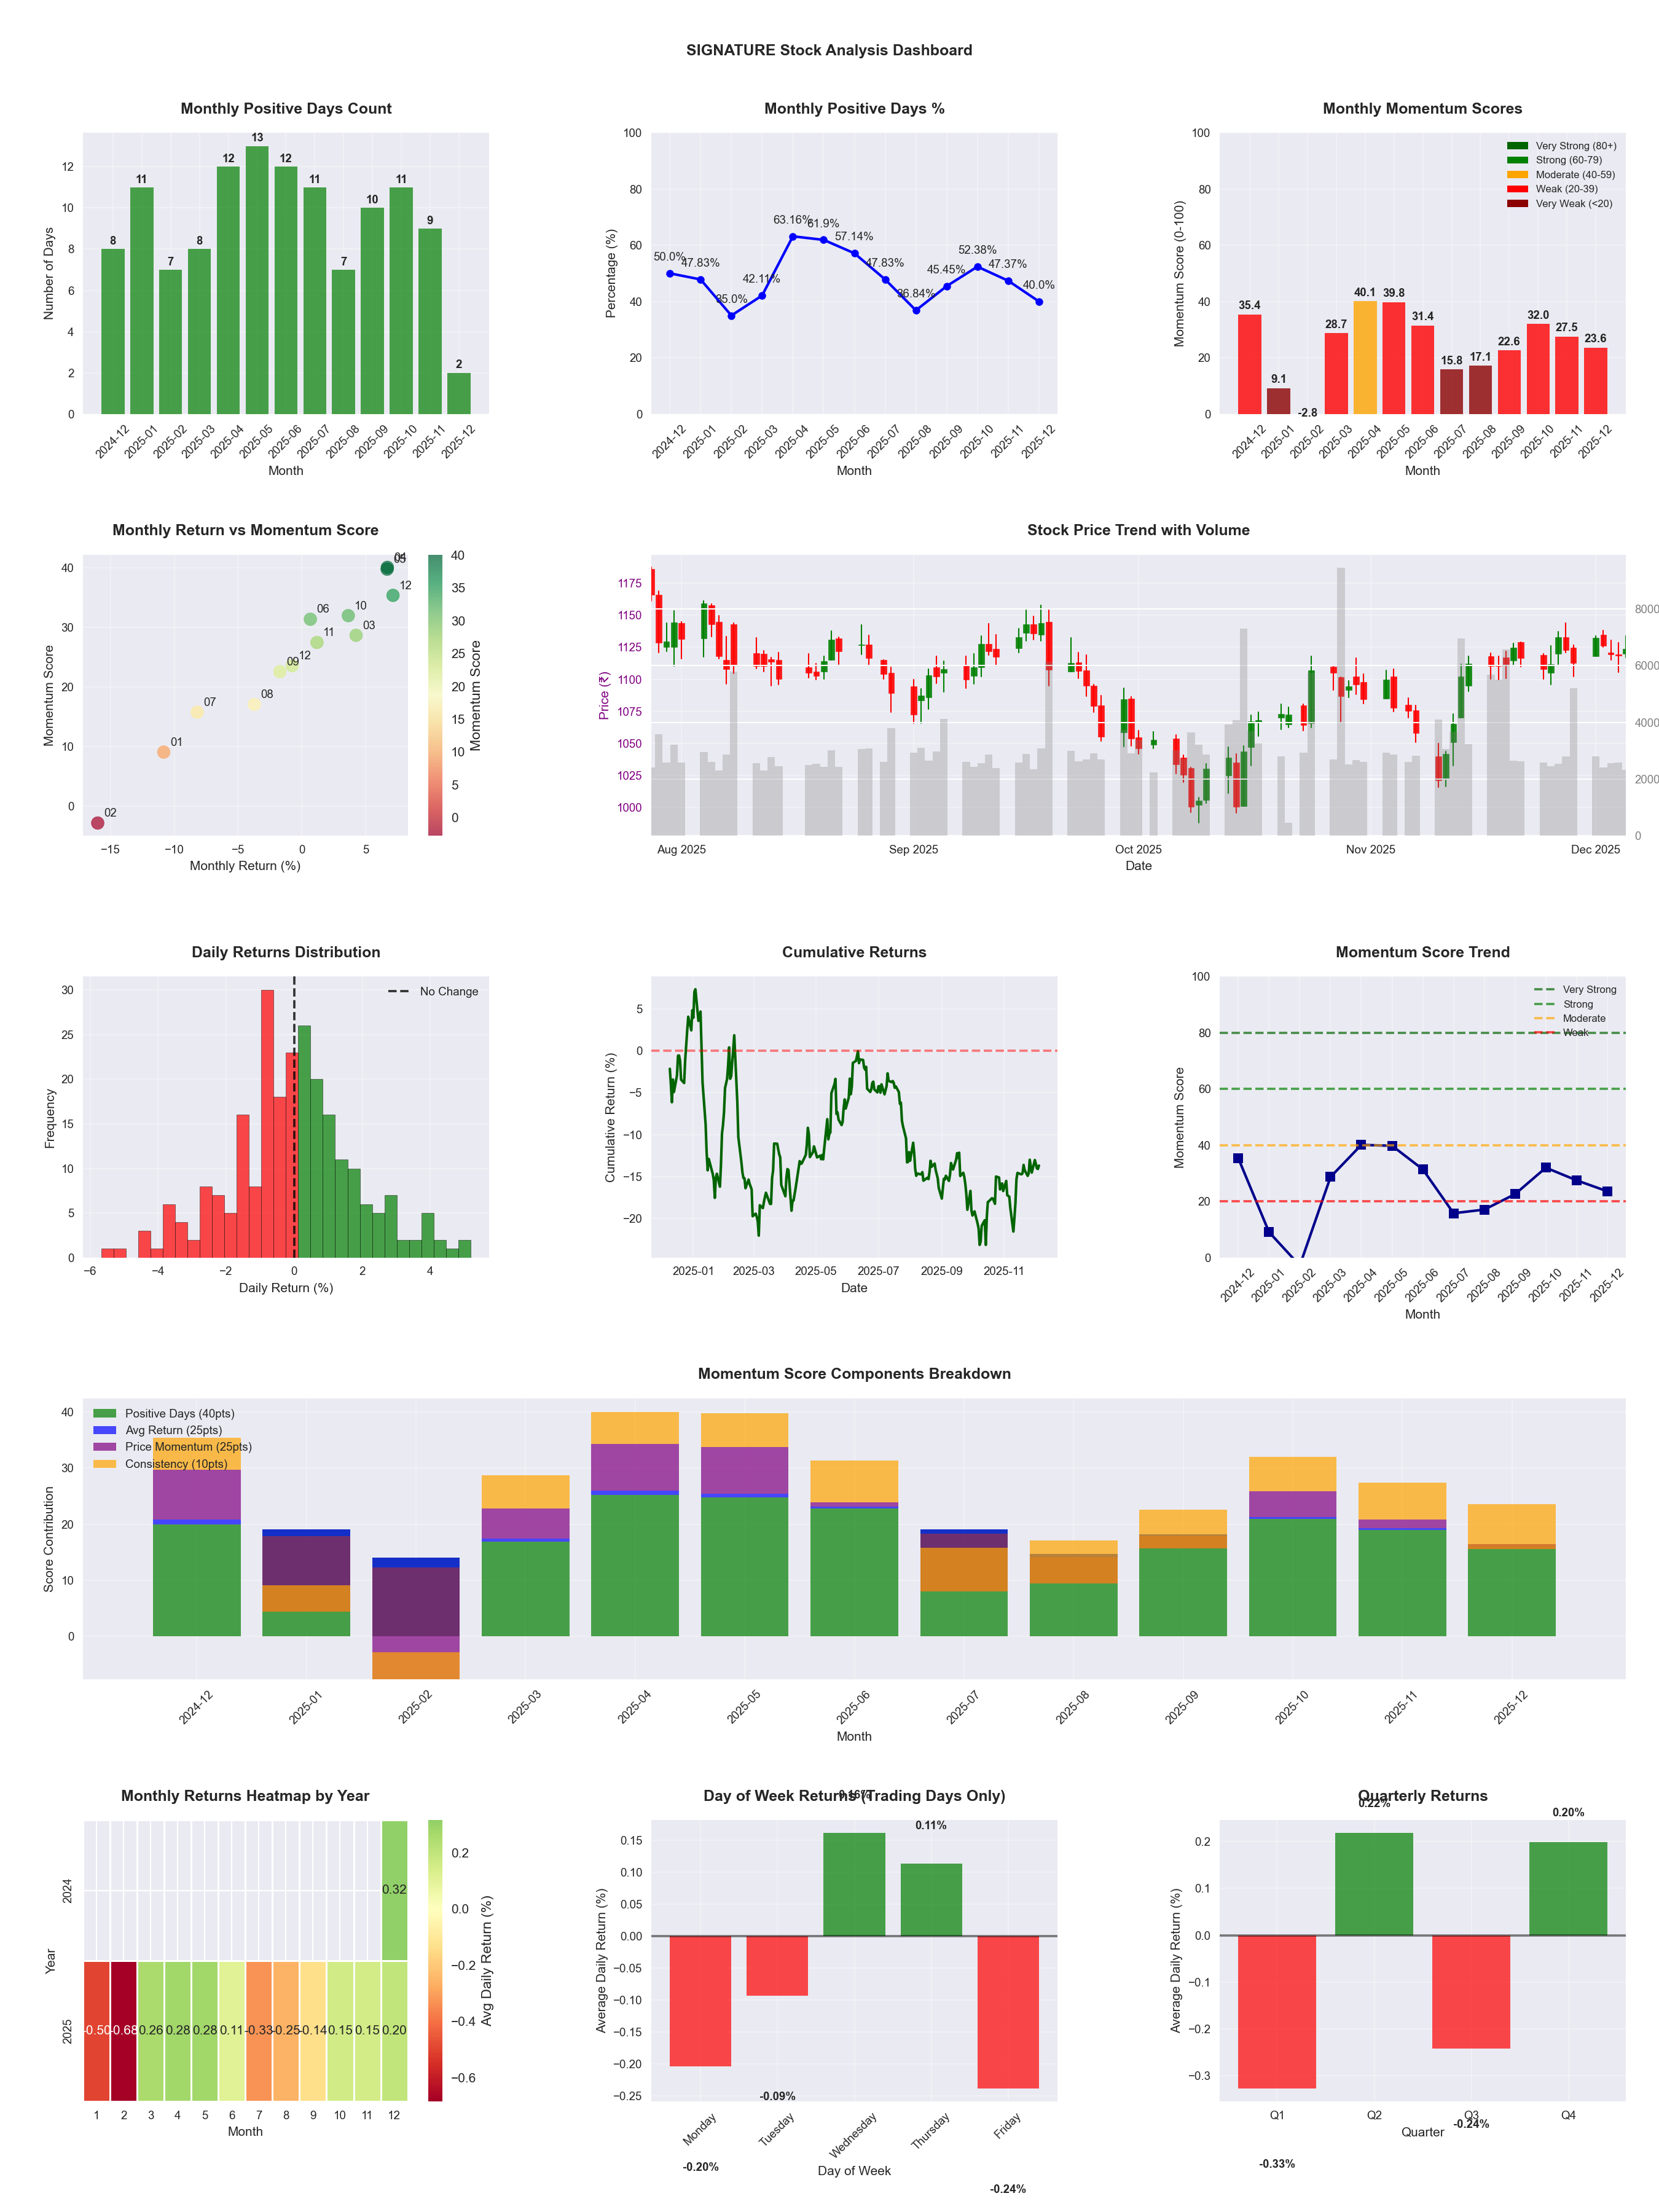
📊 Key Insights & Metrics
Symbol
📈 SIGNATURE
Date
📅 2026-04-11
Volatility
🟡 2.11%
Risk Profile
⚠️ suitable for aggressive investors
Win Rate
⚠️ 49.0%
Avg Daily Return
📉 -0.09%
Max Drawdown
📉 -45.12%
IBD RS Score
📊 9.7
Weak
Market Rank
#445
Best Month
🏆 2026-04
Best Months to Trade
📅 Apr, Feb, May
Best Days to Trade
📅 Wednesday, Friday
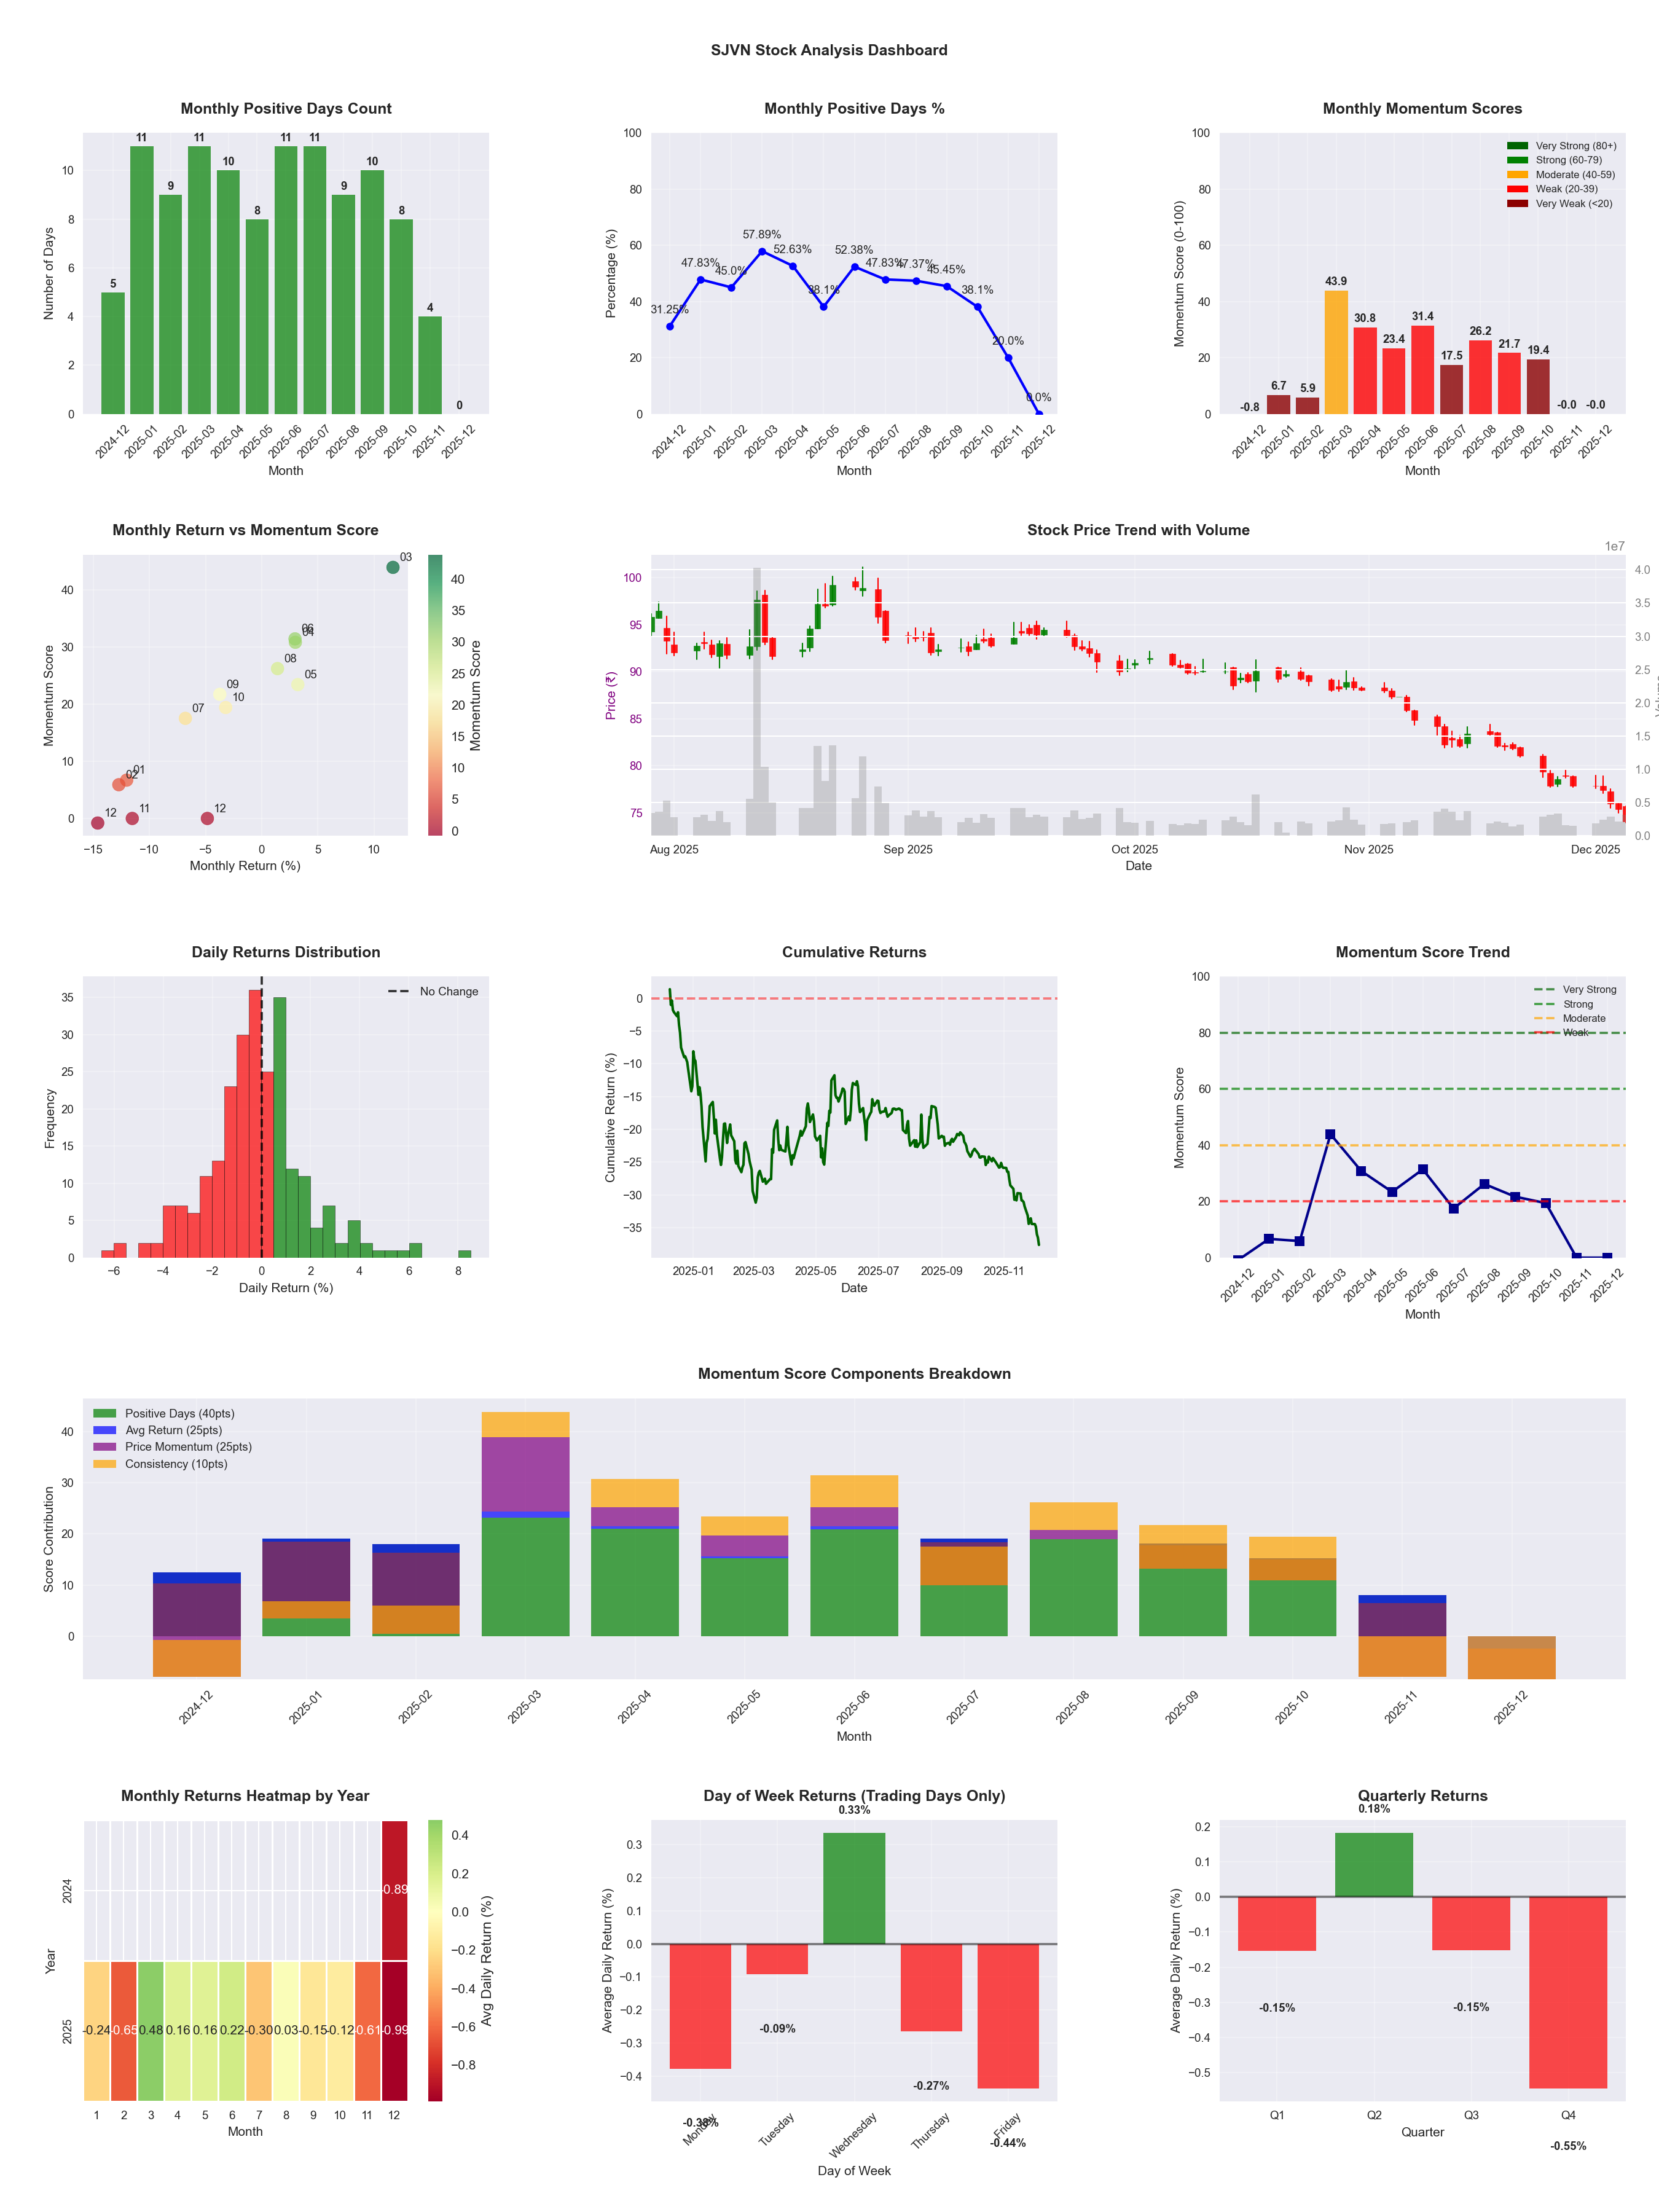
📊 Key Insights & Metrics
Symbol
📈 SJVN
Date
📅 2026-04-11
Volatility
🟡 2.17%
Risk Profile
⚠️ suitable for aggressive investors
Win Rate
⚠️ 43.9%
Avg Daily Return
📉 -0.07%
Max Drawdown
📉 -38.61%
IBD RS Score
📊 24.1
Weak
Market Rank
#374
Best Month
🏆 2026-04
Worst Month
📉 2025-11
Best Months to Trade
📅 Apr, Jun, May
Best Days to Trade
📅 Wednesday, Tuesday
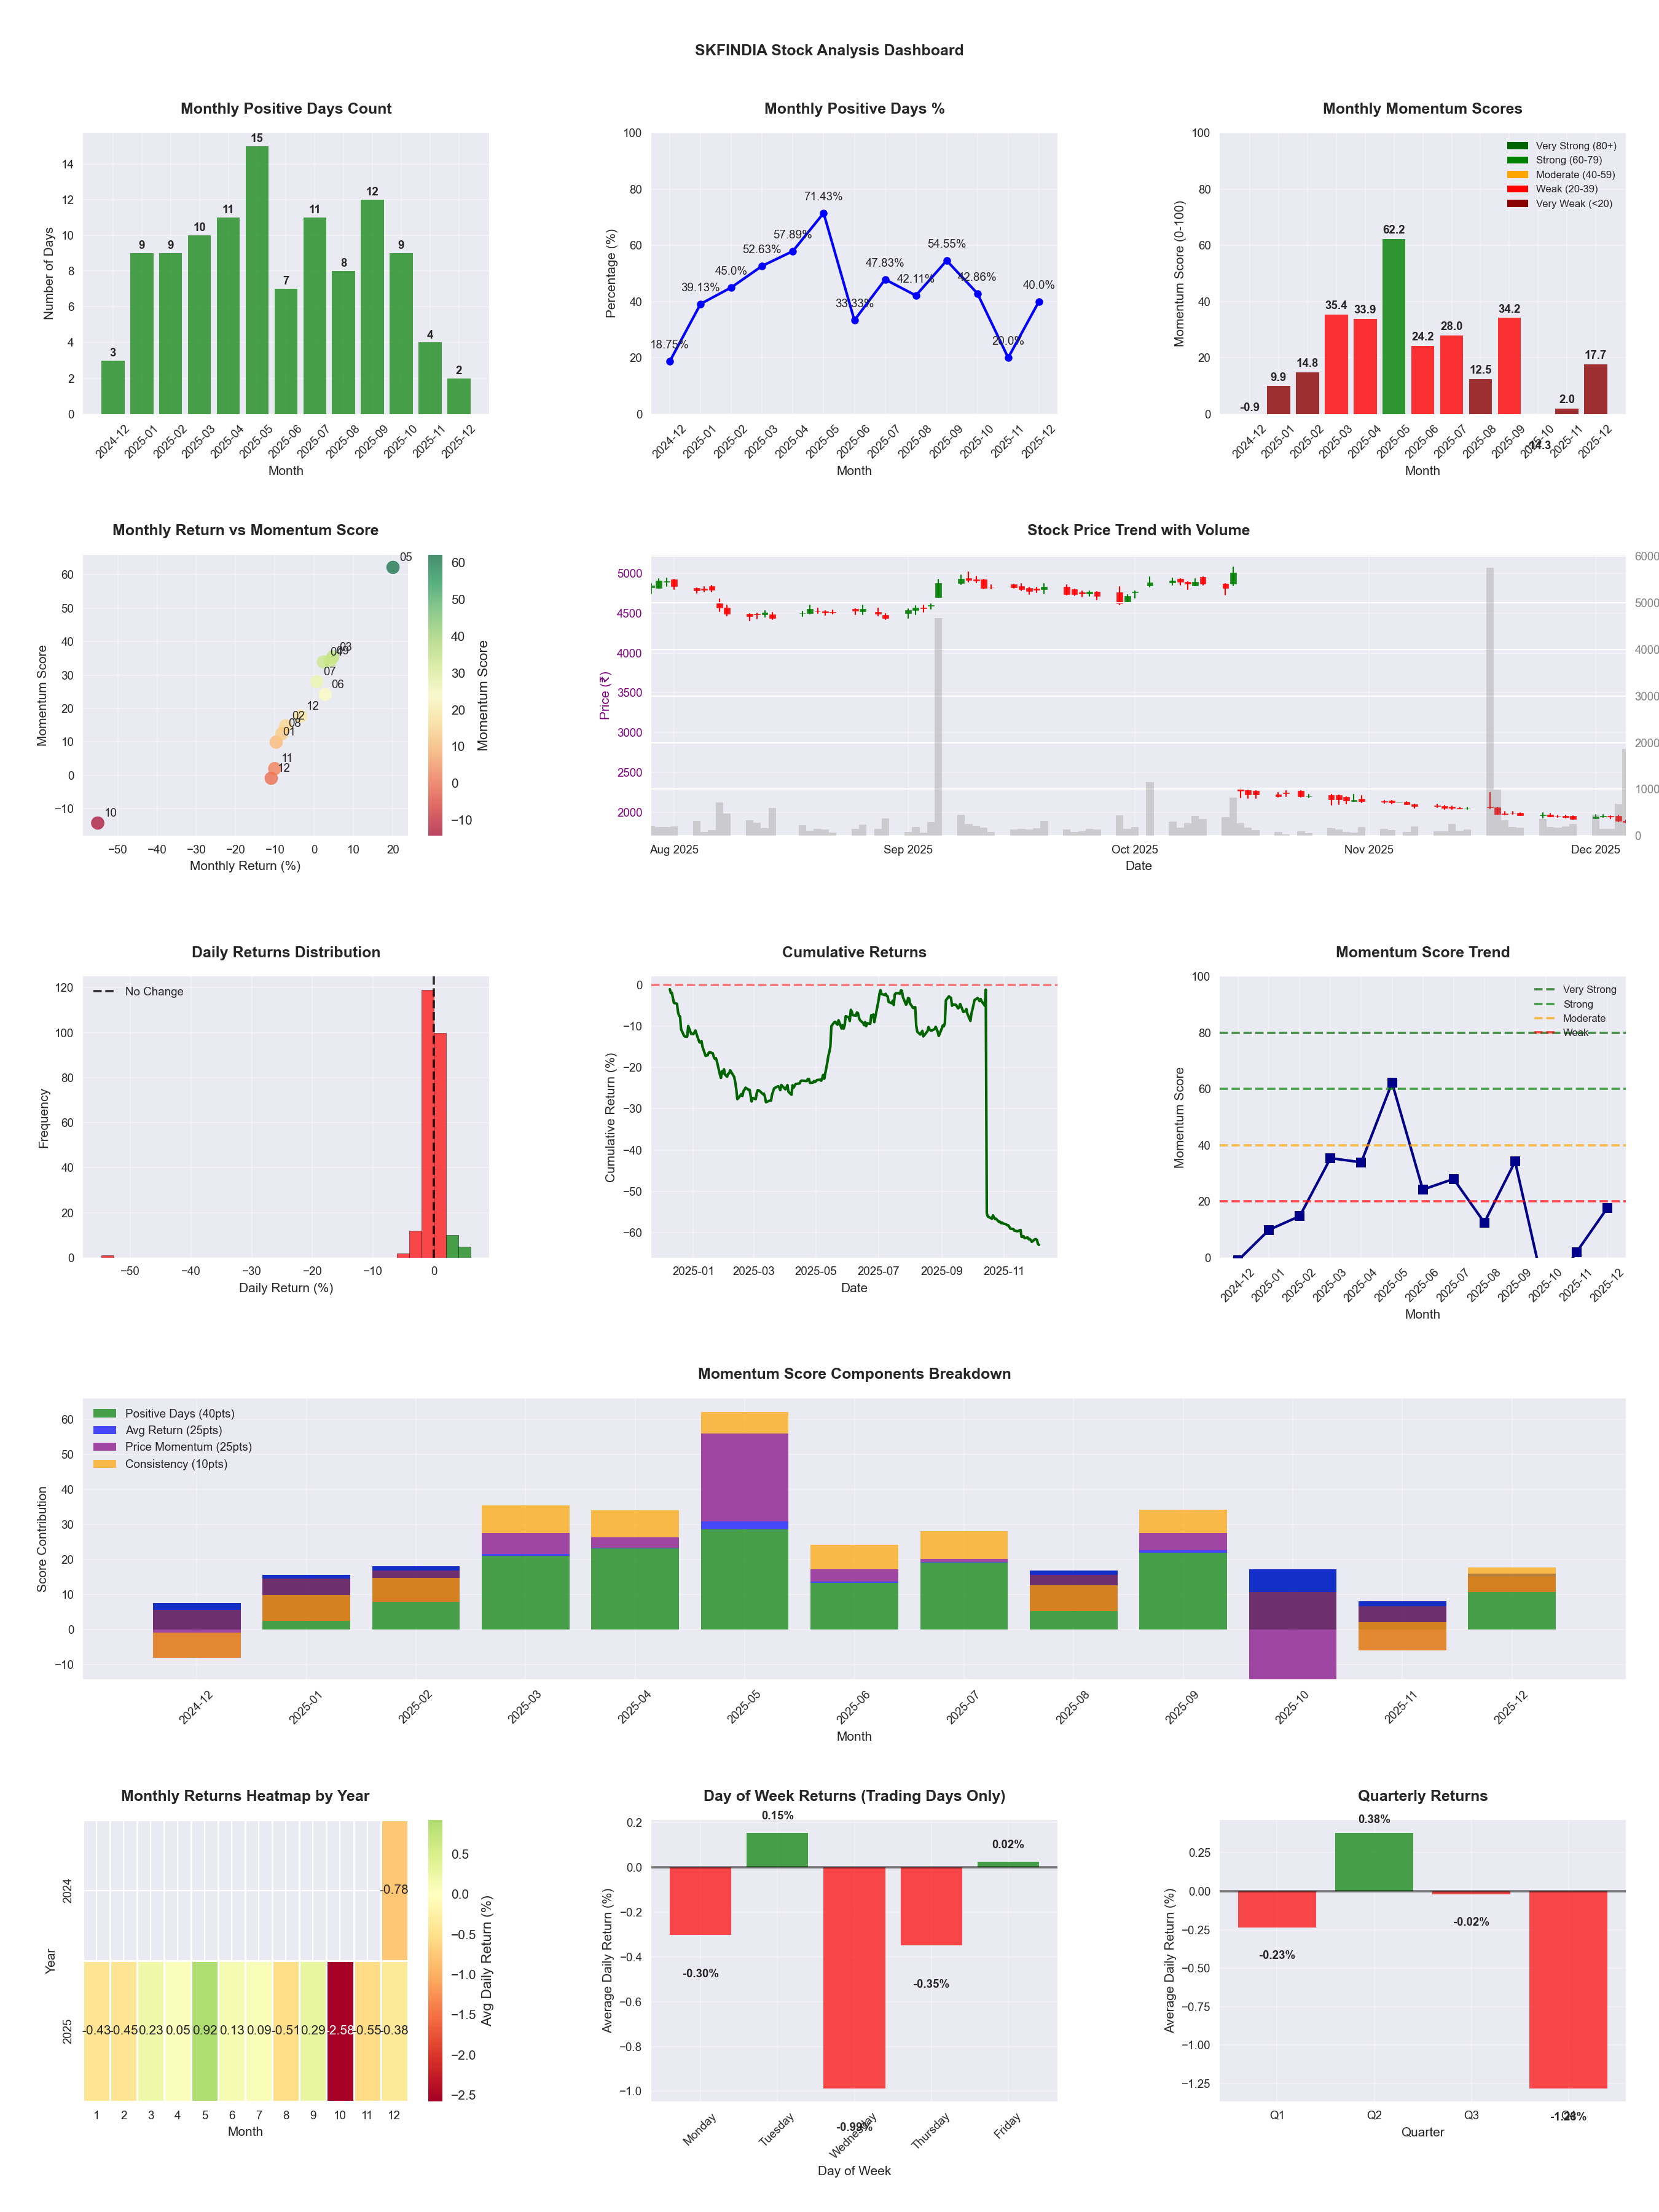
📊 Key Insights & Metrics
Symbol
📈 SKFINDIA
Date
📅 2026-04-11
Volatility
🔴 3.90%
Risk Profile
⚠️ suitable for aggressive investors
Win Rate
⚠️ 43.5%
Avg Daily Return
📉 -0.24%
Max Drawdown
📉 -71.77%
IBD RS Score
📊 0.6
Weak
Market Rank
#490
Best Month
🏆 2025-05
Best Months to Trade
📅 May, Apr, Sep
Best Days to Trade
📅 Tuesday, Friday
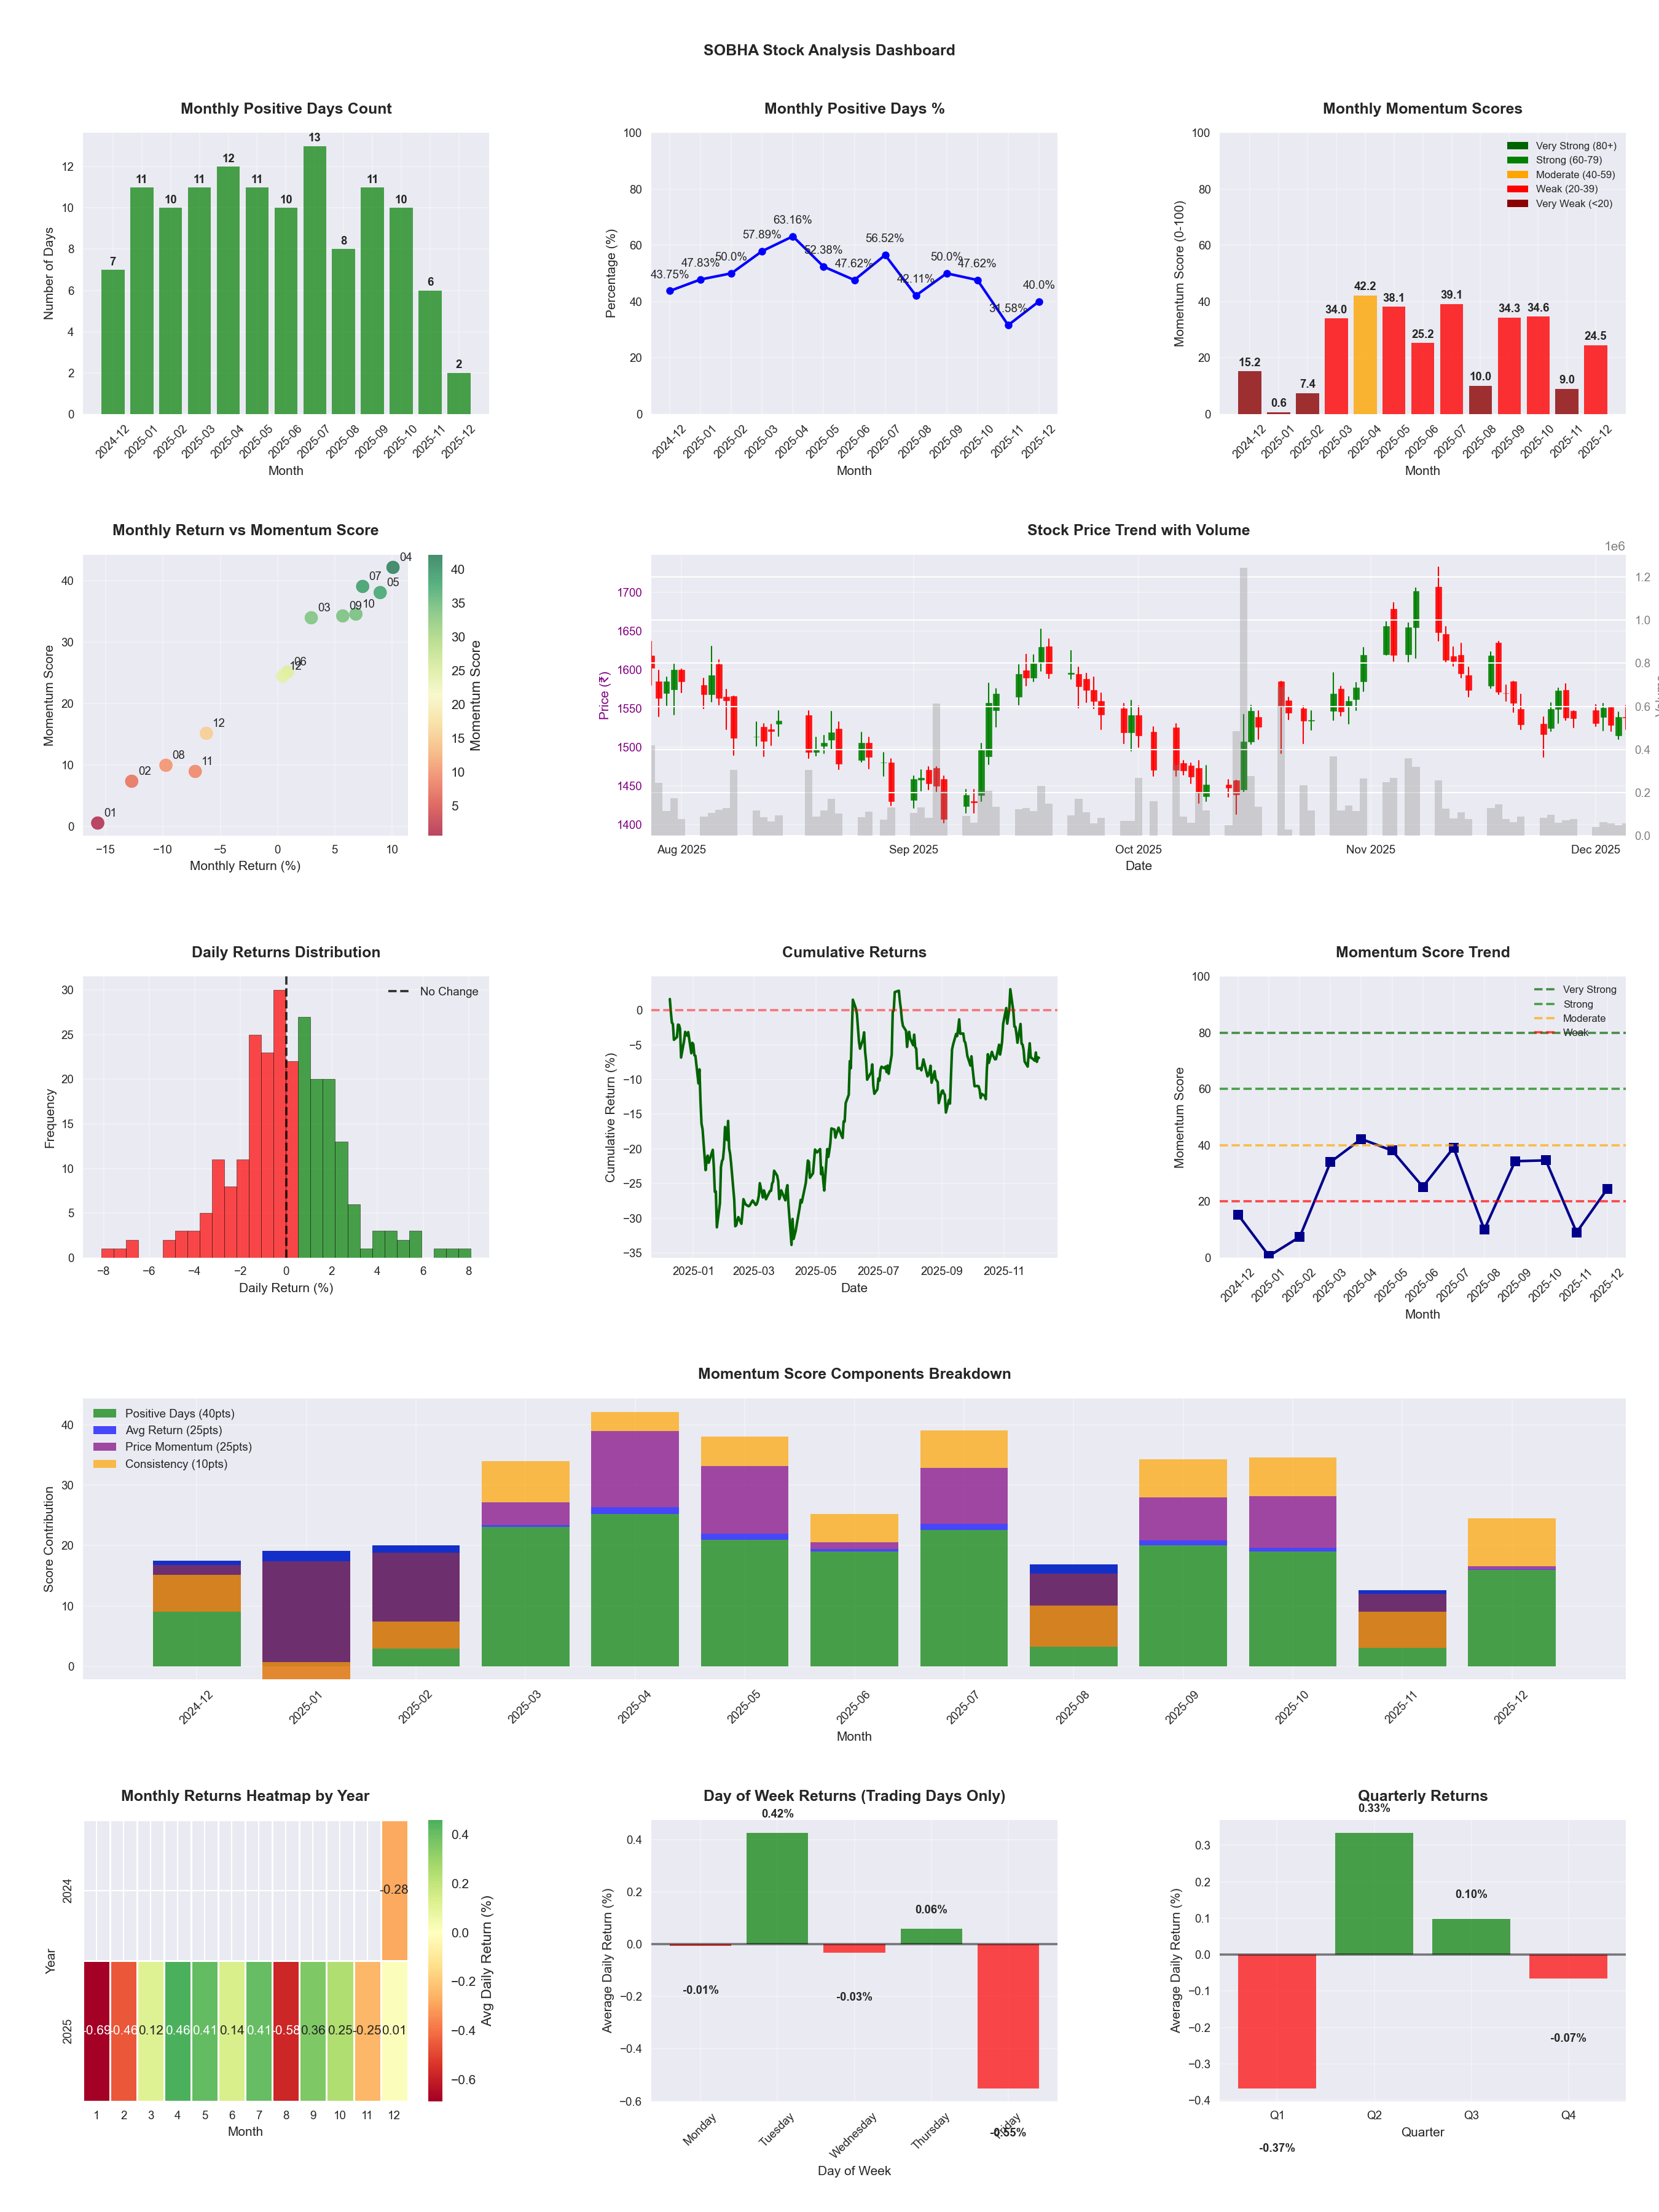
📊 Key Insights & Metrics
Symbol
📈 SOBHA
Date
📅 2026-04-11
Volatility
🟡 2.23%
Risk Profile
⚠️ suitable for aggressive investors
Win Rate
⚠️ 47.8%
Avg Daily Return
📈 +0.08%
Max Drawdown
📉 -32.00%
IBD RS Score
📊 36.3
Weak
Market Rank
#314
Best Month
🏆 2025-04
Worst Month
📉 2026-03
Best Months to Trade
📅 Apr, May, Jul
Best Days to Trade
📅 Wednesday, Monday
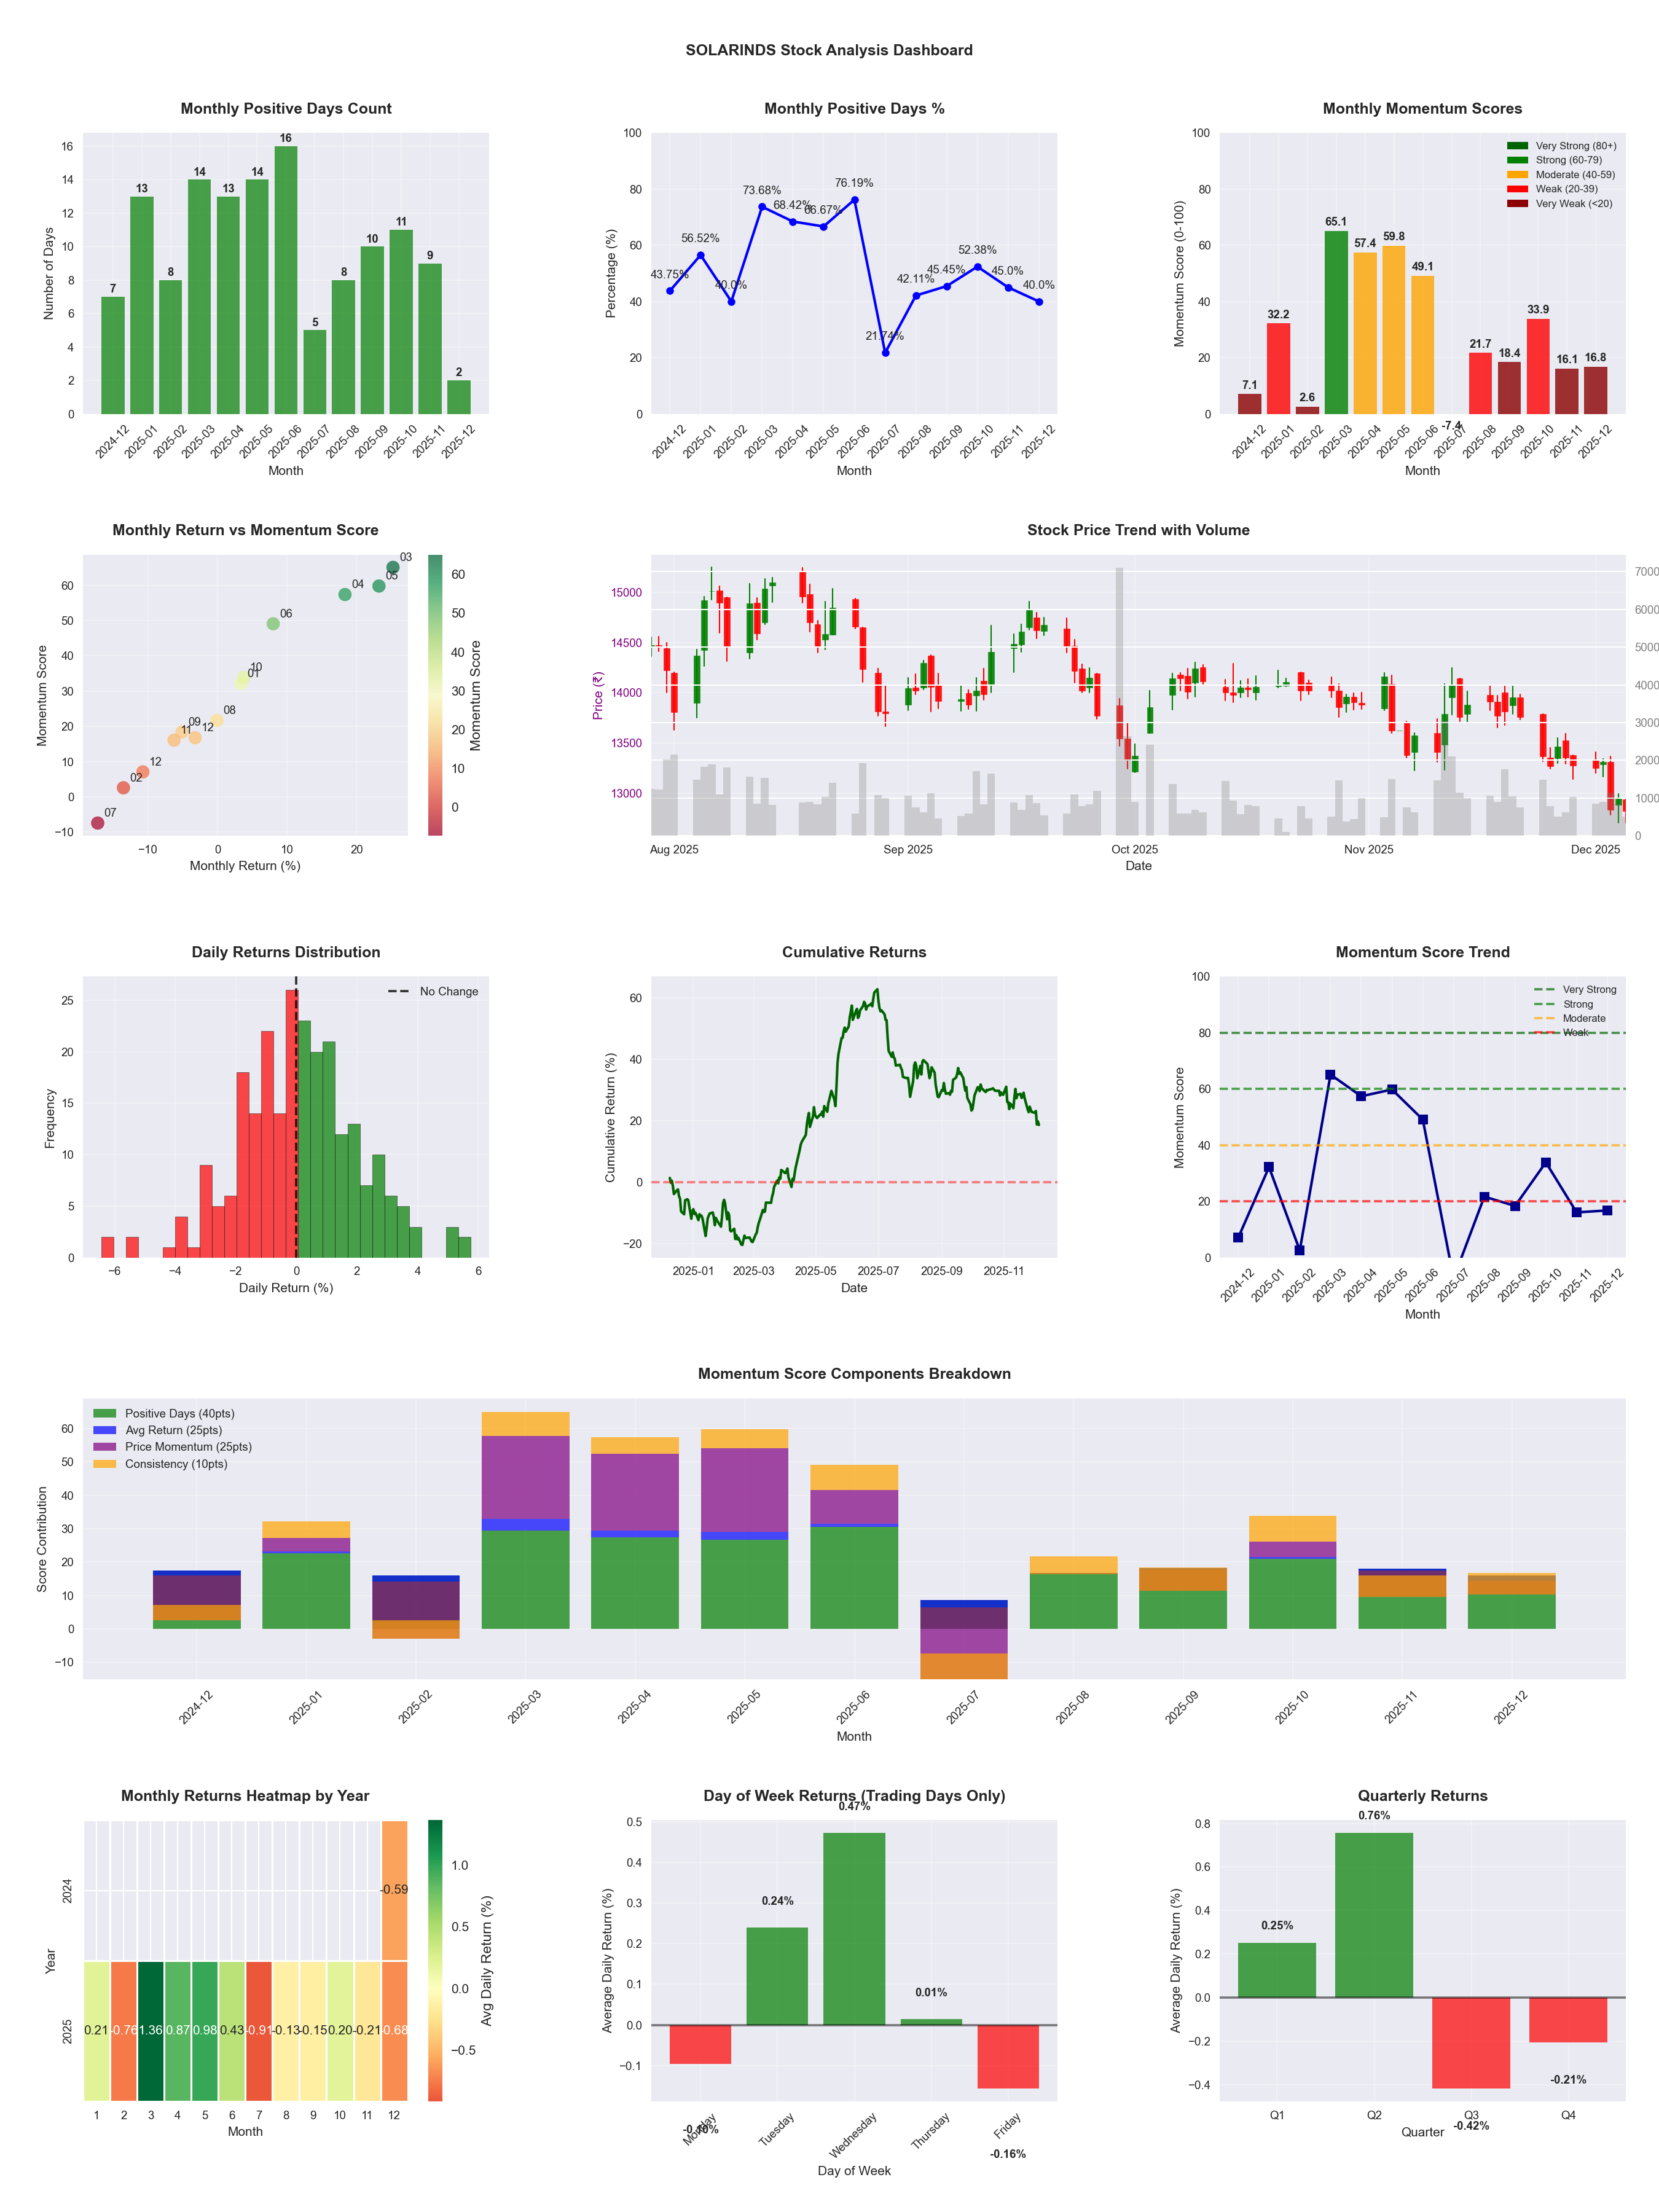
📊 Key Insights & Metrics
Symbol
📈 SOLARINDS
Date
📅 2026-04-11
Volatility
🟡 2.01%
Risk Profile
⚠️ suitable for aggressive investors
Win Rate
⚠️ 50.6%
Avg Daily Return
📈 +0.11%
Max Drawdown
📉 -33.07%
IBD RS Score
📊 69.6
Average
Market Rank
#150
Best Month
🏆 2026-04
Best Months to Trade
📅 Apr, May, Jan
Best Days to Trade
📅 Wednesday, Monday
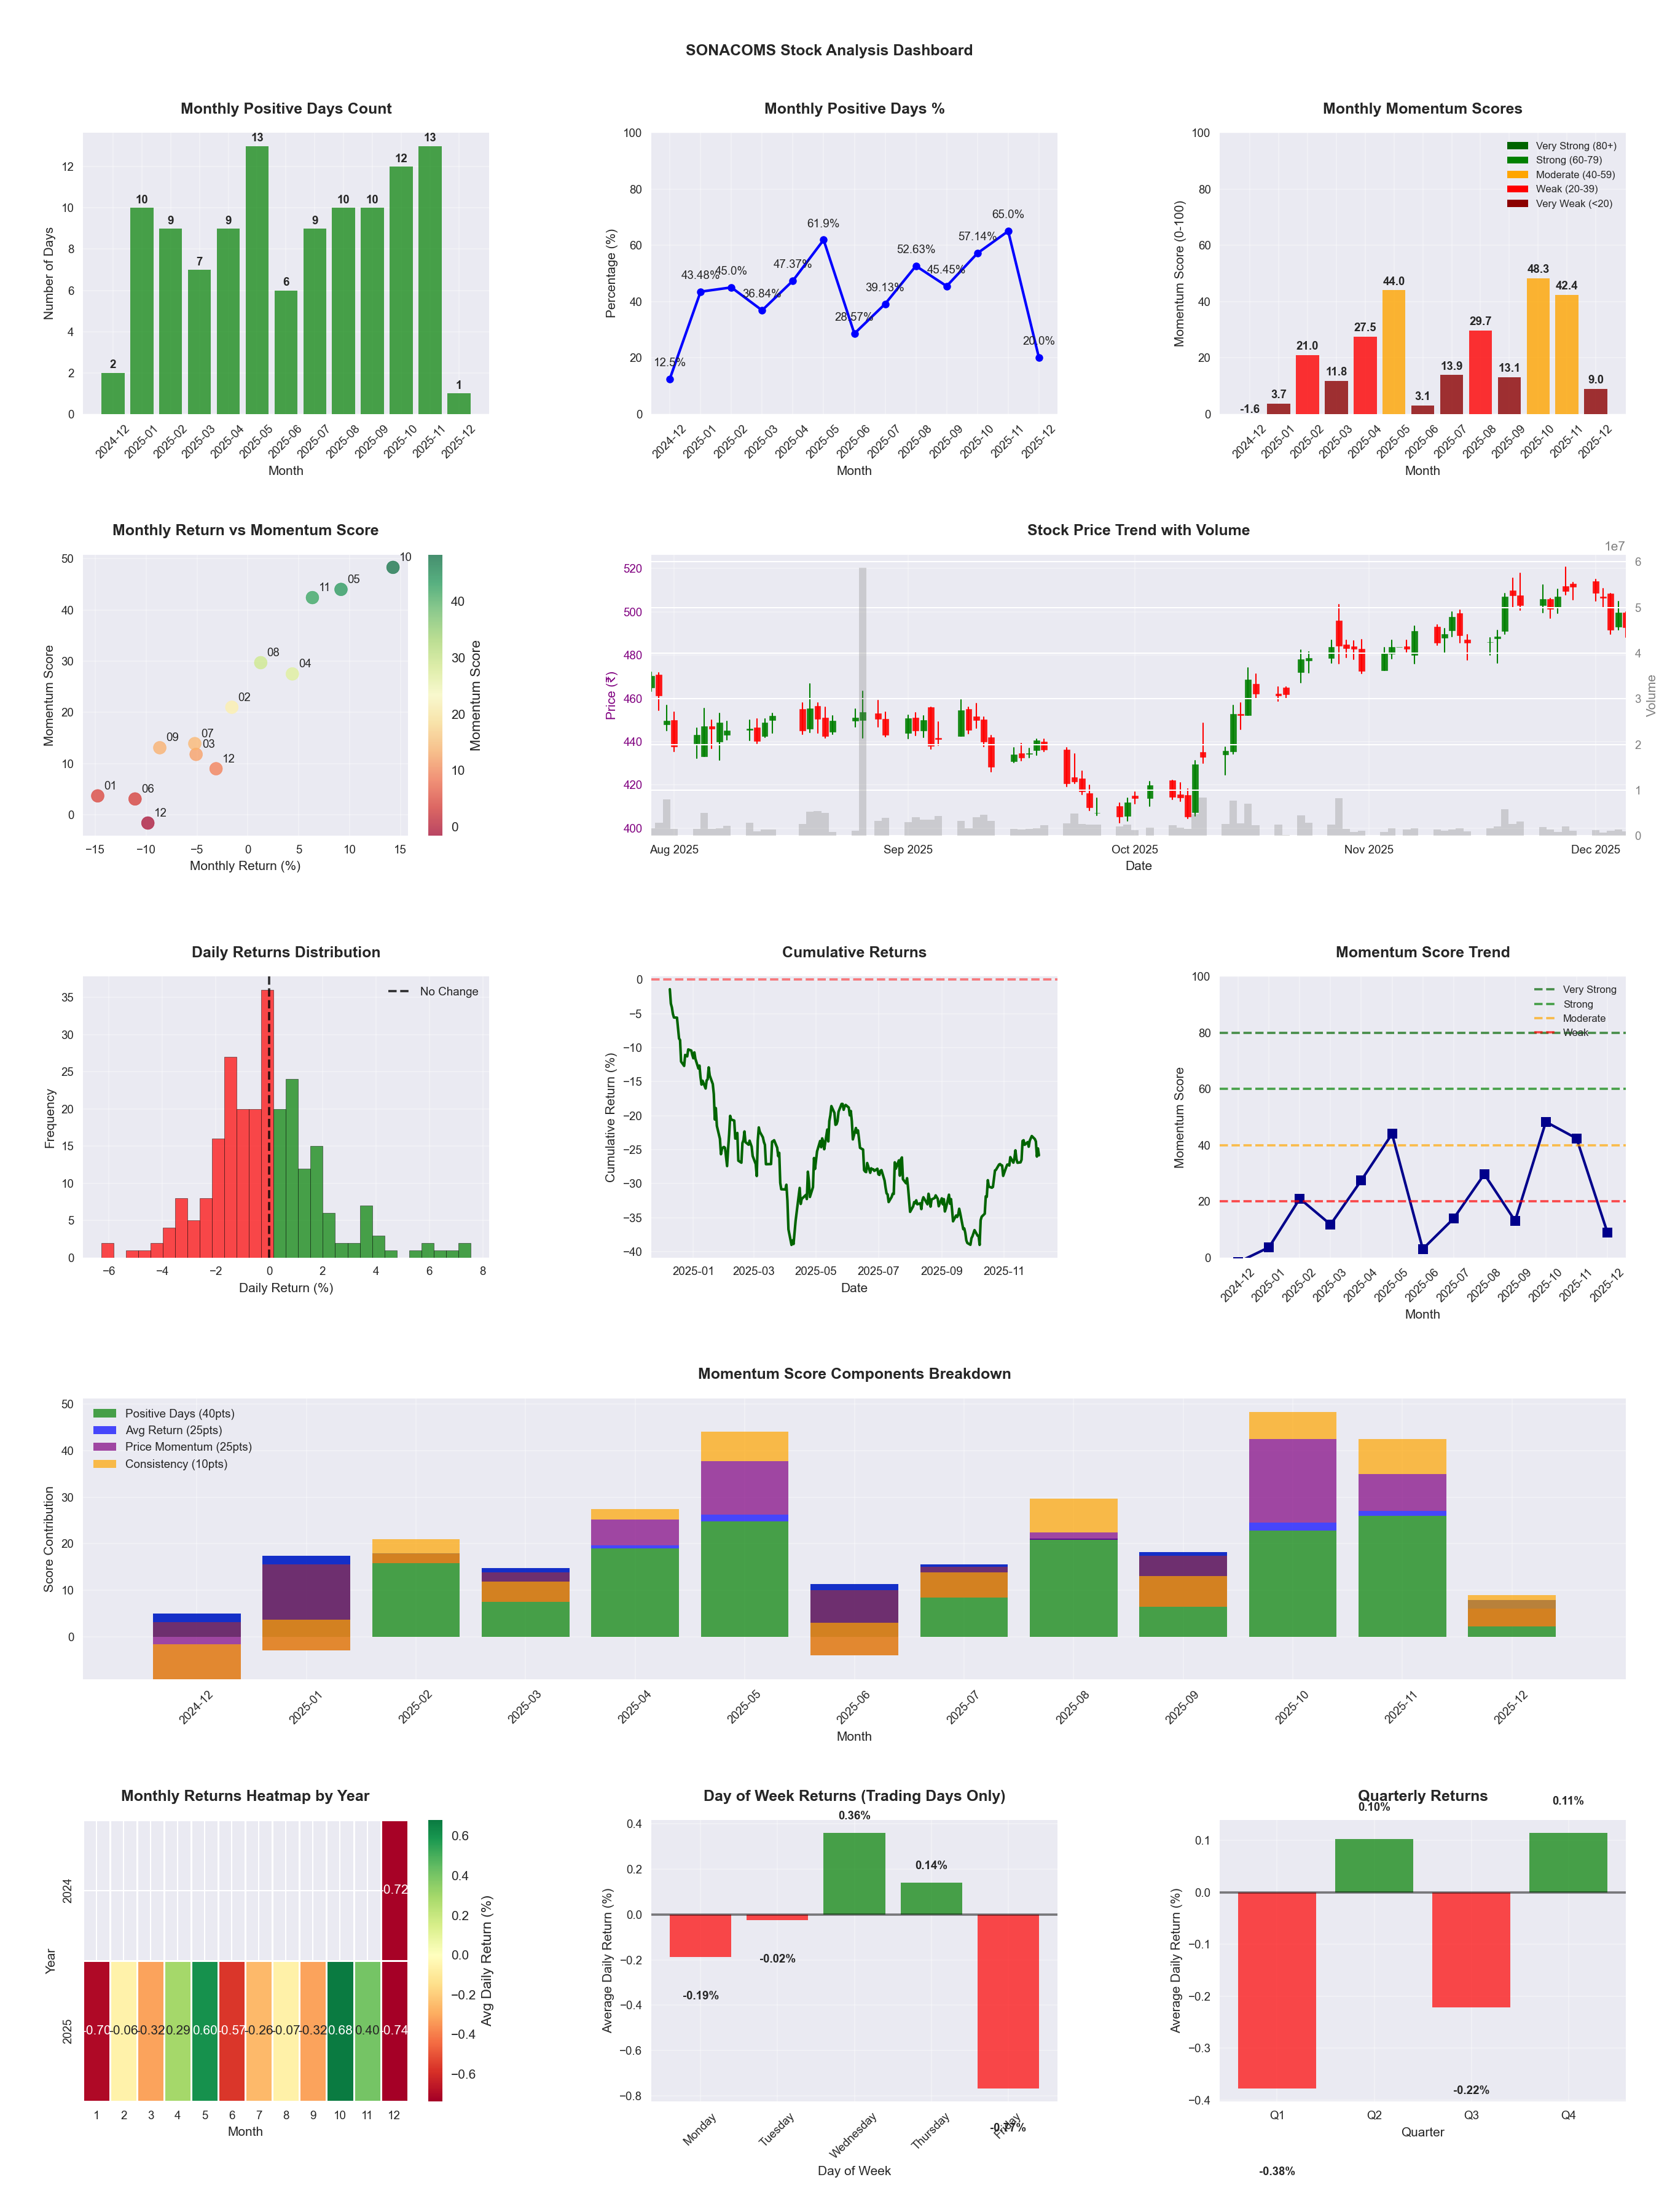
📊 Key Insights & Metrics
Symbol
📈 SONACOMS
Date
📅 2026-04-11
Volatility
🟡 2.09%
Risk Profile
⚠️ suitable for aggressive investors
Win Rate
⚠️ 48.8%
Avg Daily Return
📈 +0.13%
Max Drawdown
📉 -25.39%
IBD RS Score
📊 90.7
Leader
Market Rank
#46
Best Month
🏆 2026-04
Worst Month
📉 2025-06
Best Months to Trade
📅 Apr, Oct, May
Best Days to Trade
📅 Wednesday, Tuesday
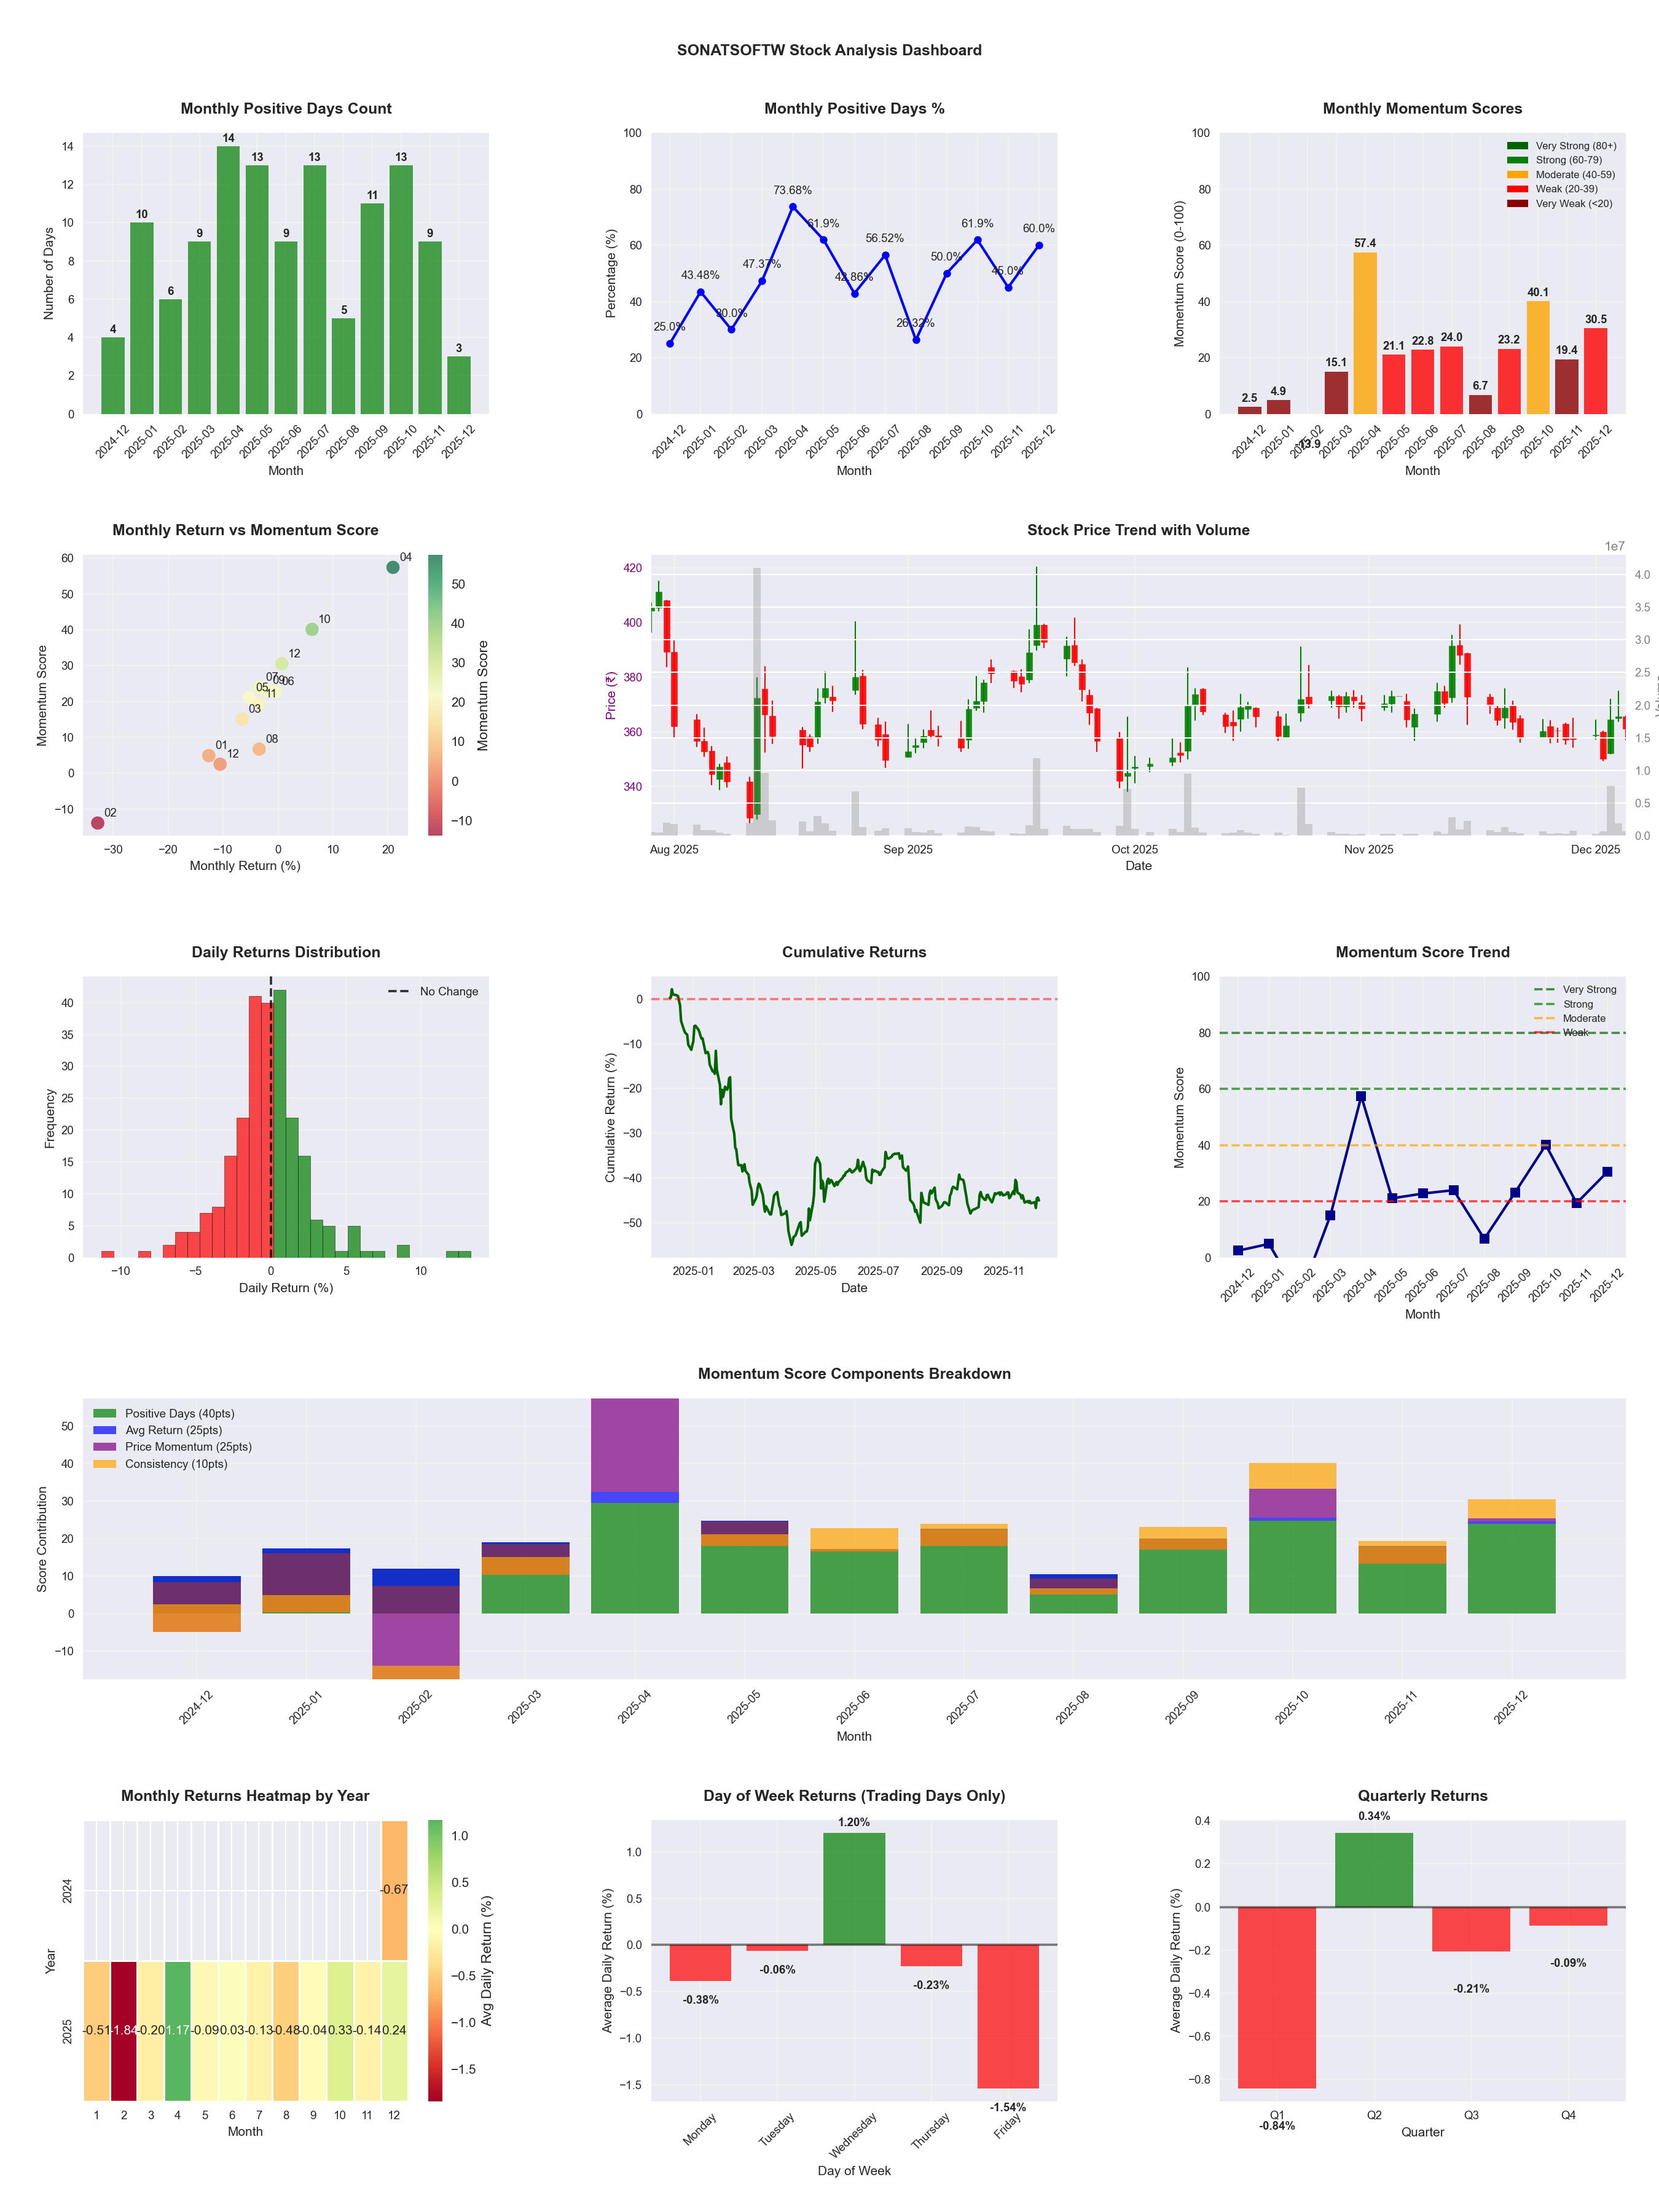
📊 Key Insights & Metrics
Symbol
📈 SONATSOFTW
Date
📅 2026-04-11
Volatility
🟡 2.76%
Risk Profile
⚠️ suitable for aggressive investors
Win Rate
⚠️ 48.0%
Avg Daily Return
📉 -0.05%
Max Drawdown
📉 -51.32%
IBD RS Score
📊 3.4
Weak
Market Rank
#476
Best Month
🏆 2025-04
Best Months to Trade
📅 Apr, Oct, Dec
Best Days to Trade
📅 Wednesday, Tuesday
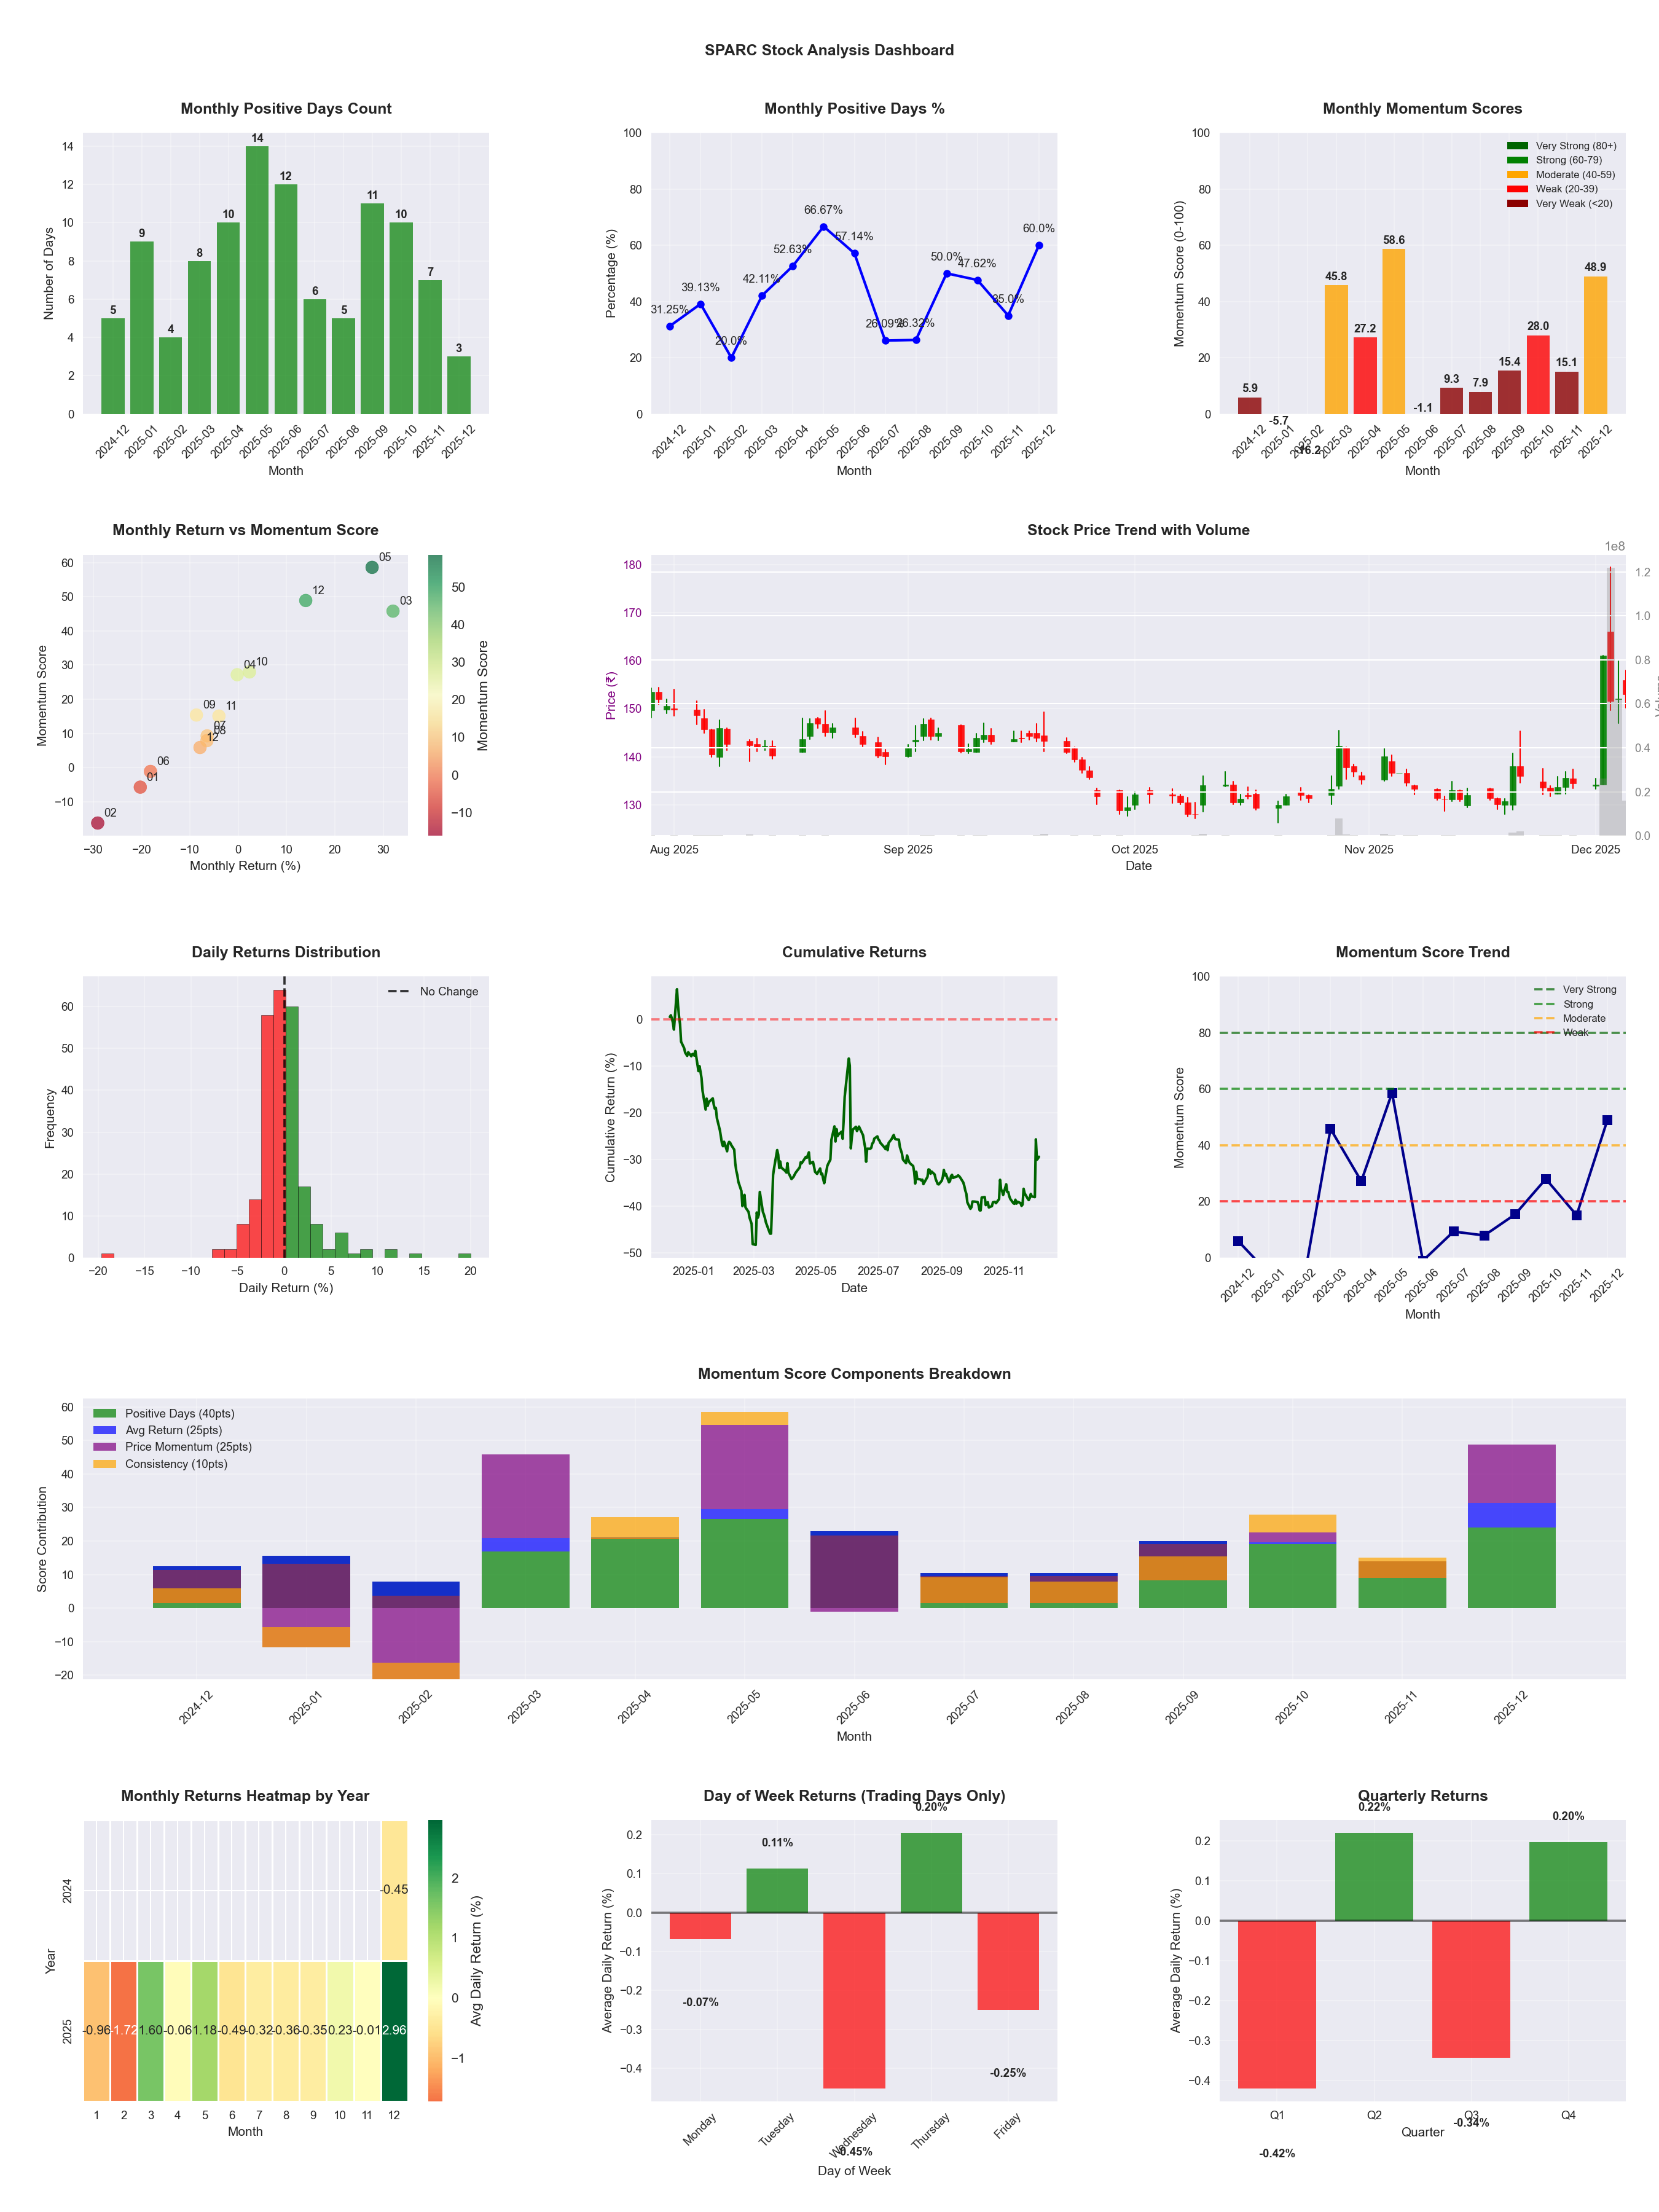
📊 Key Insights & Metrics
Symbol
📈 SPARC
Date
📅 2026-03-21
Volatility
🟡 2.86%
Risk Profile
⚠️ suitable for aggressive investors
Win Rate
⚠️ 43.7%
Avg Daily Return
📉 -0.06%
Max Drawdown
📉 -42.50%
Best Month
🏆 2025-05
Best Months to Trade
📅 May, Oct, Dec
Best Days to Trade
📅 Monday, Tuesday
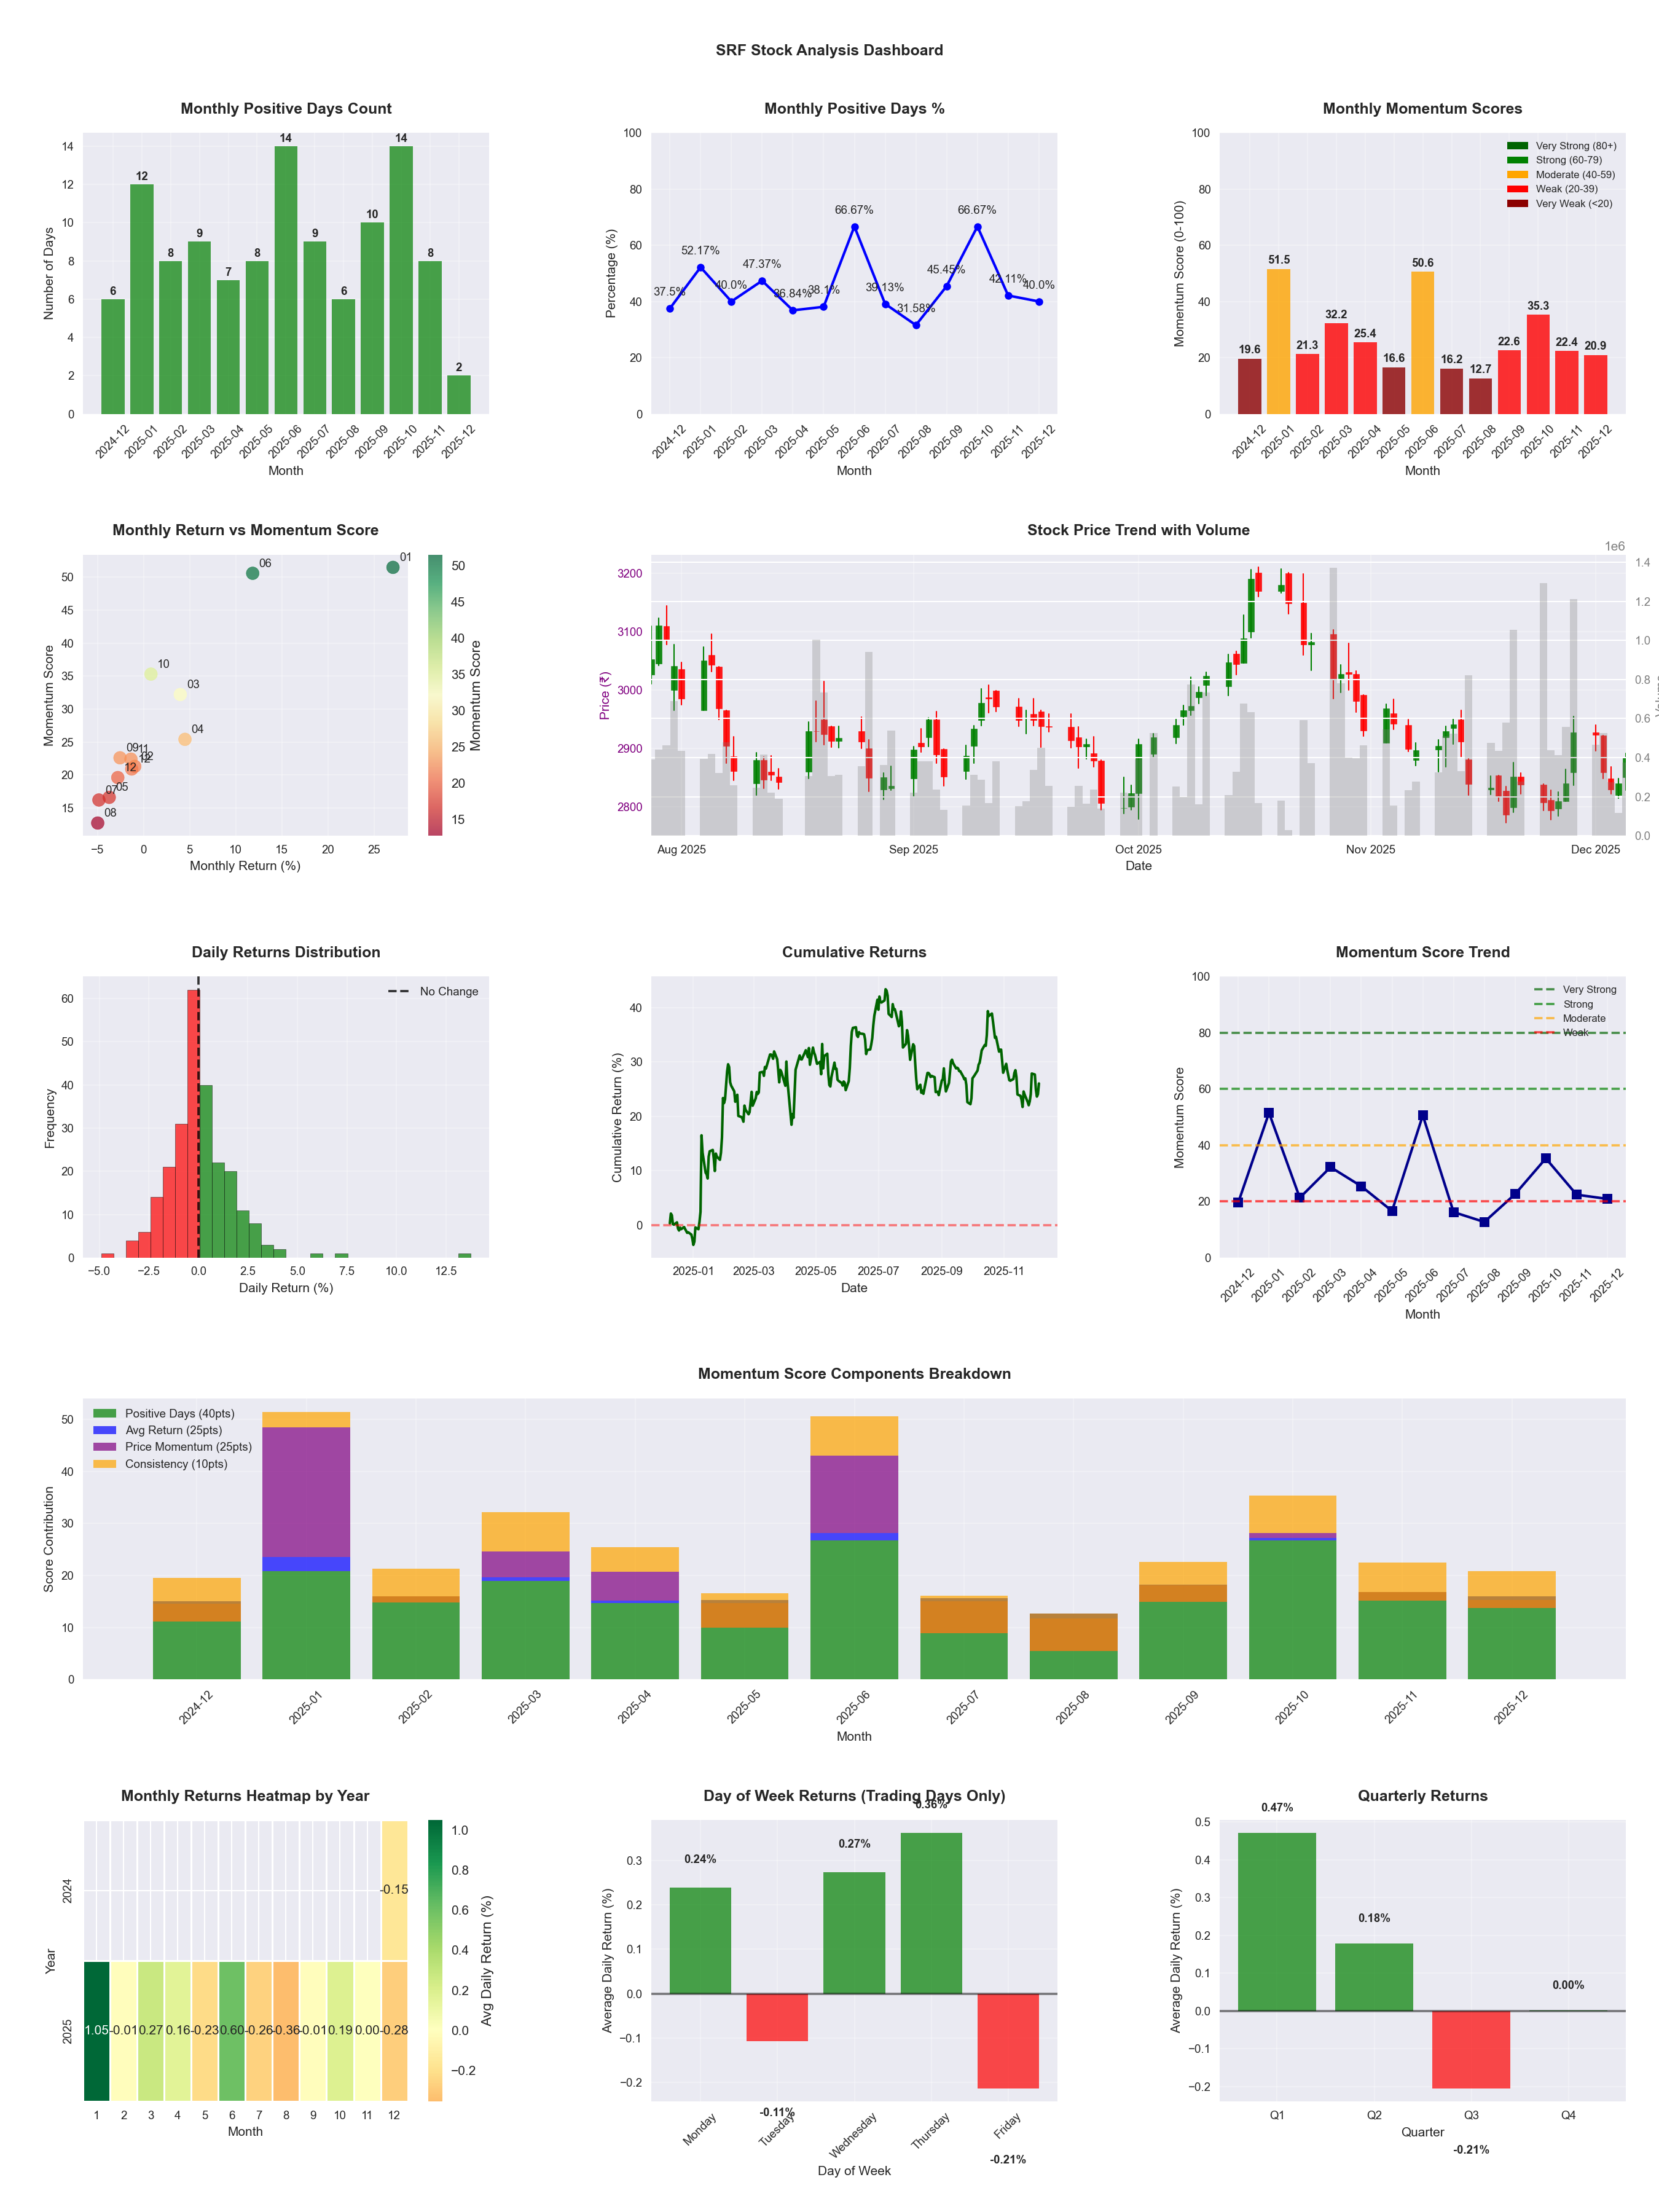
📊 Key Insights & Metrics
Symbol
📈 SRF
Date
📅 2026-04-11
Volatility
🟡 1.74%
Win Rate
⚠️ 45.9%
Avg Daily Return
📉 -0.05%
Max Drawdown
📉 -27.00%
IBD RS Score
📊 15.8
Weak
Market Rank
#415
Best Month
🏆 2025-06
Worst Month
📉 2026-01
Best Months to Trade
📅 Jun, Dec, Apr
Best Days to Trade
📅 Wednesday, Monday
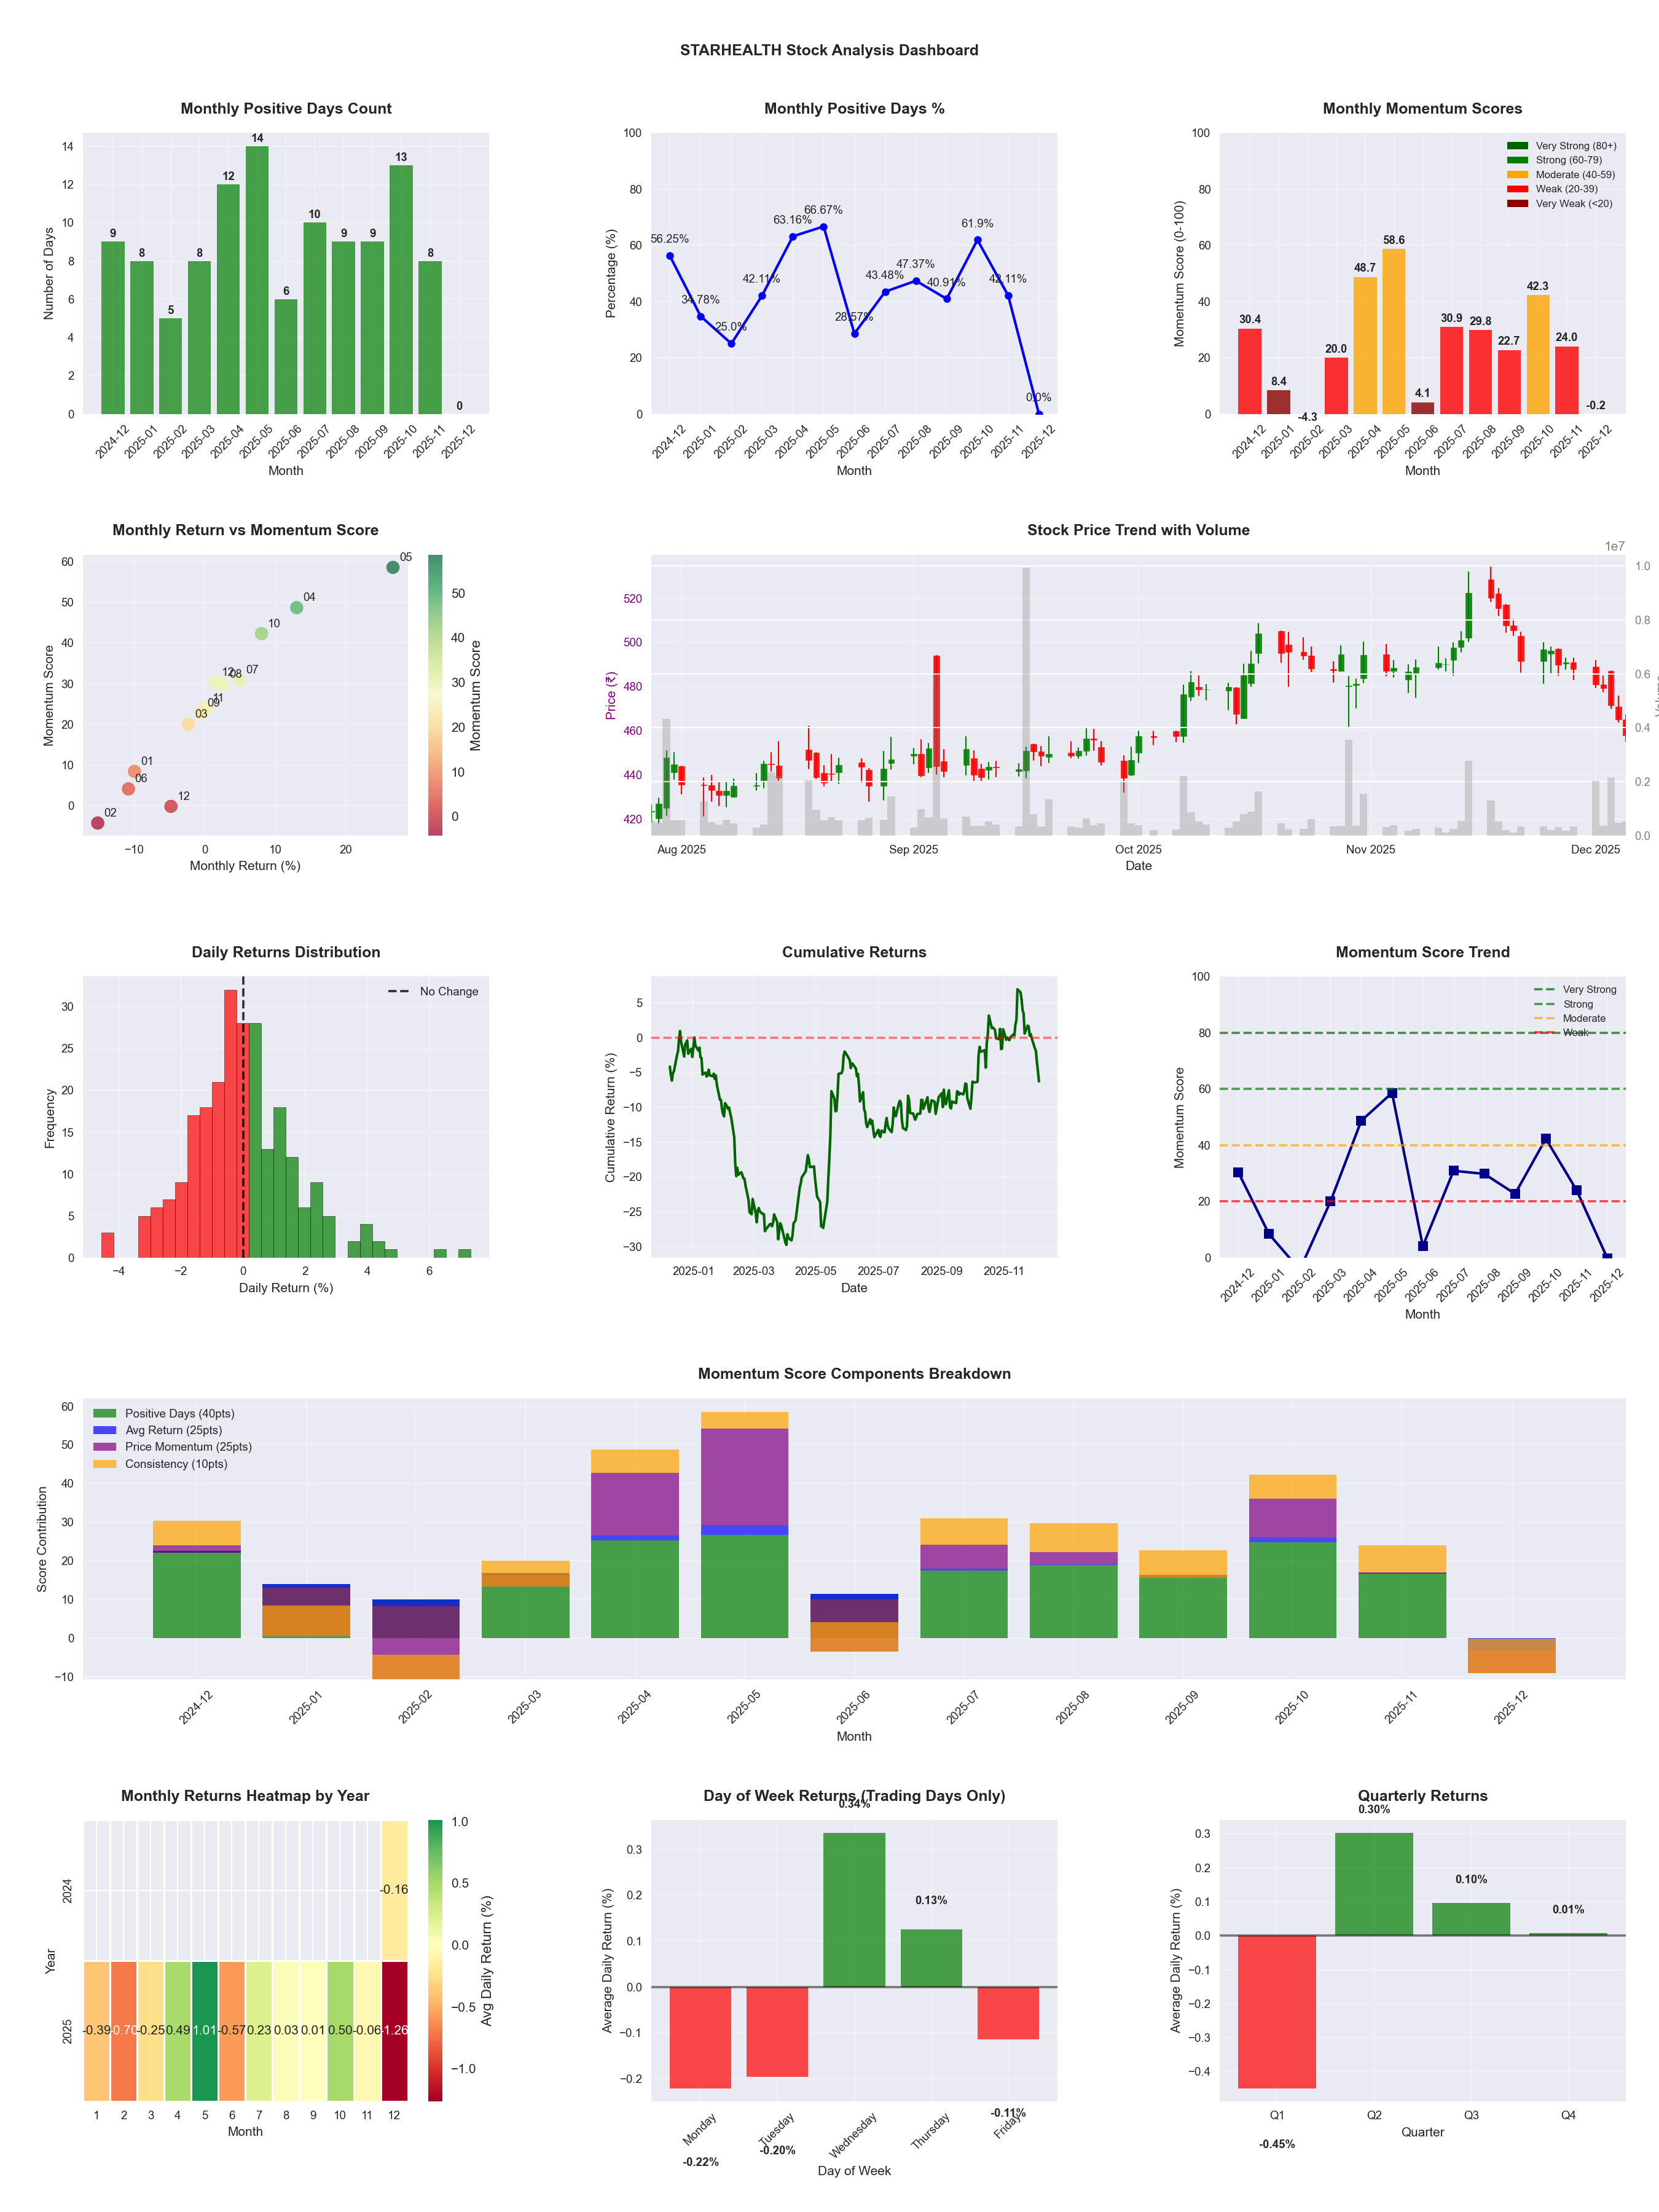
📊 Key Insights & Metrics
Symbol
📈 STARHEALTH
Date
📅 2026-04-11
Volatility
🟡 1.68%
Win Rate
⚠️ 46.3%
Avg Daily Return
📈 +0.12%
Max Drawdown
📉 -18.62%
IBD RS Score
📊 74.4
Strong
Market Rank
#126
Best Month
🏆 2025-05
Worst Month
📉 2025-06
Best Months to Trade
📅 May, Apr, Oct
Best Days to Trade
📅 Wednesday, Tuesday
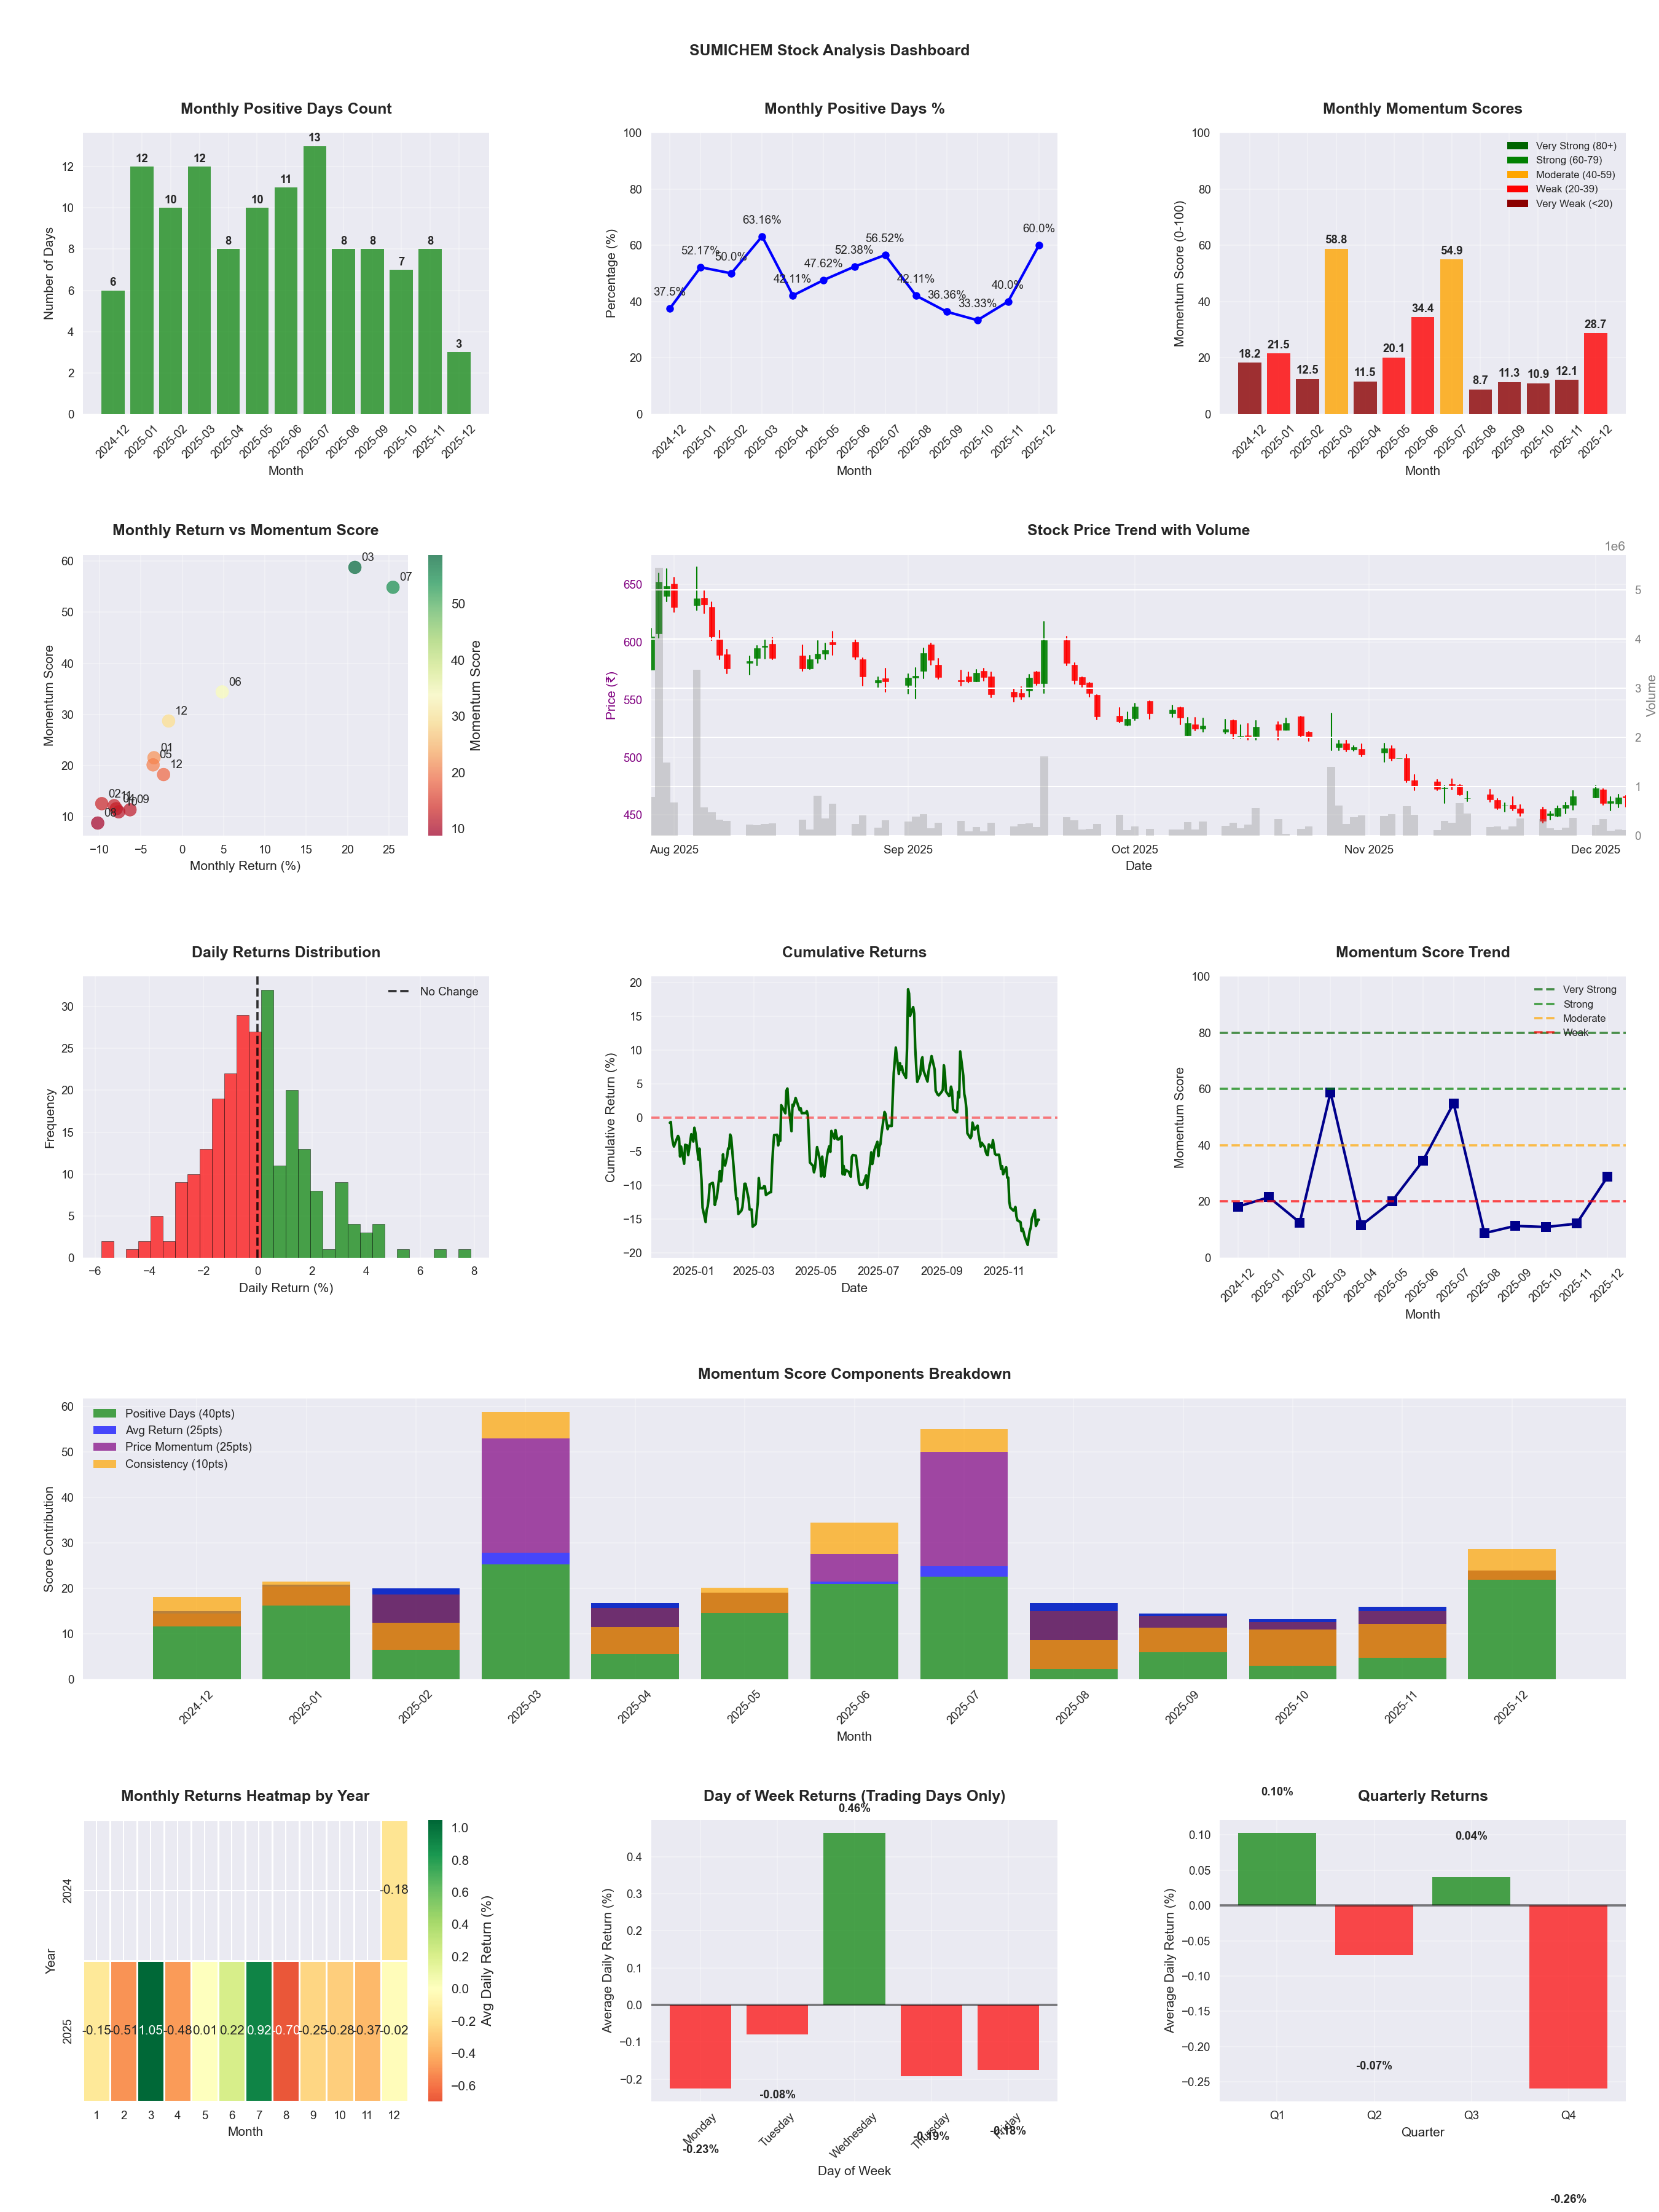
📊 Key Insights & Metrics
Symbol
📈 SUMICHEM
Date
📅 2026-04-11
Volatility
🟡 1.90%
Win Rate
⚠️ 45.1%
Avg Daily Return
📉 -0.10%
Max Drawdown
📉 -44.12%
IBD RS Score
📊 22.3
Weak
Market Rank
#383
Best Month
🏆 2026-04
Best Months to Trade
📅 Jul, Jun, Apr
Best Days to Trade
📅 Wednesday, Monday
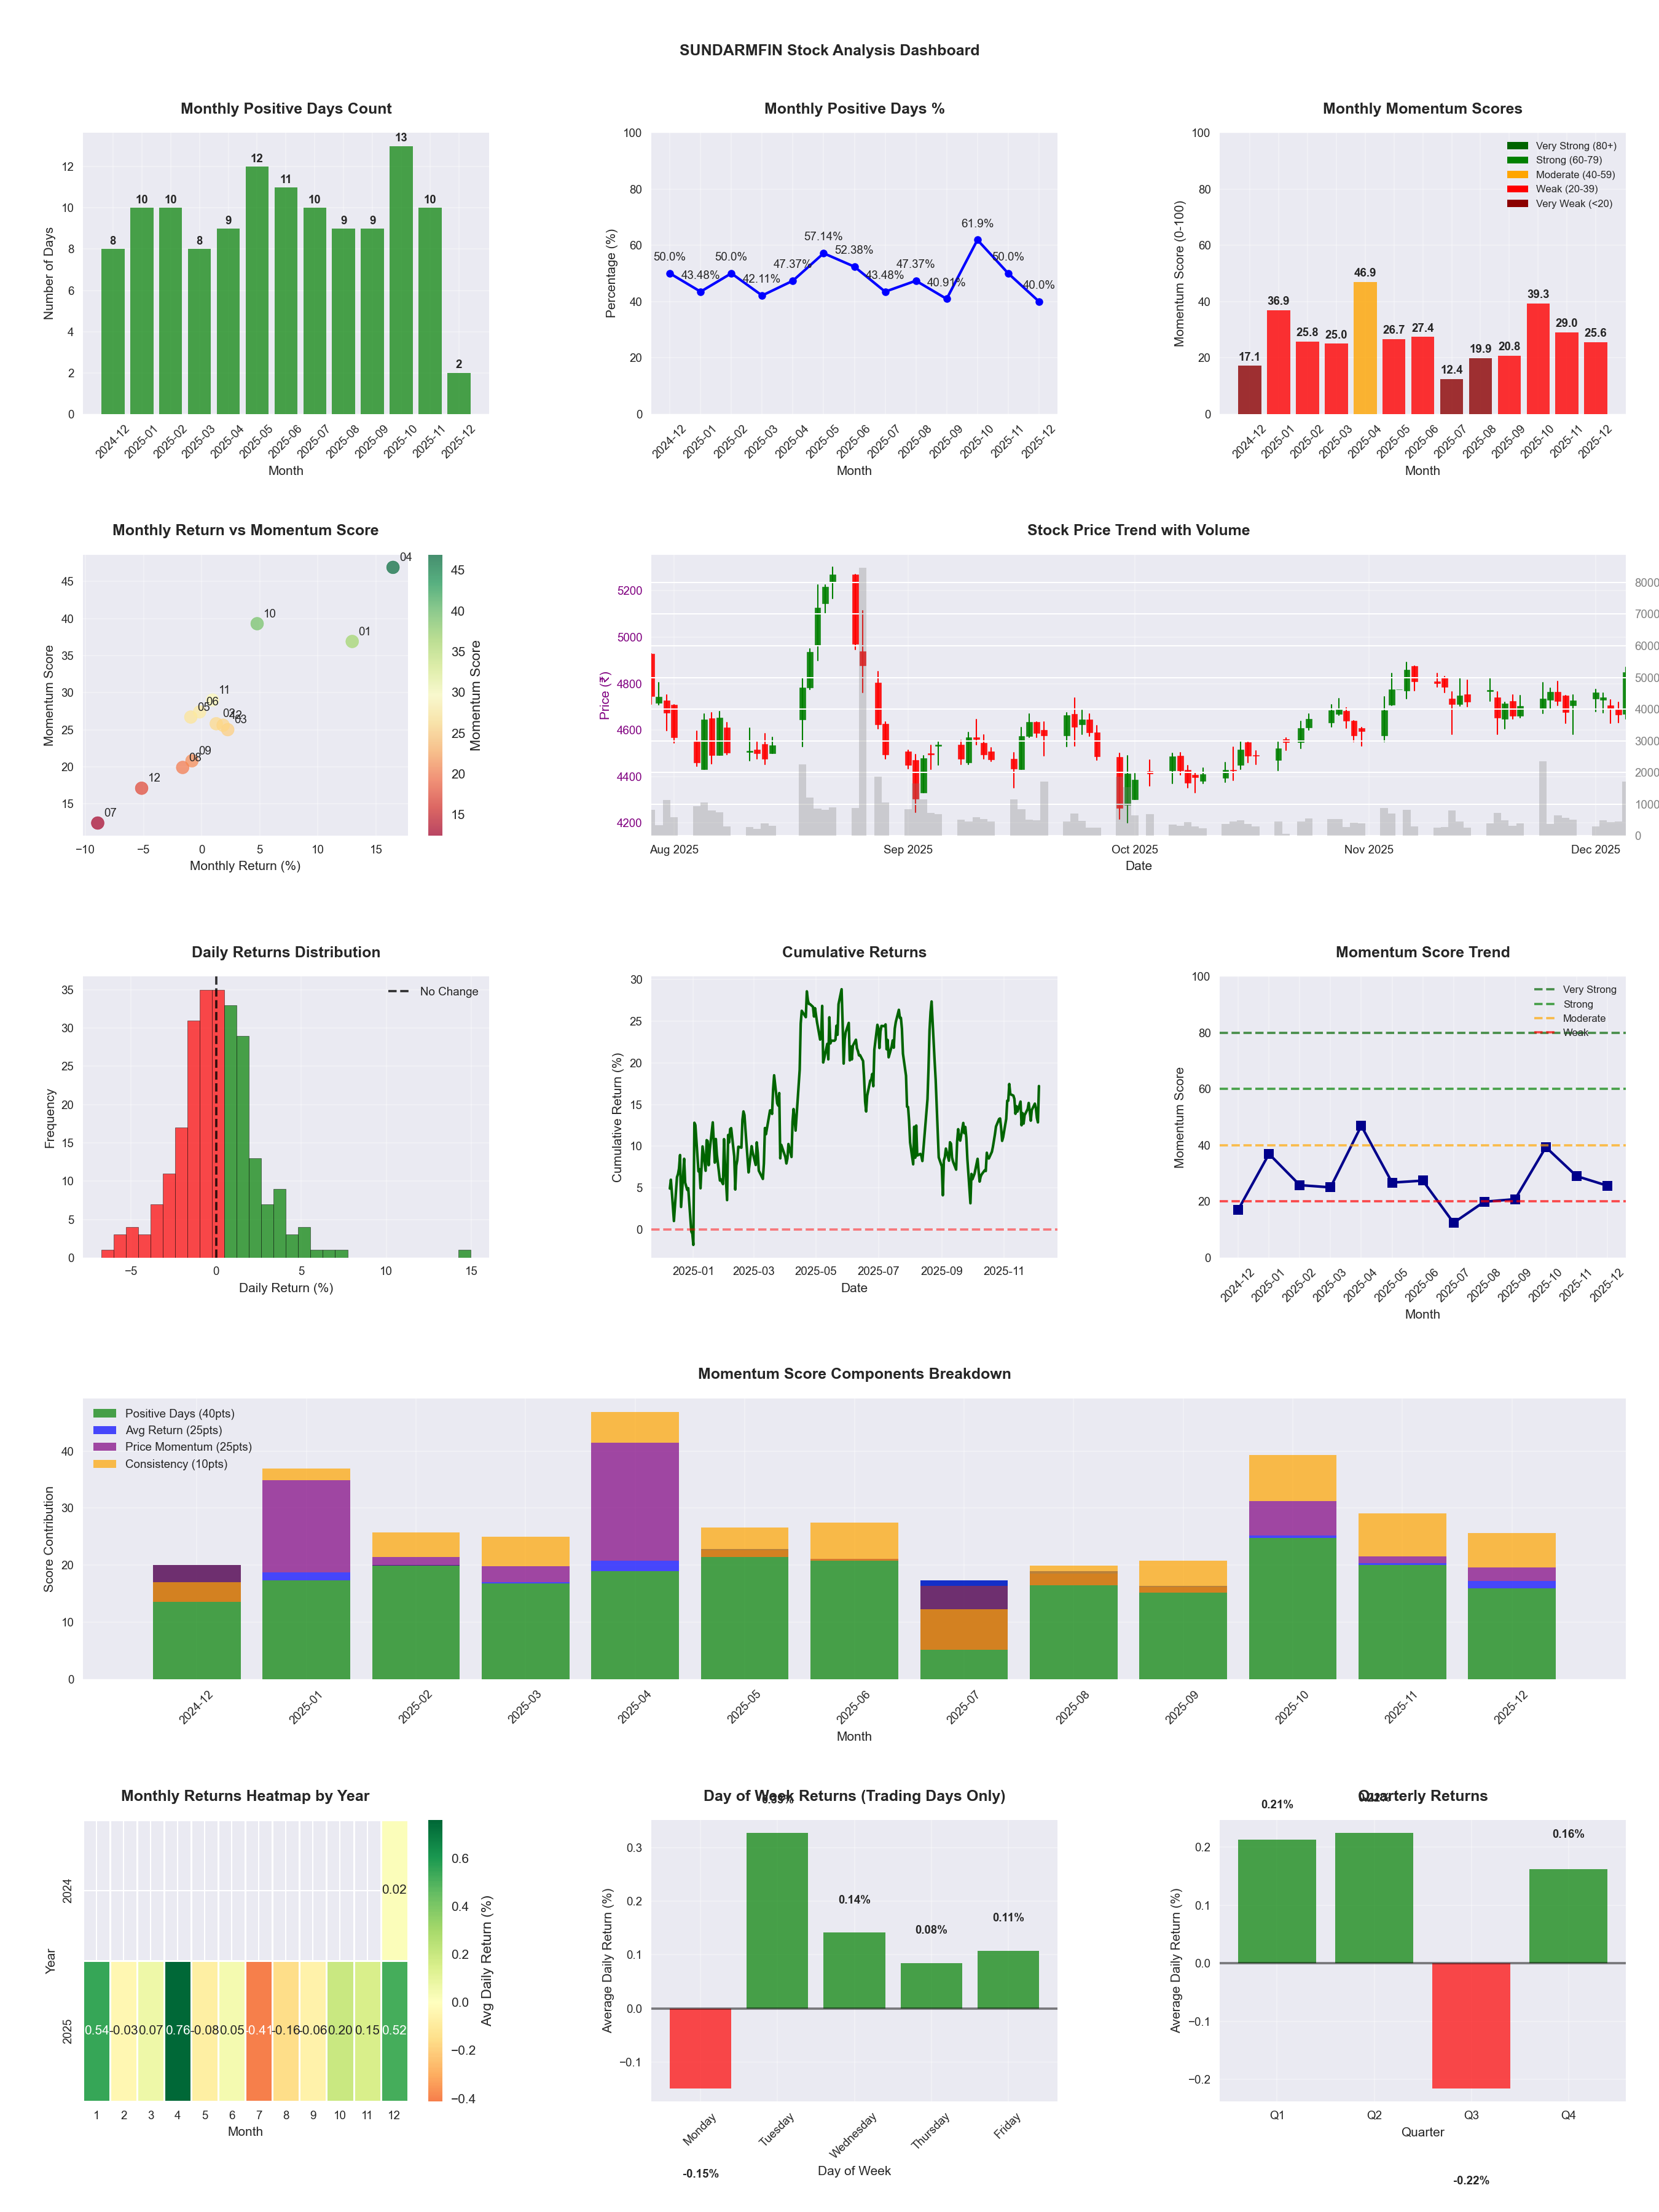
📊 Key Insights & Metrics
Symbol
📈 SUNDARMFIN
Date
📅 2026-04-11
Volatility
🟡 2.03%
Risk Profile
⚠️ suitable for aggressive investors
Win Rate
⚠️ 51.6%
Avg Daily Return
📈 +0.05%
Max Drawdown
📉 -21.61%
IBD RS Score
📊 60.6
Average
Market Rank
#194
Best Month
🏆 2026-04
Best Months to Trade
📅 Apr, Dec, Feb
Best Days to Trade
📅 Wednesday, Tuesday
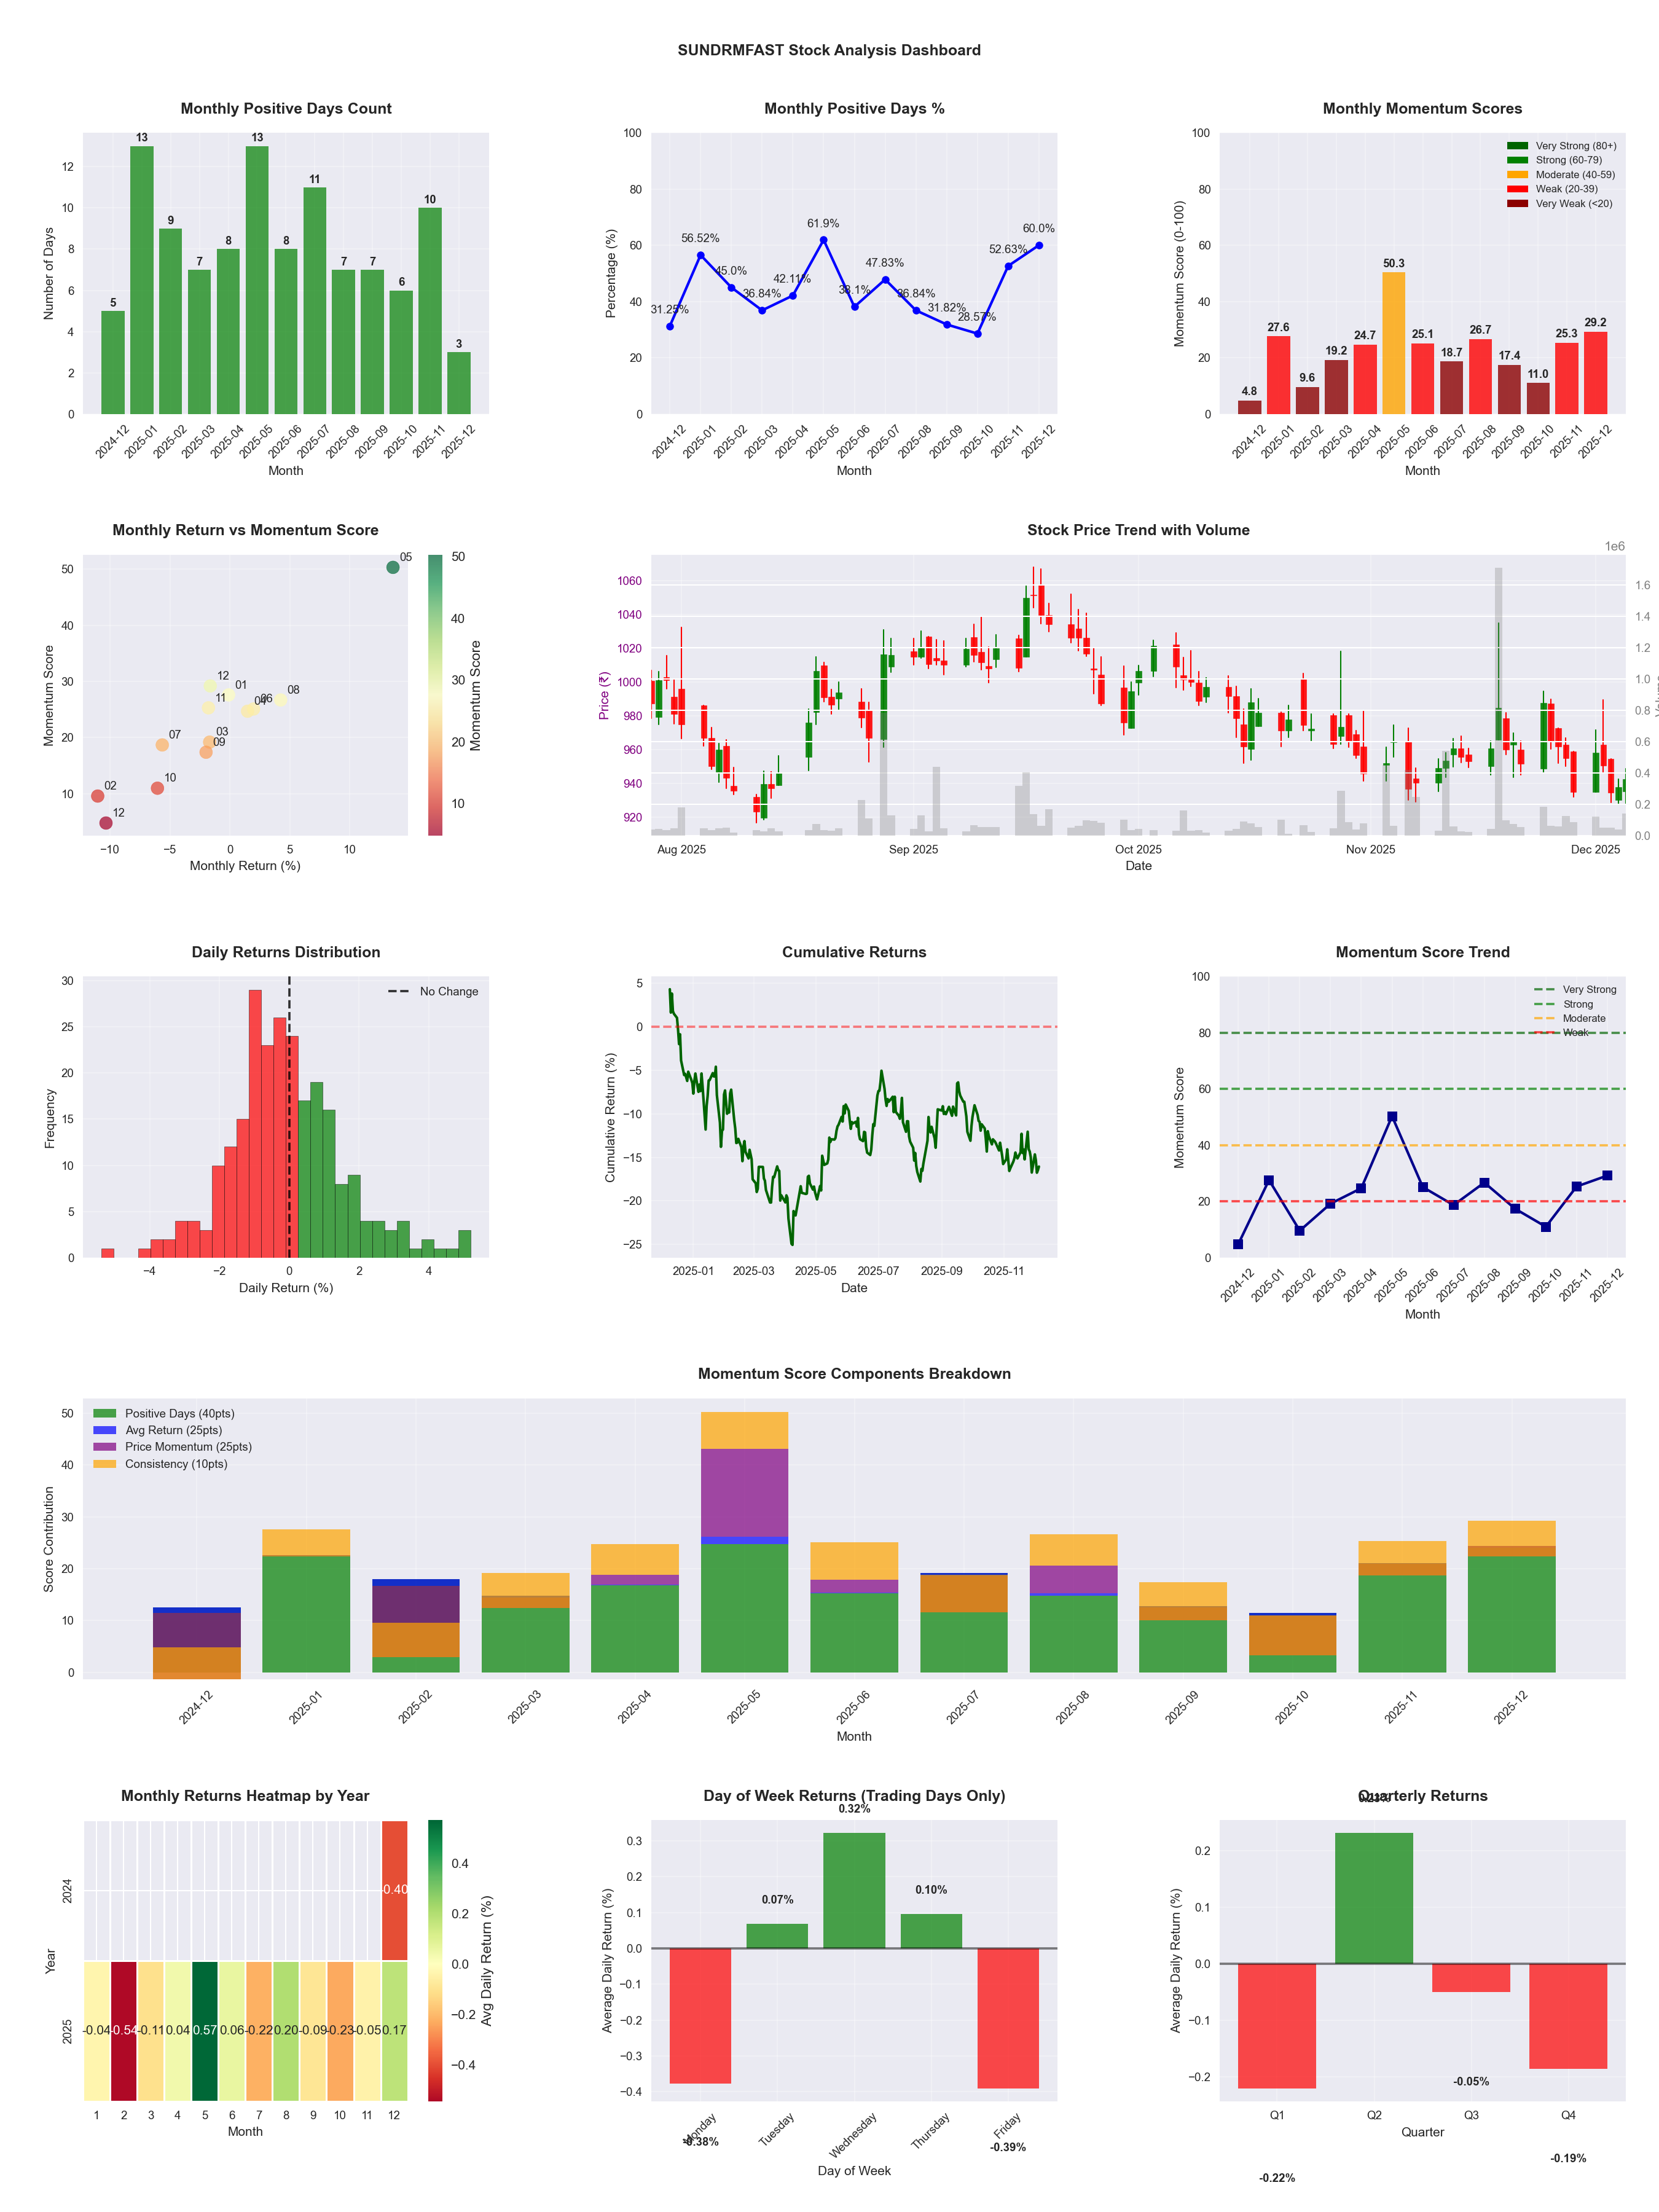
📊 Key Insights & Metrics
Symbol
📈 SUNDRMFAST
Date
📅 2026-04-11
Volatility
🟡 1.55%
Win Rate
⚠️ 43.3%
Avg Daily Return
📉 -0.03%
Max Drawdown
📉 -29.74%
IBD RS Score
📊 20.7
Weak
Market Rank
#391
Best Month
🏆 2025-05
Worst Month
📉 2026-03
Best Months to Trade
📅 Apr, May, Aug
Best Days to Trade
📅 Tuesday, Wednesday
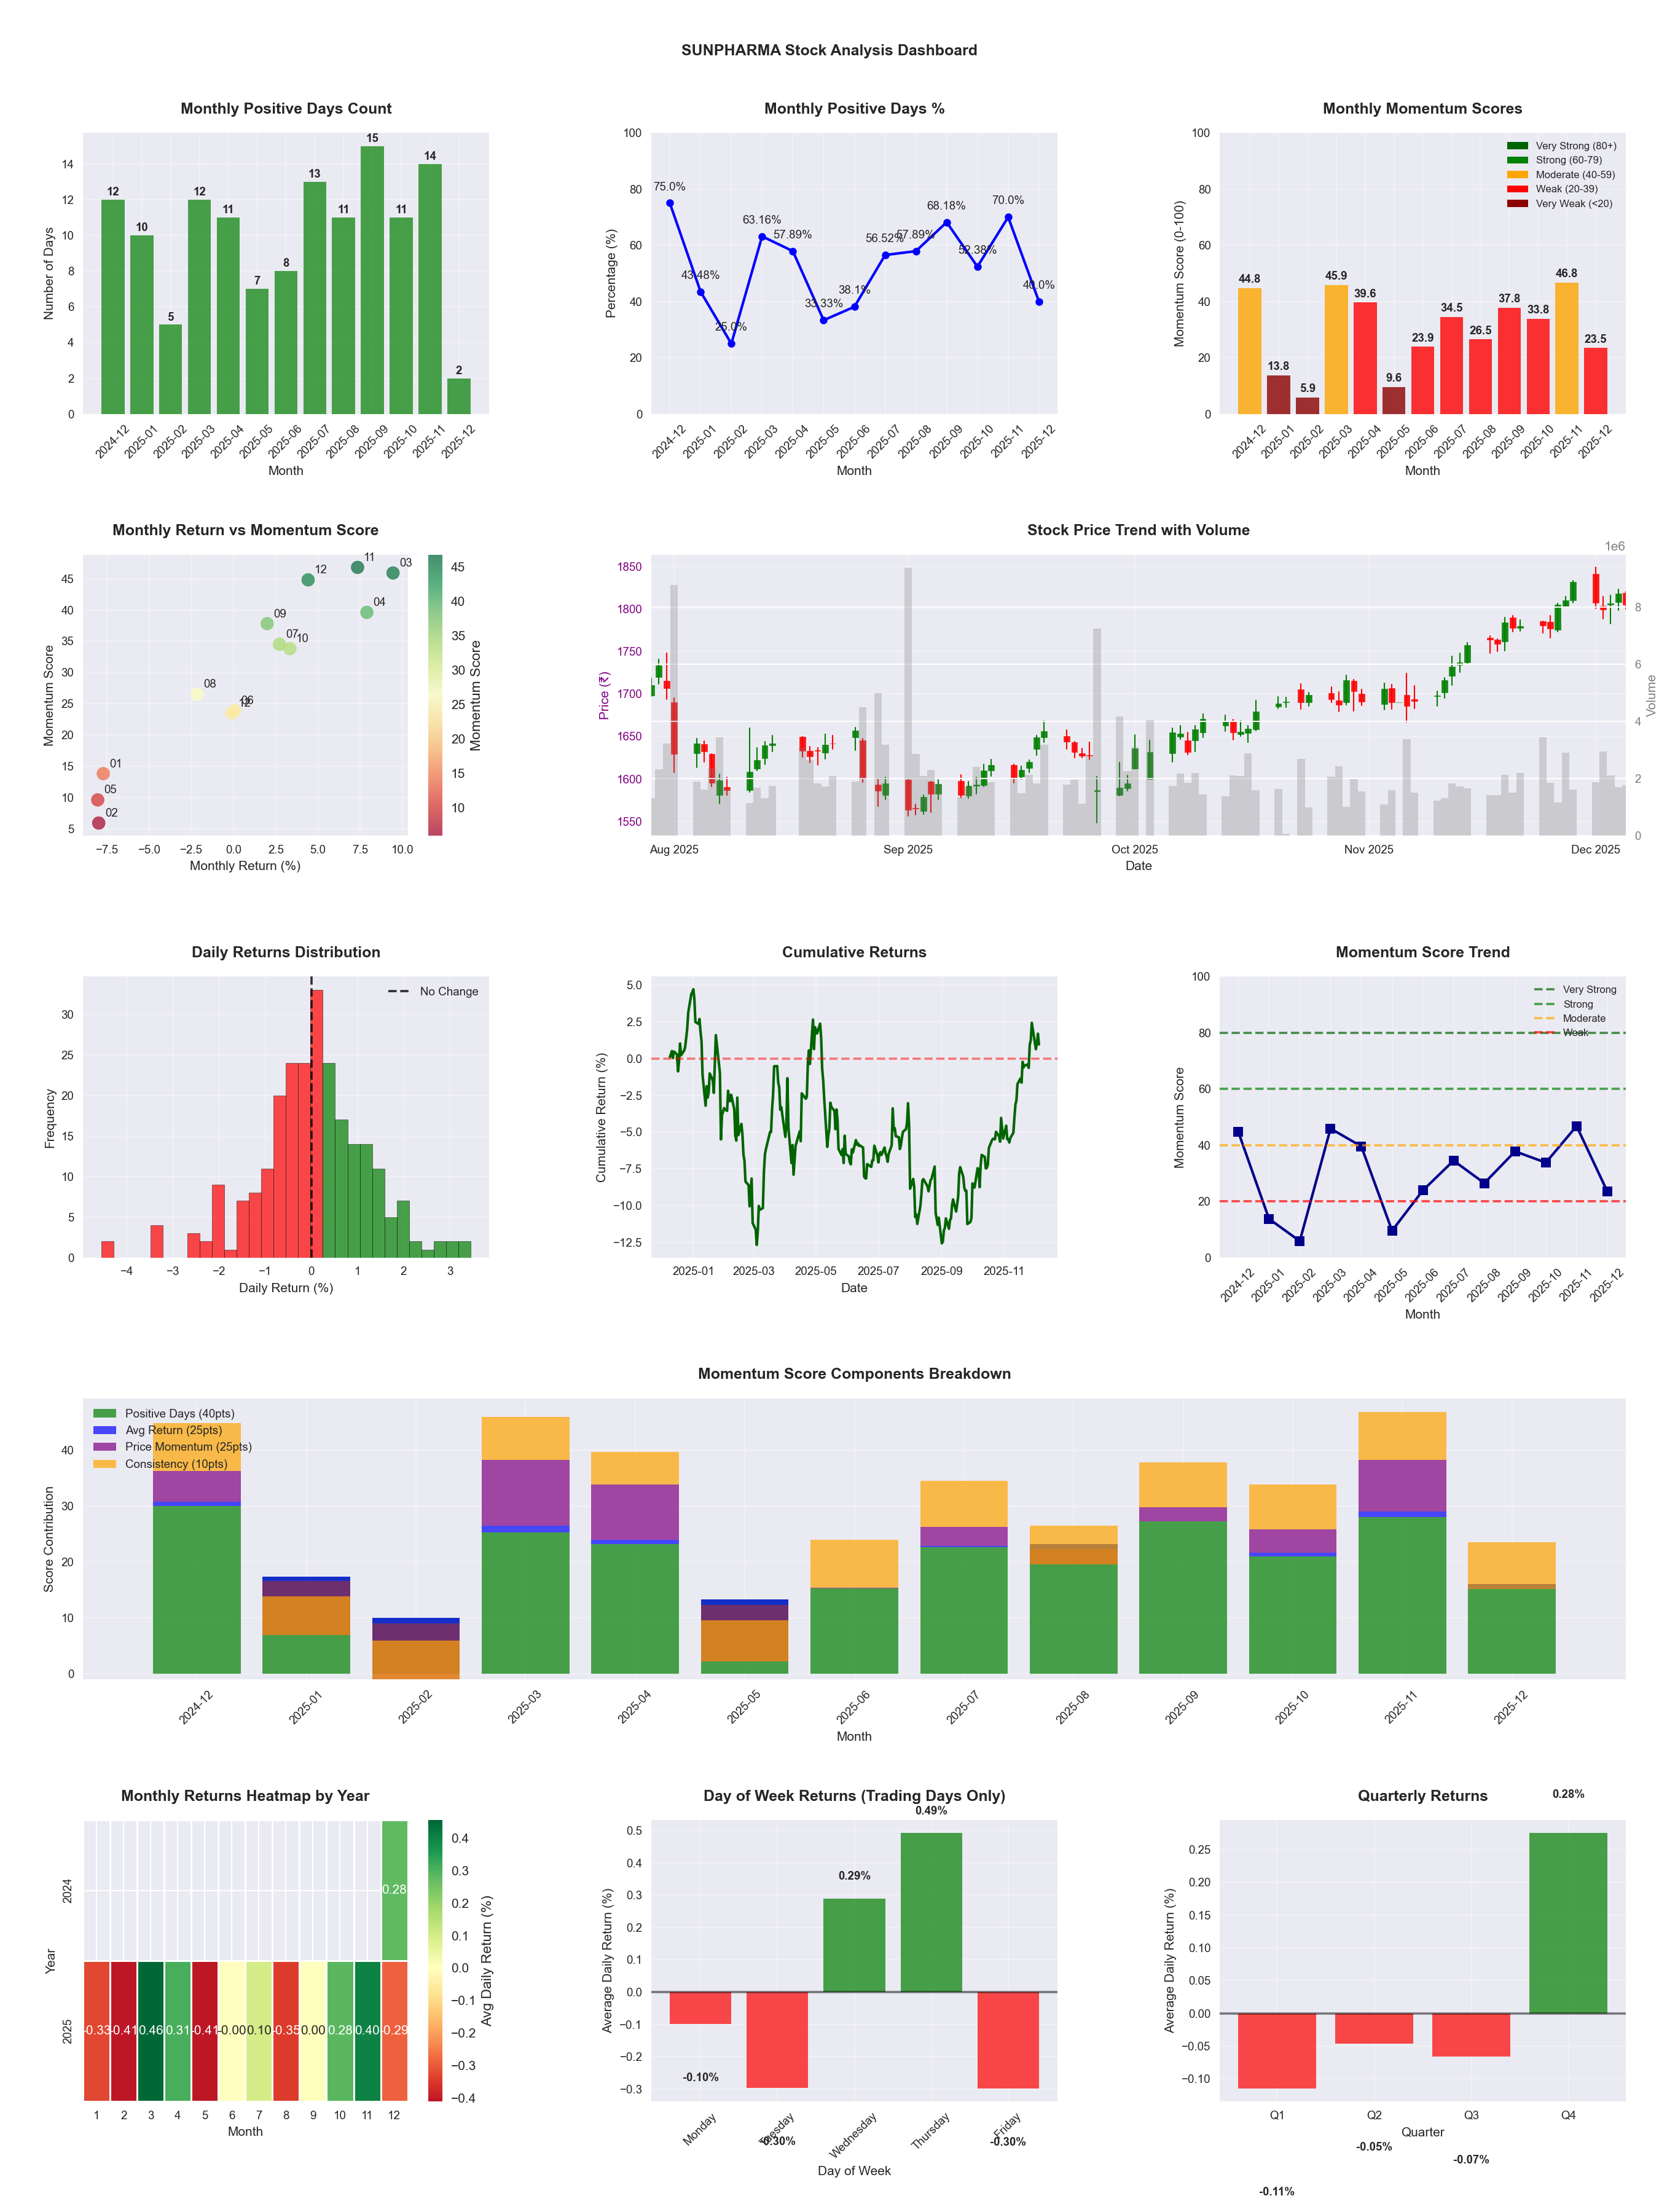
📊 Key Insights & Metrics
Symbol
📈 SUNPHARMA
Date
📅 2026-04-11
Volatility
🟢 1.19%
Win Rate
⚠️ 53.2%
Avg Daily Return
📉 +0.00%
Max Drawdown
📉 -14.83%
IBD RS Score
📊 57.4
Average
Market Rank
#210
Best Month
🏆 2025-11
Worst Month
📉 2025-05
Best Months to Trade
📅 Feb, Nov, Oct
Best Days to Trade
📅 Wednesday, Thursday
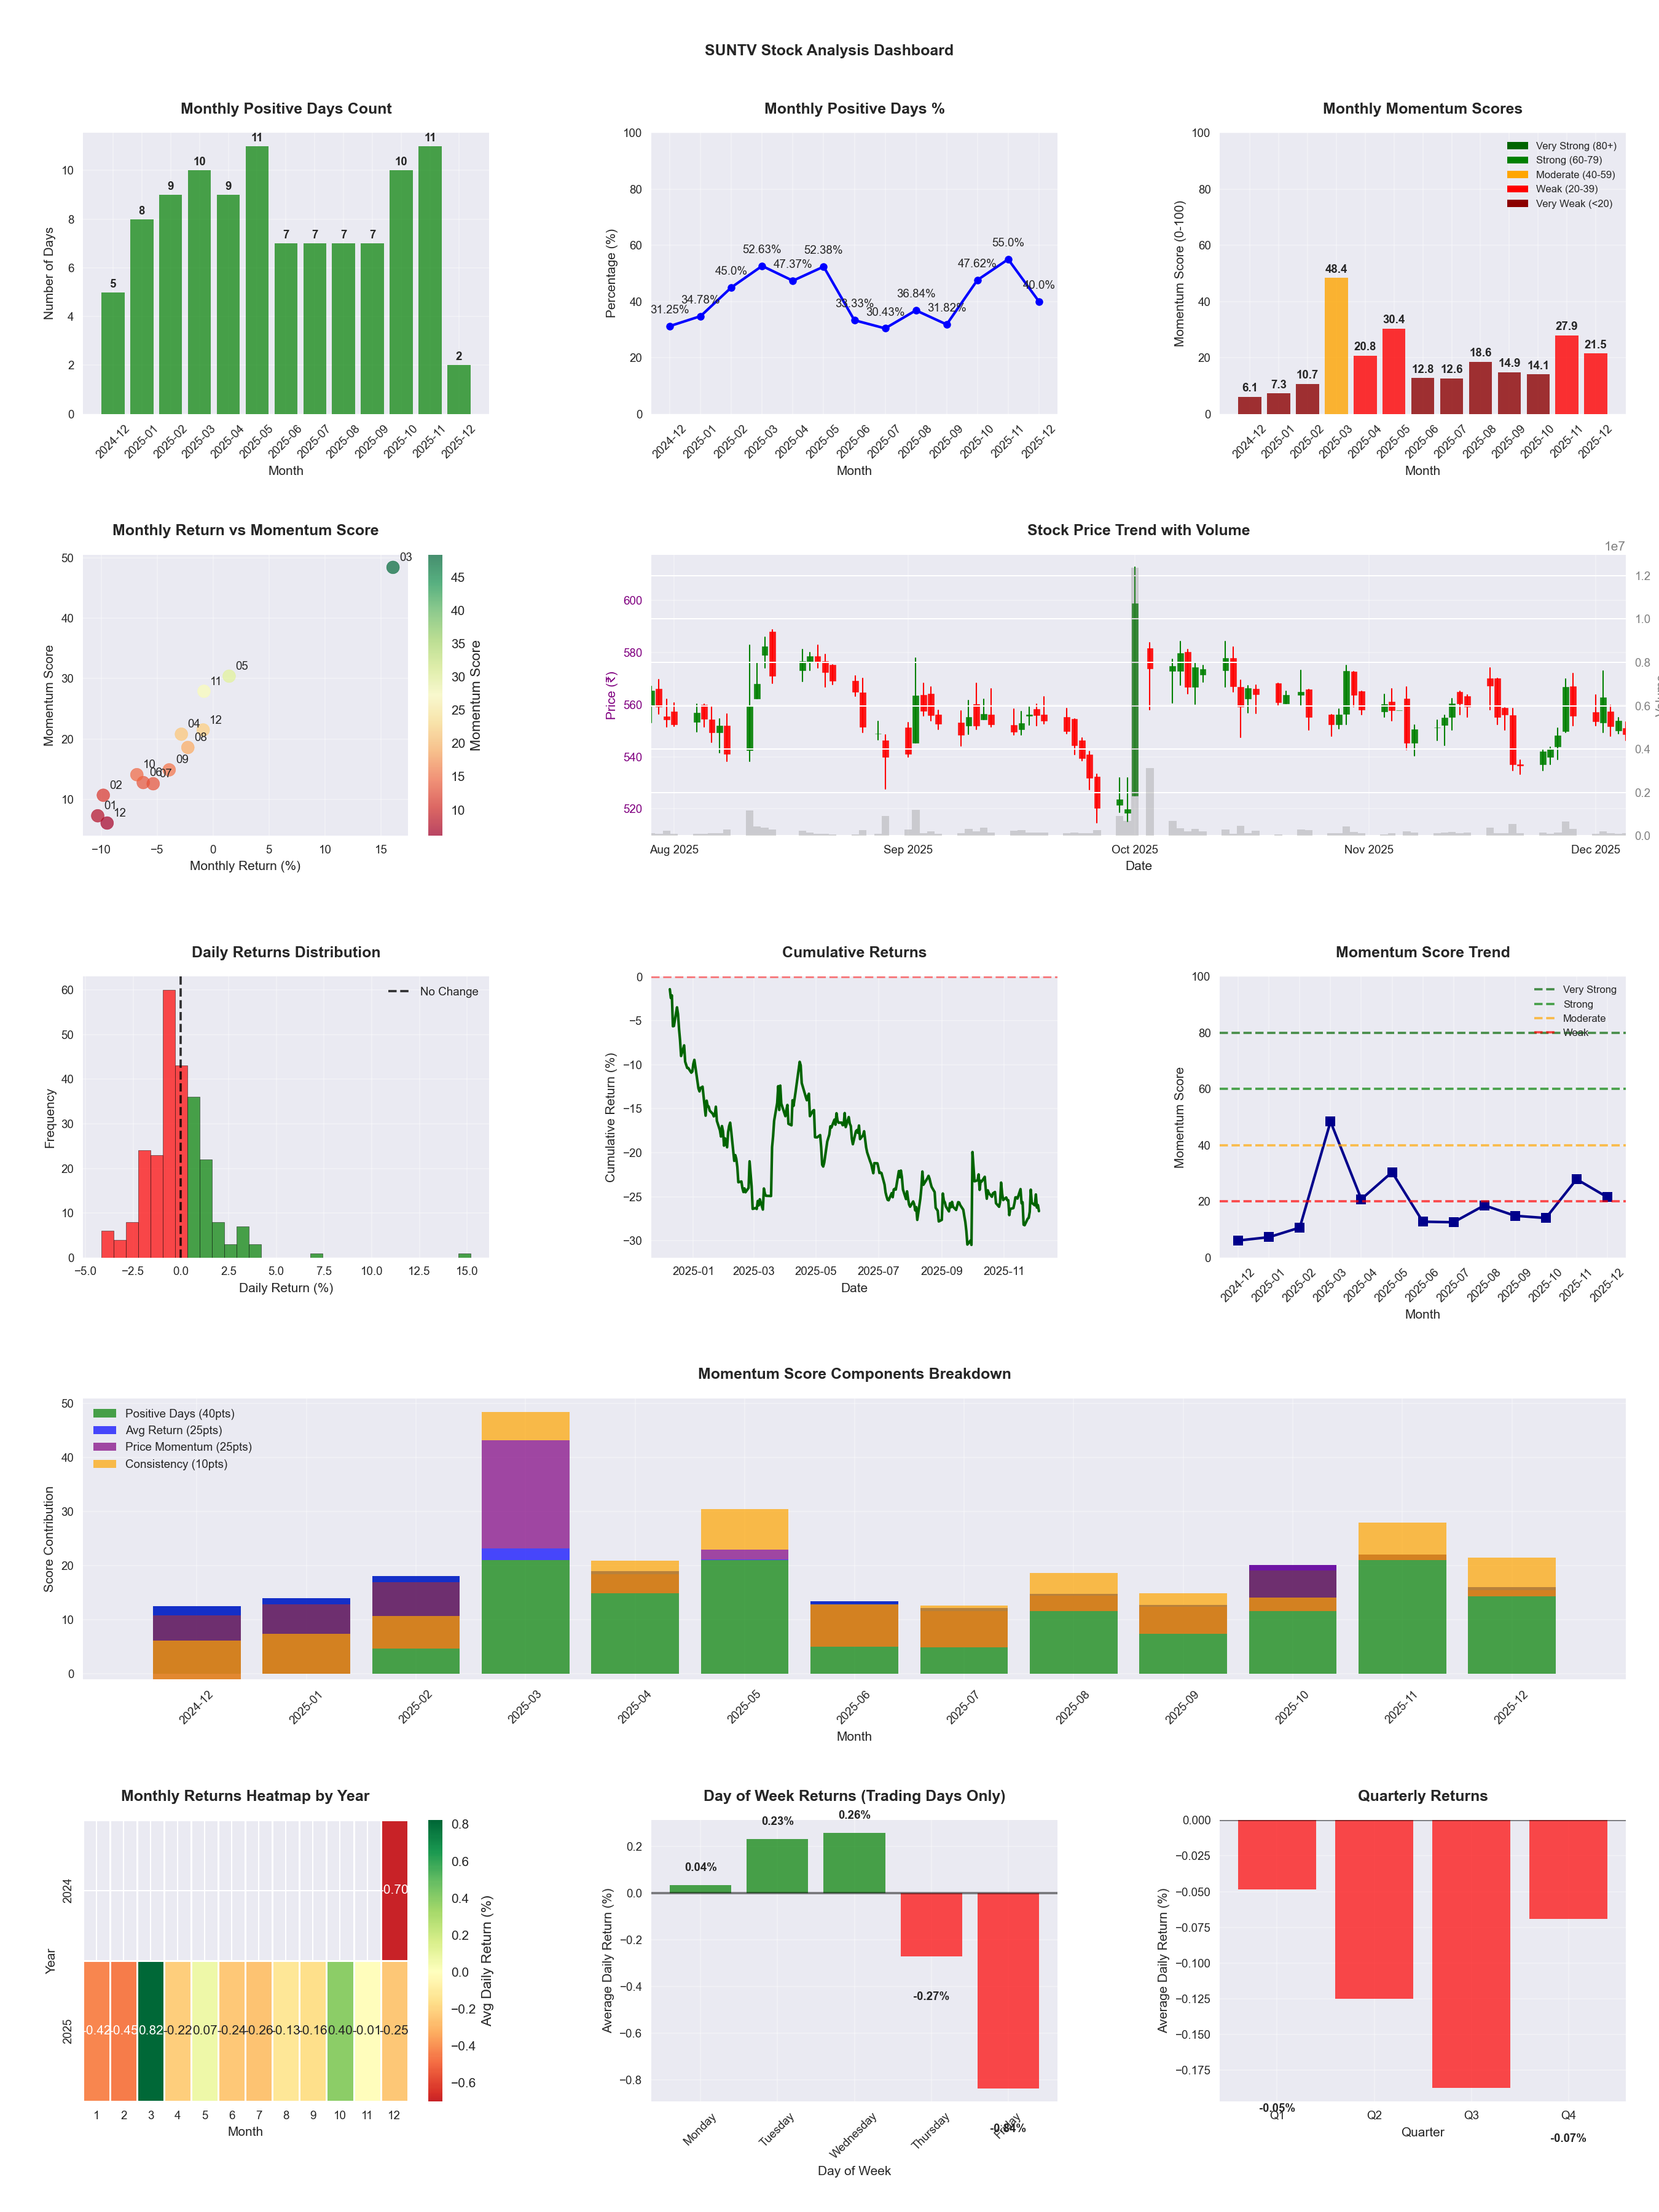
📊 Key Insights & Metrics
Symbol
📈 SUNTV
Date
📅 2026-04-11
Volatility
🟡 2.04%
Risk Profile
⚠️ suitable for aggressive investors
Win Rate
⚠️ 43.9%
Avg Daily Return
📉 -0.01%
Max Drawdown
📉 -23.02%
IBD RS Score
📊 69.8
Average
Market Rank
#149
Best Month
🏆 2026-02
Worst Month
📉 2026-03
Best Months to Trade
📅 Feb, Oct, Dec
Best Days to Trade
📅 Monday, Tuesday
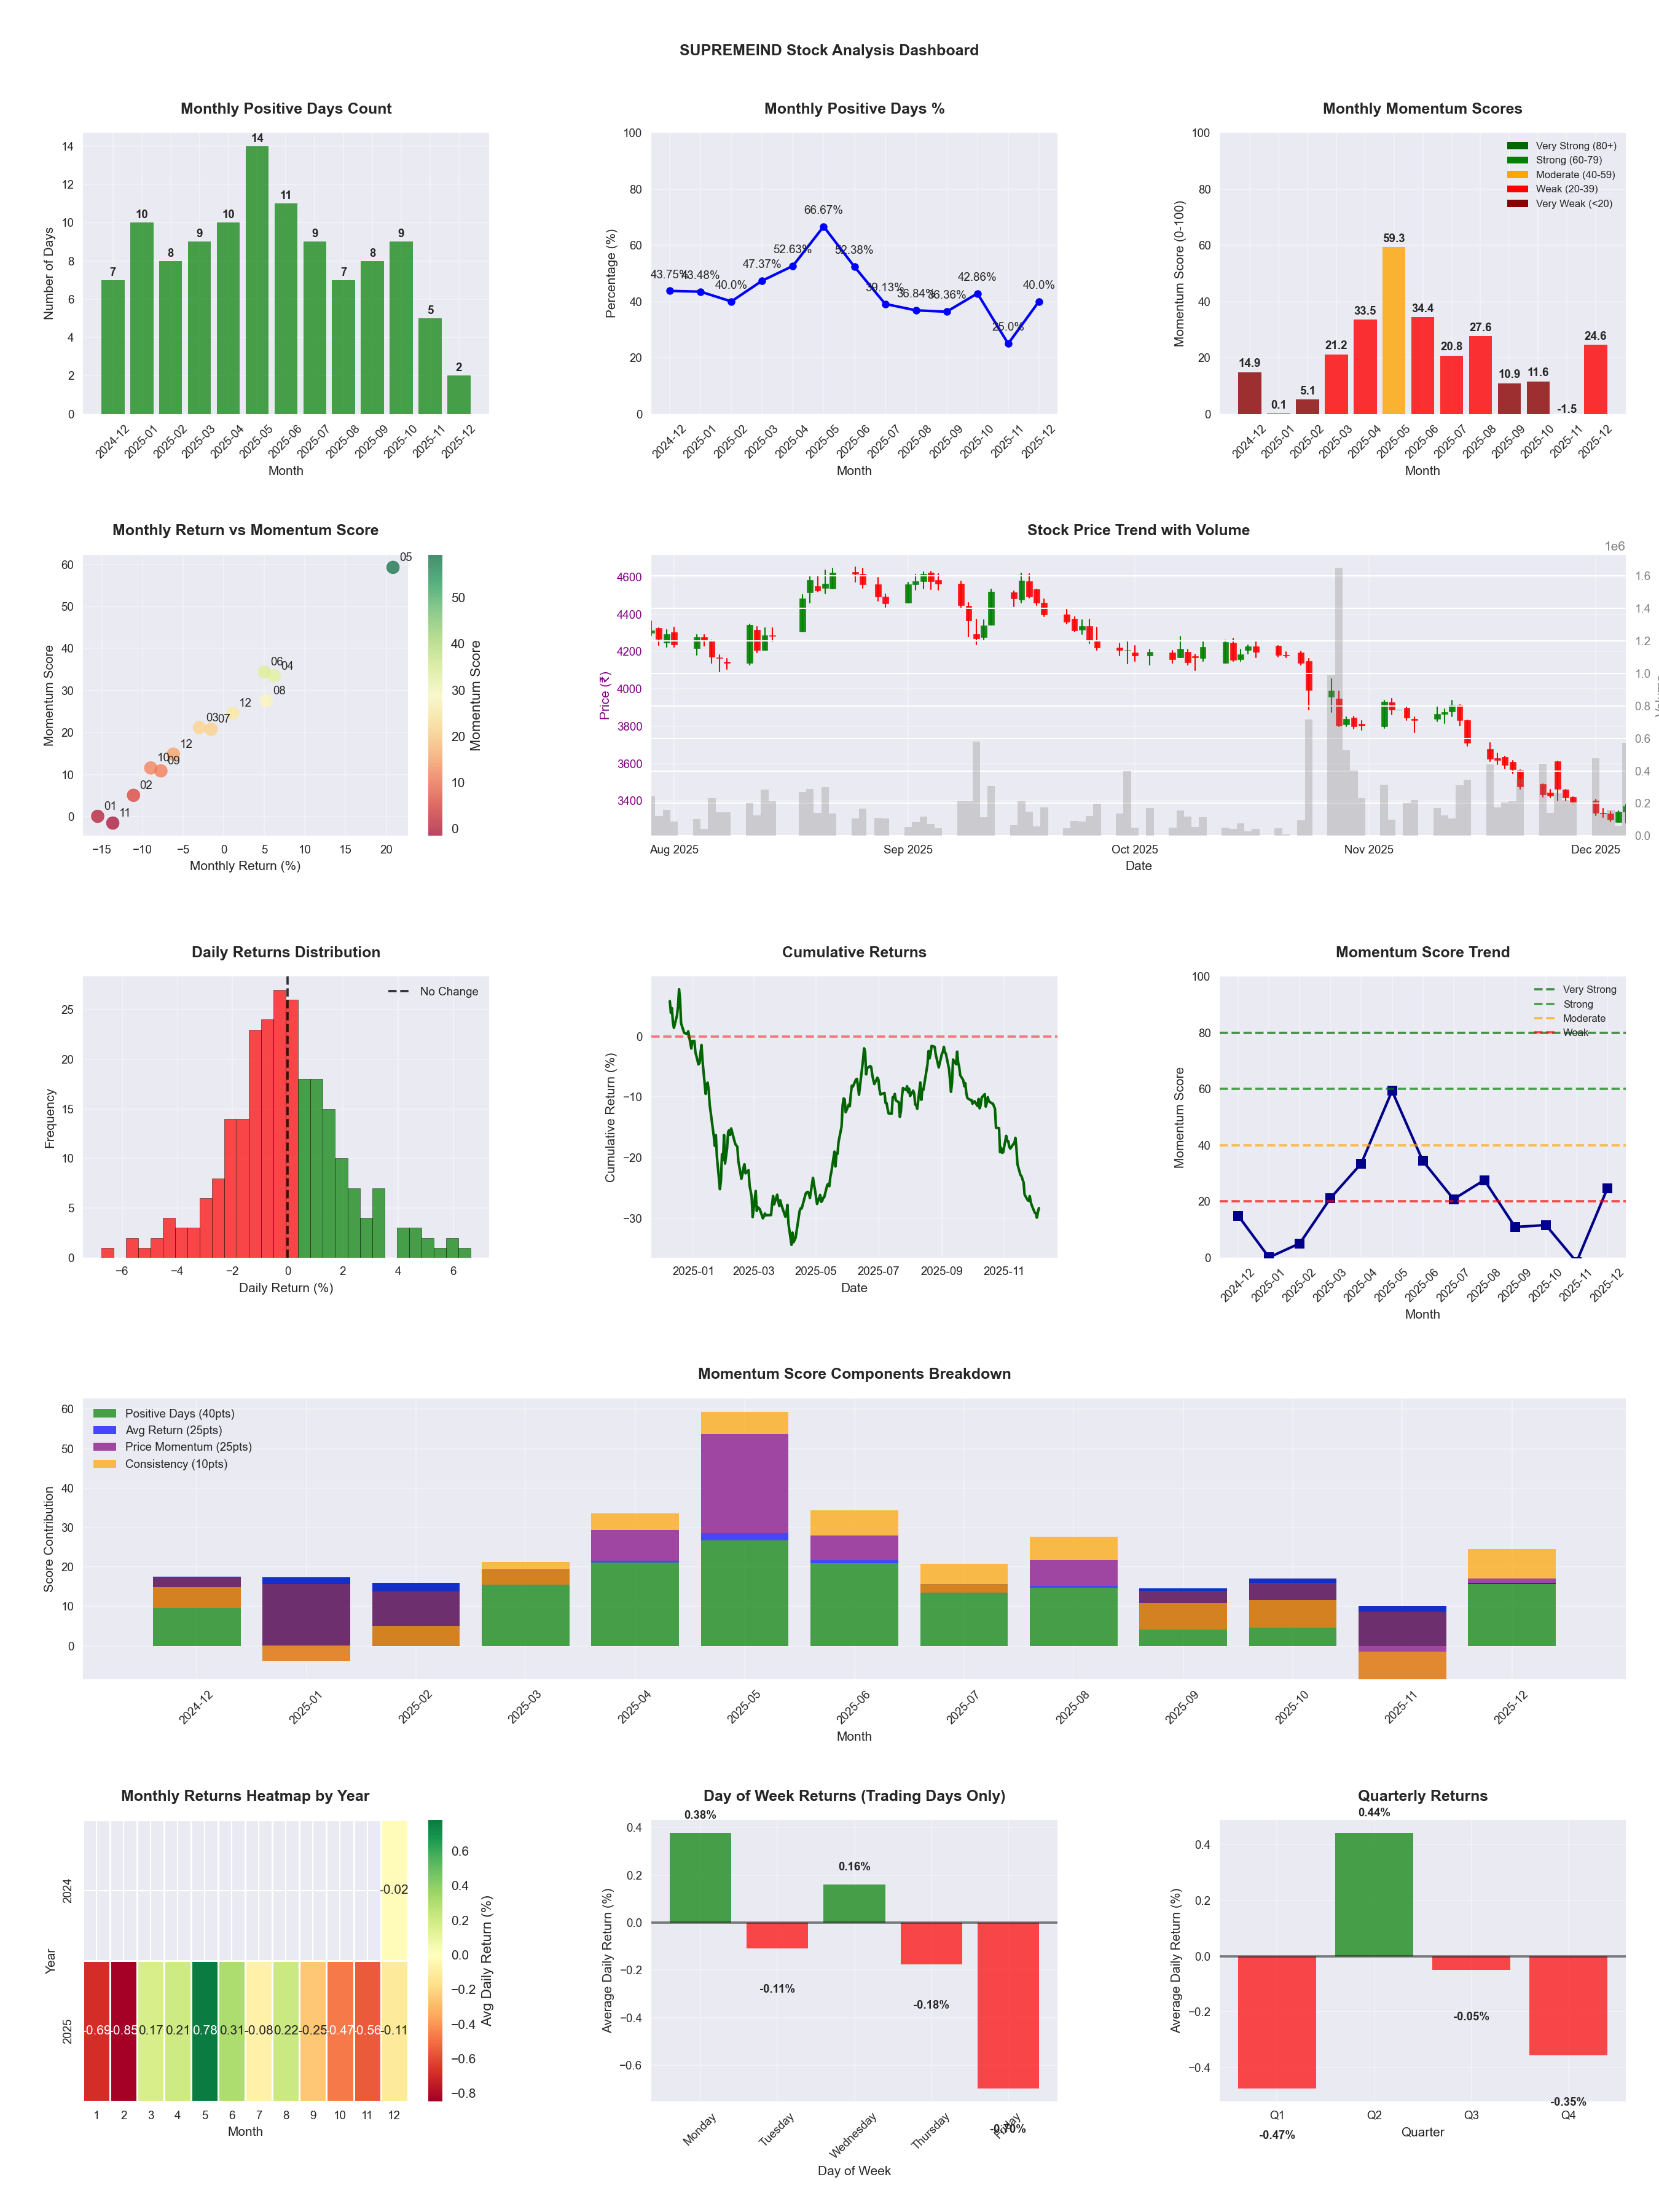
📊 Key Insights & Metrics
Symbol
📈 SUPREMEIND
Date
📅 2026-04-11
Volatility
🟡 1.81%
Win Rate
⚠️ 45.5%
Avg Daily Return
📈 +0.09%
Max Drawdown
📉 -30.35%
IBD RS Score
📊 66.3
Average
Market Rank
#166
Best Month
🏆 2025-05
Best Months to Trade
📅 May, Apr, Feb
Best Days to Trade
📅 Monday, Wednesday
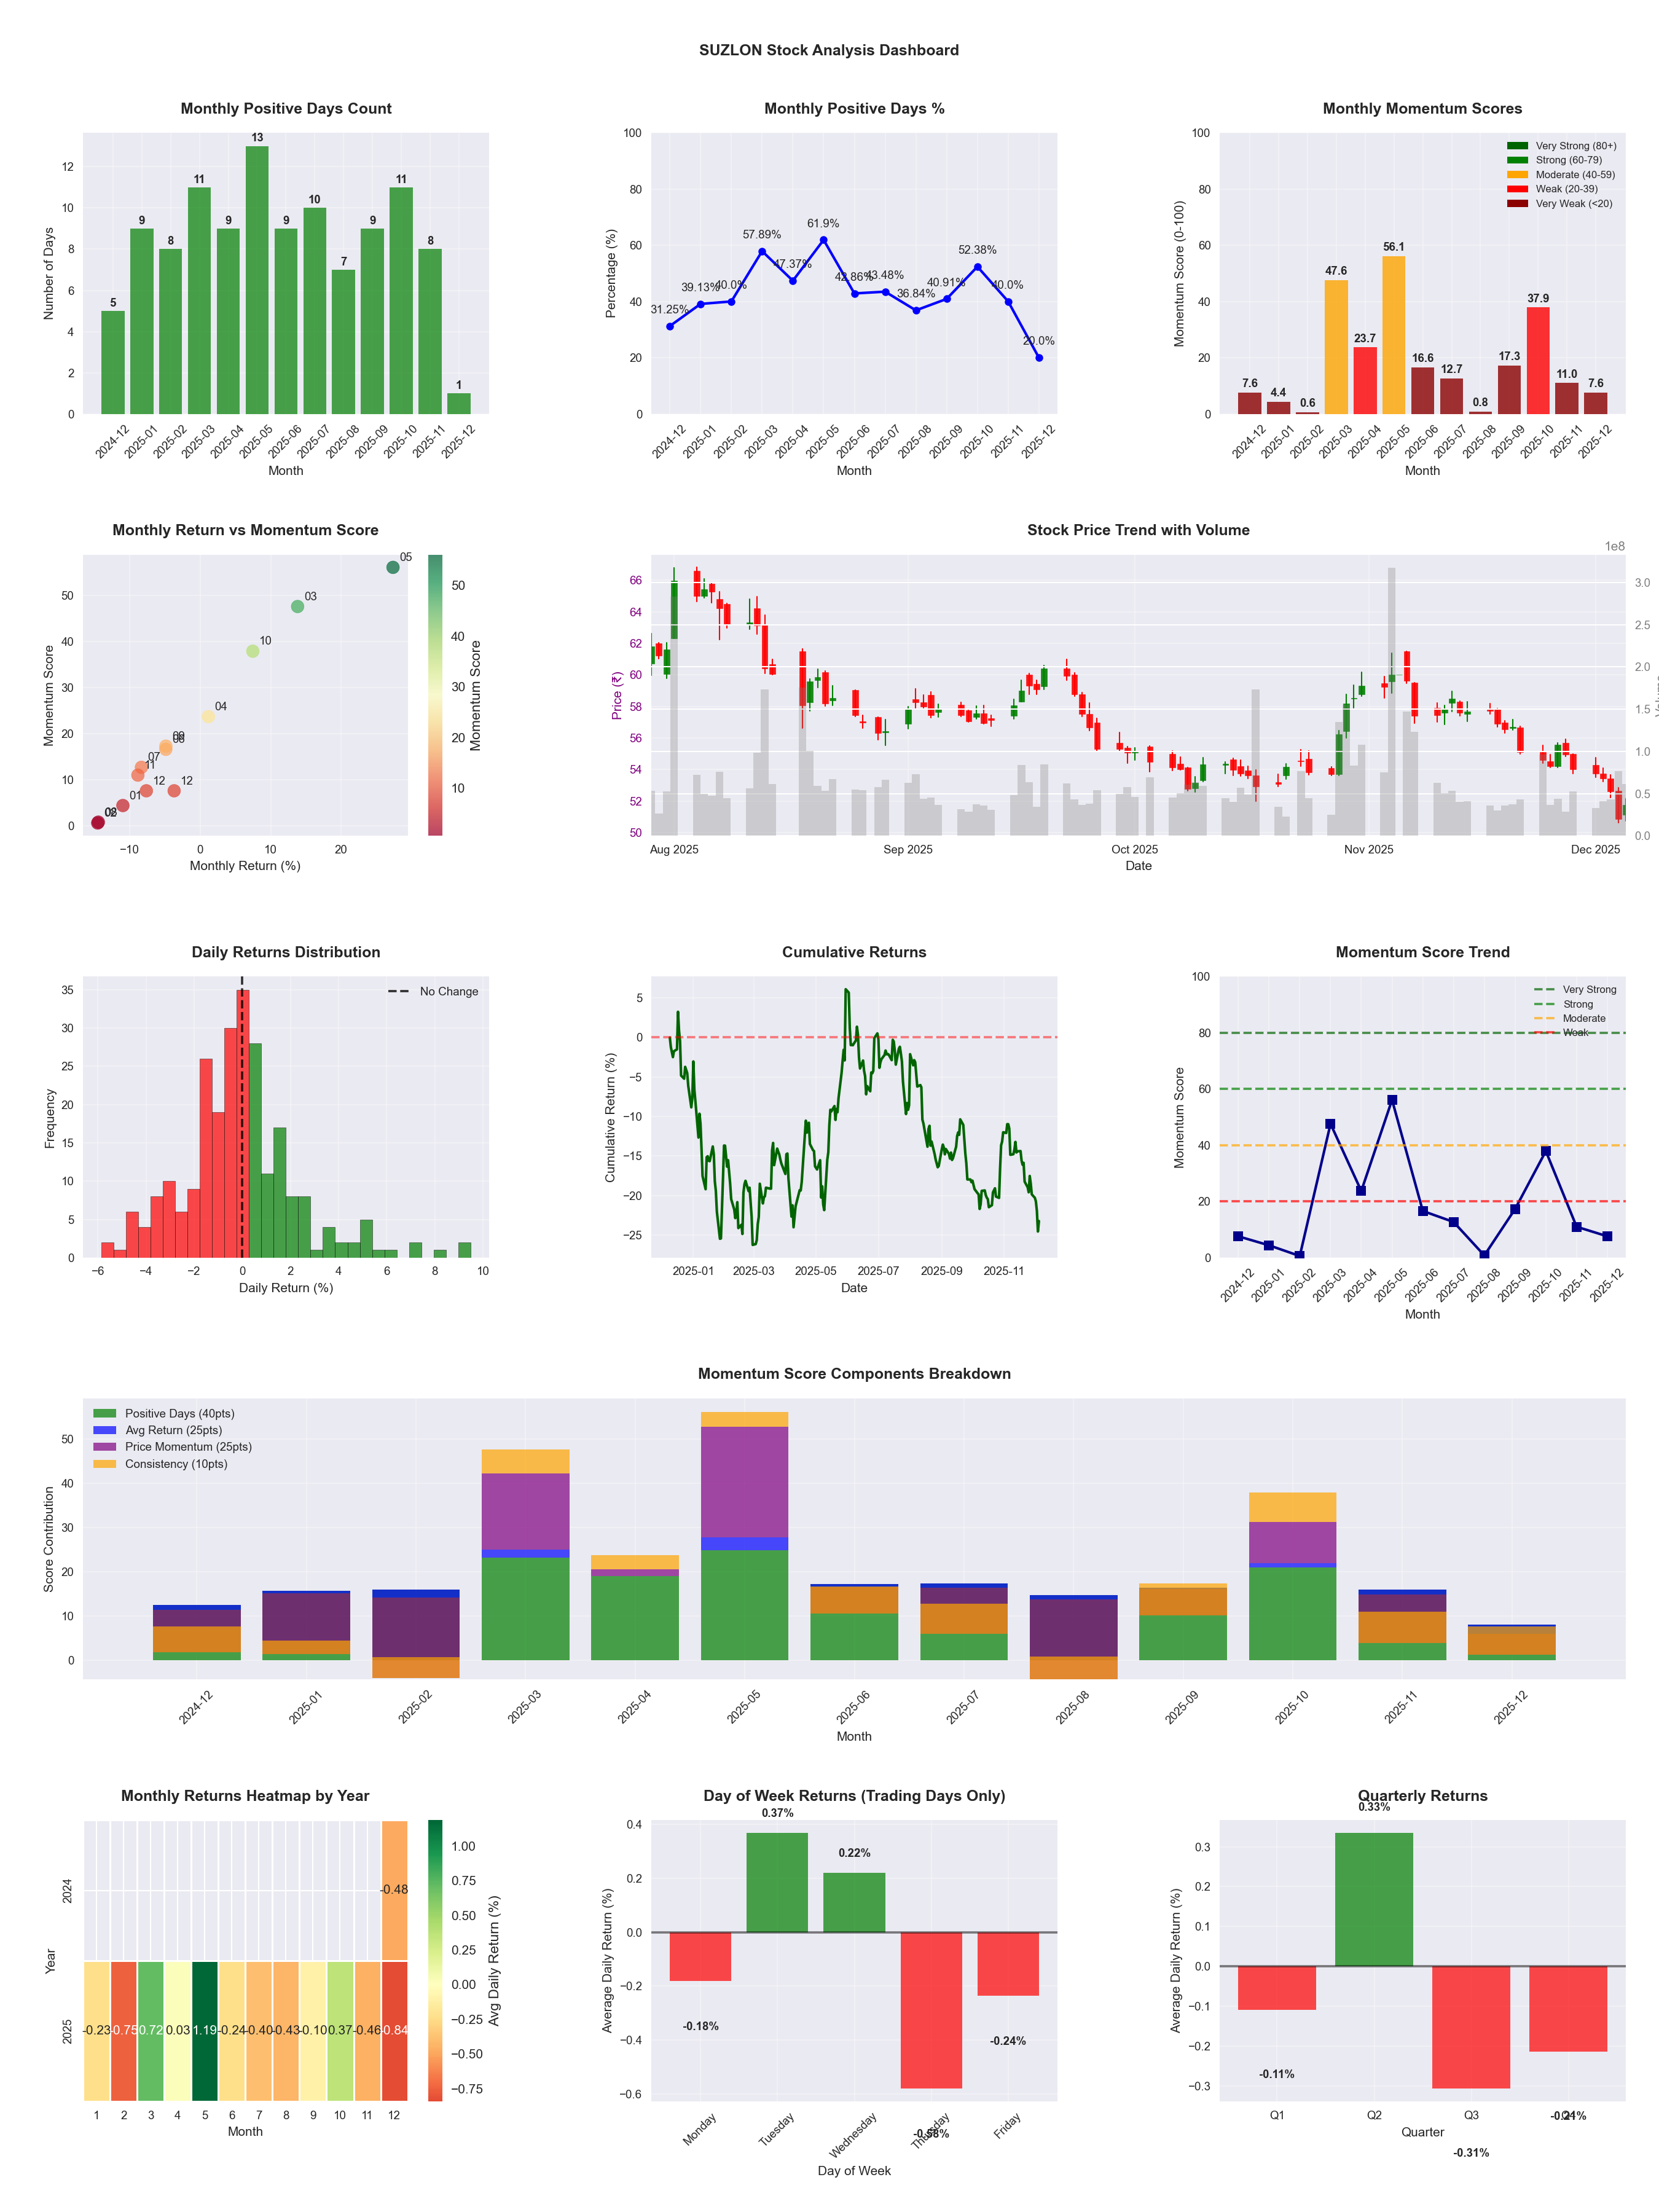
📊 Key Insights & Metrics
Symbol
📈 SUZLON
Date
📅 2026-04-11
Volatility
🟡 2.17%
Risk Profile
⚠️ suitable for aggressive investors
Win Rate
⚠️ 43.9%
Avg Daily Return
📉 -0.04%
Max Drawdown
📉 -44.66%
IBD RS Score
📊 20.9
Weak
Market Rank
#390
Best Month
🏆 2025-05
Worst Month
📉 2025-08
Best Months to Trade
📅 May, Apr, Oct
Best Days to Trade
📅 Tuesday, Wednesday
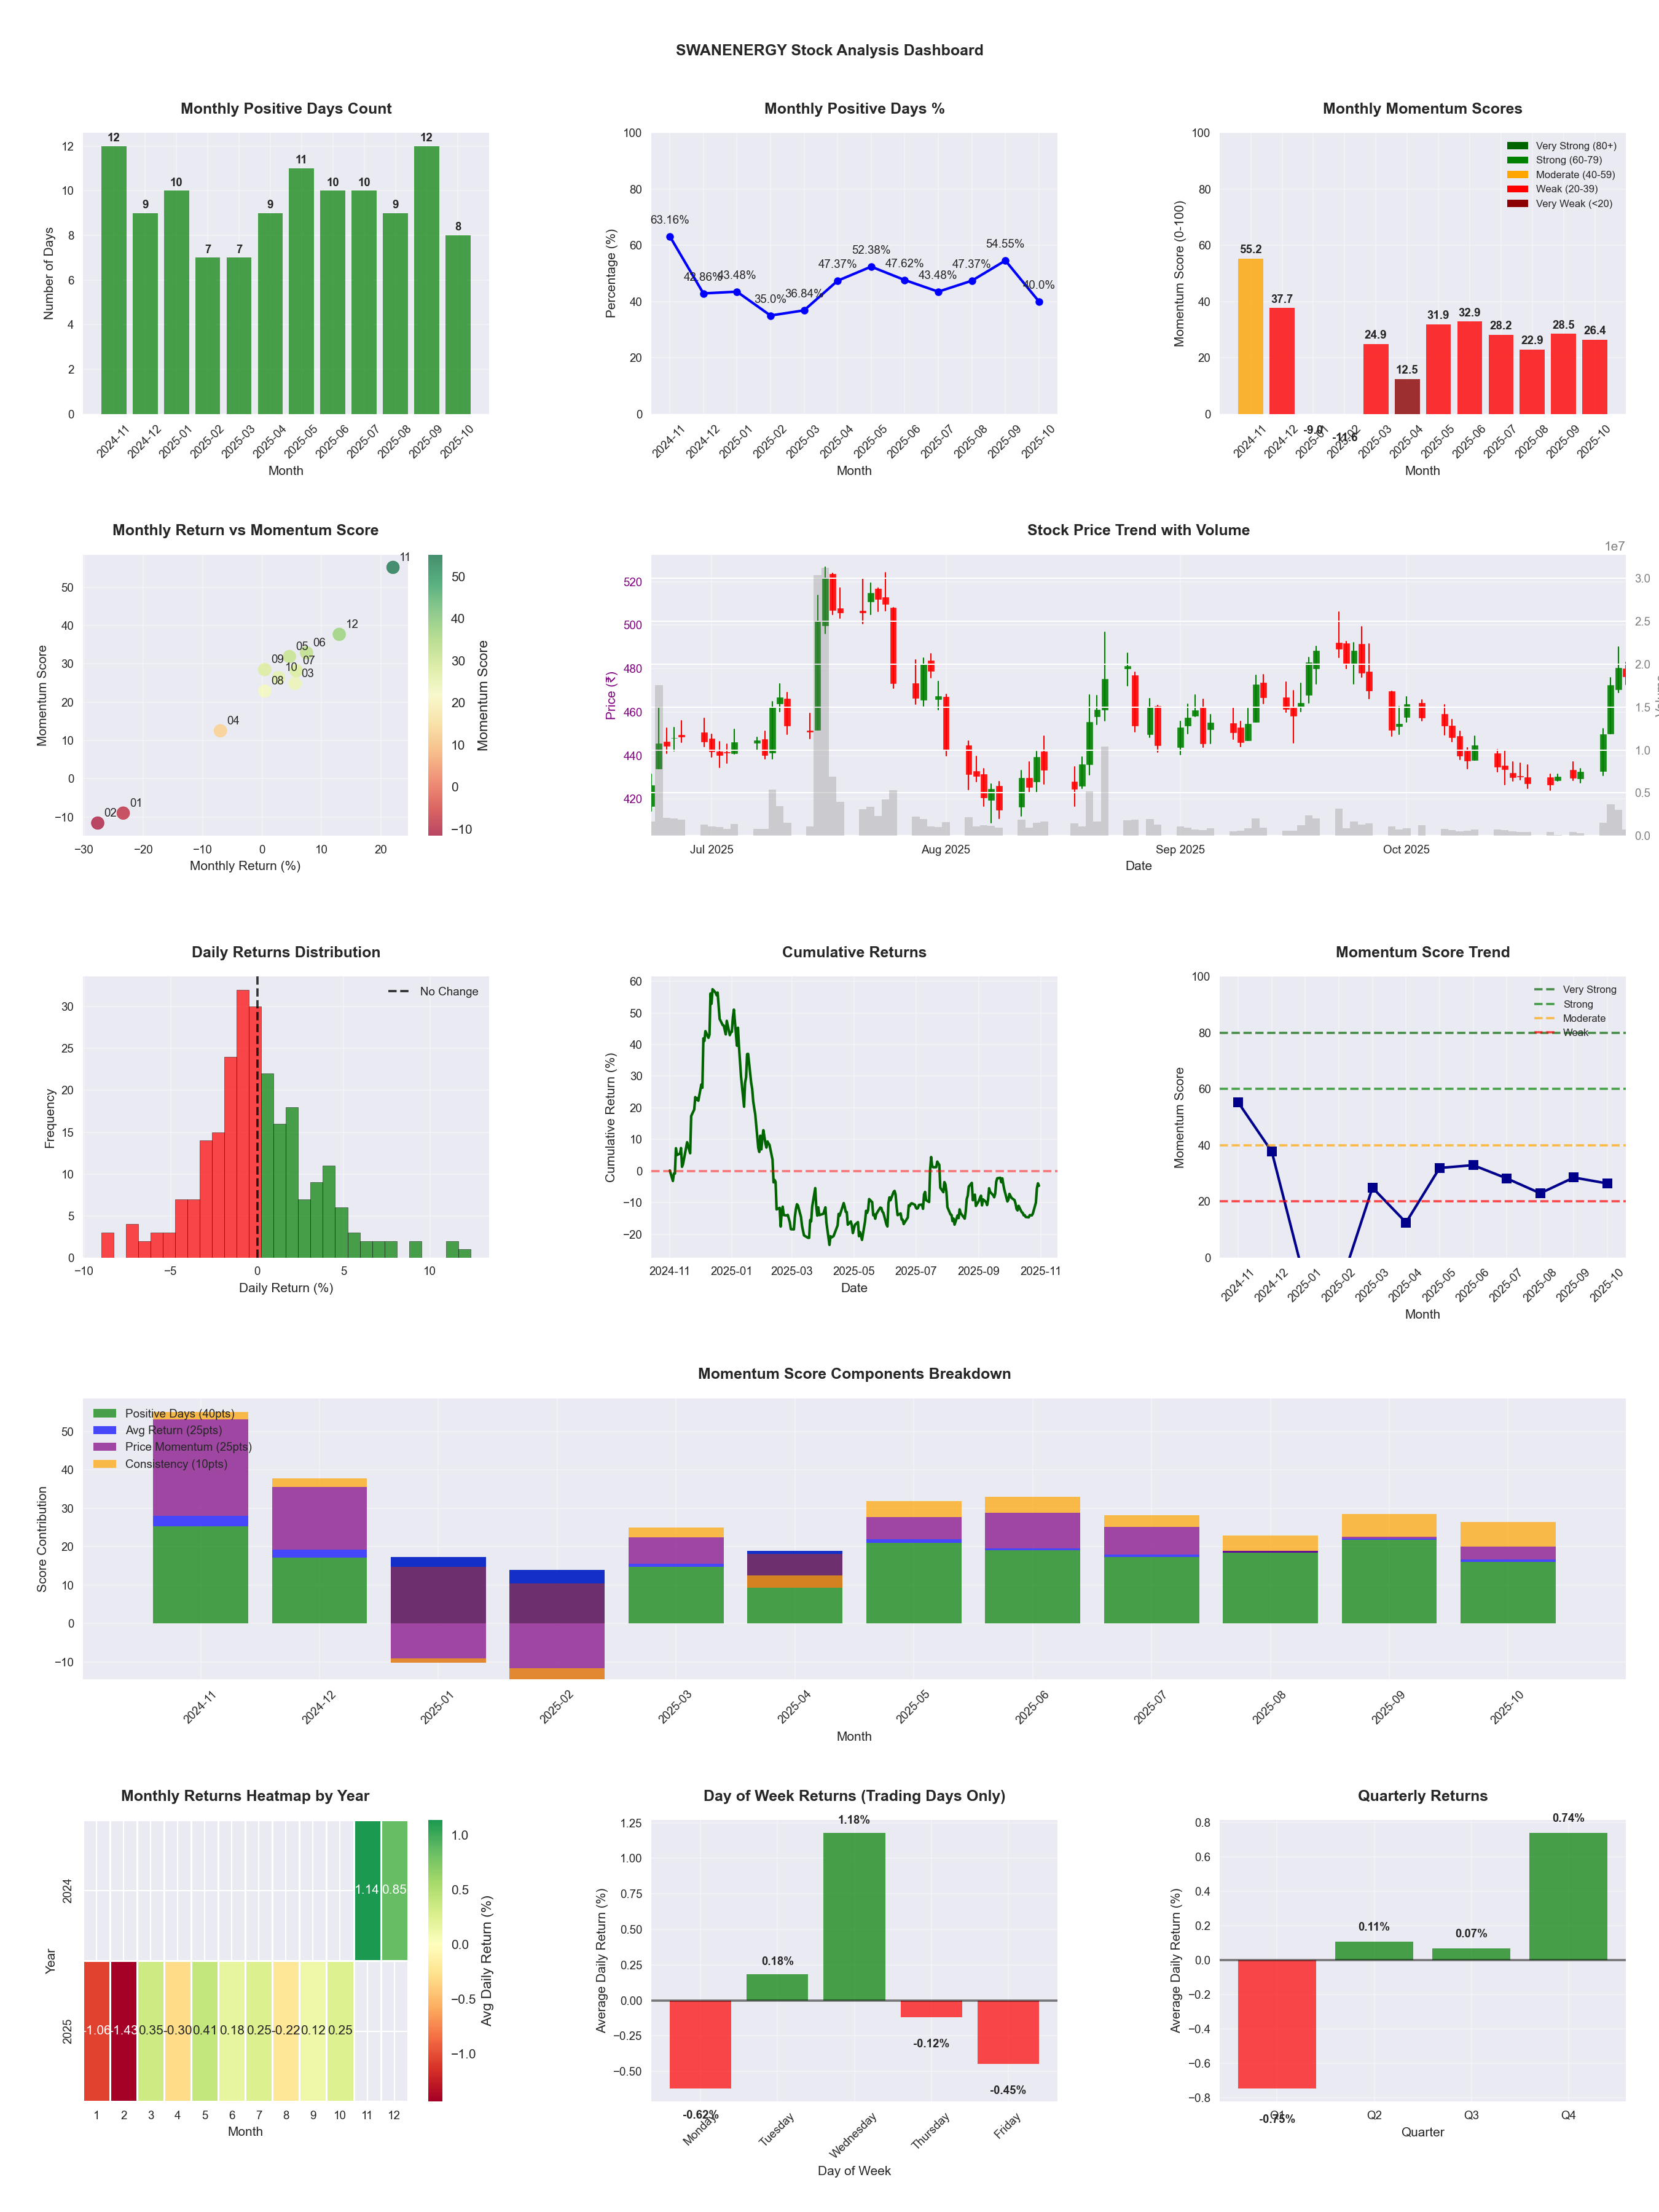
📊 Key Insights & Metrics
Symbol
📈 SWANENERGY
Date
📅 2025-10-31
Volatility
🔴 3.35%
Risk Profile
⚠️ suitable for aggressive investors
Win Rate
⚠️ 46.1%
Avg Daily Return
📈 +0.04%
Max Drawdown
📉 -51.32%
Best Month
🏆 2024-11
Best Months to Trade
📅 Nov, Dec, May
Best Days to Trade
📅 Wednesday
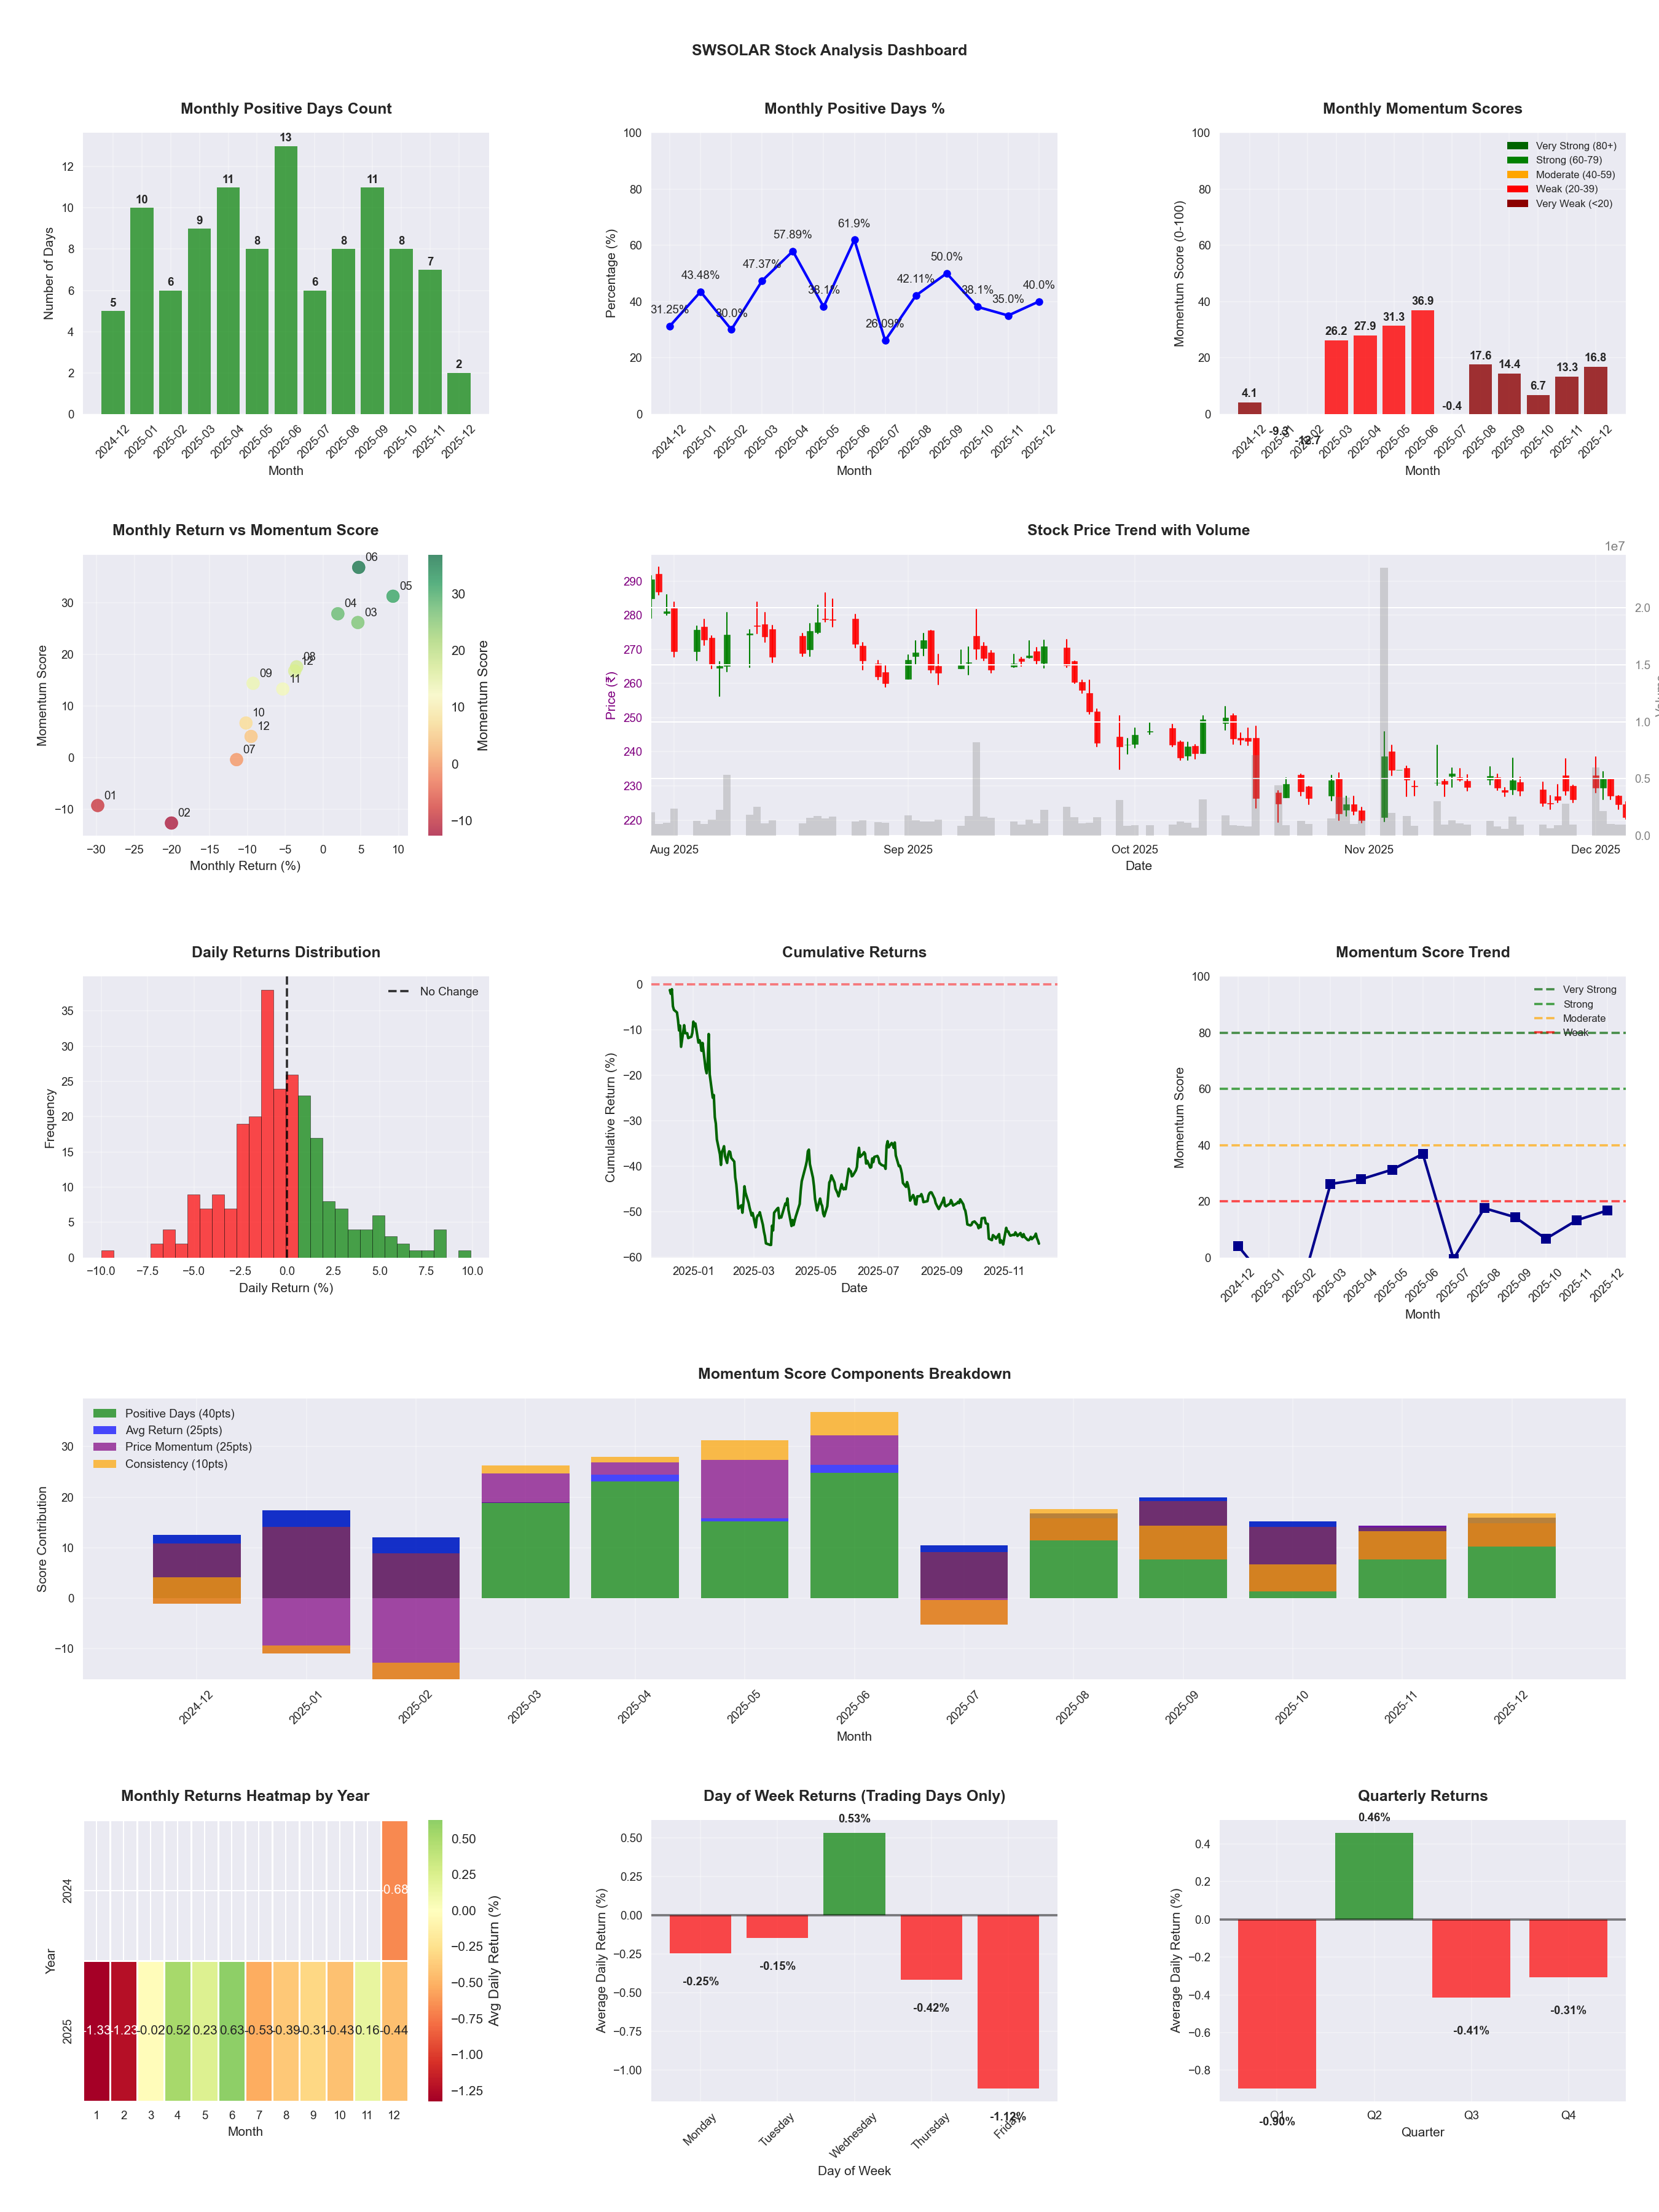
📊 Key Insights & Metrics
Symbol
📈 SWSOLAR
Date
📅 2026-03-21
Volatility
🟡 2.76%
Risk Profile
⚠️ suitable for aggressive investors
Win Rate
⚠️ 43.7%
Avg Daily Return
📉 -0.12%
Max Drawdown
📉 -49.80%
Best Month
🏆 2025-06
Best Months to Trade
📅 Jun, Apr, Feb
Best Days to Trade
📅 Tuesday, Monday
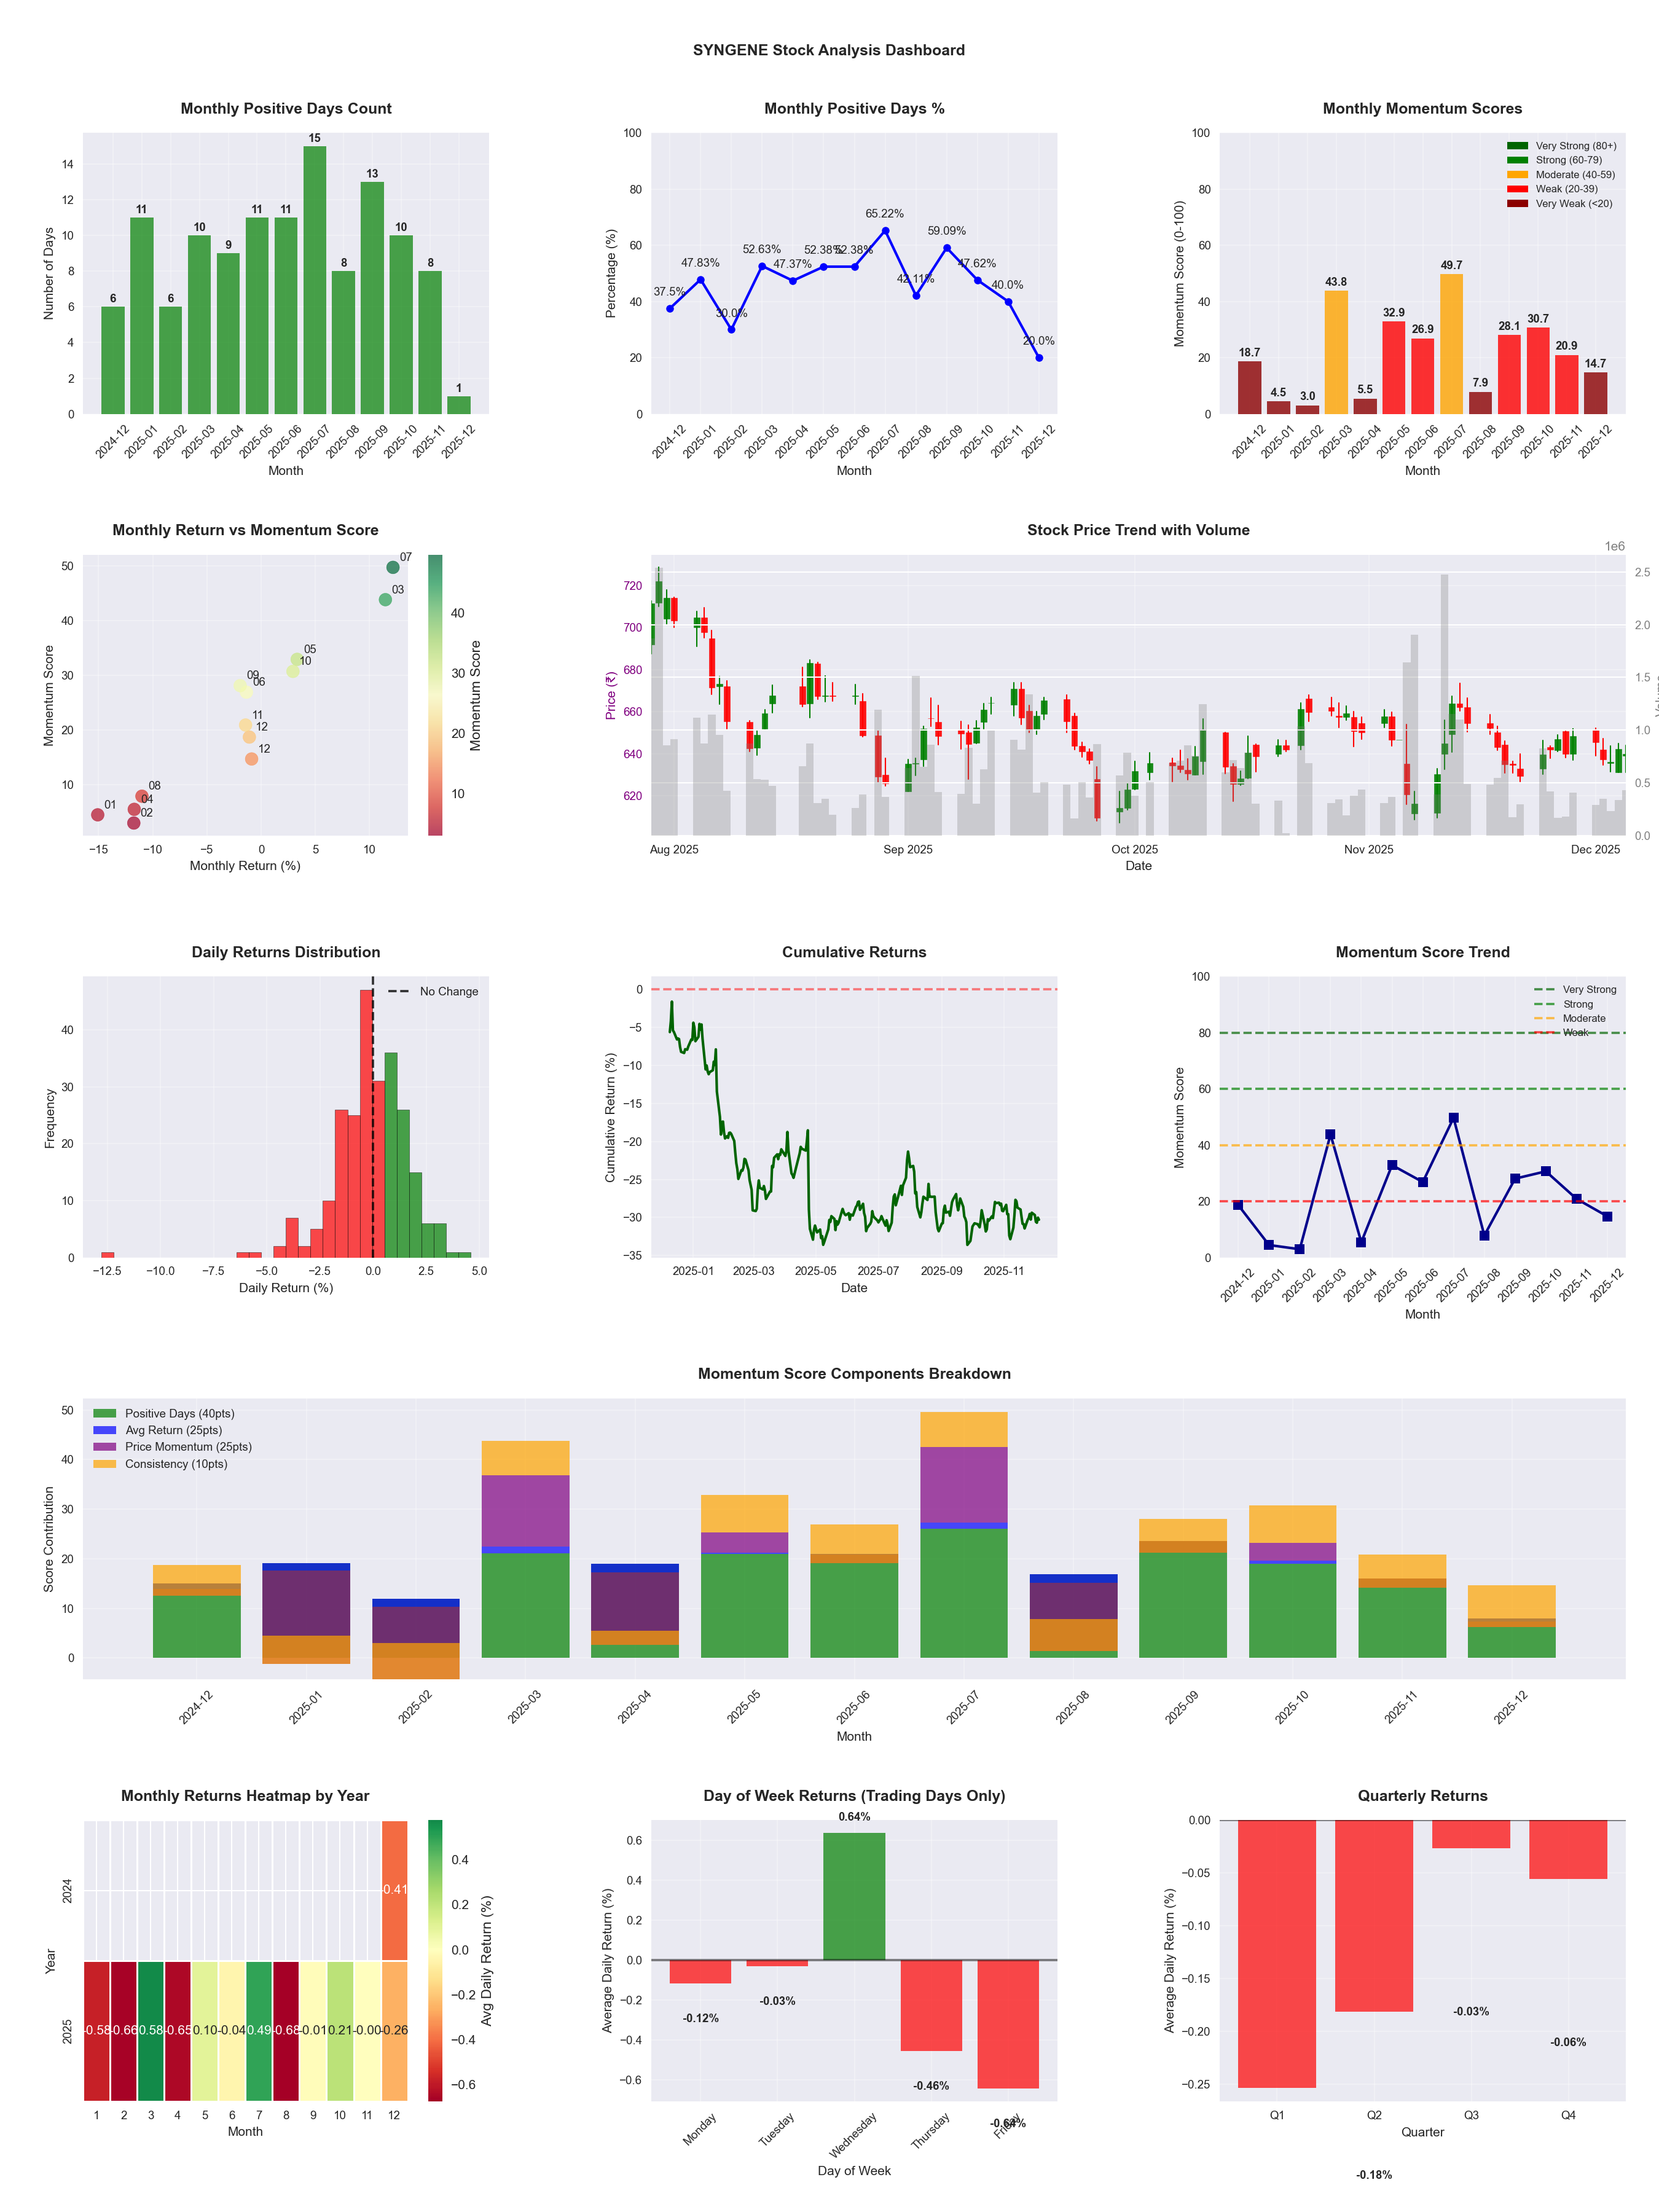
📊 Key Insights & Metrics
Symbol
📈 SYNGENE
Date
📅 2026-04-11
Volatility
🟡 1.97%
Win Rate
⚠️ 48.0%
Avg Daily Return
📉 -0.20%
Max Drawdown
📉 -47.85%
IBD RS Score
📊 1.4
Weak
Market Rank
#486
Best Month
🏆 2025-07
Best Months to Trade
📅 Jul, Oct, May
Best Days to Trade
📅 Wednesday, Monday
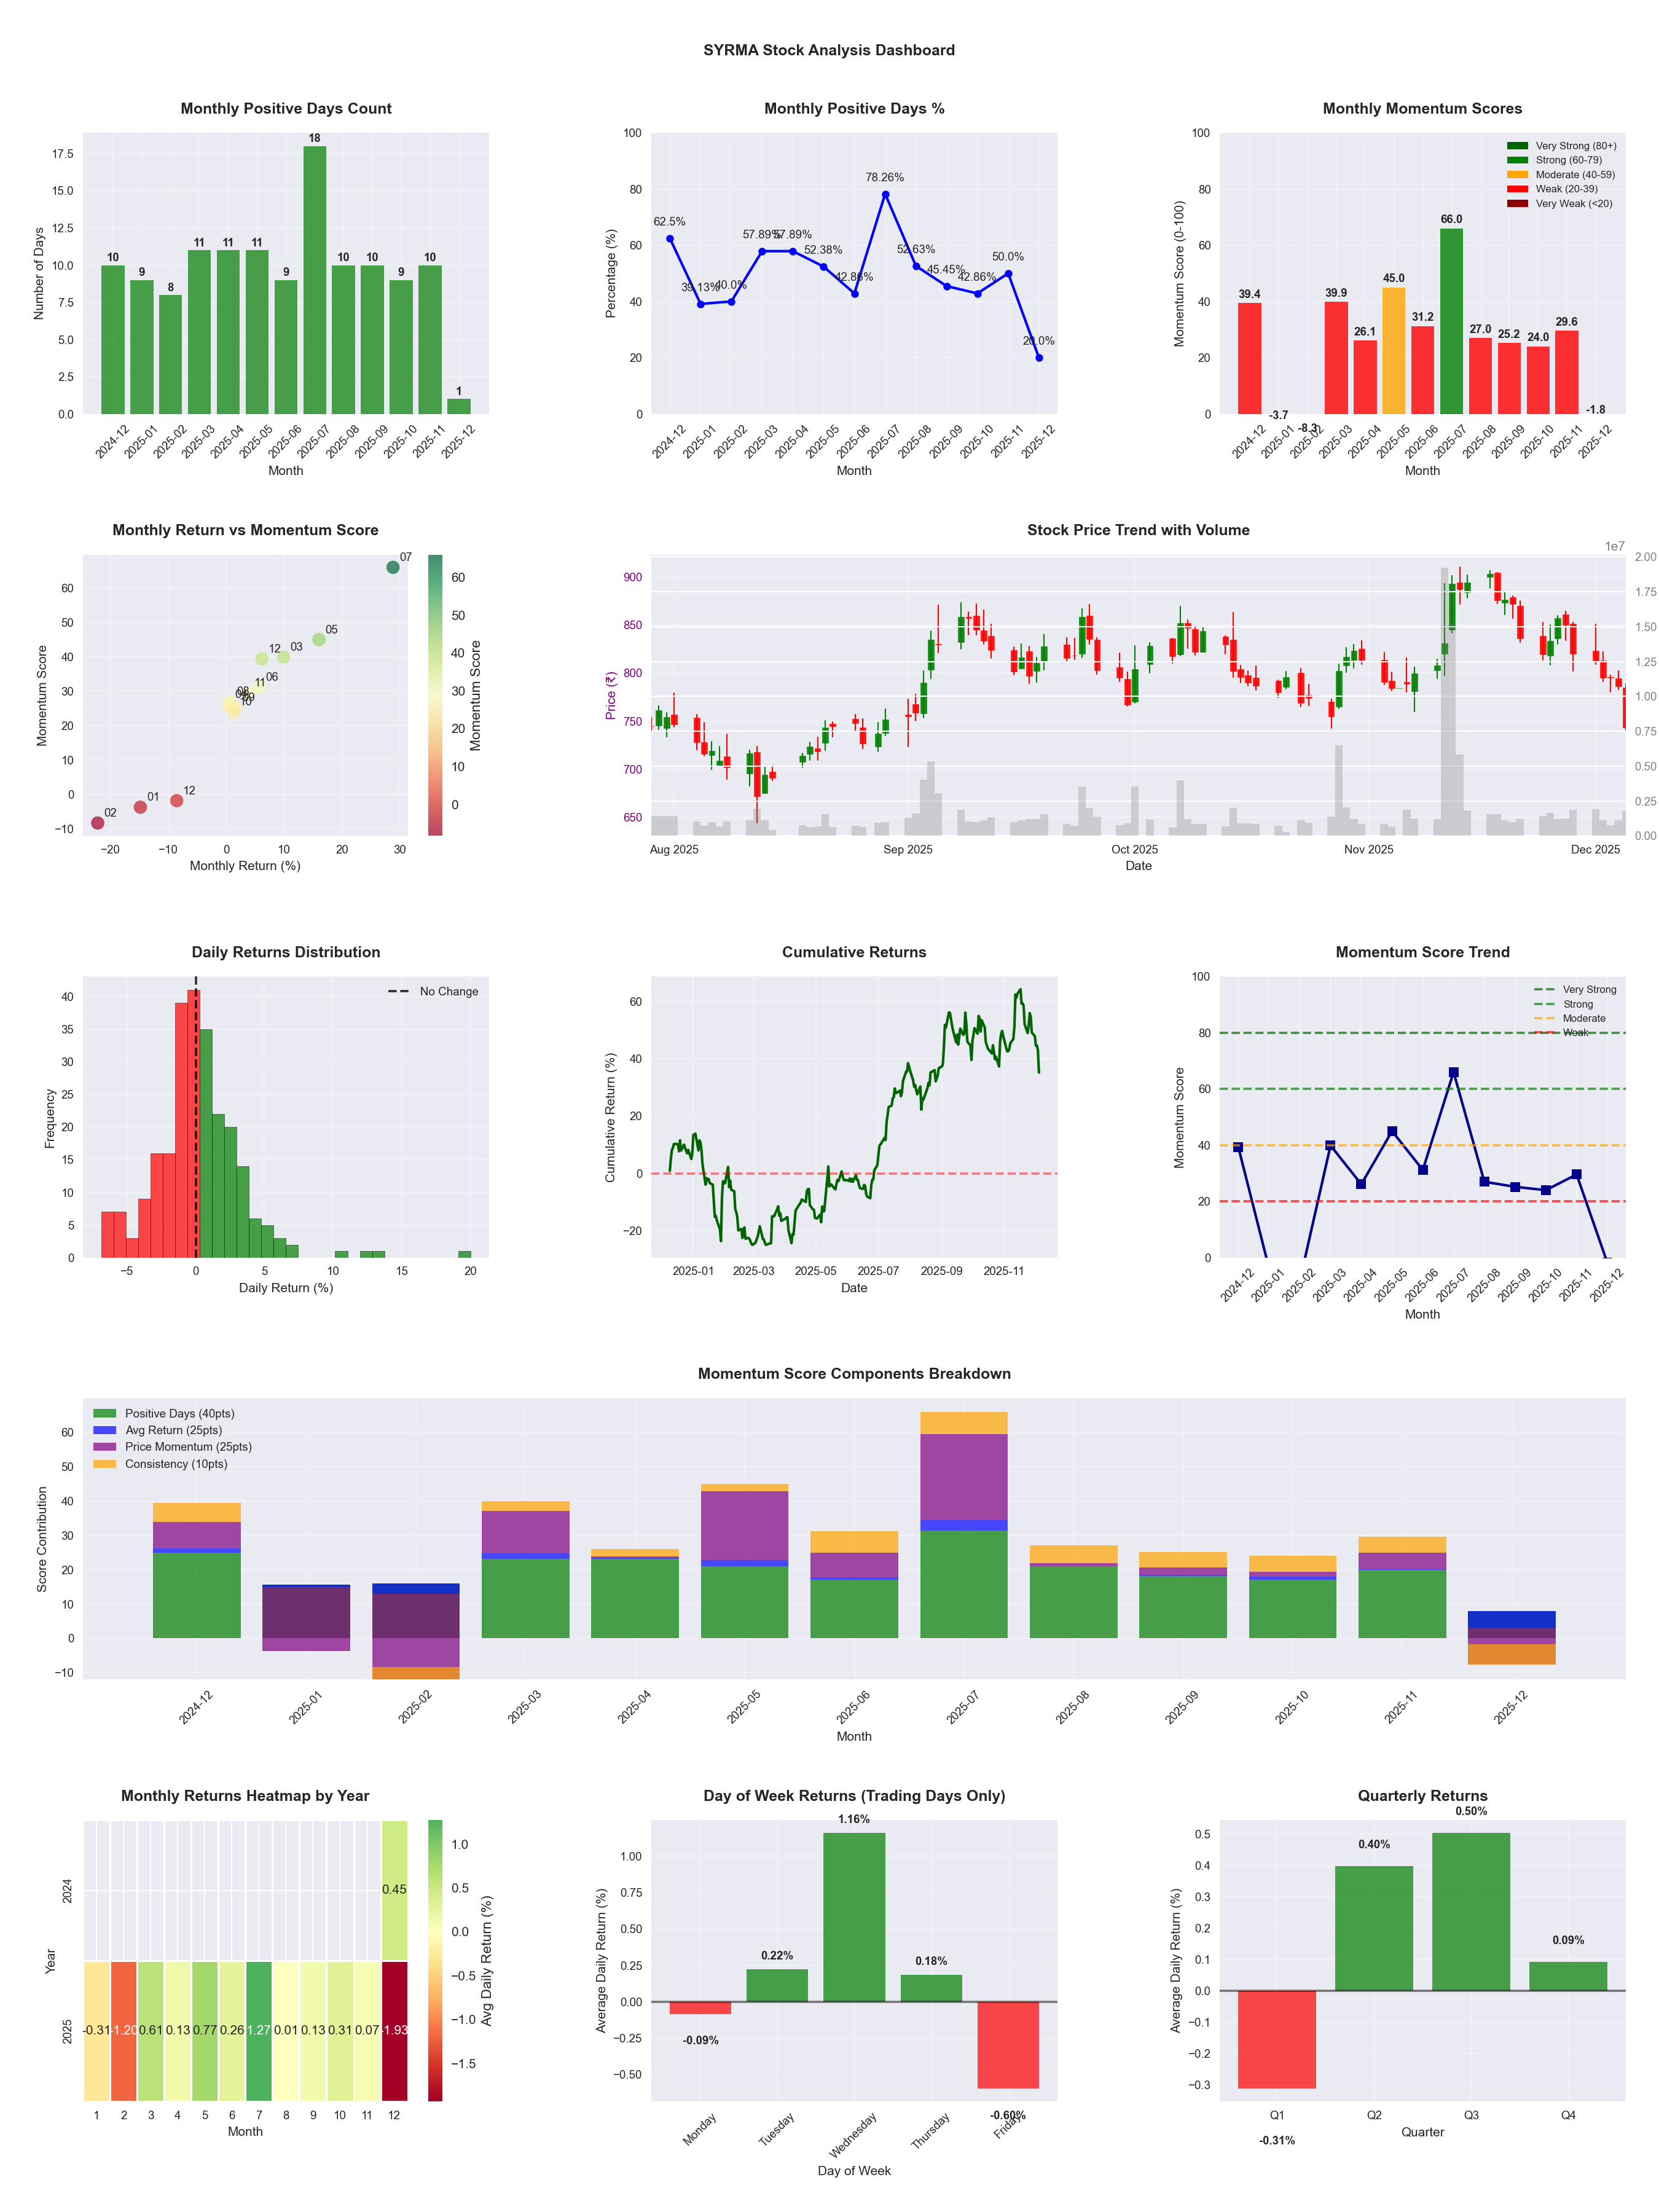
📊 Key Insights & Metrics
Symbol
📈 SYRMA
Date
📅 2026-04-11
Volatility
🟡 2.72%
Risk Profile
⚠️ suitable for aggressive investors
Win Rate
⚠️ 51.6%
Avg Daily Return
📈 +0.28%
Max Drawdown
📉 -29.12%
IBD RS Score
📊 93.9
Leader
Market Rank
#30
Best Month
🏆 2025-07
Worst Month
📉 2025-12
Best Months to Trade
📅 Jul, May, Apr
Best Days to Trade
📅 Wednesday, Tuesday
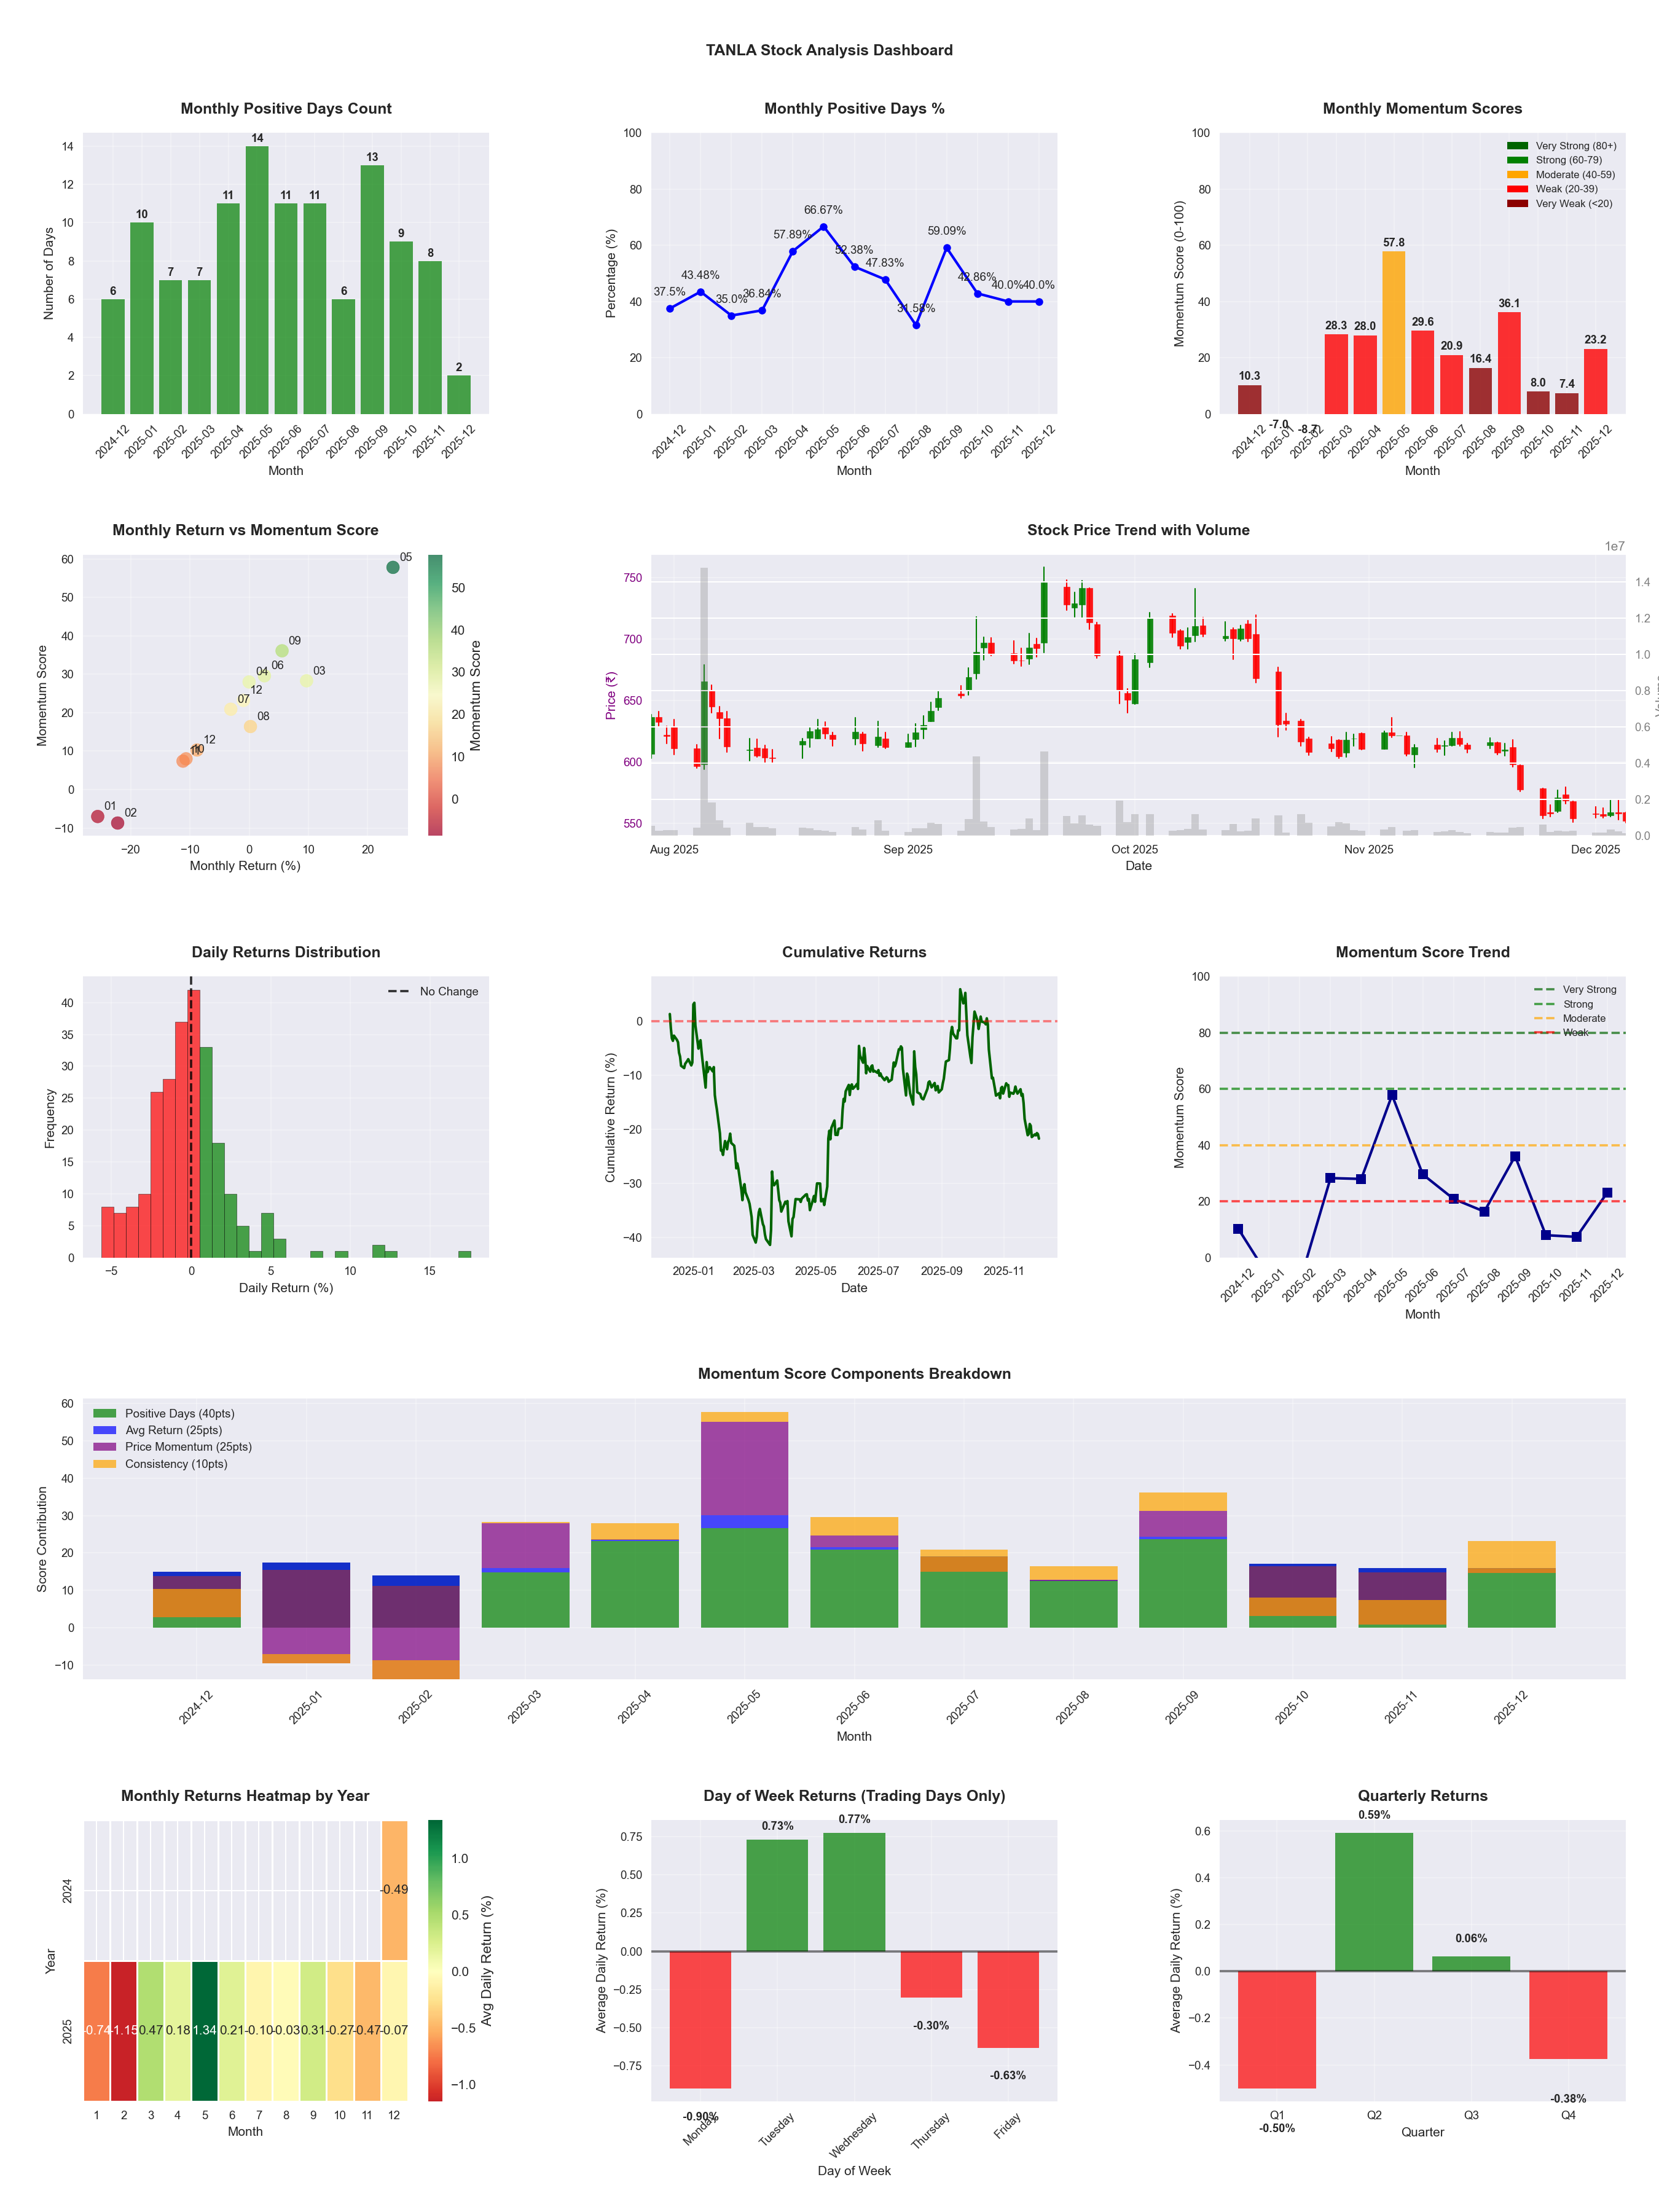
📊 Key Insights & Metrics
Symbol
📈 TANLA
Date
📅 2026-03-21
Volatility
🟡 2.62%
Risk Profile
⚠️ suitable for aggressive investors
Win Rate
⚠️ 45.8%
Avg Daily Return
📉 -0.03%
Max Drawdown
📉 -45.33%
Best Month
🏆 2025-05
Worst Month
📉 2025-03
Best Months to Trade
📅 May, Sep, Jun
Best Days to Trade
📅 Tuesday, Wednesday
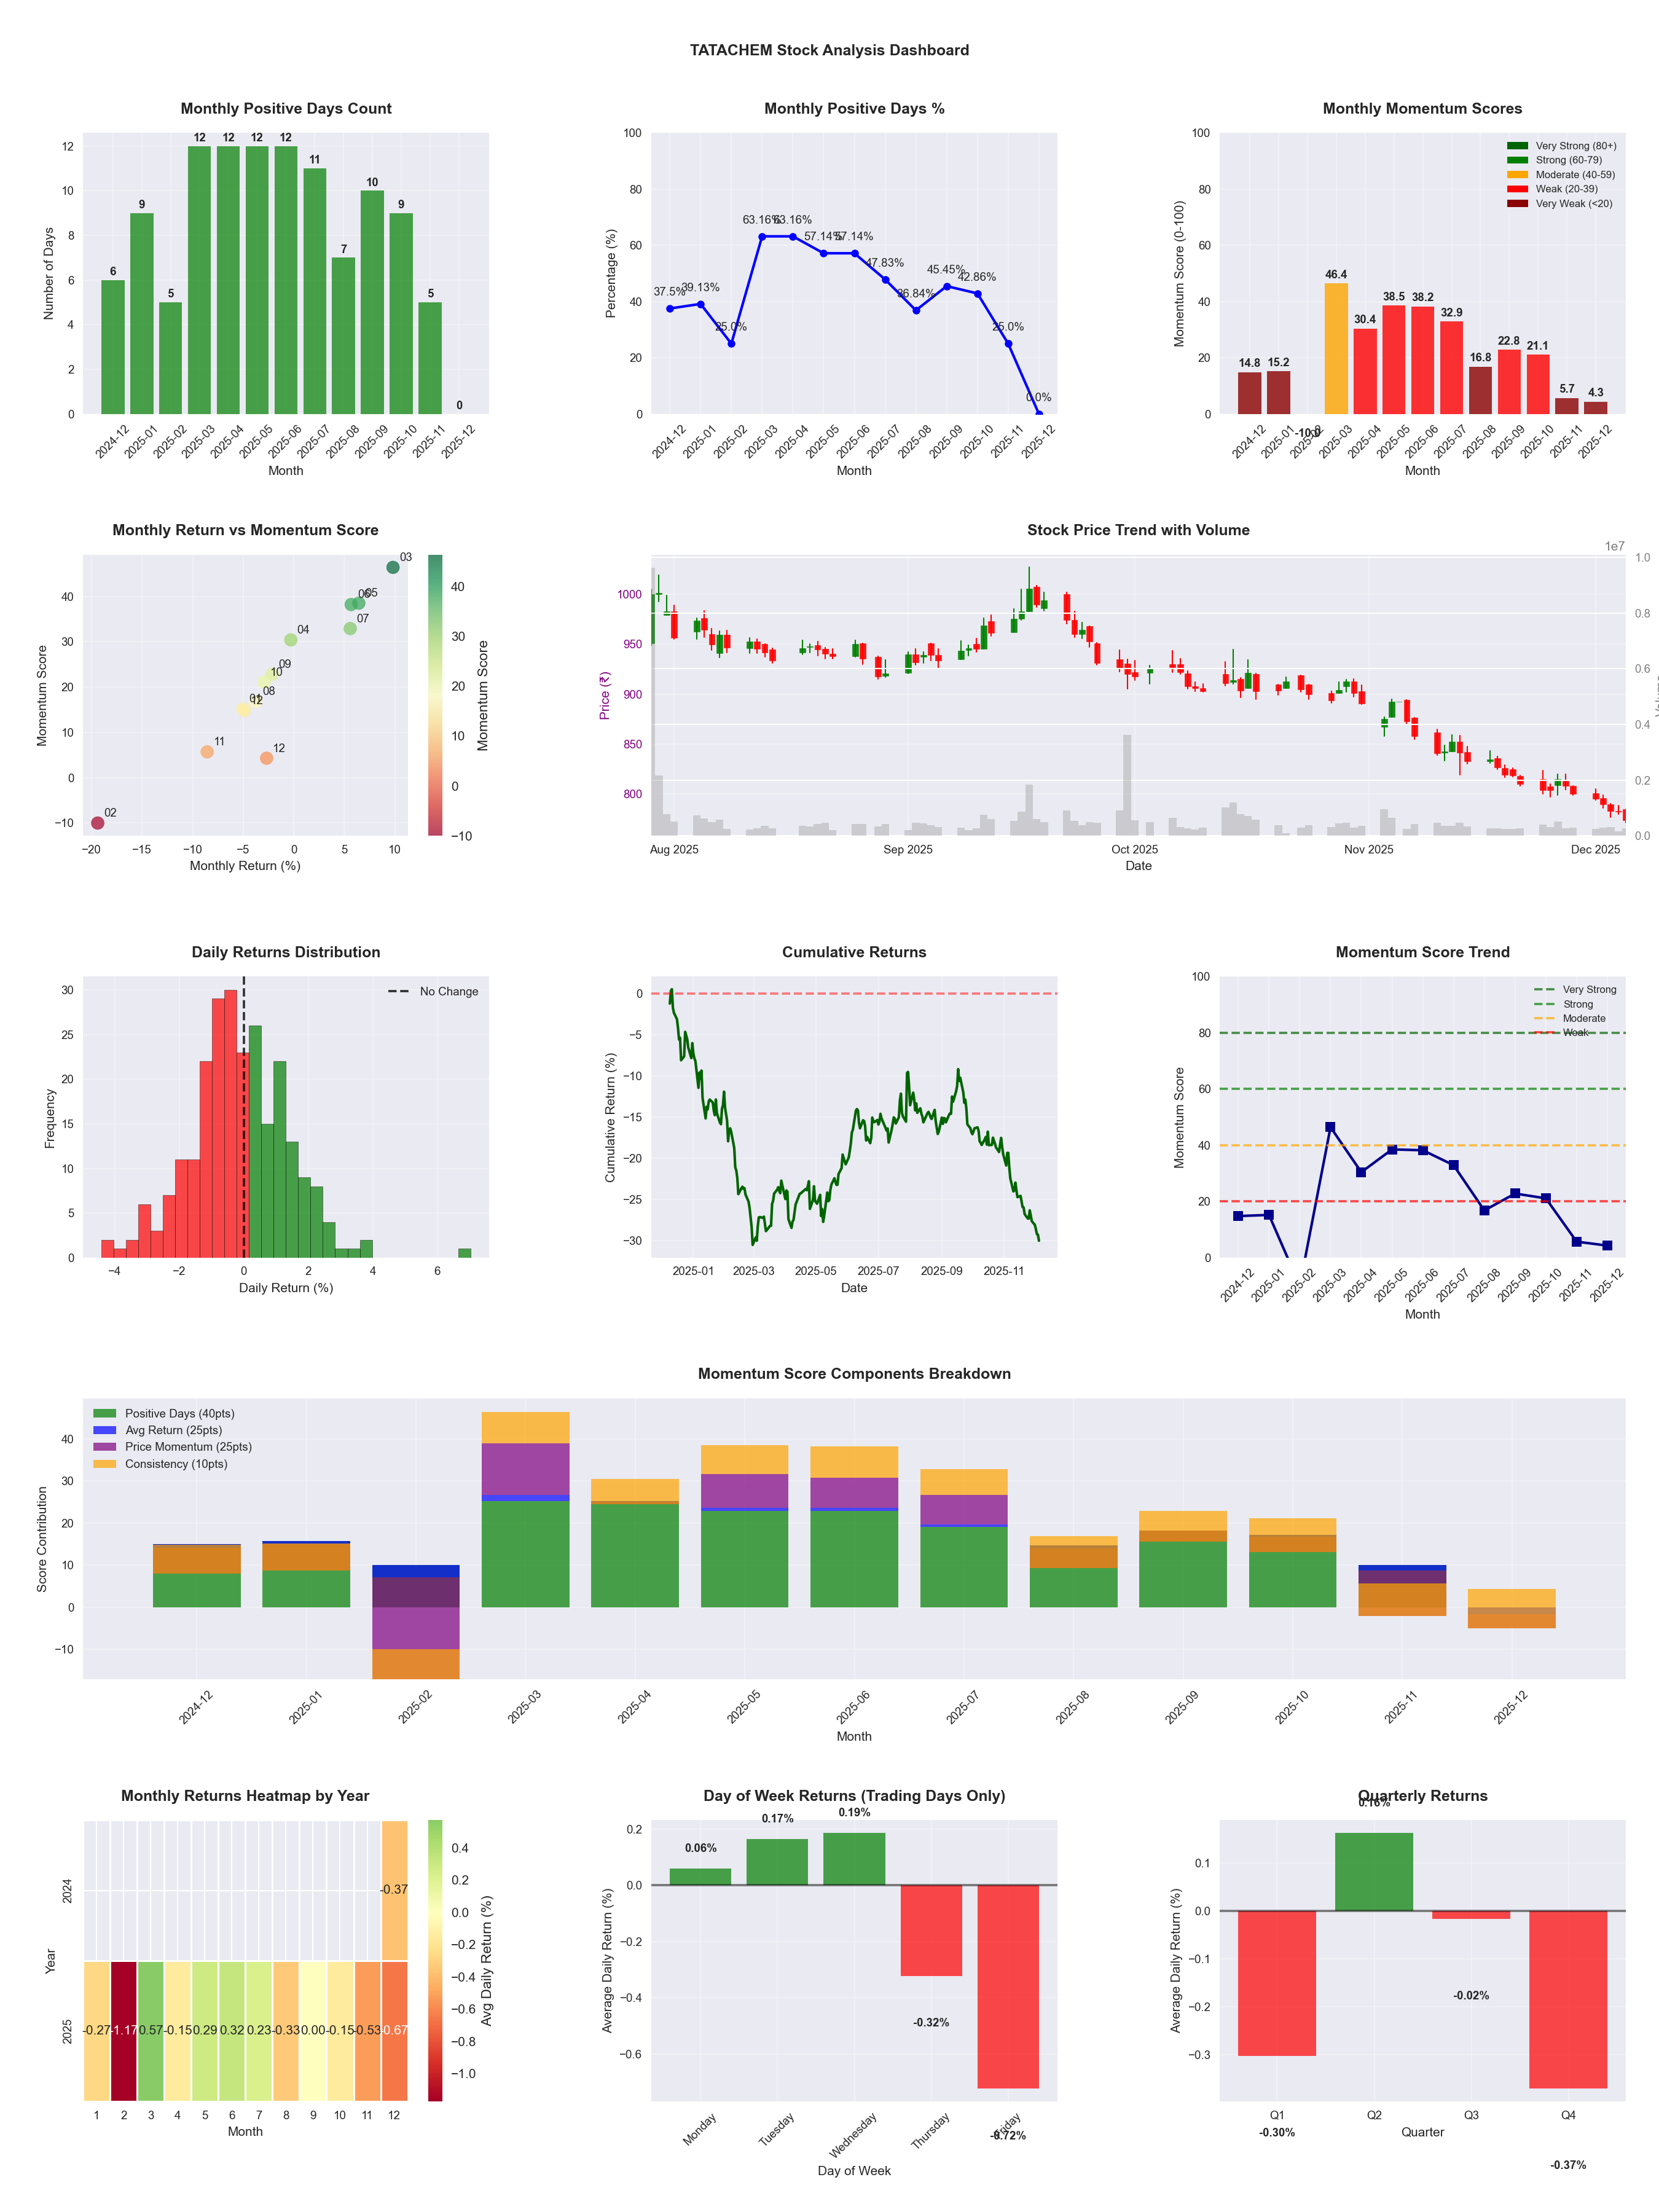
📊 Key Insights & Metrics
Symbol
📈 TATACHEM
Date
📅 2026-04-11
Volatility
🟡 1.68%
Win Rate
⚠️ 42.7%
Avg Daily Return
📉 -0.06%
Max Drawdown
📉 -41.97%
IBD RS Score
📊 20.3
Weak
Market Rank
#393
Best Month
🏆 2026-04
Best Months to Trade
📅 Apr, Jun, May
Best Days to Trade
📅 Wednesday, Tuesday
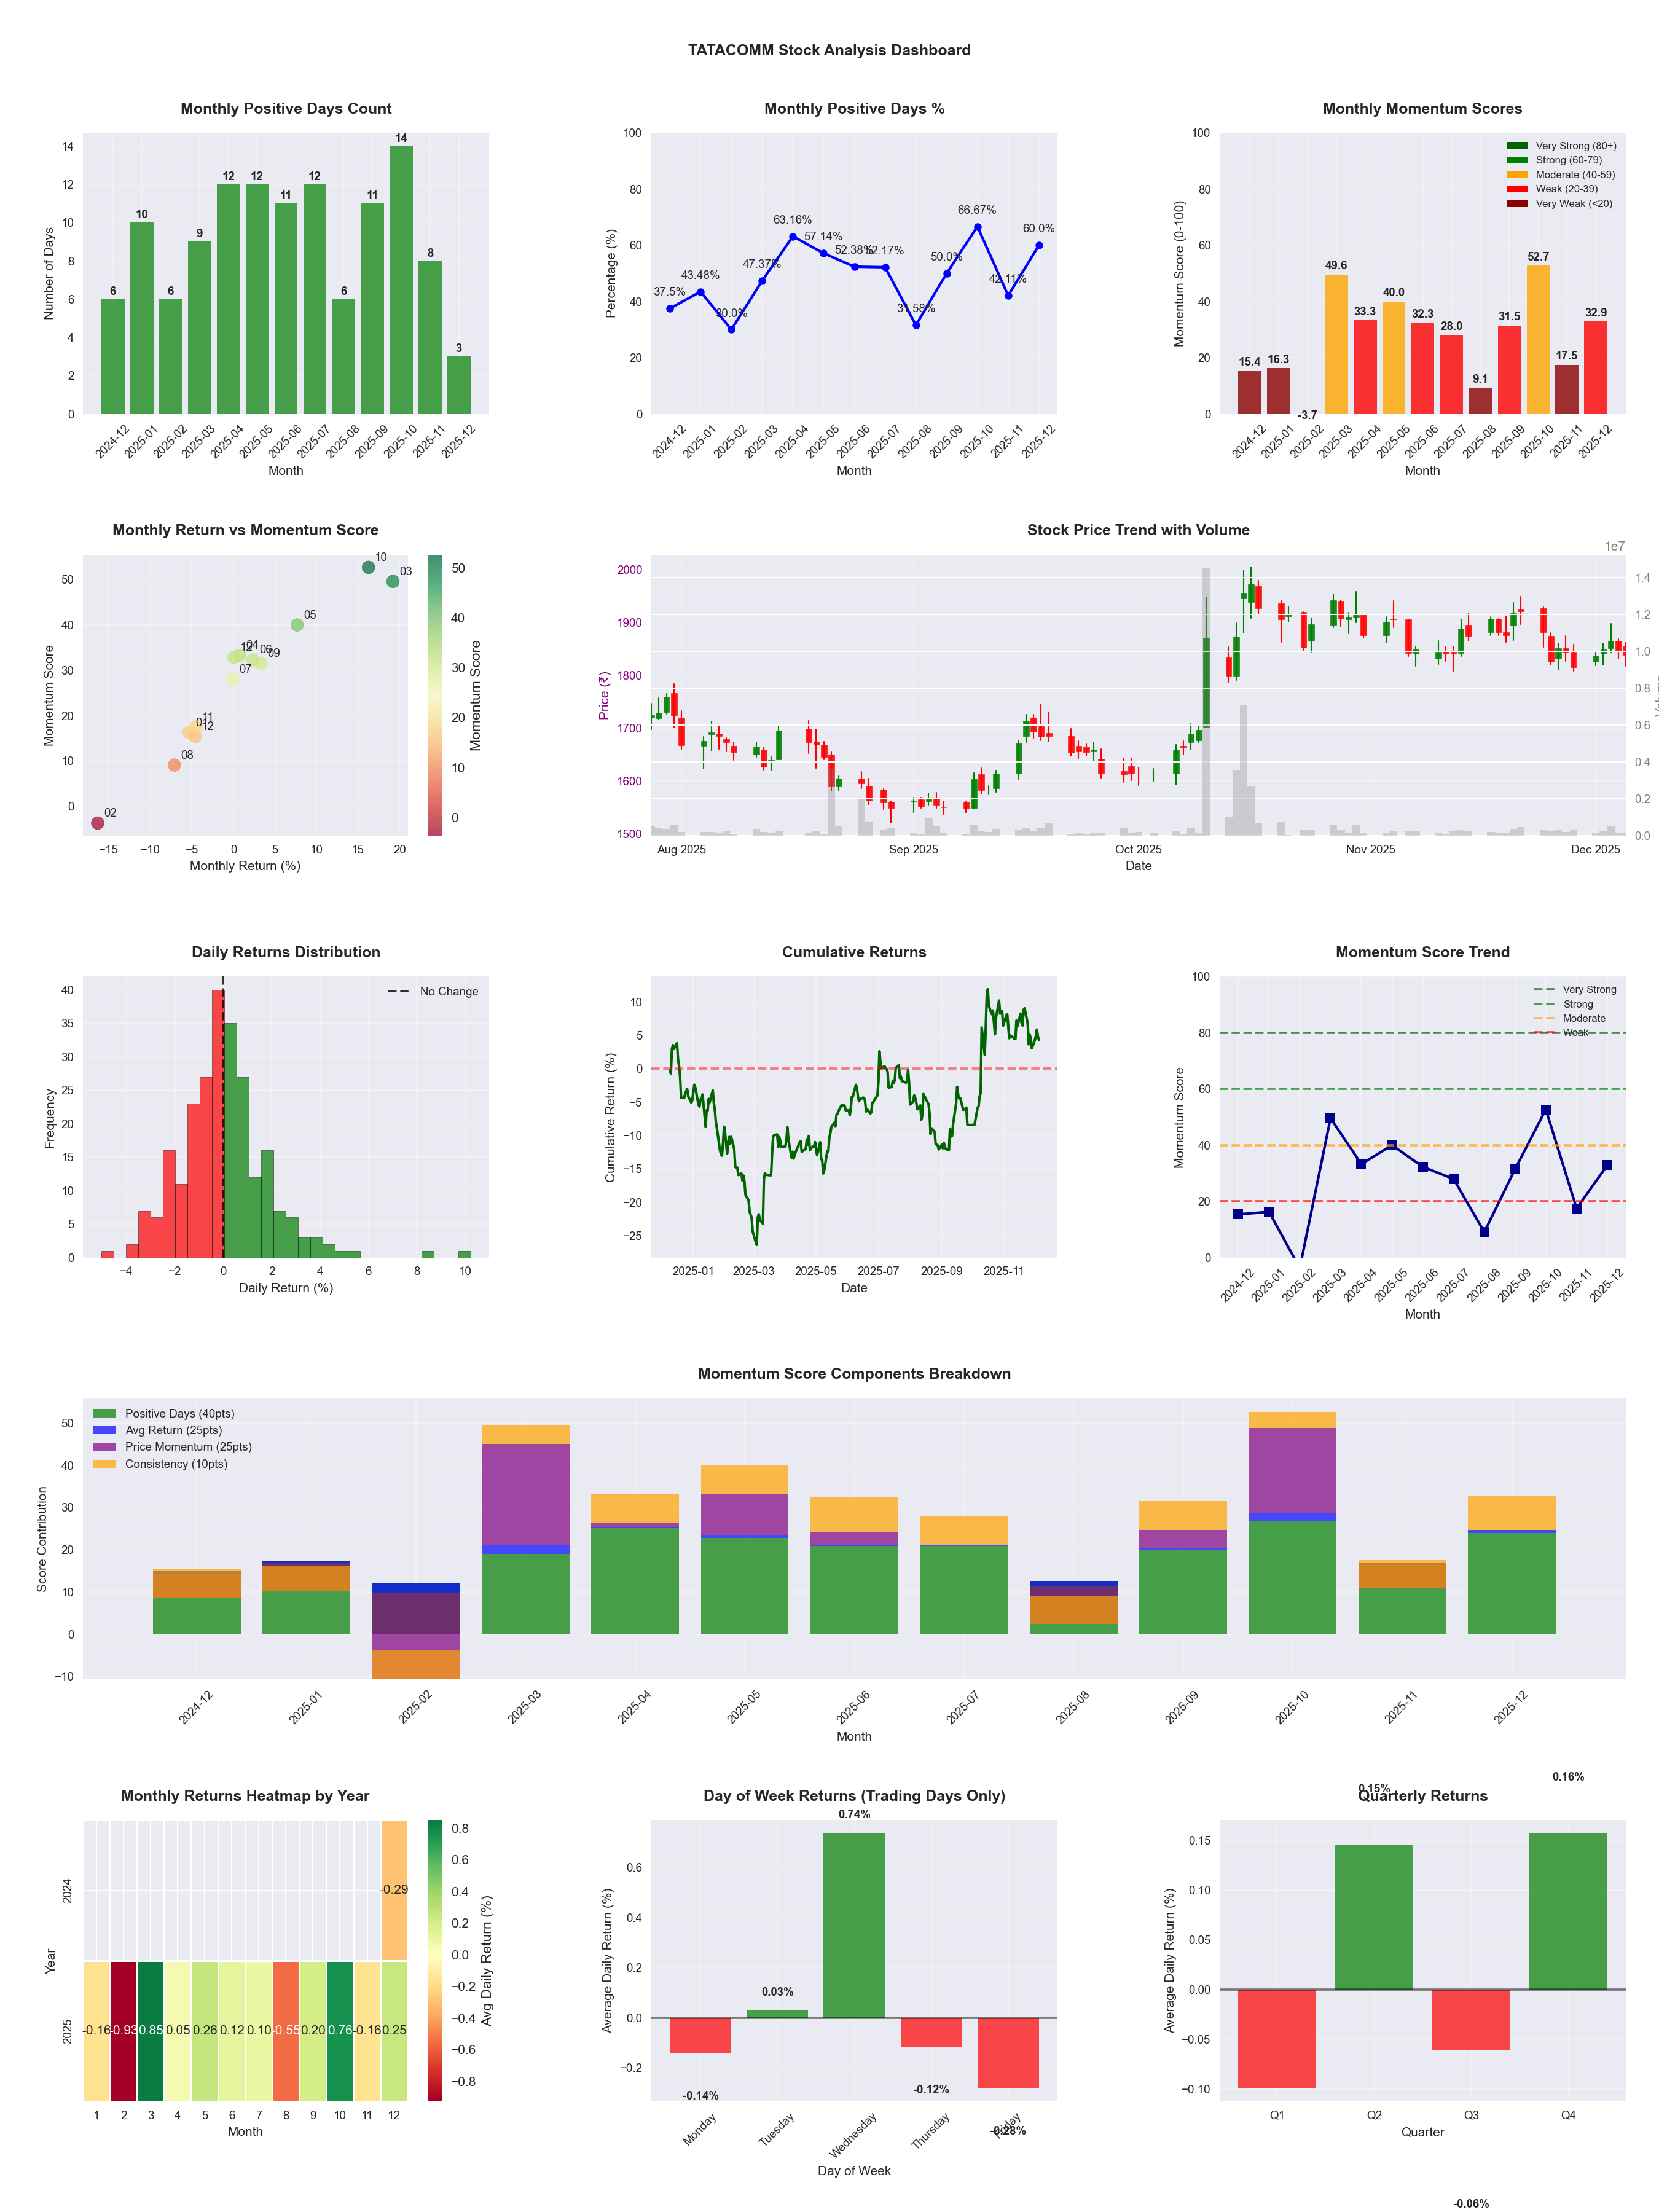
📊 Key Insights & Metrics
Symbol
📈 TATACOMM
Date
📅 2026-04-11
Volatility
🟡 1.89%
Win Rate
⚠️ 50.0%
Avg Daily Return
📈 +0.01%
Max Drawdown
📉 -31.62%
IBD RS Score
📊 34.5
Weak
Market Rank
#323
Best Month
🏆 2025-10
Worst Month
📉 2026-03
Best Months to Trade
📅 Oct, Apr, May
Best Days to Trade
📅 Wednesday, Tuesday
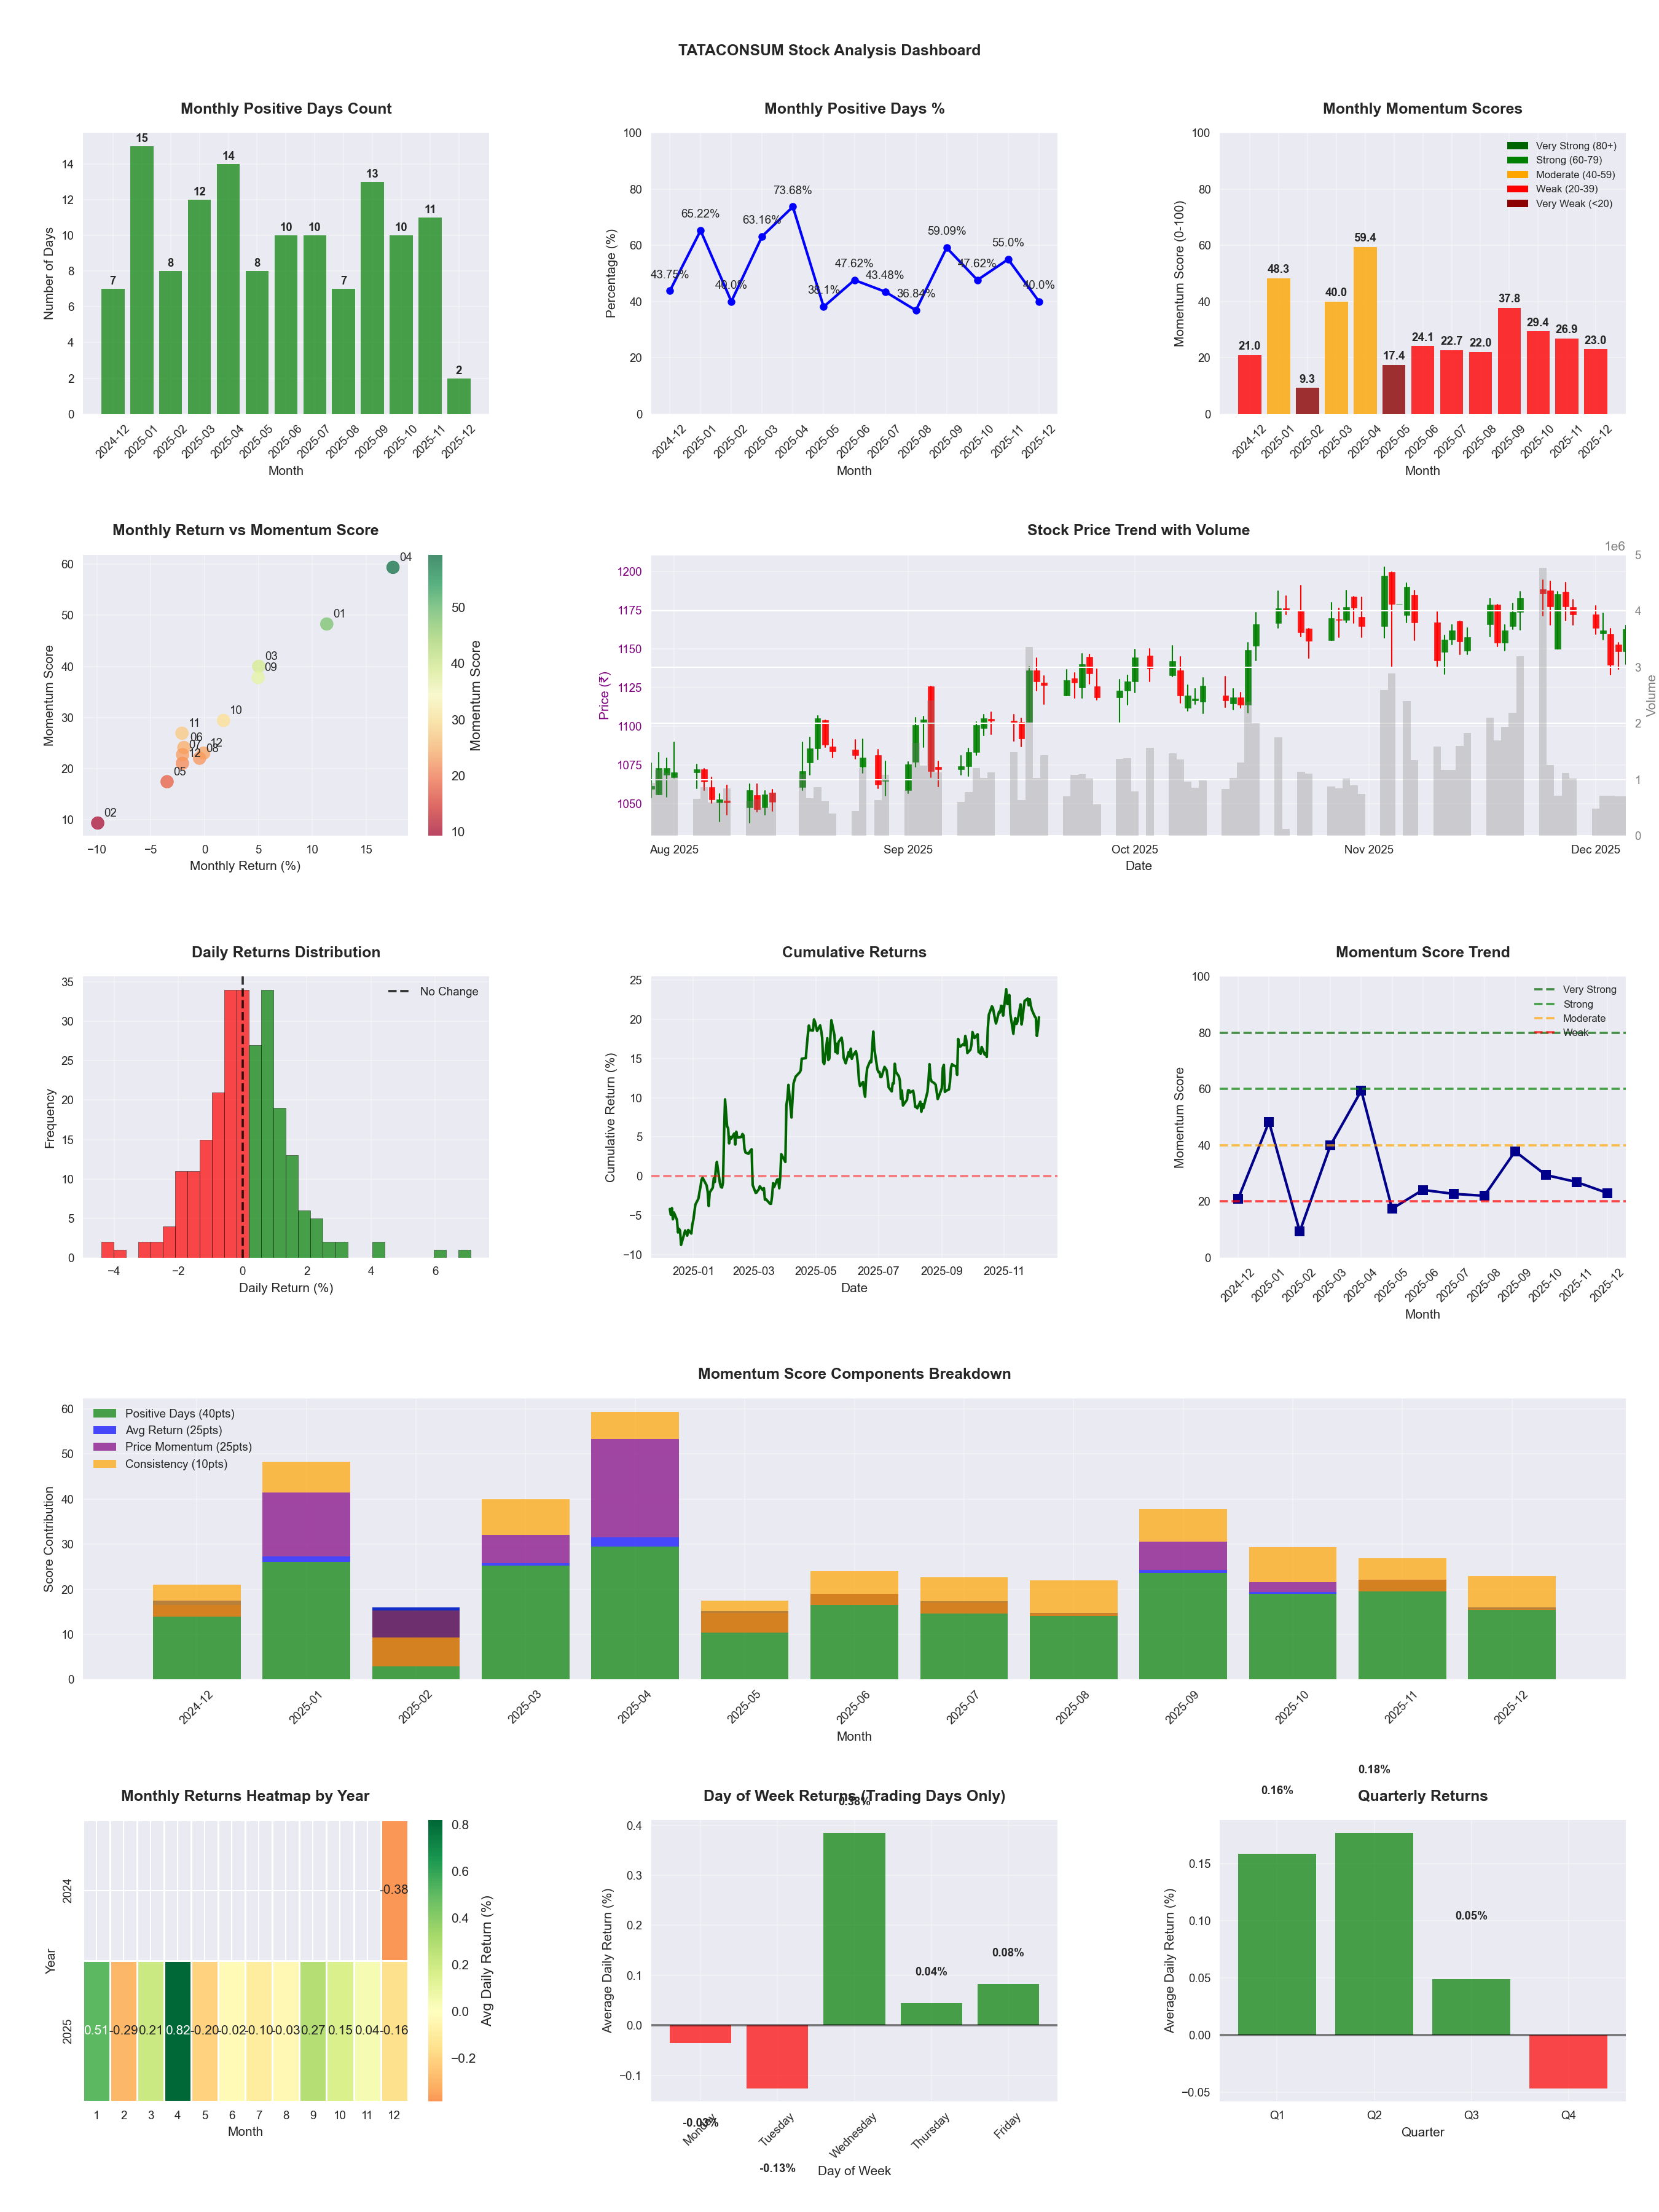
📊 Key Insights & Metrics
Symbol
📈 TATACONSUM
Date
📅 2026-04-11
Volatility
🟢 1.28%
Win Rate
⚠️ 49.2%
Avg Daily Return
📈 +0.01%
Max Drawdown
📉 -16.31%
IBD RS Score
📊 56.6
Average
Market Rank
#214
Best Month
🏆 2026-04
Worst Month
📉 2026-03
Best Months to Trade
📅 Apr, Sep, Oct
Best Days to Trade
📅 Monday, Tuesday
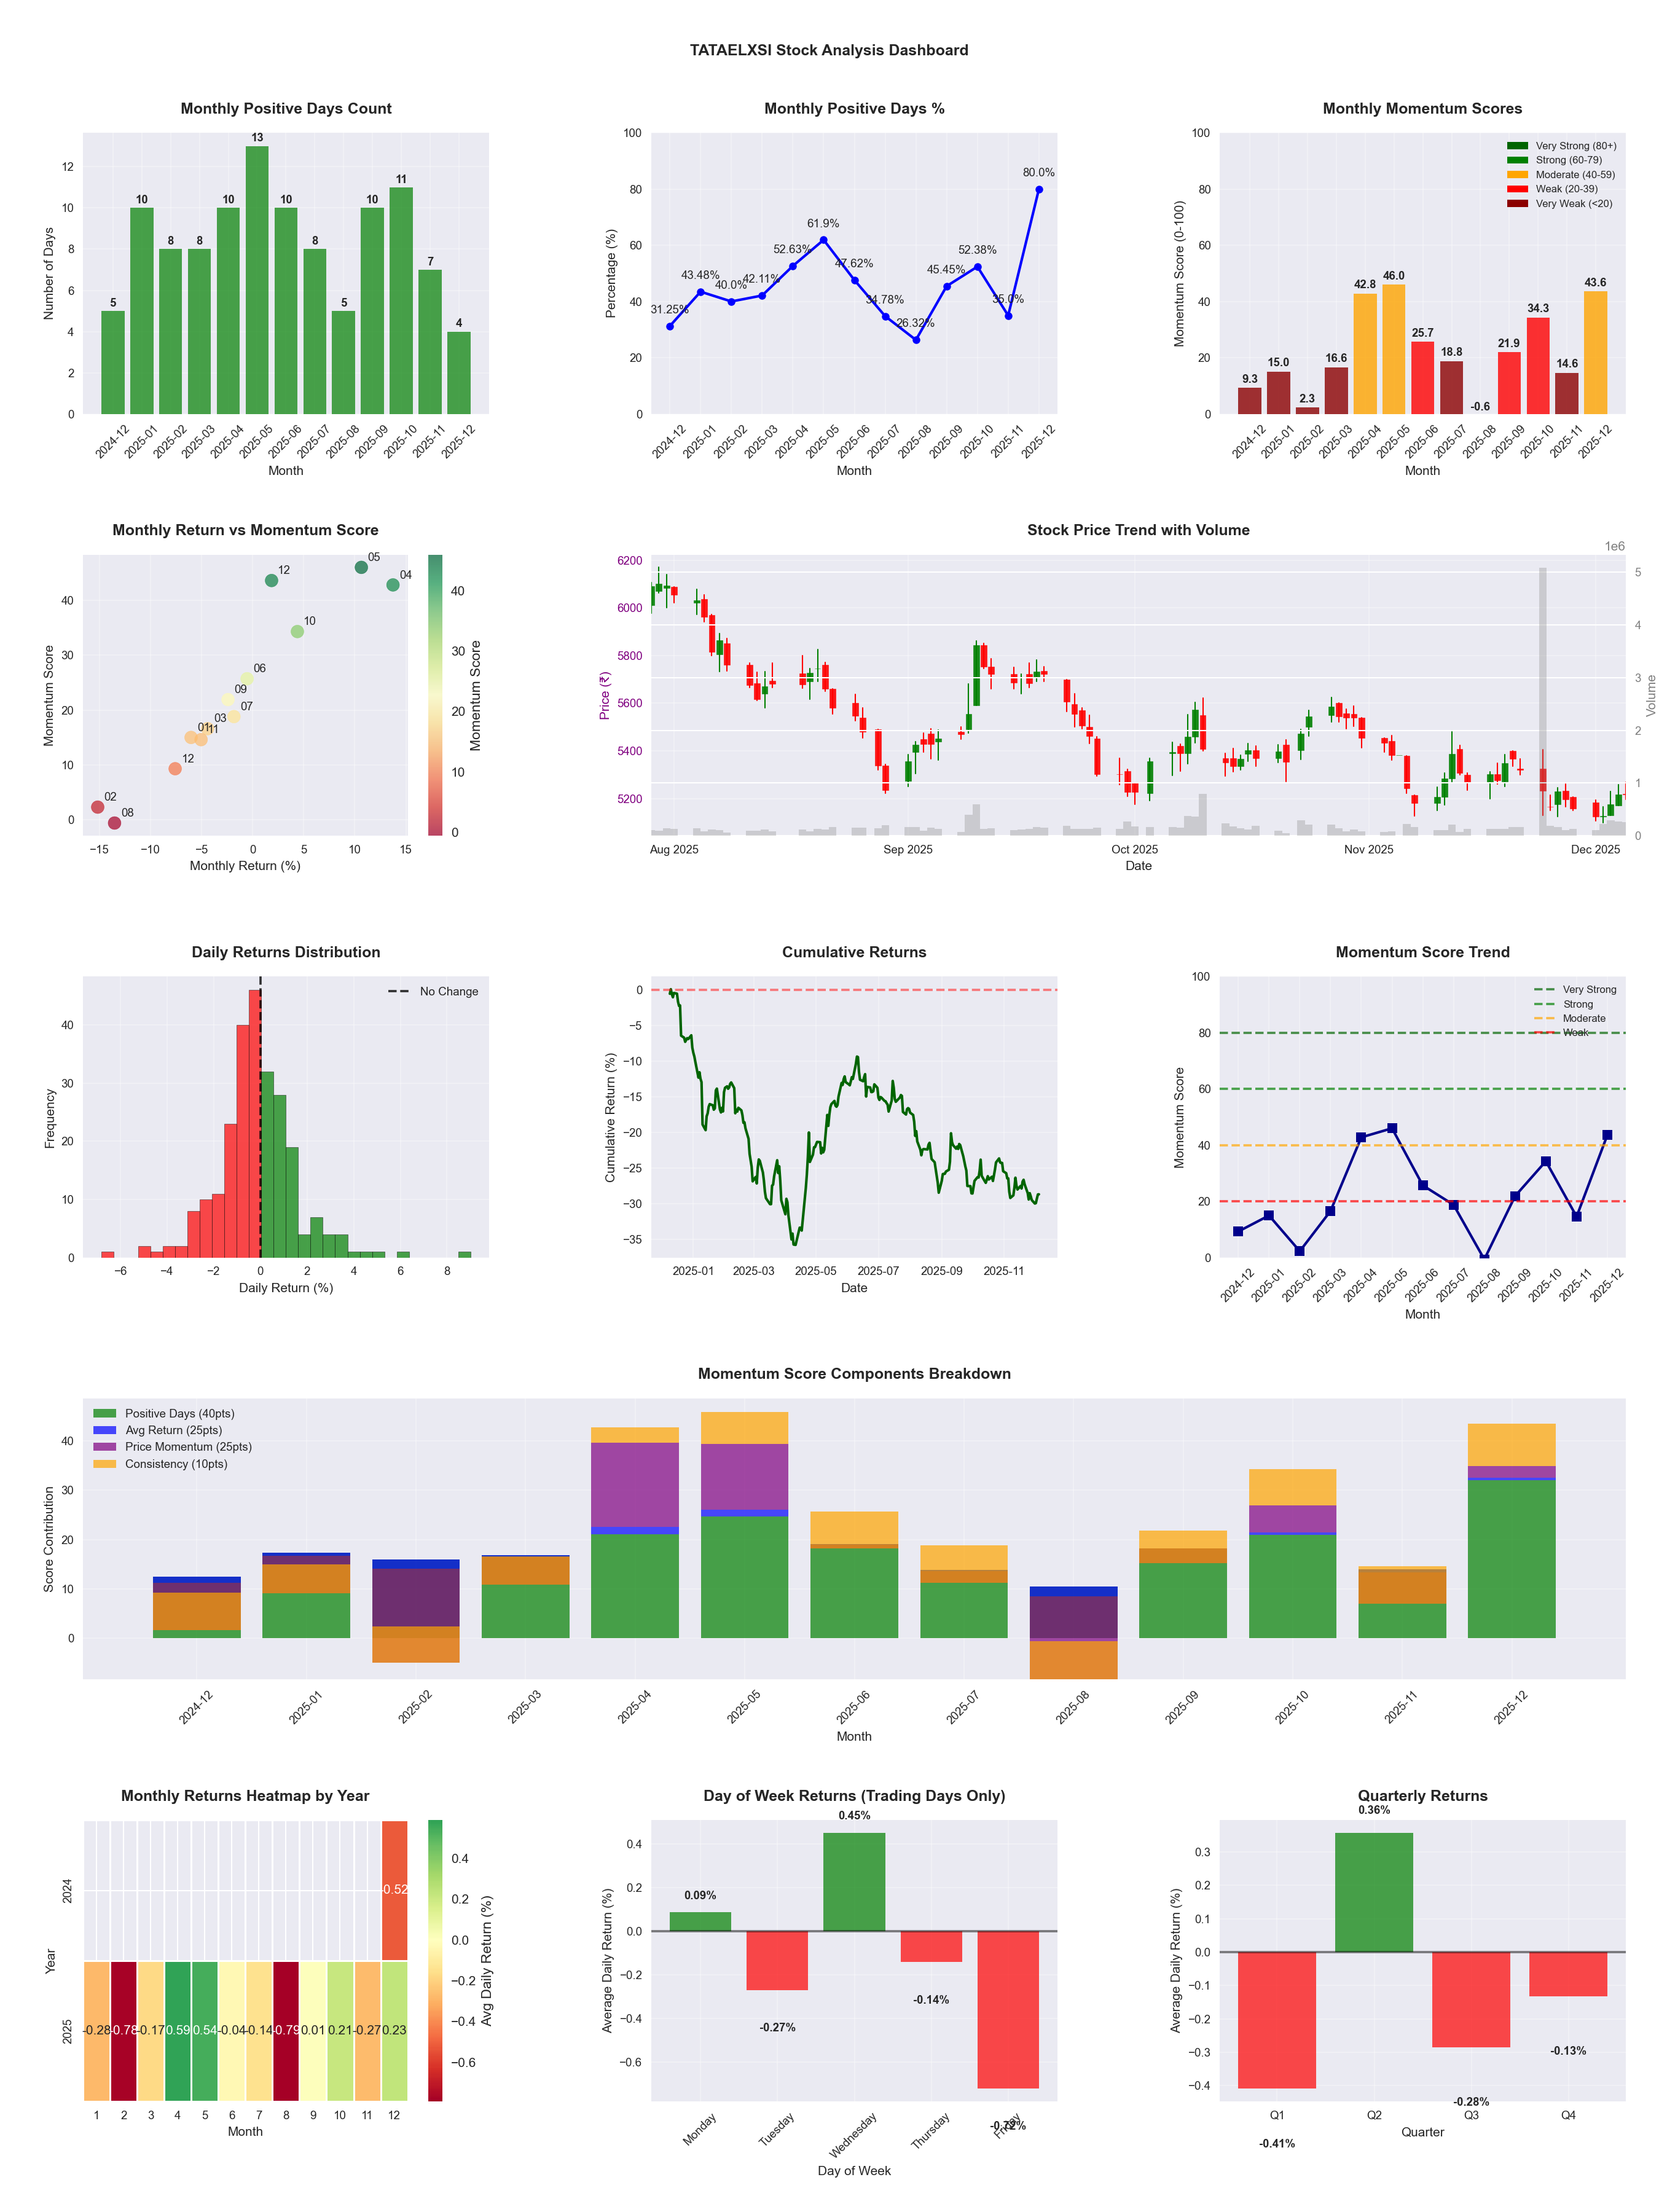
📊 Key Insights & Metrics
Symbol
📈 TATAELXSI
Date
📅 2026-04-11
Volatility
🟡 1.97%
Win Rate
⚠️ 45.5%
Avg Daily Return
📉 -0.00%
Max Drawdown
📉 -40.02%
IBD RS Score
📊 13.8
Weak
Market Rank
#425
Best Month
🏆 2025-04
Best Months to Trade
📅 Apr, May, Oct
Best Days to Trade
📅 Wednesday, Monday
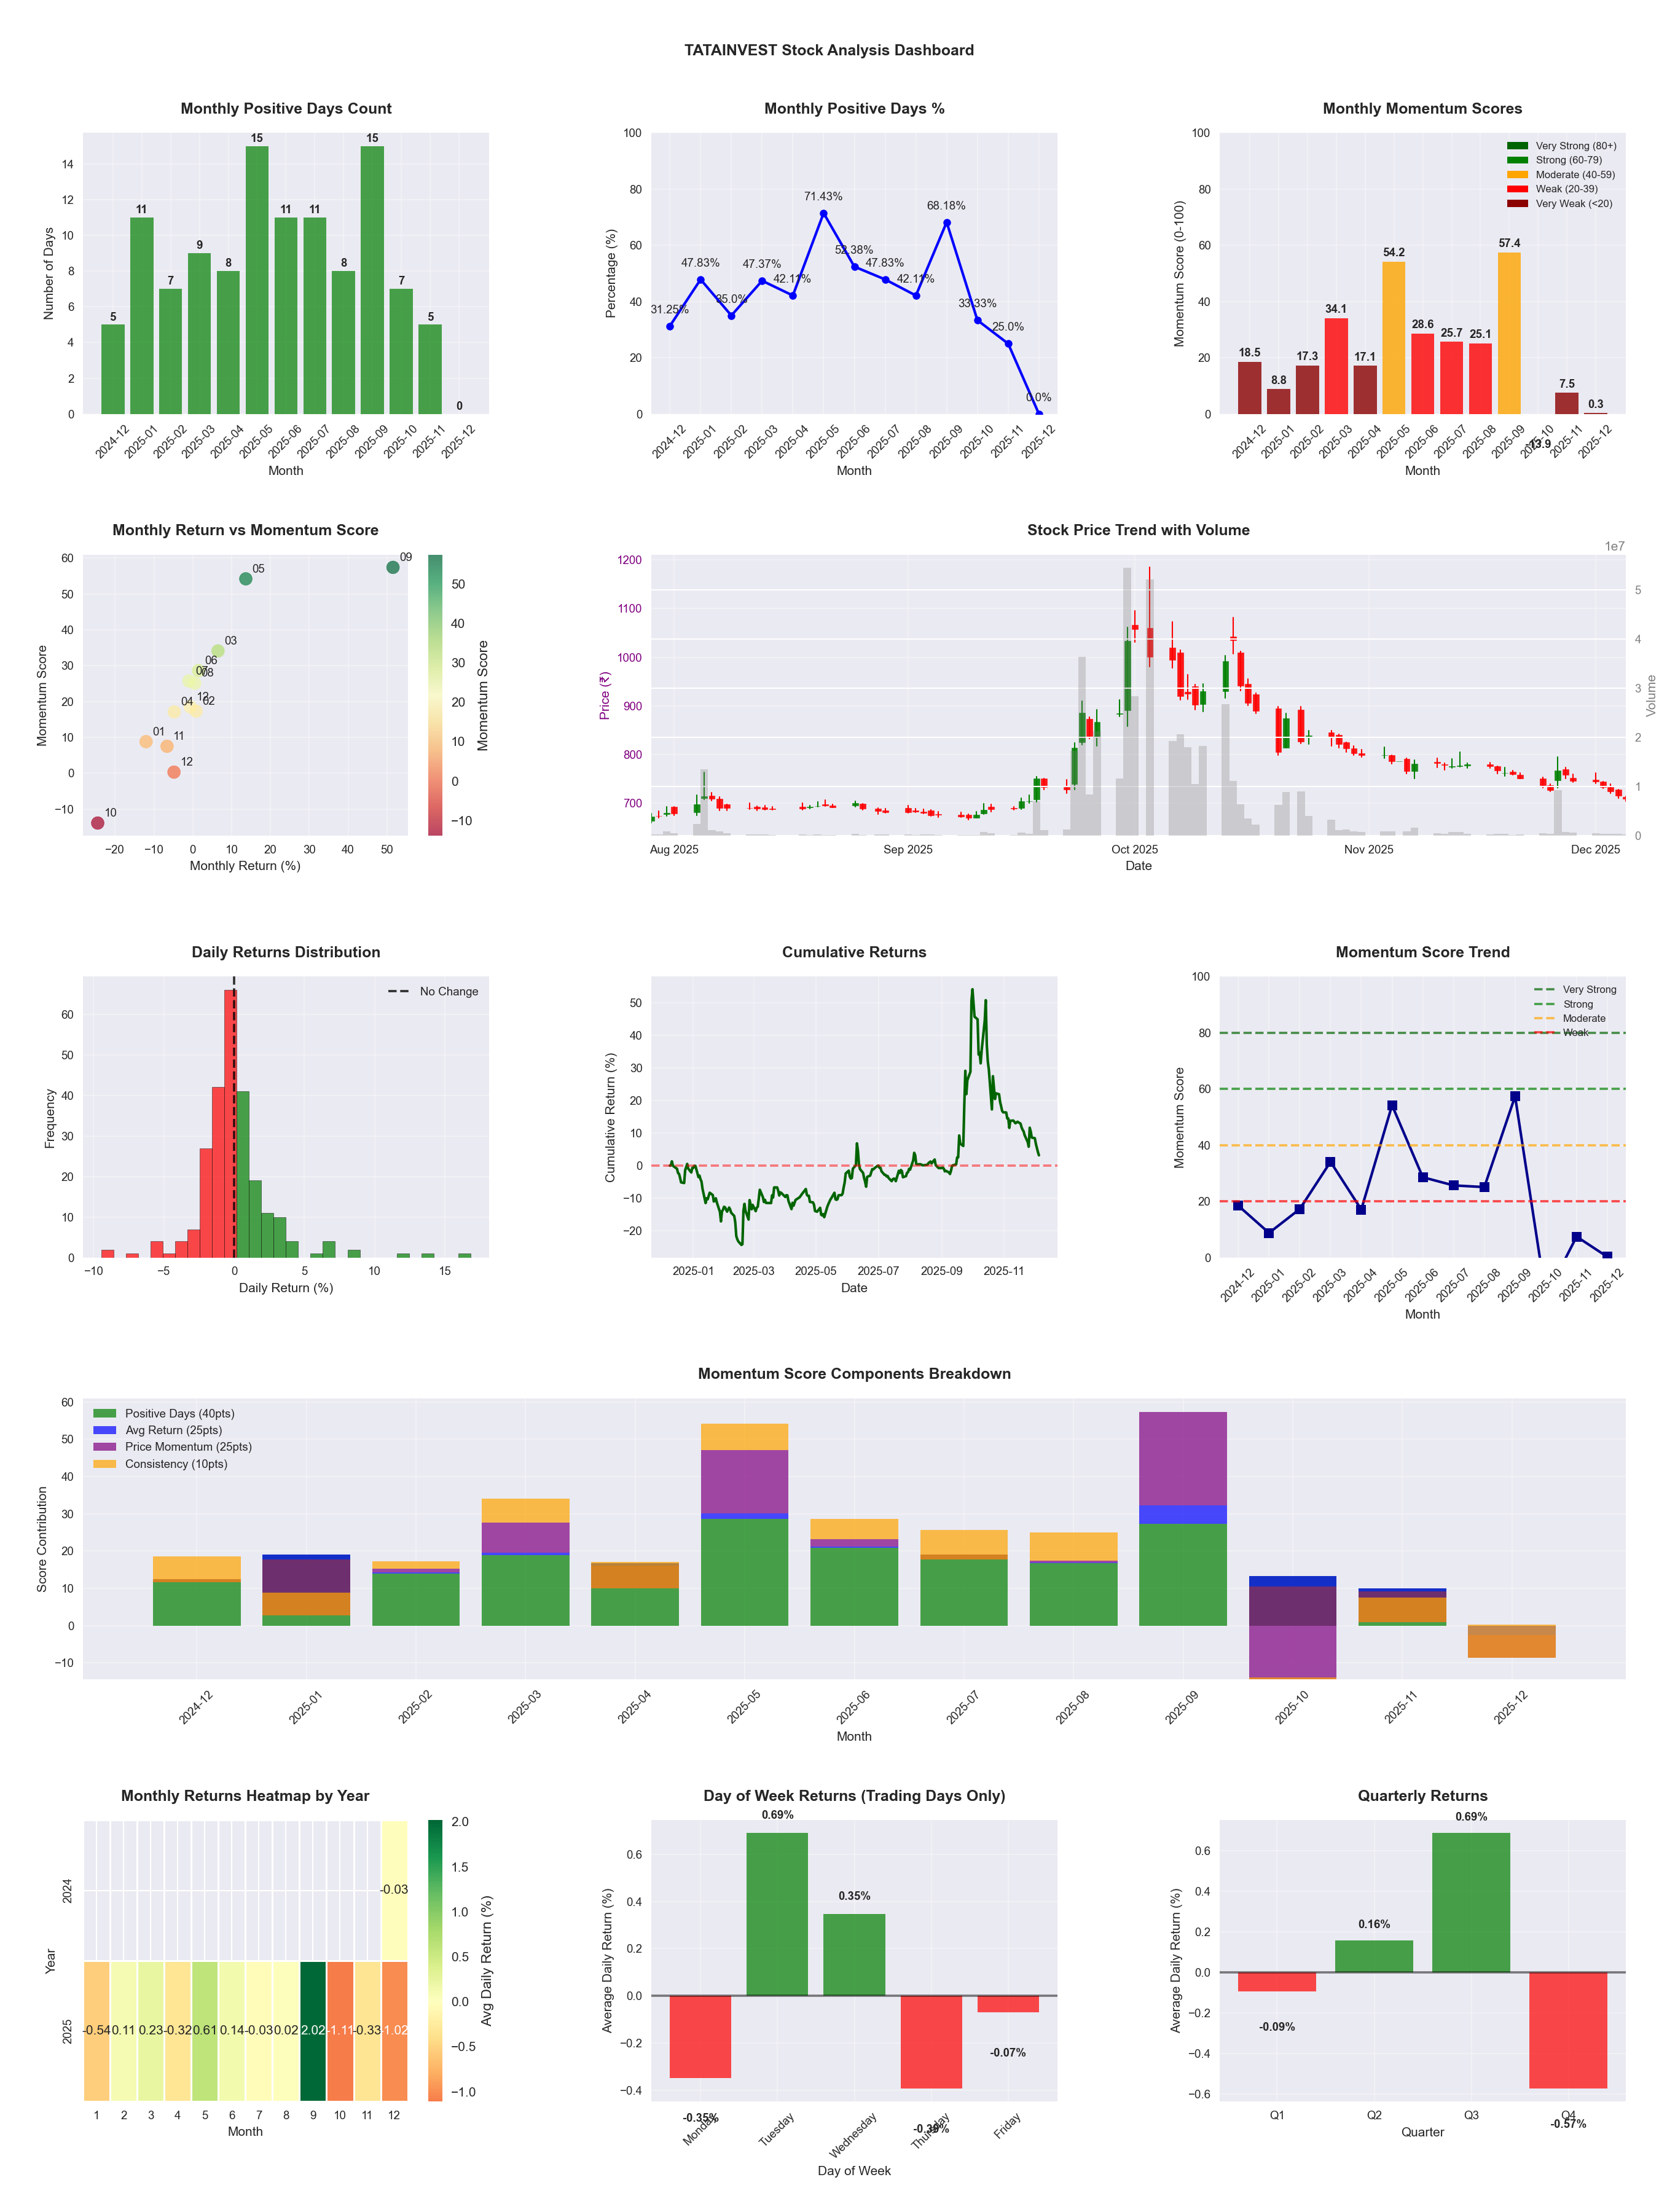
📊 Key Insights & Metrics
Symbol
📈 TATAINVEST
Date
📅 2026-04-11
Volatility
🟡 2.73%
Risk Profile
⚠️ suitable for aggressive investors
Win Rate
⚠️ 46.8%
Avg Daily Return
📈 +0.07%
Max Drawdown
📉 -48.85%
IBD RS Score
📊 50.7
Average
Market Rank
#243
Best Month
🏆 2026-04
Best Months to Trade
📅 Sep, Apr, May
Best Days to Trade
📅 Tuesday, Wednesday
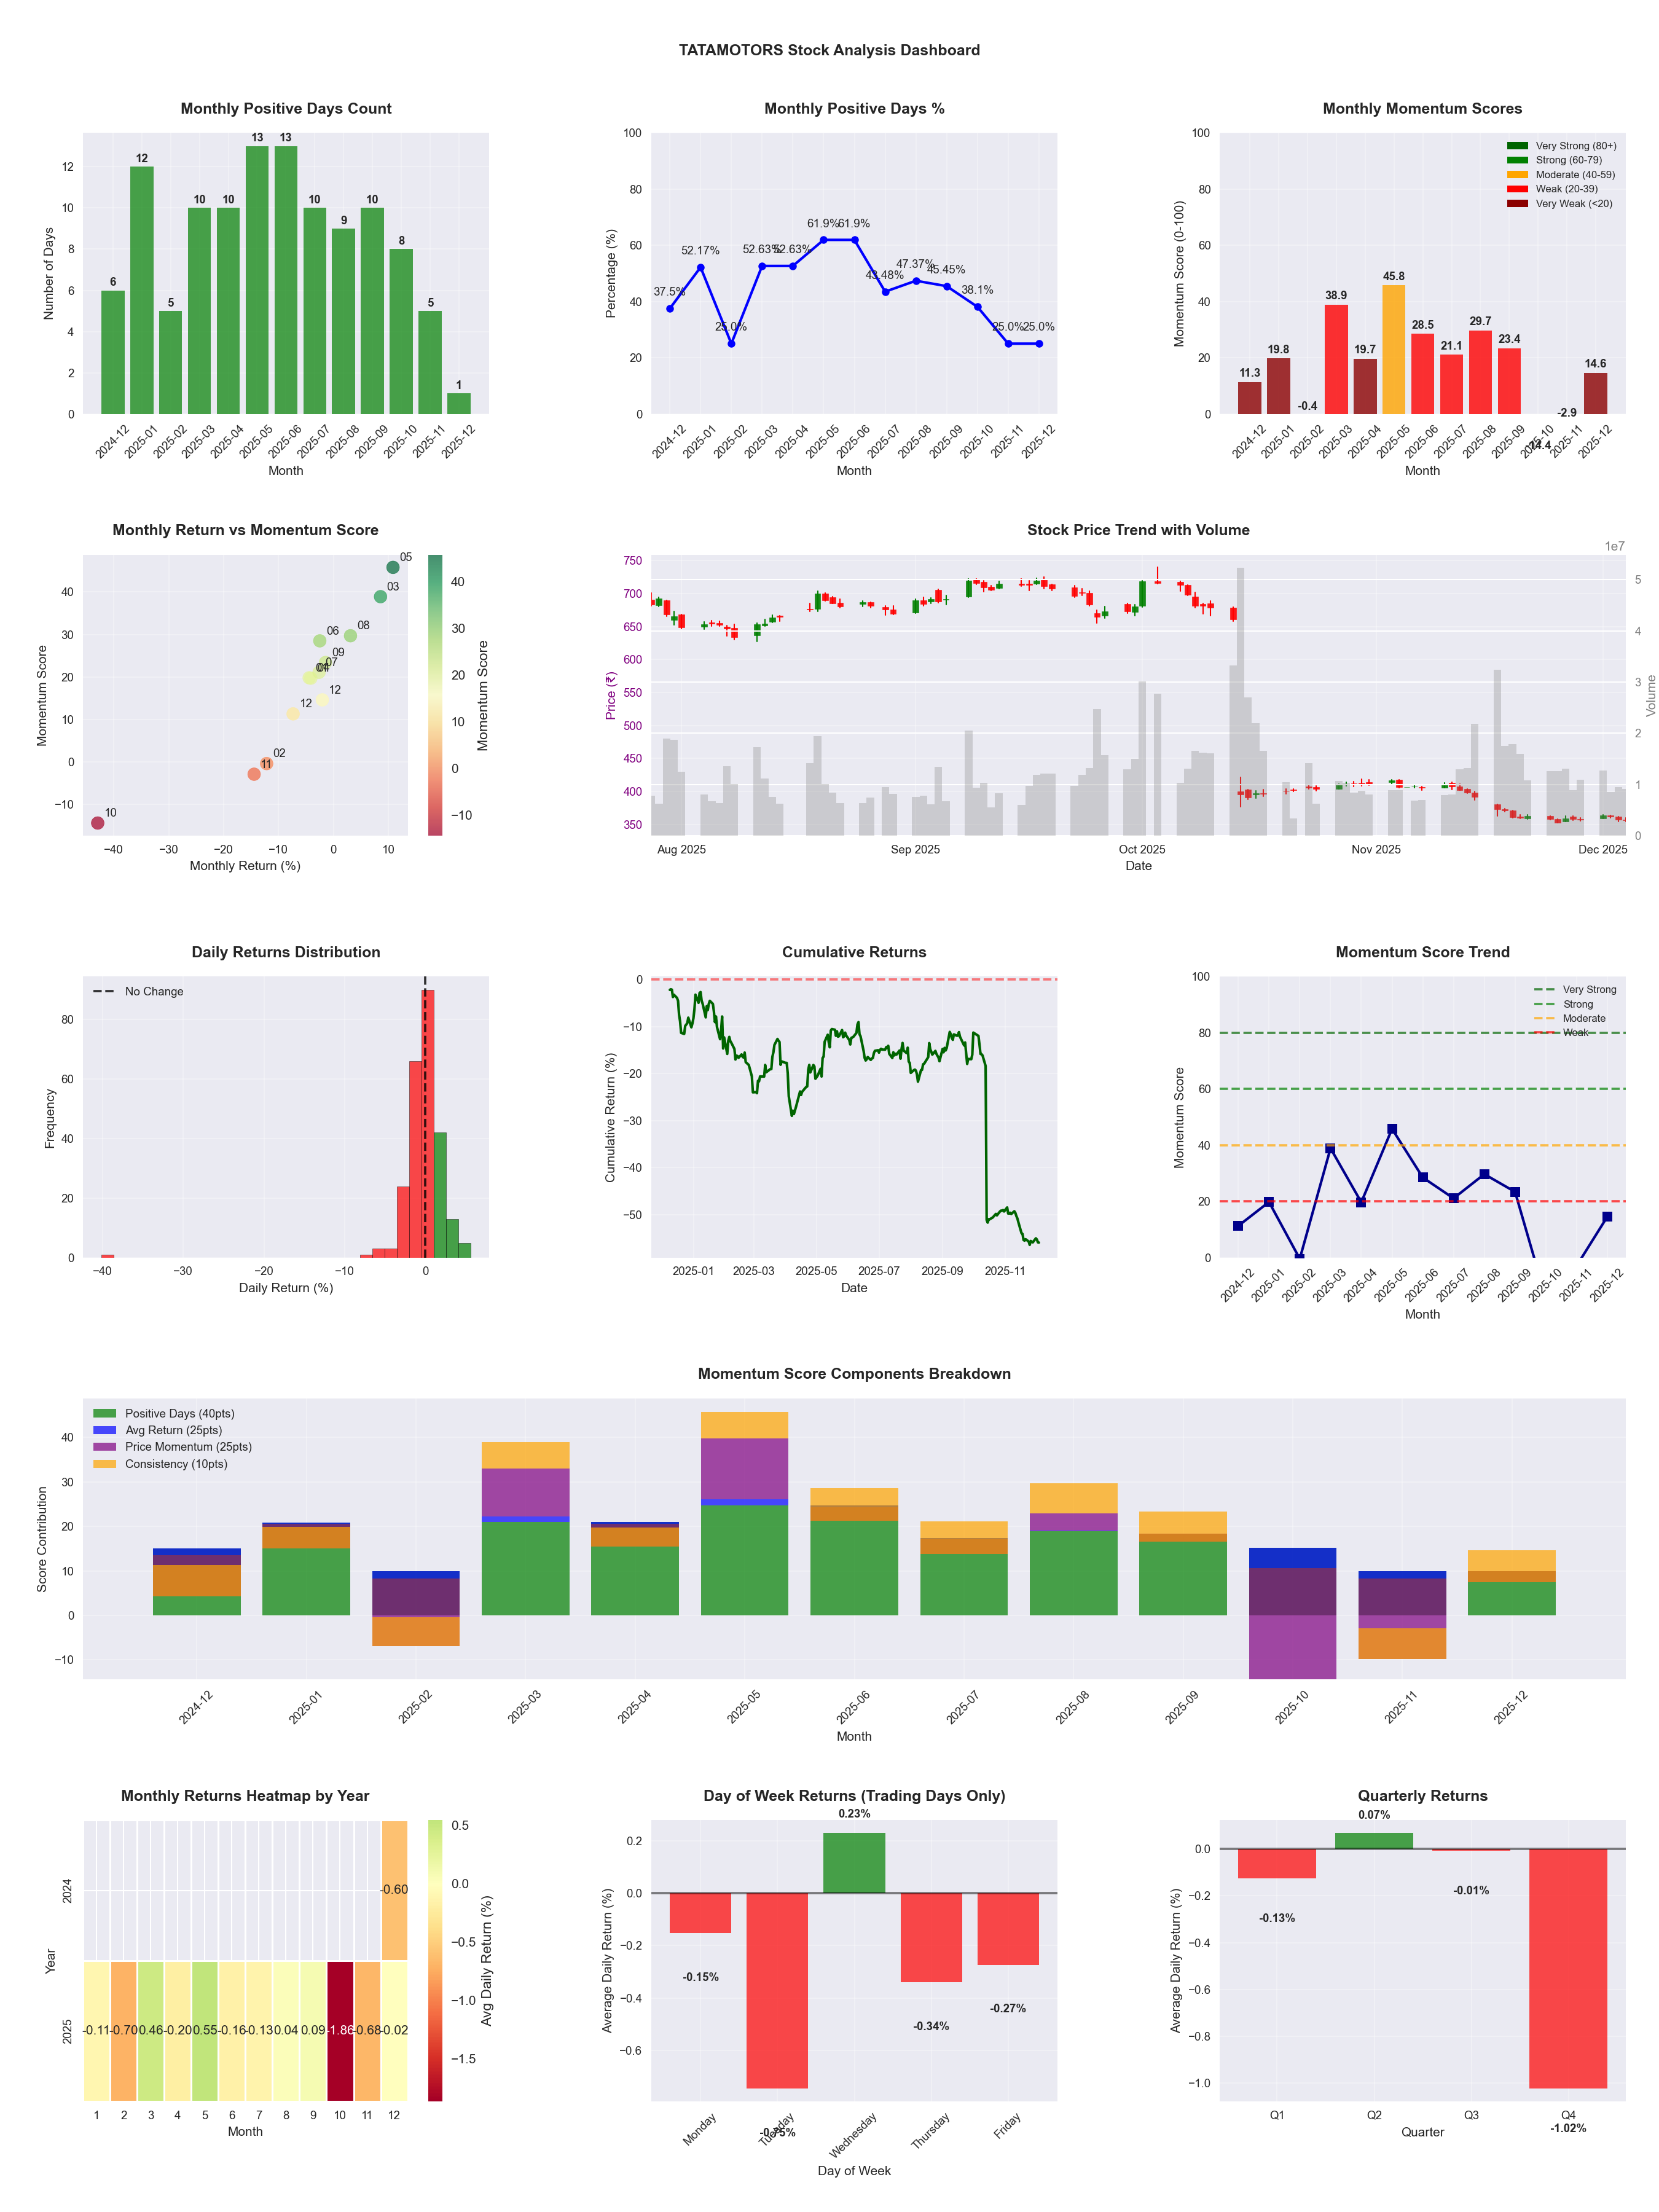
📊 Key Insights & Metrics
Symbol
📈 TATAMOTORS
Date
📅 2026-03-21
Volatility
🔴 3.16%
Risk Profile
⚠️ suitable for aggressive investors
Win Rate
⚠️ 45.2%
Avg Daily Return
📉 -0.27%
Max Drawdown
📉 -55.56%
Best Month
🏆 2025-05
Best Months to Trade
📅 May, Mar, Sep
Best Days to Trade
📅 Wednesday, Monday
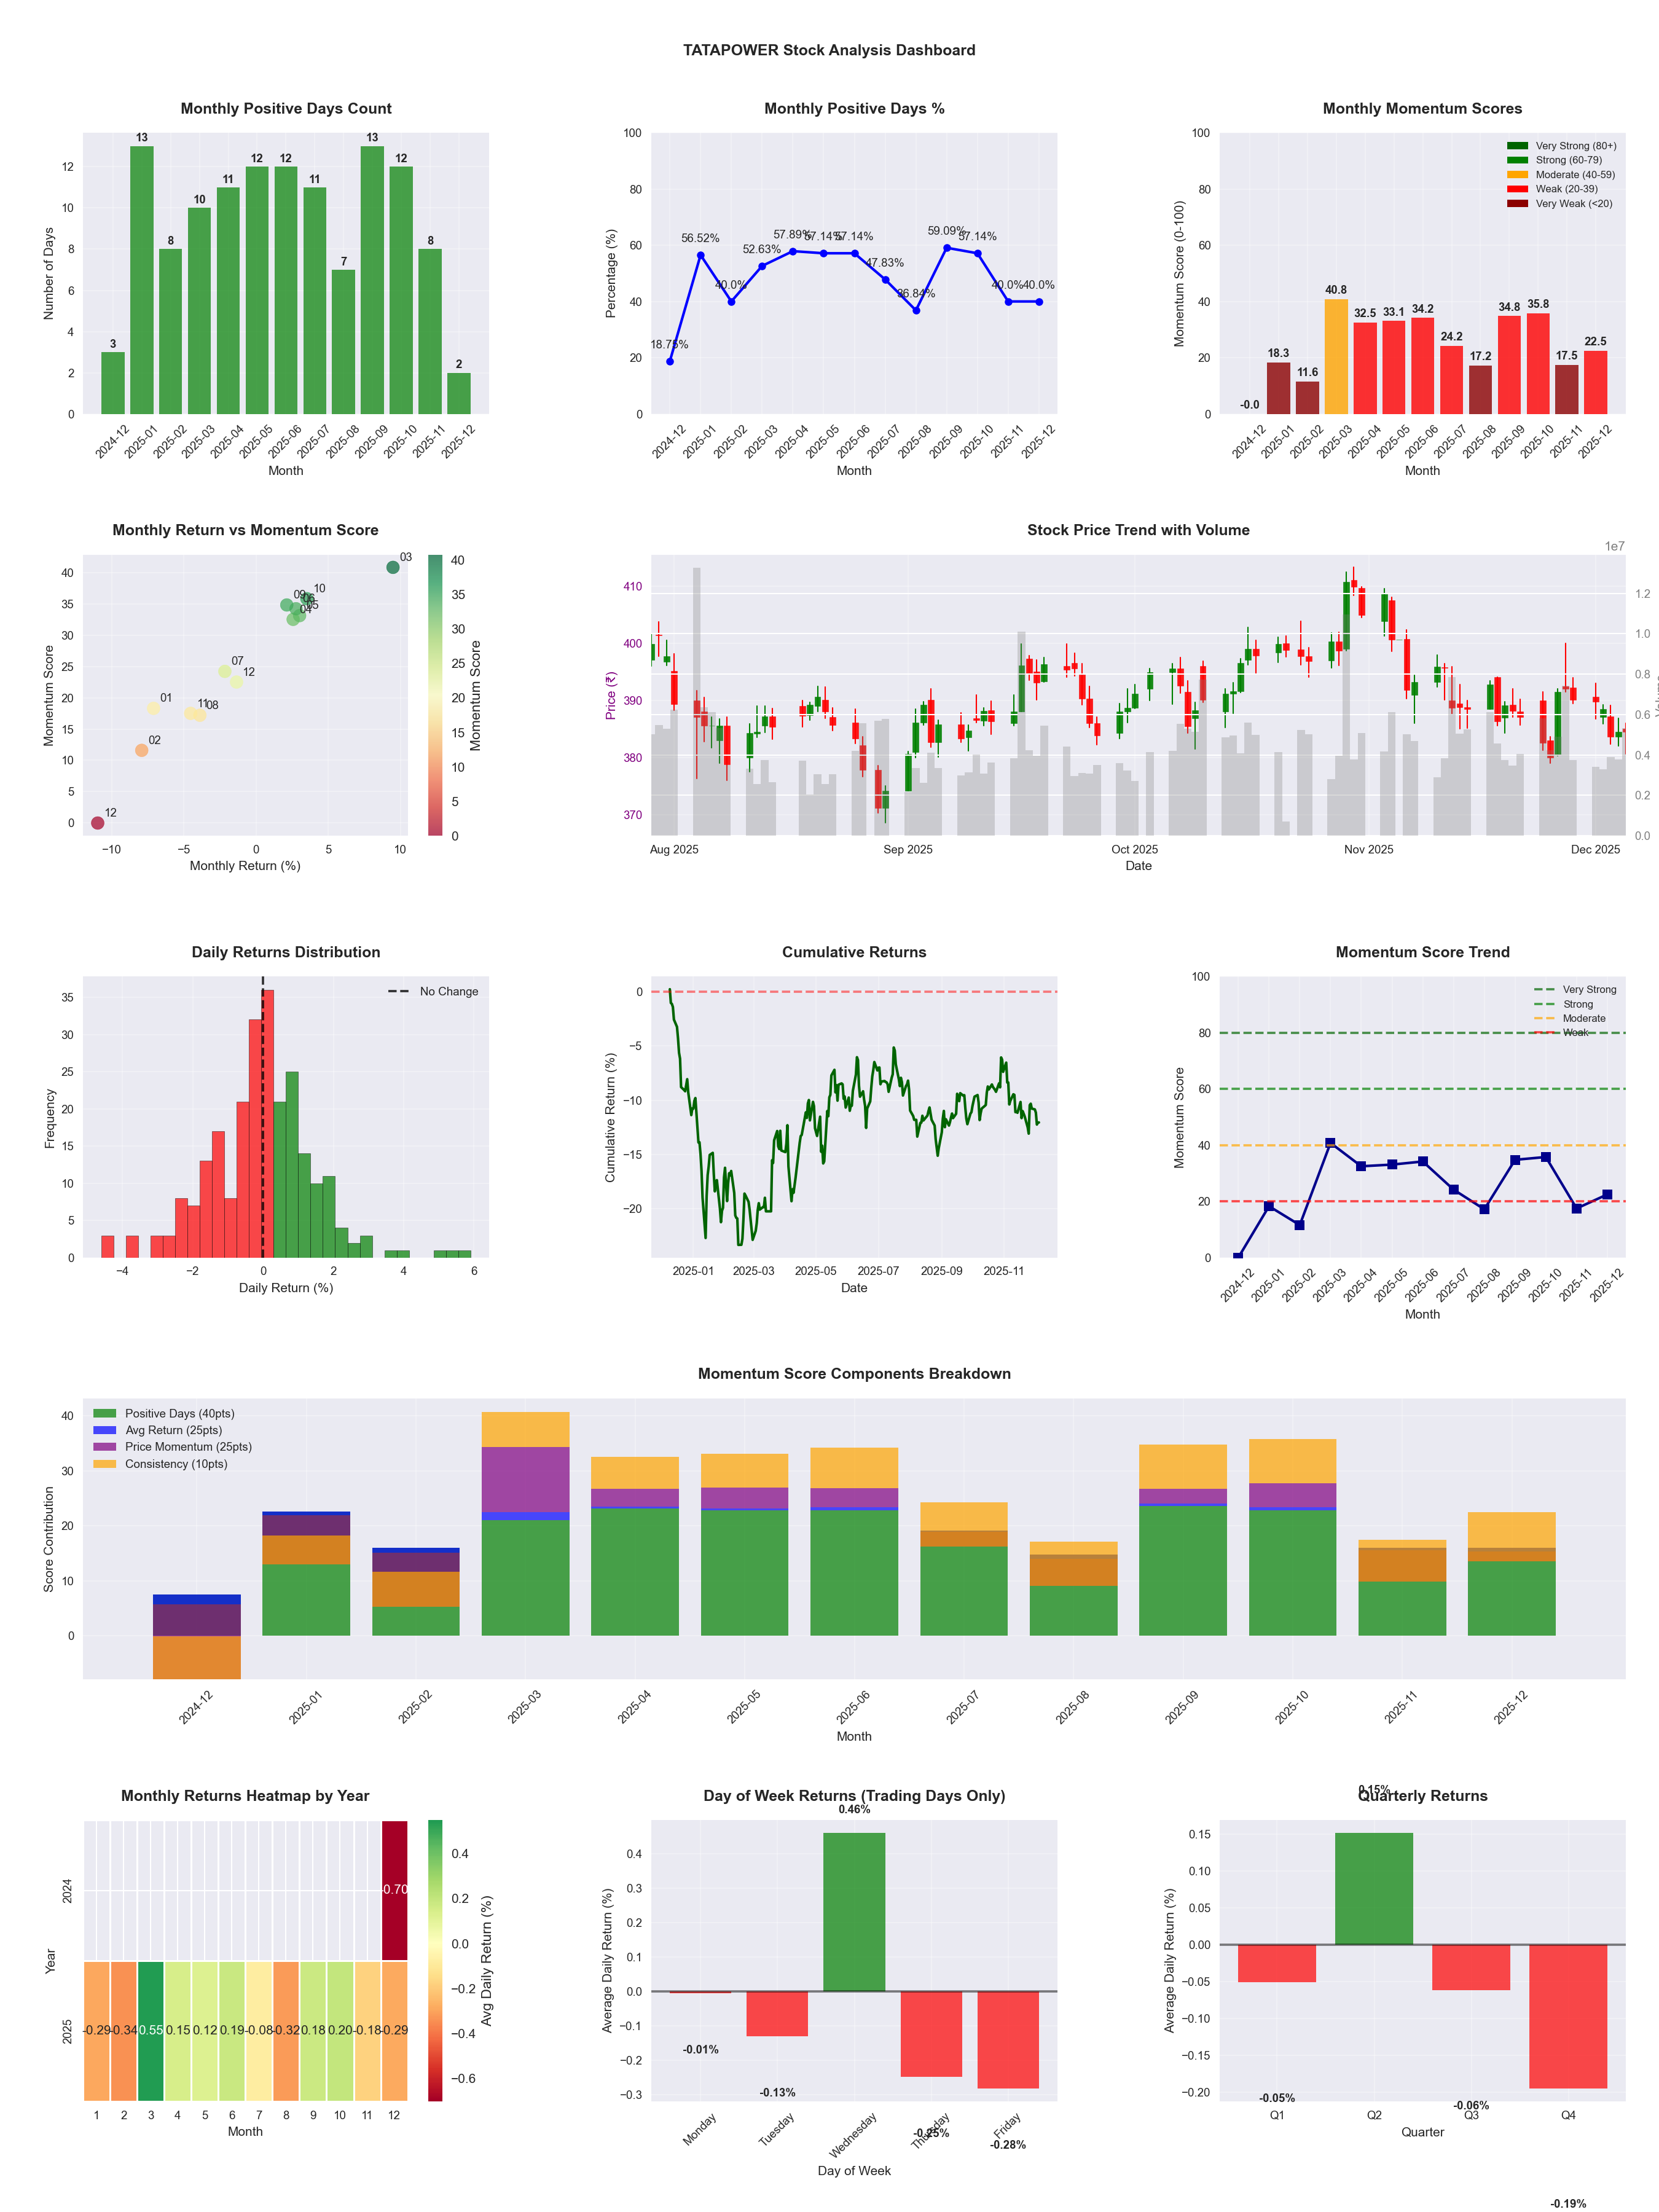
📊 Key Insights & Metrics
Symbol
📈 TATAPOWER
Date
📅 2026-04-11
Volatility
🟢 1.36%
Win Rate
⚠️ 50.4%
Avg Daily Return
📈 +0.05%
Max Drawdown
📉 -16.75%
IBD RS Score
📊 71.6
Strong
Market Rank
#140
Best Month
🏆 2026-04
Worst Month
📉 2026-01
Best Months to Trade
📅 Apr, Oct, Jun
Best Days to Trade
📅 Wednesday, Monday
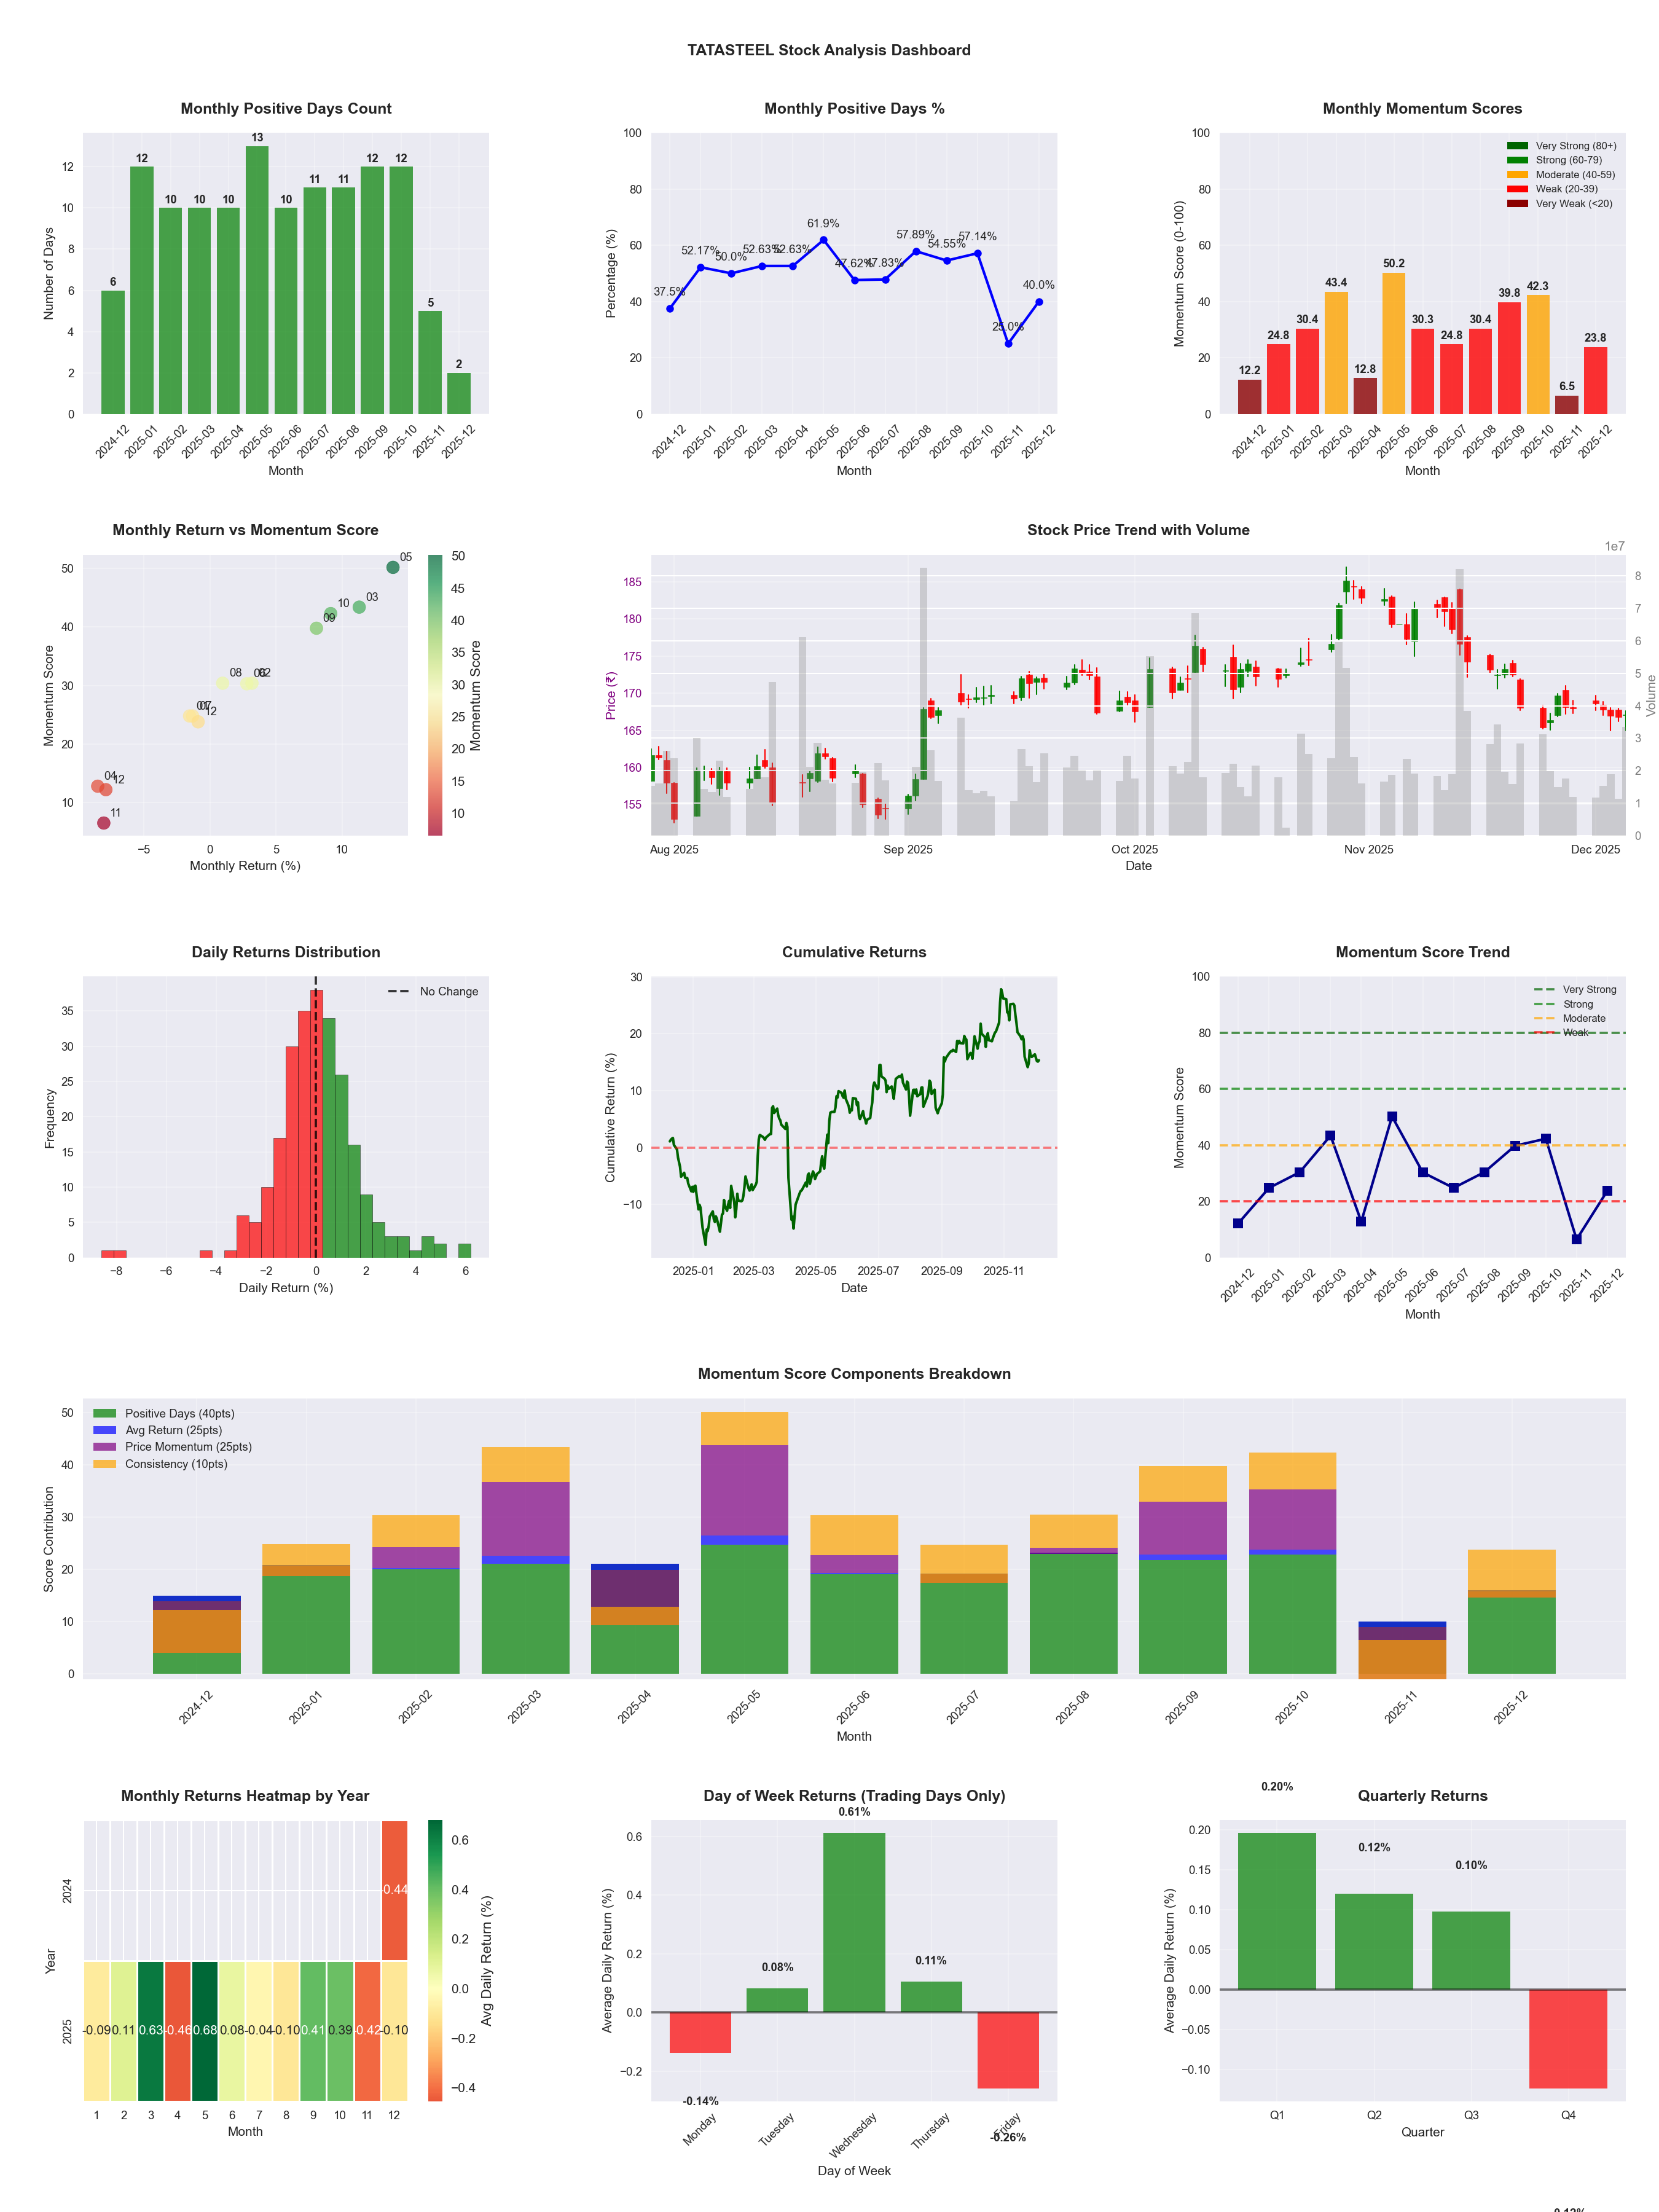
📊 Key Insights & Metrics
Symbol
📈 TATASTEEL
Date
📅 2026-04-11
Volatility
🟡 1.74%
Win Rate
⚠️ 53.2%
Avg Daily Return
📈 +0.20%
Max Drawdown
📉 -14.85%
IBD RS Score
📊 93.3
Leader
Market Rank
#33
Best Month
🏆 2026-04
Worst Month
📉 2026-03
Best Months to Trade
📅 Apr, May, Feb
Best Days to Trade
📅 Wednesday, Tuesday
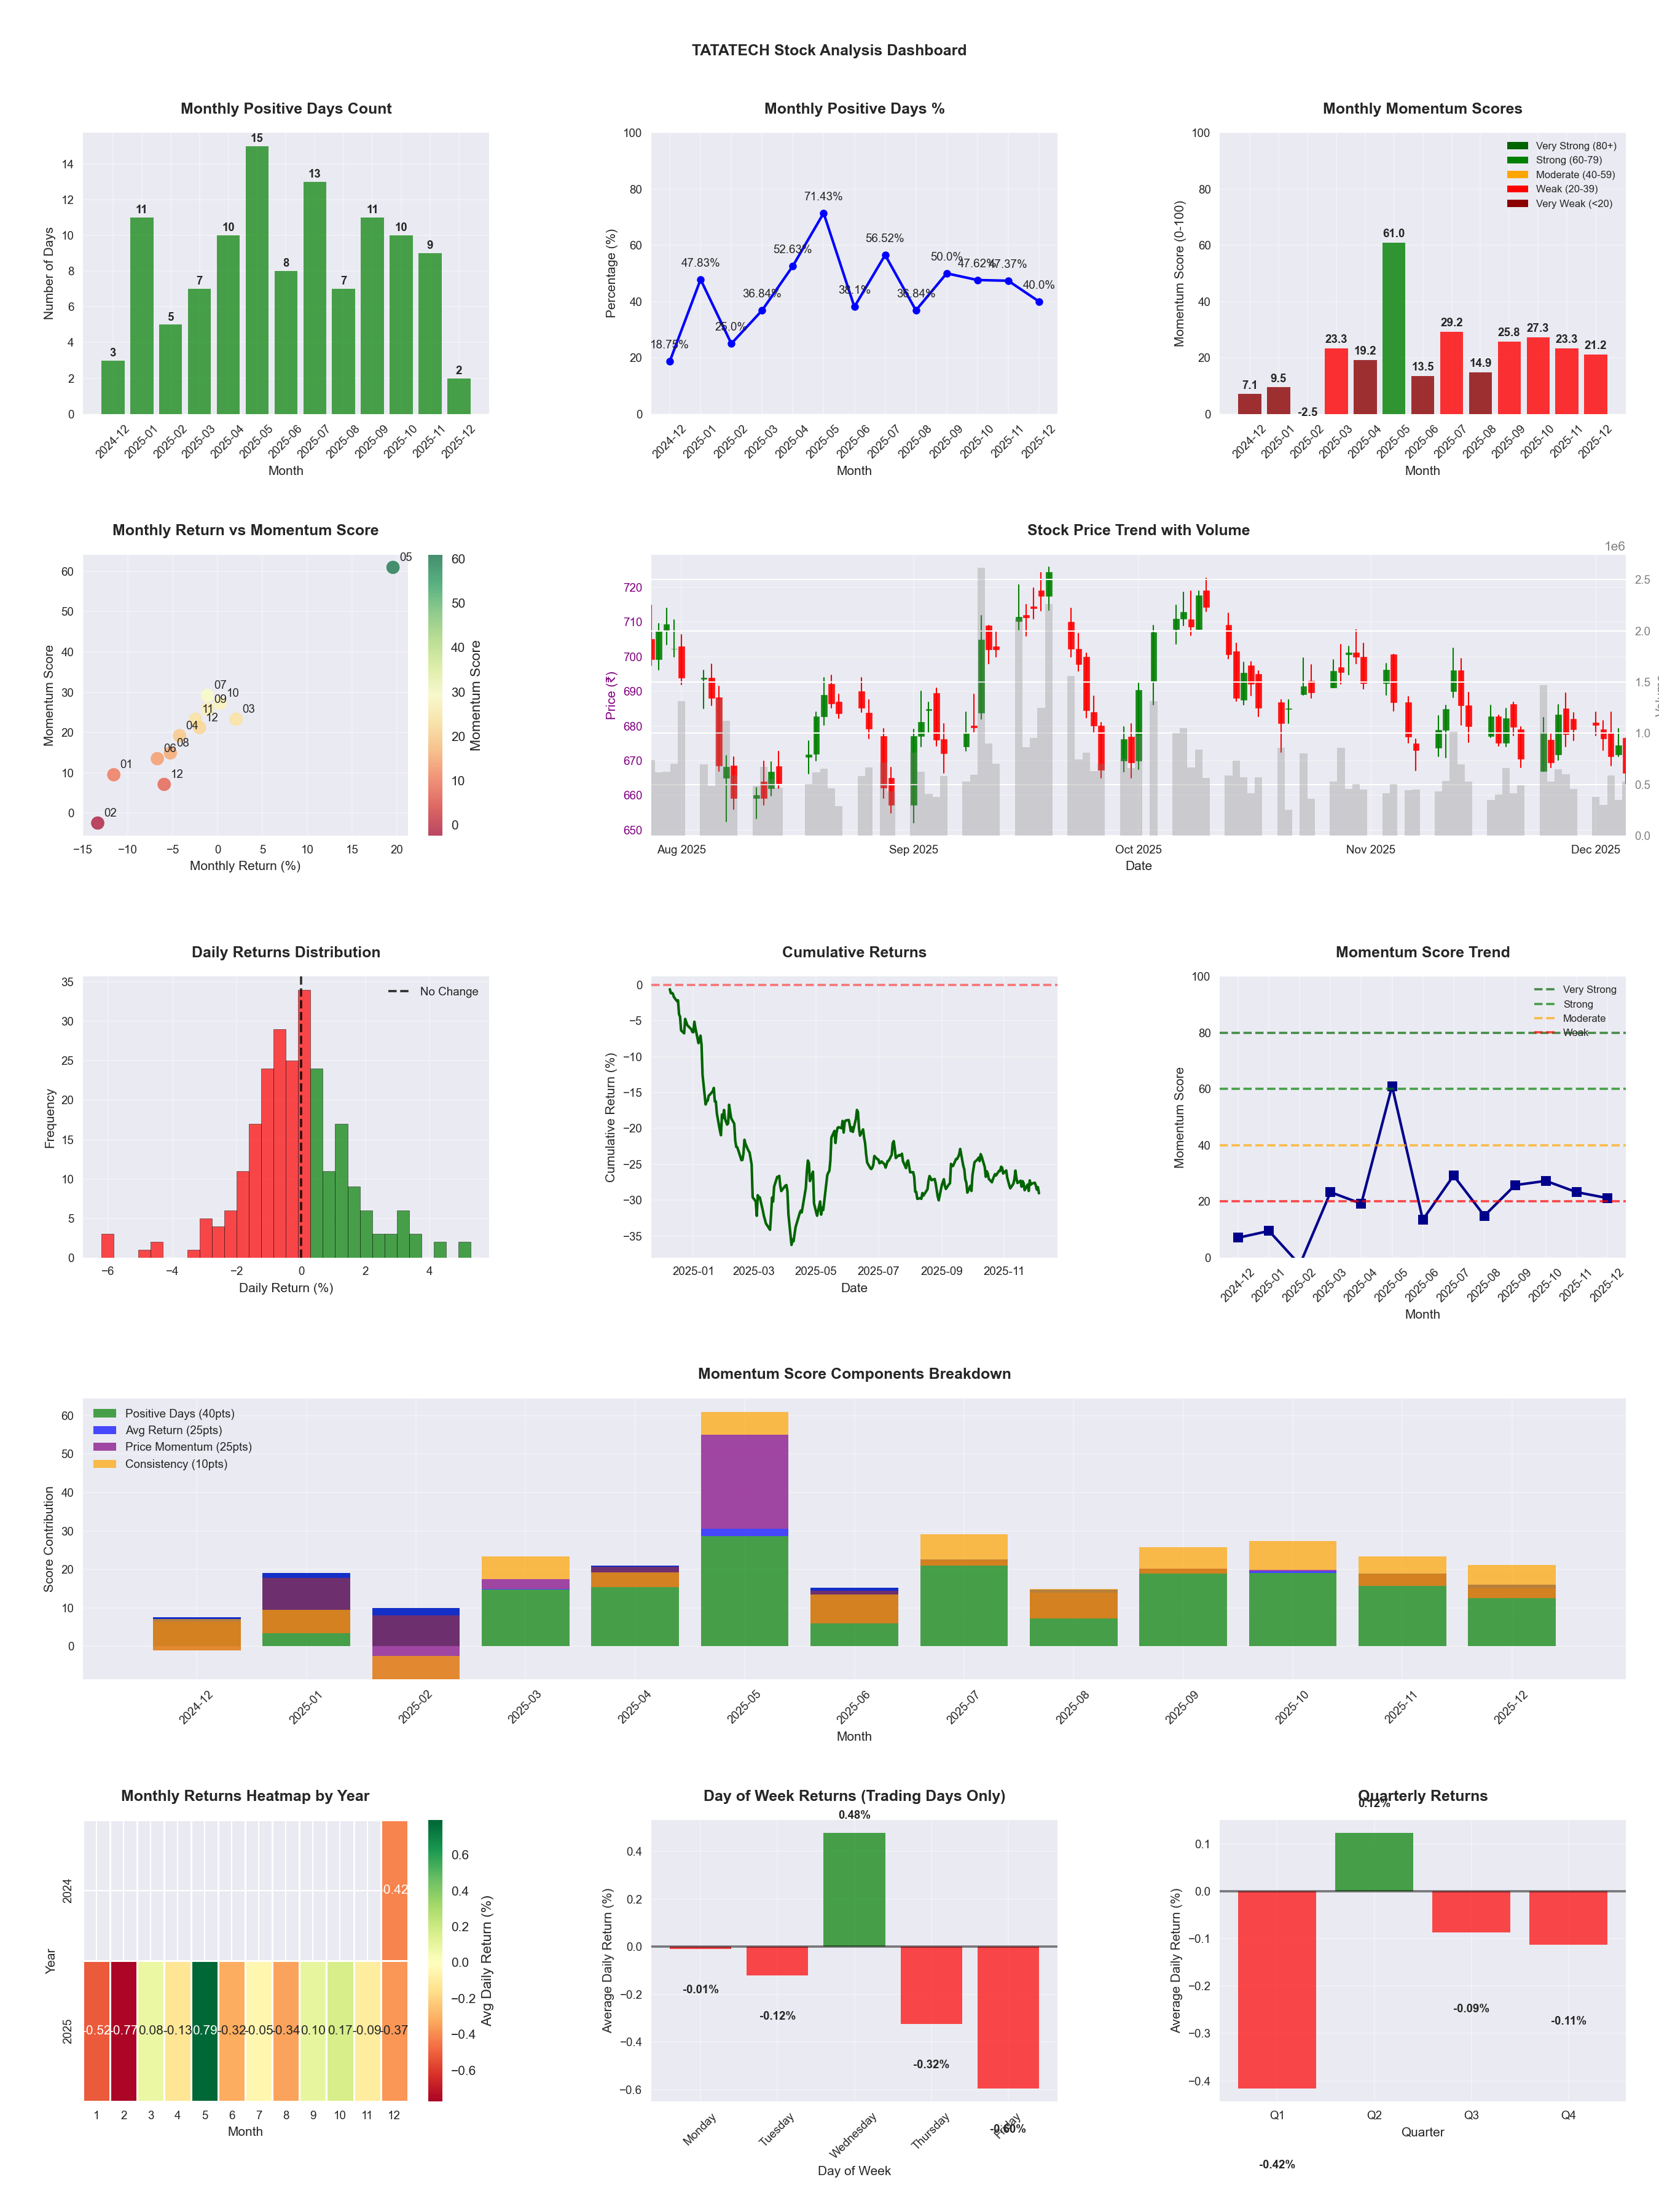
📊 Key Insights & Metrics
Symbol
📈 TATATECH
Date
📅 2026-04-11
Volatility
🟡 1.69%
Win Rate
⚠️ 48.6%
Avg Daily Return
📉 -0.02%
Max Drawdown
📉 -34.33%
IBD RS Score
📊 21.1
Weak
Market Rank
#389
Best Month
🏆 2025-05
Worst Month
📉 2026-03
Best Months to Trade
📅 Apr, May, Oct
Best Days to Trade
📅 Wednesday, Monday
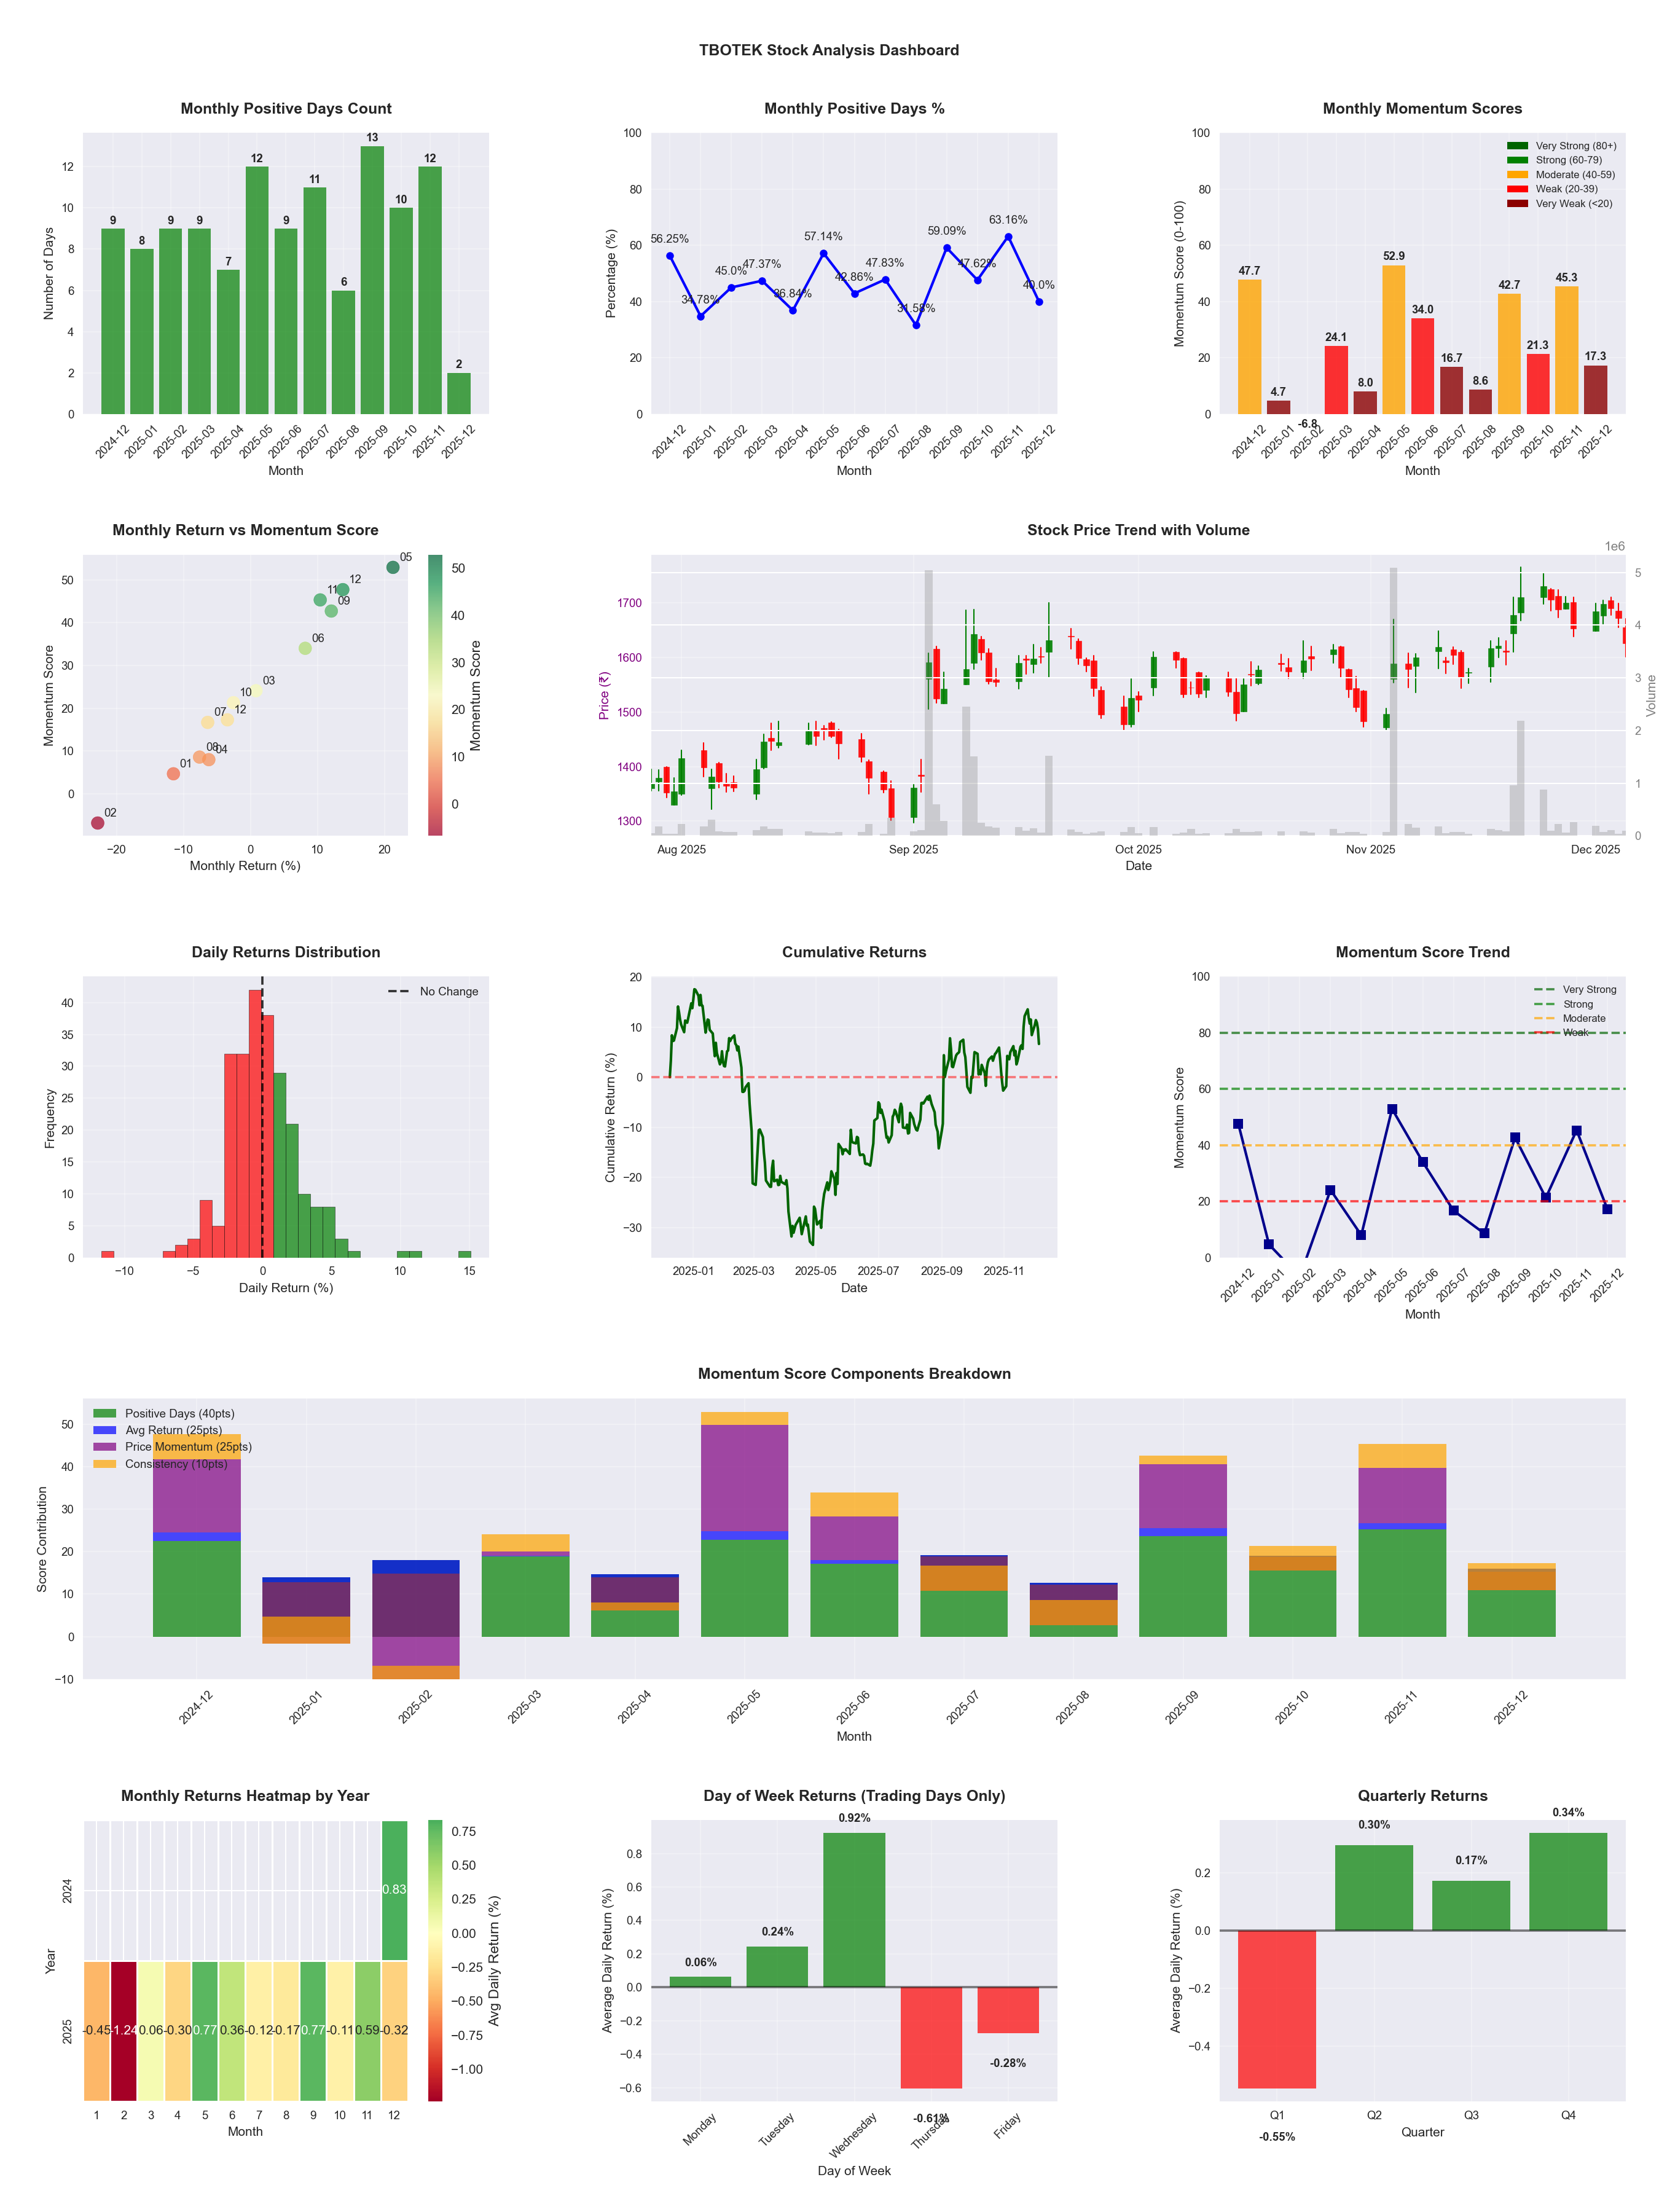
📊 Key Insights & Metrics
Symbol
📈 TBOTEK
Date
📅 2026-04-11
Volatility
🟡 2.67%
Risk Profile
⚠️ suitable for aggressive investors
Win Rate
⚠️ 47.6%
Avg Daily Return
📈 +0.07%
Max Drawdown
📉 -41.18%
IBD RS Score
📊 27.2
Weak
Market Rank
#359
Best Month
🏆 2025-05
Worst Month
📉 2026-02
Best Months to Trade
📅 Apr, Sep, May
Best Days to Trade
📅 Tuesday, Wednesday
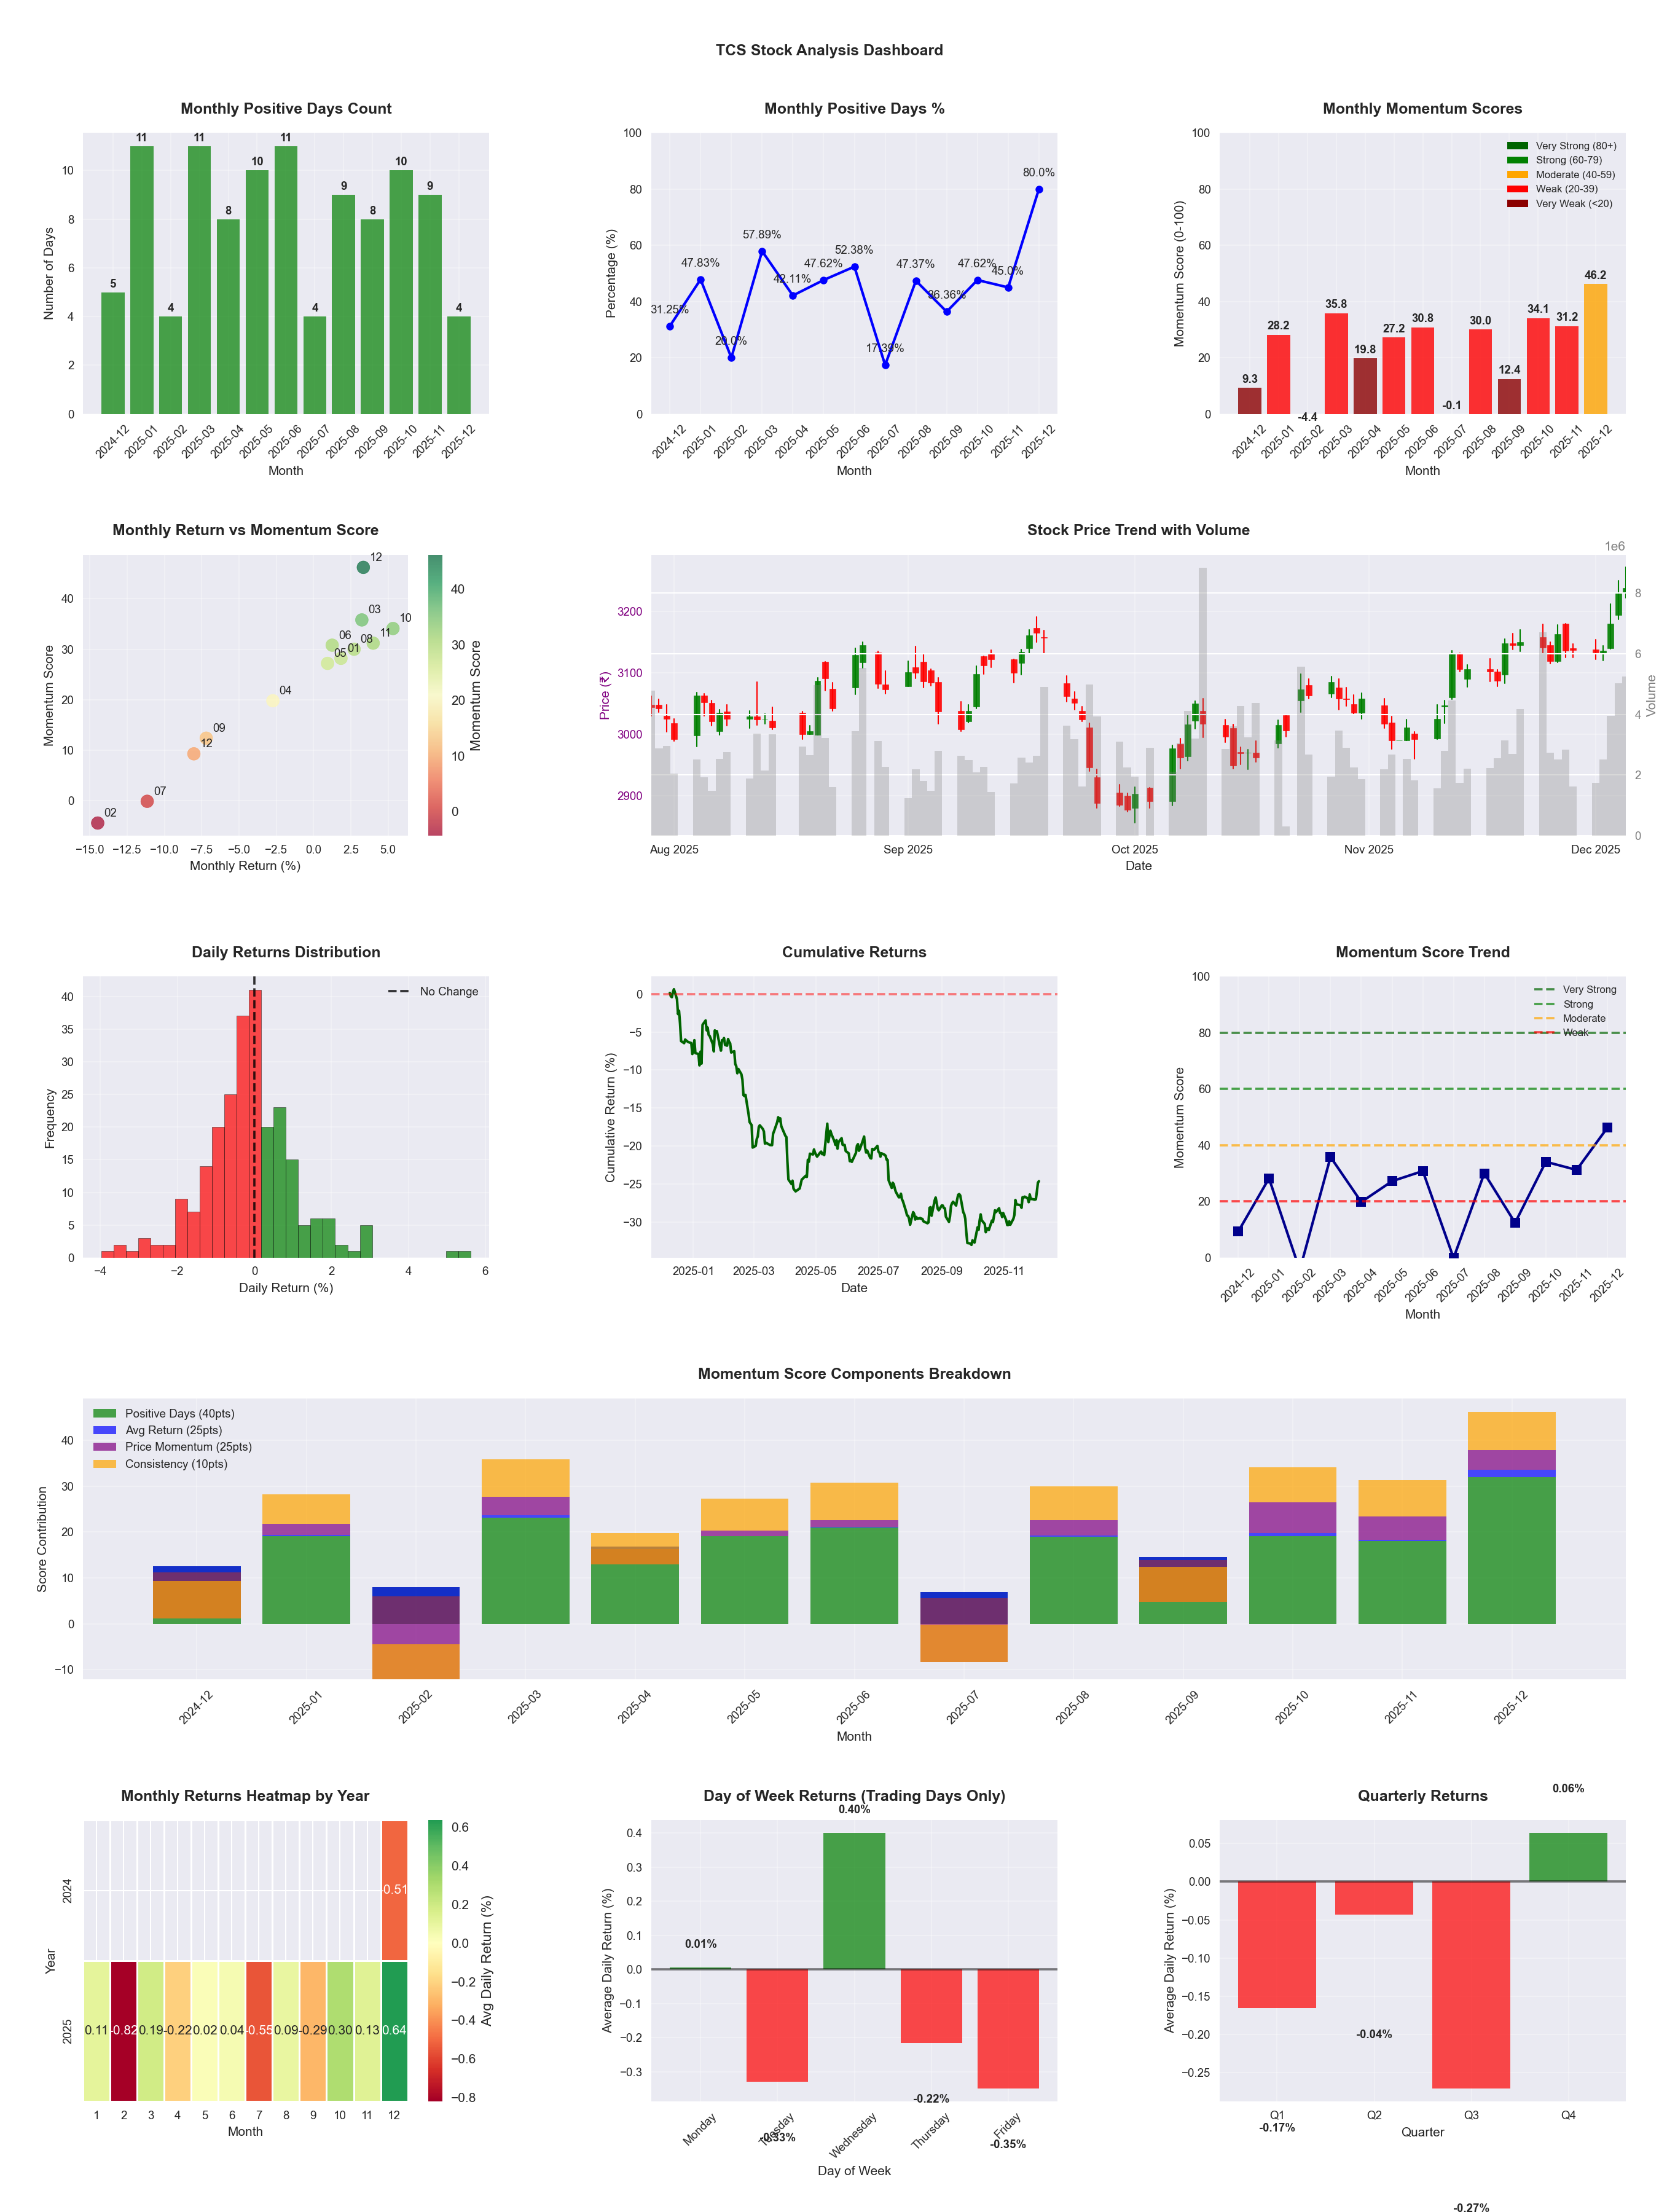
📊 Key Insights & Metrics
Symbol
📈 TCS
Date
📅 2026-04-11
Volatility
🟢 1.35%
Win Rate
⚠️ 45.1%
Avg Daily Return
📉 -0.08%
Max Drawdown
📉 -32.68%
IBD RS Score
📊 15.4
Weak
Market Rank
#417
Best Month
🏆 2026-04
Best Months to Trade
📅 Apr, Oct, Nov
Best Days to Trade
📅 Wednesday, Monday
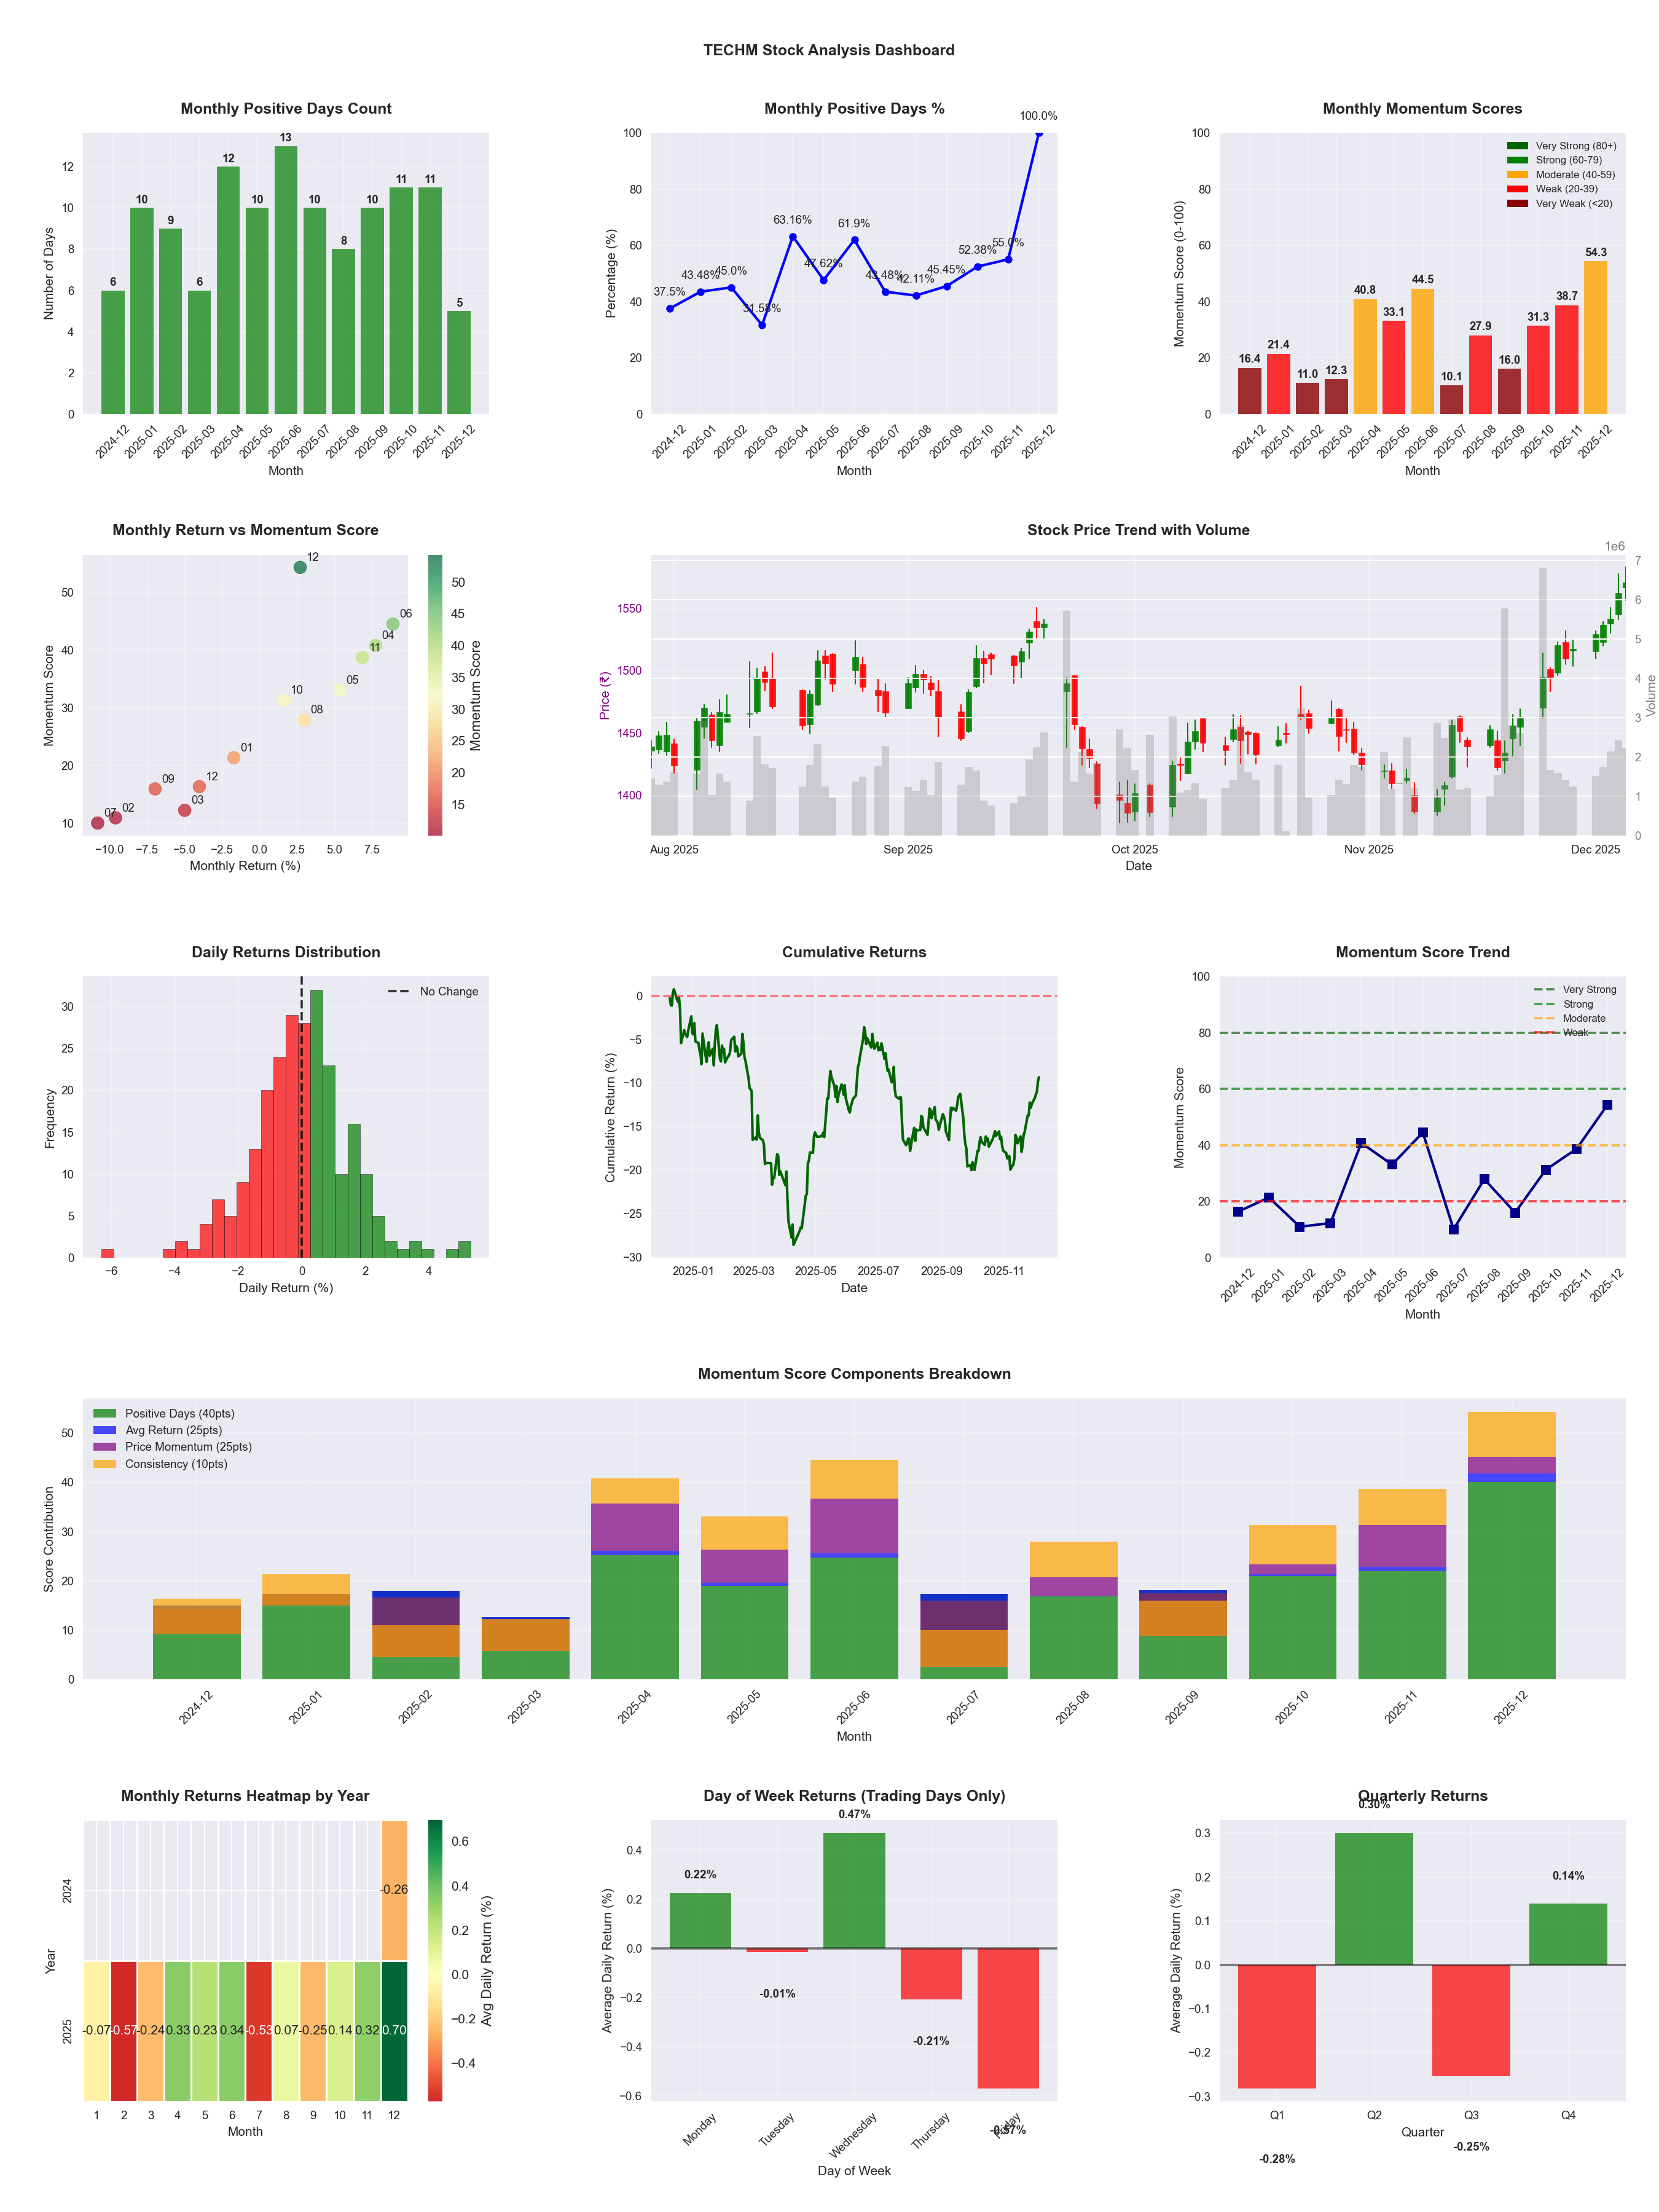
📊 Key Insights & Metrics
Symbol
📈 TECHM
Date
📅 2026-04-11
Volatility
🟡 1.55%
Win Rate
⚠️ 52.9%
Avg Daily Return
📈 +0.07%
Max Drawdown
📉 -24.69%
IBD RS Score
📊 58.6
Average
Market Rank
#204
Best Month
🏆 2025-04
Best Months to Trade
📅 Apr, Jan, Nov
Best Days to Trade
📅 Wednesday, Monday
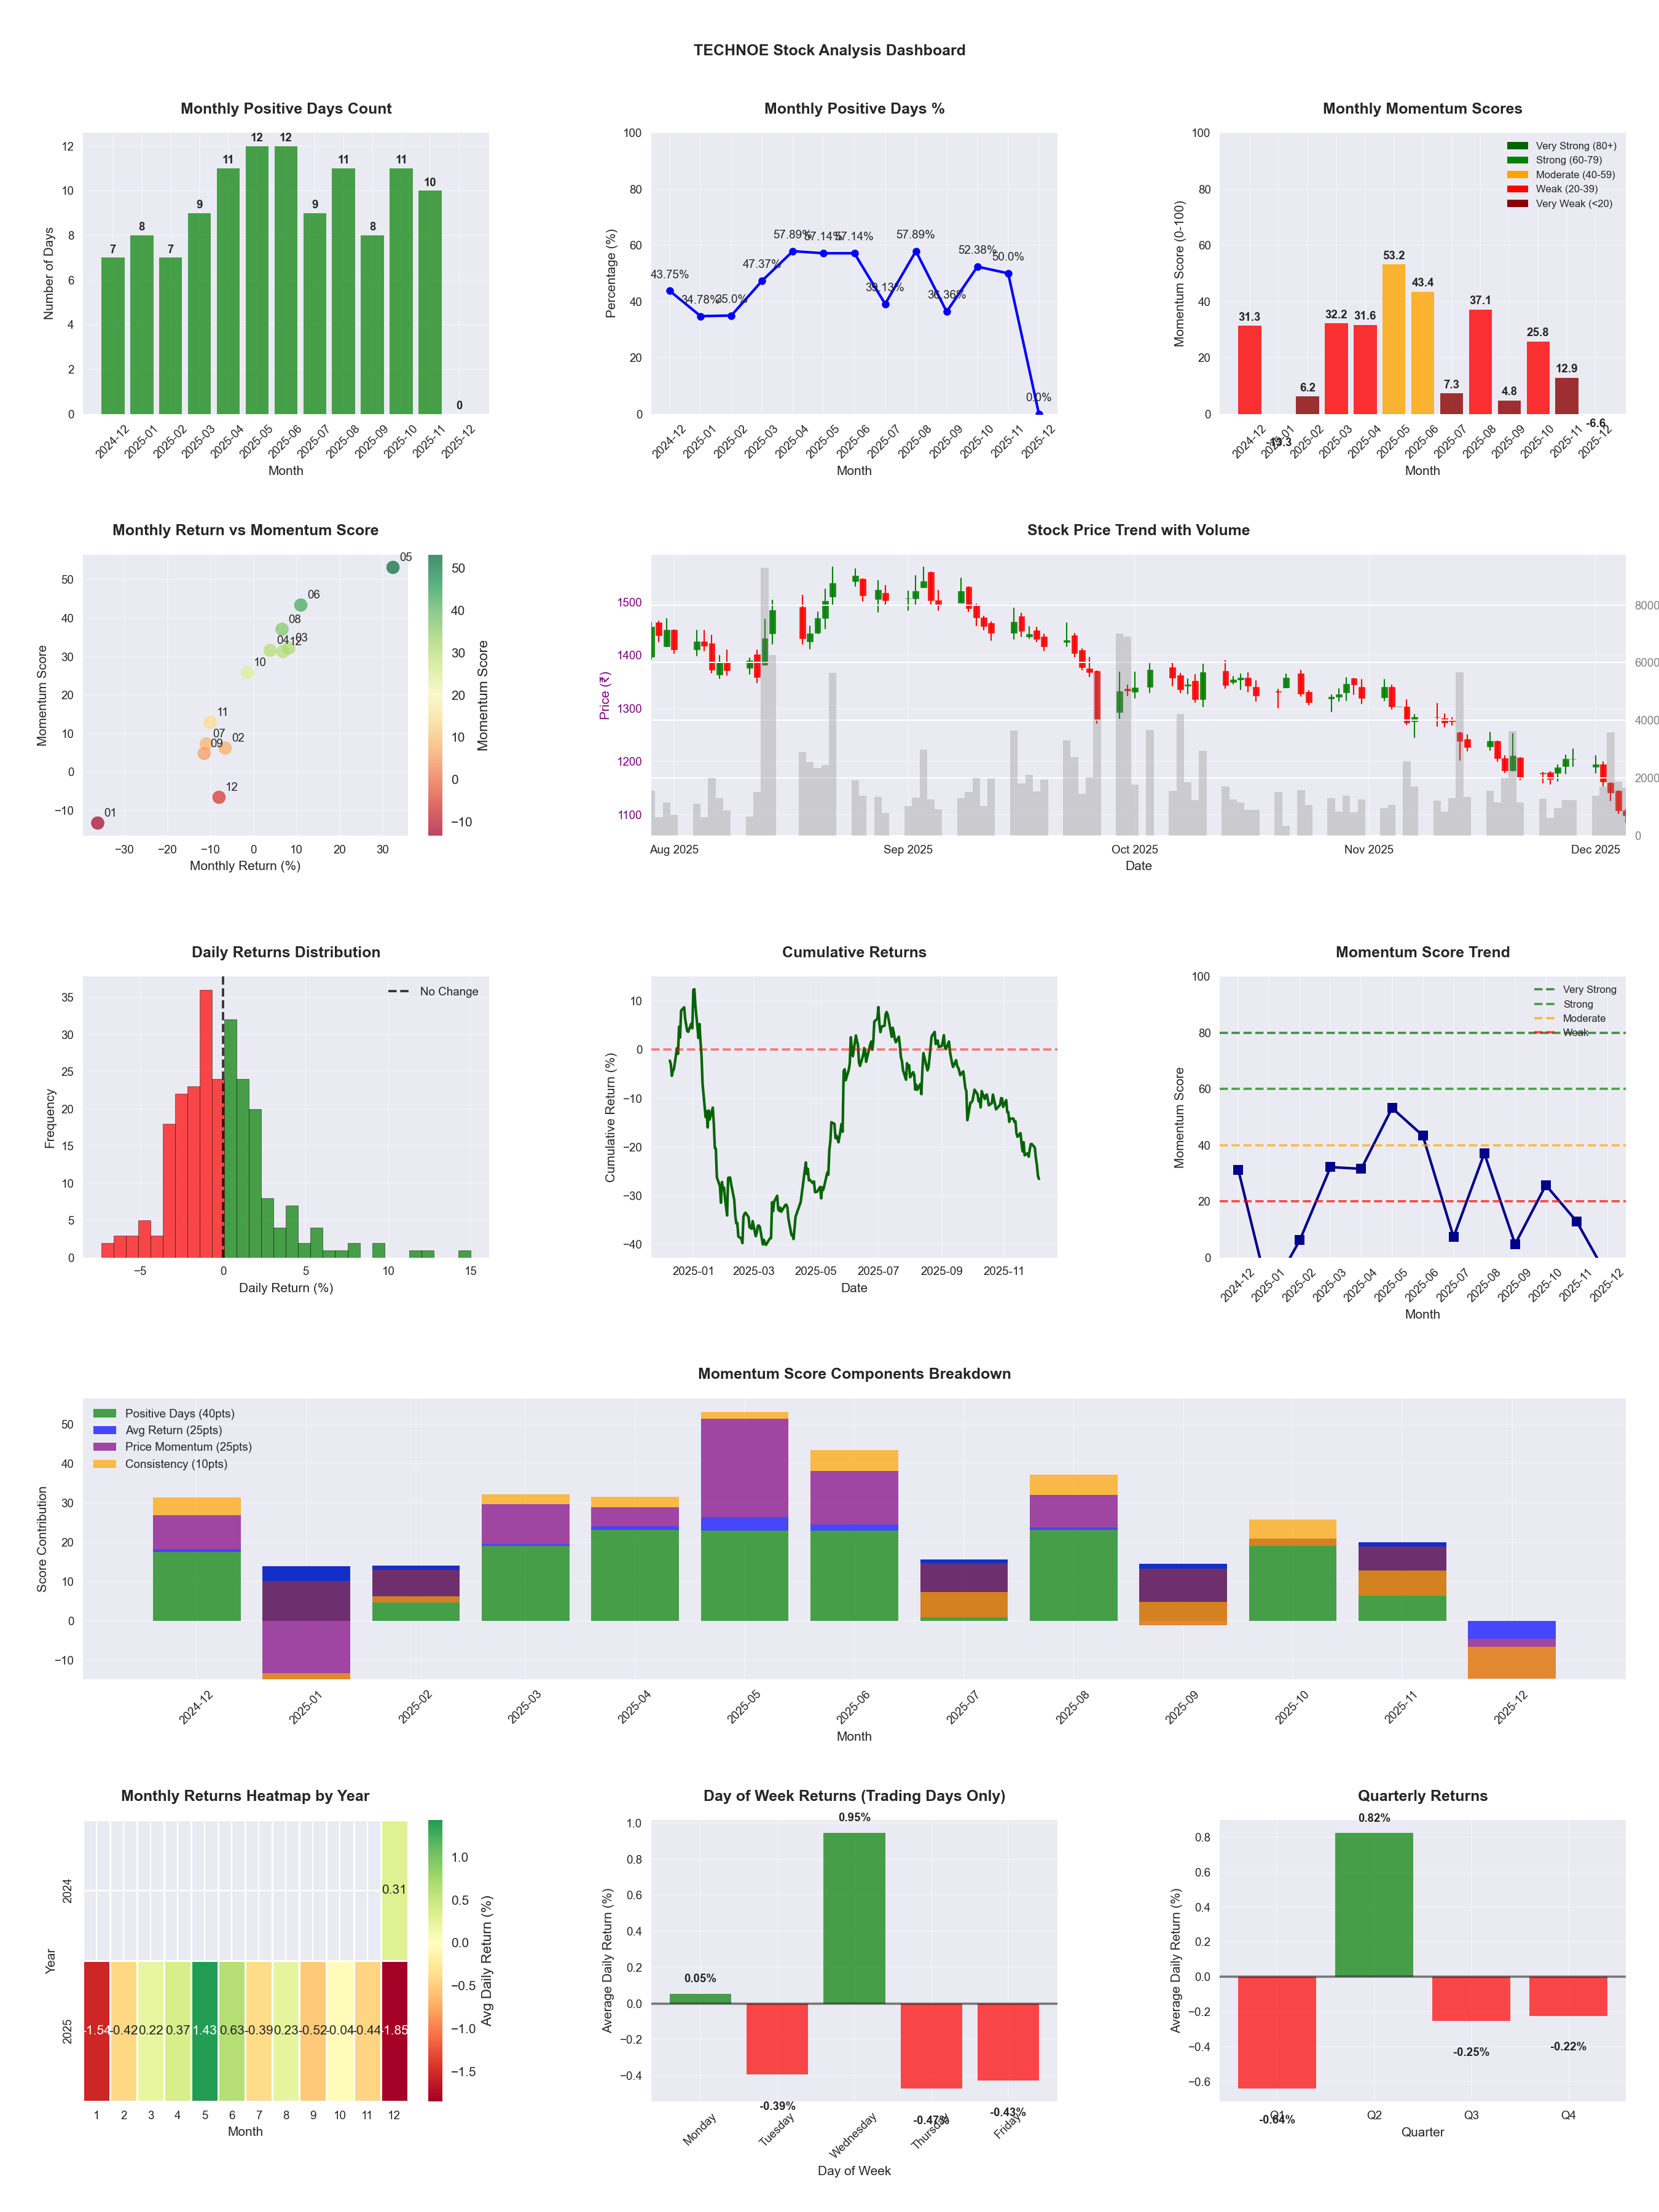
📊 Key Insights & Metrics
Symbol
📈 TECHNOE
Date
📅 2026-04-11
Volatility
🟡 2.56%
Risk Profile
⚠️ suitable for aggressive investors
Win Rate
⚠️ 48.4%
Avg Daily Return
📈 +0.08%
Max Drawdown
📉 -45.06%
IBD RS Score
📊 56.0
Average
Market Rank
#217
Best Month
🏆 2026-02
Worst Month
📉 2026-03
Best Months to Trade
📅 May, Apr, Feb
Best Days to Trade
📅 Wednesday, Monday
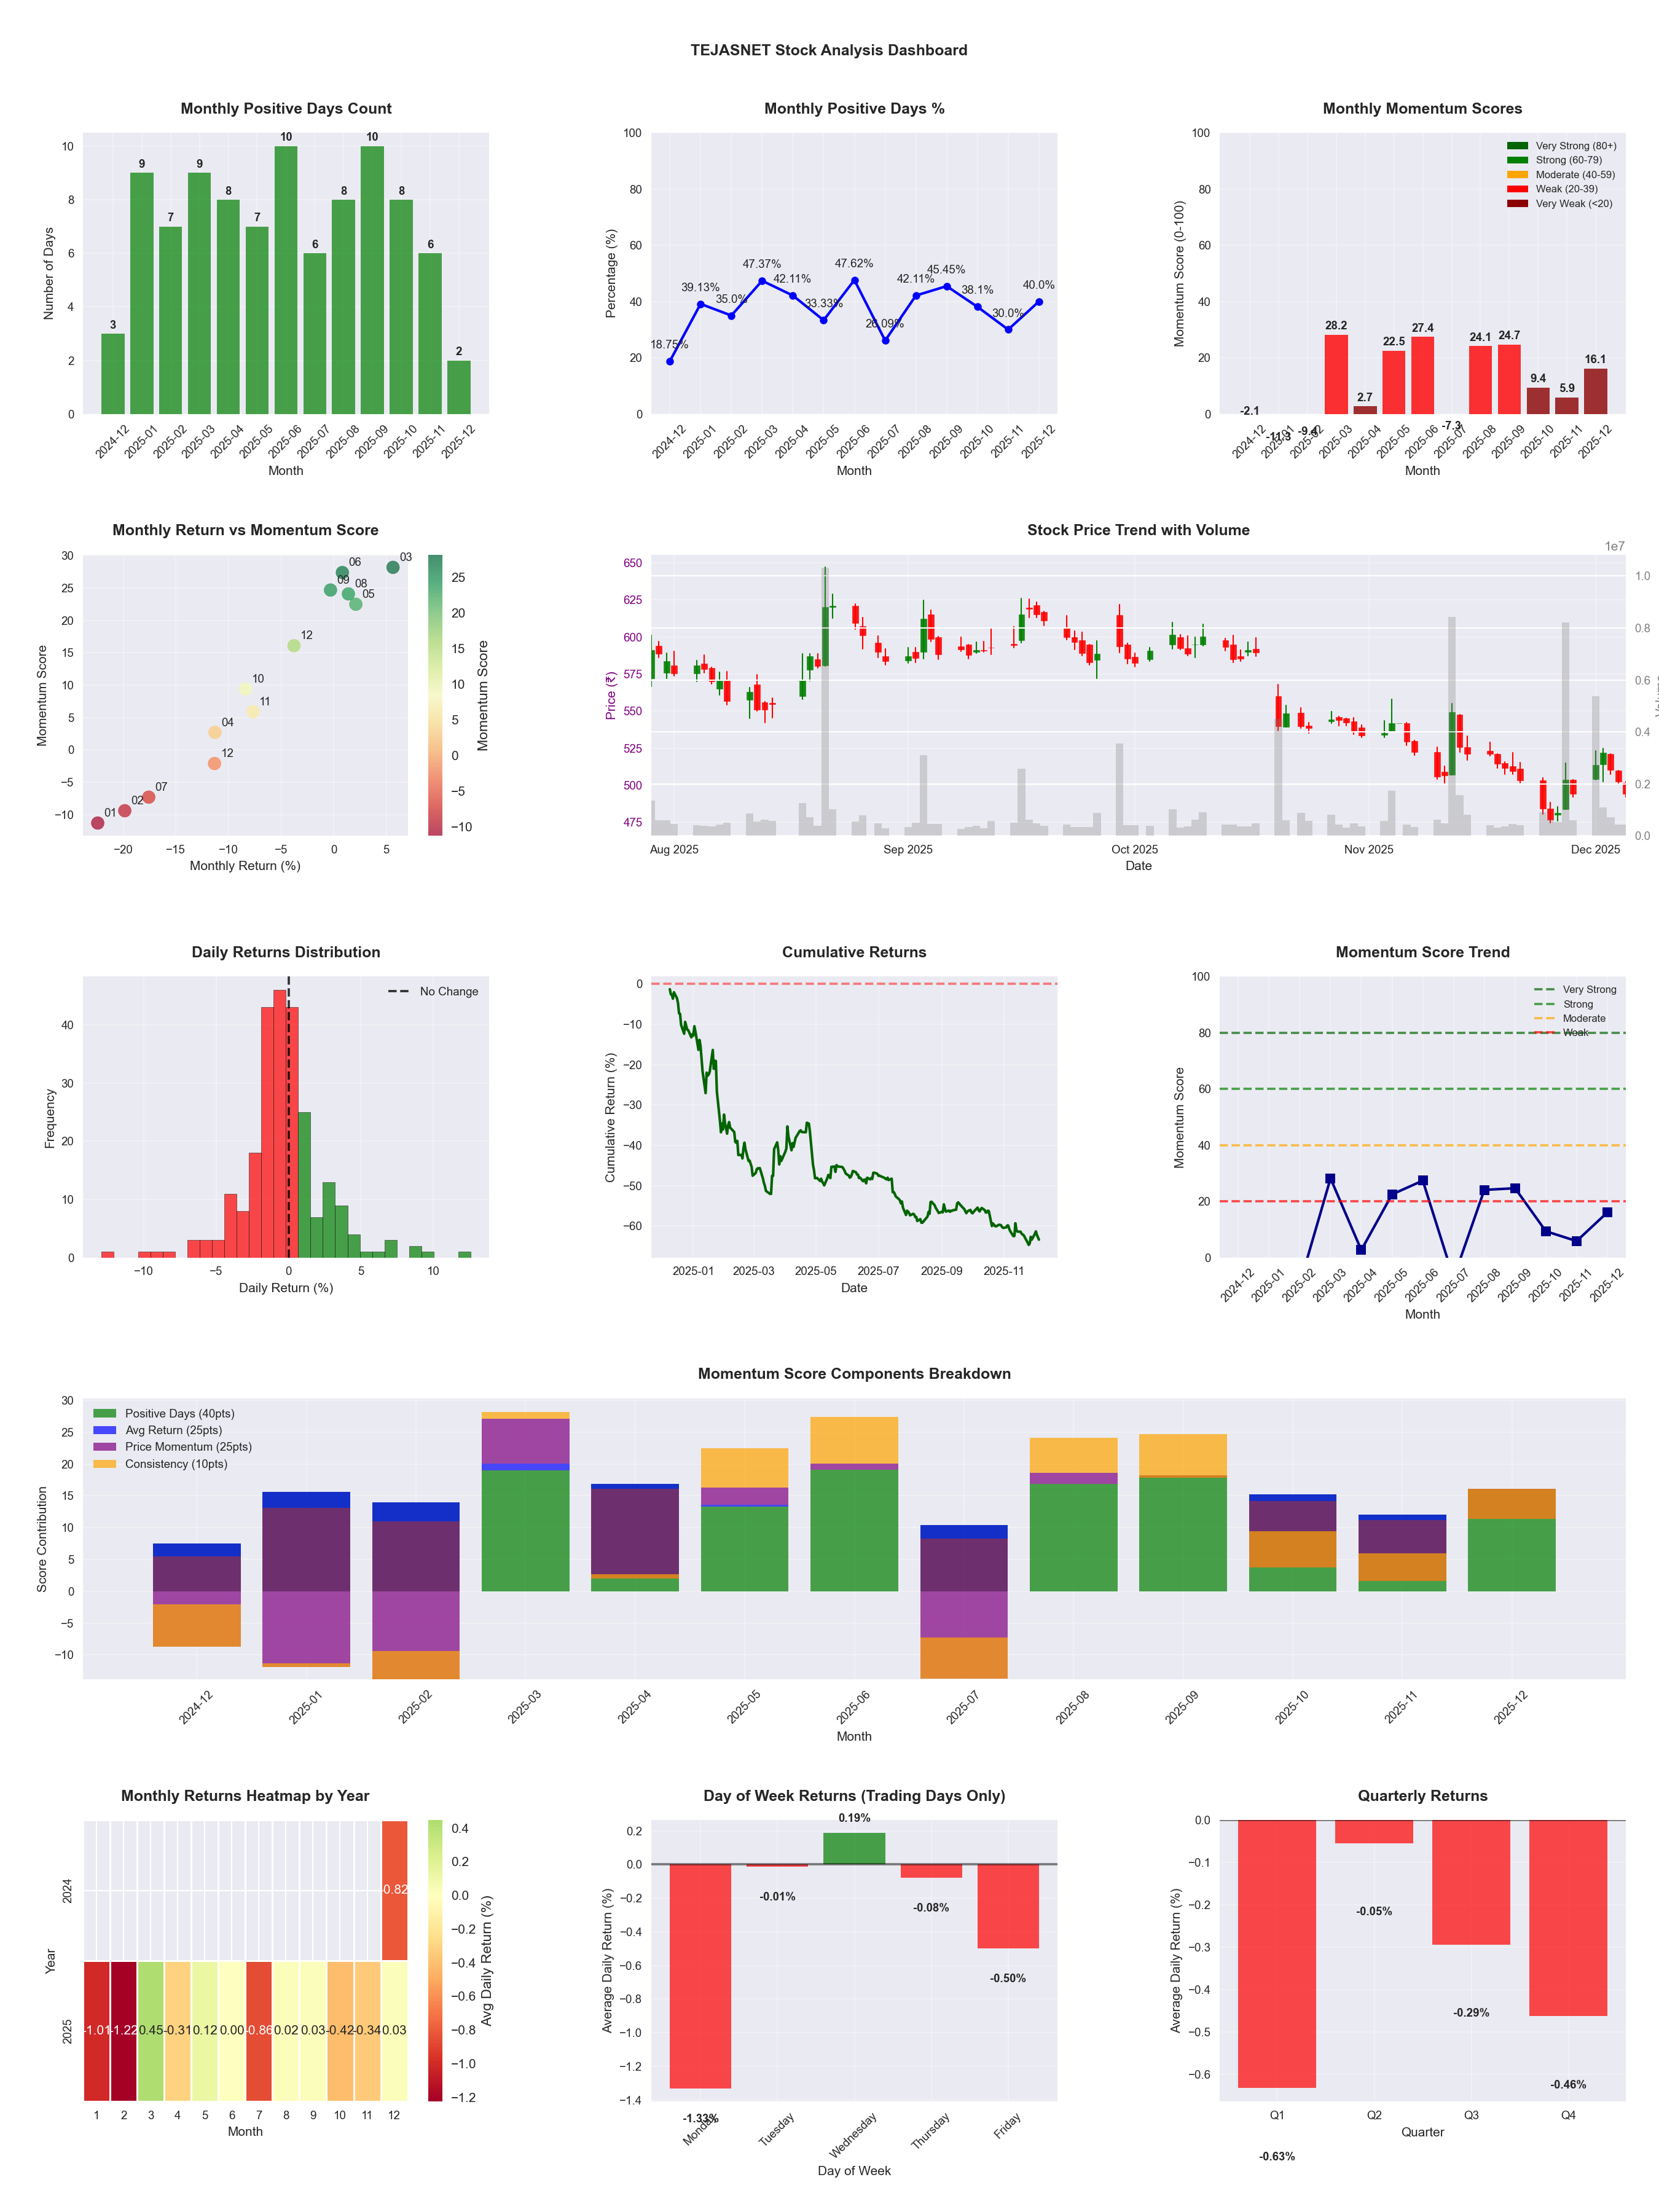
📊 Key Insights & Metrics
Symbol
📈 TEJASNET
Date
📅 2026-04-11
Volatility
🔴 3.33%
Risk Profile
⚠️ suitable for aggressive investors
Win Rate
❌ 37.8%
Avg Daily Return
📉 -0.20%
Max Drawdown
📉 -66.56%
IBD RS Score
📊 17.6
Weak
Market Rank
#406
Best Month
🏆 2026-02
Best Months to Trade
📅 Feb, May, Sep
Best Days to Trade
📅 Wednesday, Tuesday
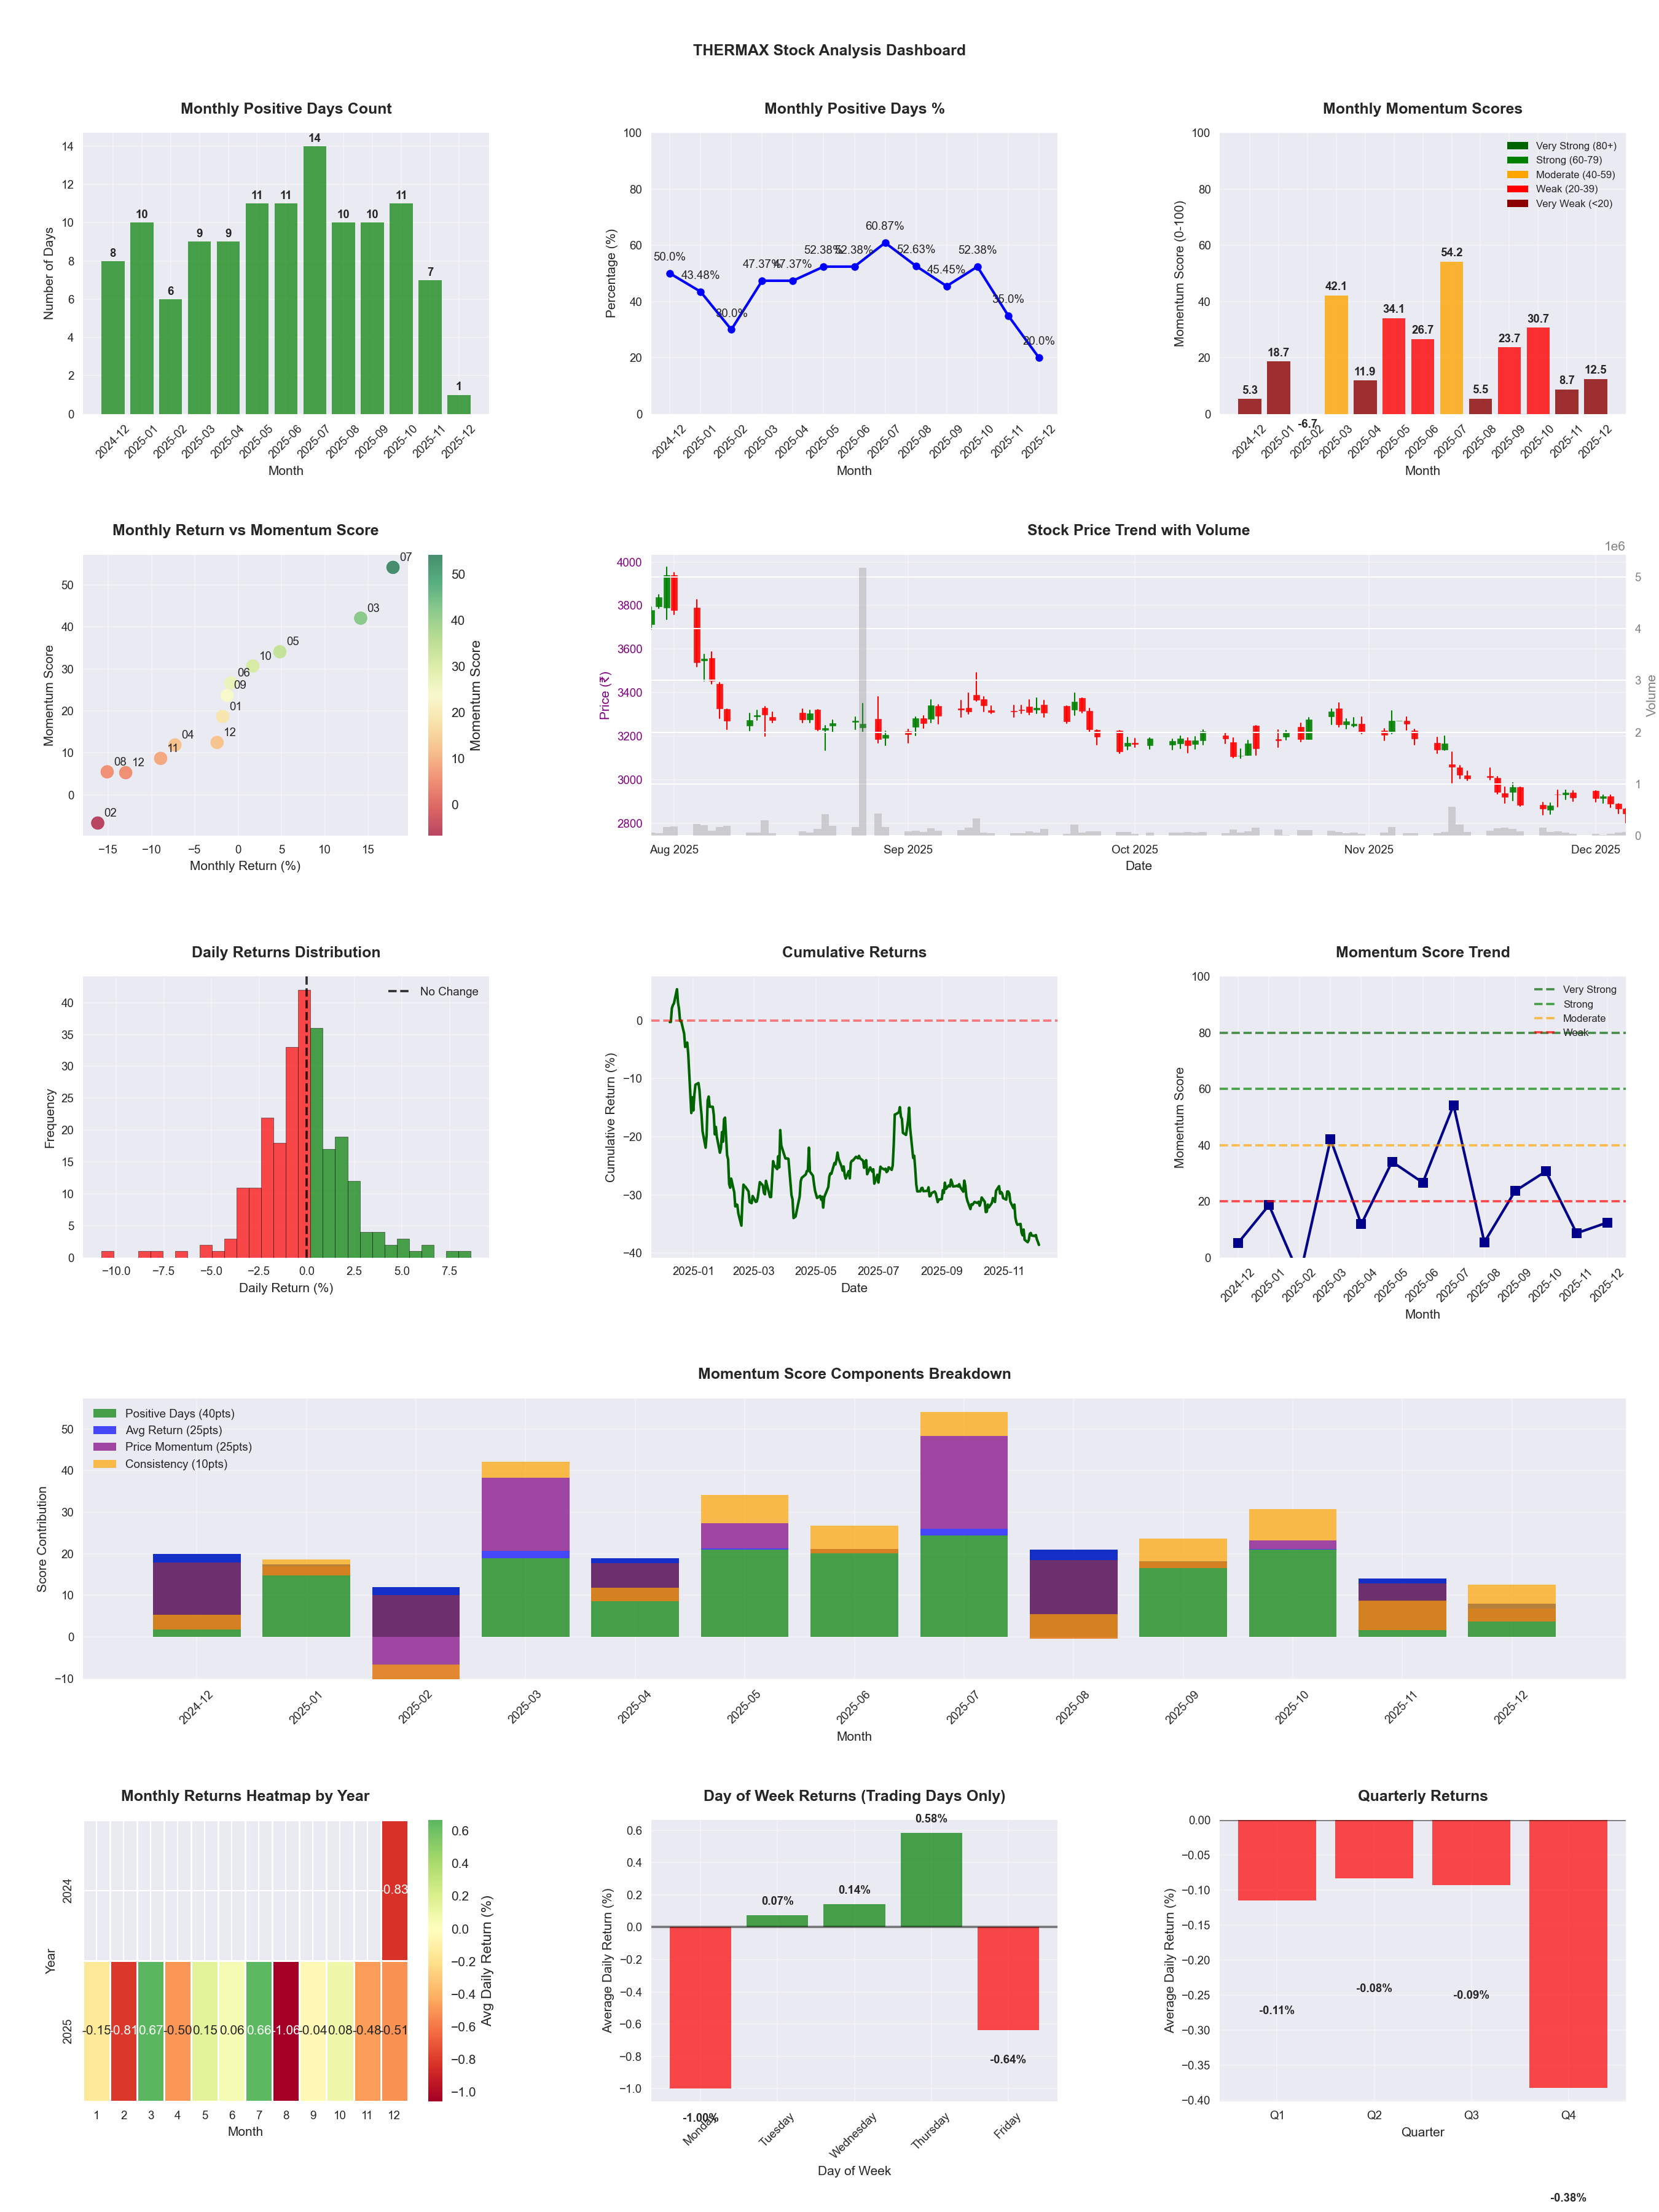
📊 Key Insights & Metrics
Symbol
📈 THERMAX
Date
📅 2026-04-11
Volatility
🟡 1.90%
Win Rate
⚠️ 51.4%
Avg Daily Return
📈 +0.09%
Max Drawdown
📉 -29.68%
IBD RS Score
📊 81.1
Strong
Market Rank
#93
Best Month
🏆 2025-07
Worst Month
📉 2025-08
Best Months to Trade
📅 Apr, Jul, Feb
Best Days to Trade
📅 Tuesday, Wednesday
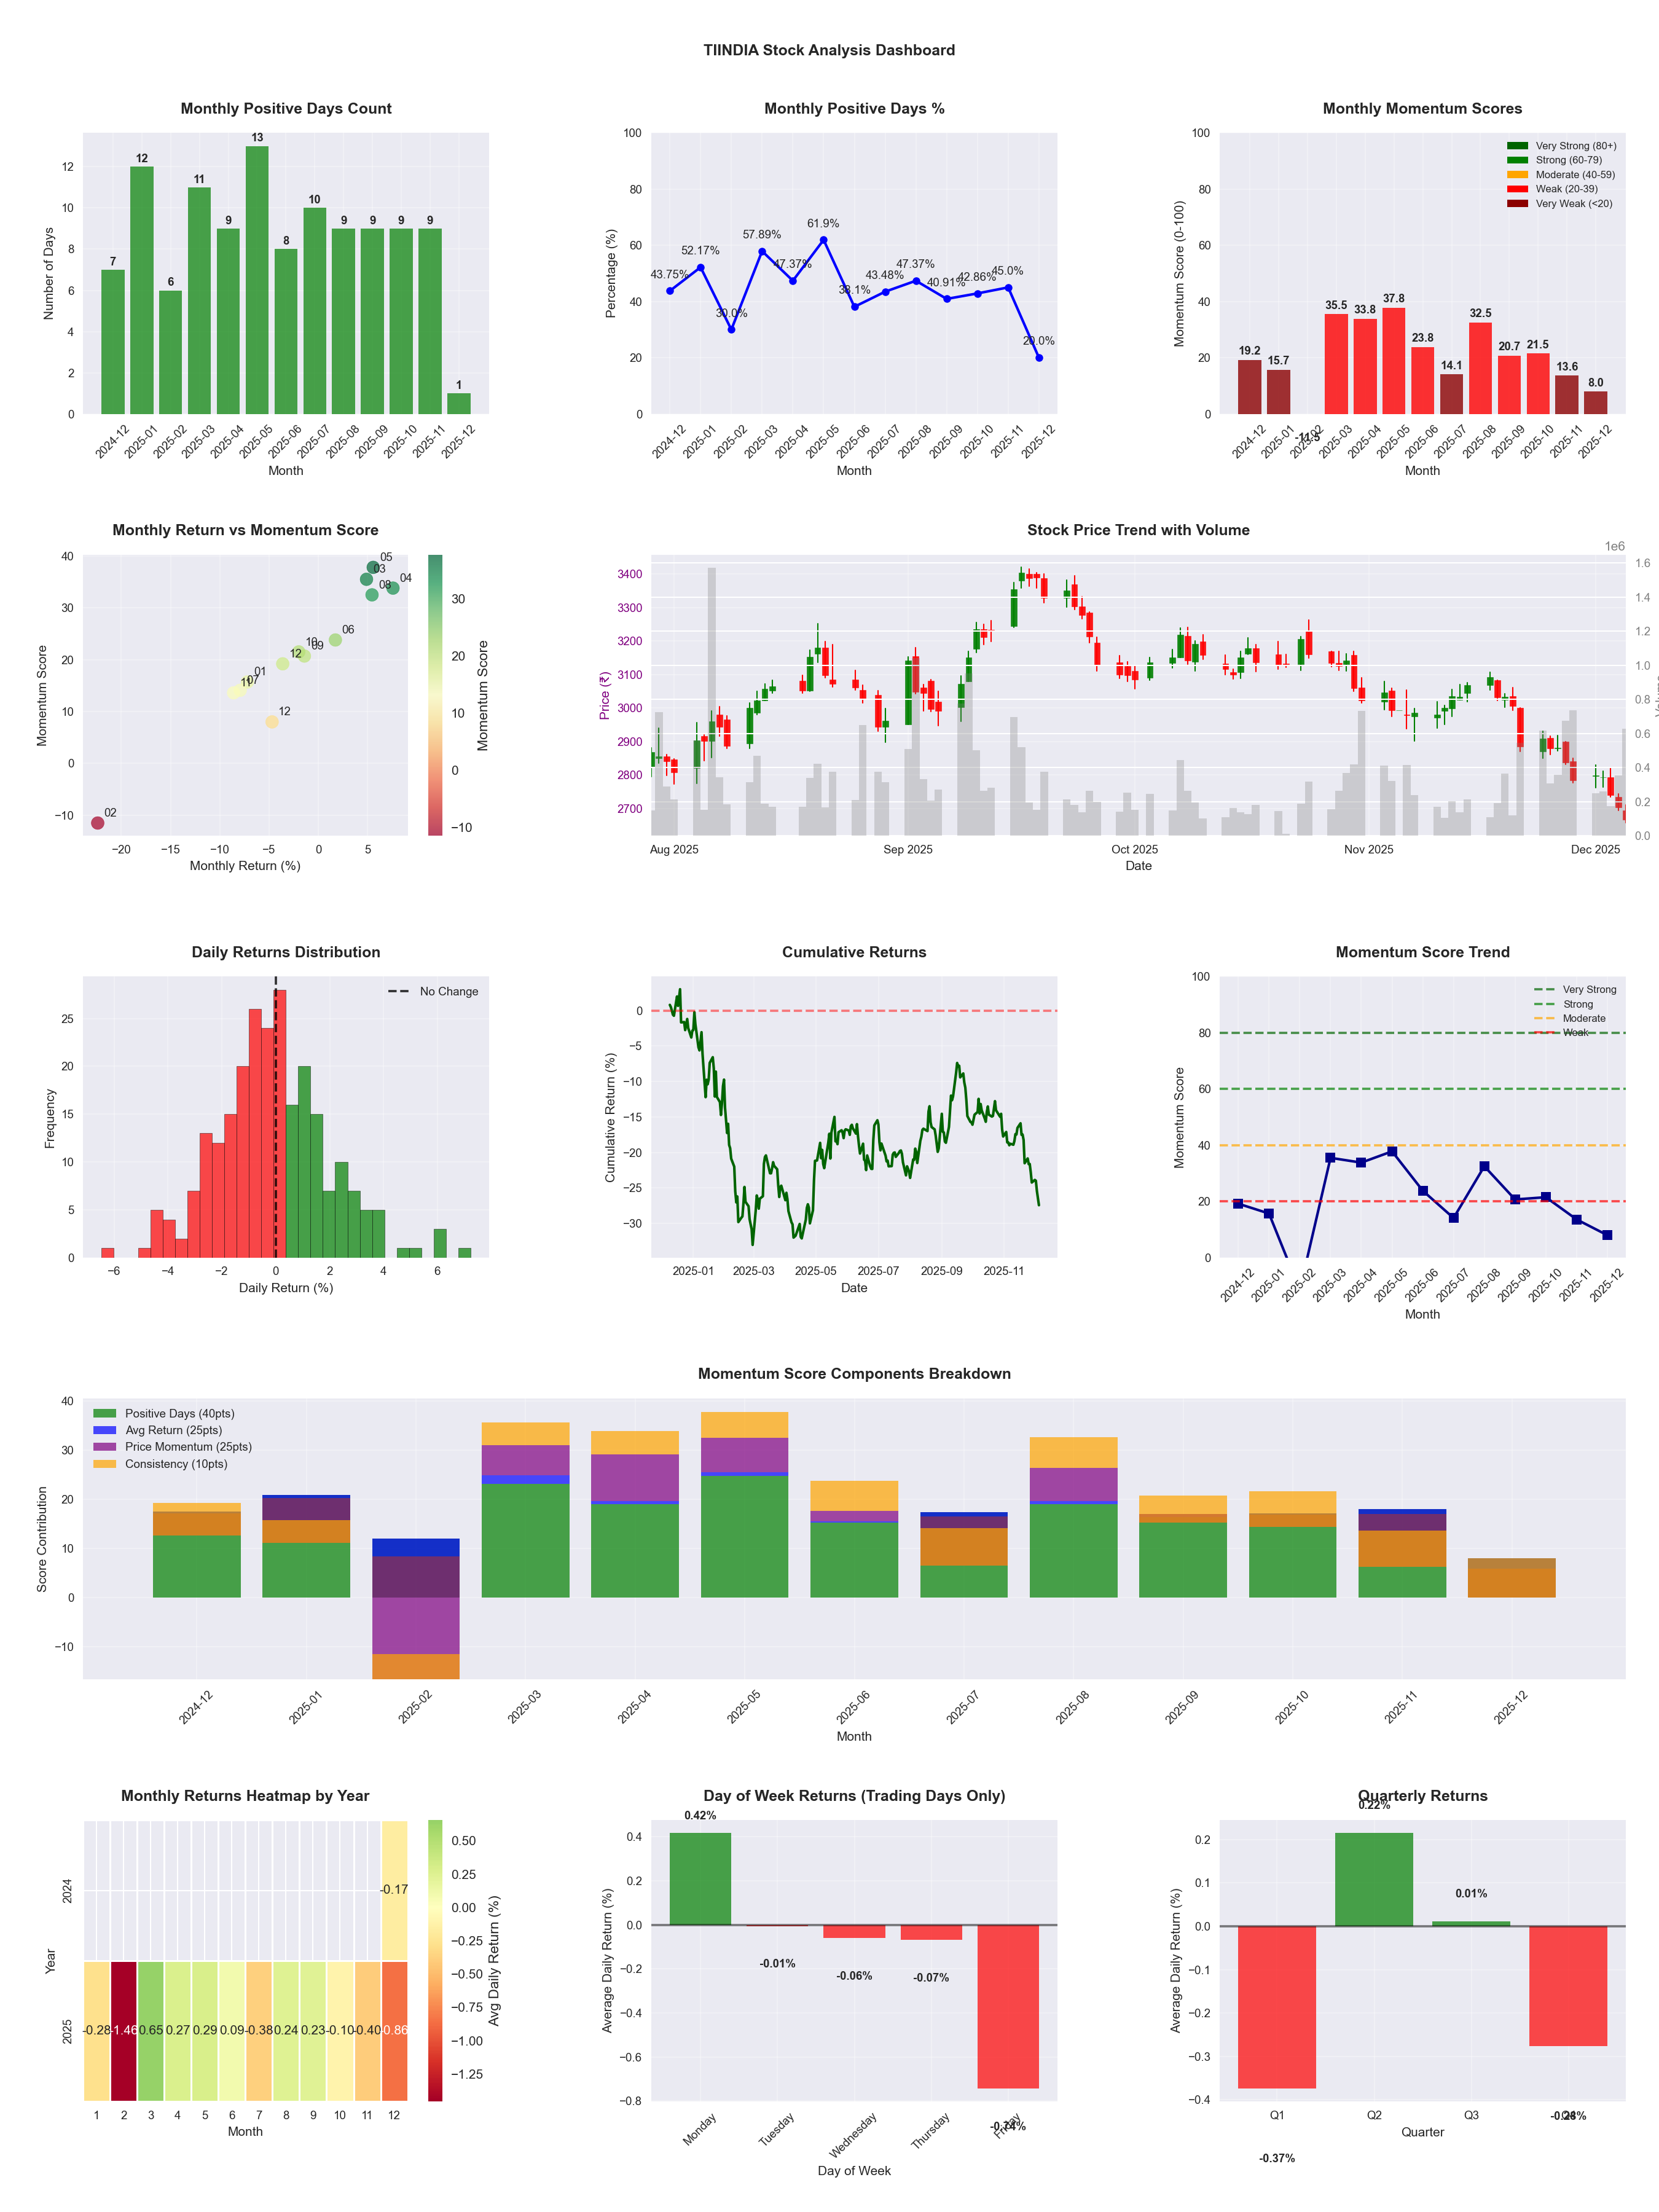
📊 Key Insights & Metrics
Symbol
📈 TIINDIA
Date
📅 2026-04-11
Volatility
🟡 2.15%
Risk Profile
⚠️ suitable for aggressive investors
Win Rate
⚠️ 47.6%
Avg Daily Return
📈 +0.06%
Max Drawdown
📉 -35.69%
IBD RS Score
📊 68.4
Average
Market Rank
#156
Best Month
🏆 2026-02
Worst Month
📉 2026-01
Best Months to Trade
📅 Apr, Feb, May
Best Days to Trade
📅 Wednesday, Tuesday
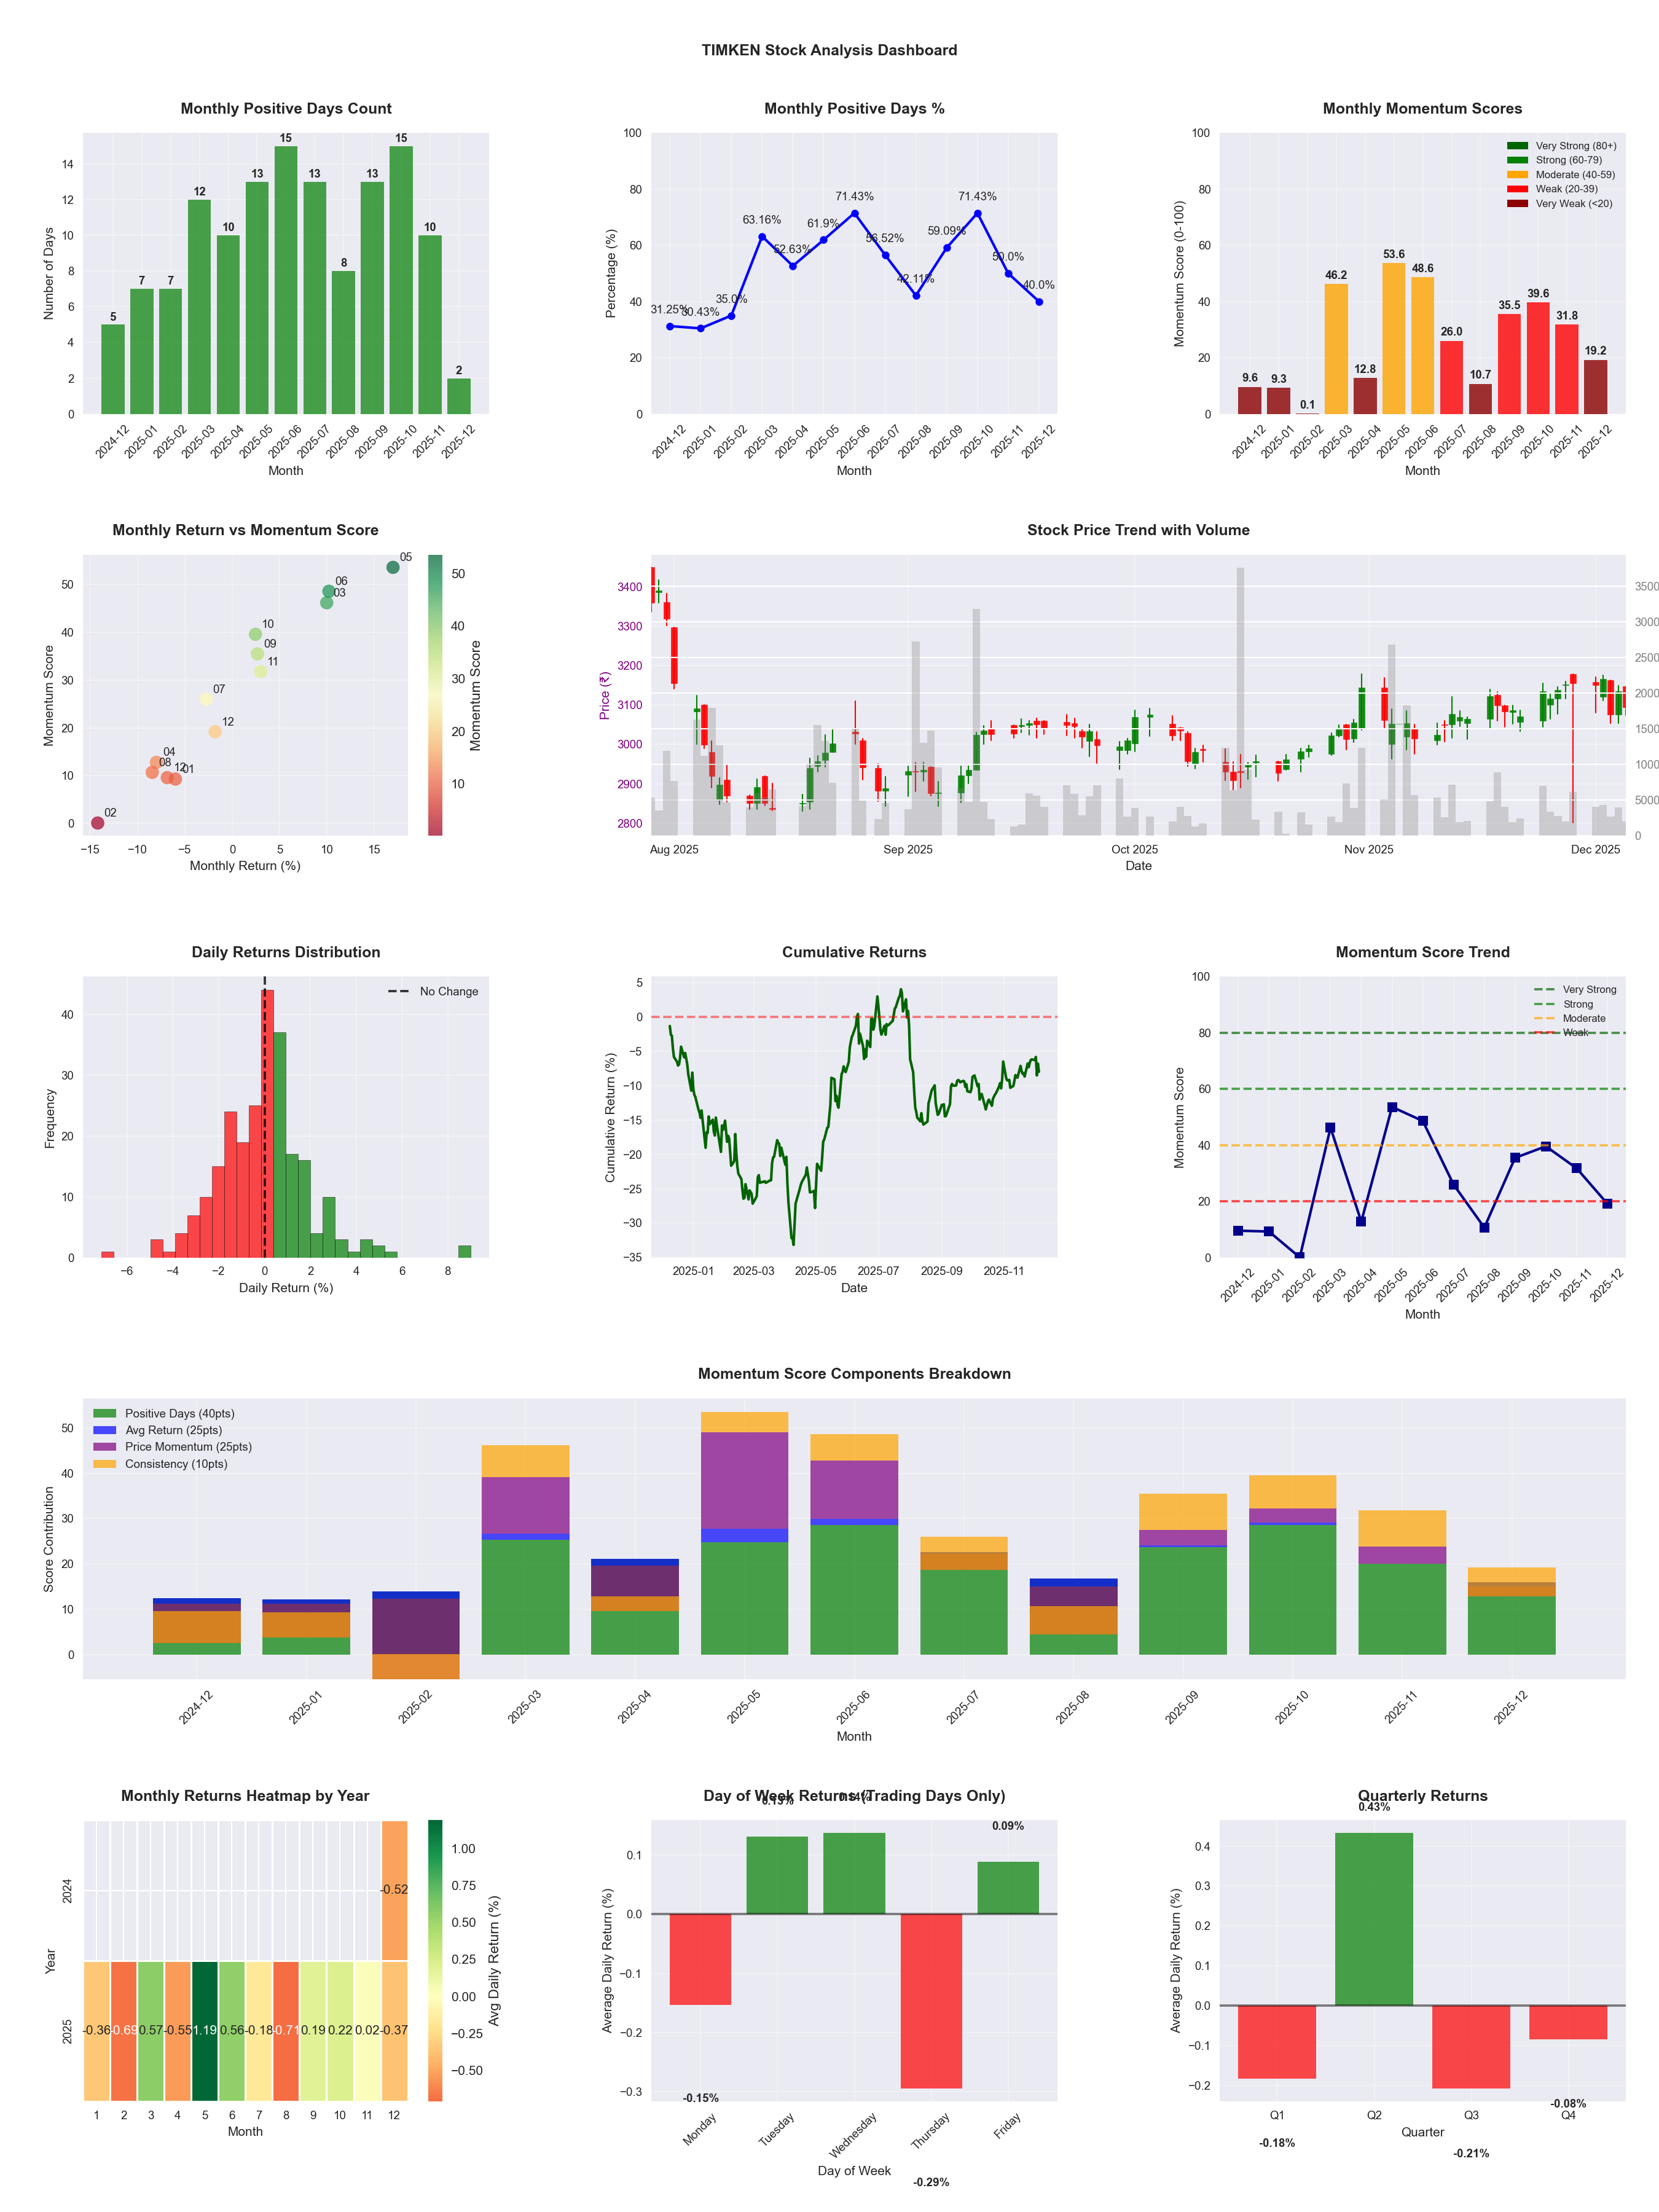
📊 Key Insights & Metrics
Symbol
📈 TIMKEN
Date
📅 2026-04-11
Volatility
🟡 1.89%
Win Rate
⚠️ 57.1%
Avg Daily Return
📈 +0.16%
Max Drawdown
📉 -18.92%
IBD RS Score
📊 87.0
Strong
Market Rank
#64
Best Month
🏆 2025-05
Worst Month
📉 2025-08
Best Months to Trade
📅 May, Feb, Jun
Best Days to Trade
📅 Wednesday, Monday
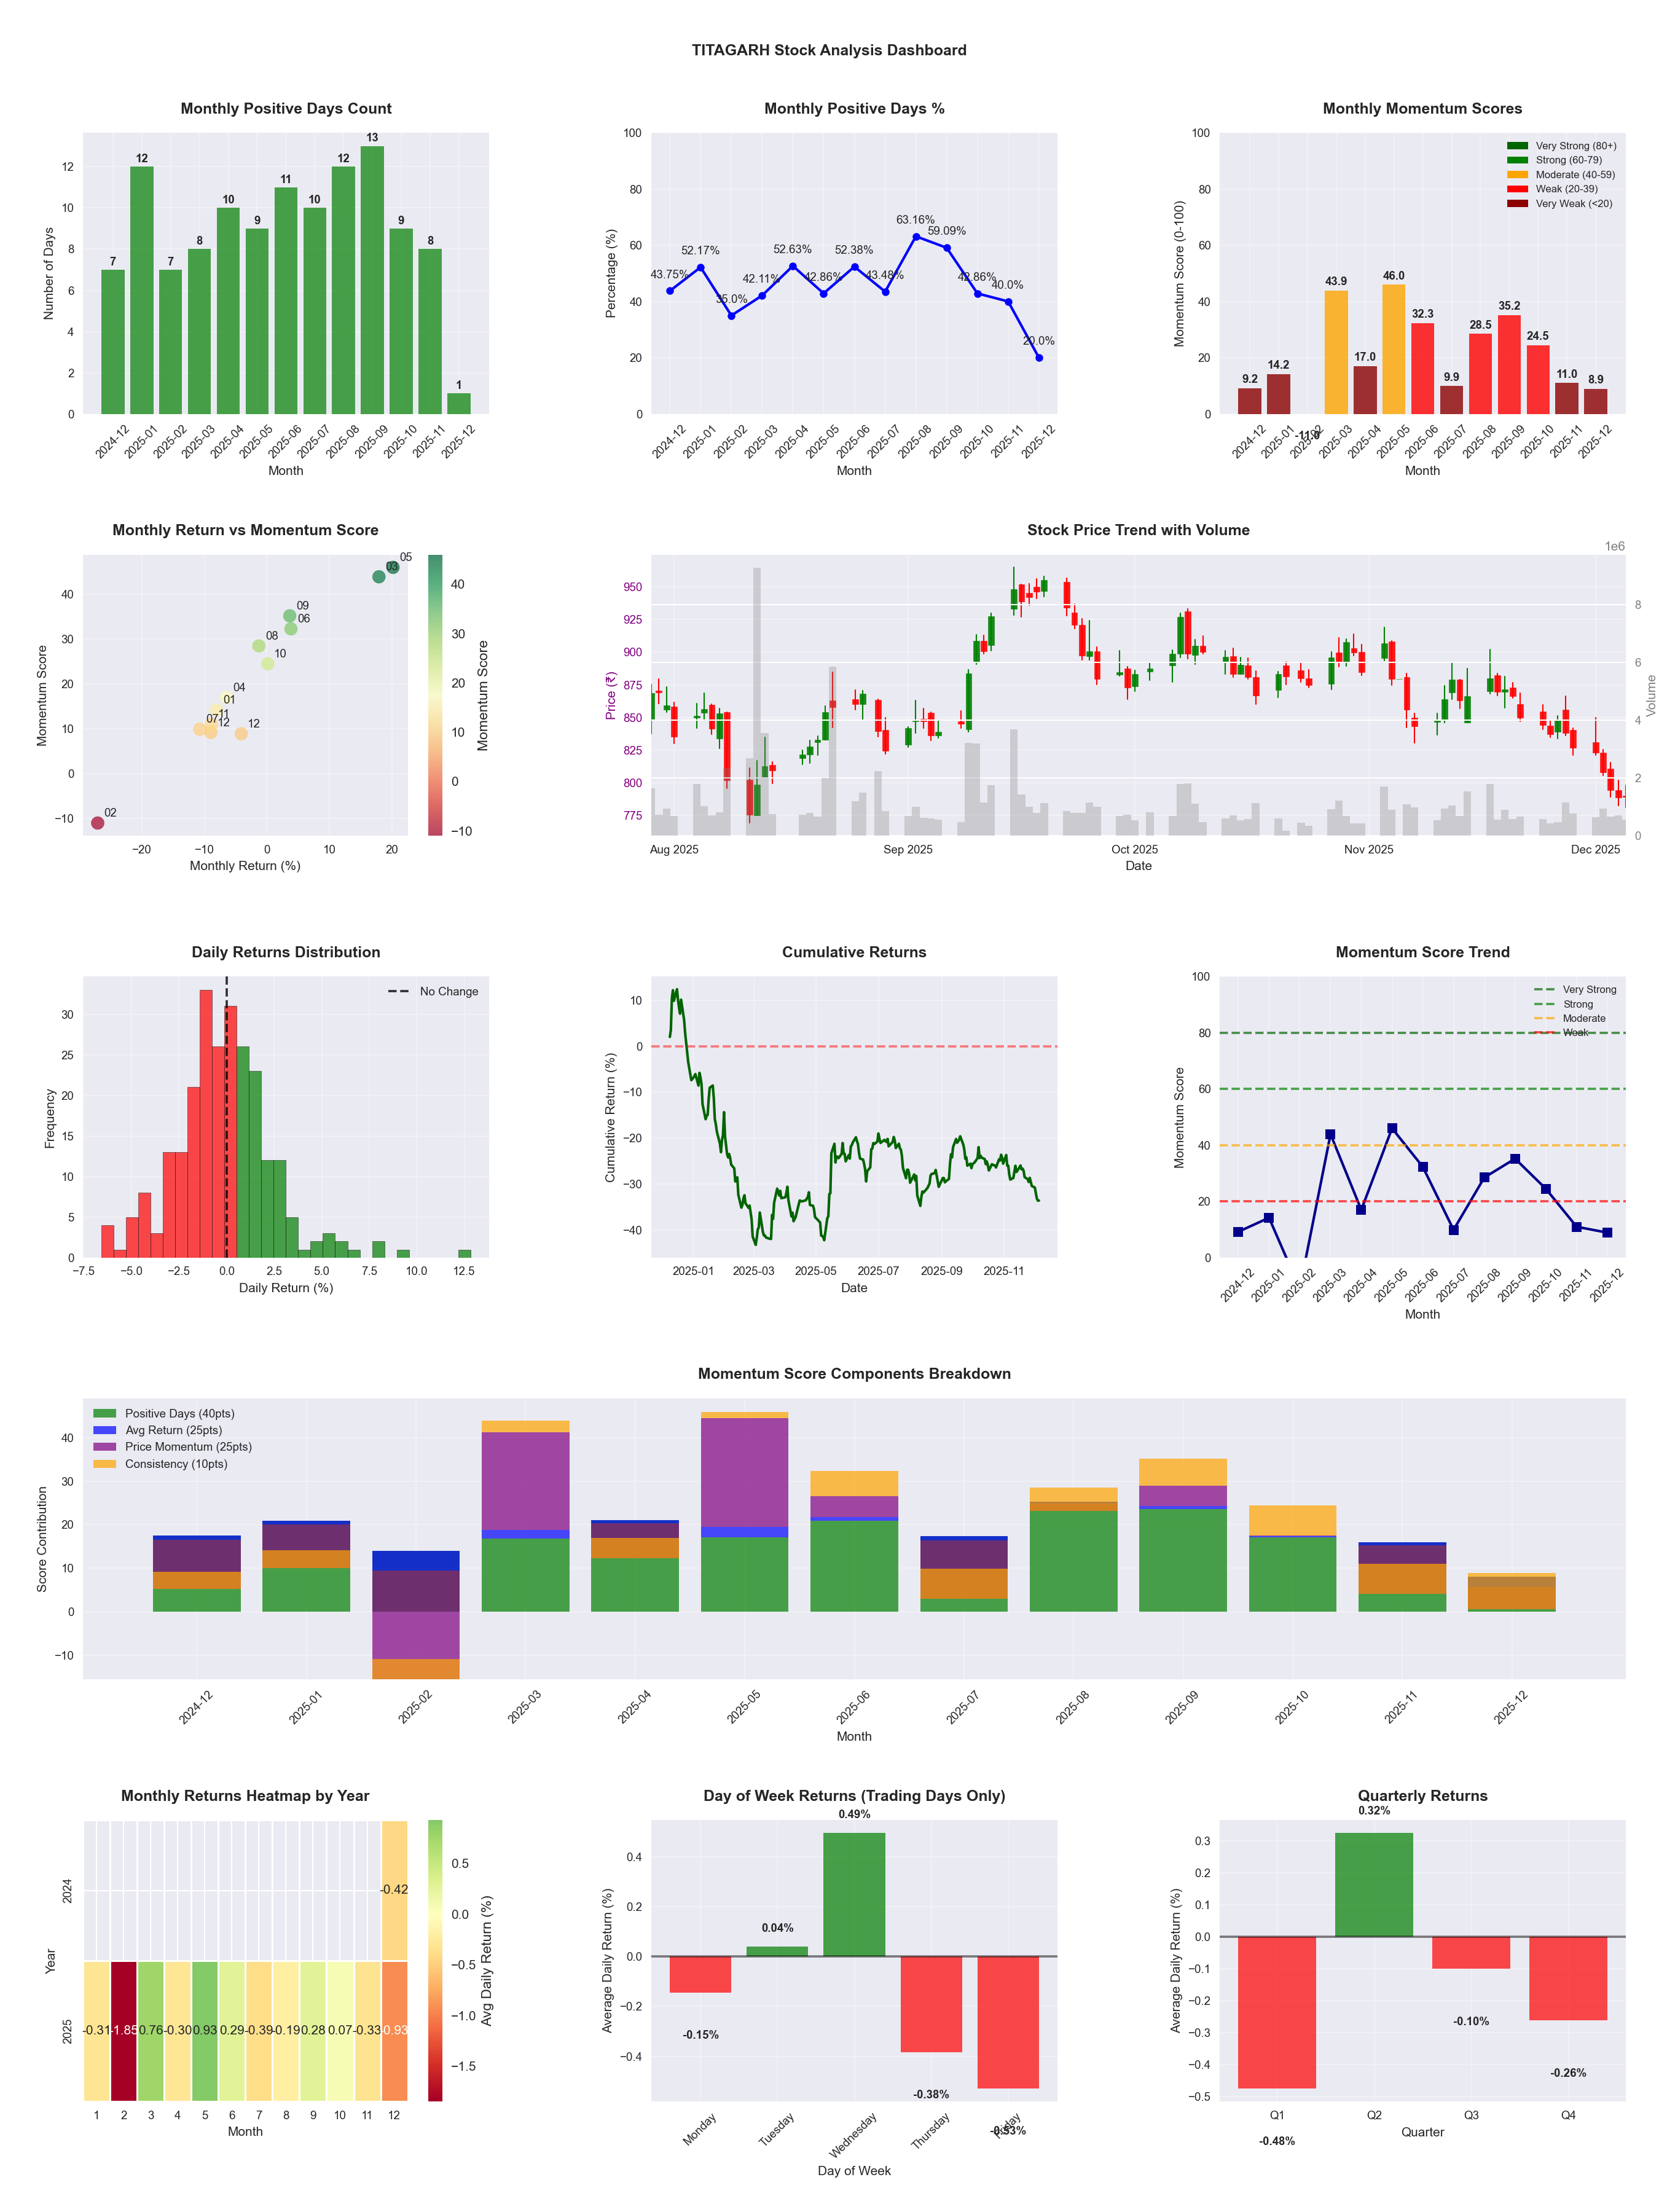
📊 Key Insights & Metrics
Symbol
📈 TITAGARH
Date
📅 2026-04-11
Volatility
🟡 2.41%
Risk Profile
⚠️ suitable for aggressive investors
Win Rate
⚠️ 46.8%
Avg Daily Return
📈 +0.01%
Max Drawdown
📉 -40.28%
IBD RS Score
📊 24.5
Weak
Market Rank
#372
Best Month
🏆 2026-04
Worst Month
📉 2026-03
Best Months to Trade
📅 Apr, May, Dec
Best Days to Trade
📅 Wednesday, Tuesday
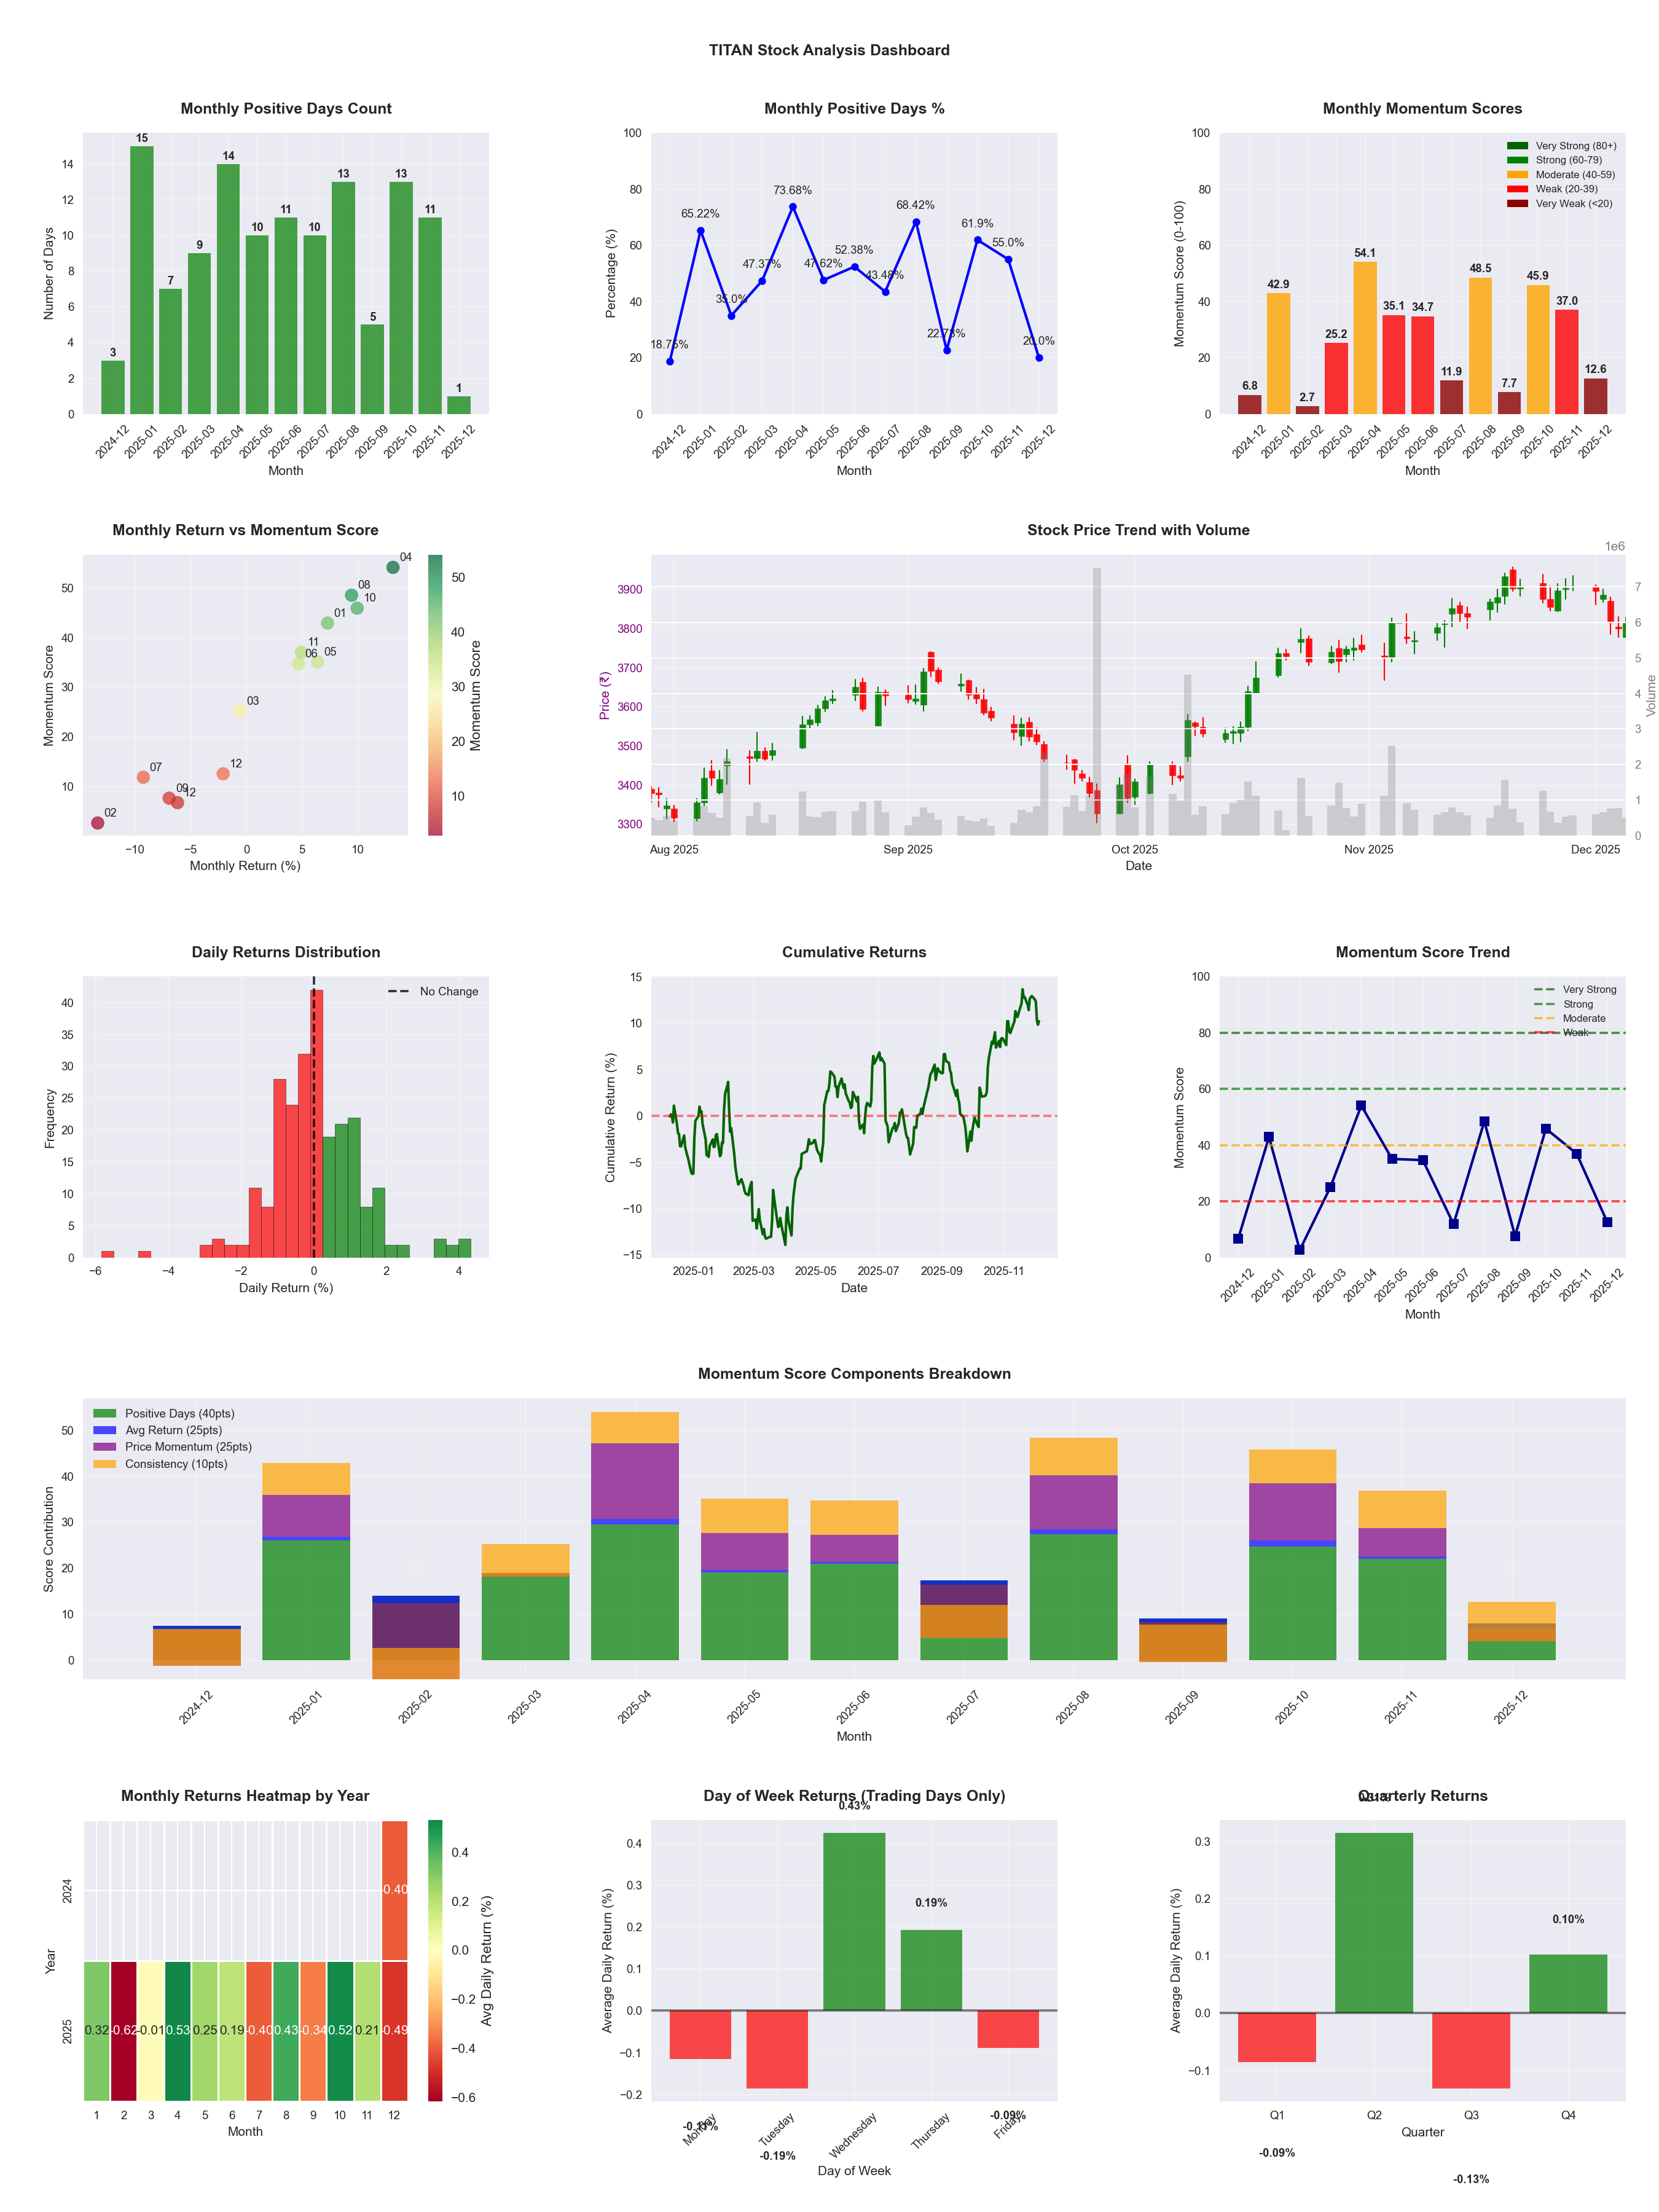
📊 Key Insights & Metrics
Symbol
📈 TITAN
Date
📅 2026-04-11
Volatility
🟢 1.34%
Win Rate
⚠️ 51.2%
Avg Daily Return
📈 +0.14%
Max Drawdown
📉 -11.27%
IBD RS Score
📊 89.9
Strong
Market Rank
#50
Best Month
🏆 2026-04
Worst Month
📉 2025-09
Best Months to Trade
📅 Apr, Oct, Feb
Best Days to Trade
📅 Wednesday, Tuesday
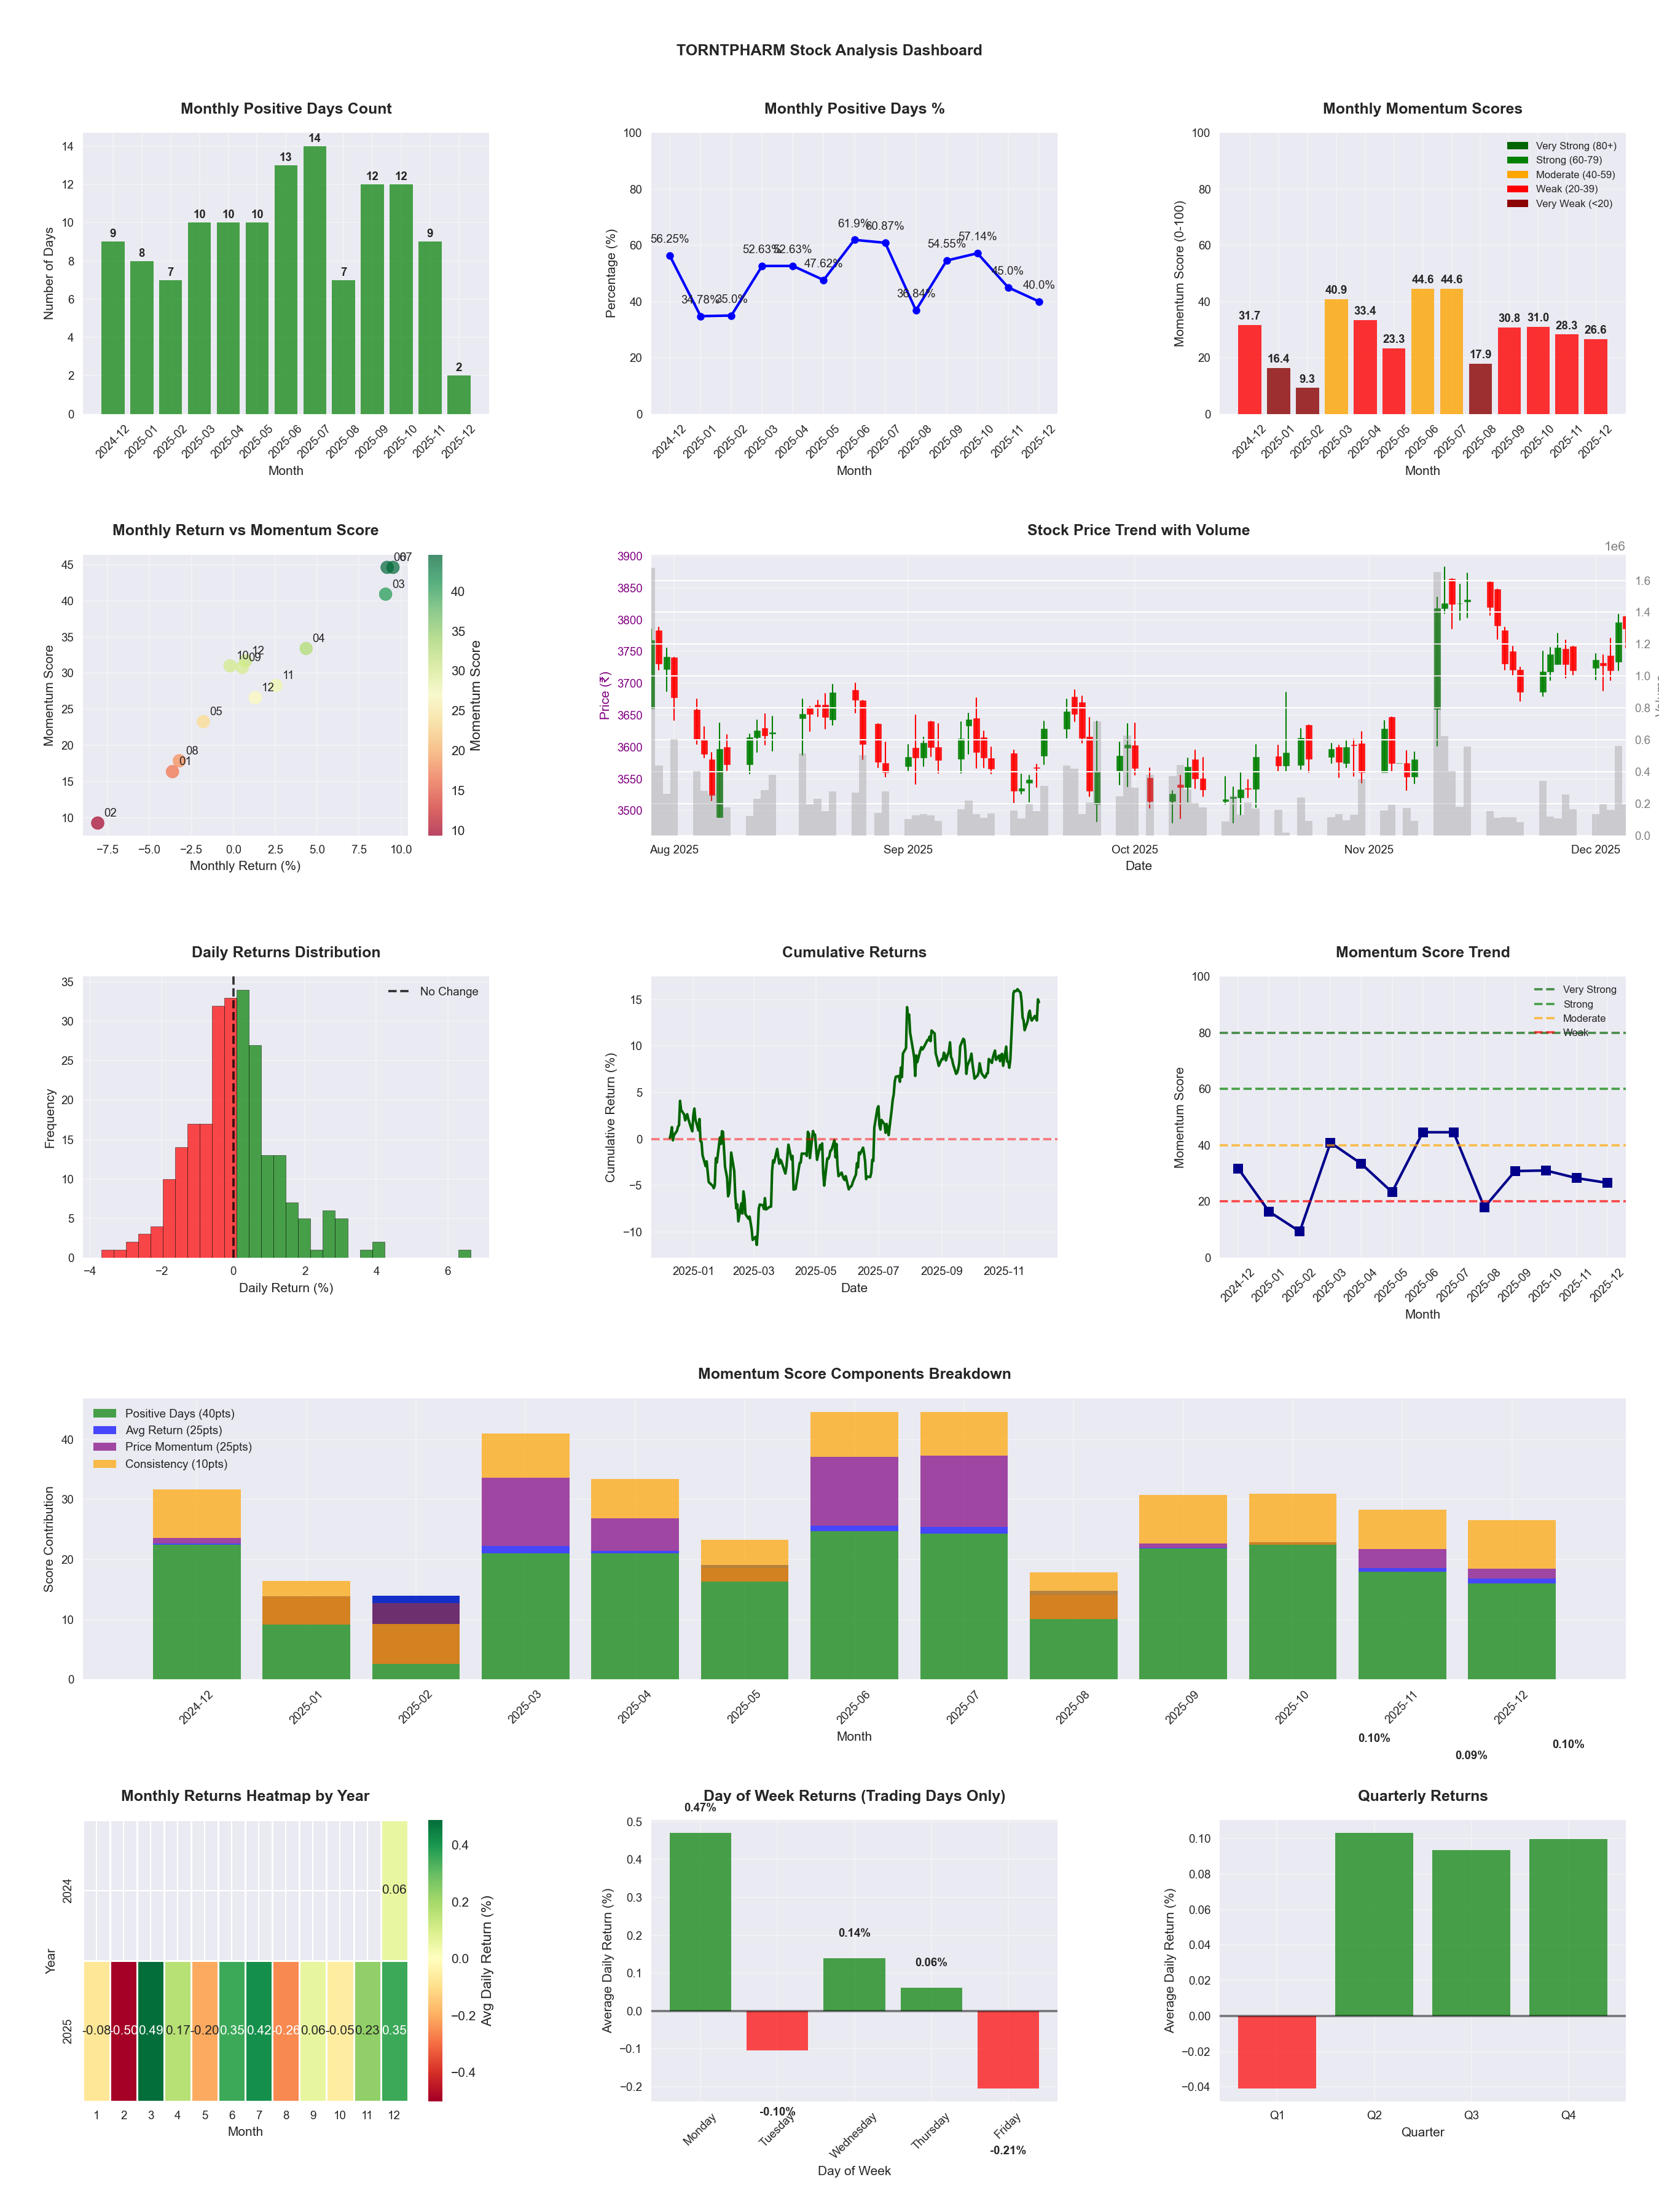
📊 Key Insights & Metrics
Symbol
📈 TORNTPHARM
Date
📅 2026-04-11
Volatility
🟢 1.29%
Win Rate
⚠️ 52.9%
Avg Daily Return
📈 +0.13%
Max Drawdown
📉 -10.32%
IBD RS Score
📊 84.8
Strong
Market Rank
#75
Best Month
🏆 2025-06
Worst Month
📉 2025-08
Best Months to Trade
📅 Feb, Jul, Jun
Best Days to Trade
📅 Monday, Tuesday
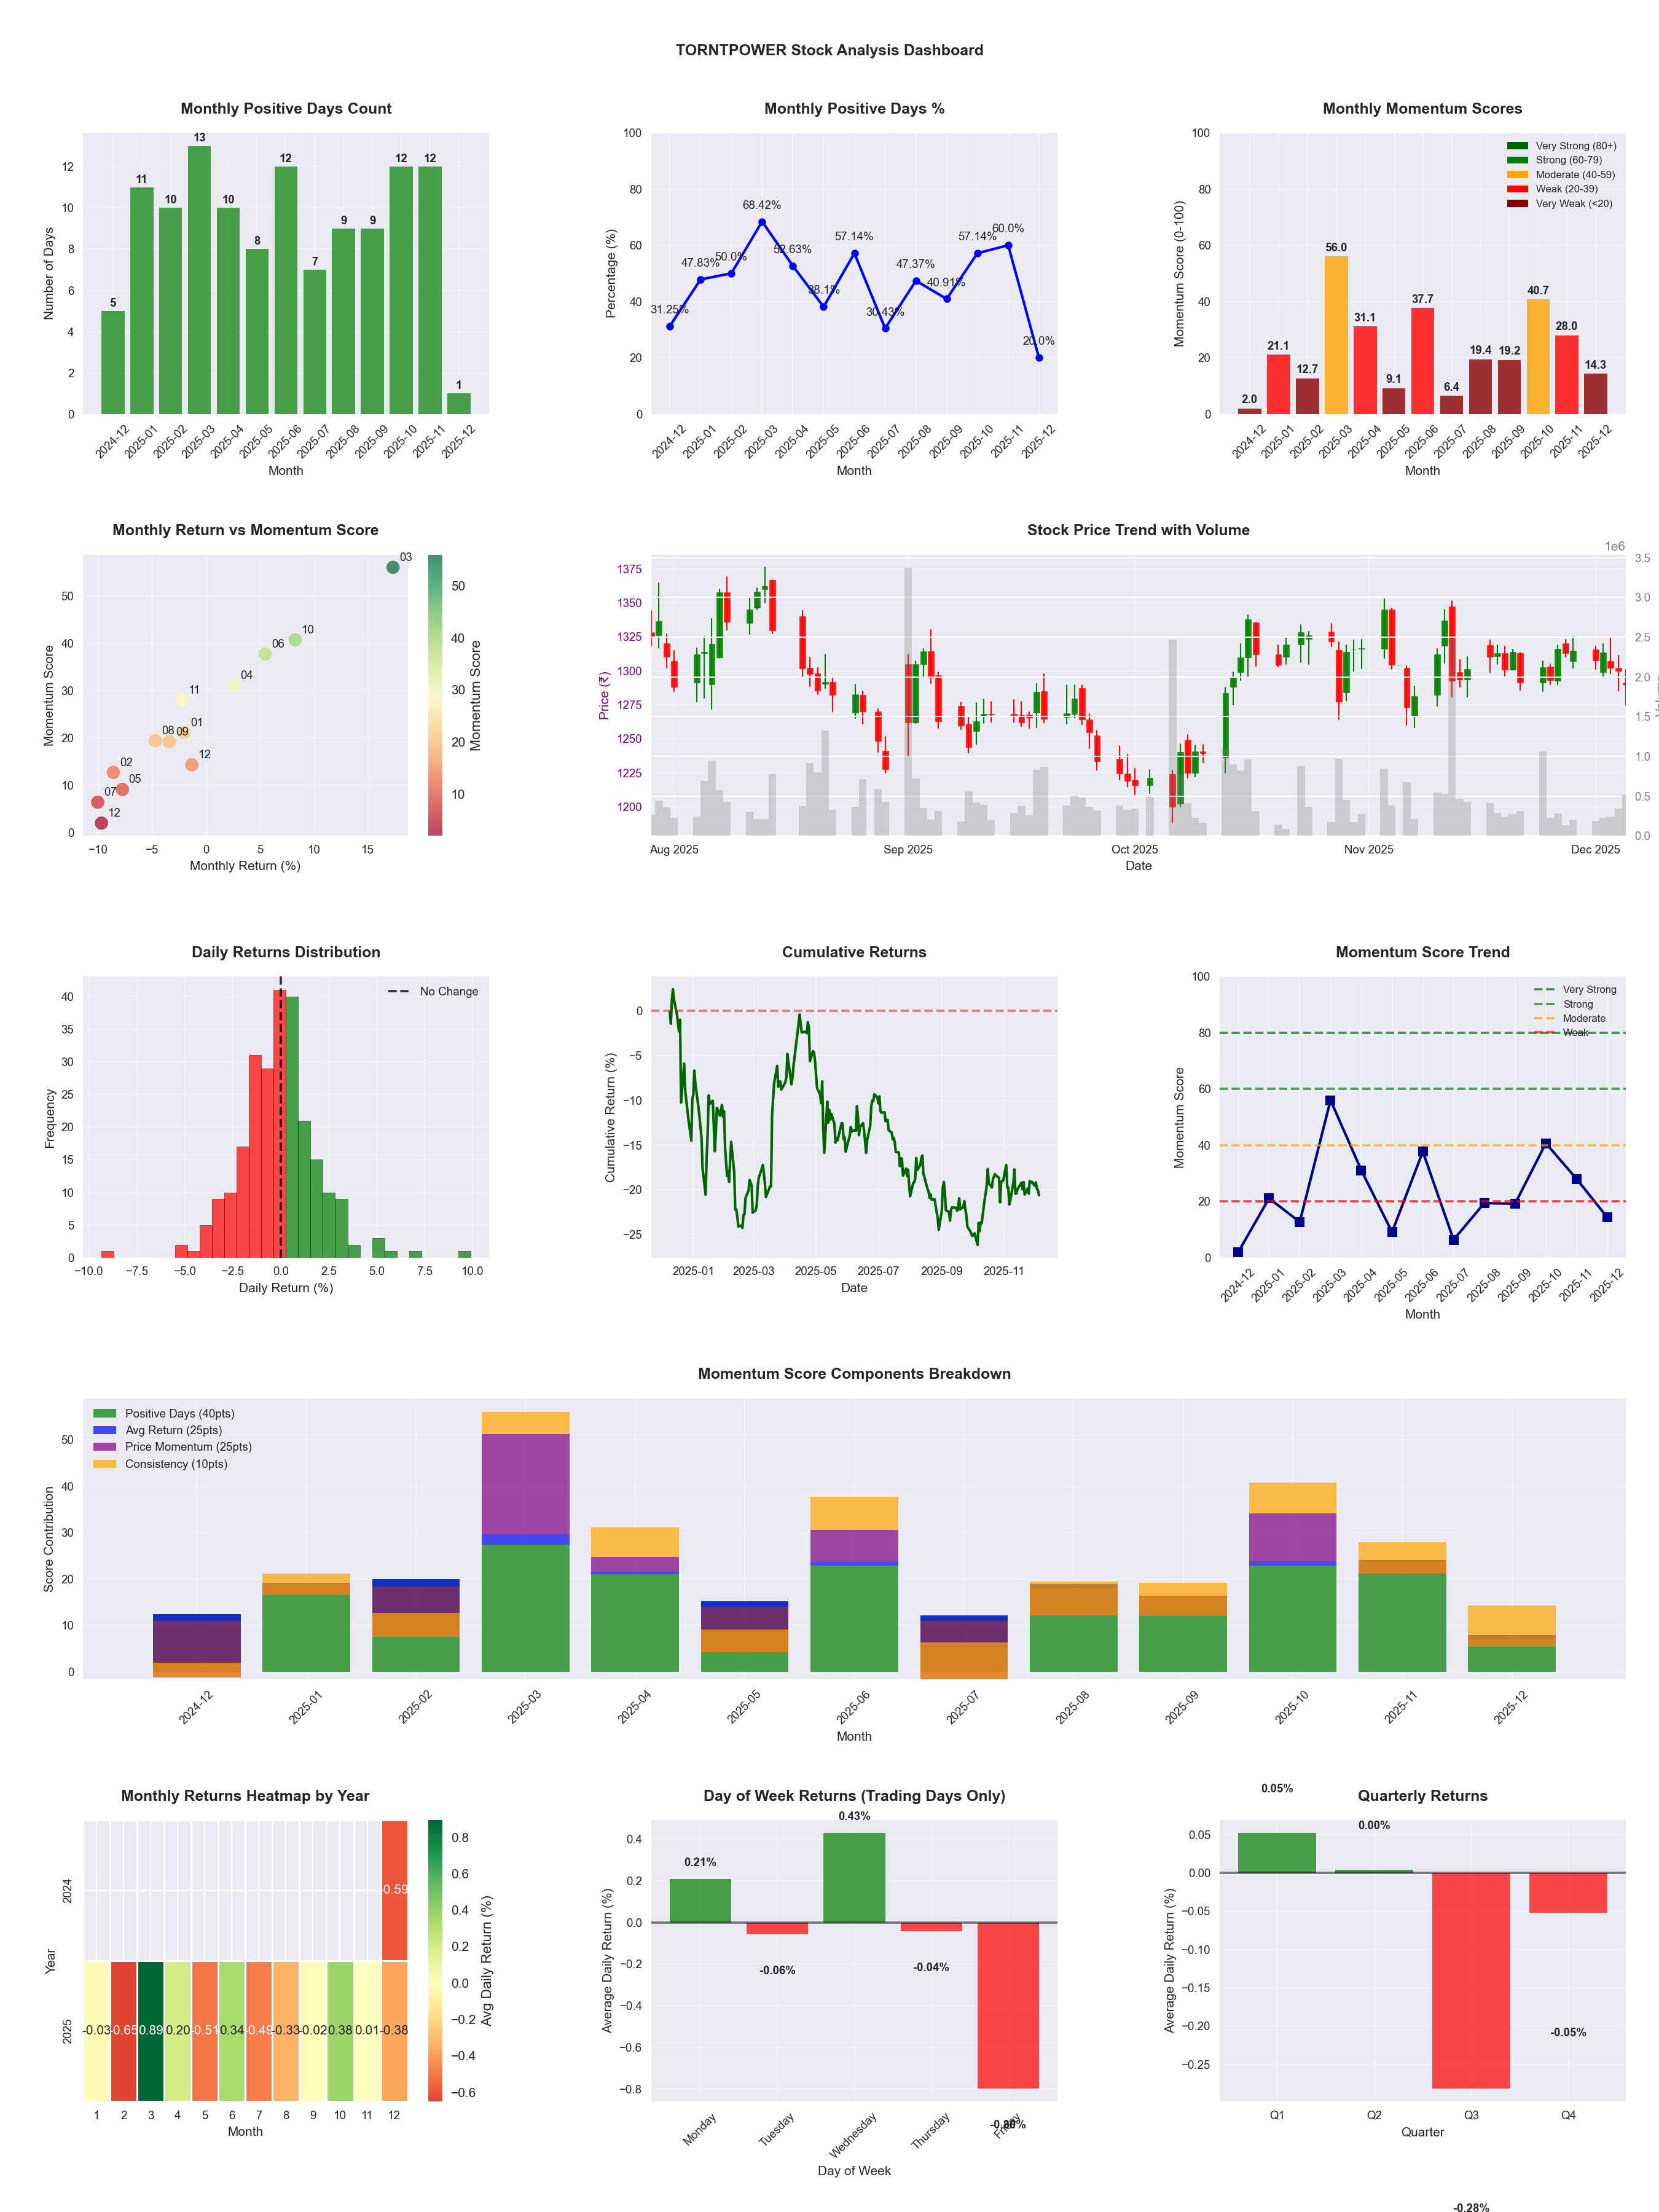
📊 Key Insights & Metrics
Symbol
📈 TORNTPOWER
Date
📅 2026-04-11
Volatility
🟡 1.85%
Win Rate
⚠️ 49.6%
Avg Daily Return
📉 -0.00%
Max Drawdown
📉 -25.83%
IBD RS Score
📊 75.3
Strong
Market Rank
#122
Best Month
🏆 2026-02
Best Months to Trade
📅 Feb, Apr, Oct
Best Days to Trade
📅 Wednesday, Tuesday
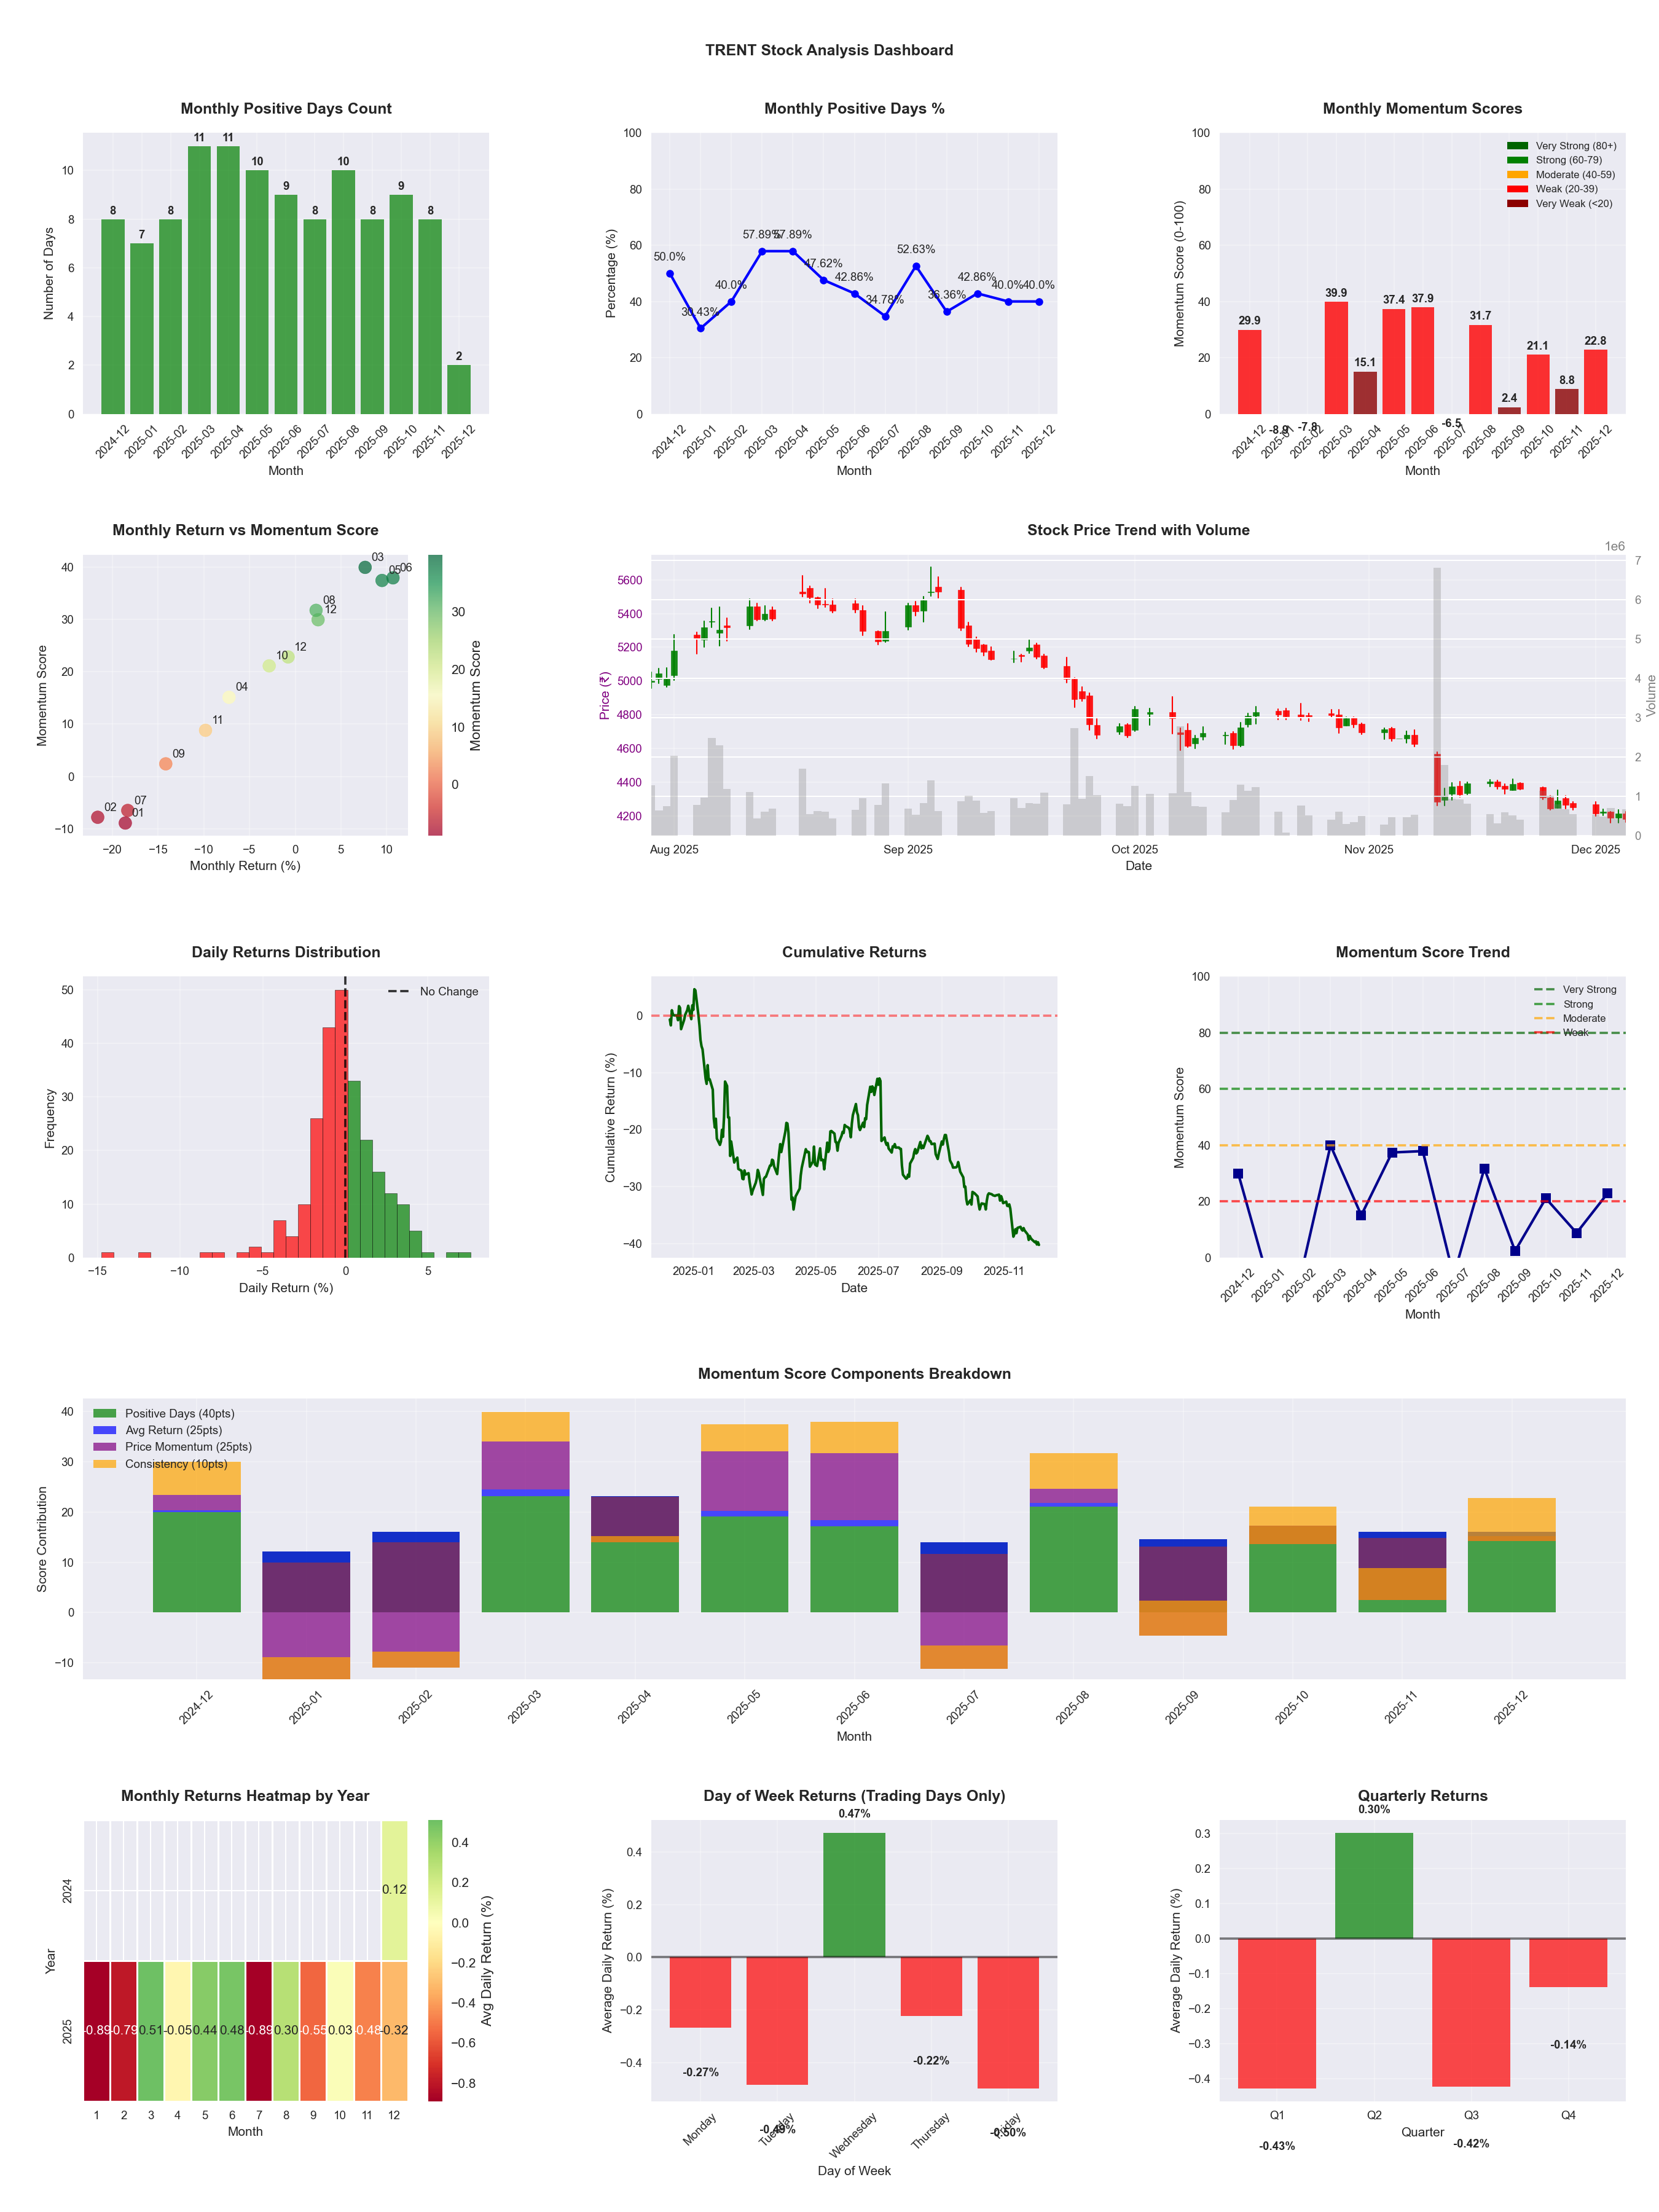
📊 Key Insights & Metrics
Symbol
📈 TRENT
Date
📅 2026-04-11
Volatility
🟡 2.14%
Risk Profile
⚠️ suitable for aggressive investors
Win Rate
⚠️ 45.1%
Avg Daily Return
📉 -0.06%
Max Drawdown
📉 -47.03%
IBD RS Score
📊 28.2
Weak
Market Rank
#354
Best Month
🏆 2026-04
Best Months to Trade
📅 Apr, Jun, May
Best Days to Trade
📅 Wednesday, Monday
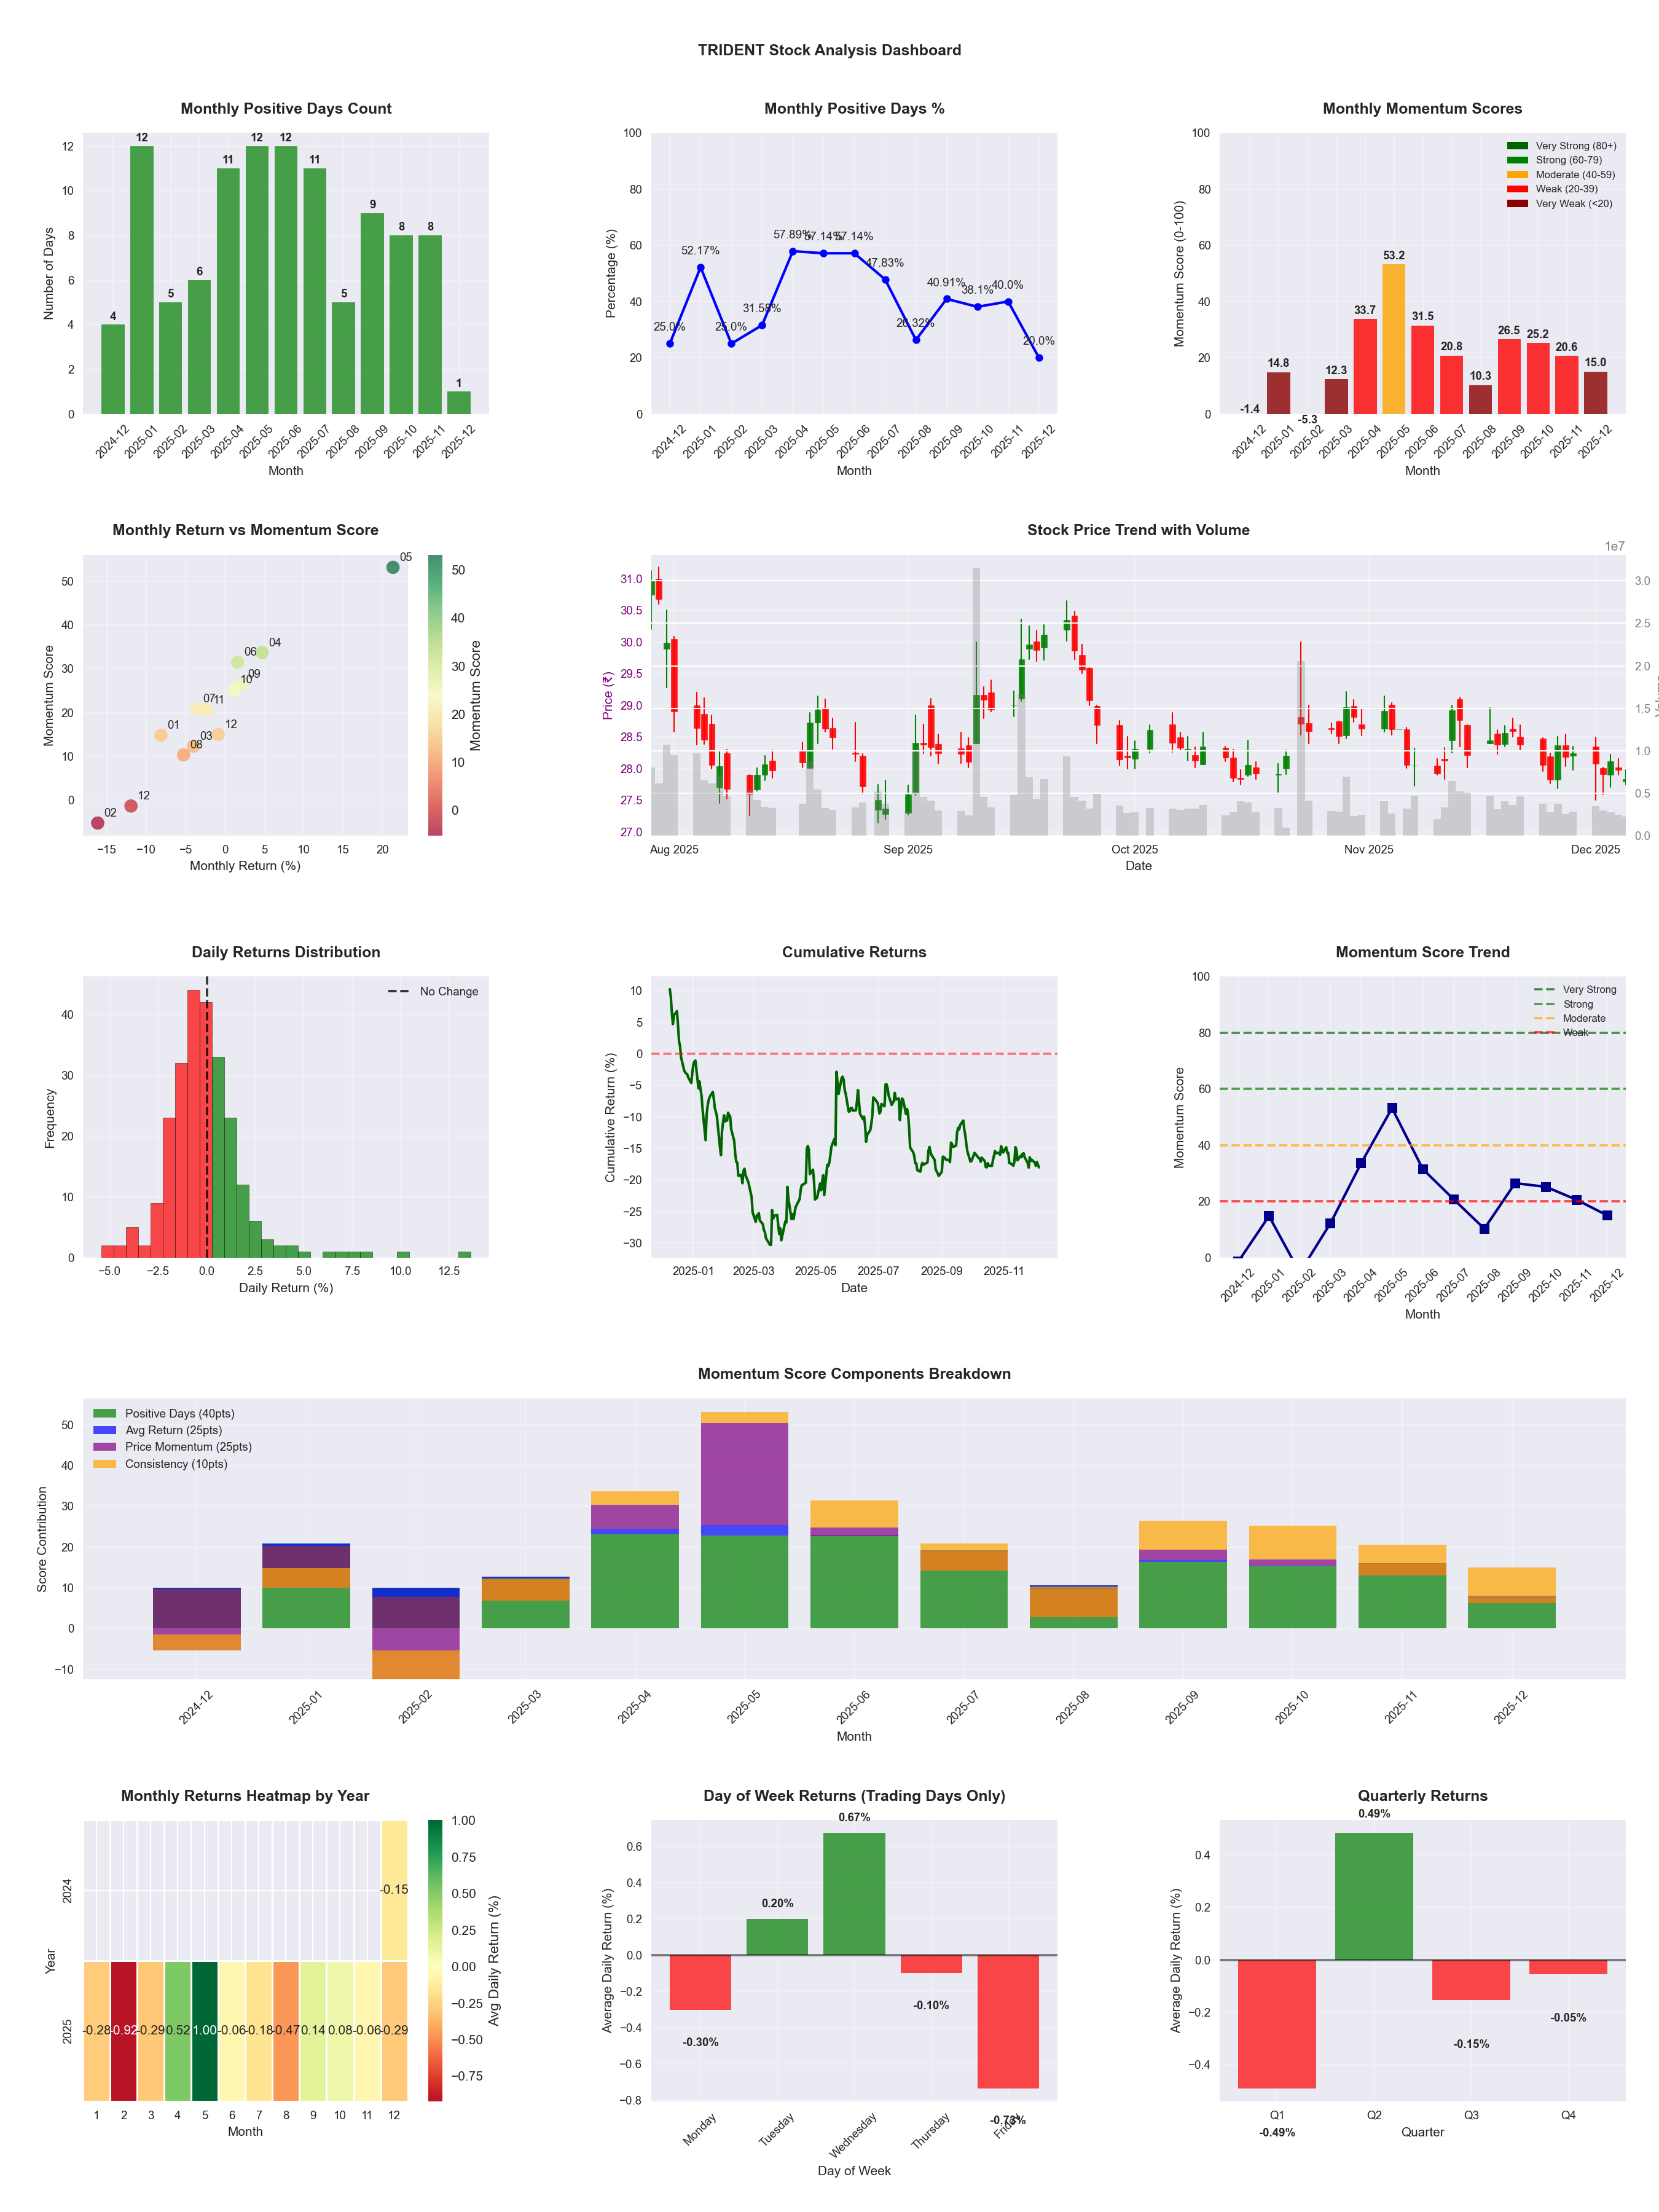
📊 Key Insights & Metrics
Symbol
📈 TRIDENT
Date
📅 2026-04-11
Volatility
🟡 2.25%
Risk Profile
⚠️ suitable for aggressive investors
Win Rate
⚠️ 43.1%
Avg Daily Return
📈 +0.02%
Max Drawdown
📉 -33.10%
IBD RS Score
📊 43.8
Weak
Market Rank
#277
Best Month
🏆 2025-05
Worst Month
📉 2026-03
Best Months to Trade
📅 May, Apr, Sep
Best Days to Trade
📅 Wednesday, Tuesday
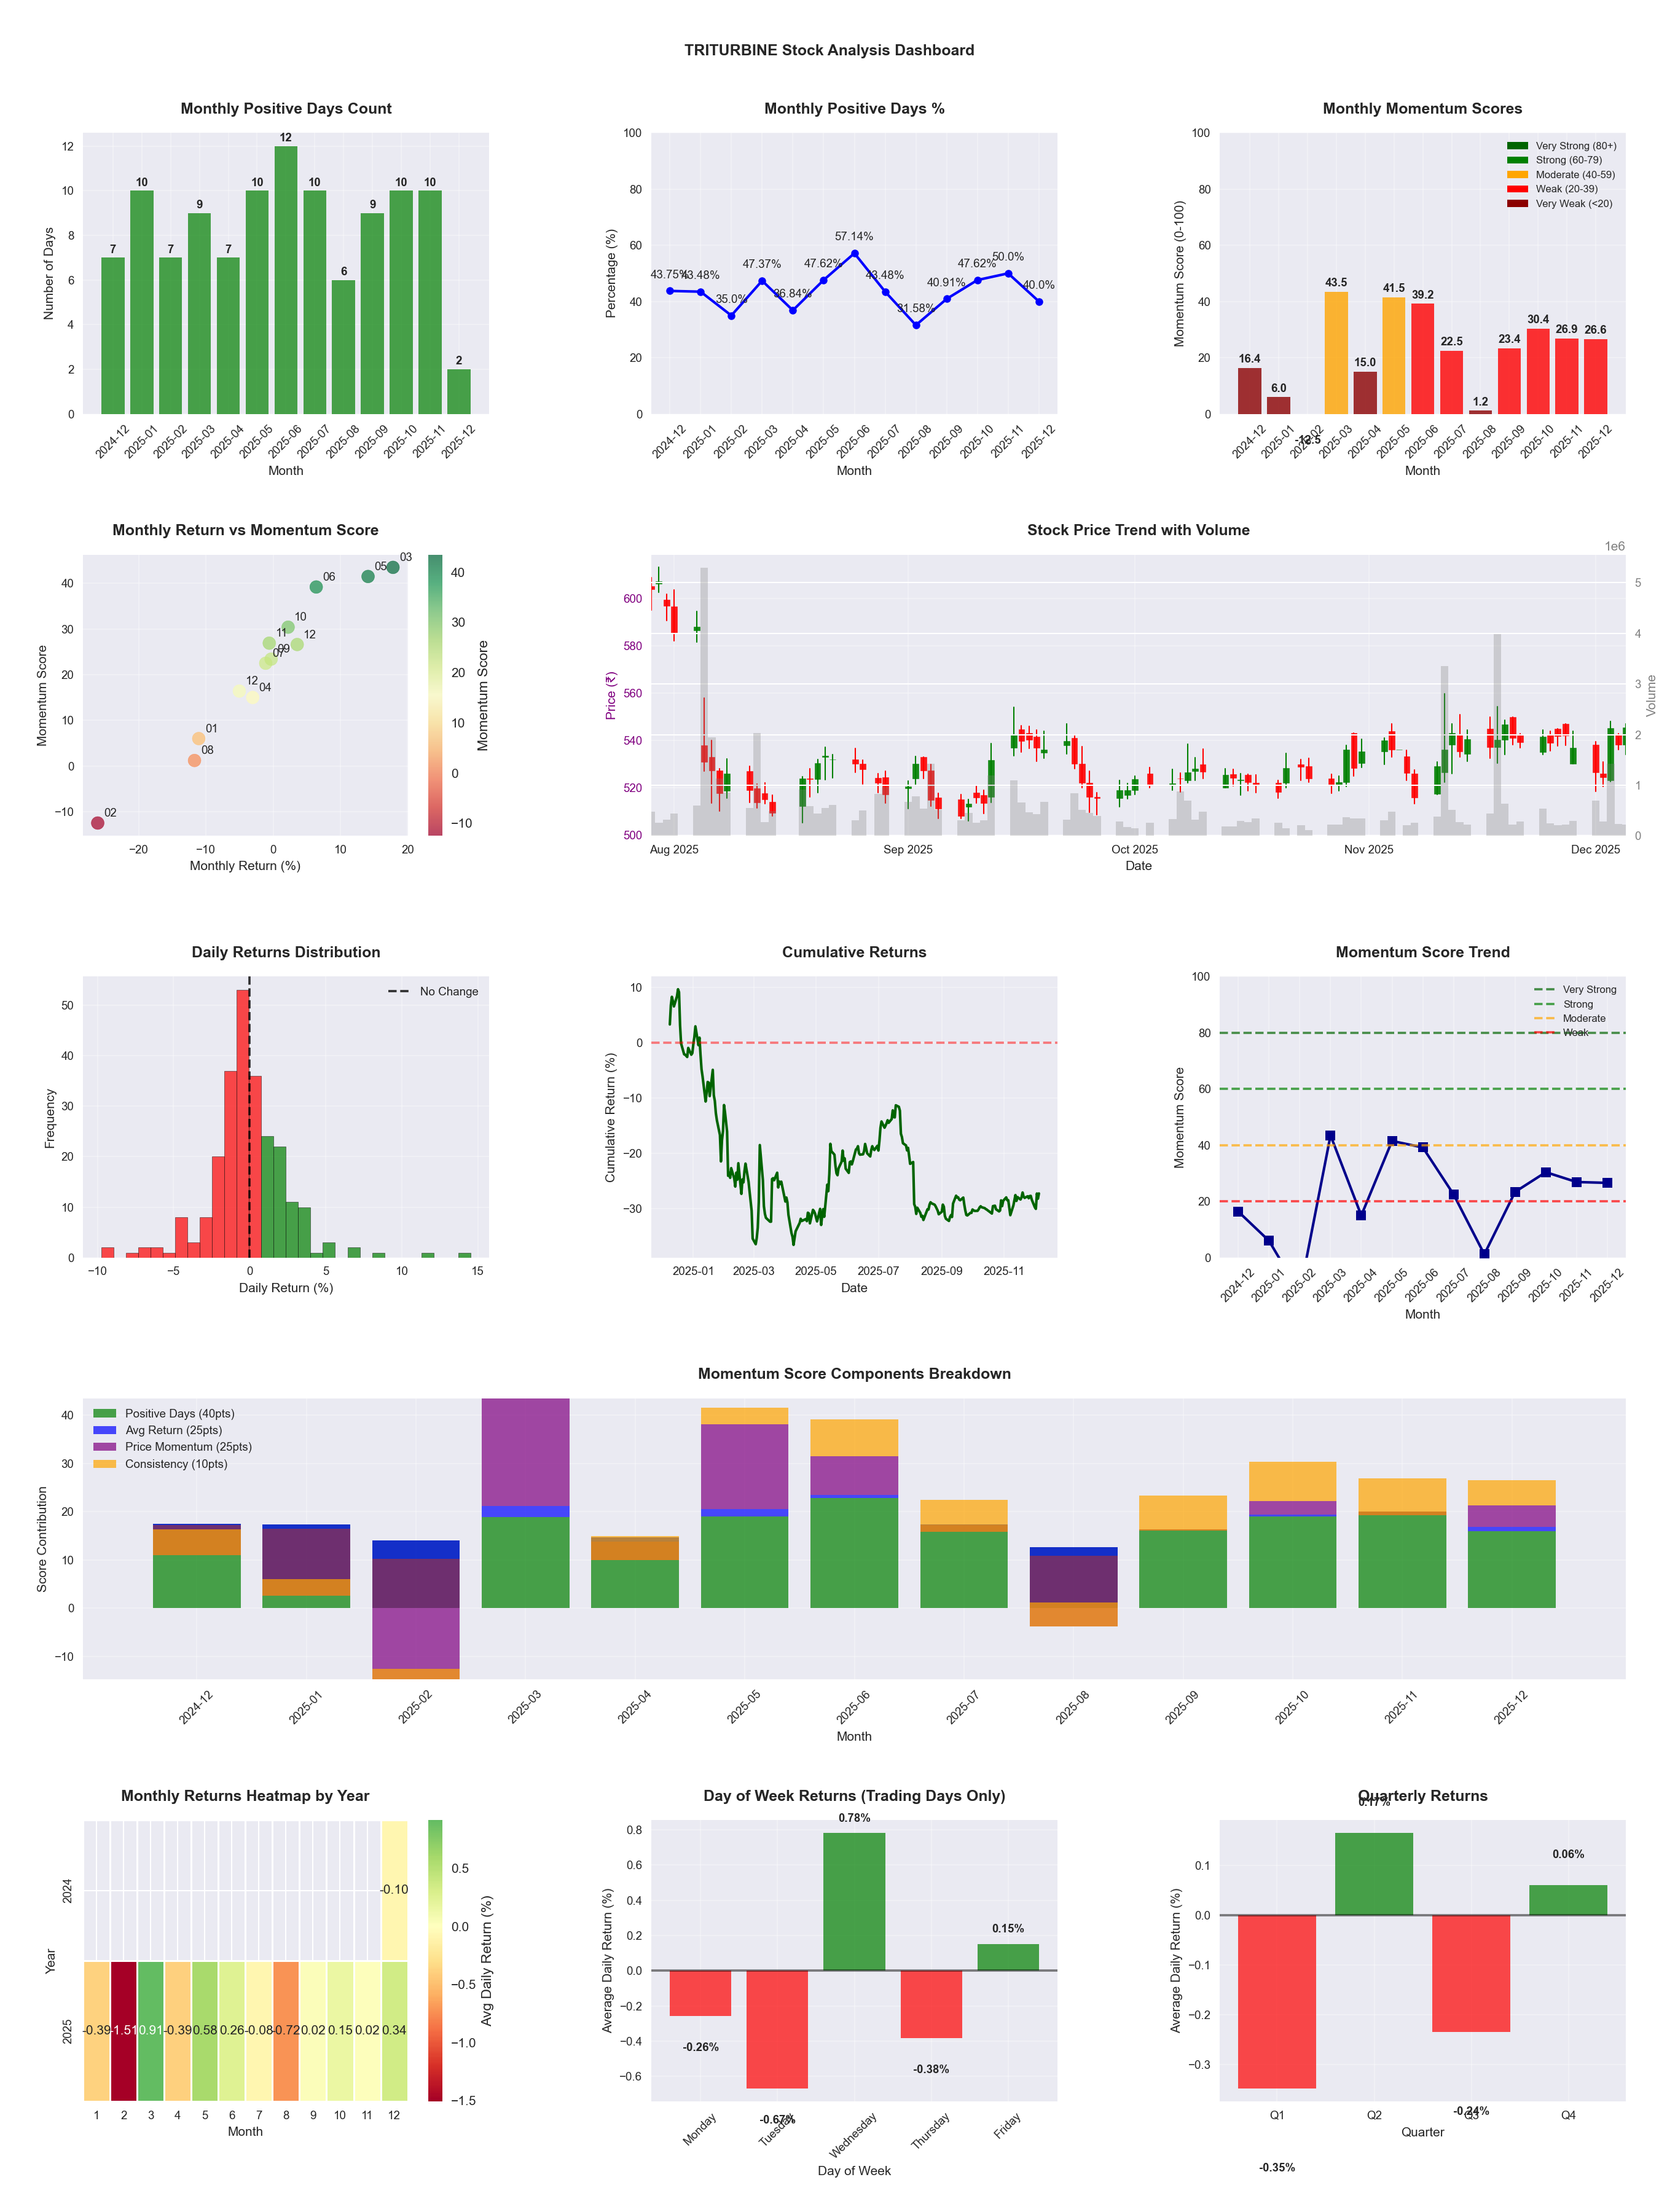
📊 Key Insights & Metrics
Symbol
📈 TRITURBINE
Date
📅 2026-04-11
Volatility
🟡 1.96%
Win Rate
⚠️ 45.5%
Avg Daily Return
📉 -0.01%
Max Drawdown
📉 -34.27%
IBD RS Score
📊 27.6
Weak
Market Rank
#357
Best Month
🏆 2025-05
Worst Month
📉 2025-08
Best Months to Trade
📅 May, Apr, Jun
Best Days to Trade
📅 Wednesday, Monday
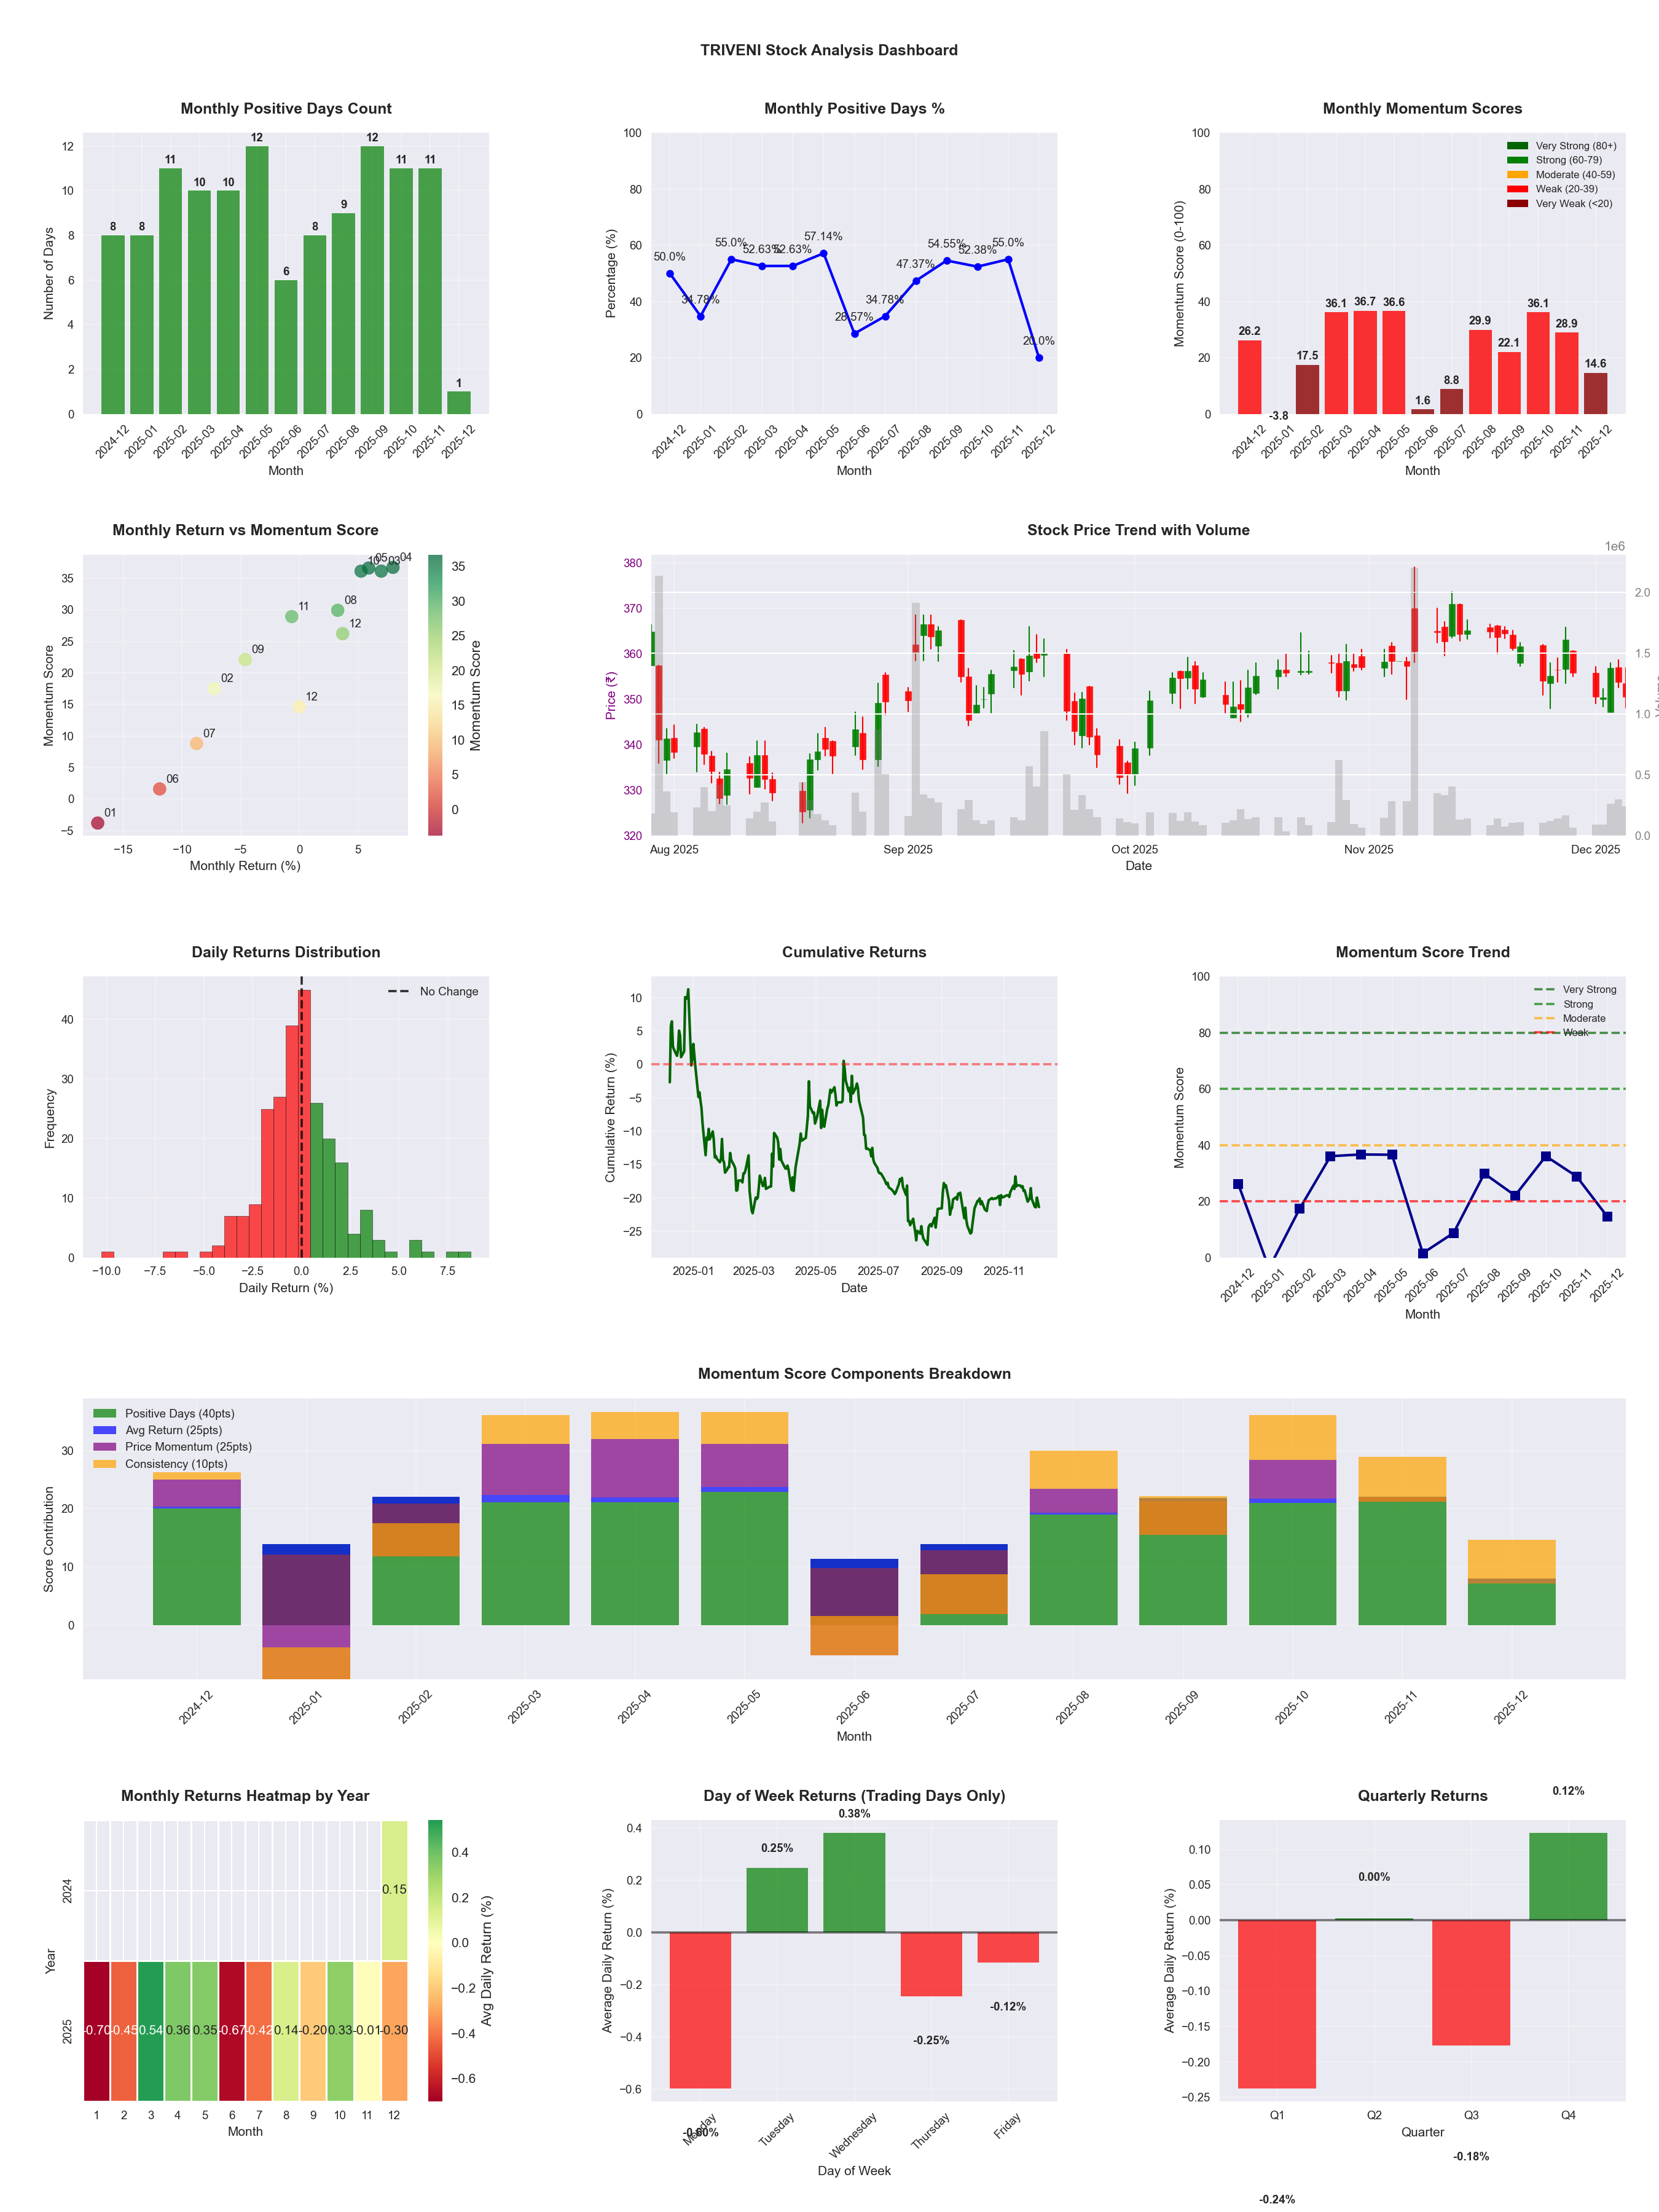
📊 Key Insights & Metrics
Symbol
📈 TRIVENI
Date
📅 2026-04-11
Volatility
🟡 2.13%
Risk Profile
⚠️ suitable for aggressive investors
Win Rate
⚠️ 44.7%
Avg Daily Return
📈 +0.03%
Max Drawdown
📉 -27.44%
IBD RS Score
📊 72.6
Strong
Market Rank
#135
Best Month
🏆 2025-12
Worst Month
📉 2025-06
Best Months to Trade
📅 Apr, Dec, May
Best Days to Trade
📅 Wednesday, Tuesday
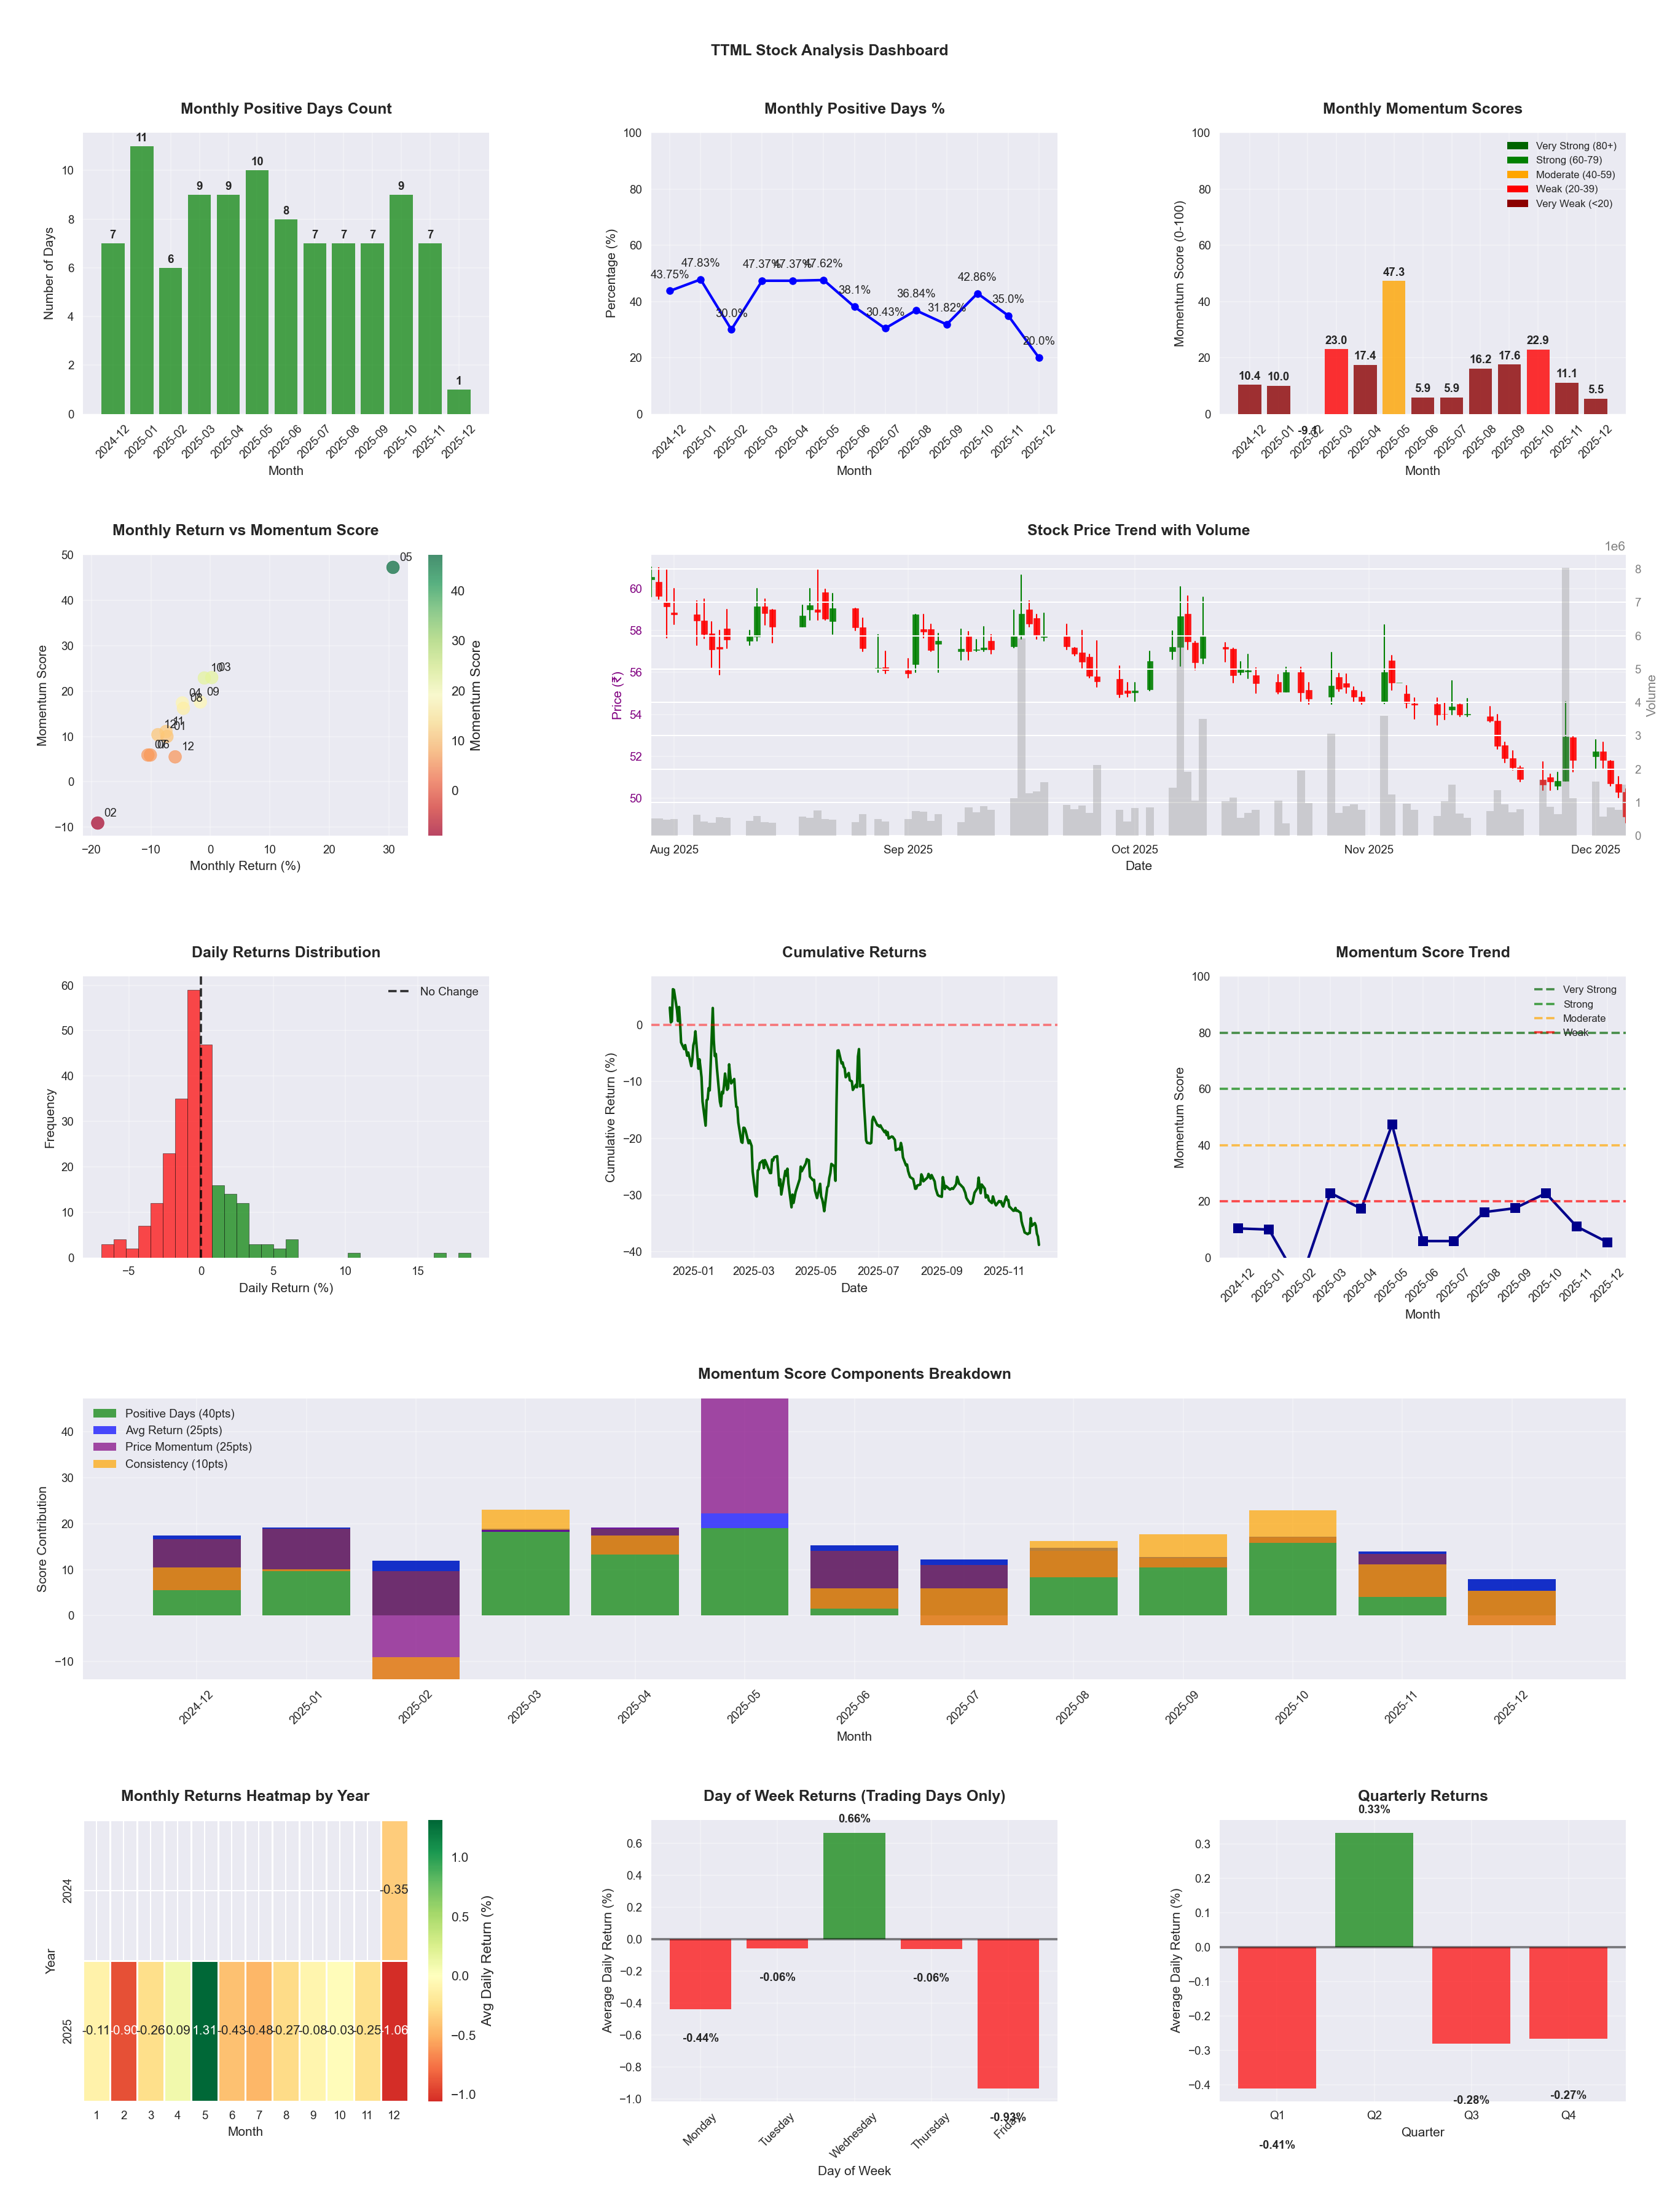
📊 Key Insights & Metrics
Symbol
📈 TTML
Date
📅 2026-04-11
Volatility
🟡 2.91%
Risk Profile
⚠️ suitable for aggressive investors
Win Rate
❌ 36.6%
Avg Daily Return
📉 -0.08%
Max Drawdown
📉 -59.22%
IBD RS Score
📊 11.4
Weak
Market Rank
#437
Best Month
🏆 2026-04
Best Months to Trade
📅 Apr, May, Oct
Best Days to Trade
📅 Wednesday, Tuesday
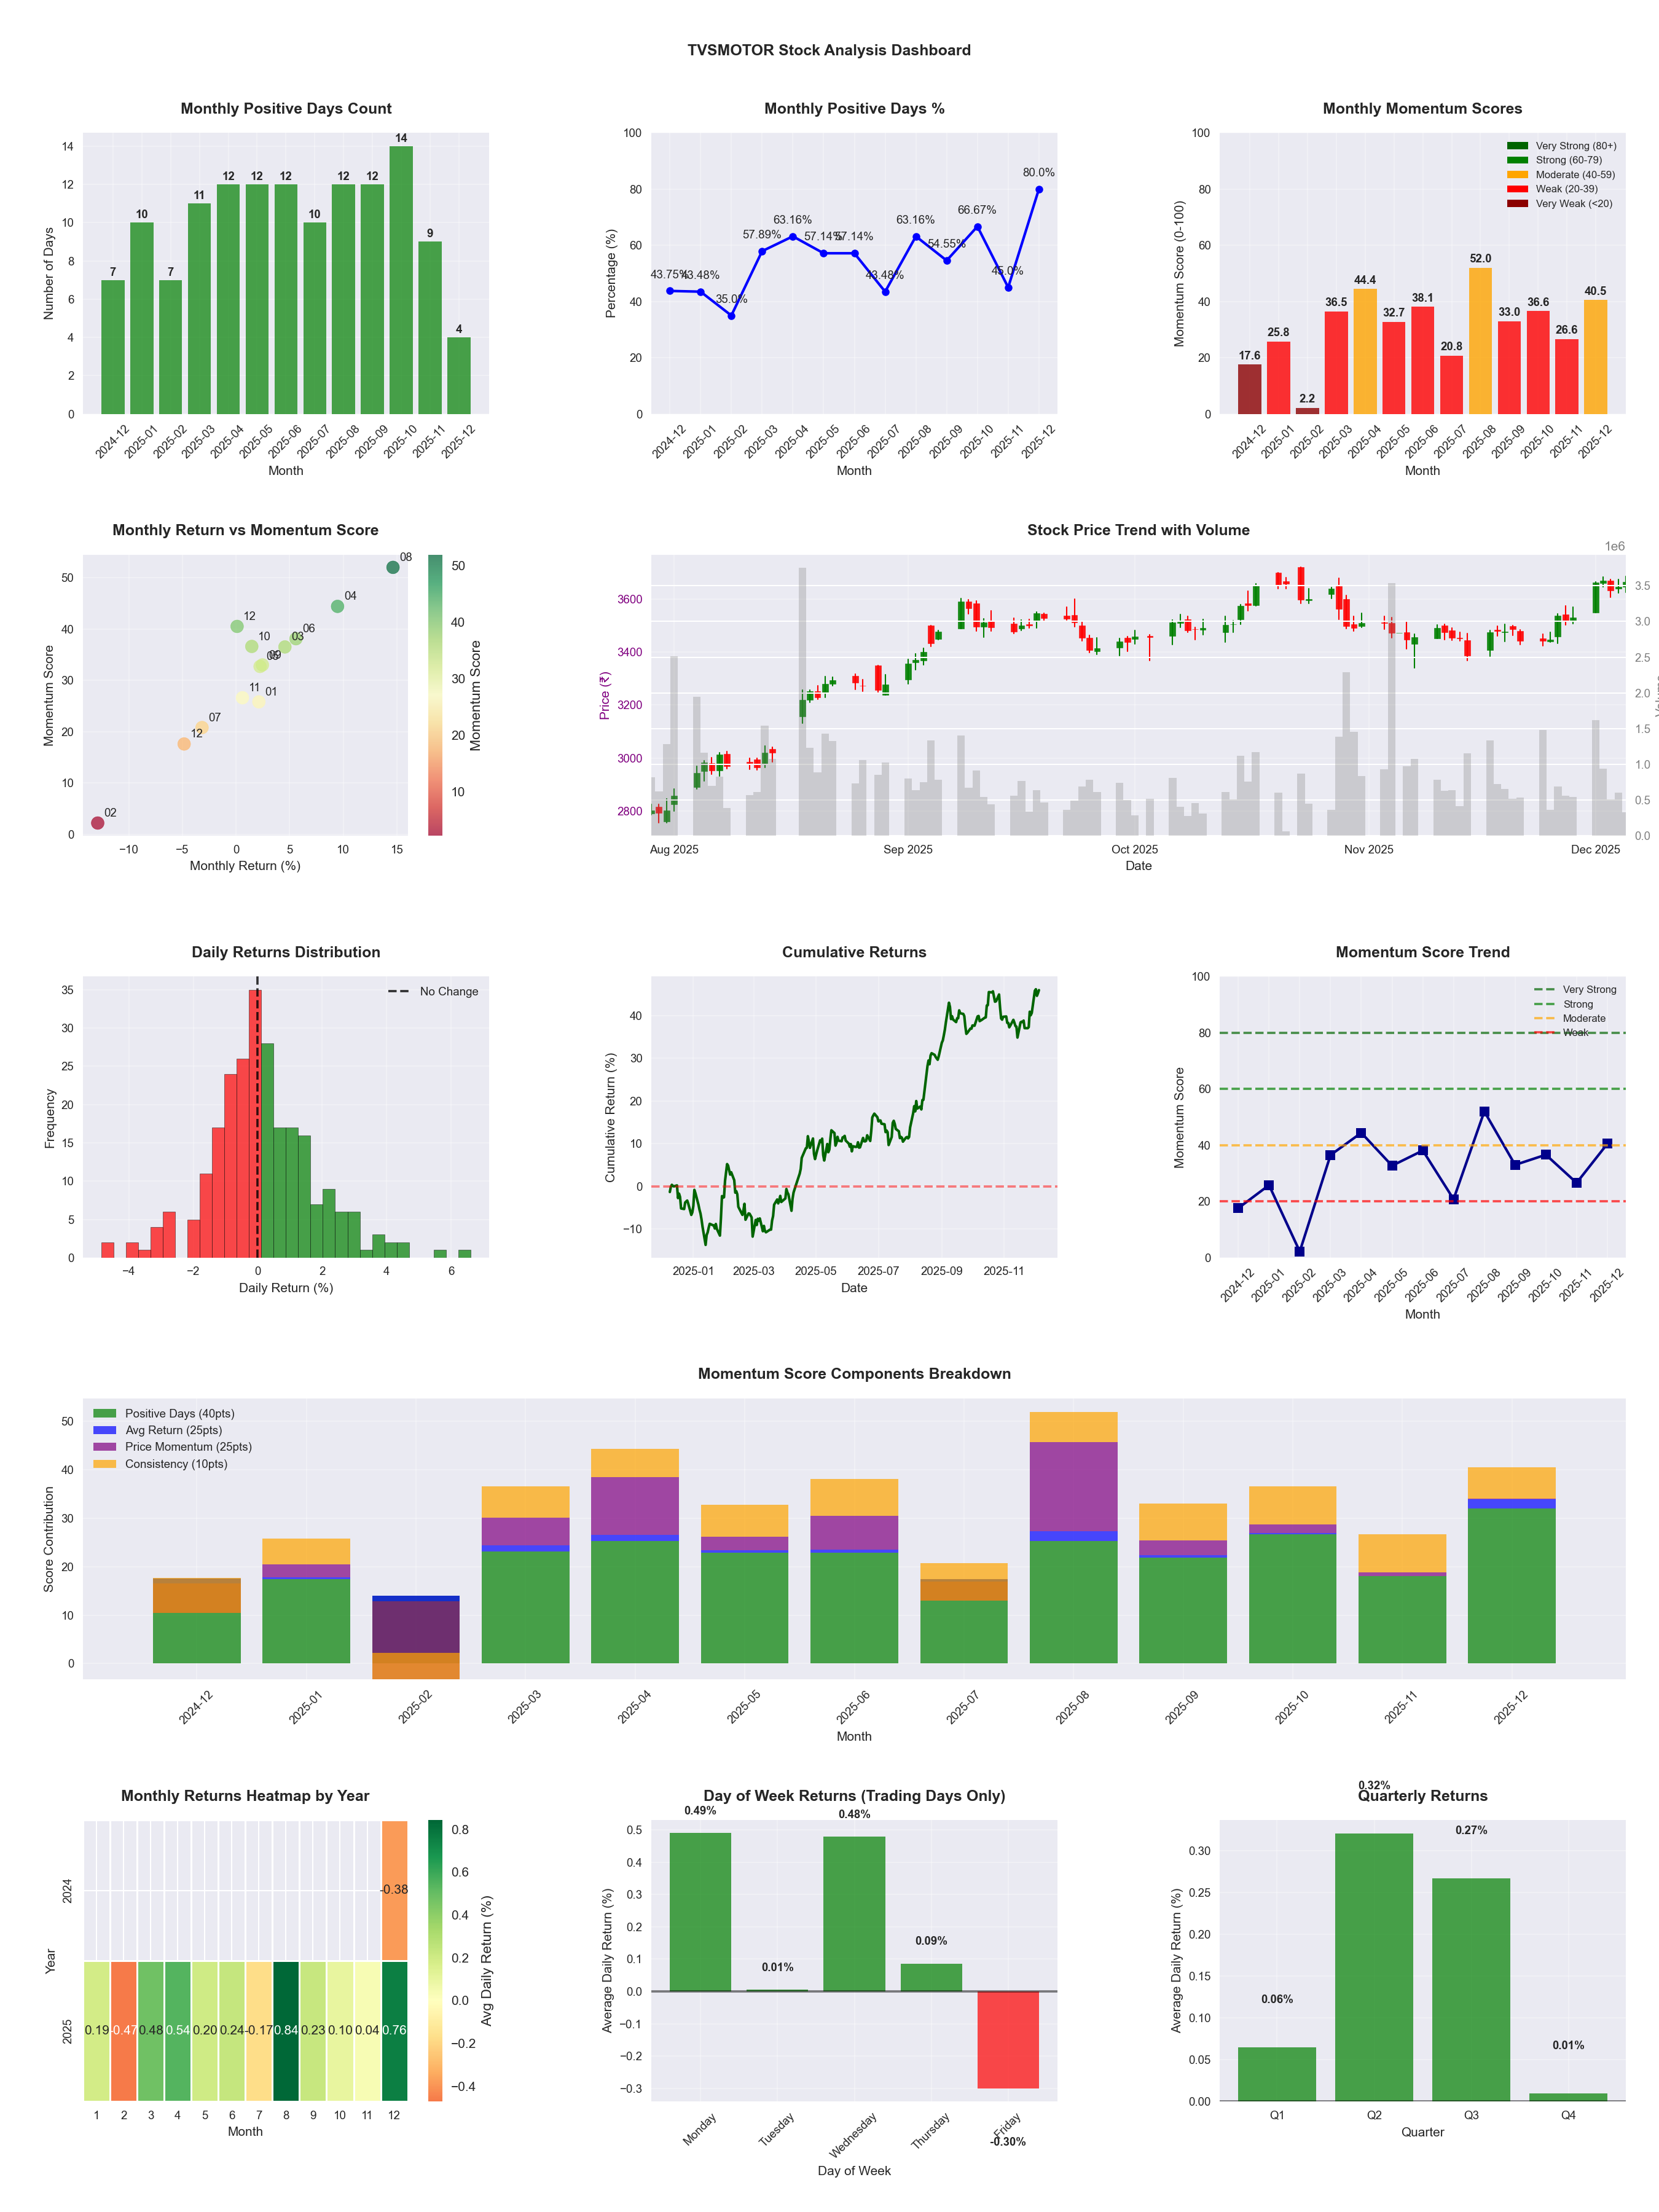
📊 Key Insights & Metrics
Symbol
📈 TVSMOTOR
Date
📅 2026-04-11
Volatility
🟡 1.63%
Win Rate
⚠️ 54.1%
Avg Daily Return
📈 +0.19%
Max Drawdown
📉 -15.92%
IBD RS Score
📊 86.8
Strong
Market Rank
#65
Best Month
🏆 2026-04
Worst Month
📉 2026-03
Best Months to Trade
📅 Apr, Aug, Feb
Best Days to Trade
📅 Monday, Wednesday
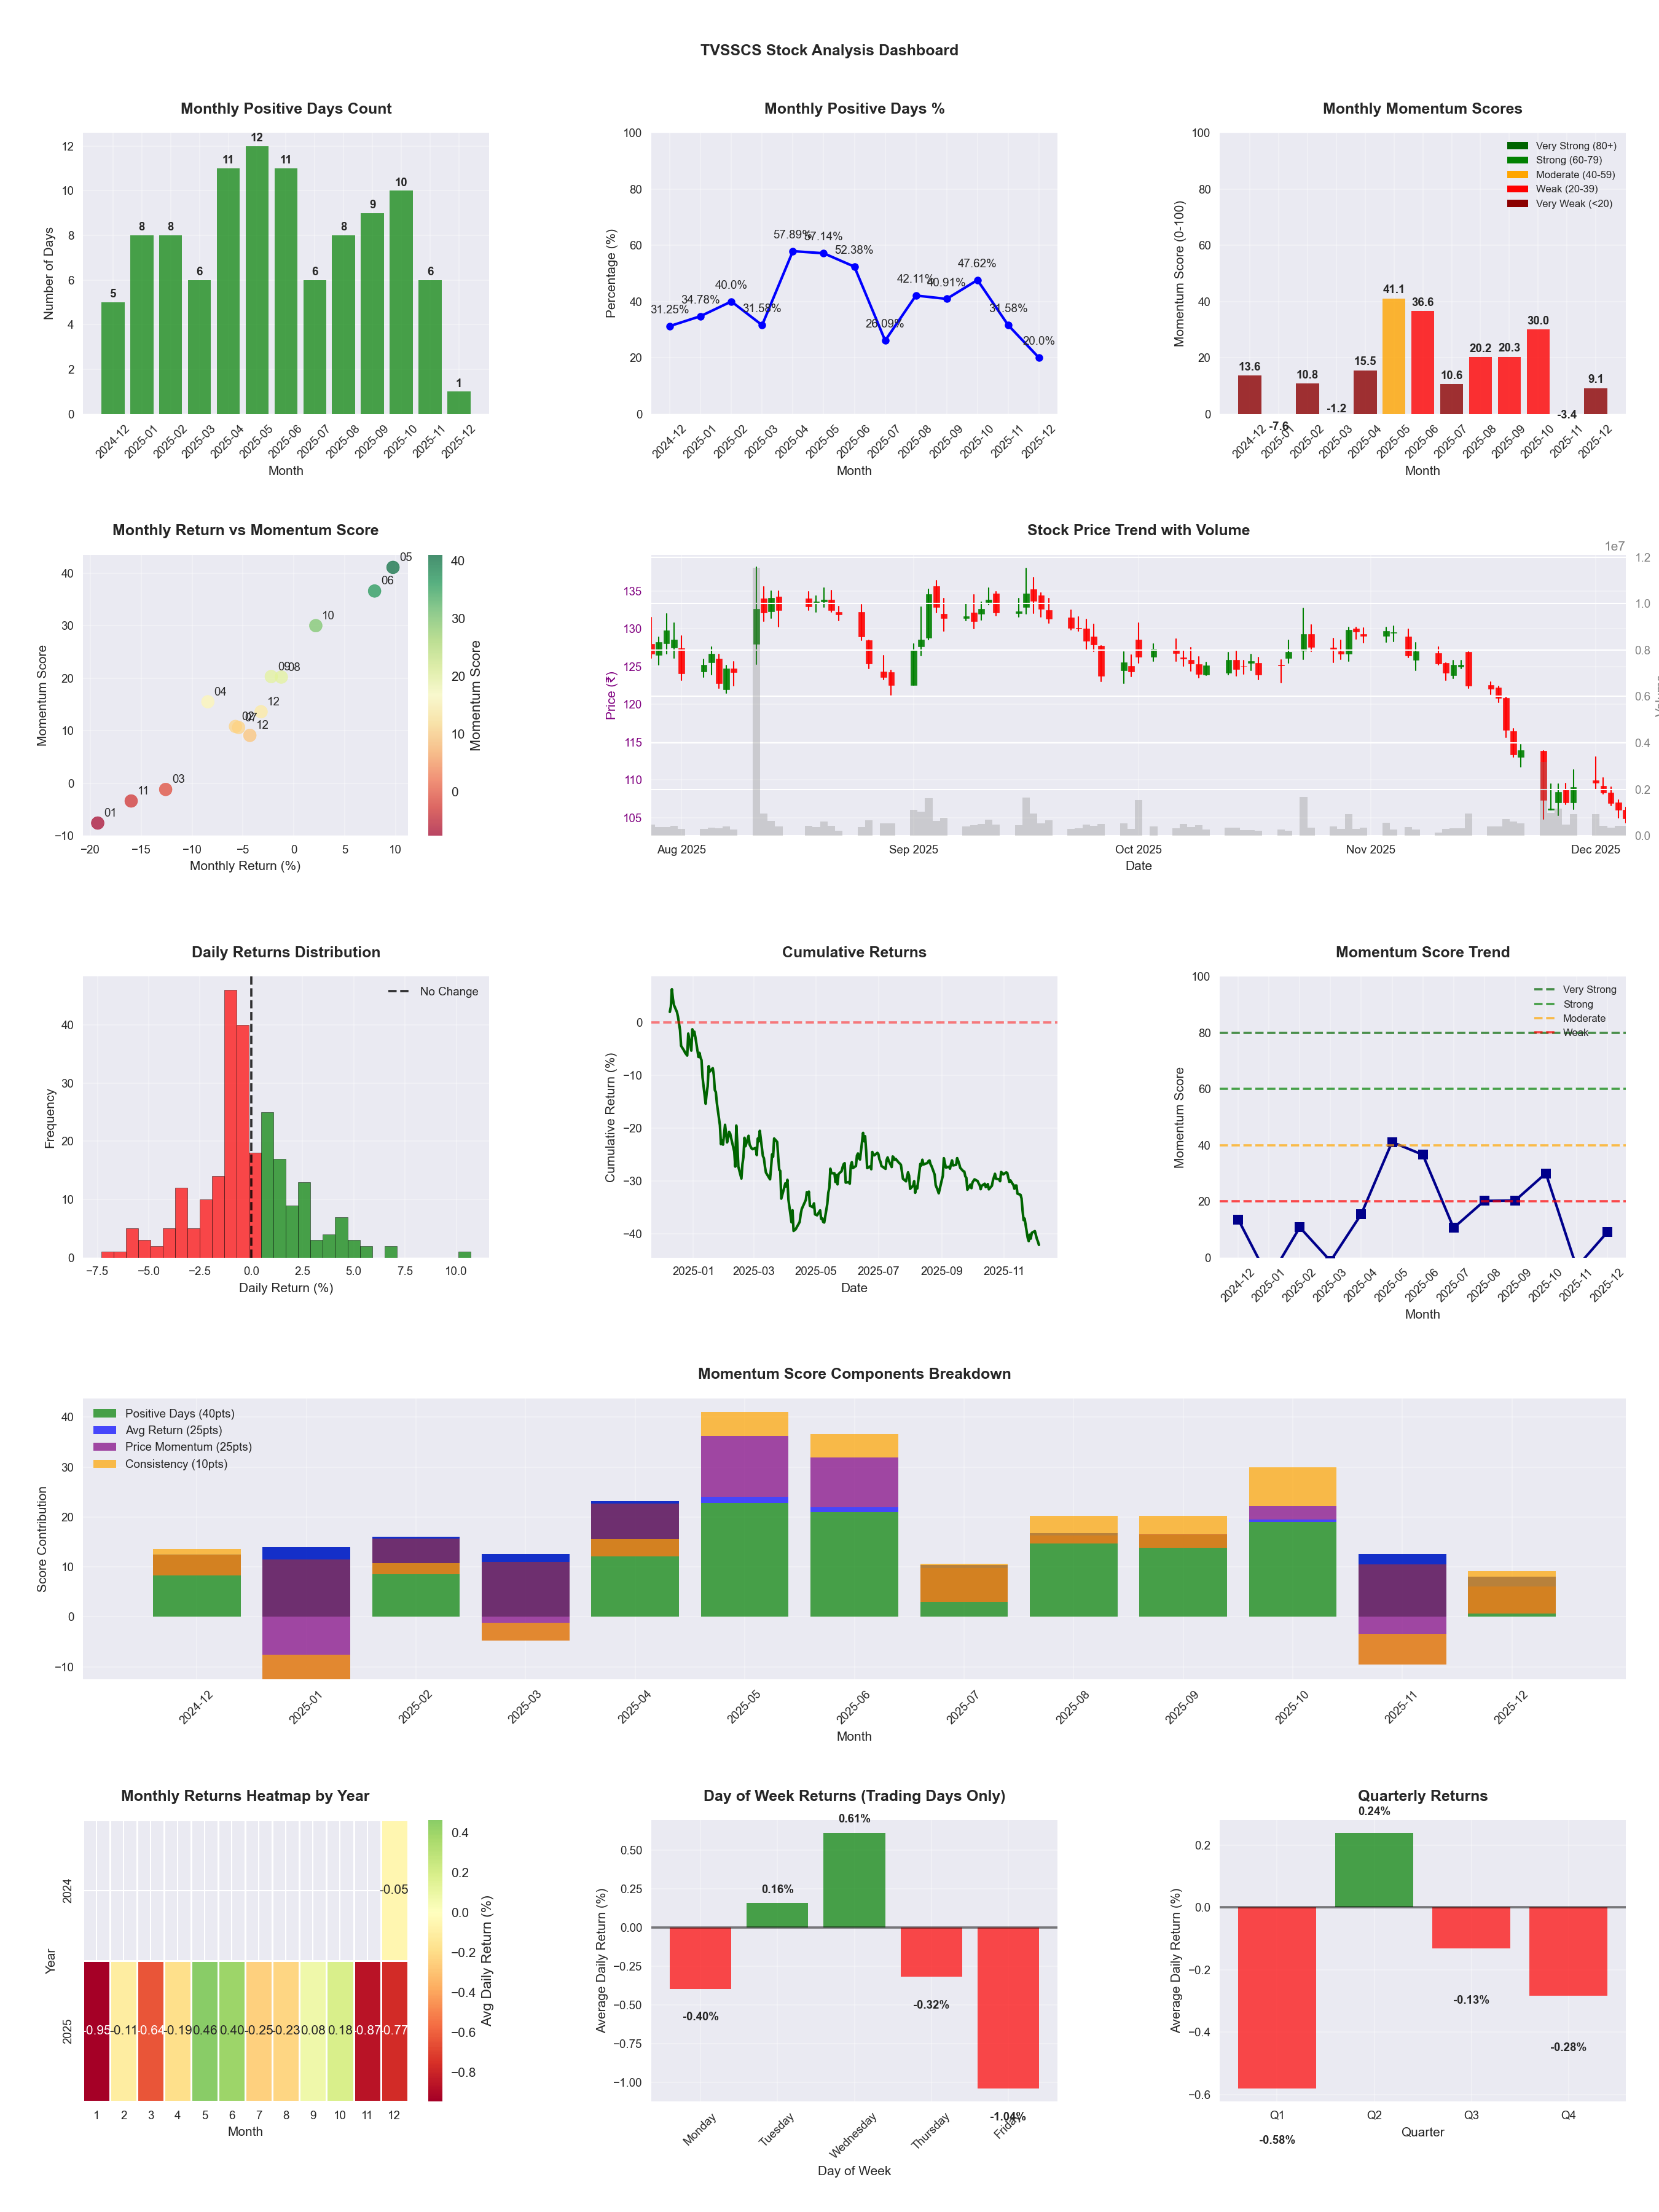
📊 Key Insights & Metrics
Symbol
📈 TVSSCS
Date
📅 2026-03-21
Volatility
🟡 2.41%
Risk Profile
⚠️ suitable for aggressive investors
Win Rate
⚠️ 43.9%
Avg Daily Return
📉 -0.11%
Max Drawdown
📉 -34.44%
Best Month
🏆 2026-02
Best Months to Trade
📅 Feb, May, Jun
Best Days to Trade
📅 Wednesday, Tuesday
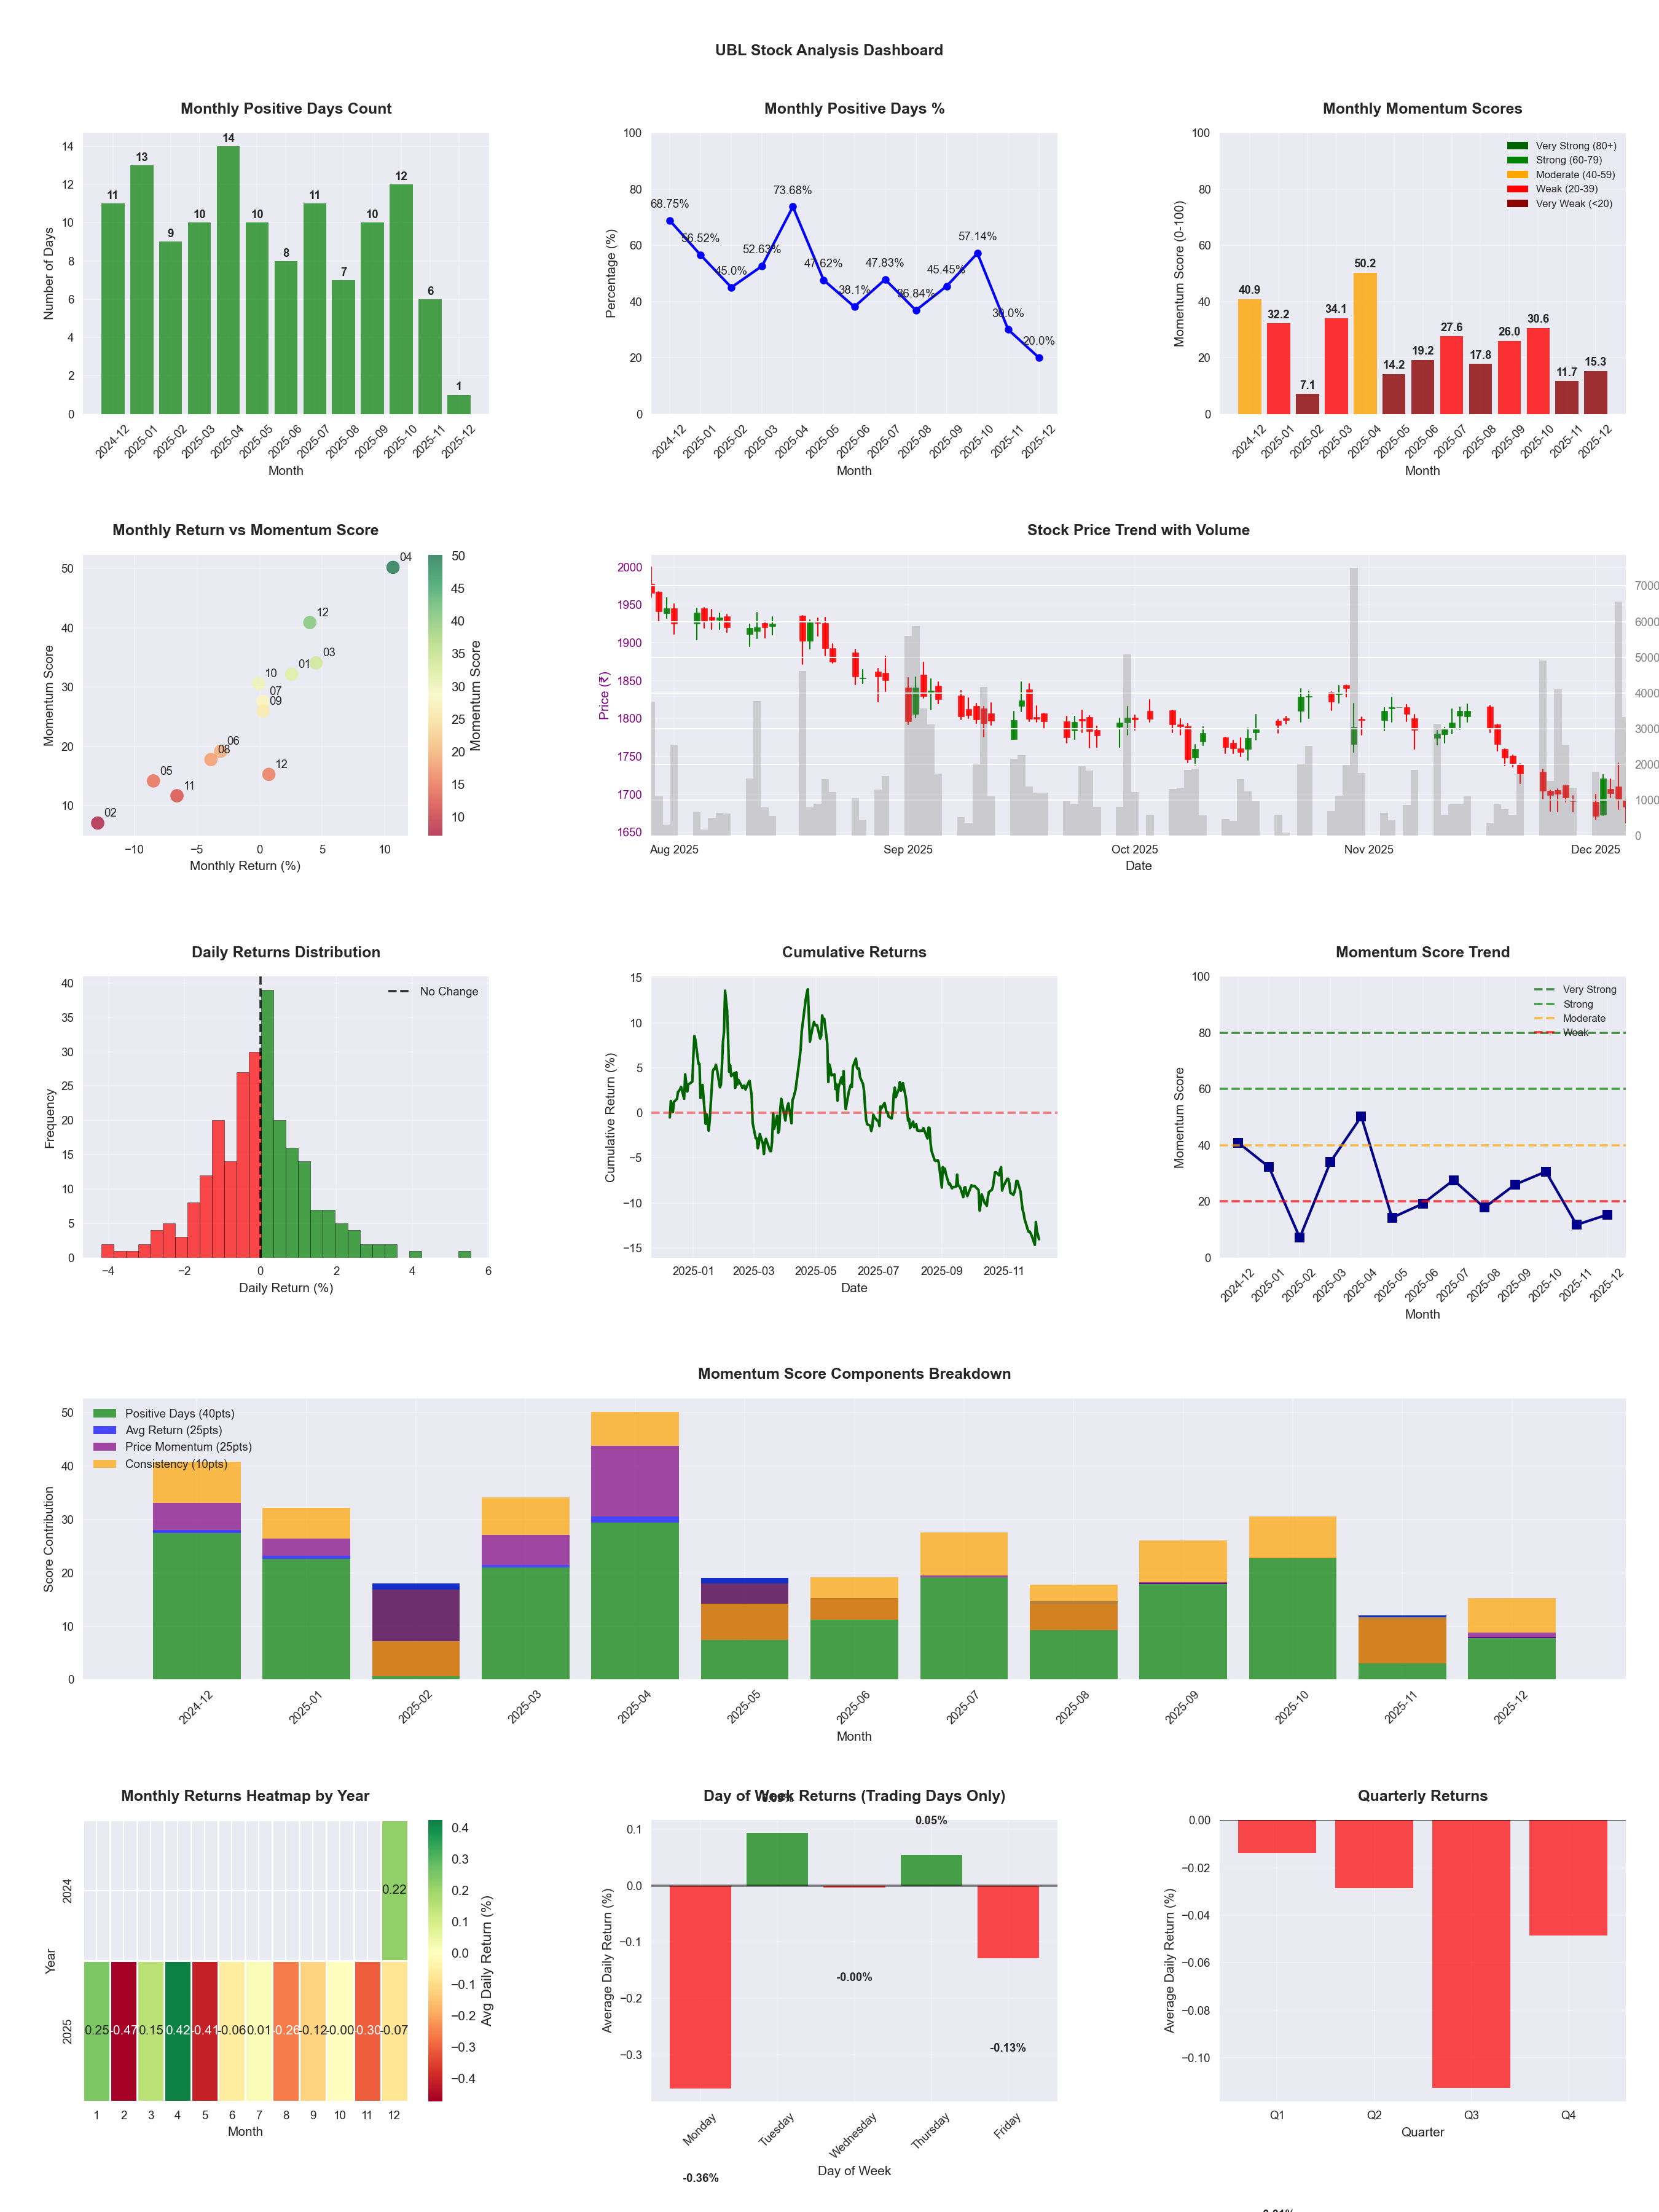
📊 Key Insights & Metrics
Symbol
📈 UBL
Date
📅 2026-04-11
Volatility
🟢 1.39%
Win Rate
⚠️ 43.1%
Avg Daily Return
📉 -0.12%
Max Drawdown
📉 -36.09%
IBD RS Score
📊 18.7
Weak
Market Rank
#401
Best Month
🏆 2026-02
Worst Month
📉 2026-04
Best Months to Trade
📅 Feb, Apr, Jul
Best Days to Trade
📅 Tuesday, Wednesday
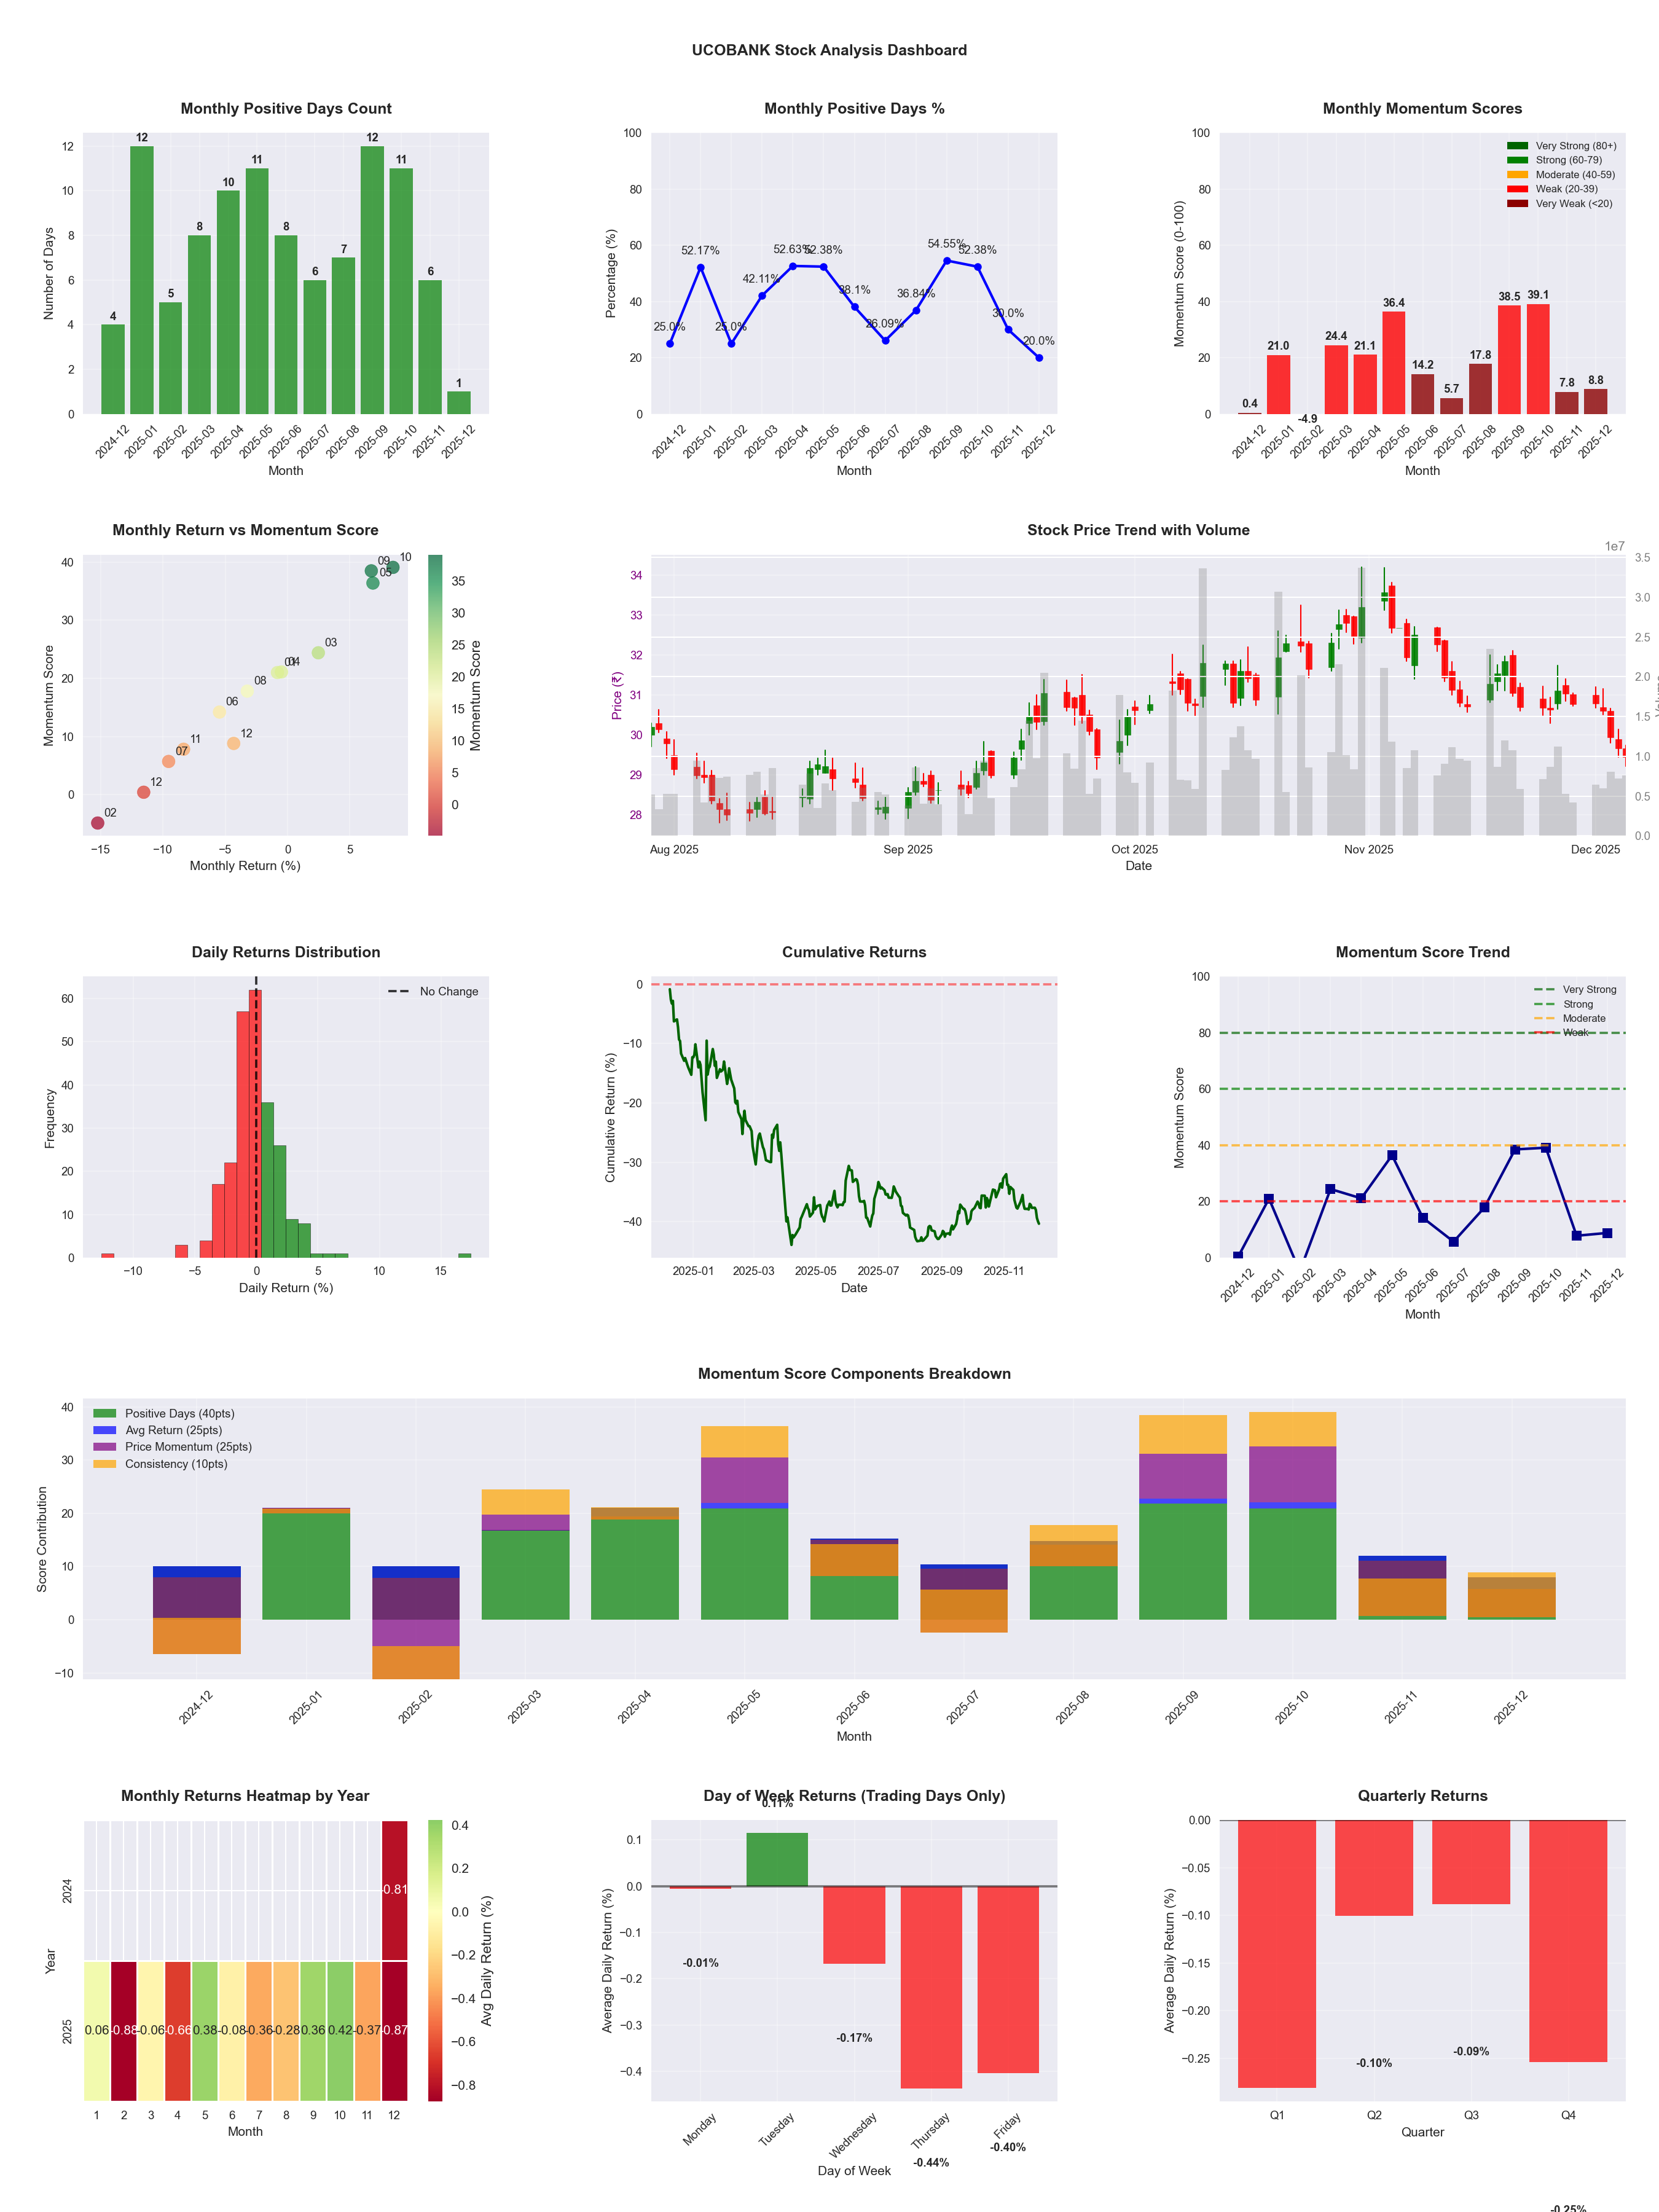
📊 Key Insights & Metrics
Symbol
📈 UCOBANK
Date
📅 2026-04-11
Volatility
🟡 1.81%
Win Rate
⚠️ 44.7%
Avg Daily Return
📉 -0.02%
Max Drawdown
📉 -34.49%
IBD RS Score
📊 30.6
Weak
Market Rank
#342
Best Month
🏆 2026-04
Best Months to Trade
📅 Apr, Oct, May
Best Days to Trade
📅 Wednesday, Tuesday
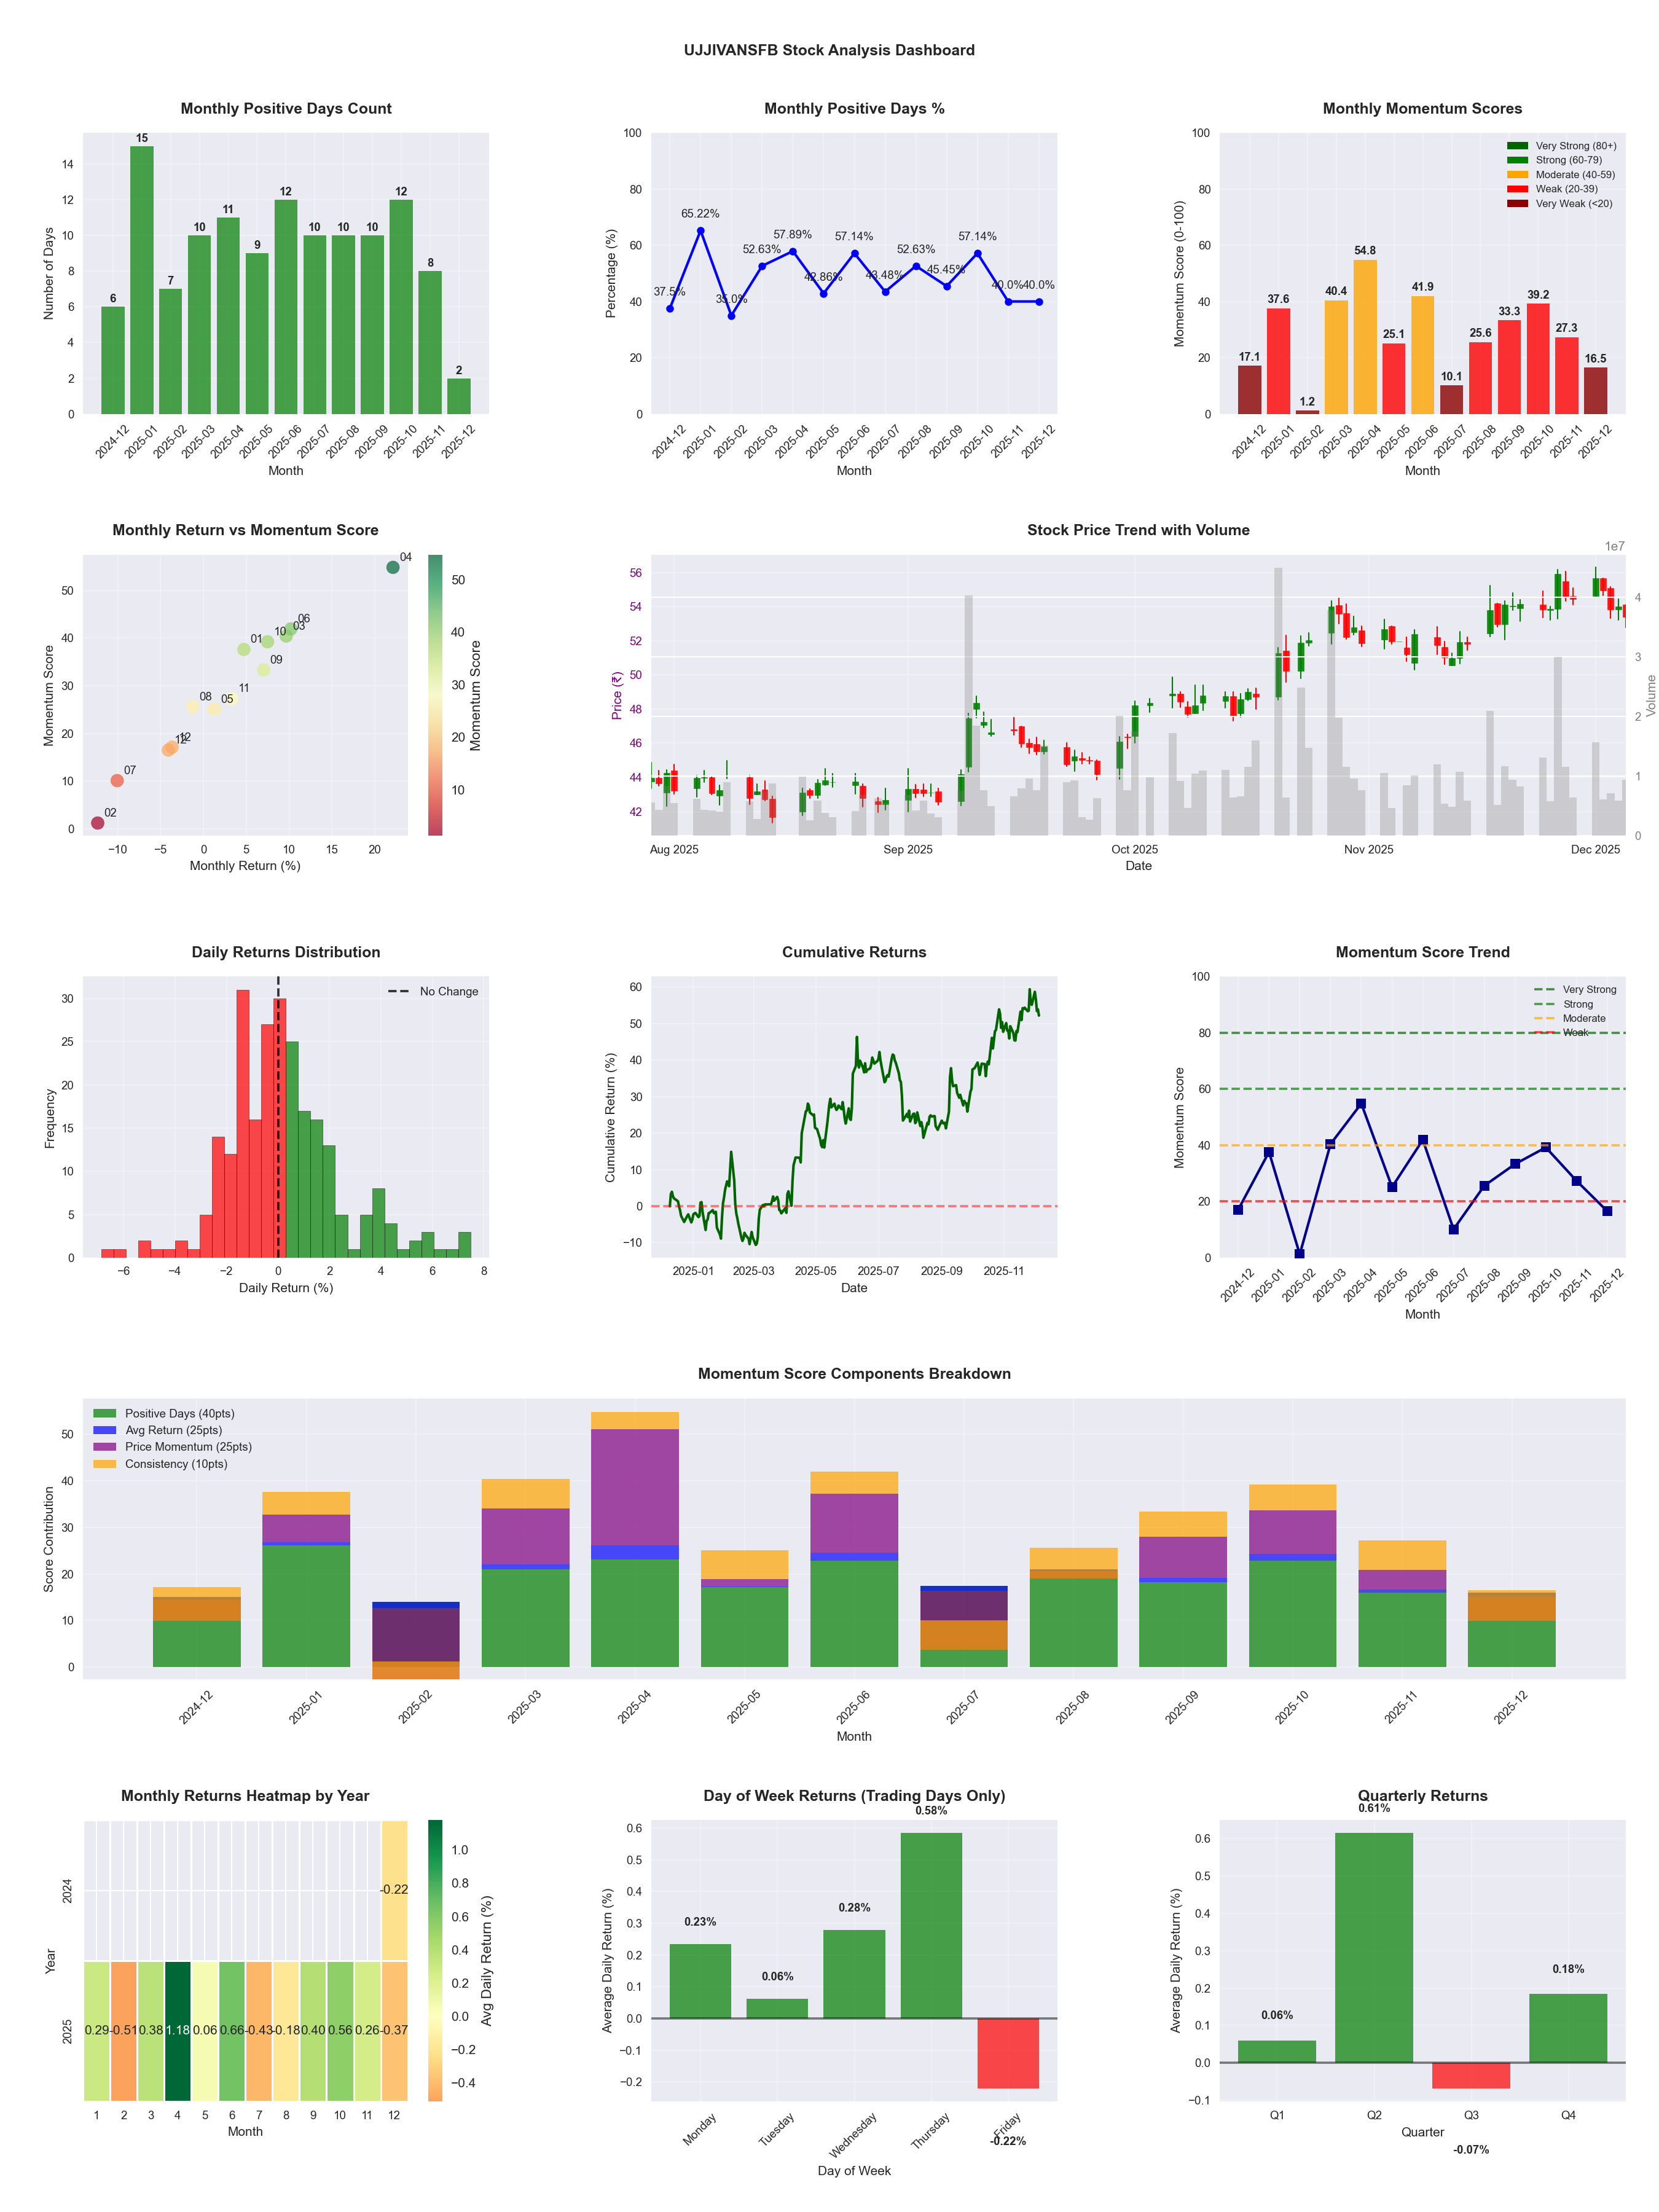
📊 Key Insights & Metrics
Symbol
📈 UJJIVANSFB
Date
📅 2026-03-21
Volatility
🟡 2.39%
Risk Profile
⚠️ suitable for aggressive investors
Win Rate
⚠️ 49.0%
Avg Daily Return
📈 +0.19%
Max Drawdown
📉 -22.84%
Best Month
🏆 2025-04
Worst Month
📉 2025-03
Best Months to Trade
📅 Apr, Jan, Jun
Best Days to Trade
📅 Monday, Wednesday
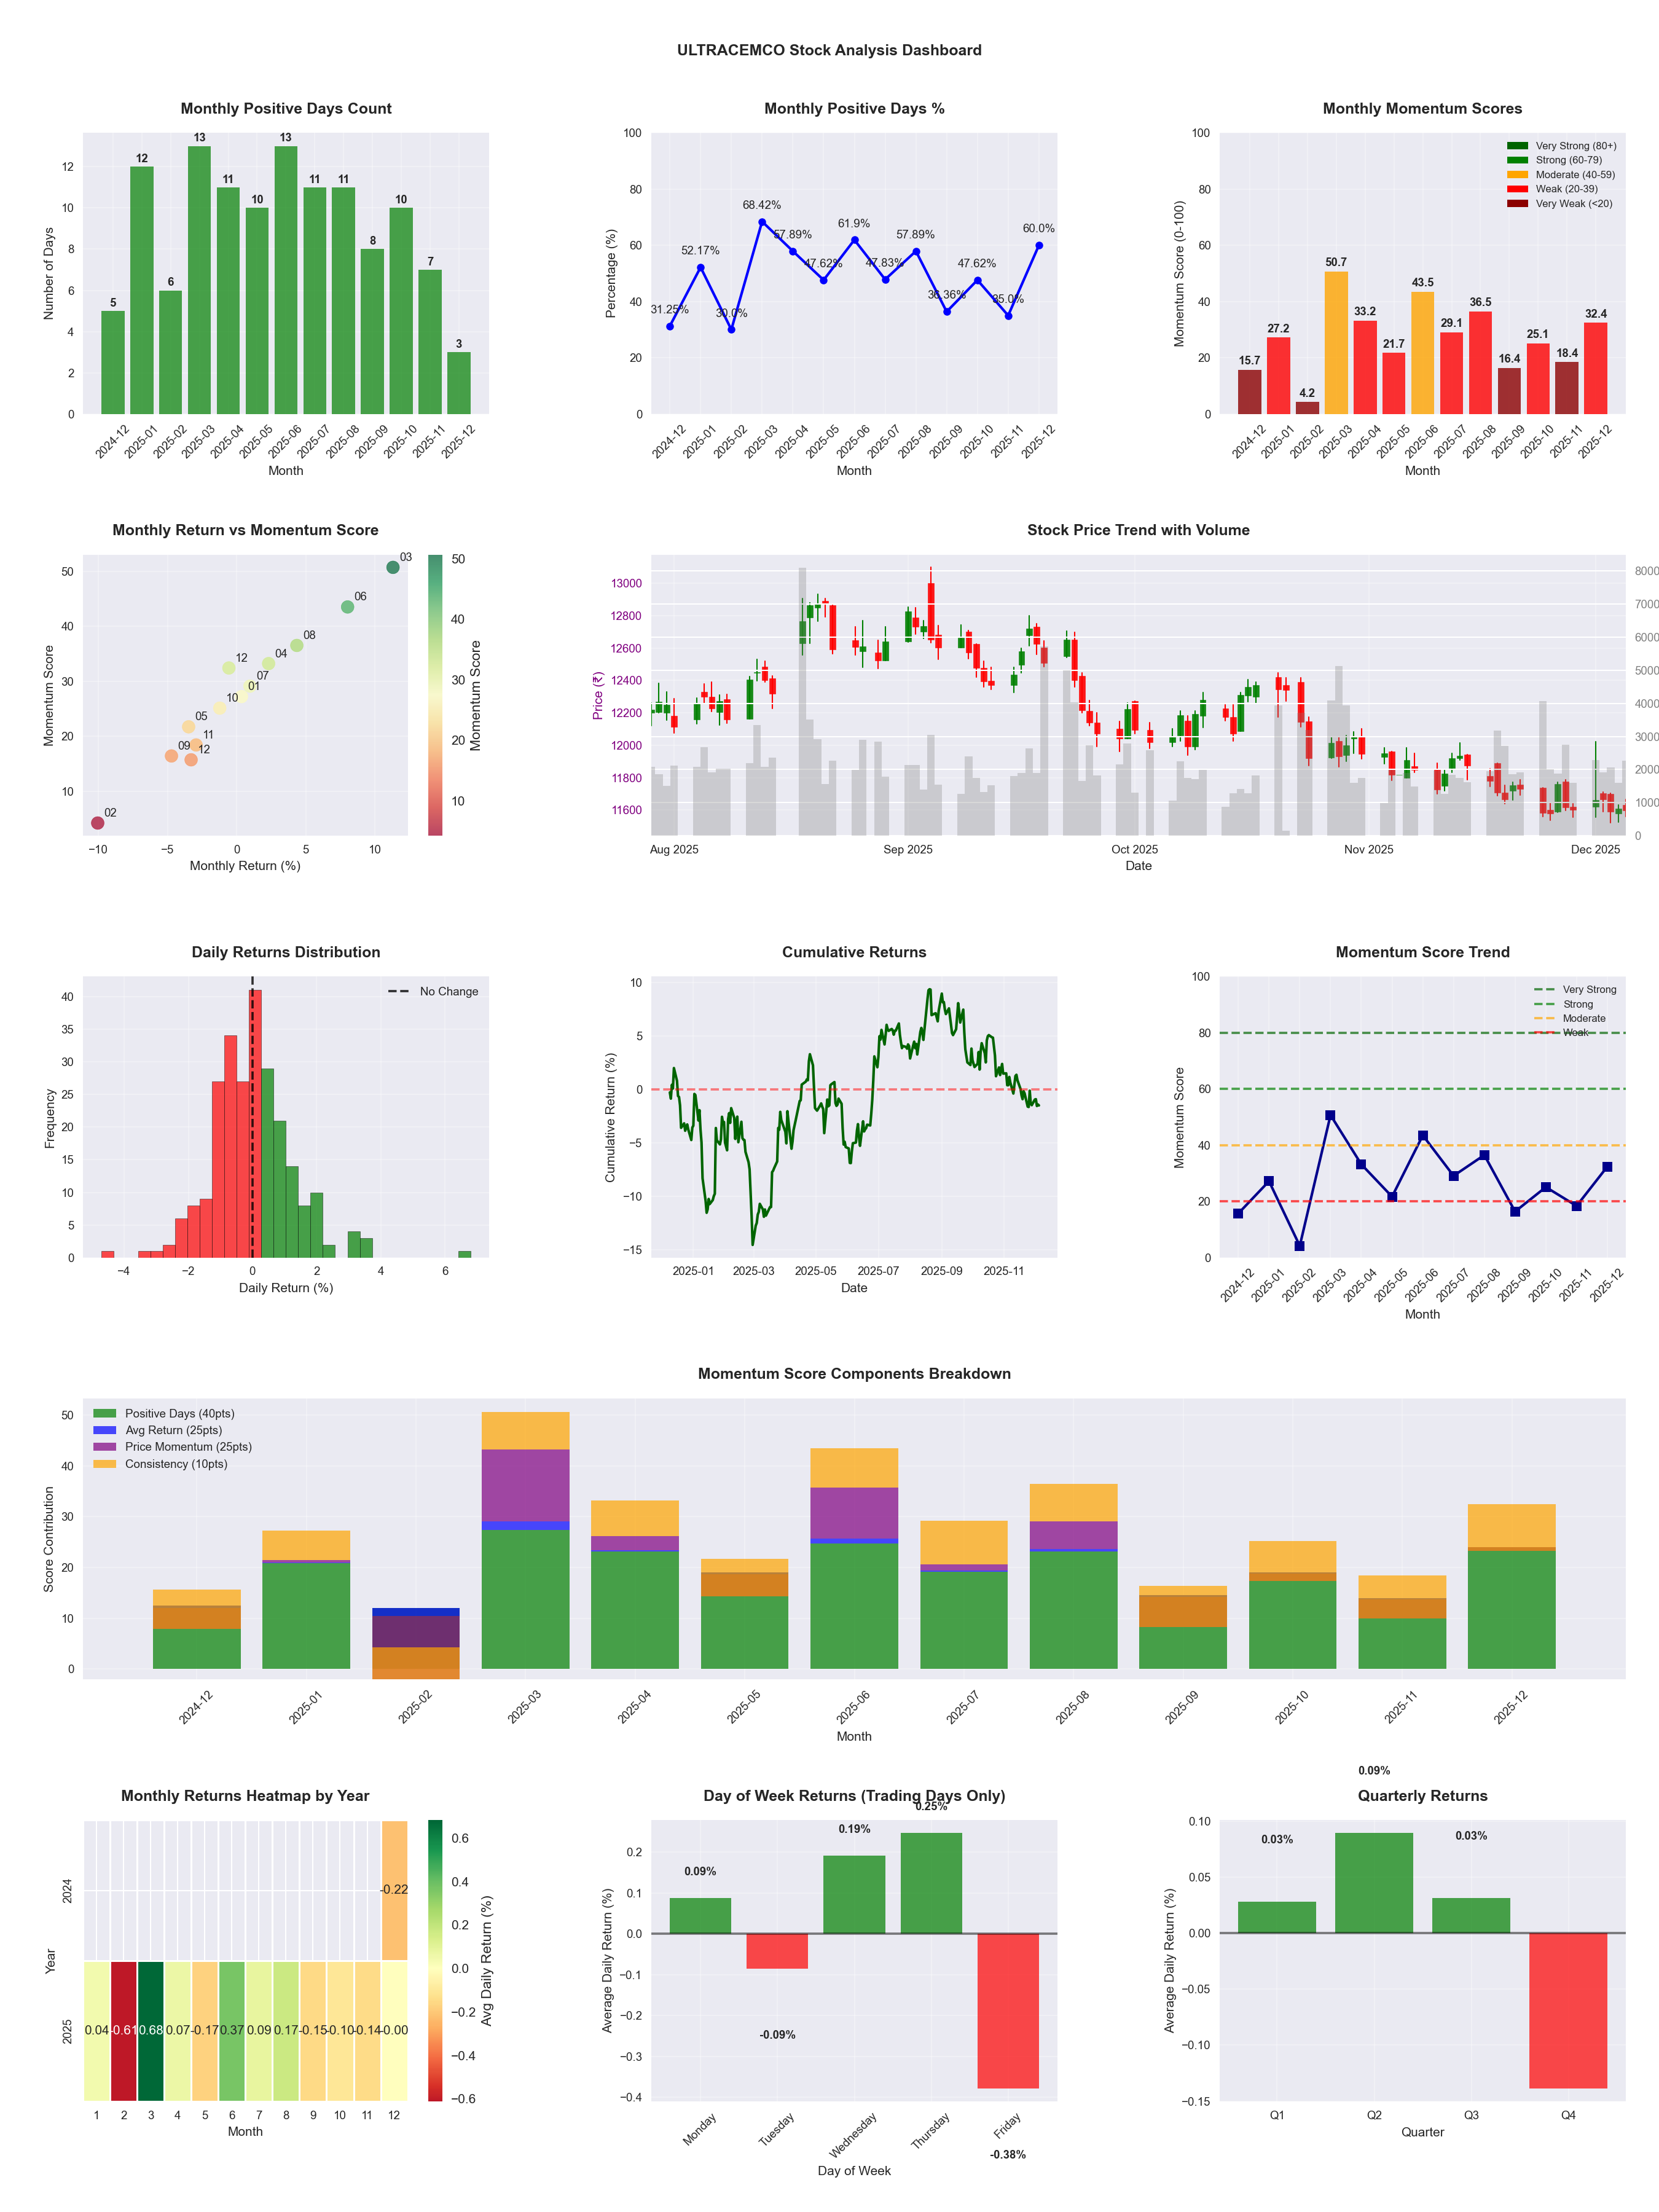
📊 Key Insights & Metrics
Symbol
📈 ULTRACEMCO
Date
📅 2026-04-11
Volatility
🟢 1.41%
Win Rate
⚠️ 50.0%
Avg Daily Return
📈 +0.02%
Max Drawdown
📉 -20.61%
IBD RS Score
📊 54.8
Average
Market Rank
#223
Best Month
🏆 2025-06
Worst Month
📉 2026-03
Best Months to Trade
📅 Apr, Jun, Jan
Best Days to Trade
📅 Wednesday, Monday
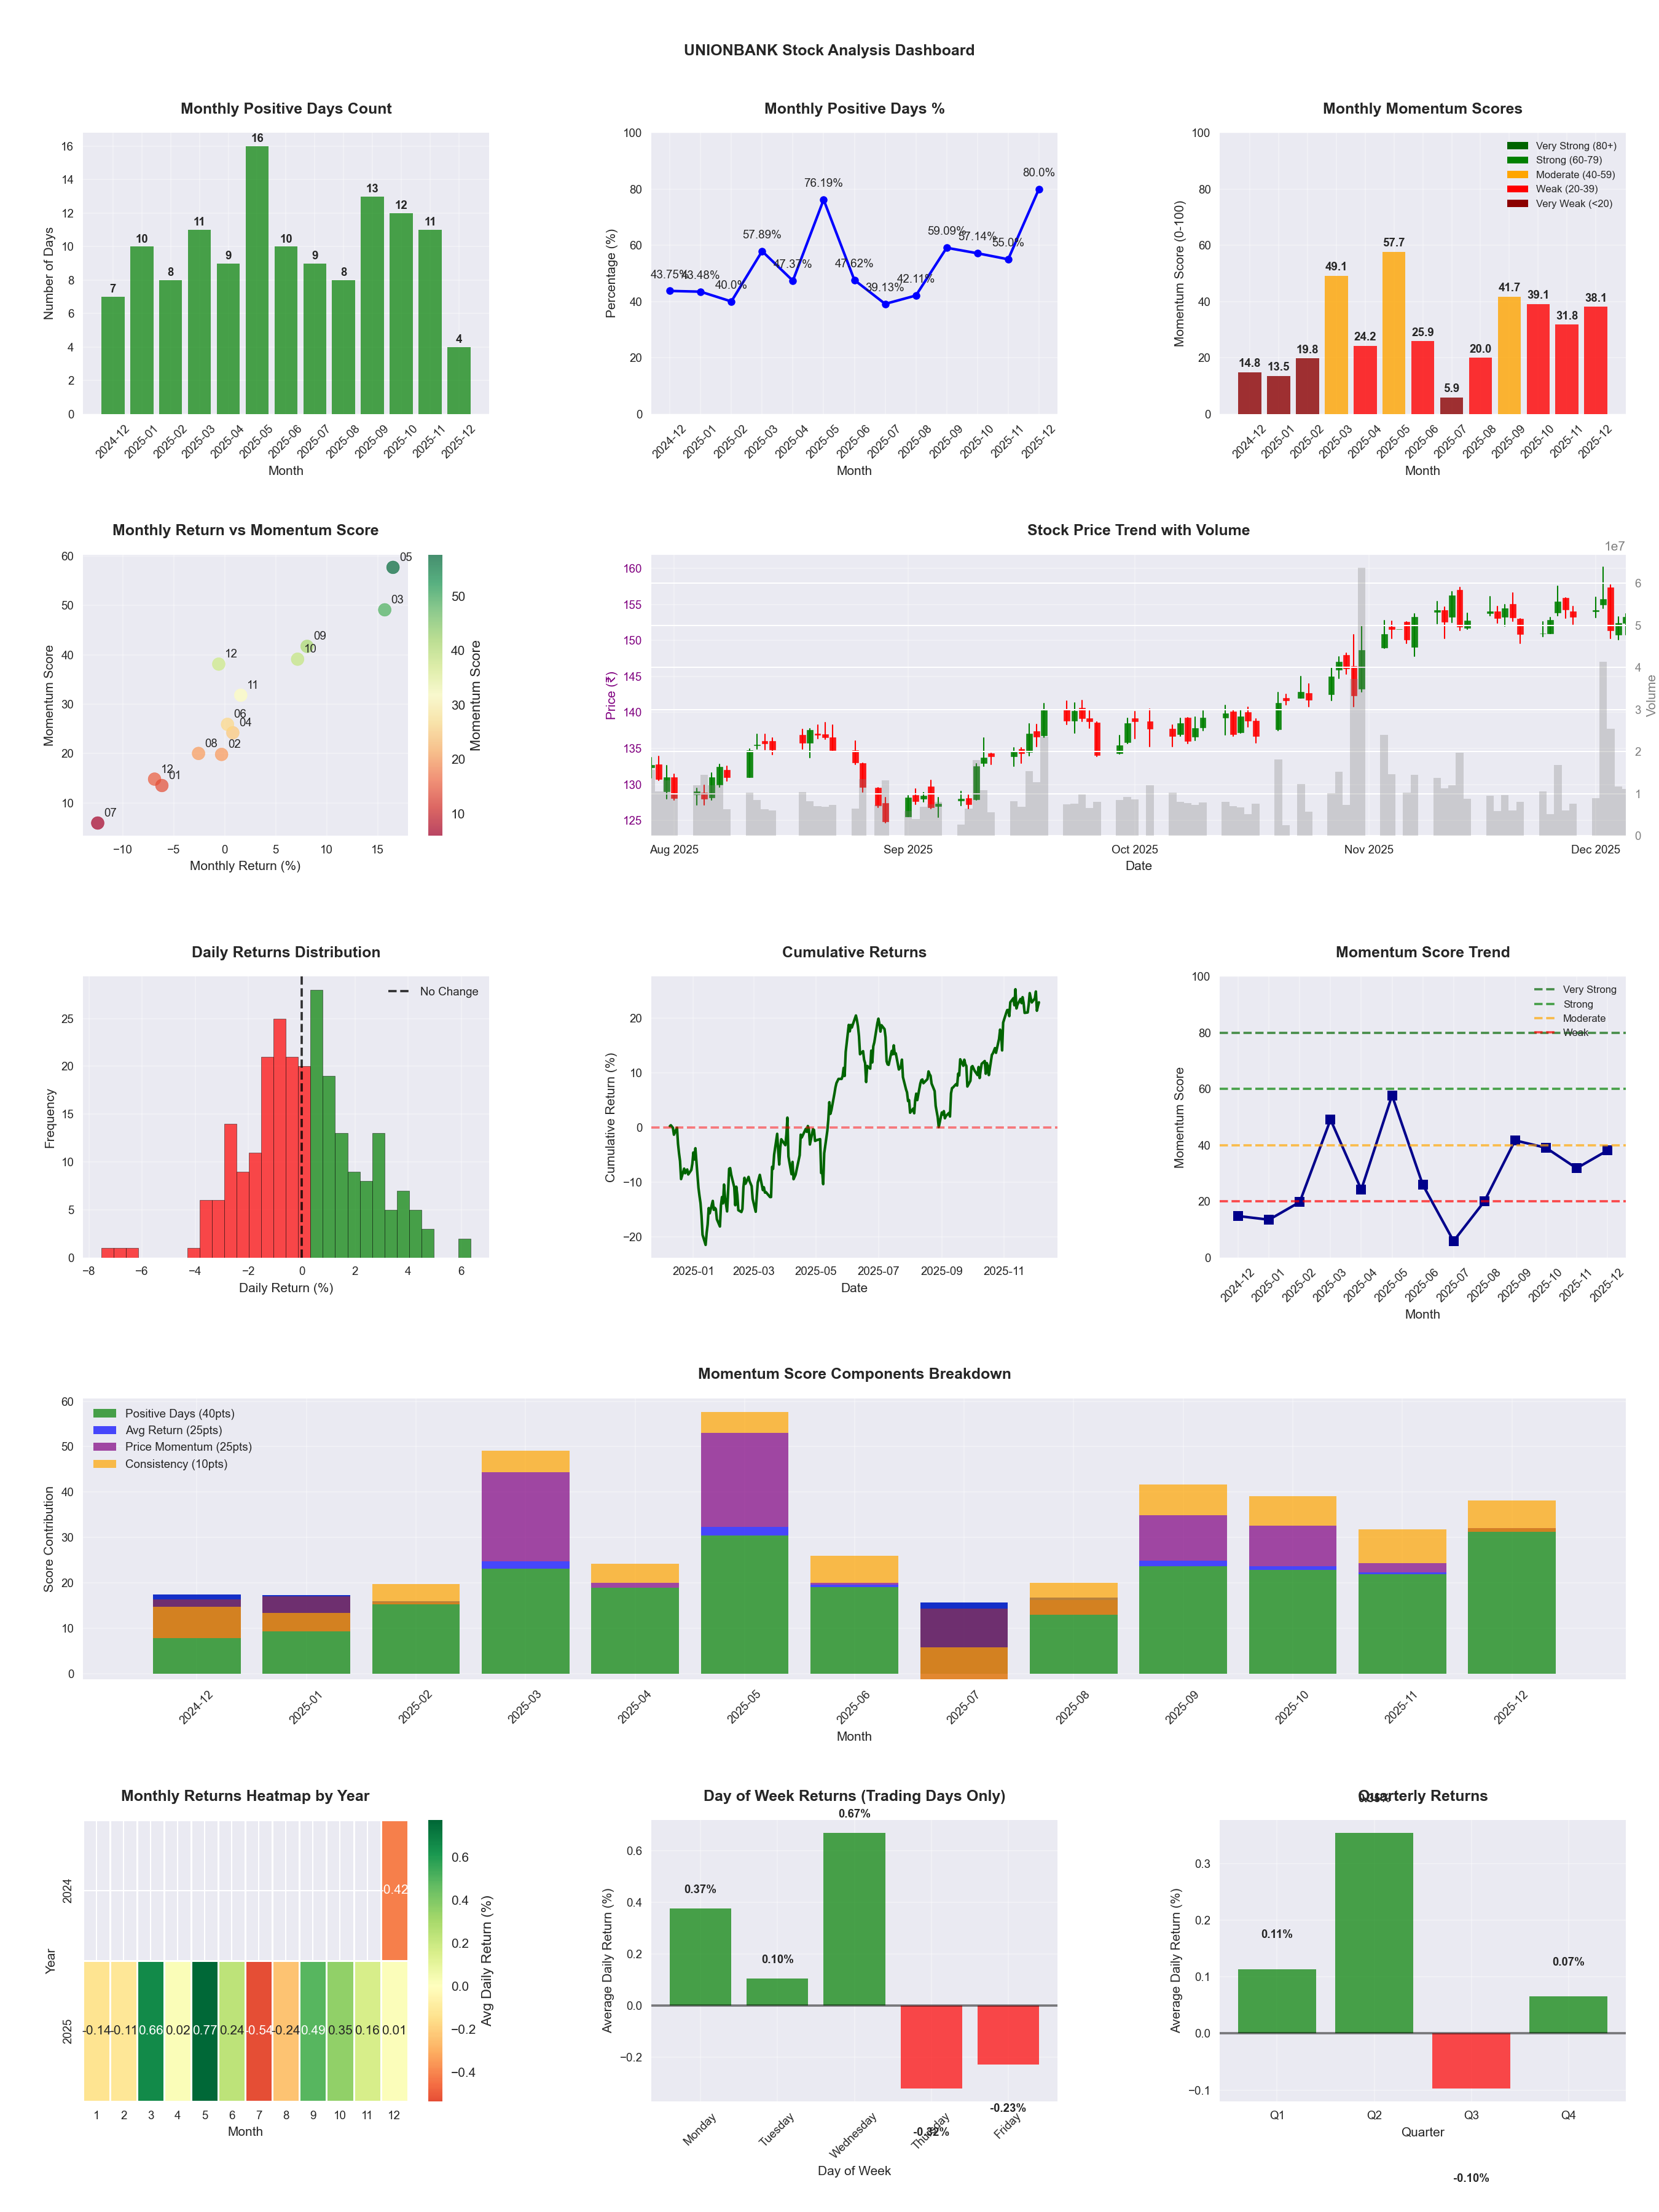
📊 Key Insights & Metrics
Symbol
📈 UNIONBANK
Date
📅 2026-04-11
Volatility
🟡 2.10%
Risk Profile
⚠️ suitable for aggressive investors
Win Rate
⚠️ 55.7%
Avg Daily Return
📈 +0.23%
Max Drawdown
📉 -18.82%
IBD RS Score
📊 95.1
Leader
Market Rank
#24
Best Month
🏆 2026-02
Best Months to Trade
📅 Apr, Jan, May
Best Days to Trade
📅 Wednesday, Tuesday
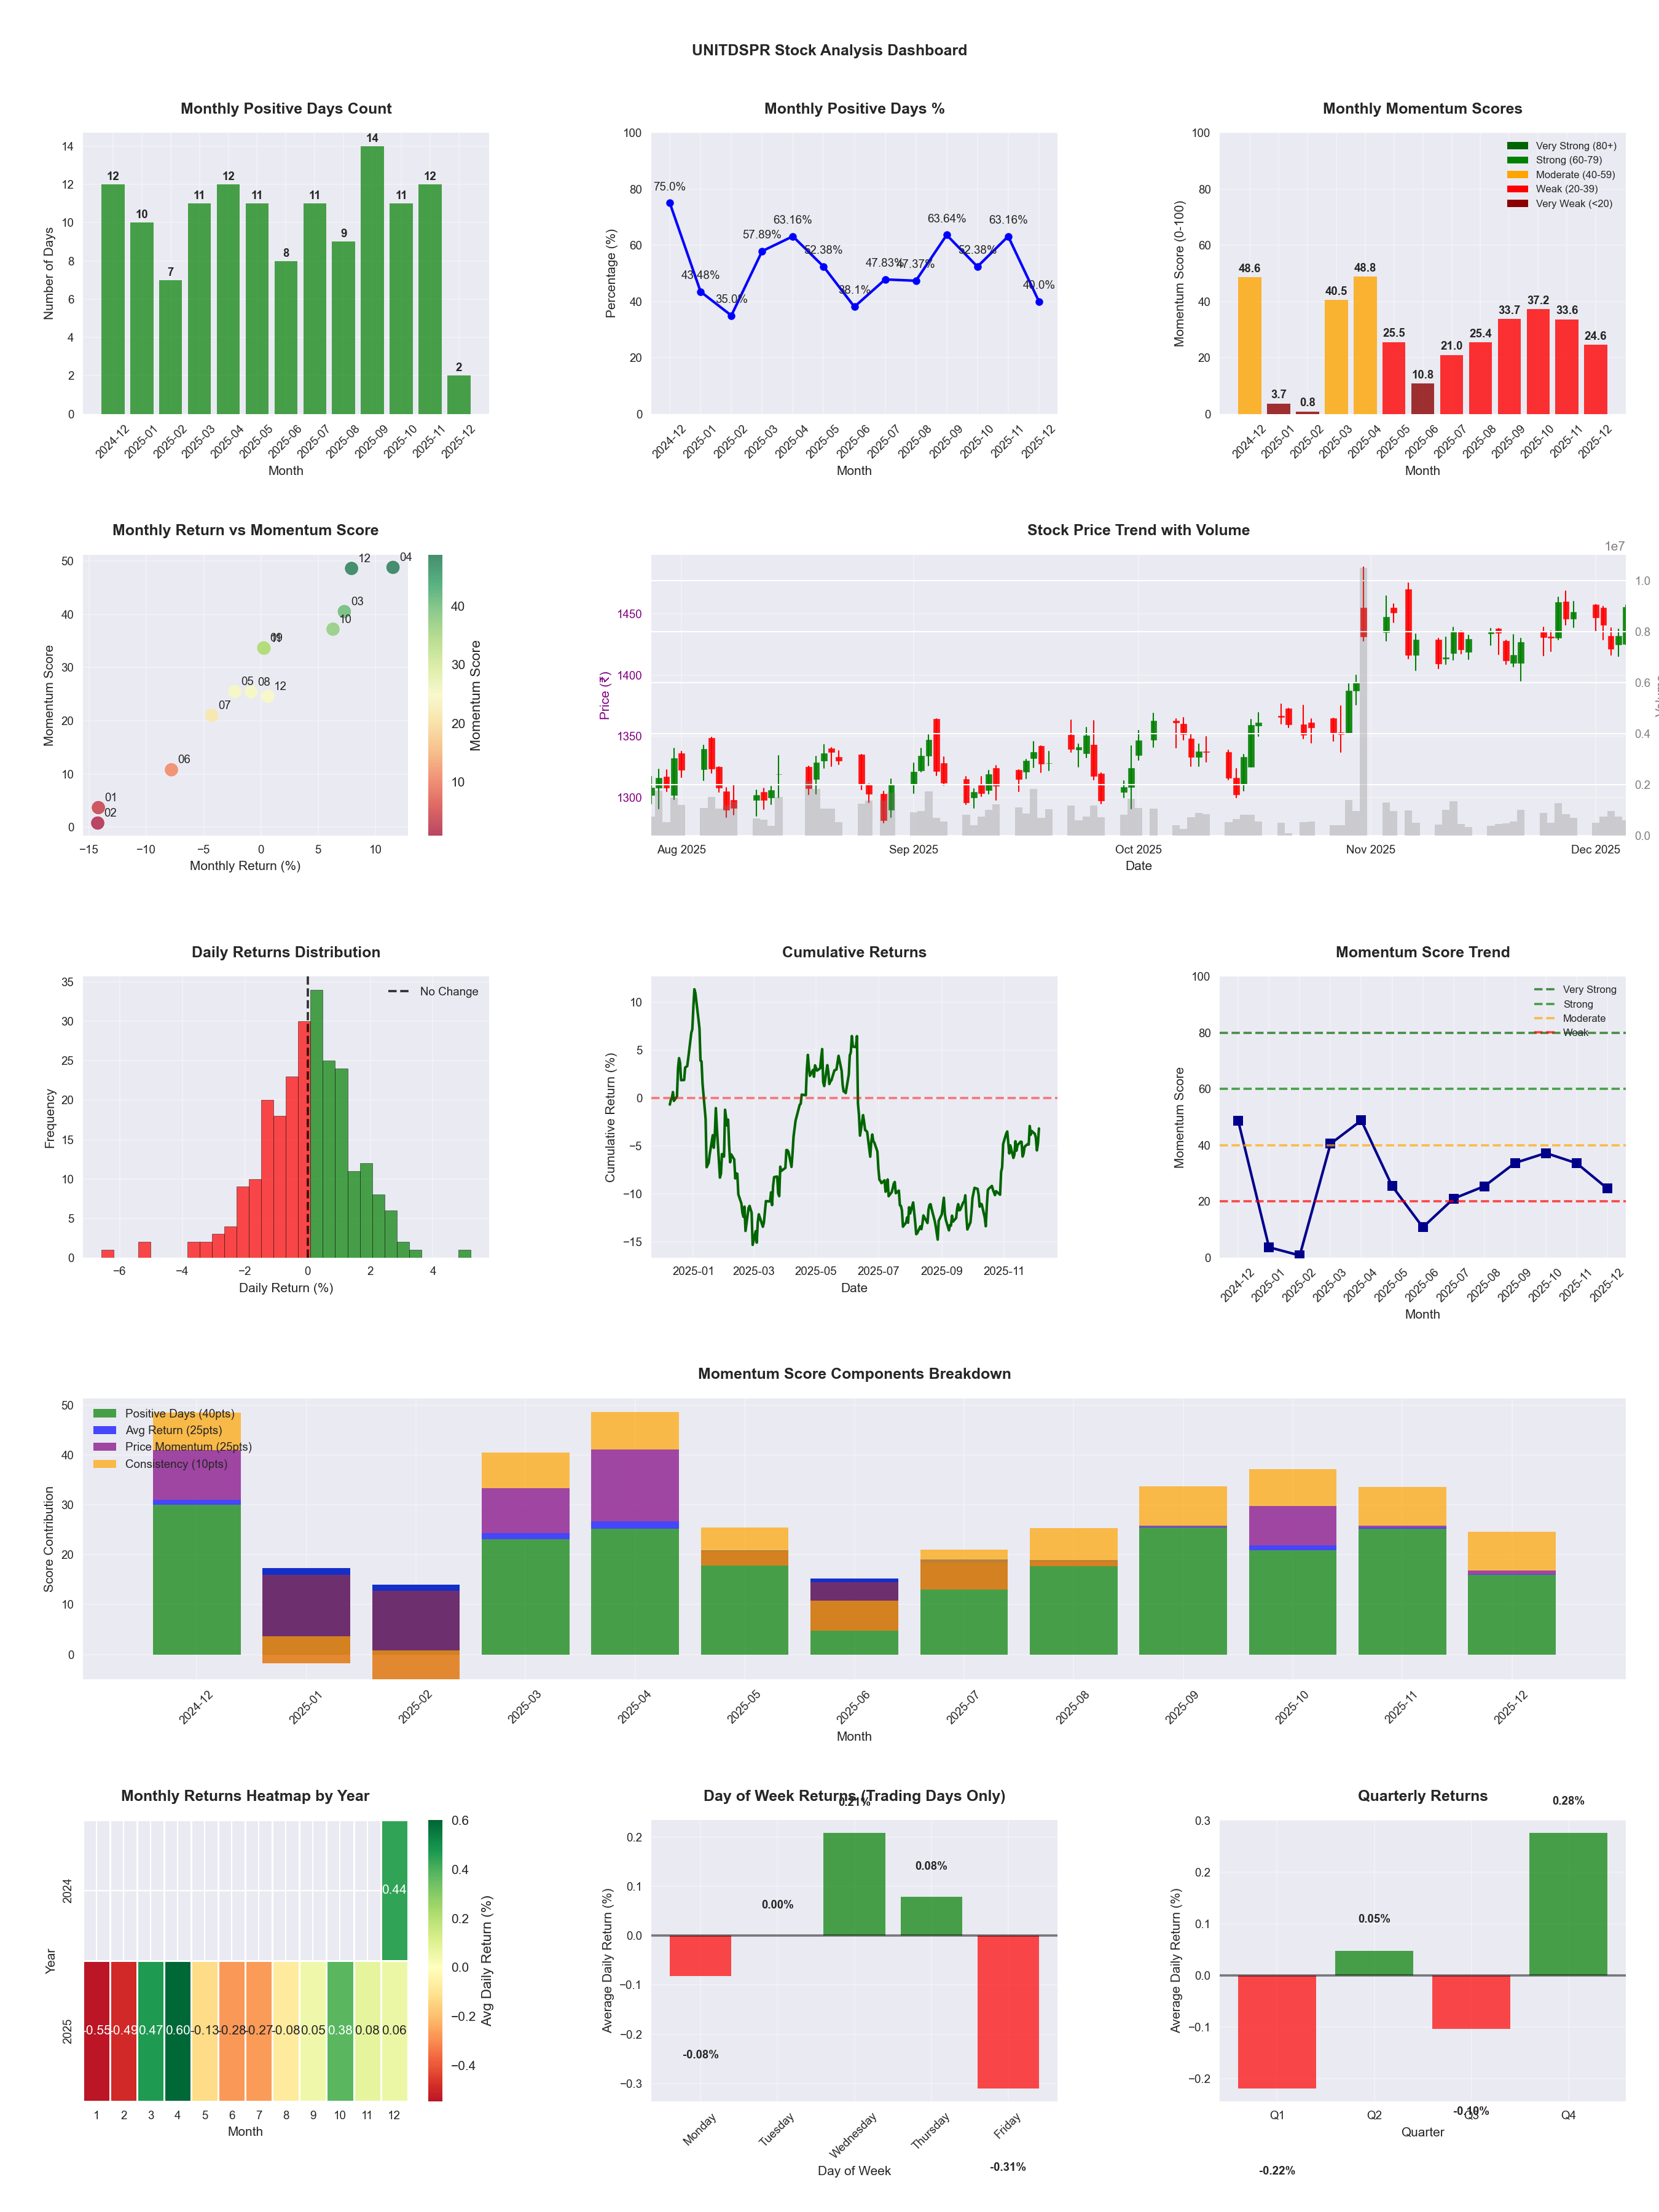
📊 Key Insights & Metrics
Symbol
📈 UNITDSPR
Date
📅 2026-04-11
Volatility
🟢 1.43%
Win Rate
⚠️ 52.6%
Avg Daily Return
📉 -0.05%
Max Drawdown
📉 -23.50%
IBD RS Score
📊 45.0
Weak
Market Rank
#271
Best Month
🏆 2026-04
Worst Month
📉 2026-03
Best Months to Trade
📅 Apr, Oct, Nov
Best Days to Trade
📅 Tuesday, Wednesday
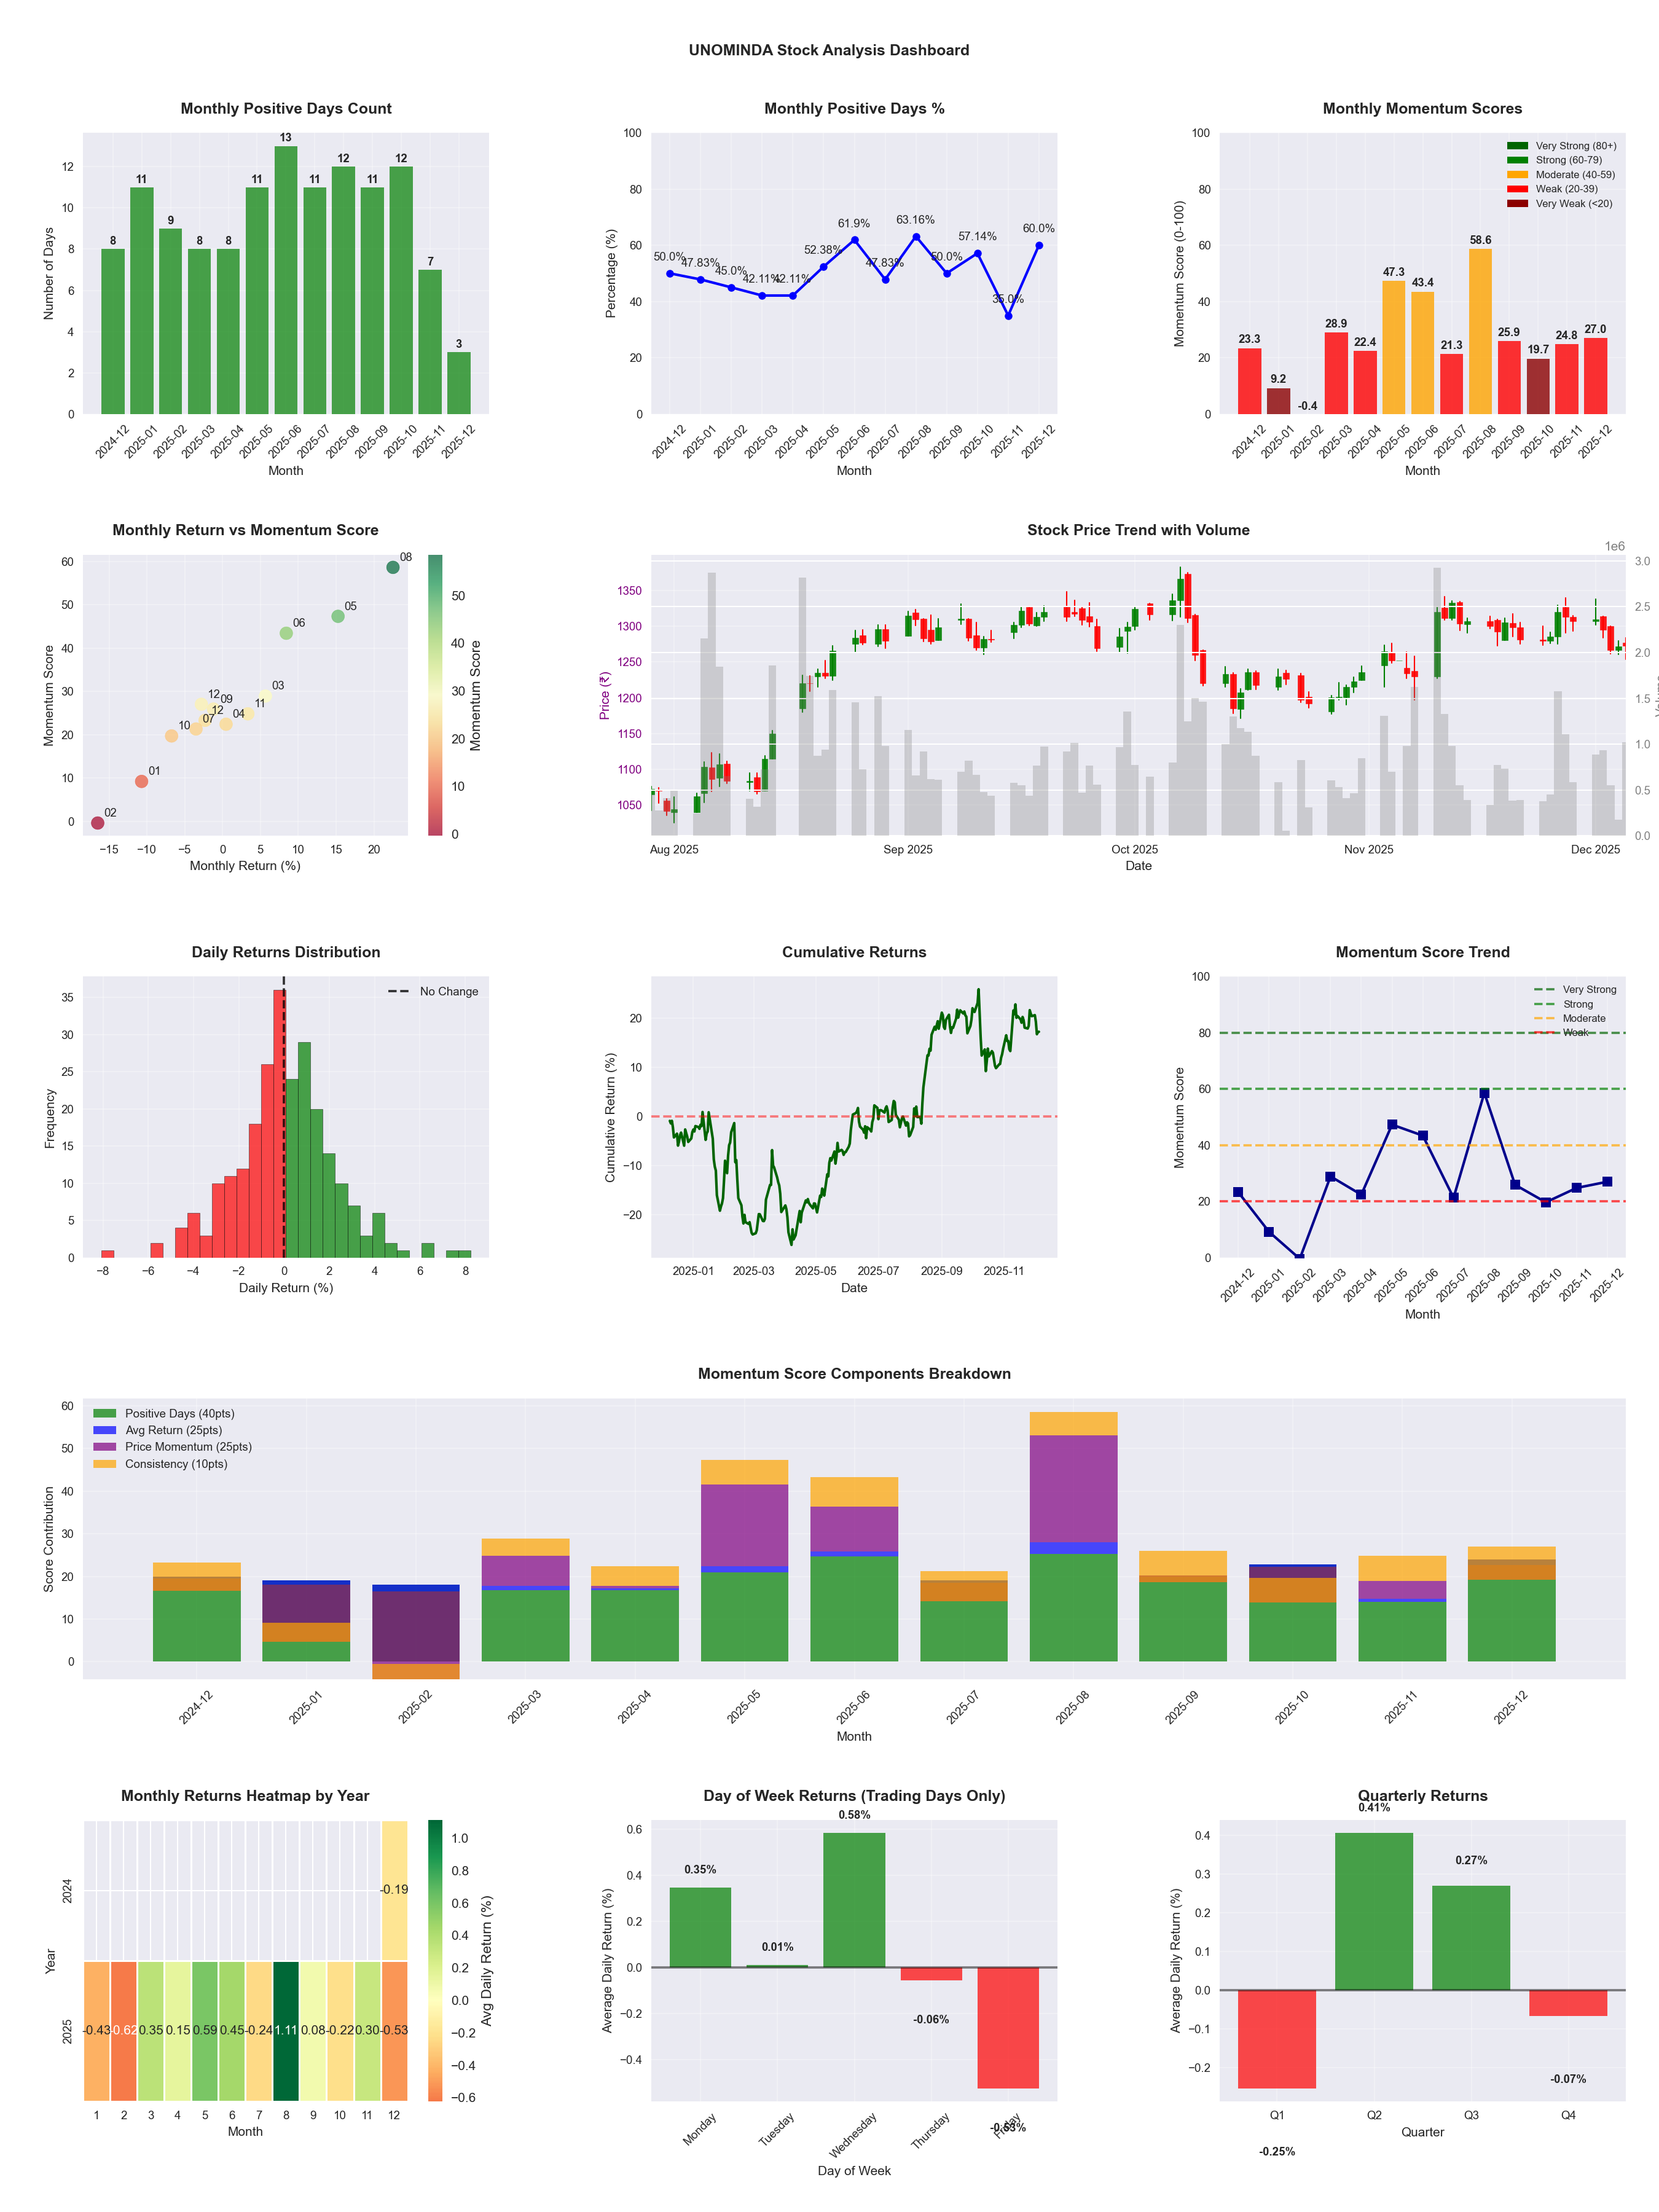
📊 Key Insights & Metrics
Symbol
📈 UNOMINDA
Date
📅 2026-04-11
Volatility
🟡 2.08%
Risk Profile
⚠️ suitable for aggressive investors
Win Rate
⚠️ 50.0%
Avg Daily Return
📈 +0.13%
Max Drawdown
📉 -25.79%
IBD RS Score
📊 55.0
Average
Market Rank
#222
Best Month
🏆 2025-08
Worst Month
📉 2026-03
Best Months to Trade
📅 Aug, Apr, May
Best Days to Trade
📅 Wednesday, Monday
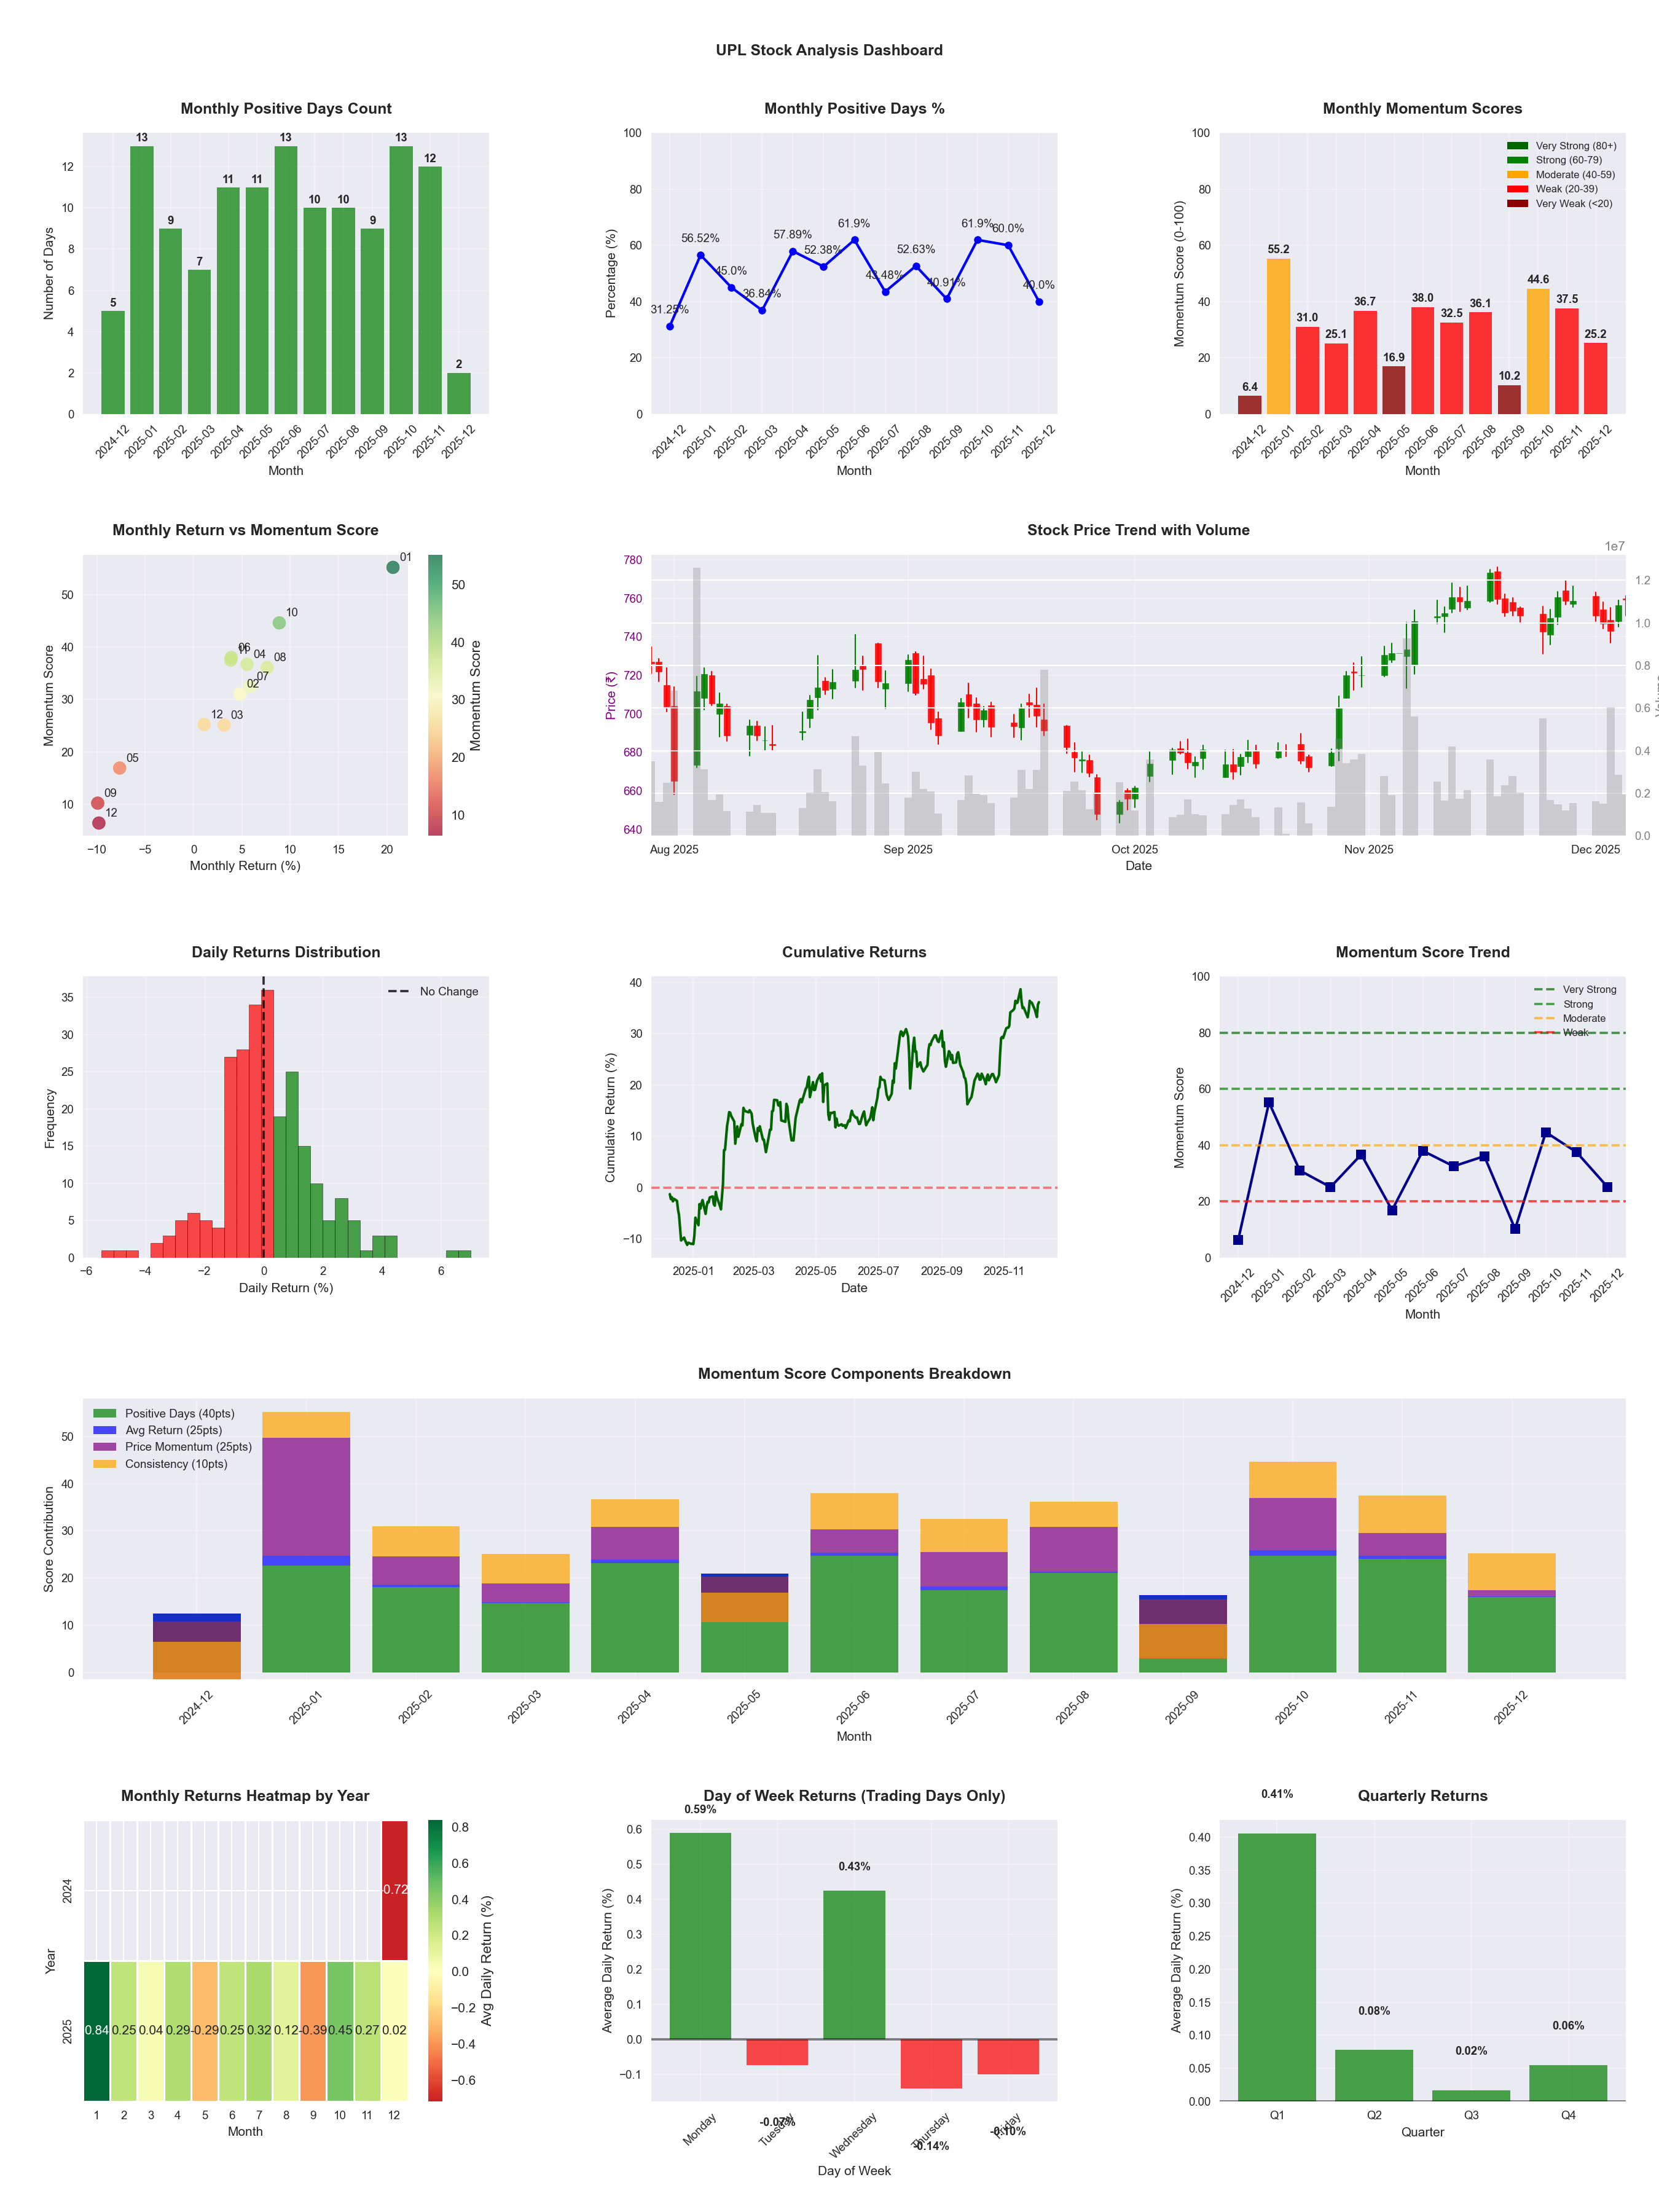
📊 Key Insights & Metrics
Symbol
📈 UPL
Date
📅 2026-04-11
Volatility
🟡 2.00%
Risk Profile
⚠️ suitable for aggressive investors
Win Rate
⚠️ 52.9%
Avg Daily Return
📈 +0.03%
Max Drawdown
📉 -29.48%
IBD RS Score
📊 43.2
Weak
Market Rank
#280
Best Month
🏆 2026-04
Worst Month
📉 2026-01
Best Months to Trade
📅 Apr, Oct, Jul
Best Days to Trade
📅 Monday, Wednesday
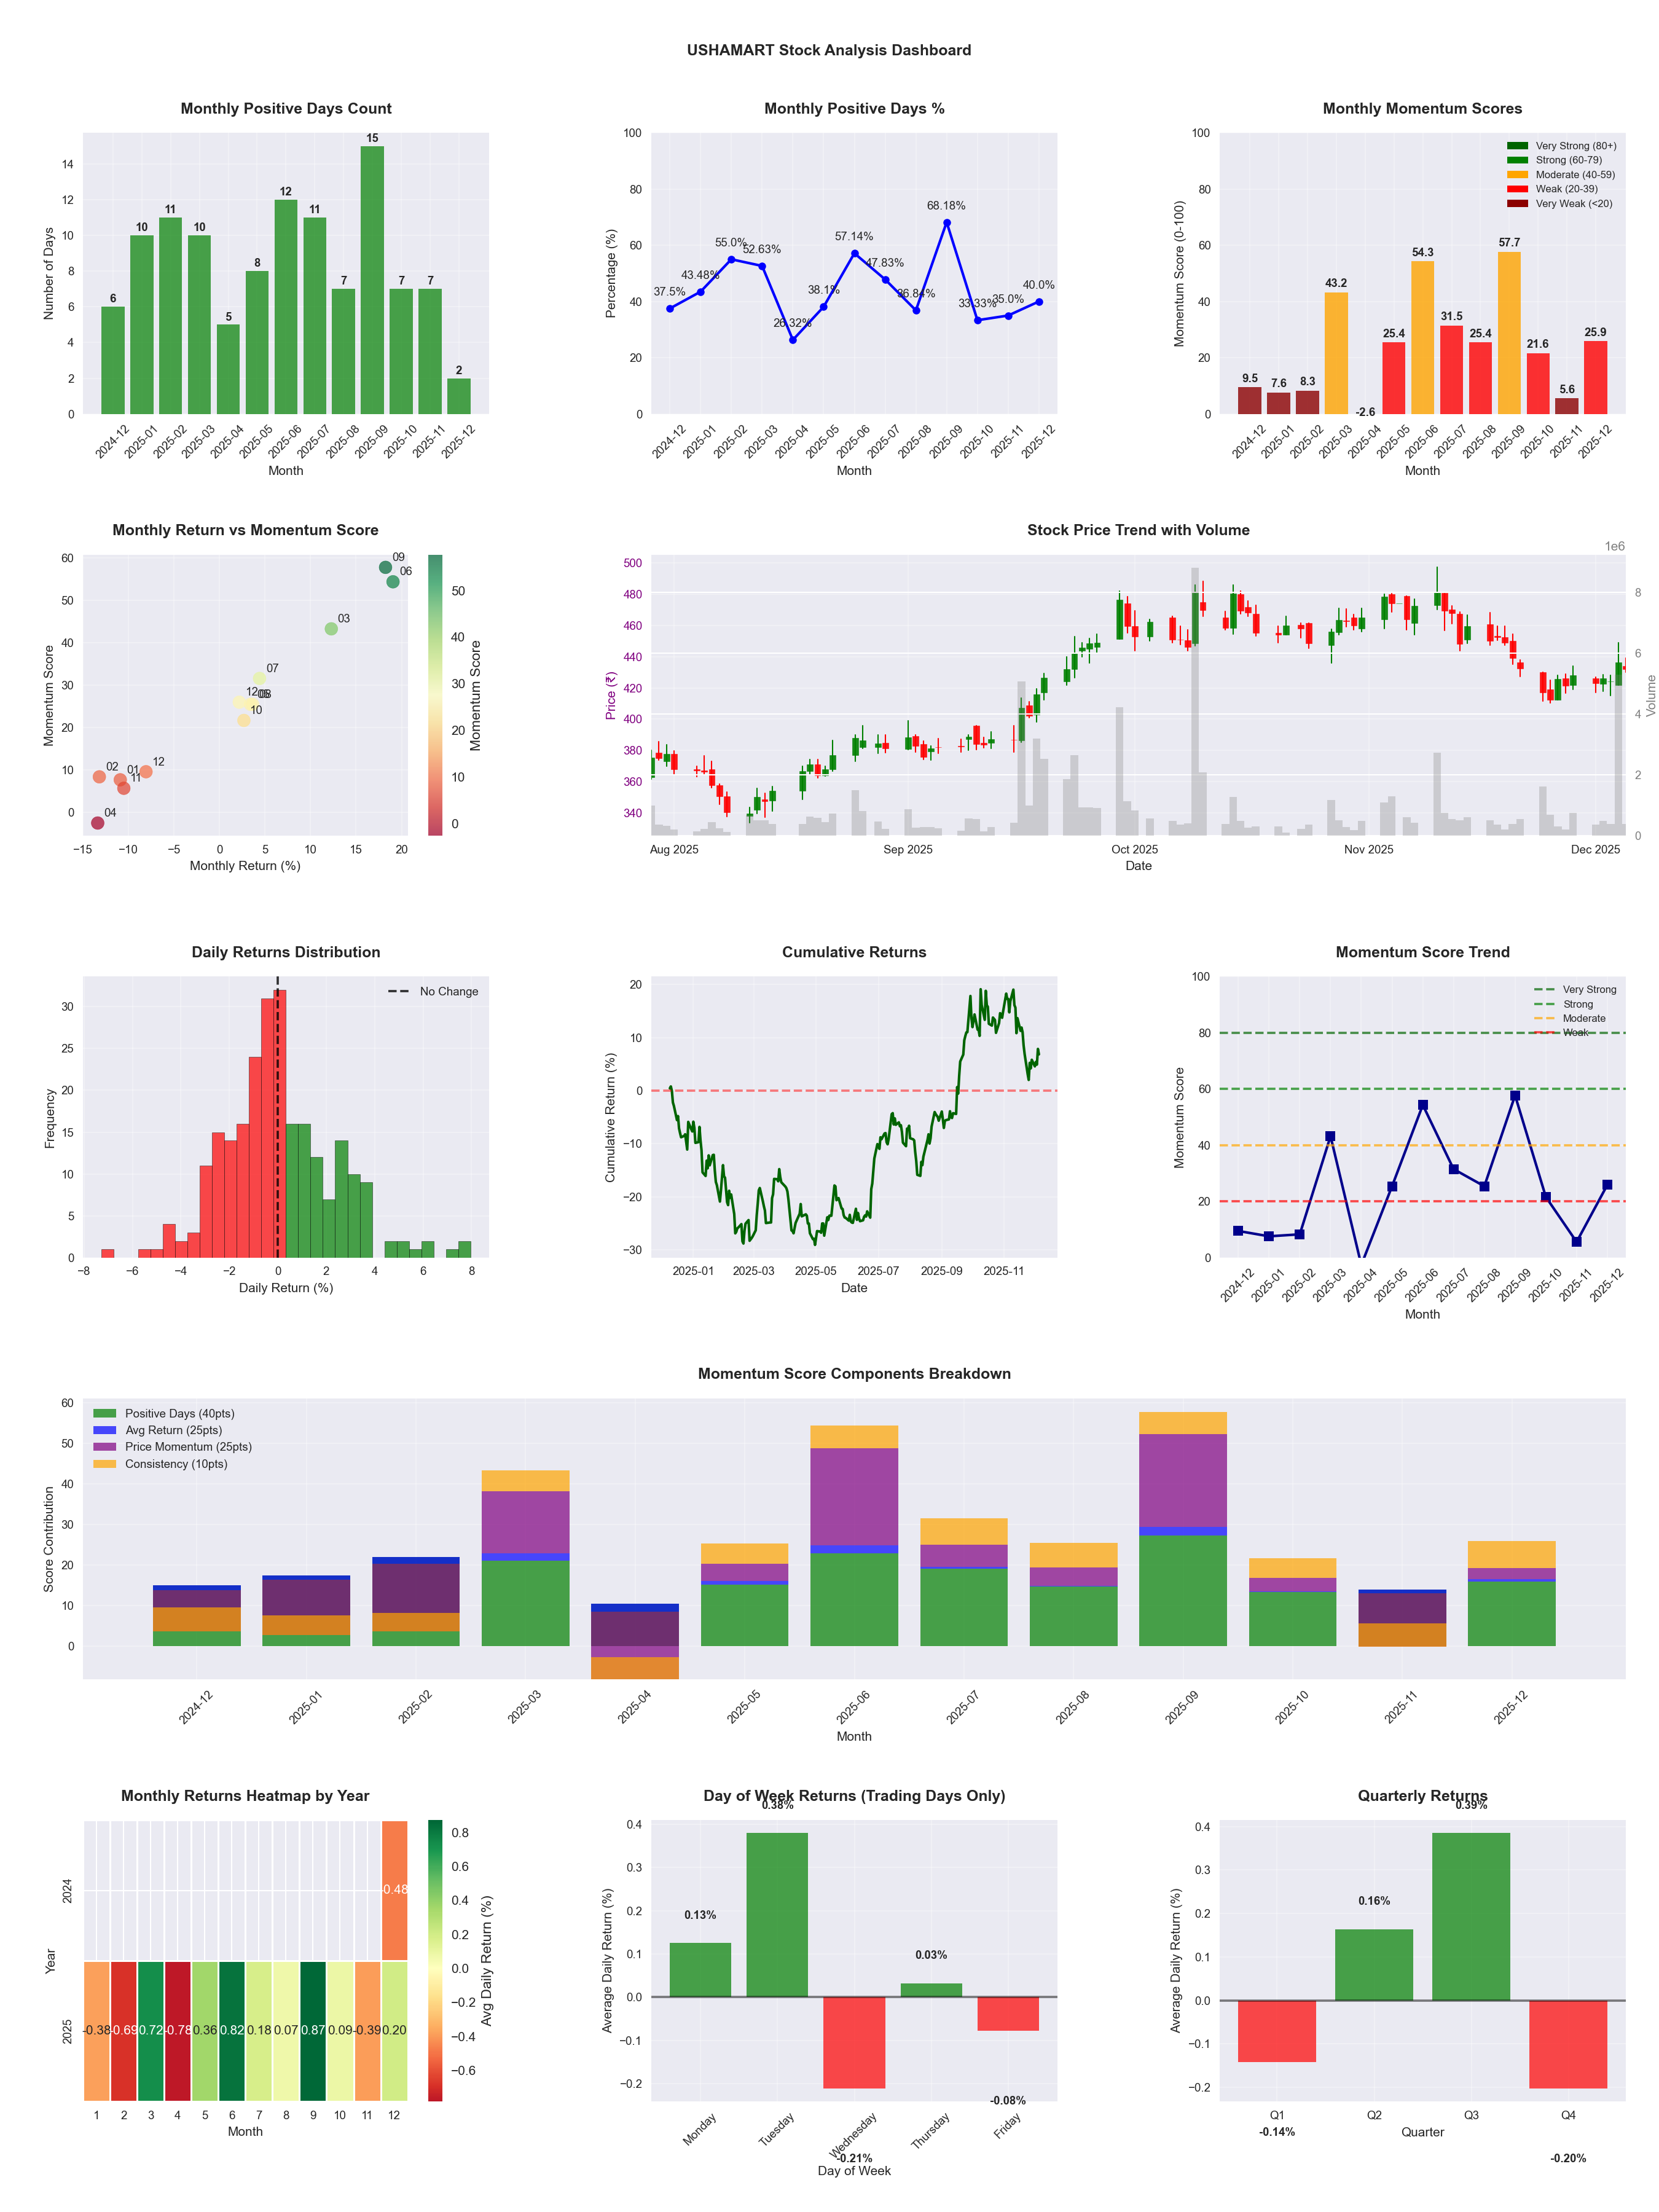
📊 Key Insights & Metrics
Symbol
📈 USHAMART
Date
📅 2026-04-11
Volatility
🟡 2.20%
Risk Profile
⚠️ suitable for aggressive investors
Win Rate
⚠️ 45.9%
Avg Daily Return
📈 +0.18%
Max Drawdown
📉 -19.57%
IBD RS Score
📊 78.1
Strong
Market Rank
#108
Best Month
🏆 2025-09
Worst Month
📉 2025-11
Best Months to Trade
📅 Sep, Jun, Apr
Best Days to Trade
📅 Tuesday, Monday
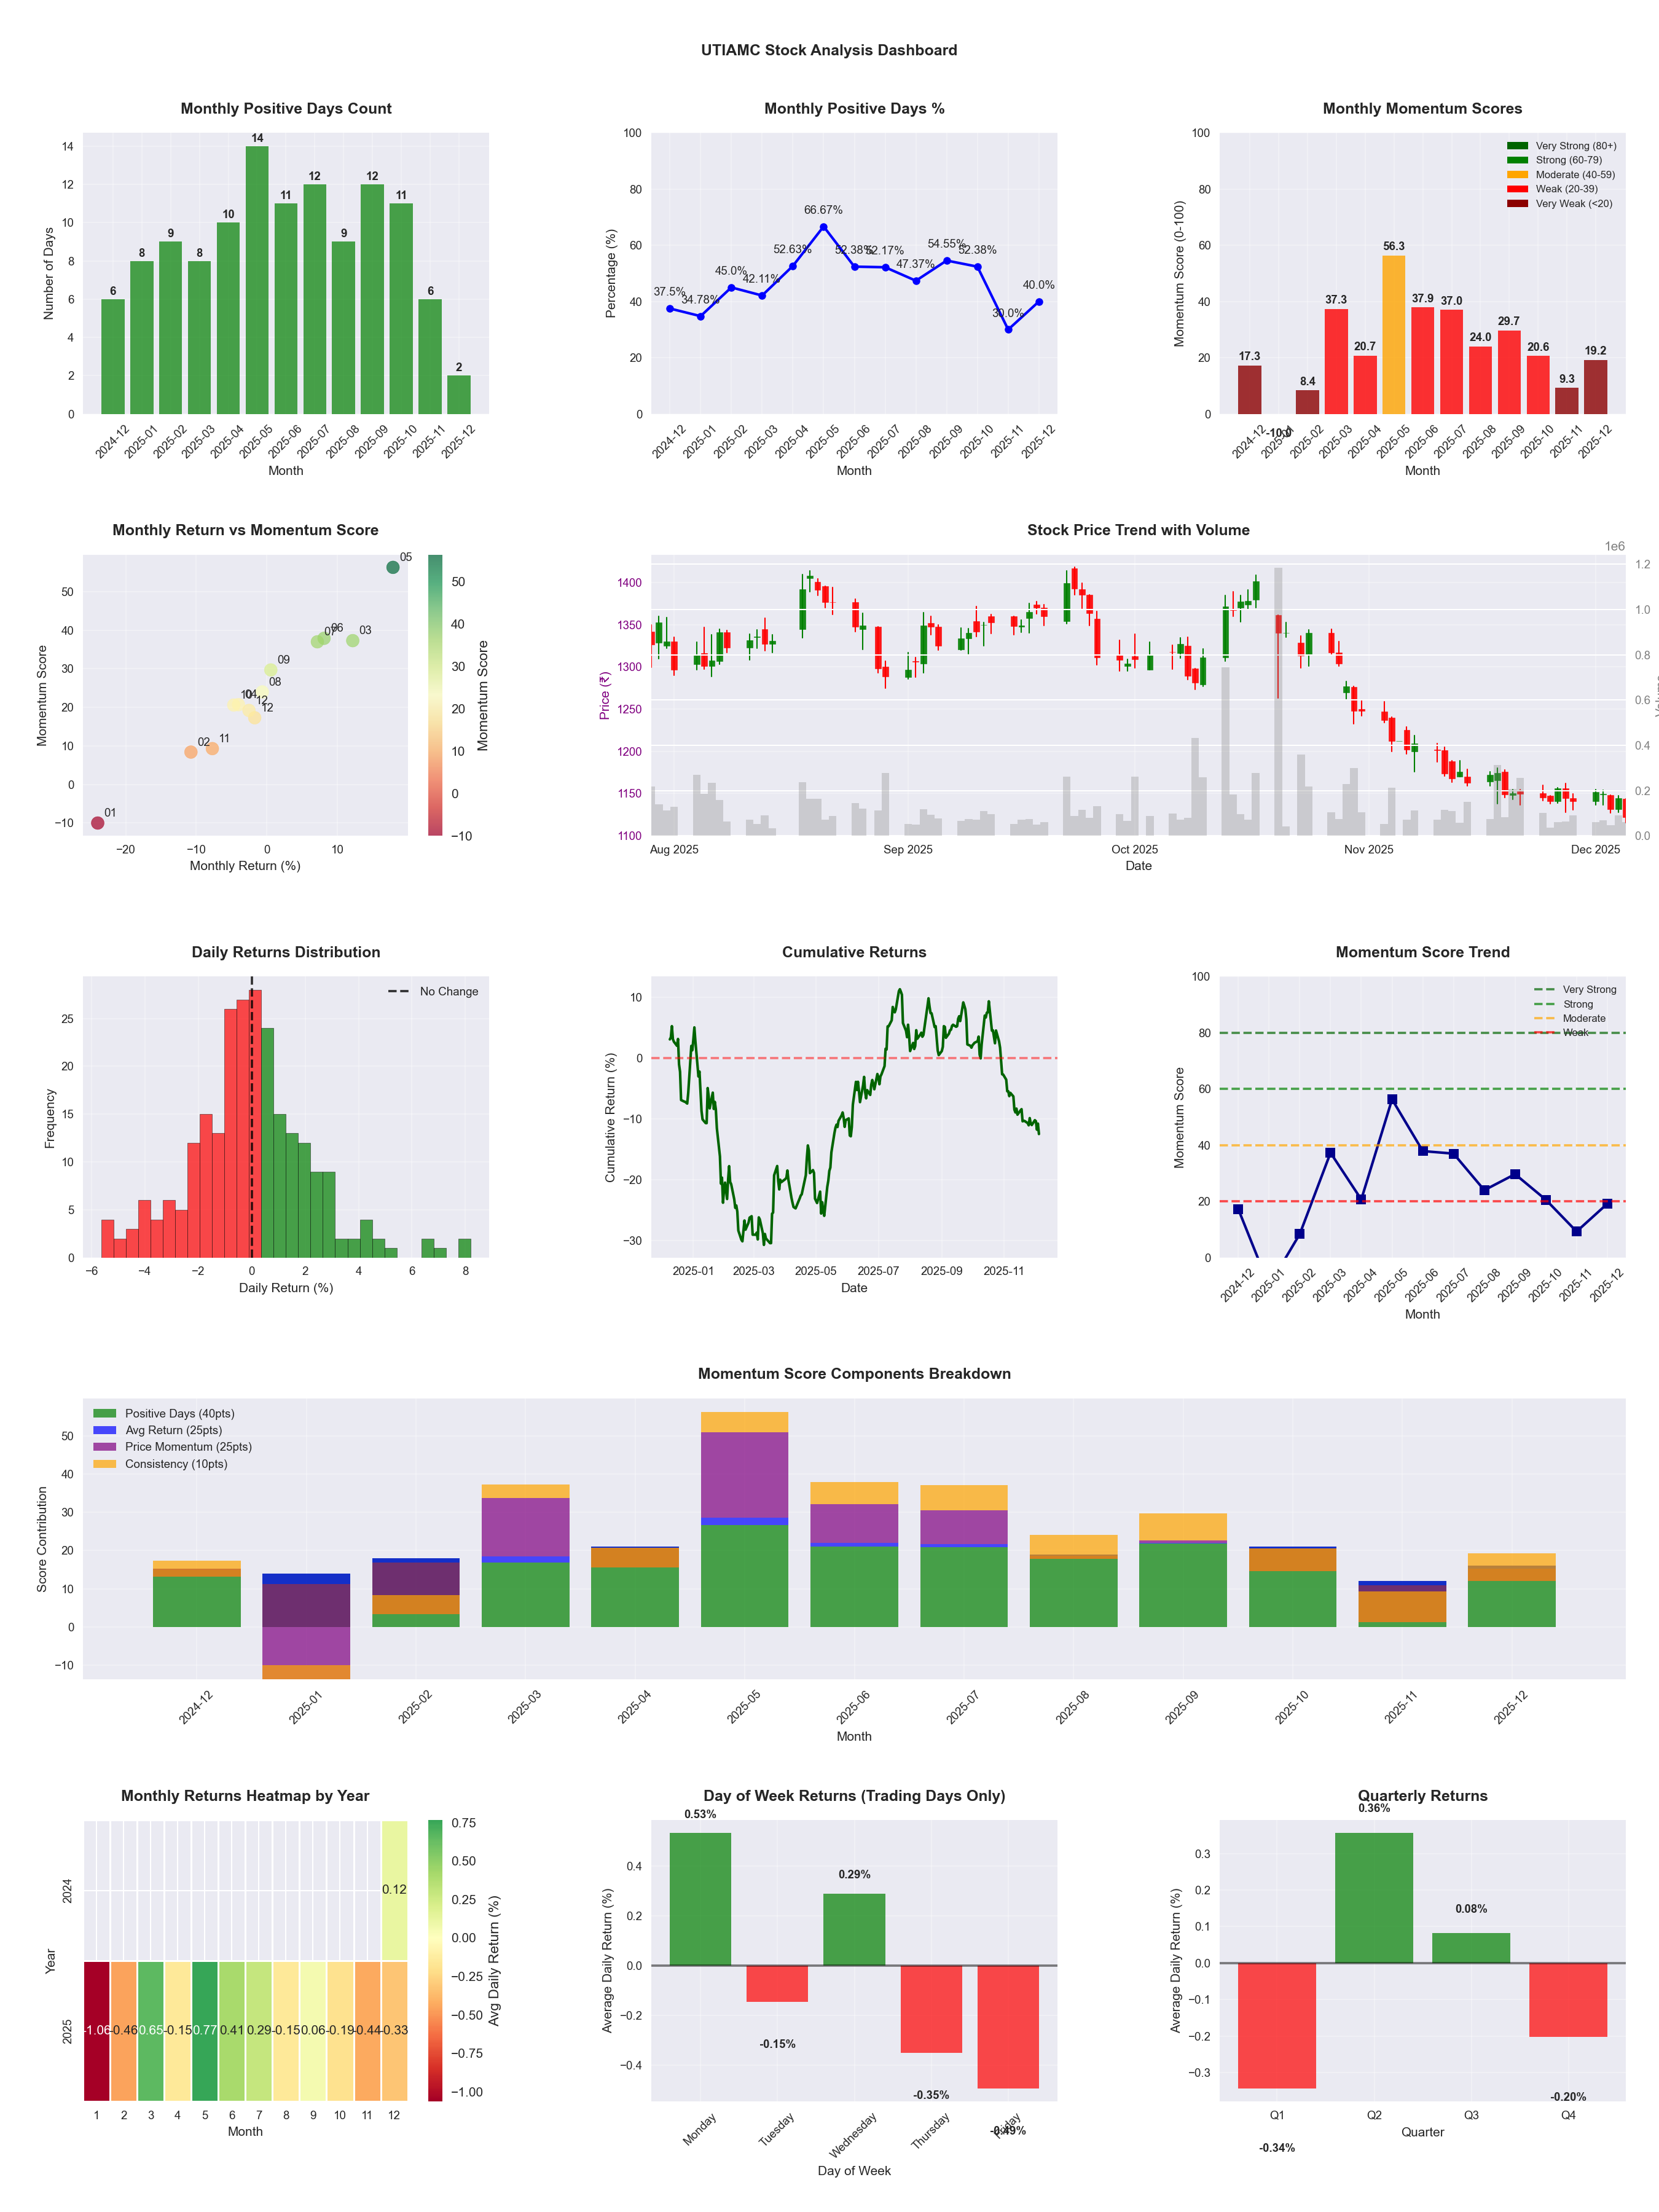
📊 Key Insights & Metrics
Symbol
📈 UTIAMC
Date
📅 2026-04-11
Volatility
🟡 1.92%
Win Rate
⚠️ 48.8%
Avg Daily Return
📈 +0.02%
Max Drawdown
📉 -36.47%
IBD RS Score
📊 19.9
Weak
Market Rank
#395
Best Month
🏆 2025-05
Worst Month
📉 2026-01
Best Months to Trade
📅 May, Jun, Apr
Best Days to Trade
📅 Monday, Tuesday
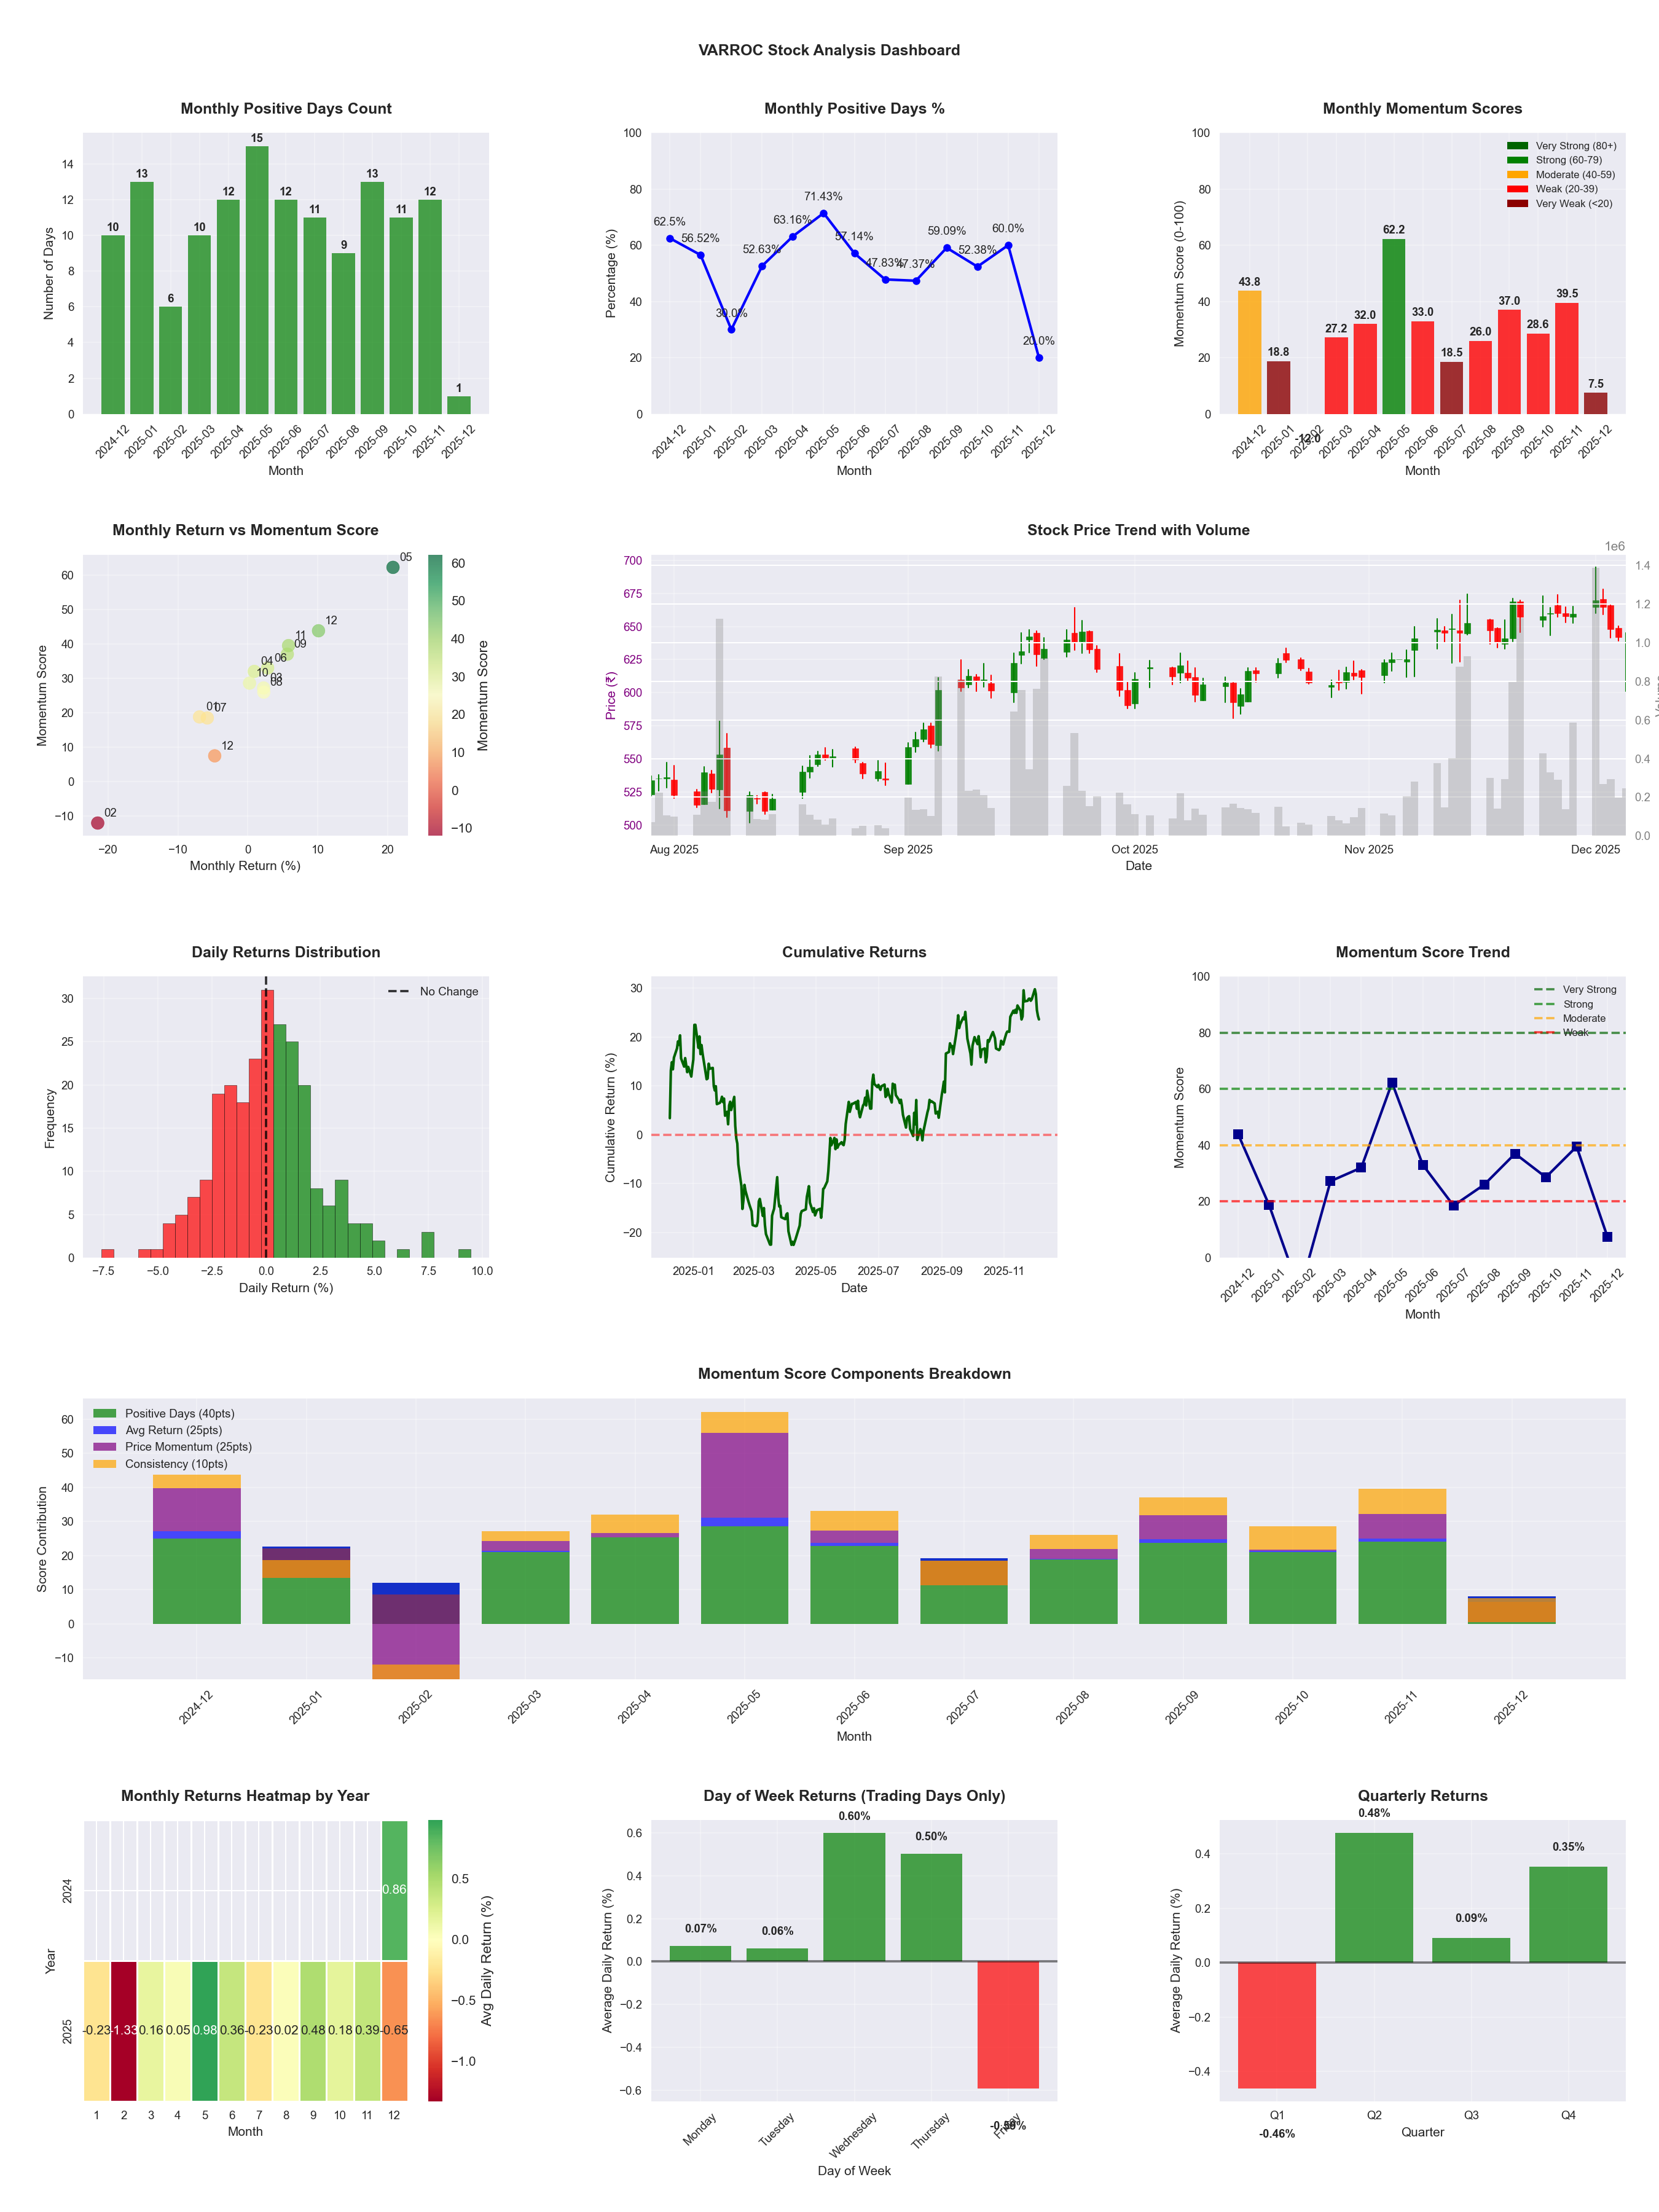
📊 Key Insights & Metrics
Symbol
📈 VARROC
Date
📅 2026-03-21
Volatility
🟡 2.20%
Risk Profile
⚠️ suitable for aggressive investors
Win Rate
⚠️ 50.6%
Avg Daily Return
📈 +0.08%
Max Drawdown
📉 -28.52%
Best Month
🏆 2025-05
Worst Month
📉 2025-03
Best Months to Trade
📅 May, Sep, Nov
Best Days to Trade
📅 Wednesday, Thursday
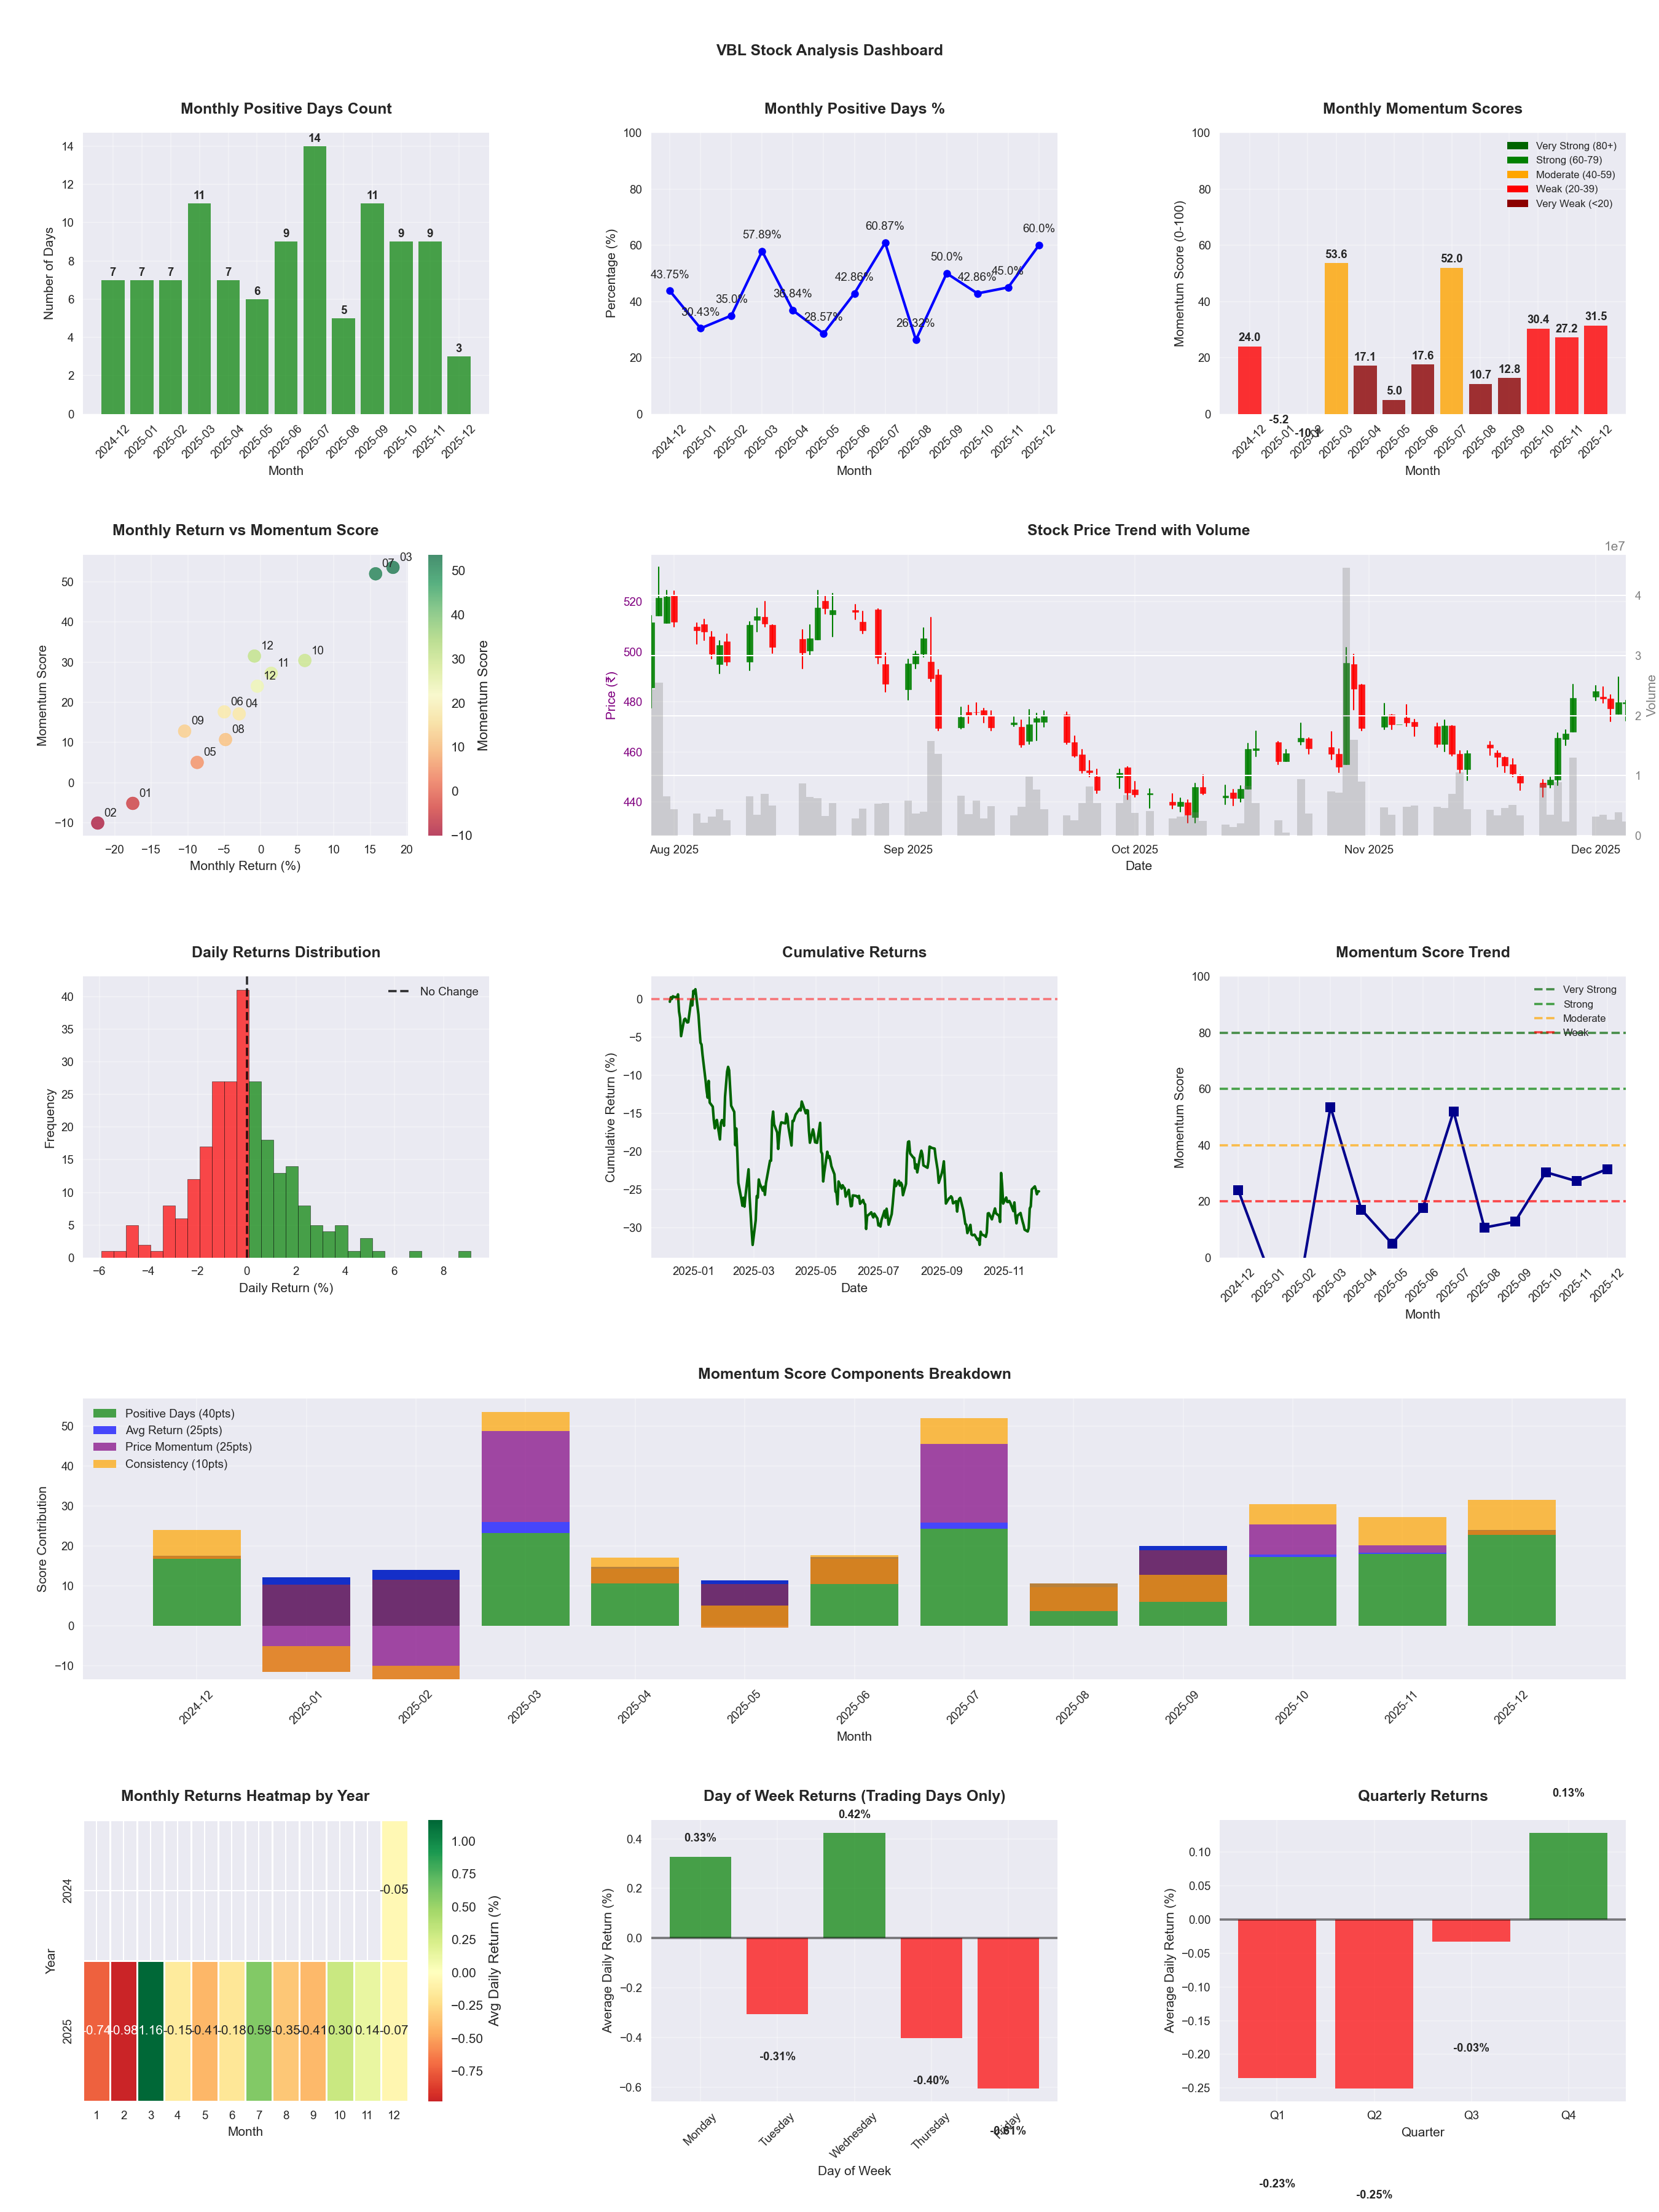
📊 Key Insights & Metrics
Symbol
📈 VBL
Date
📅 2026-04-11
Volatility
🟡 1.82%
Win Rate
⚠️ 44.3%
Avg Daily Return
📉 -0.08%
Max Drawdown
📉 -31.22%
IBD RS Score
📊 35.3
Weak
Market Rank
#319
Best Month
🏆 2025-07
Best Months to Trade
📅 Jul, Apr, Oct
Best Days to Trade
📅 Wednesday, Monday
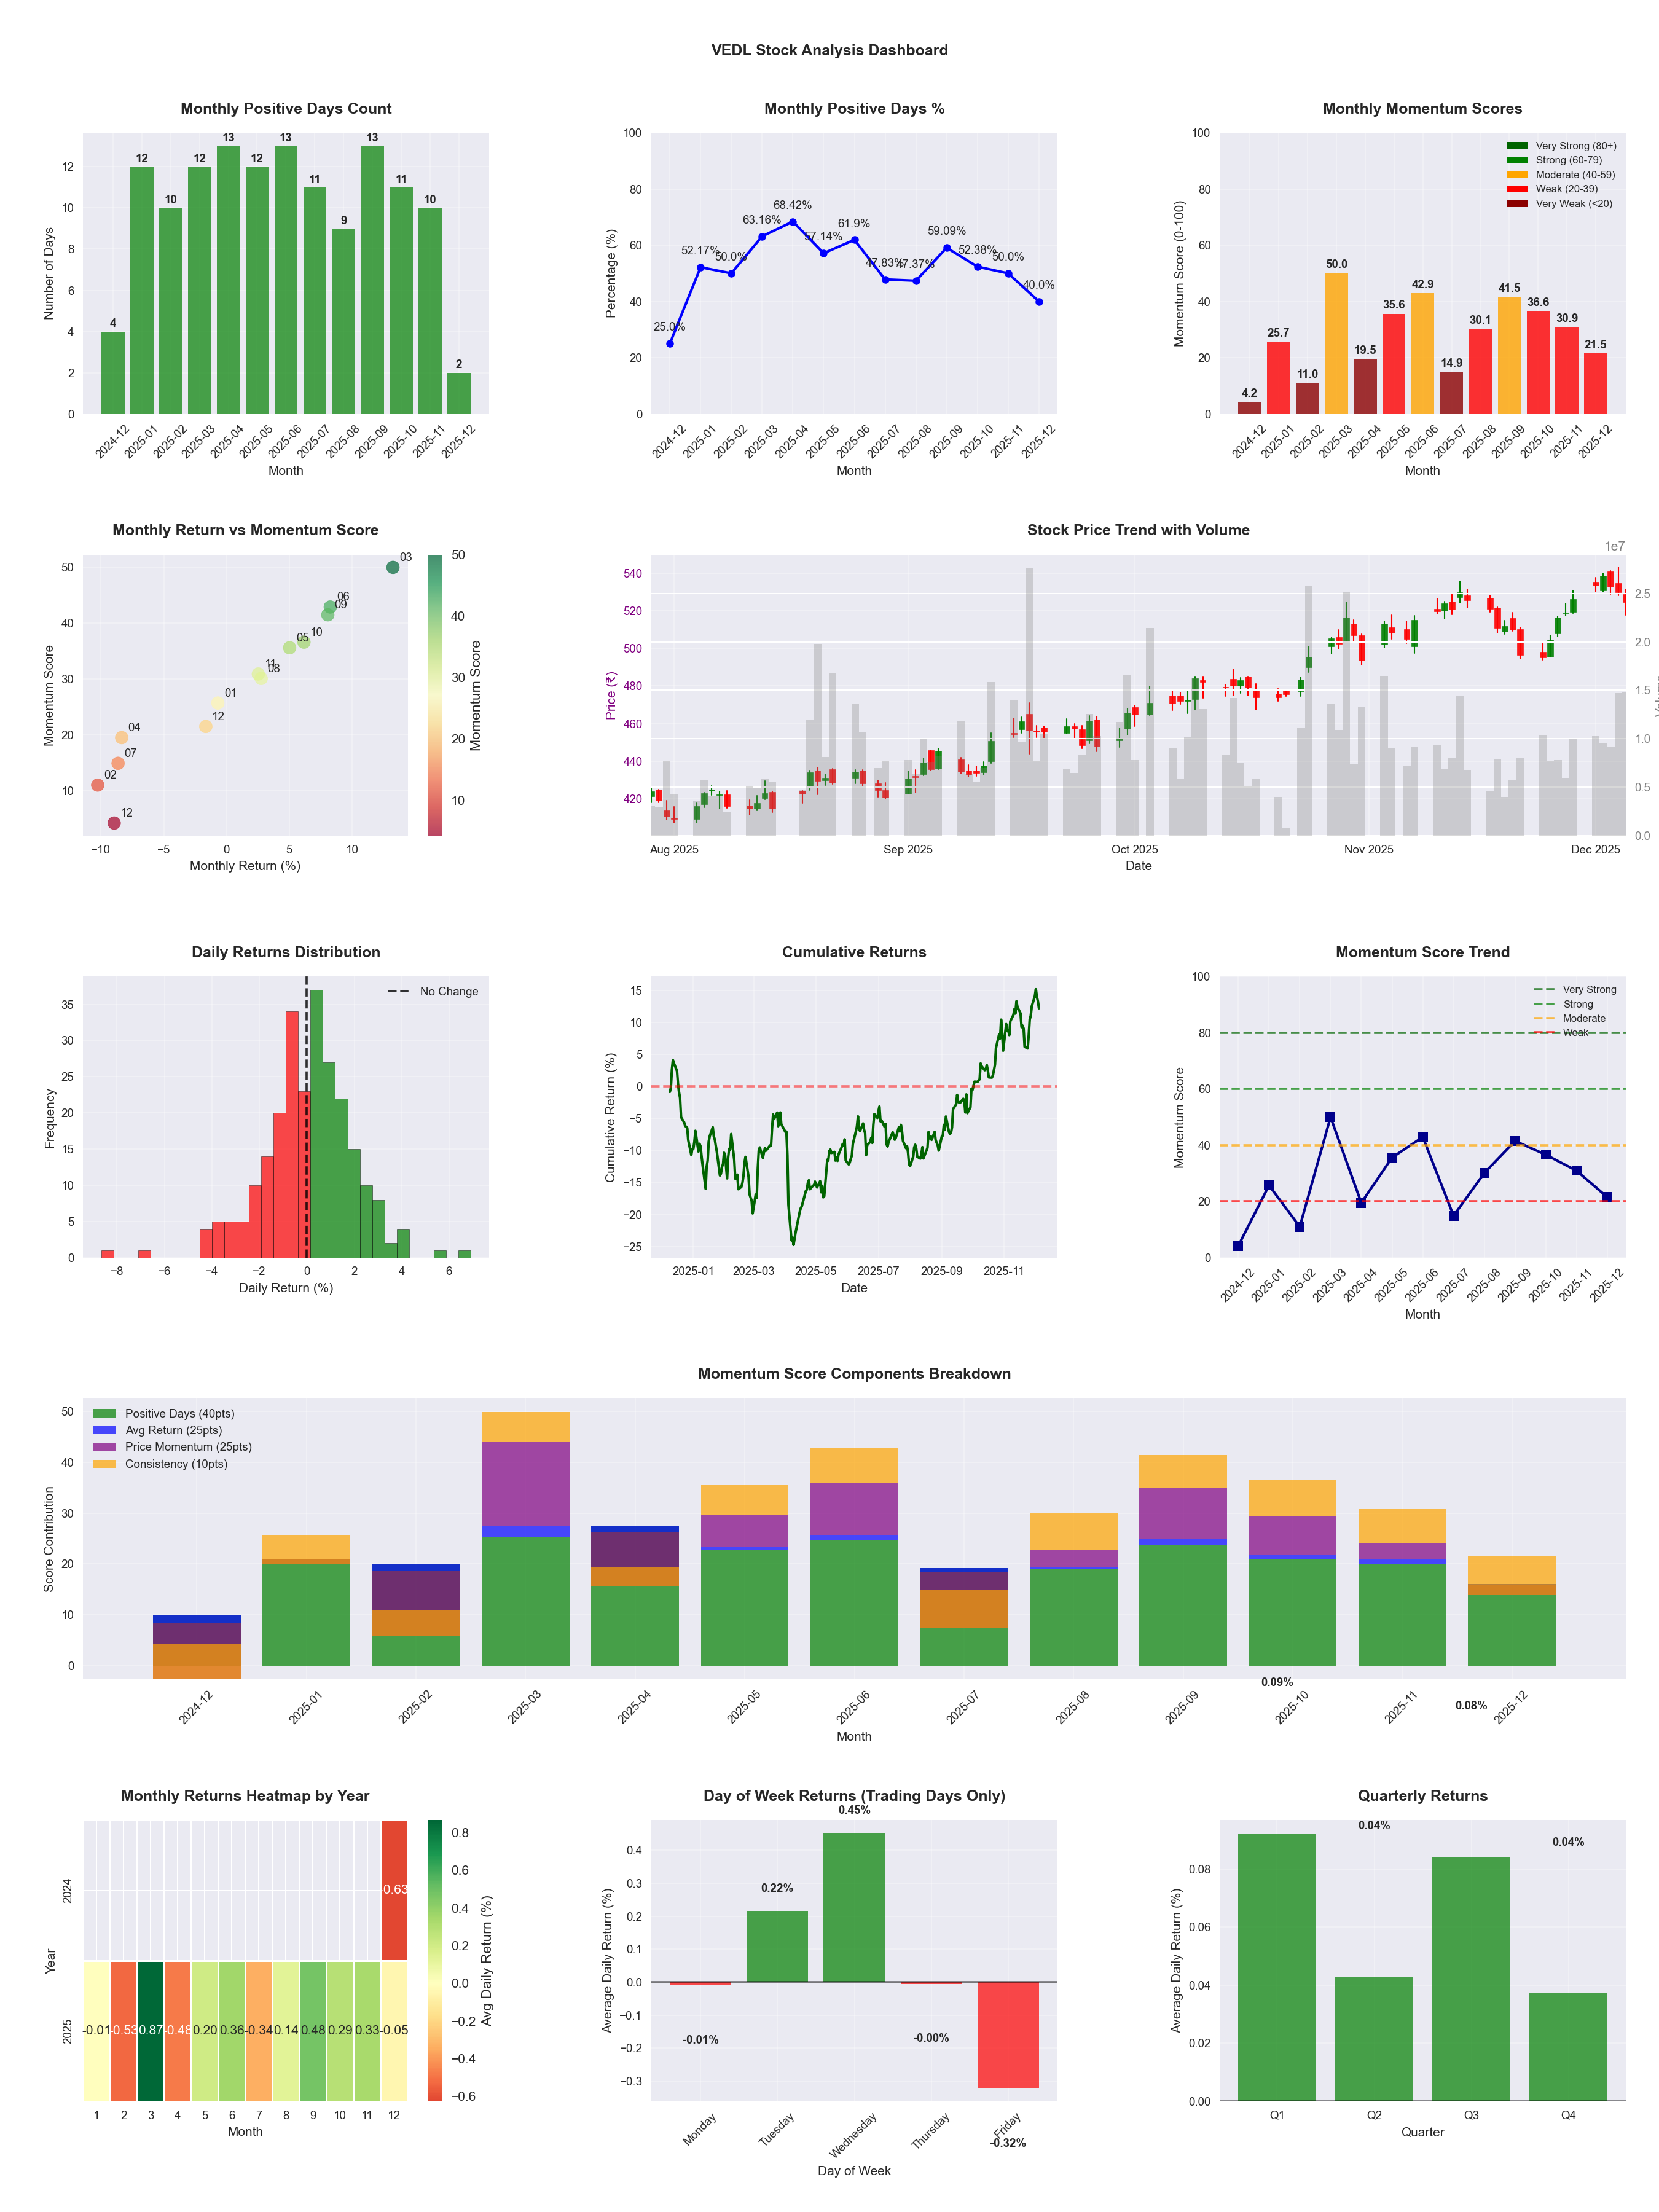
📊 Key Insights & Metrics
Symbol
📈 VEDL
Date
📅 2026-04-11
Volatility
🟡 1.90%
Win Rate
✅ 60.2%
Avg Daily Return
📈 +0.32%
Max Drawdown
📉 -15.74%
IBD RS Score
📊 98.8
Leader
Market Rank
#6
Best Month
🏆 2026-04
Worst Month
📉 2026-03
Best Months to Trade
📅 Apr, Dec, Jan
Best Days to Trade
📅 Tuesday, Wednesday
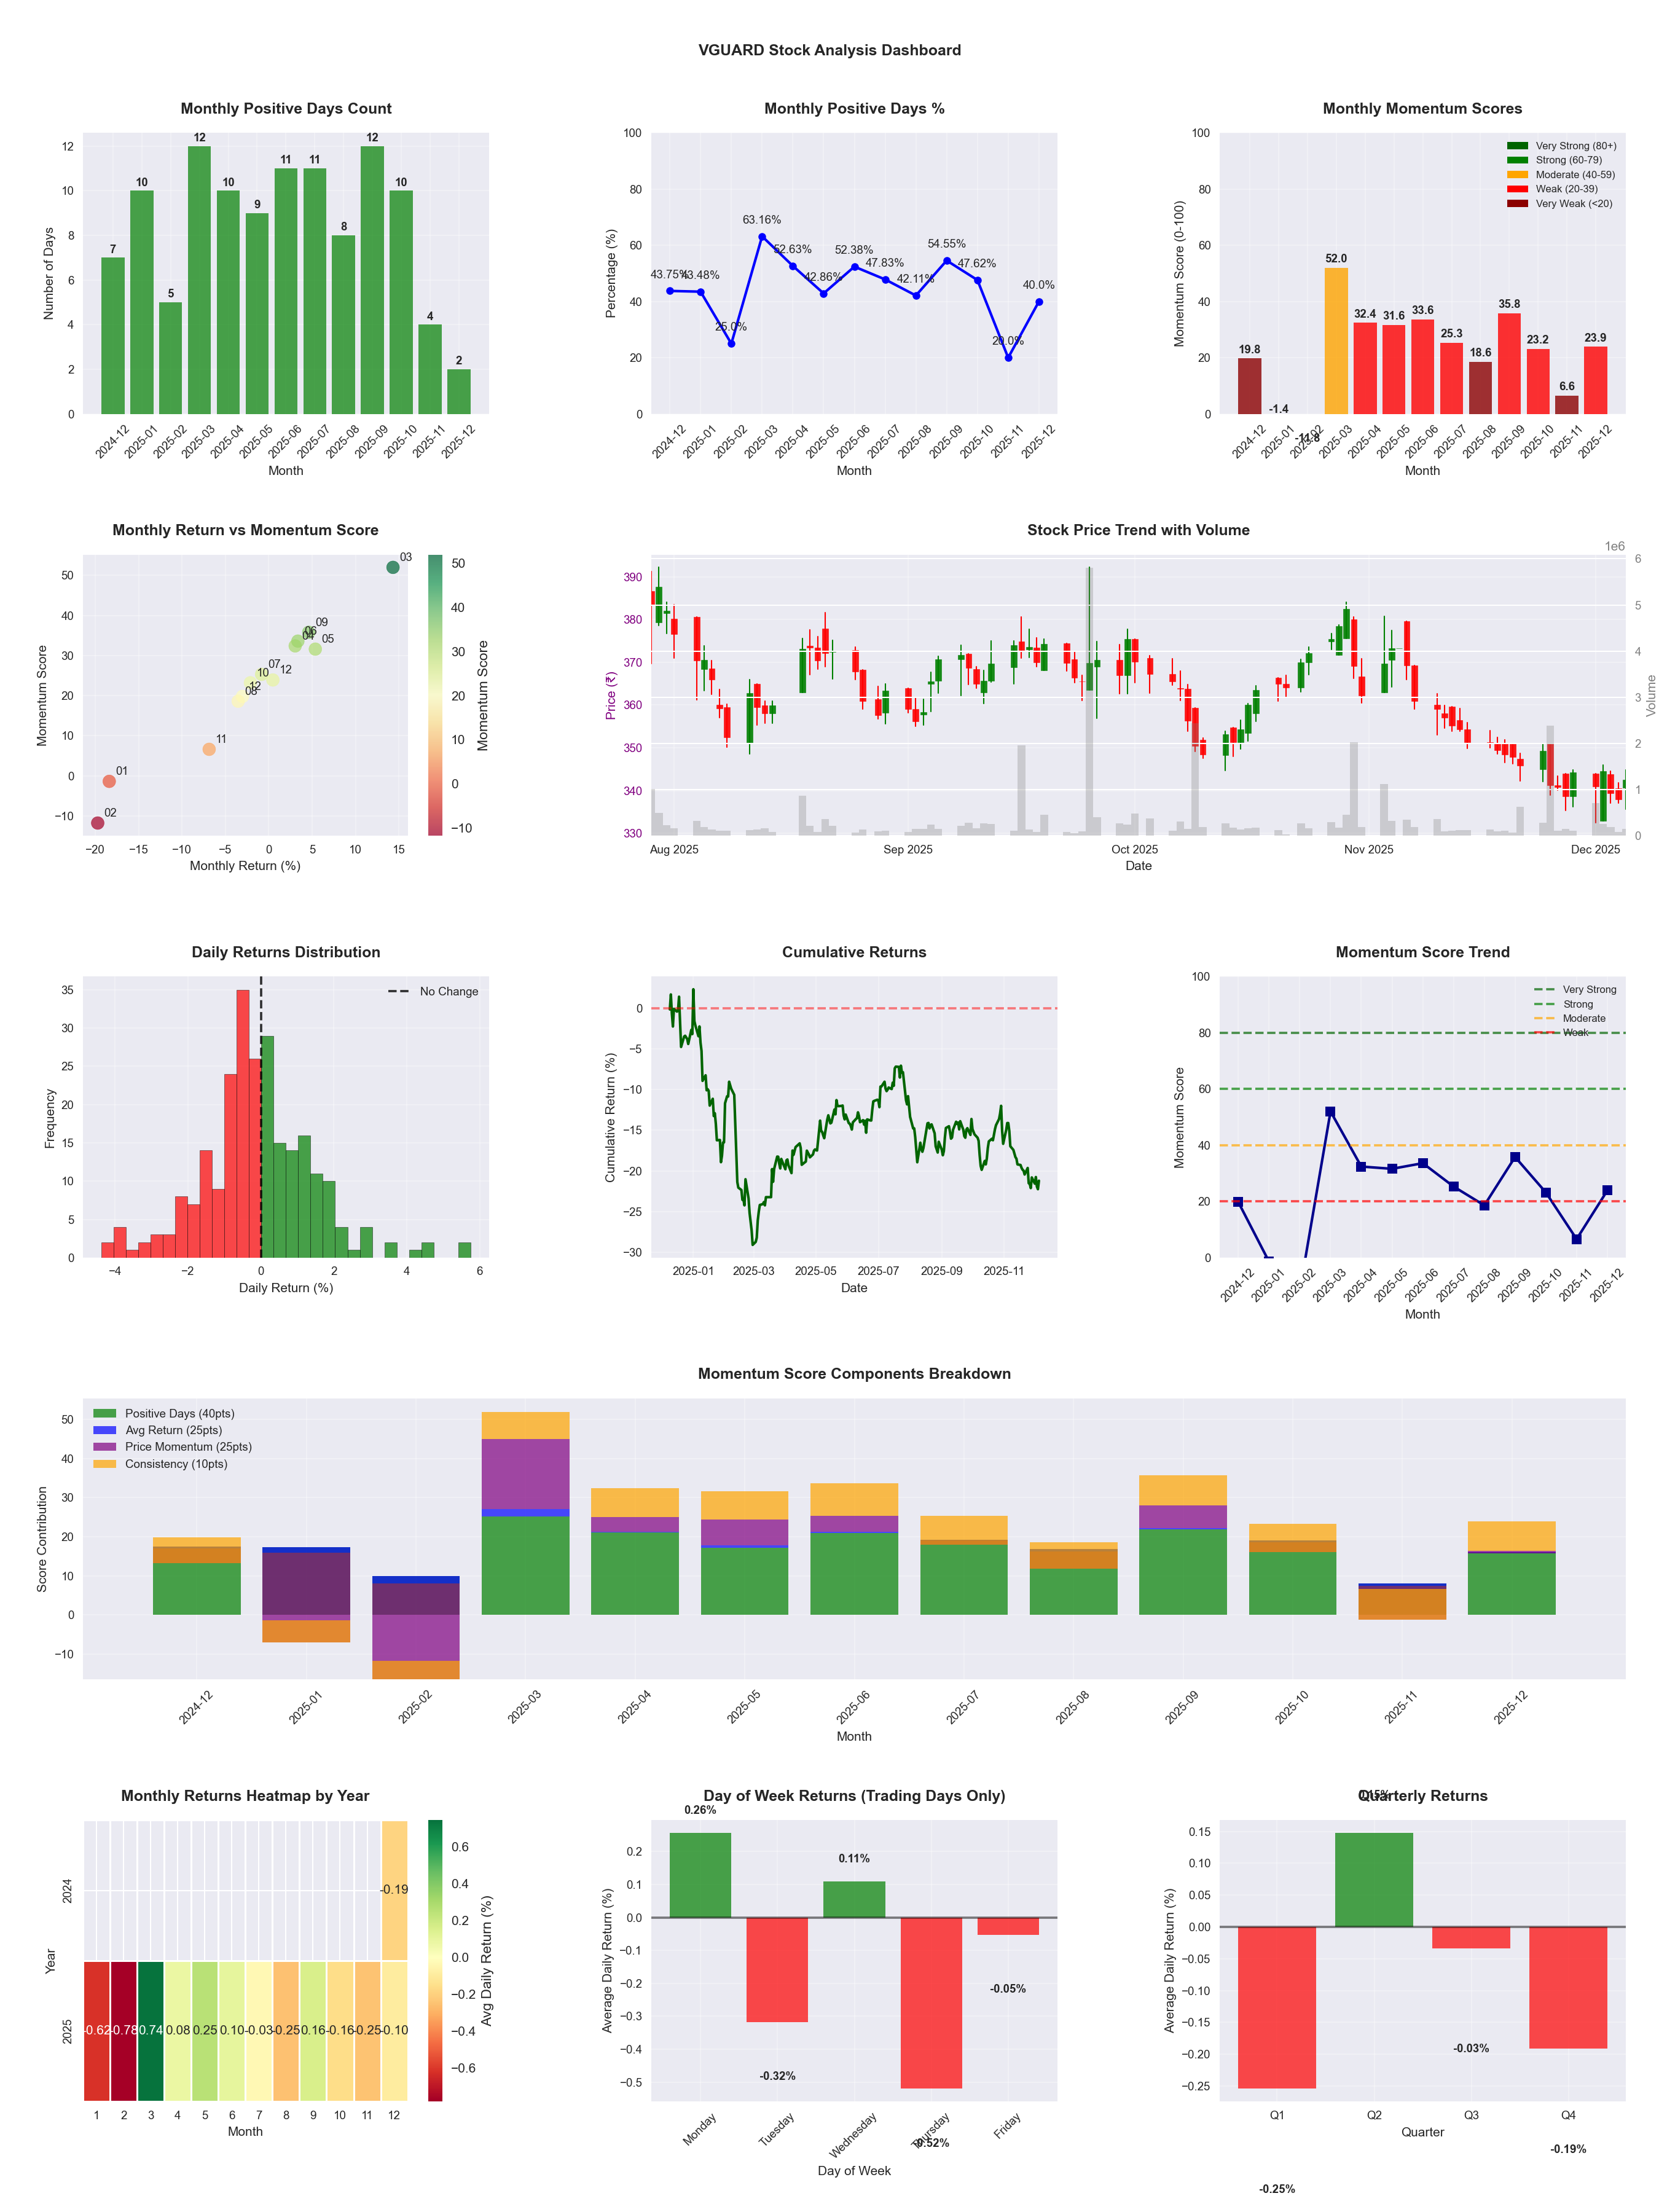
📊 Key Insights & Metrics
Symbol
📈 VGUARD
Date
📅 2026-04-11
Volatility
🟢 1.43%
Win Rate
⚠️ 46.8%
Avg Daily Return
📉 -0.04%
Max Drawdown
📉 -25.65%
IBD RS Score
📊 47.1
Weak
Market Rank
#261
Best Month
🏆 2026-01
Worst Month
📉 2025-11
Best Months to Trade
📅 Jan, May, Sep
Best Days to Trade
📅 Monday, Friday
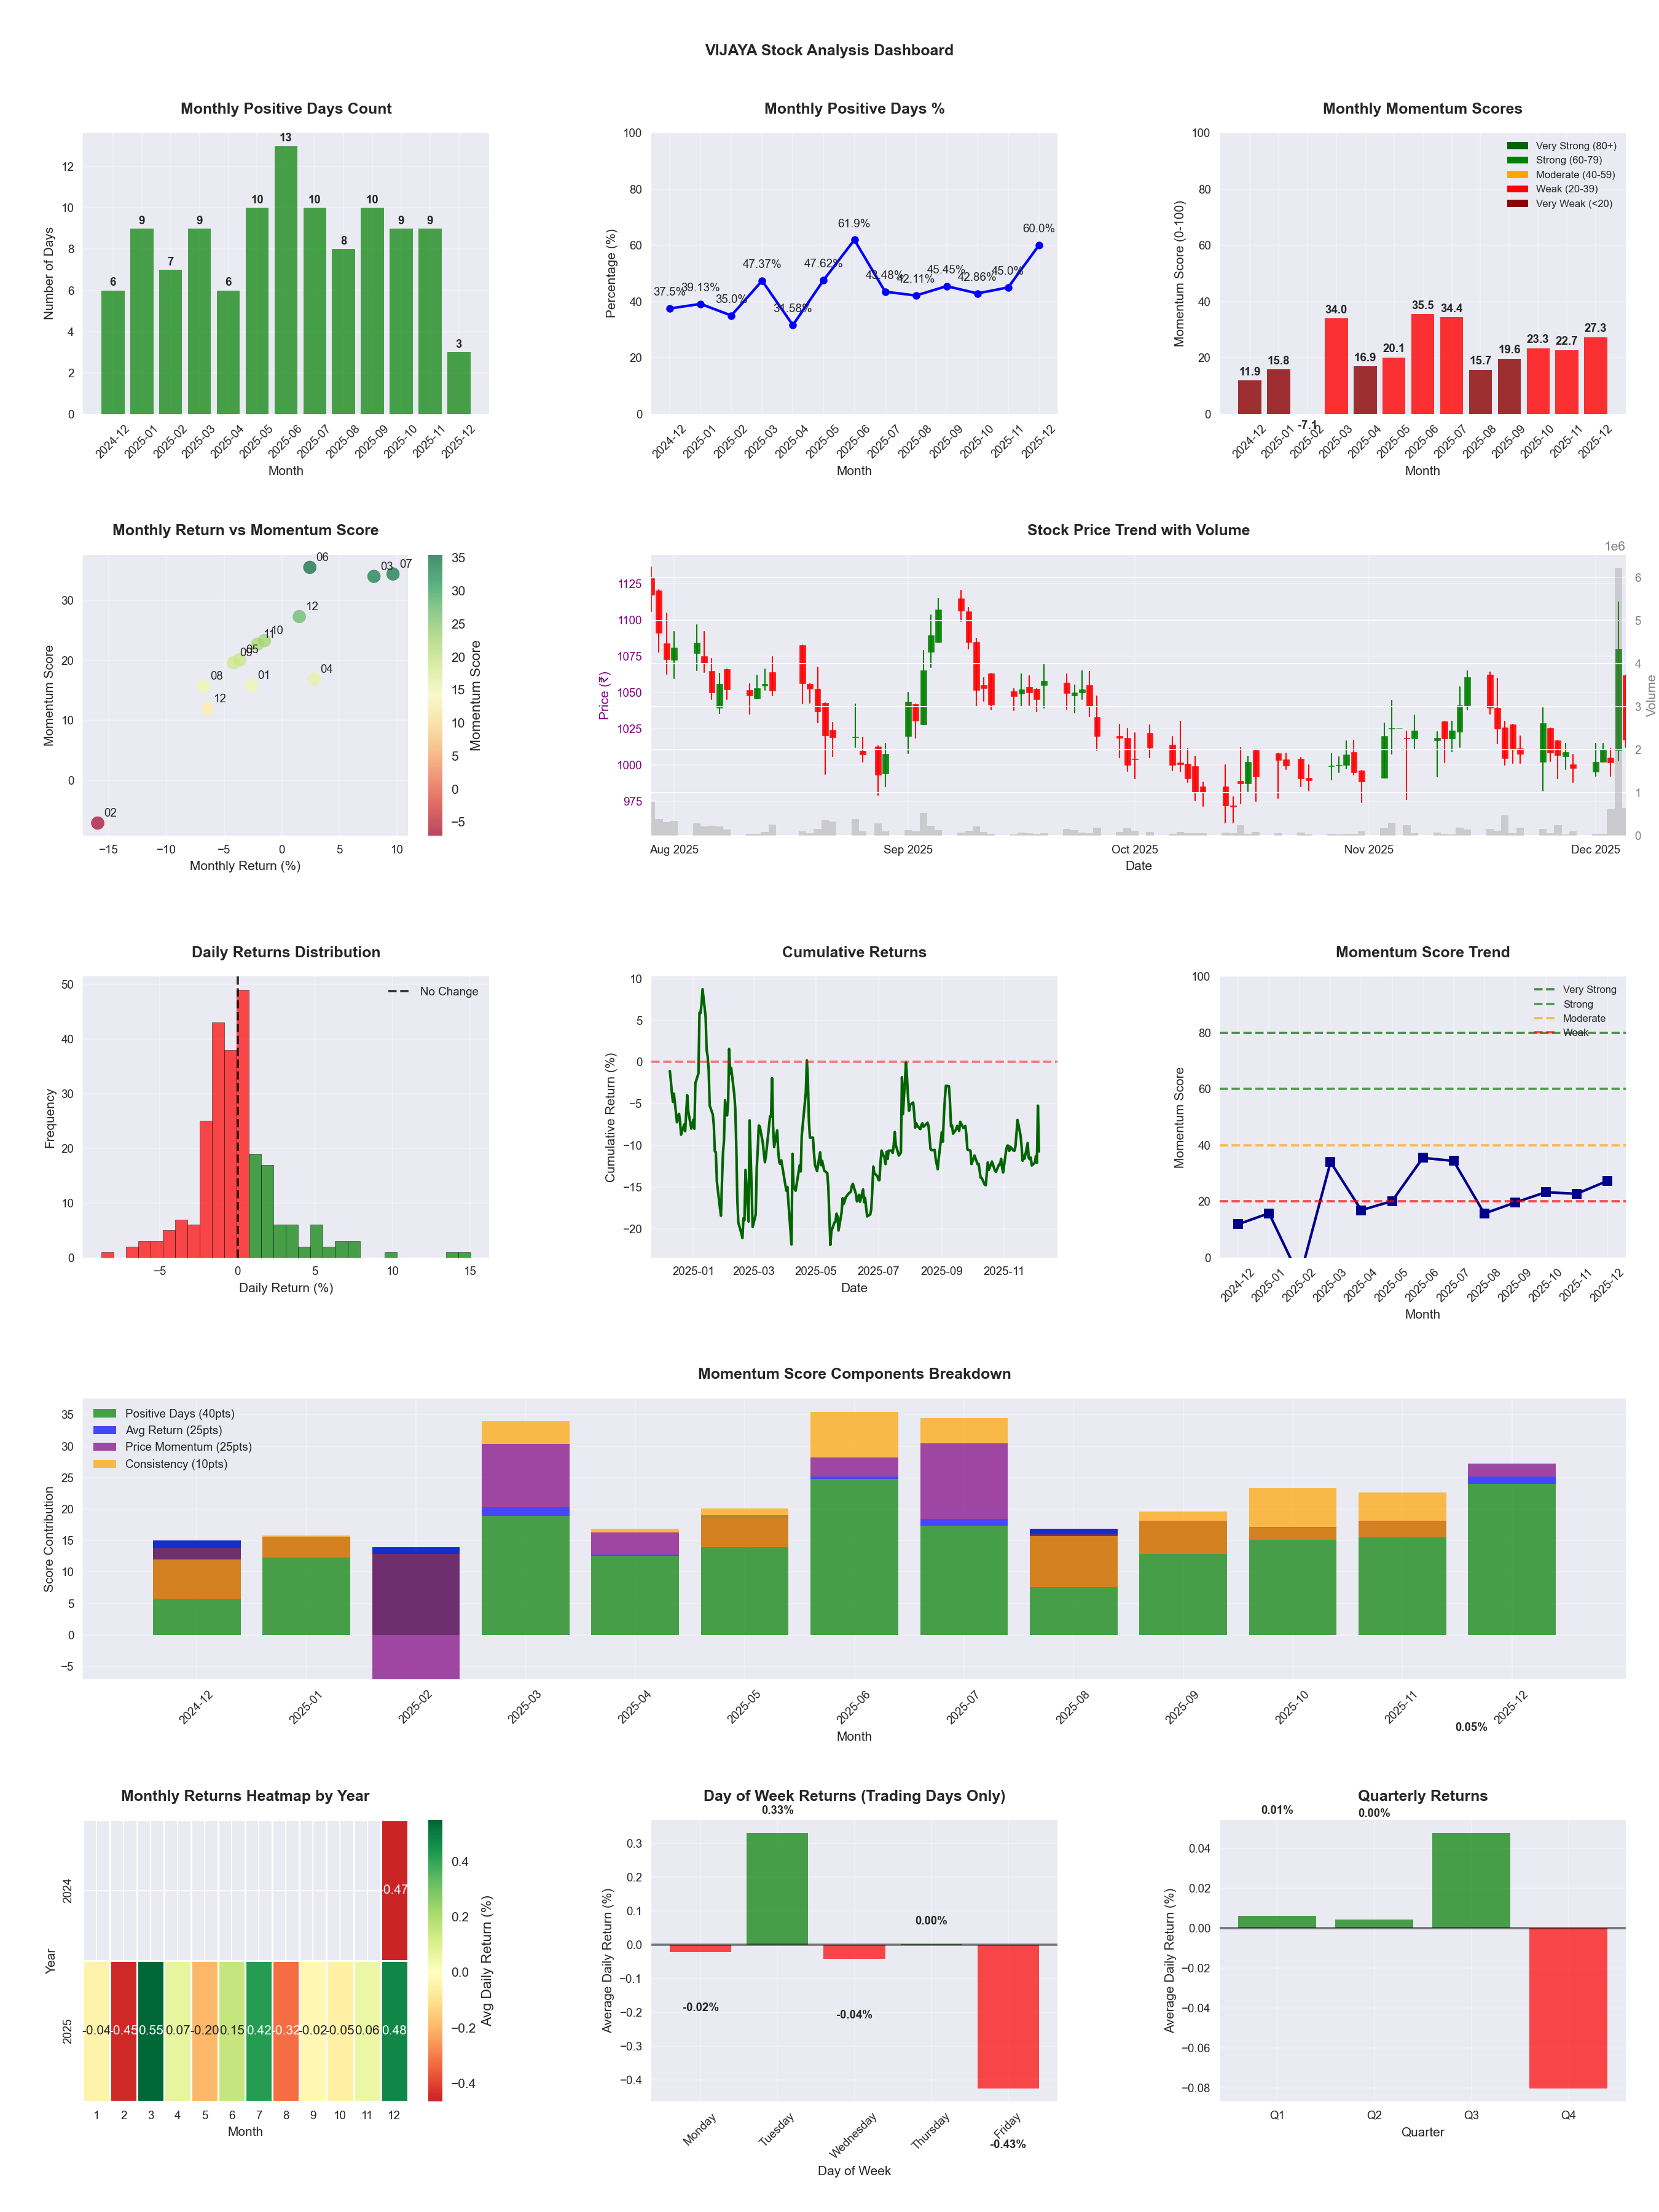
📊 Key Insights & Metrics
Symbol
📈 VIJAYA
Date
📅 2026-04-11
Volatility
🟡 1.89%
Win Rate
⚠️ 46.9%
Avg Daily Return
📈 +0.03%
Max Drawdown
📉 -24.56%
IBD RS Score
📊 59.4
Average
Market Rank
#200
Best Month
🏆 2026-04
Worst Month
📉 2026-03
Best Months to Trade
📅 Apr, Jul, Dec
Best Days to Trade
📅 Monday, Thursday
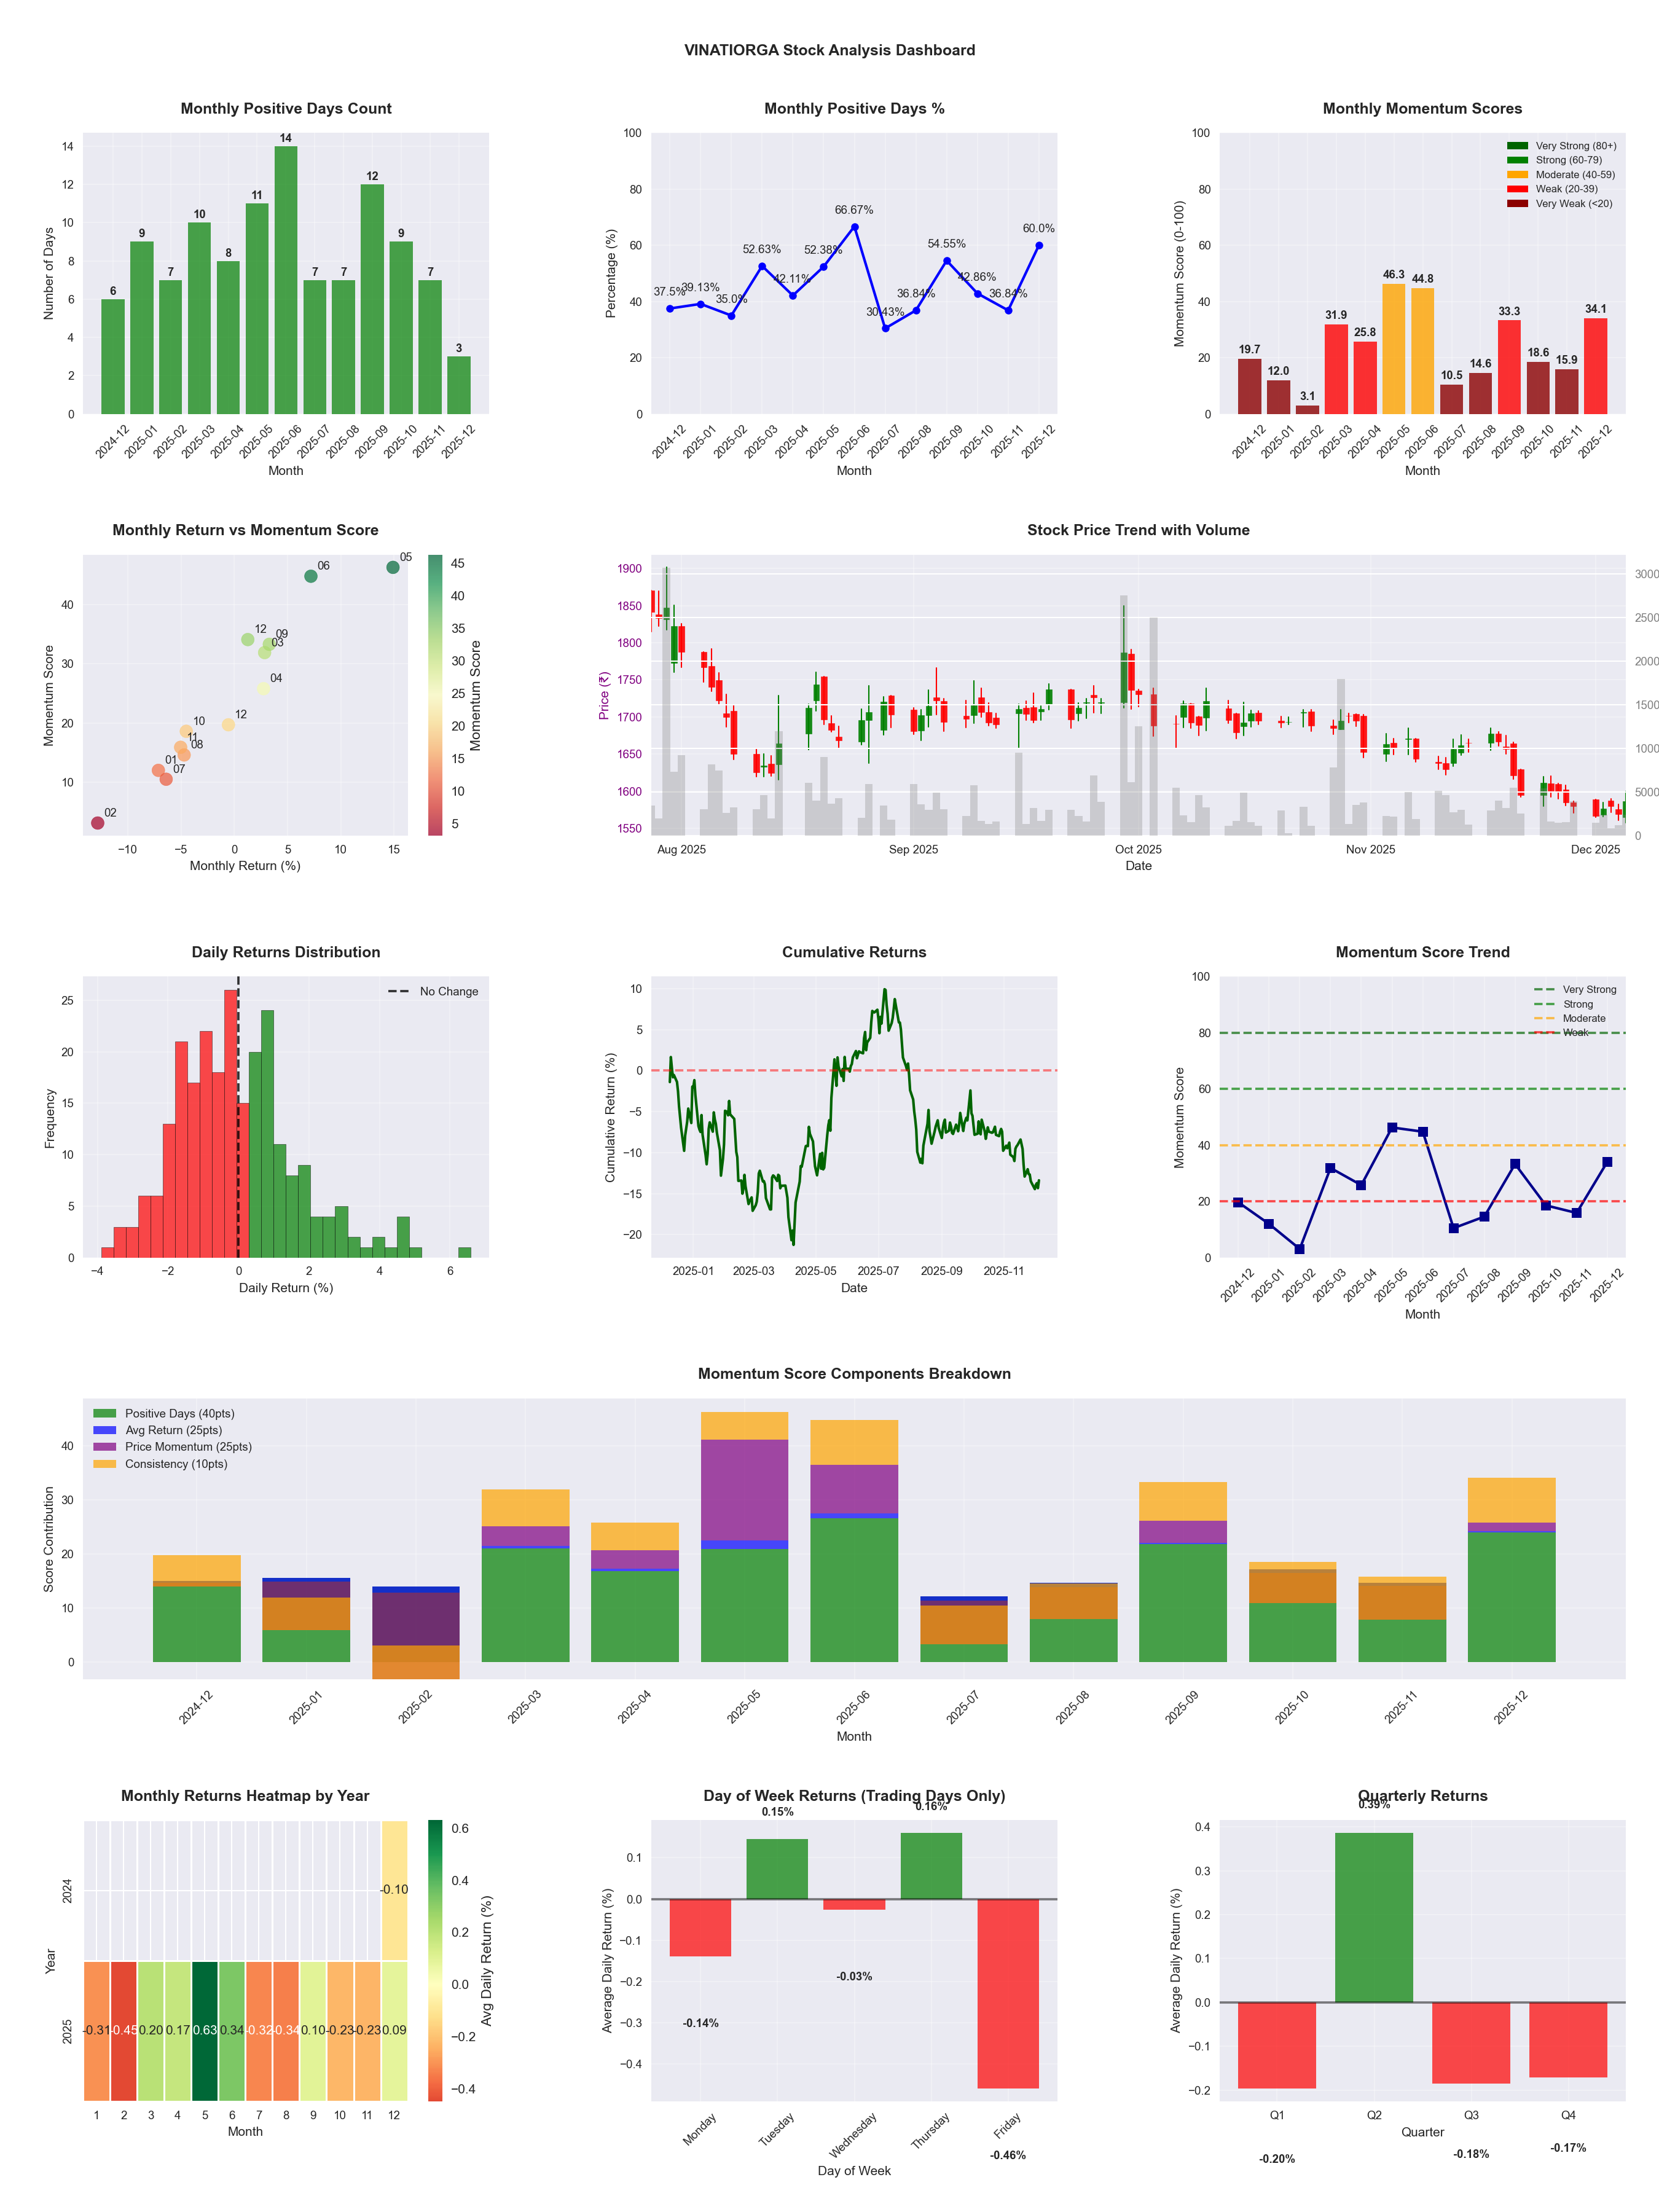
📊 Key Insights & Metrics
Symbol
📈 VINATIORGA
Date
📅 2026-03-21
Volatility
🟡 1.55%
Win Rate
⚠️ 45.8%
Avg Daily Return
📉 -0.04%
Max Drawdown
📉 -33.04%
Best Month
🏆 2025-05
Worst Month
📉 2025-07
Best Months to Trade
📅 May, Jun, Apr
Best Days to Trade
📅 Monday, Tuesday
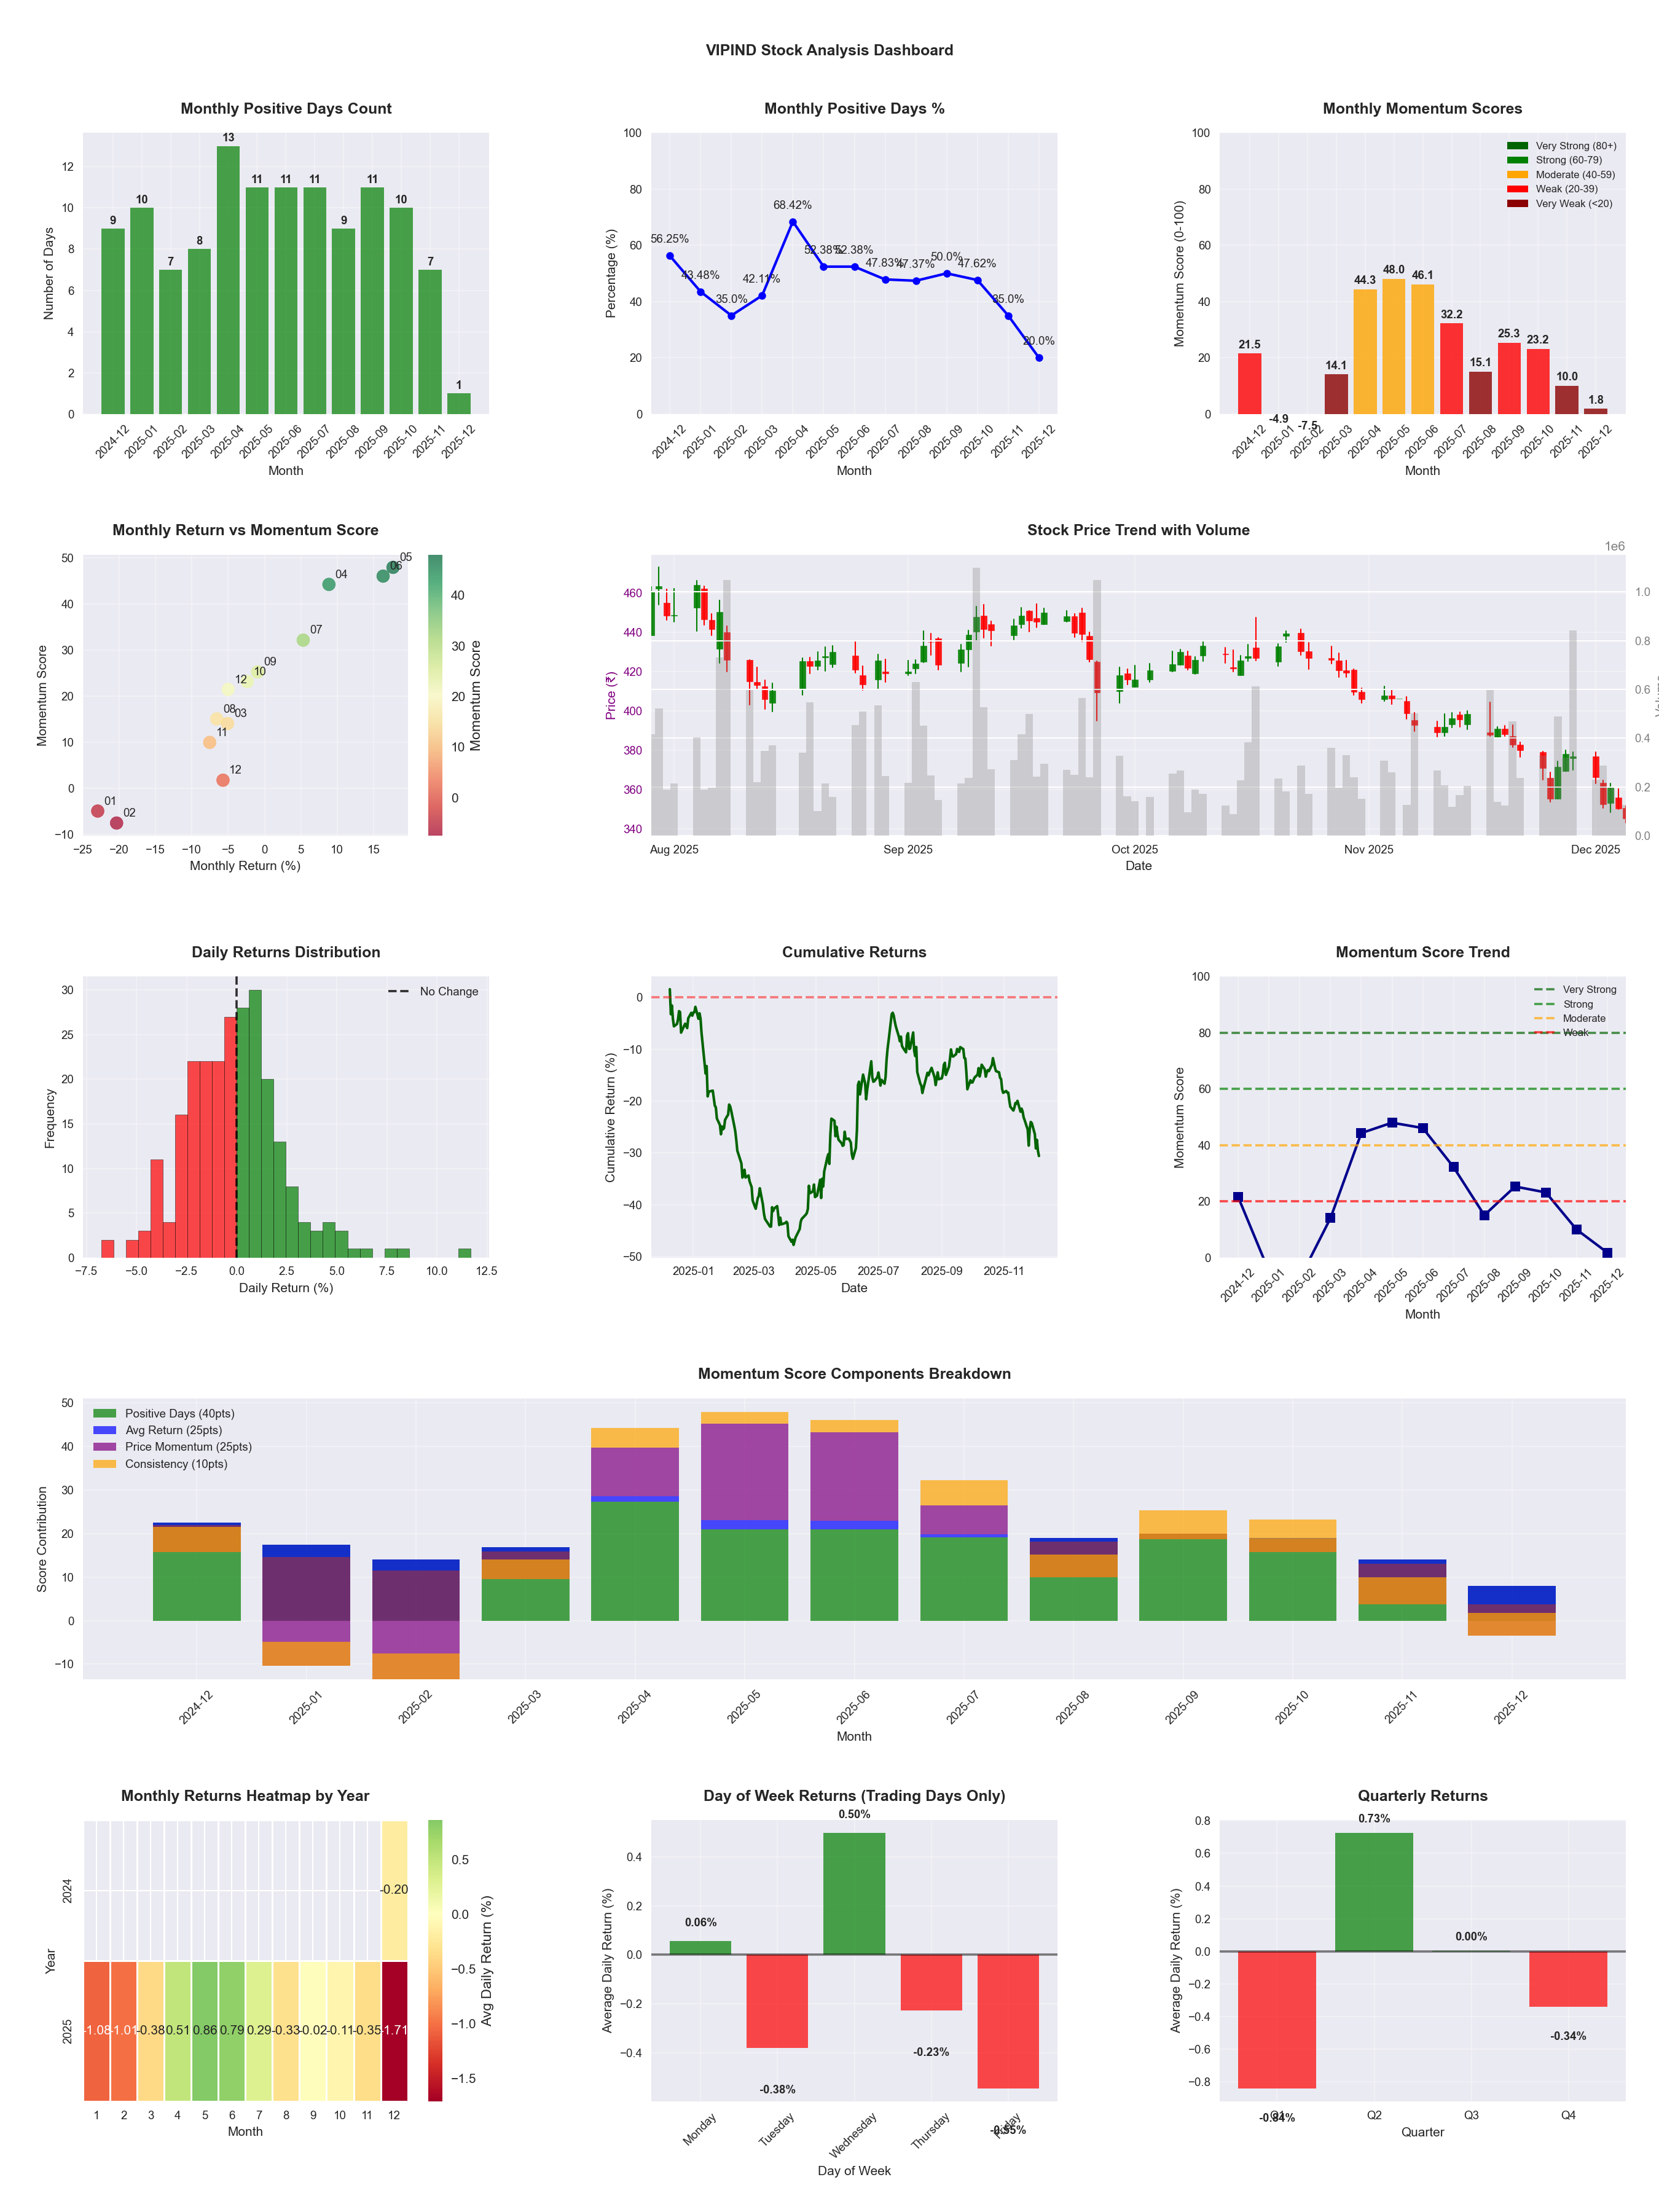
📊 Key Insights & Metrics
Symbol
📈 VIPIND
Date
📅 2026-03-21
Volatility
🟡 2.57%
Risk Profile
⚠️ suitable for aggressive investors
Win Rate
⚠️ 48.8%
Avg Daily Return
📈 +0.09%
Max Drawdown
📉 -33.01%
Best Month
🏆 2025-05
Worst Month
📉 2025-11
Best Months to Trade
📅 May, Jun, Apr
Best Days to Trade
📅 Wednesday, Monday
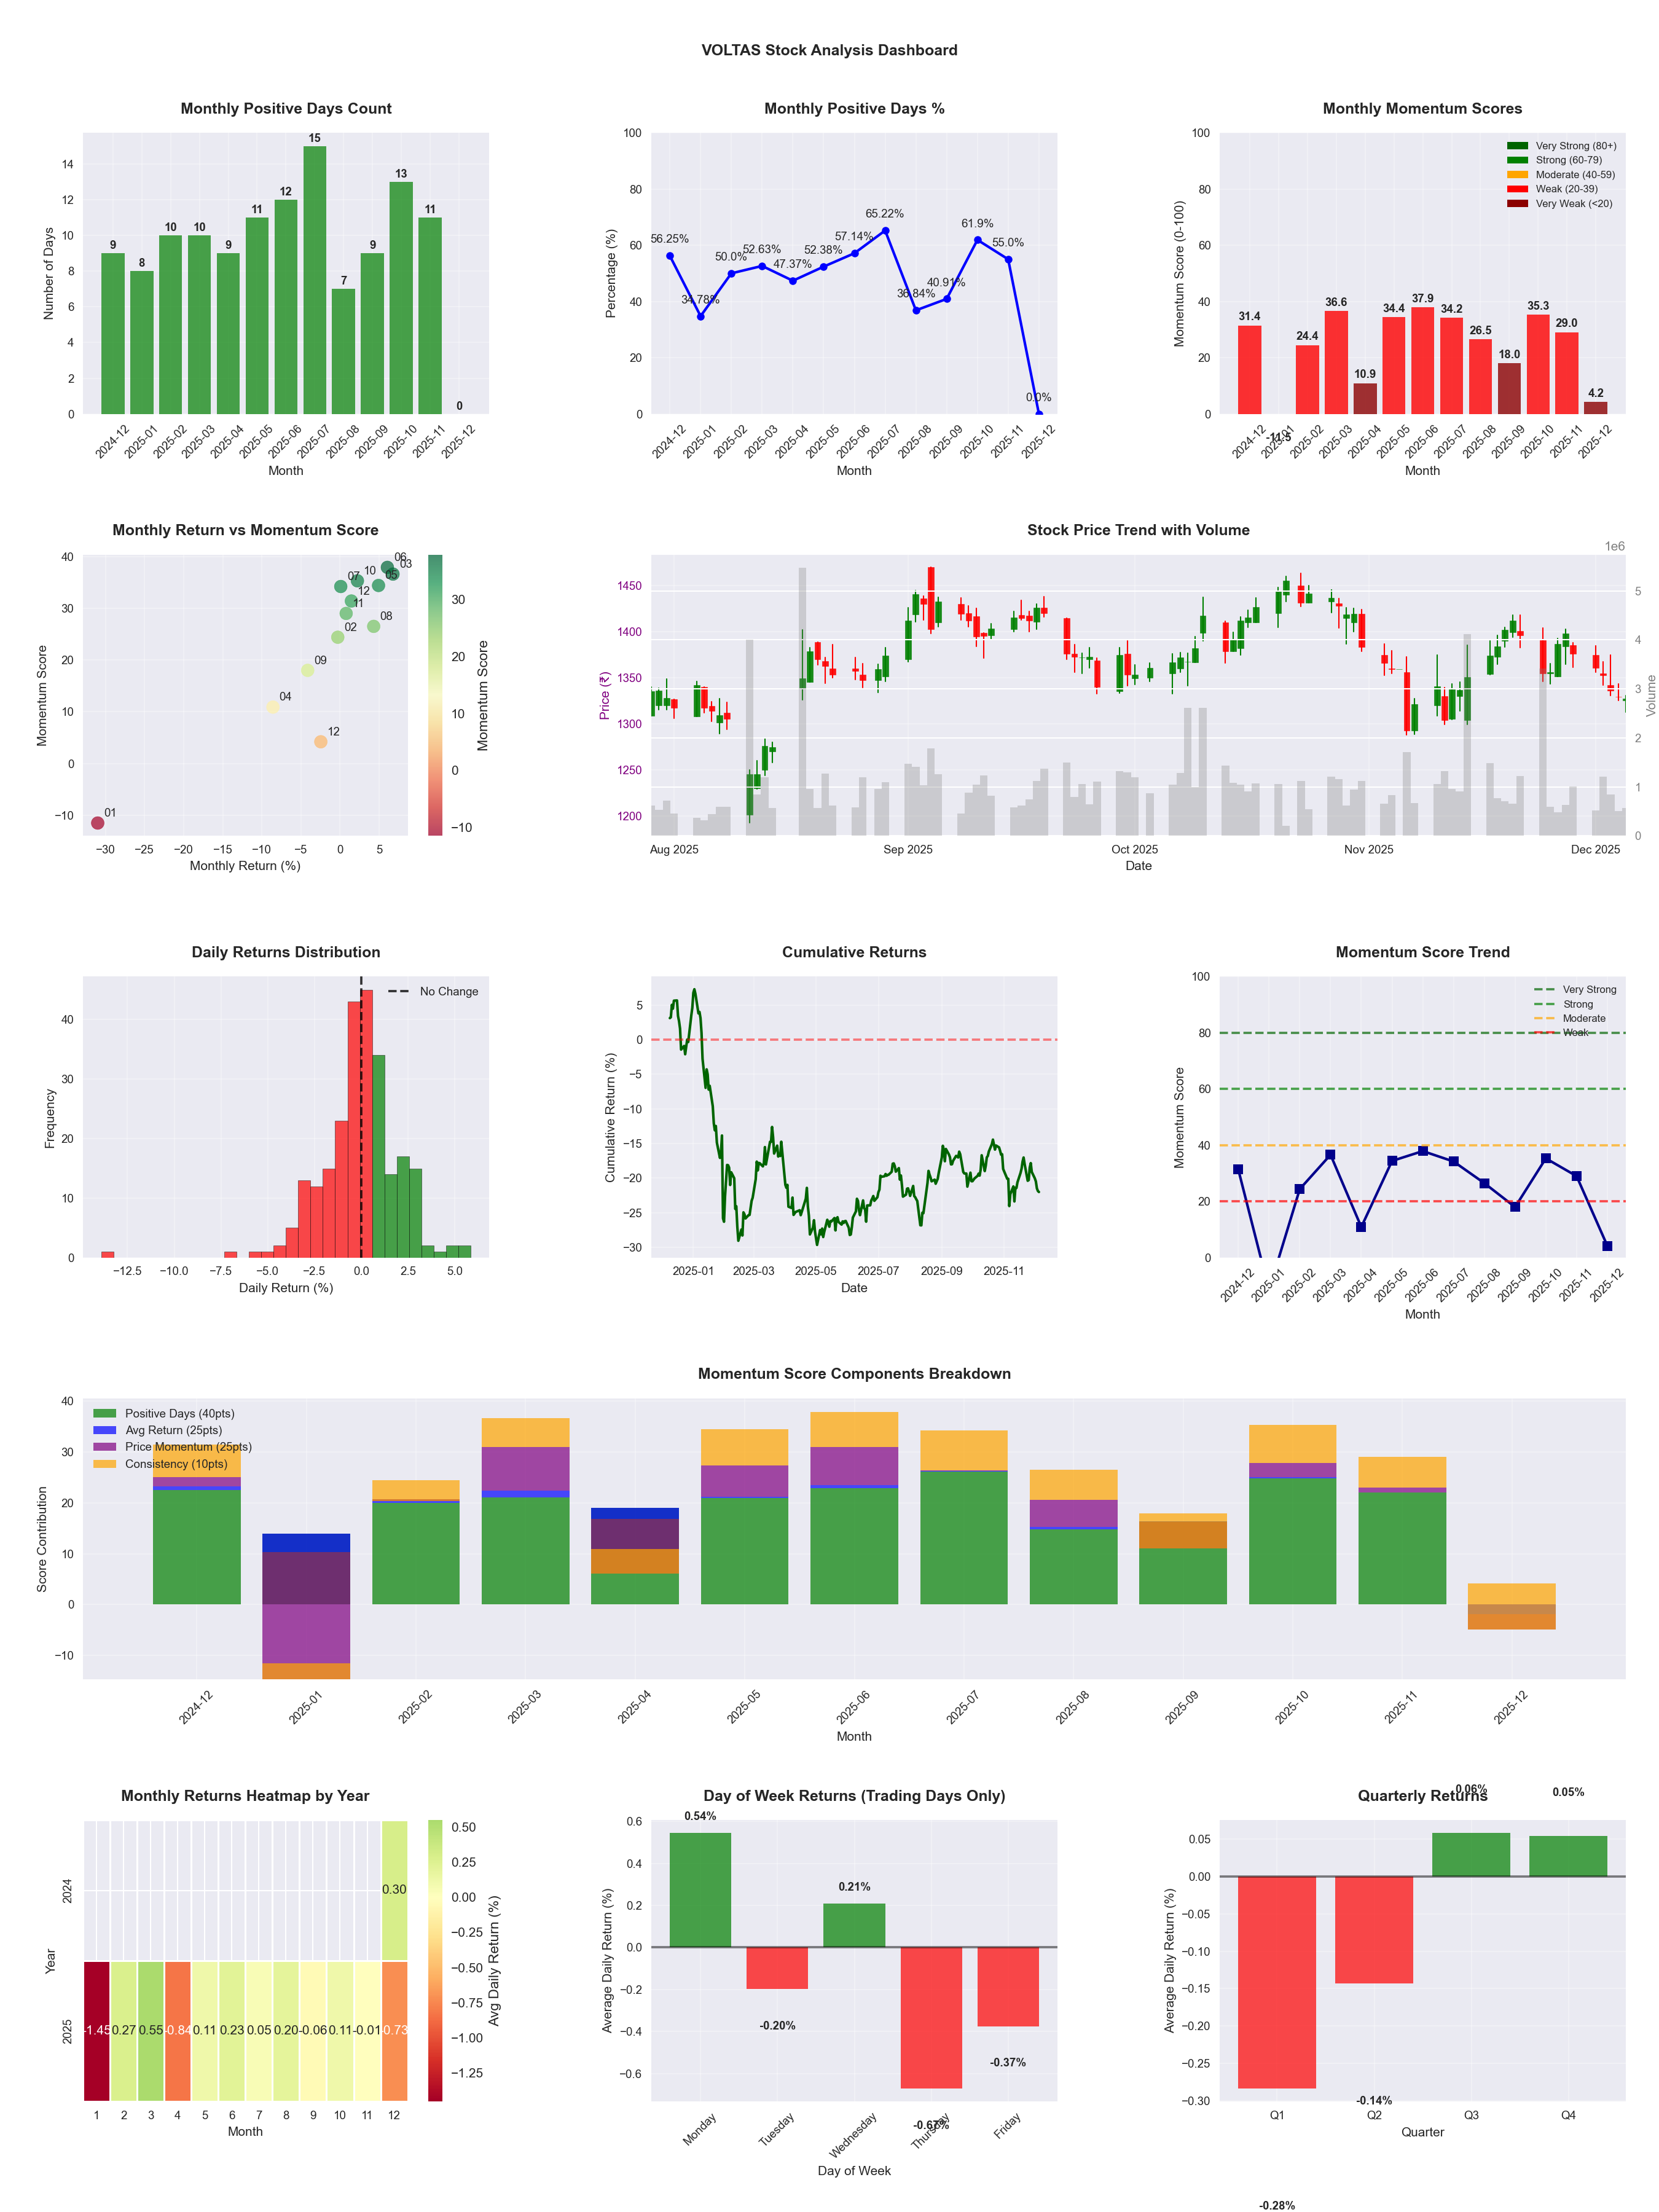
📊 Key Insights & Metrics
Symbol
📈 VOLTAS
Date
📅 2026-04-11
Volatility
🟡 1.83%
Win Rate
⚠️ 51.6%
Avg Daily Return
📈 +0.03%
Max Drawdown
📉 -21.85%
IBD RS Score
📊 50.3
Average
Market Rank
#245
Best Month
🏆 2026-02
Best Months to Trade
📅 Feb, Jun, Aug
Best Days to Trade
📅 Wednesday, Monday
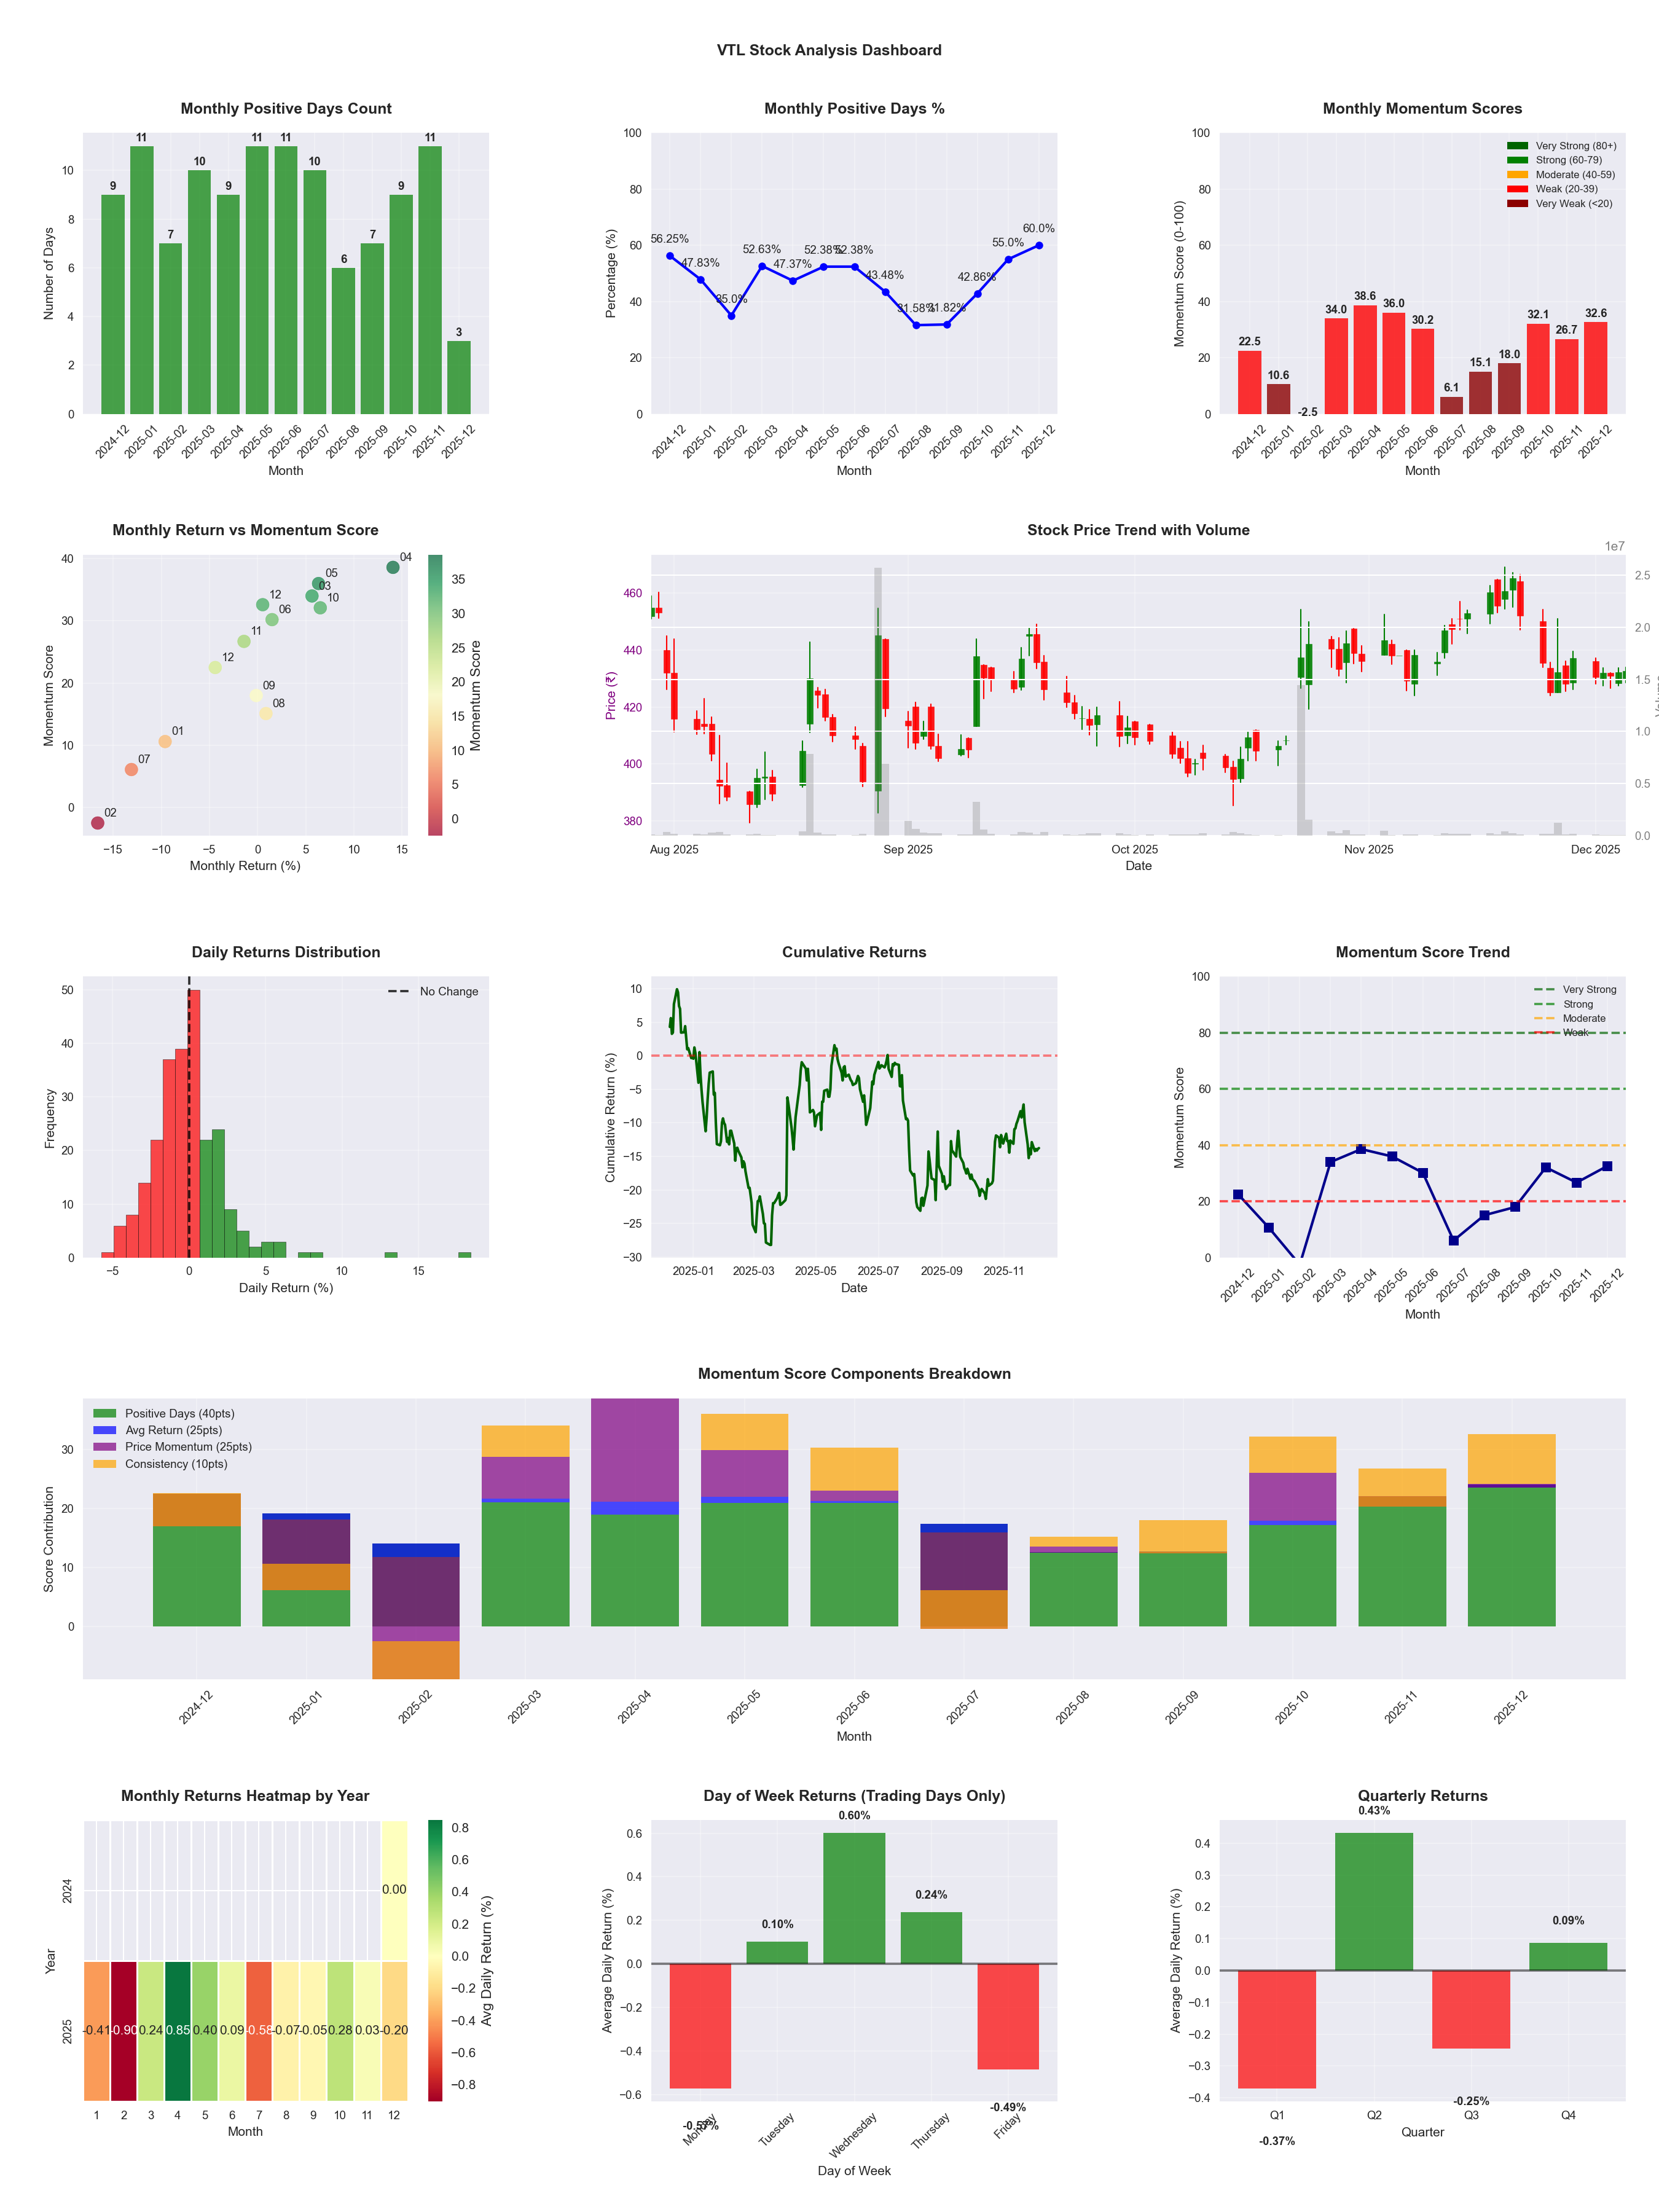
📊 Key Insights & Metrics
Symbol
📈 VTL
Date
📅 2026-04-11
Volatility
🟡 2.26%
Risk Profile
⚠️ suitable for aggressive investors
Win Rate
⚠️ 47.6%
Avg Daily Return
📈 +0.11%
Max Drawdown
📉 -24.30%
IBD RS Score
📊 93.7
Leader
Market Rank
#31
Best Month
🏆 2026-04
Worst Month
📉 2025-07
Best Months to Trade
📅 Feb, May, Apr
Best Days to Trade
📅 Wednesday, Tuesday
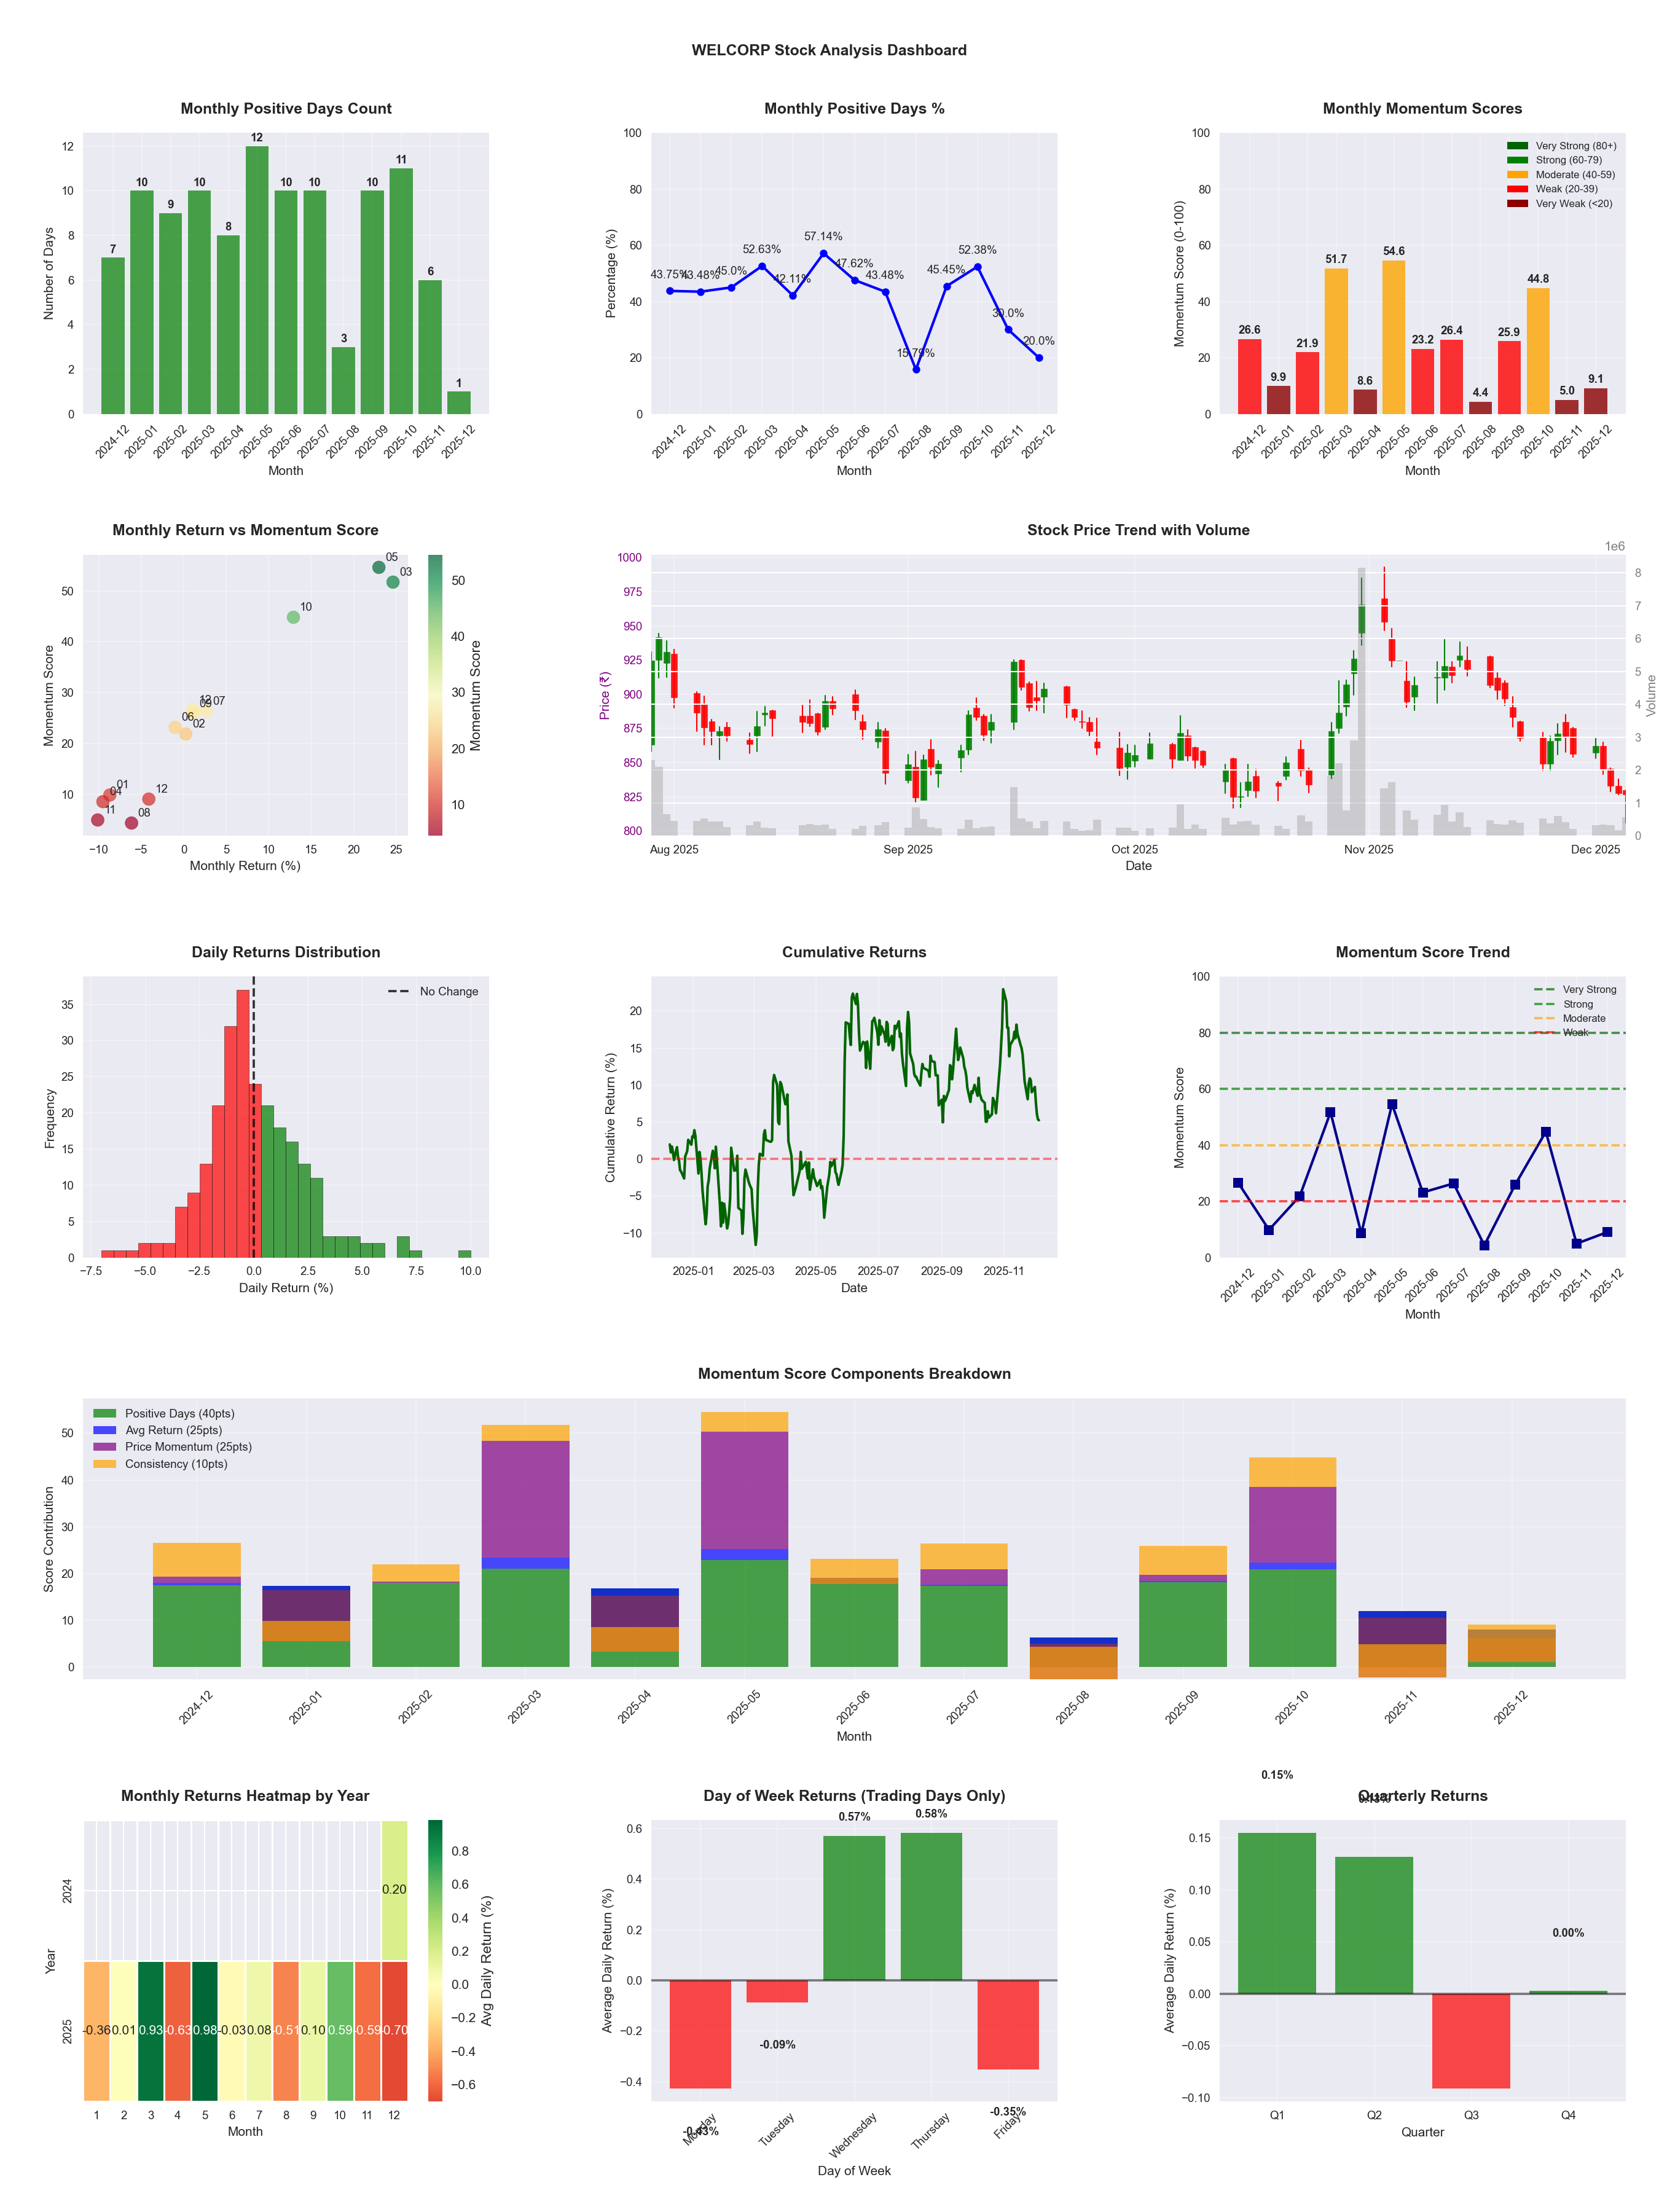
📊 Key Insights & Metrics
Symbol
📈 WELCORP
Date
📅 2026-04-11
Volatility
🟡 2.24%
Risk Profile
⚠️ suitable for aggressive investors
Win Rate
⚠️ 43.5%
Avg Daily Return
📈 +0.12%
Max Drawdown
📉 -25.25%
IBD RS Score
📊 88.6
Strong
Market Rank
#56
Best Month
🏆 2026-04
Worst Month
📉 2026-01
Best Months to Trade
📅 Apr, May, Feb
Best Days to Trade
📅 Wednesday, Tuesday
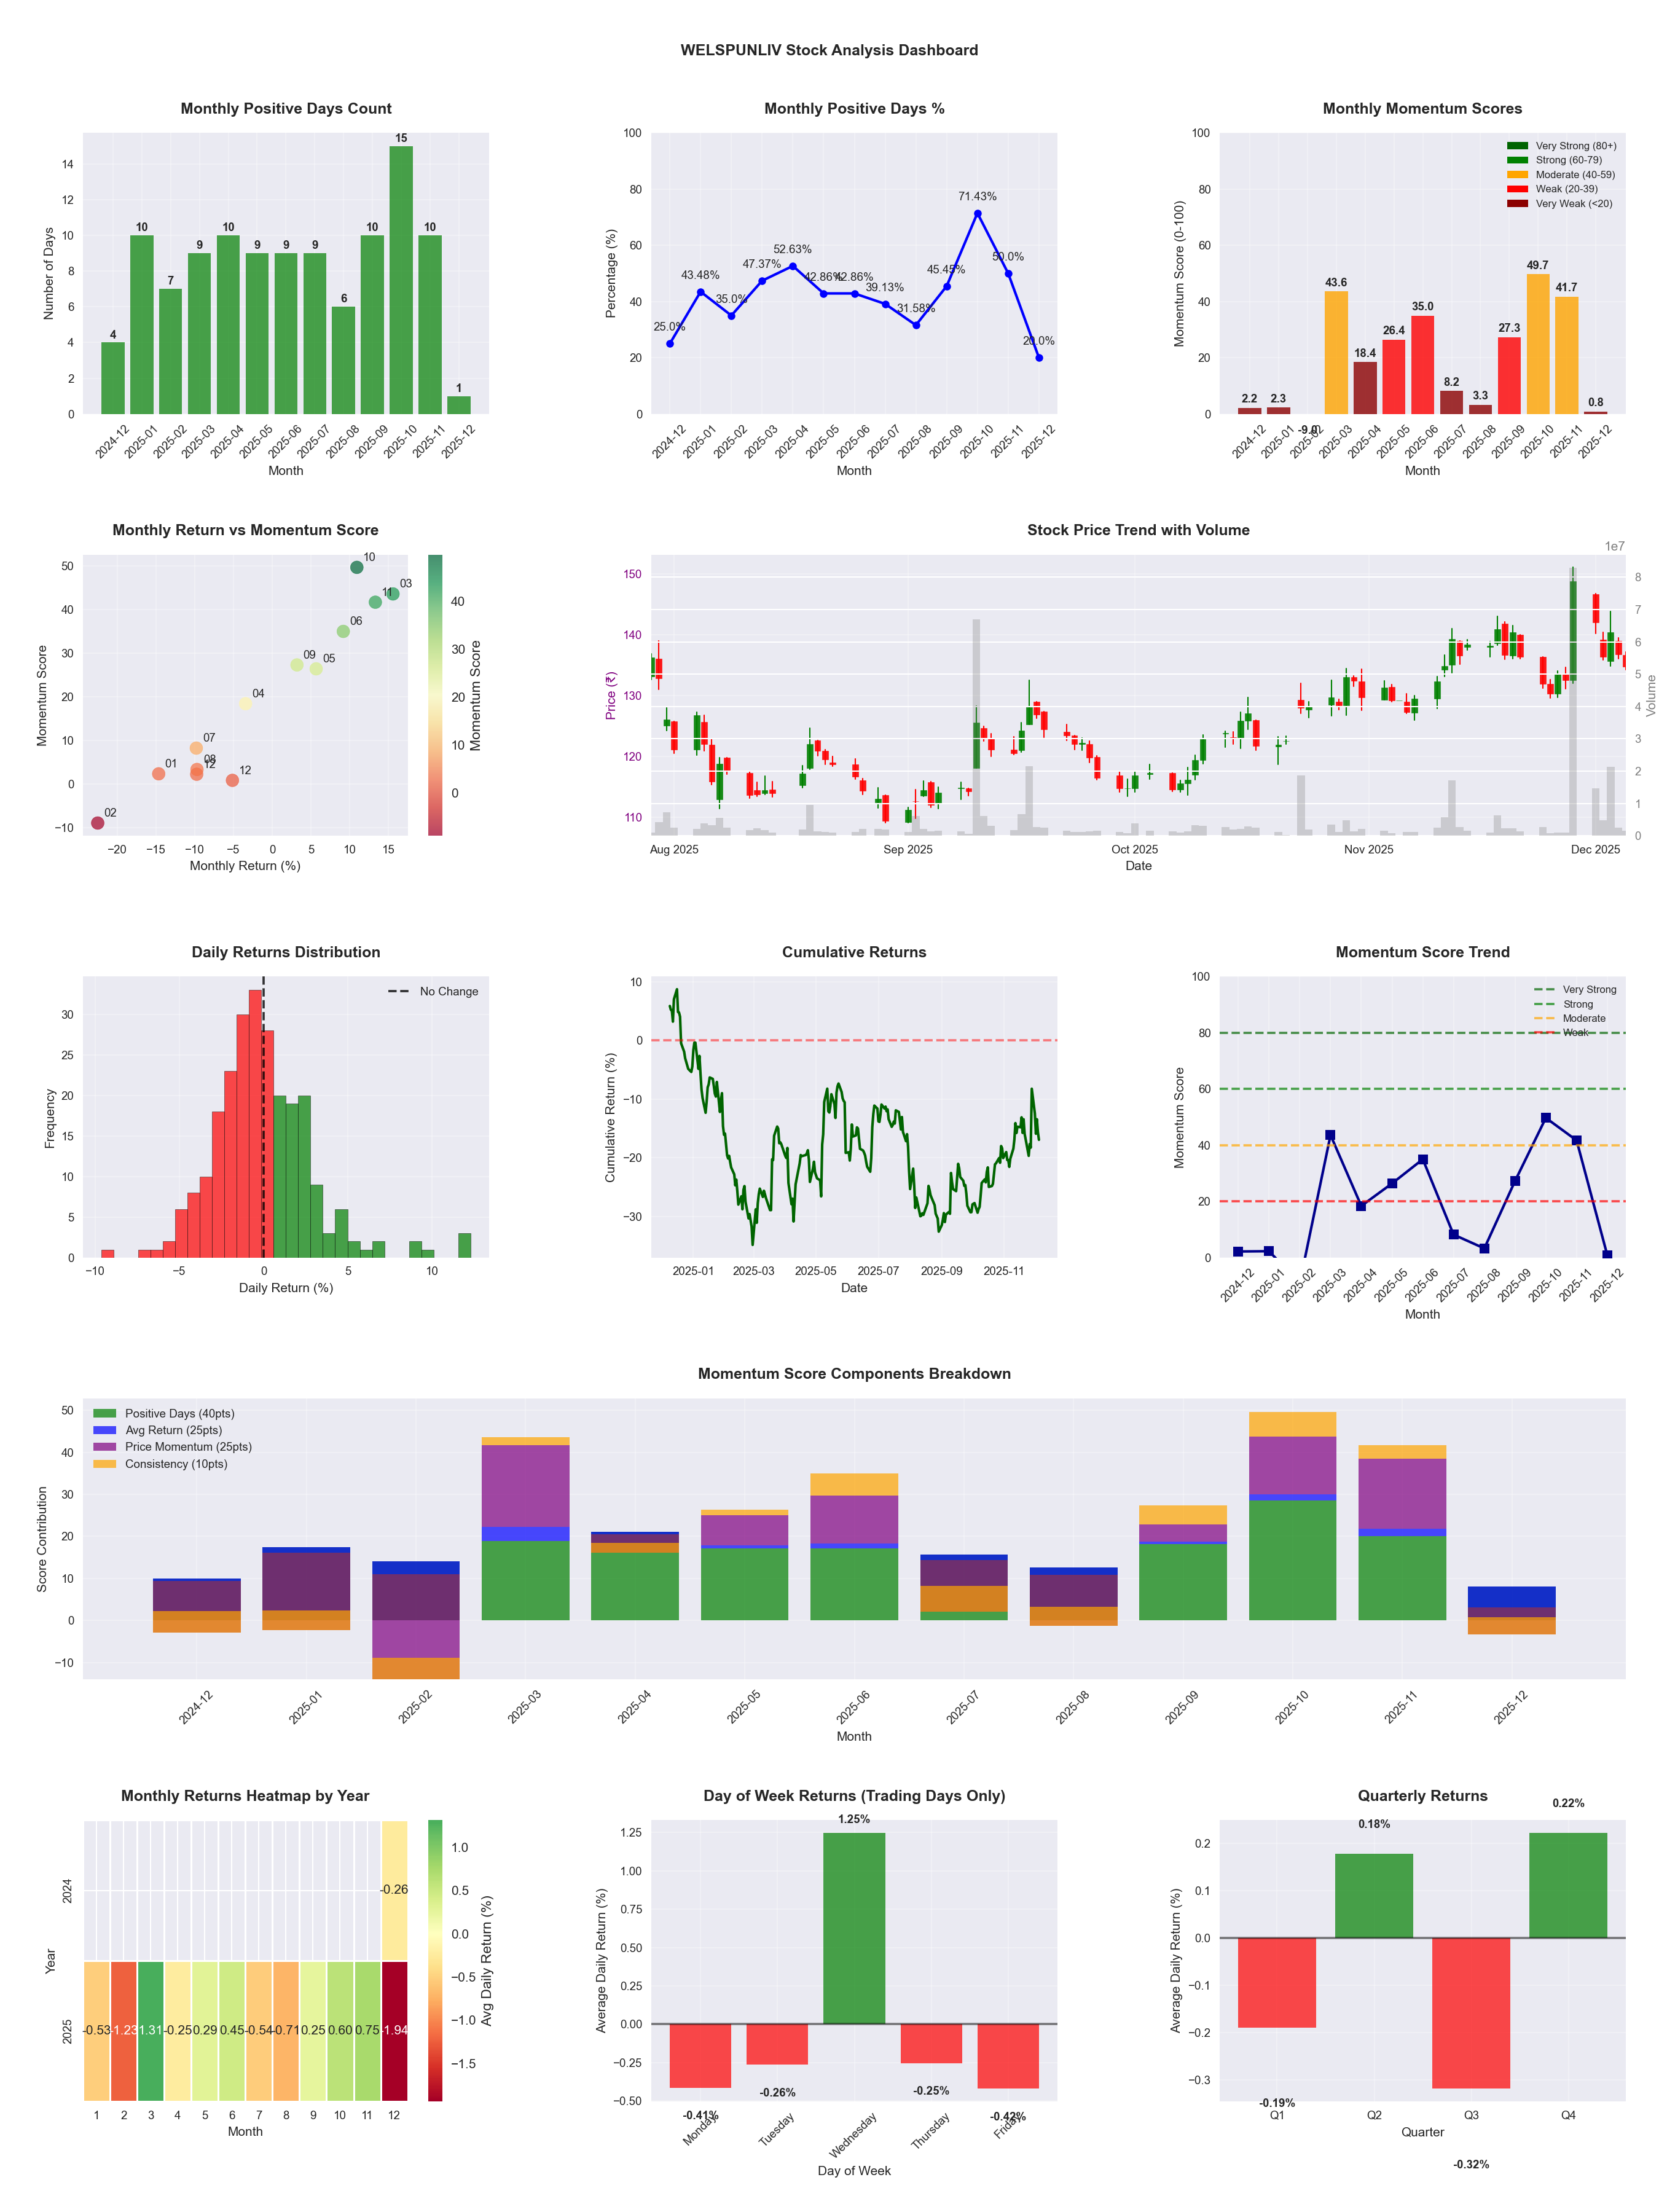
📊 Key Insights & Metrics
Symbol
📈 WELSPUNLIV
Date
📅 2026-04-11
Volatility
🔴 3.08%
Risk Profile
⚠️ suitable for aggressive investors
Win Rate
⚠️ 45.1%
Avg Daily Return
📈 +0.05%
Max Drawdown
📉 -27.91%
IBD RS Score
📊 55.6
Average
Market Rank
#219
Best Month
🏆 2026-04
Worst Month
📉 2025-08
Best Months to Trade
📅 Apr, Nov, Oct
Best Days to Trade
📅 Wednesday, Tuesday
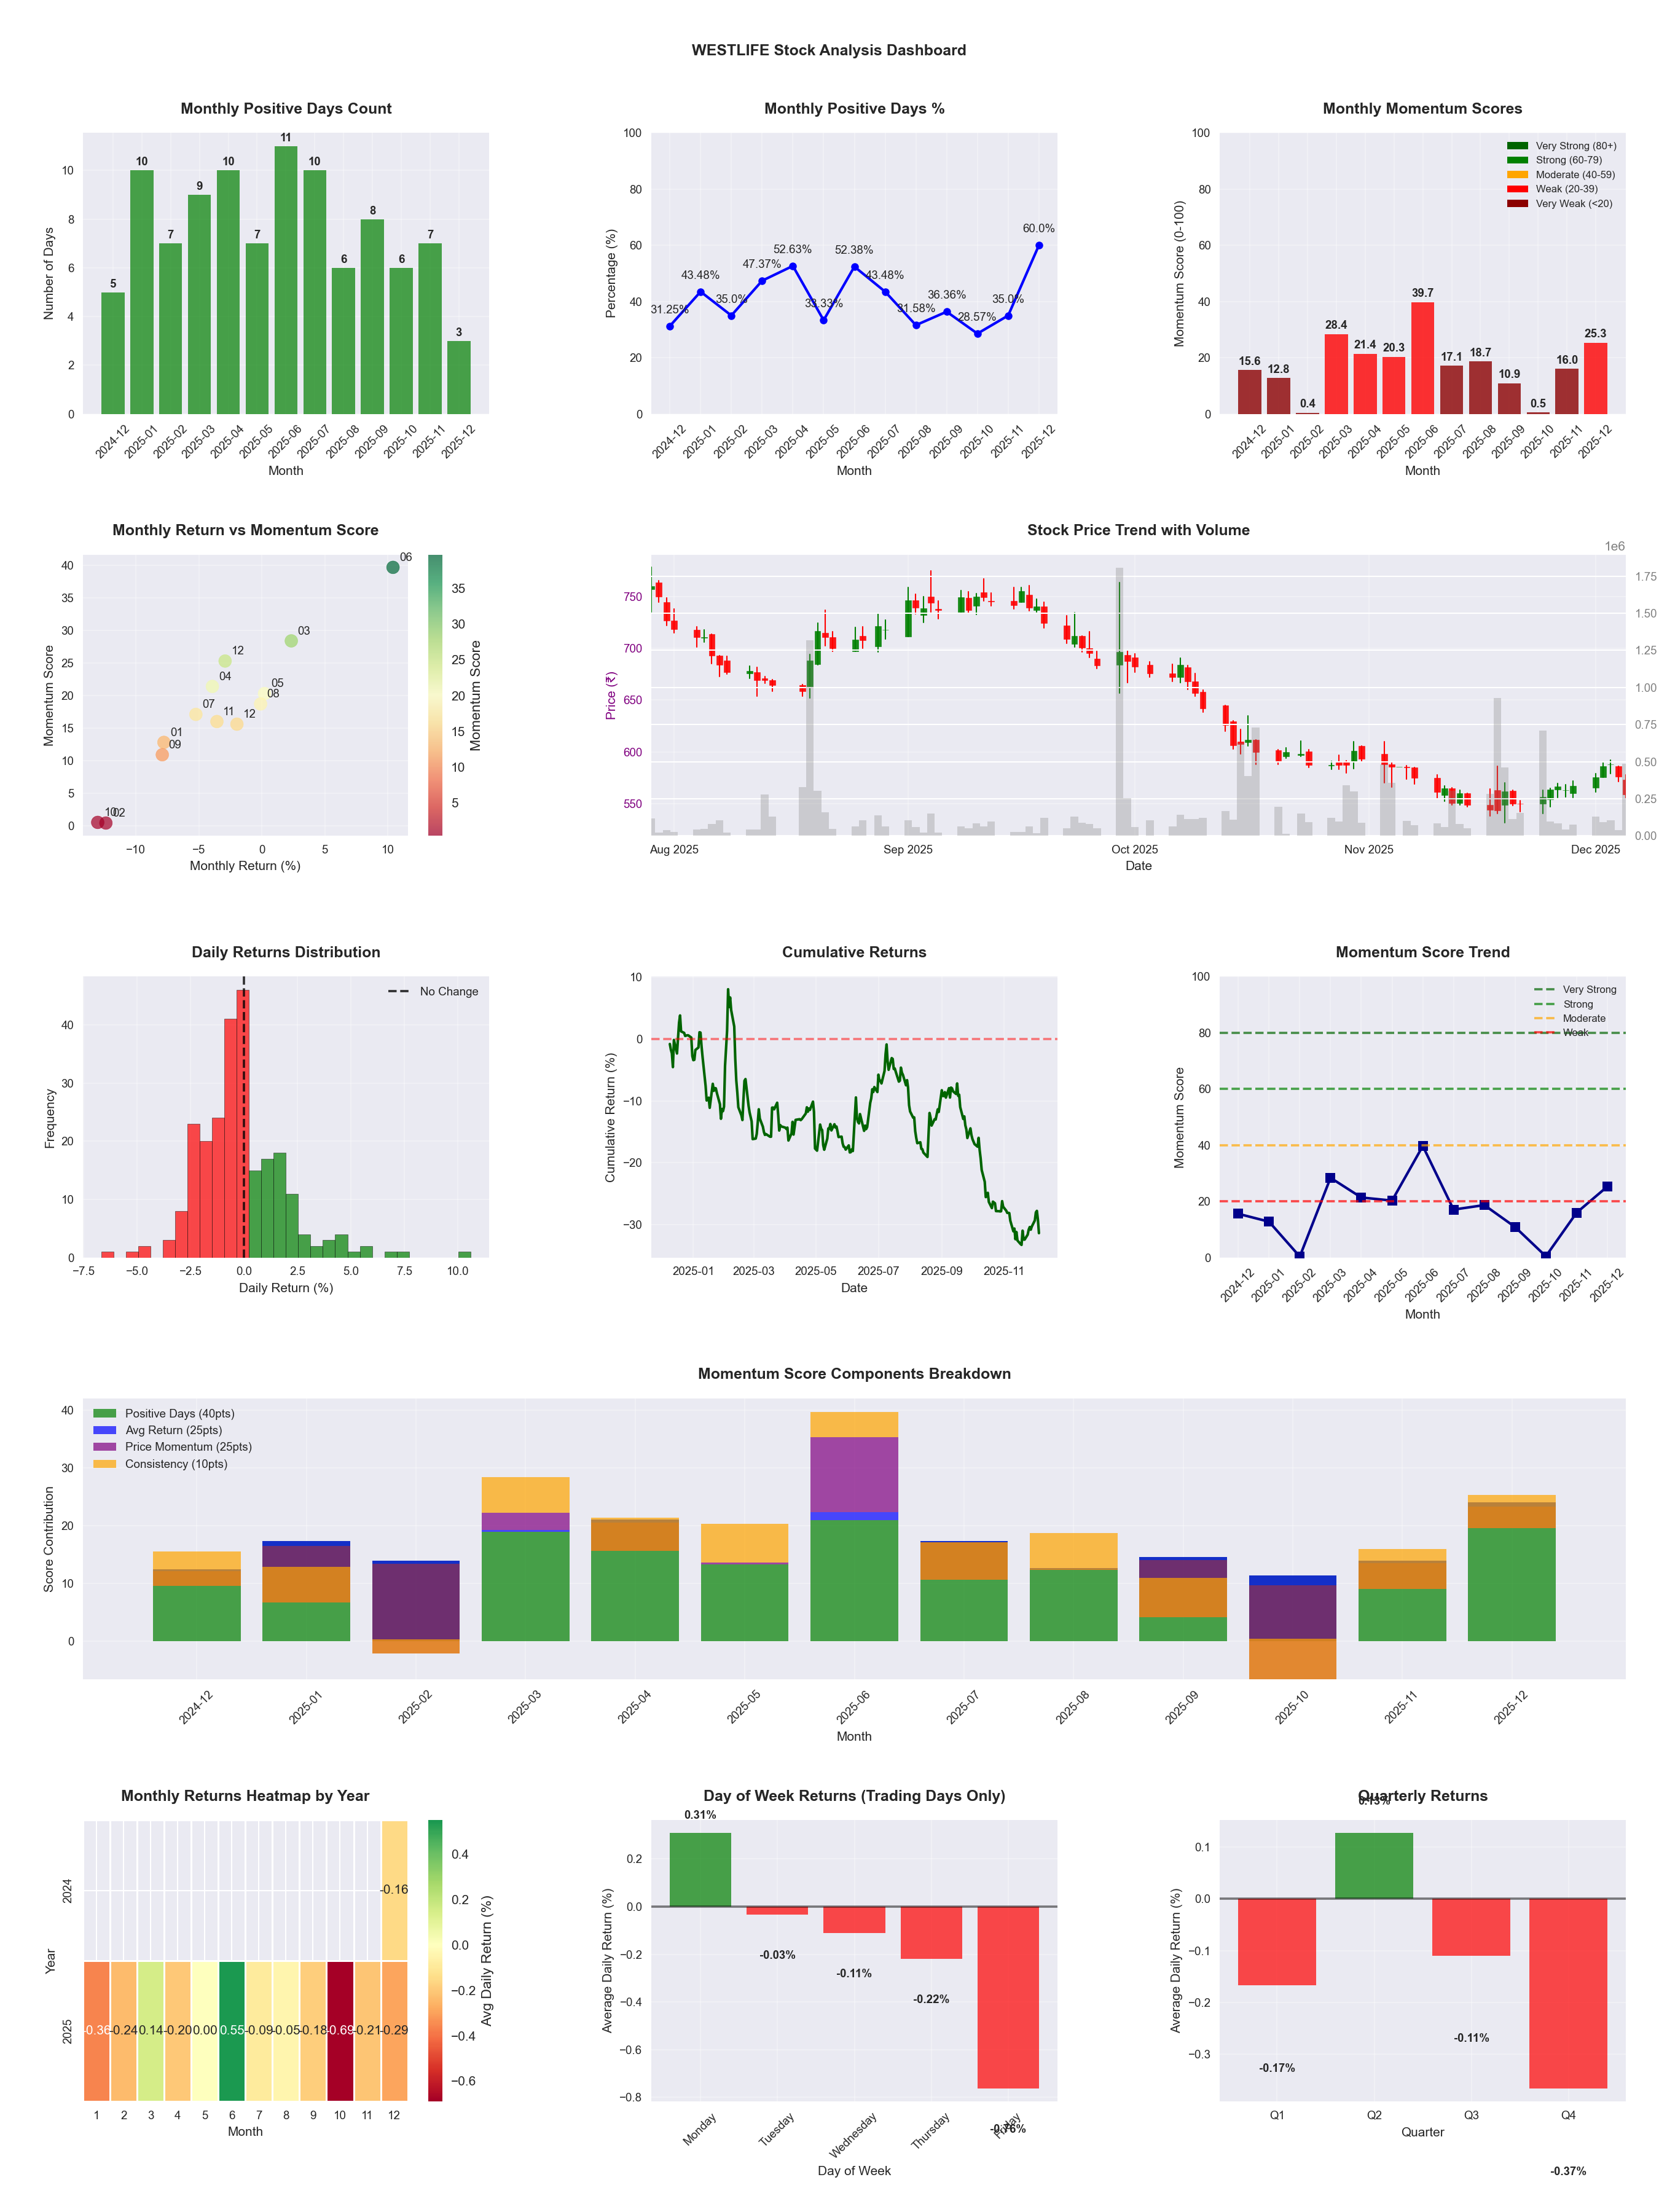
📊 Key Insights & Metrics
Symbol
📈 WESTLIFE
Date
📅 2026-03-21
Volatility
🟡 2.07%
Risk Profile
⚠️ suitable for aggressive investors
Win Rate
⚠️ 41.1%
Avg Daily Return
📉 -0.18%
Max Drawdown
📉 -46.59%
Best Month
🏆 2025-06
Worst Month
📉 2025-10
Best Months to Trade
📅 Jun, Feb, May
Best Days to Trade
📅 Tuesday, Monday
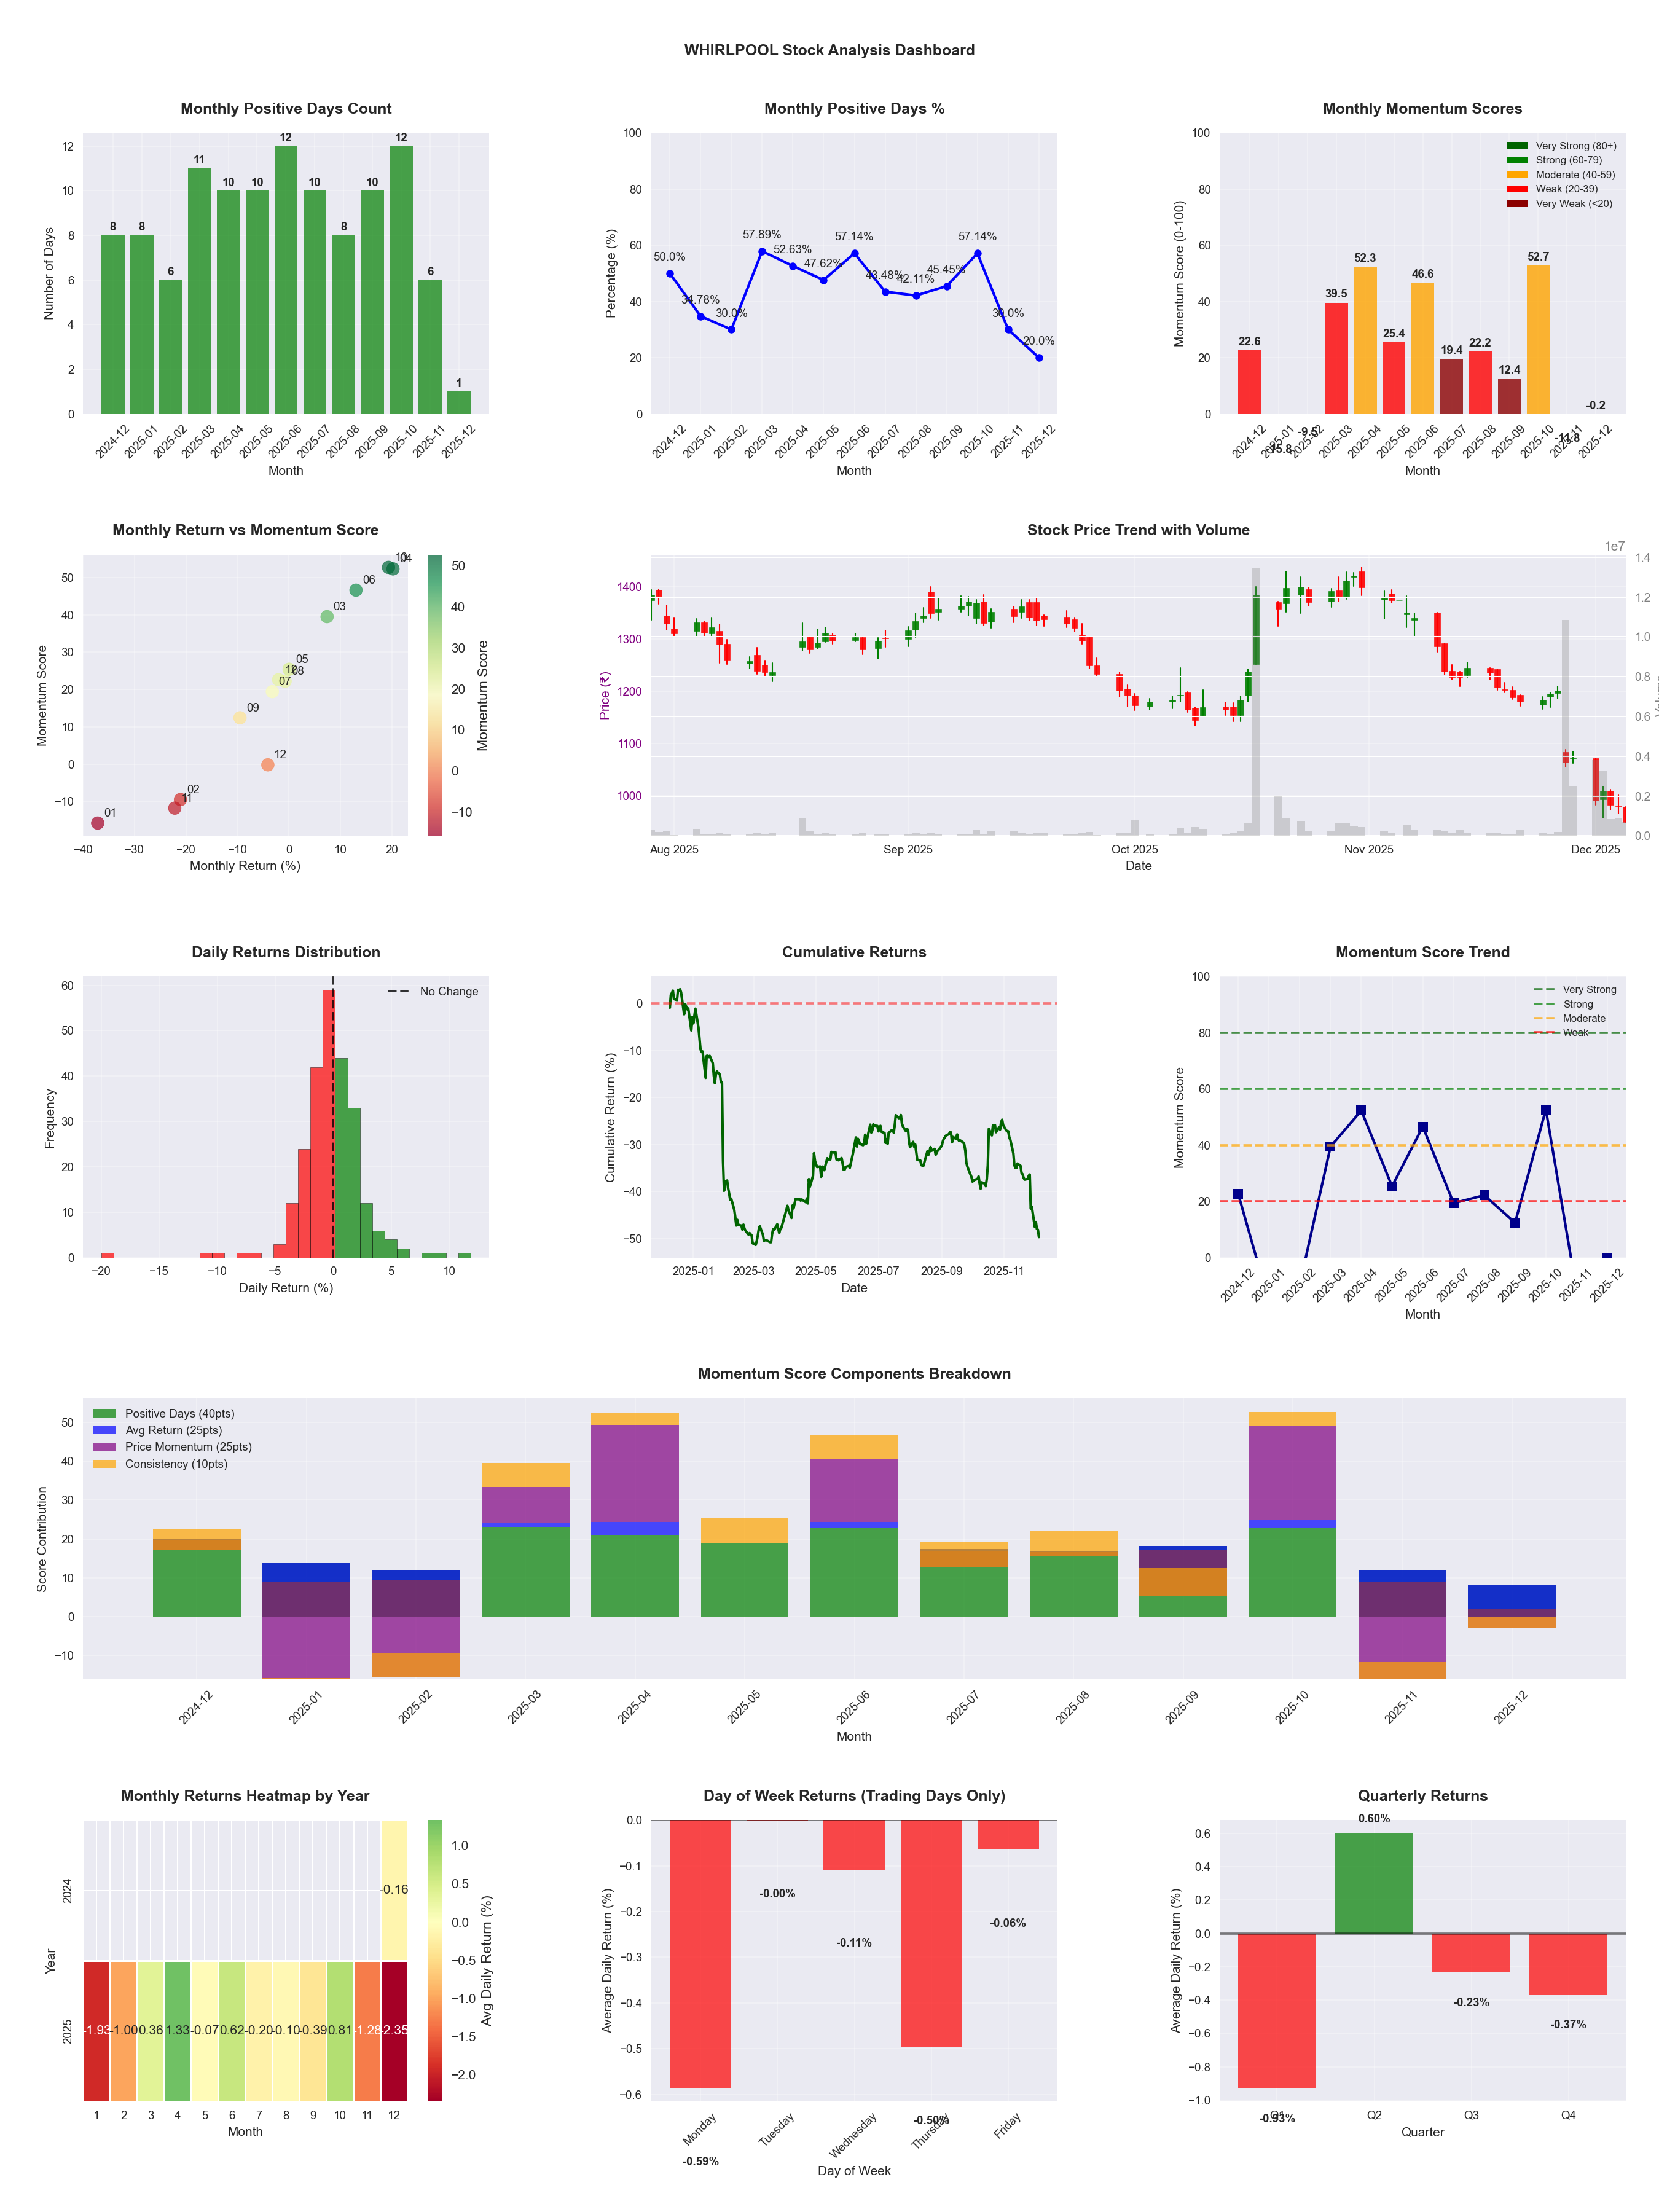
📊 Key Insights & Metrics
Symbol
📈 WHIRLPOOL
Date
📅 2026-04-11
Volatility
🟡 2.36%
Risk Profile
⚠️ suitable for aggressive investors
Win Rate
⚠️ 47.1%
Avg Daily Return
📉 -0.09%
Max Drawdown
📉 -46.26%
IBD RS Score
📊 15.0
Weak
Market Rank
#419
Best Month
🏆 2026-02
Best Months to Trade
📅 Apr, Feb, Oct
Best Days to Trade
📅 Friday, Wednesday
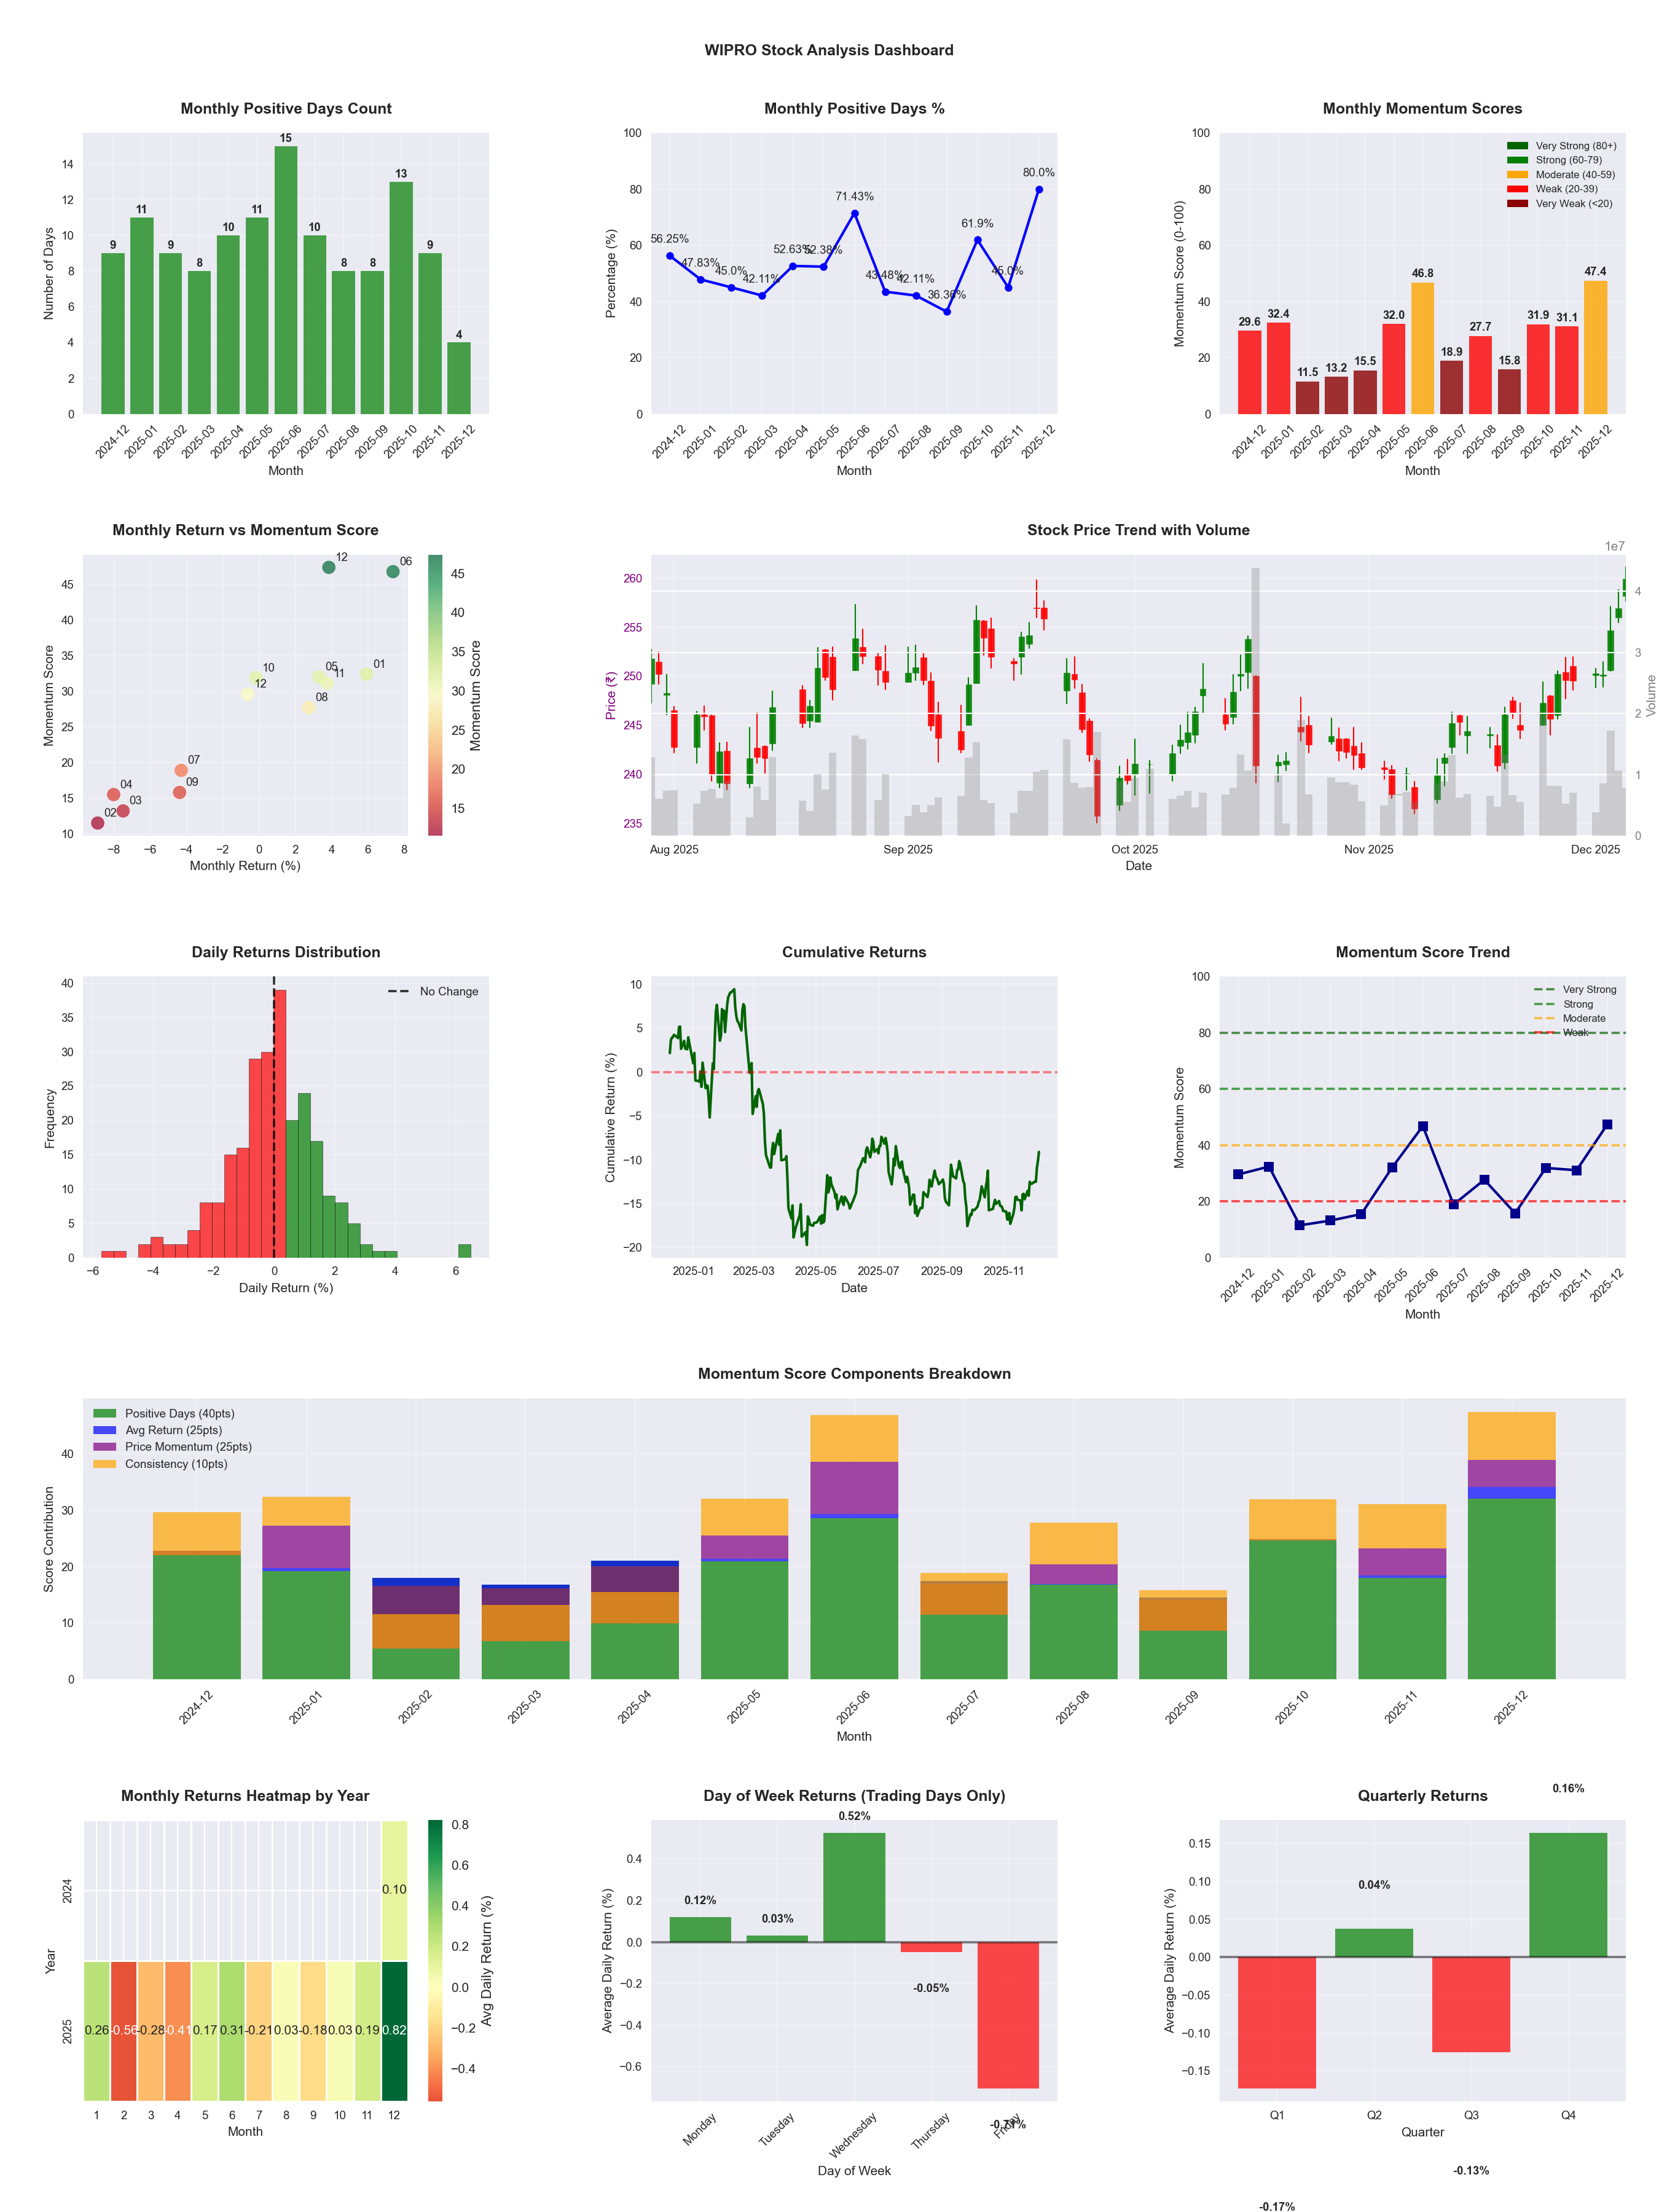
📊 Key Insights & Metrics
Symbol
📈 WIPRO
Date
📅 2026-04-11
Volatility
🟡 1.51%
Win Rate
⚠️ 50.8%
Avg Daily Return
📉 -0.03%
Max Drawdown
📉 -29.45%
IBD RS Score
📊 22.7
Weak
Market Rank
#381
Best Month
🏆 2026-04
Best Months to Trade
📅 Apr, Jun, Dec
Best Days to Trade
📅 Wednesday, Tuesday
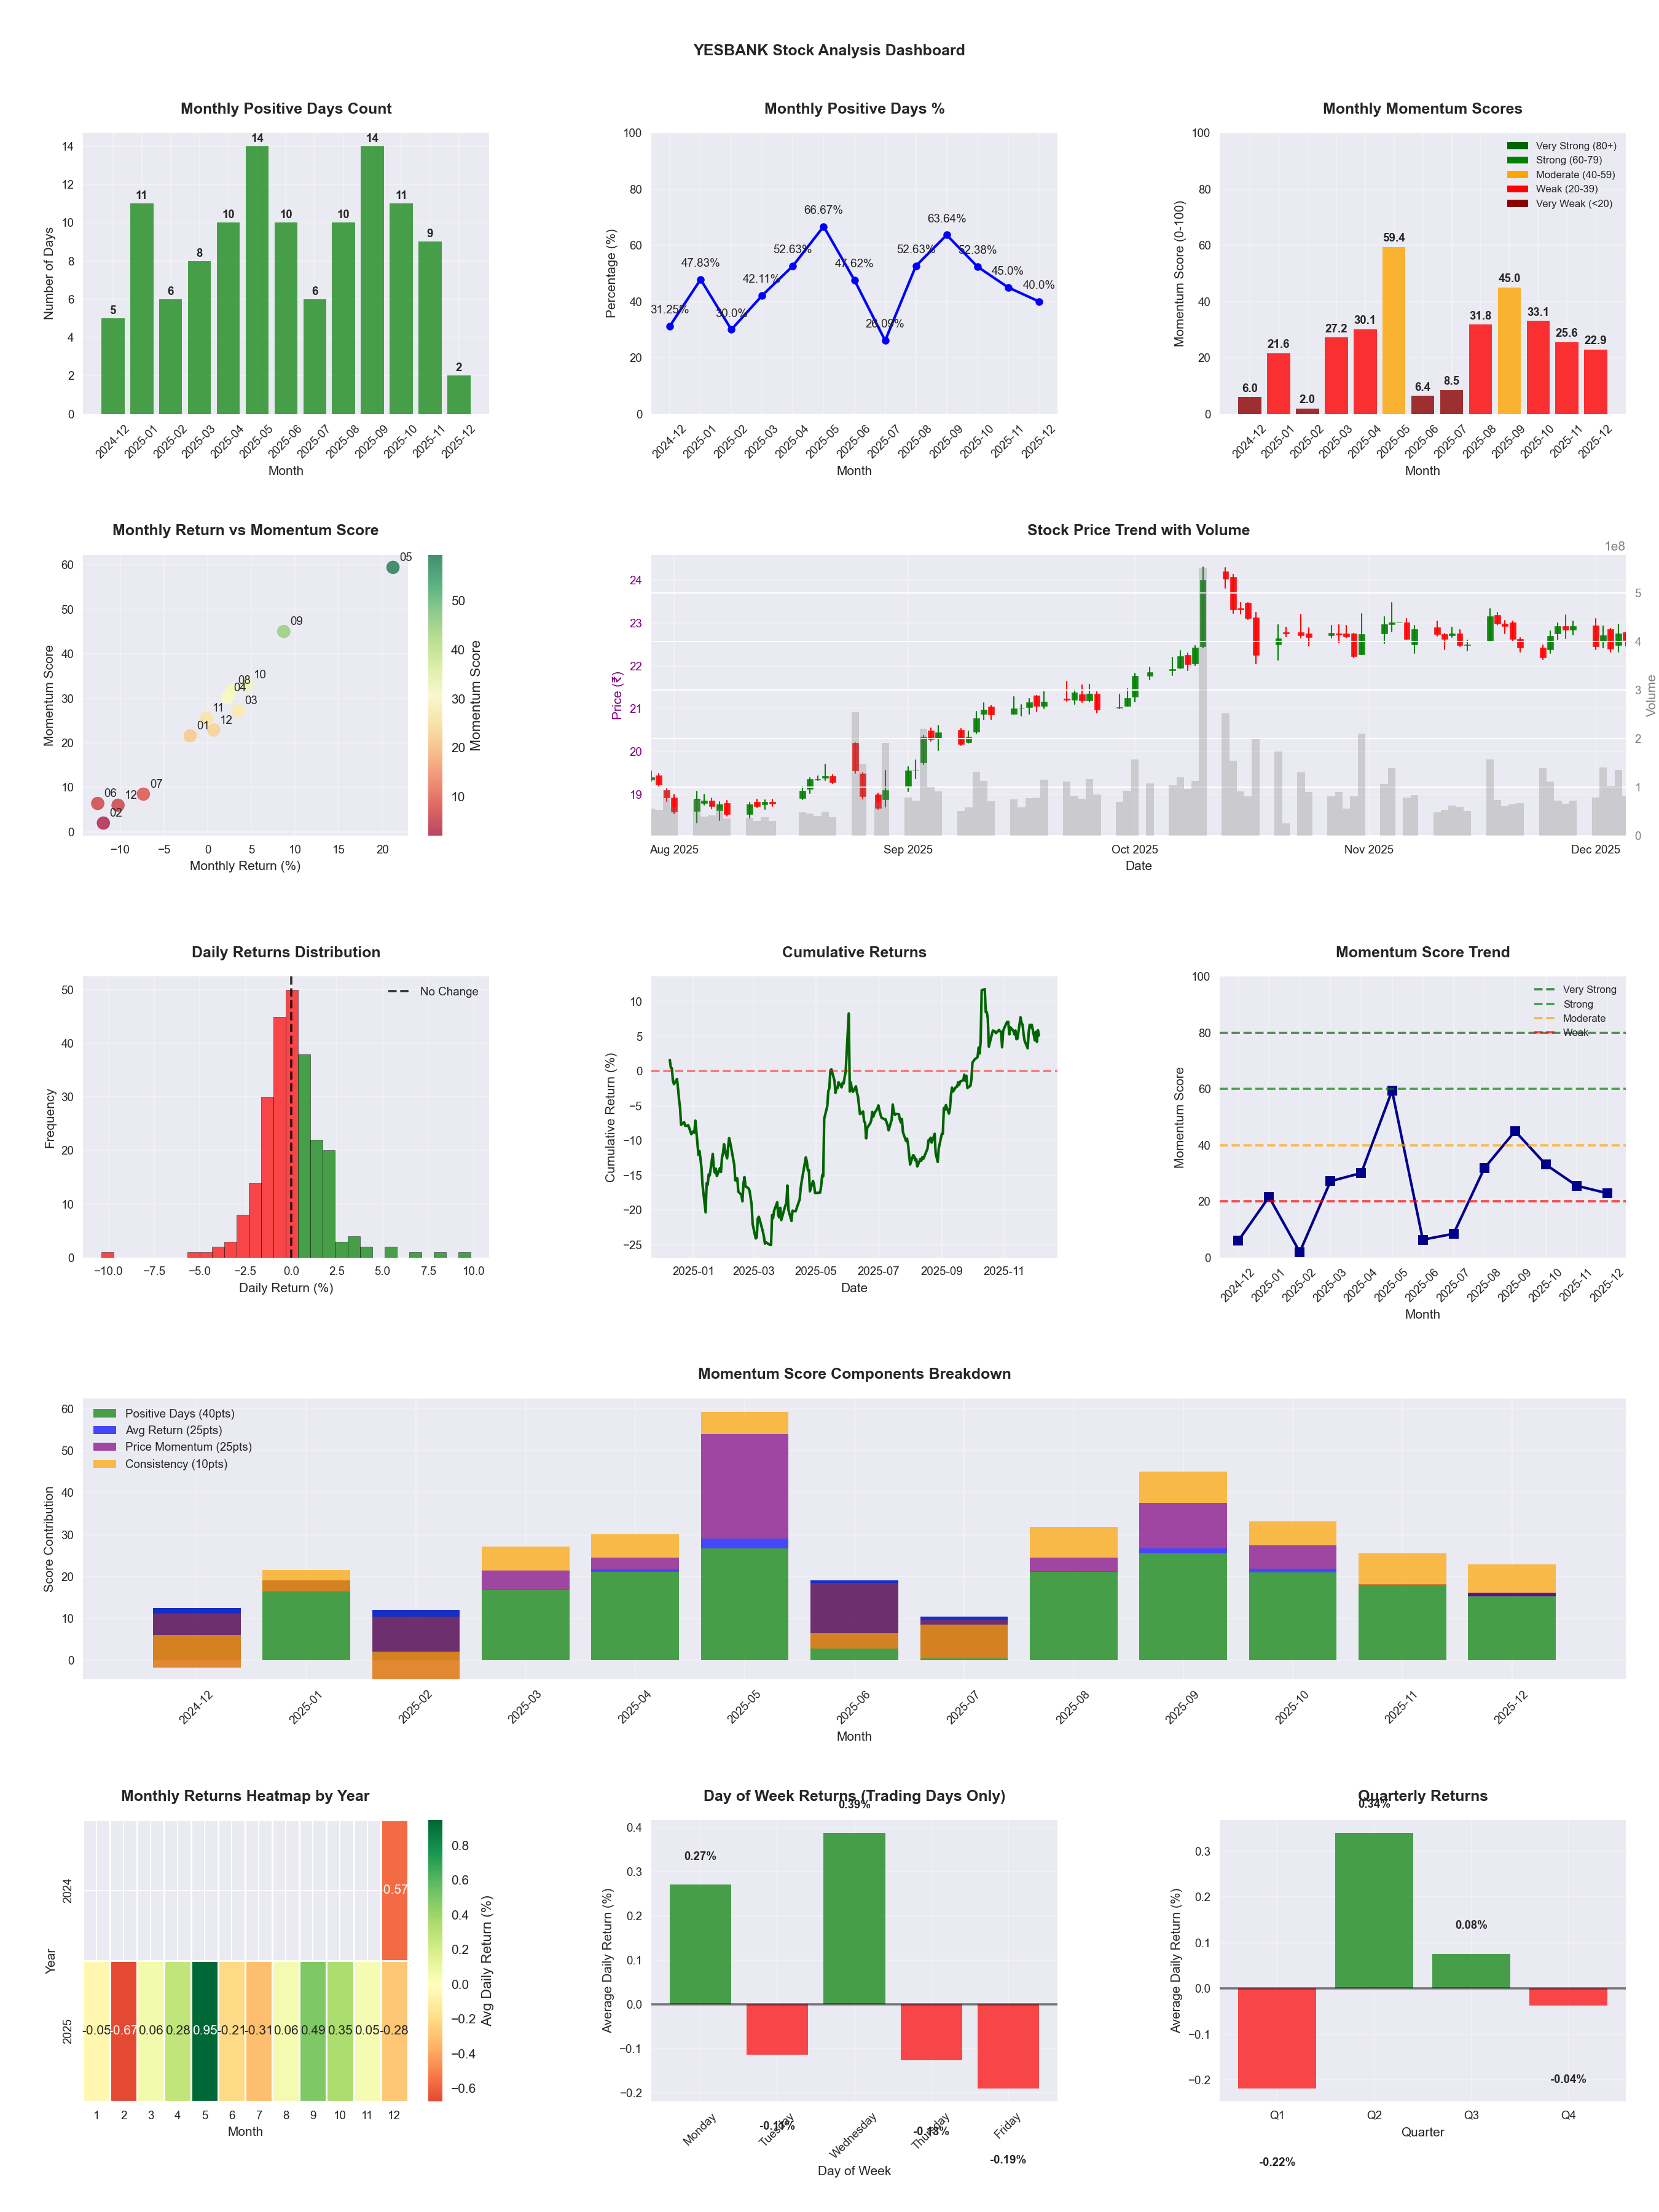
📊 Key Insights & Metrics
Symbol
📈 YESBANK
Date
📅 2026-04-11
Volatility
🟡 1.90%
Win Rate
⚠️ 48.0%
Avg Daily Return
📈 +0.06%
Max Drawdown
📉 -28.21%
IBD RS Score
📊 35.5
Weak
Market Rank
#318
Best Month
🏆 2025-05
Best Months to Trade
📅 May, Apr, Sep
Best Days to Trade
📅 Wednesday, Monday
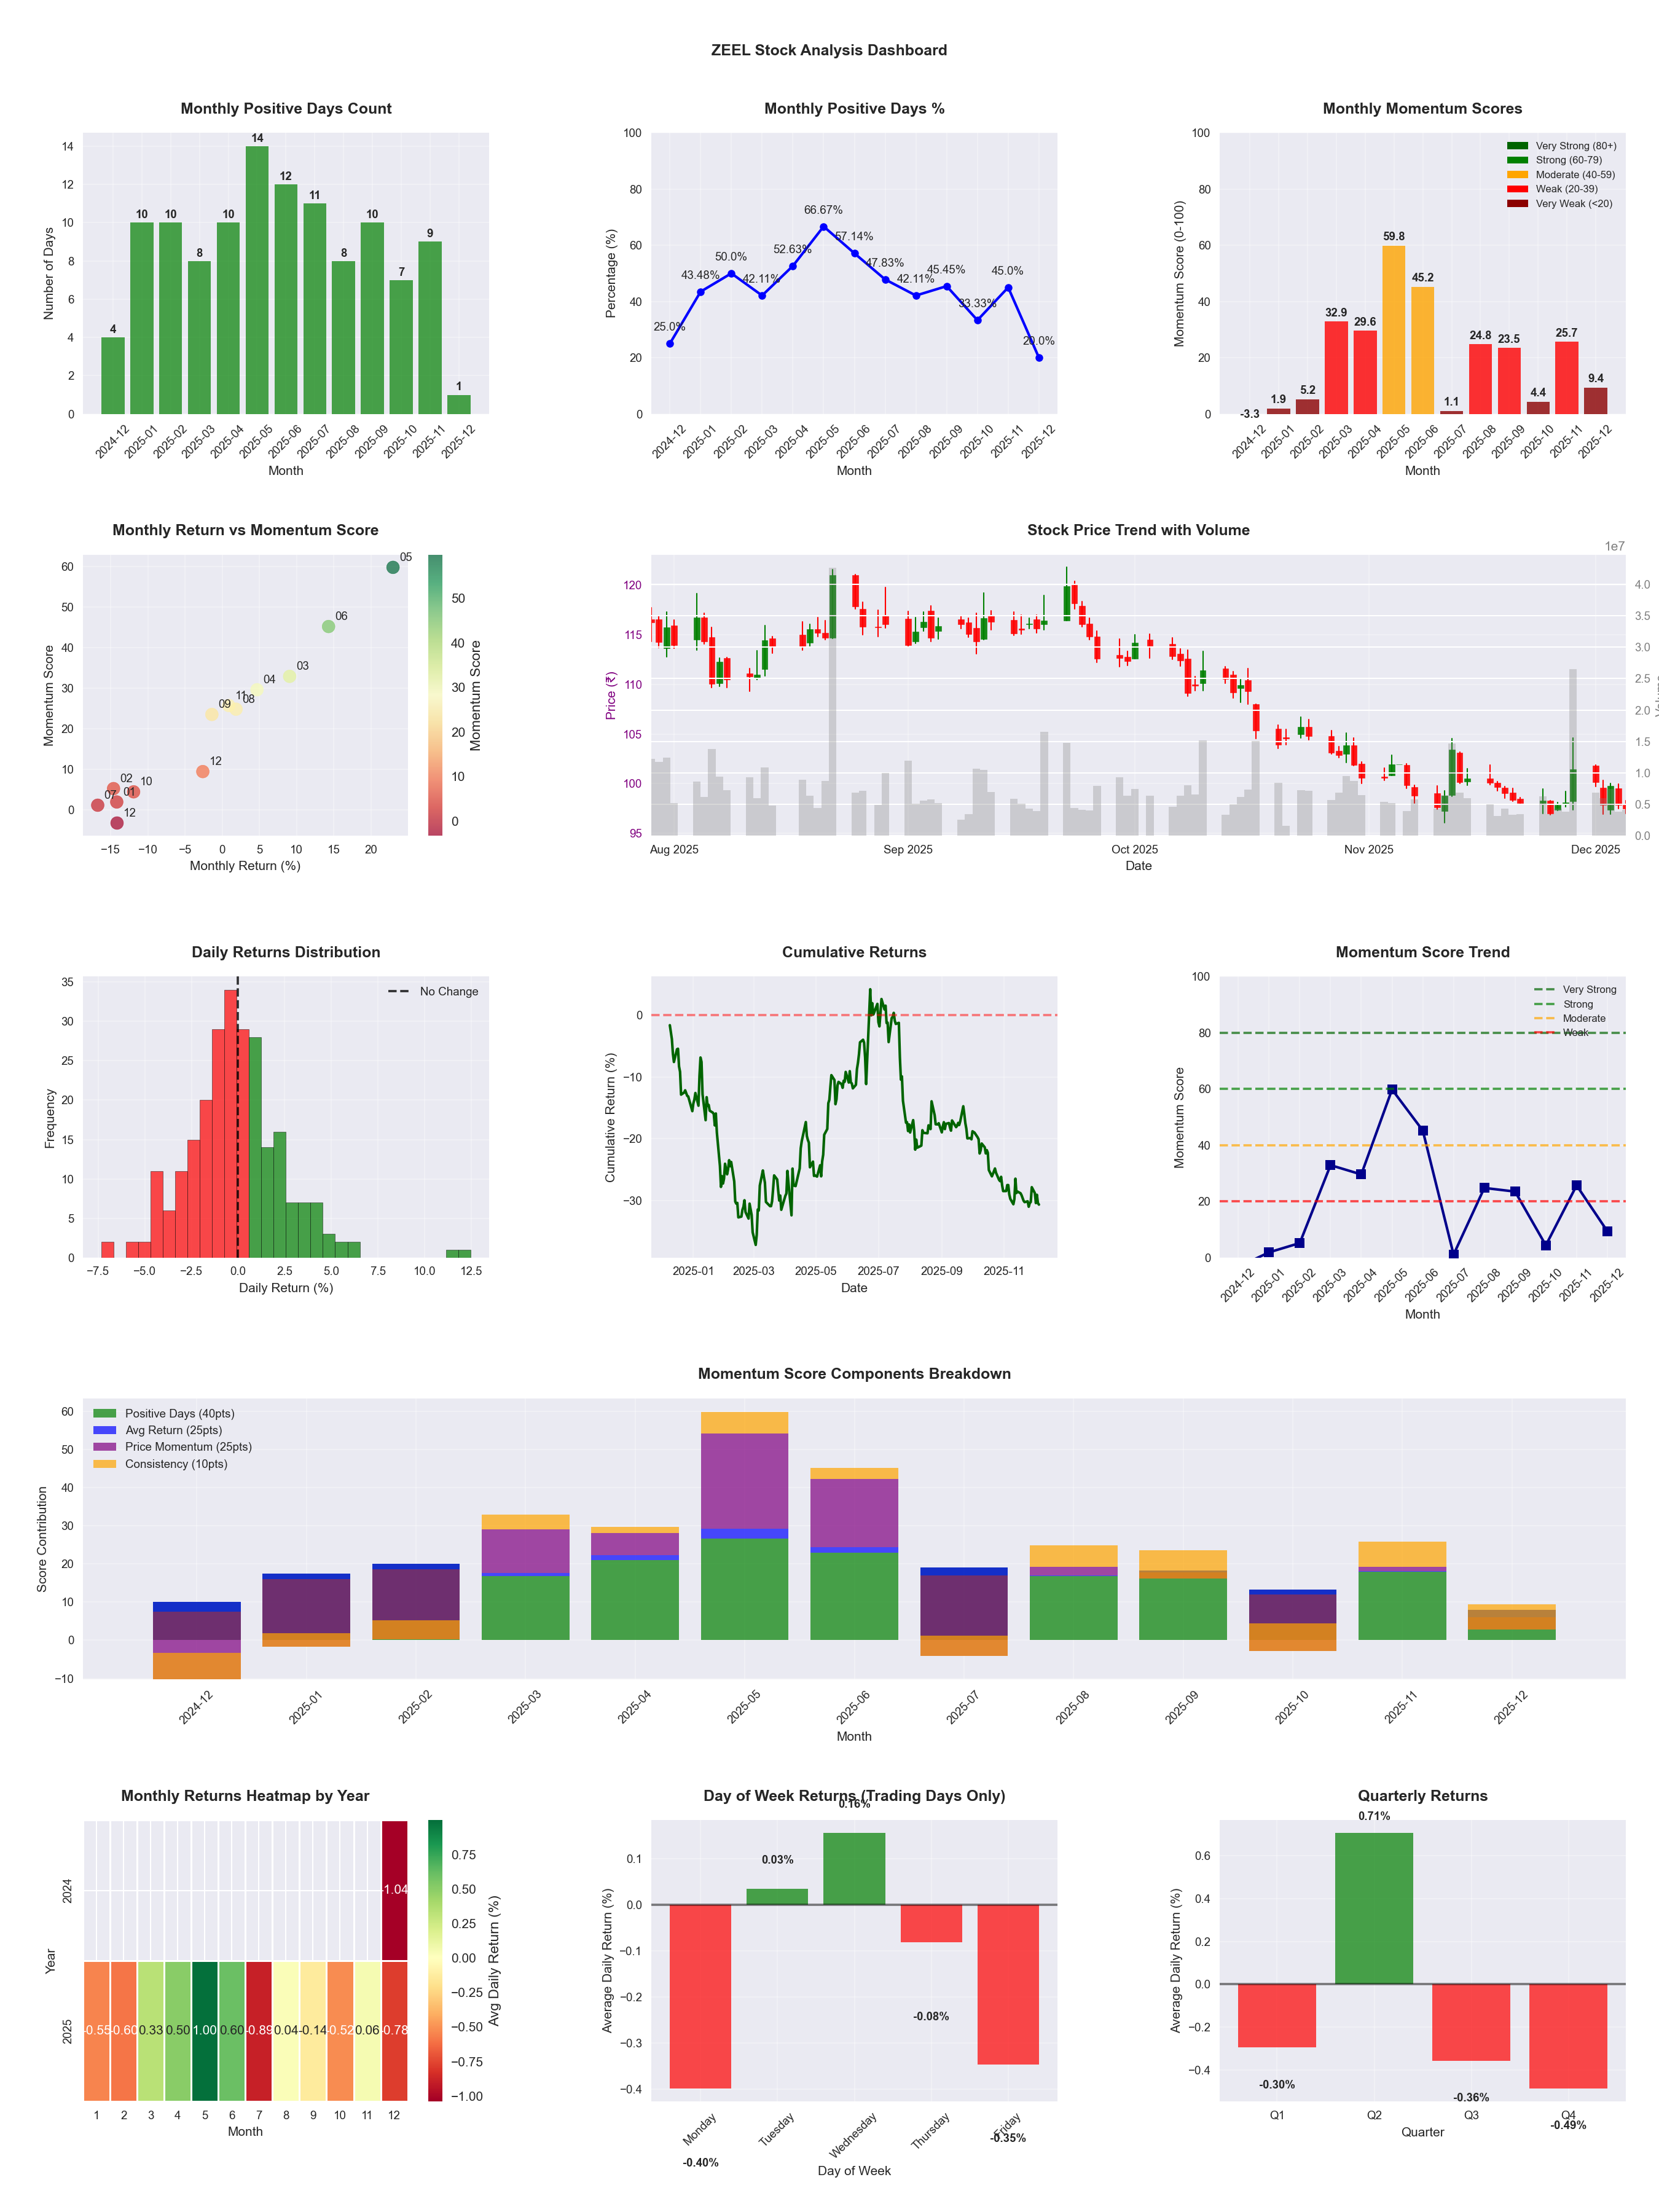
📊 Key Insights & Metrics
Symbol
📈 ZEEL
Date
📅 2026-04-11
Volatility
🟡 2.39%
Risk Profile
⚠️ suitable for aggressive investors
Win Rate
⚠️ 47.6%
Avg Daily Return
📉 -0.06%
Max Drawdown
📉 -53.34%
IBD RS Score
📊 10.8
Weak
Market Rank
#440
Best Month
🏆 2025-05
Best Months to Trade
📅 May, Apr, Jun
Best Days to Trade
📅 Wednesday, Friday
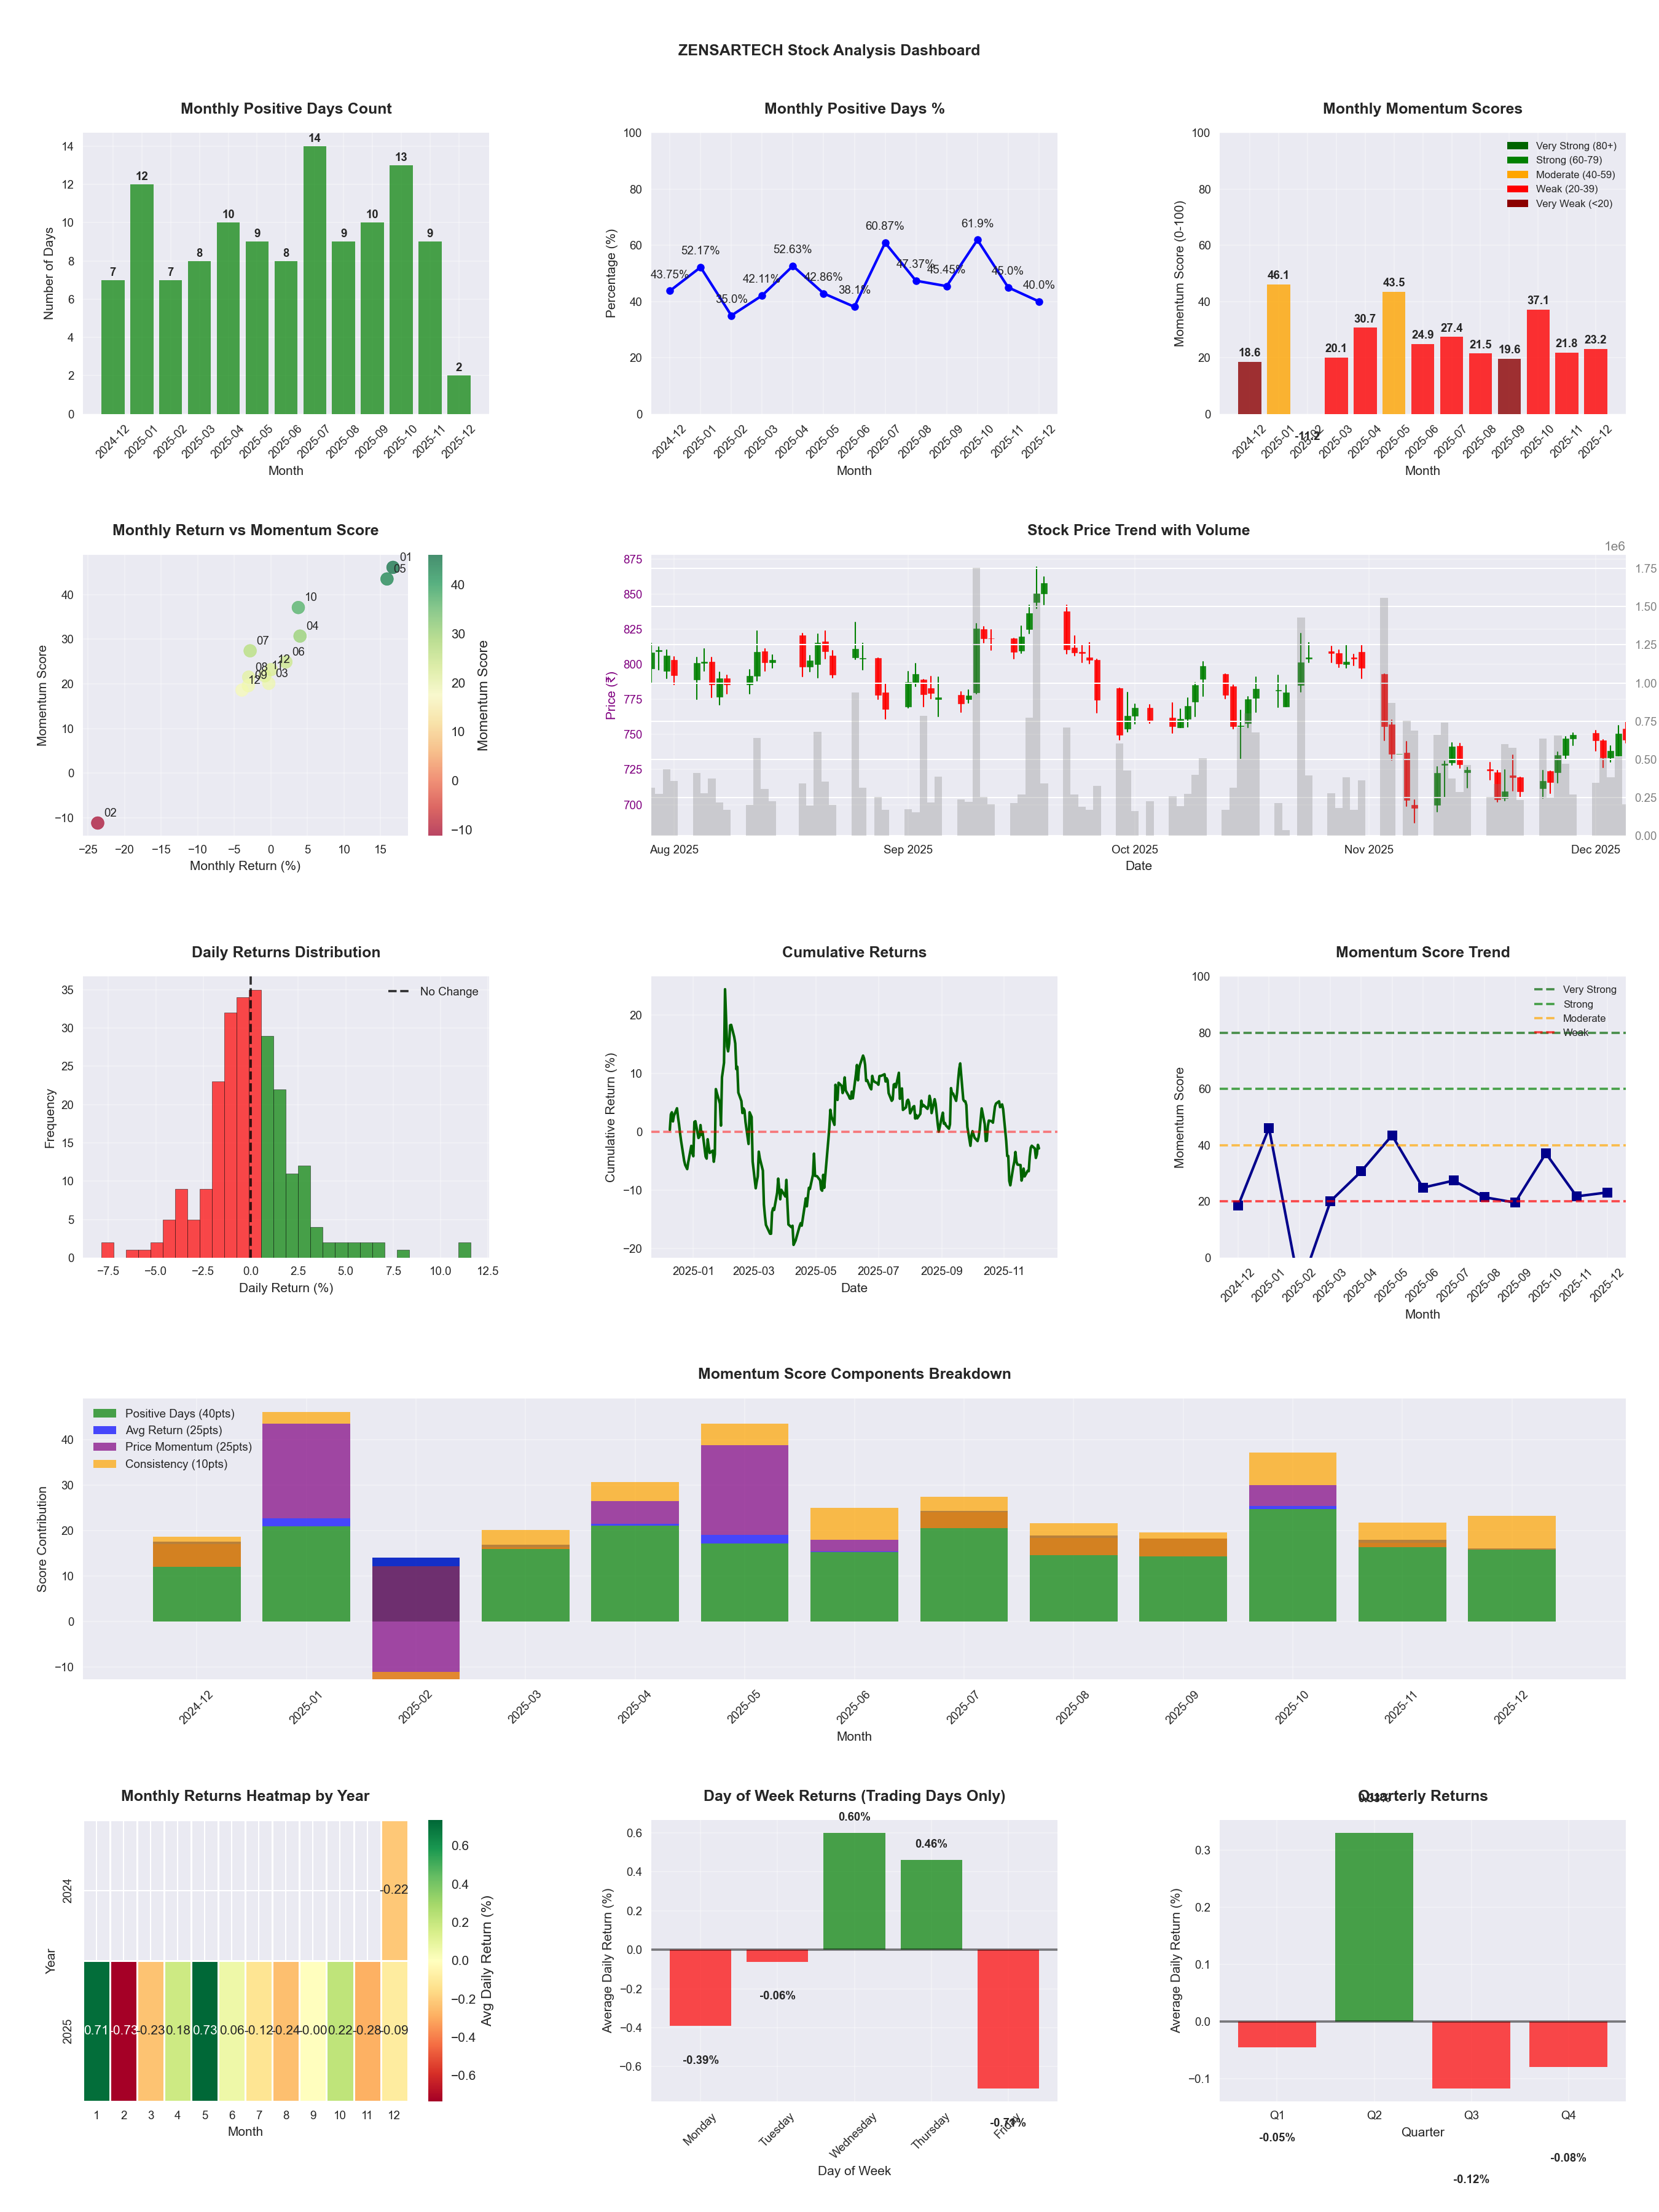
📊 Key Insights & Metrics
Symbol
📈 ZENSARTECH
Date
📅 2026-04-11
Volatility
🟡 1.99%
Win Rate
⚠️ 48.0%
Avg Daily Return
📉 -0.03%
Max Drawdown
📉 -40.51%
IBD RS Score
📊 10.1
Weak
Market Rank
#443
Best Month
🏆 2026-04
Best Months to Trade
📅 Apr, May, Oct
Best Days to Trade
📅 Wednesday, Thursday
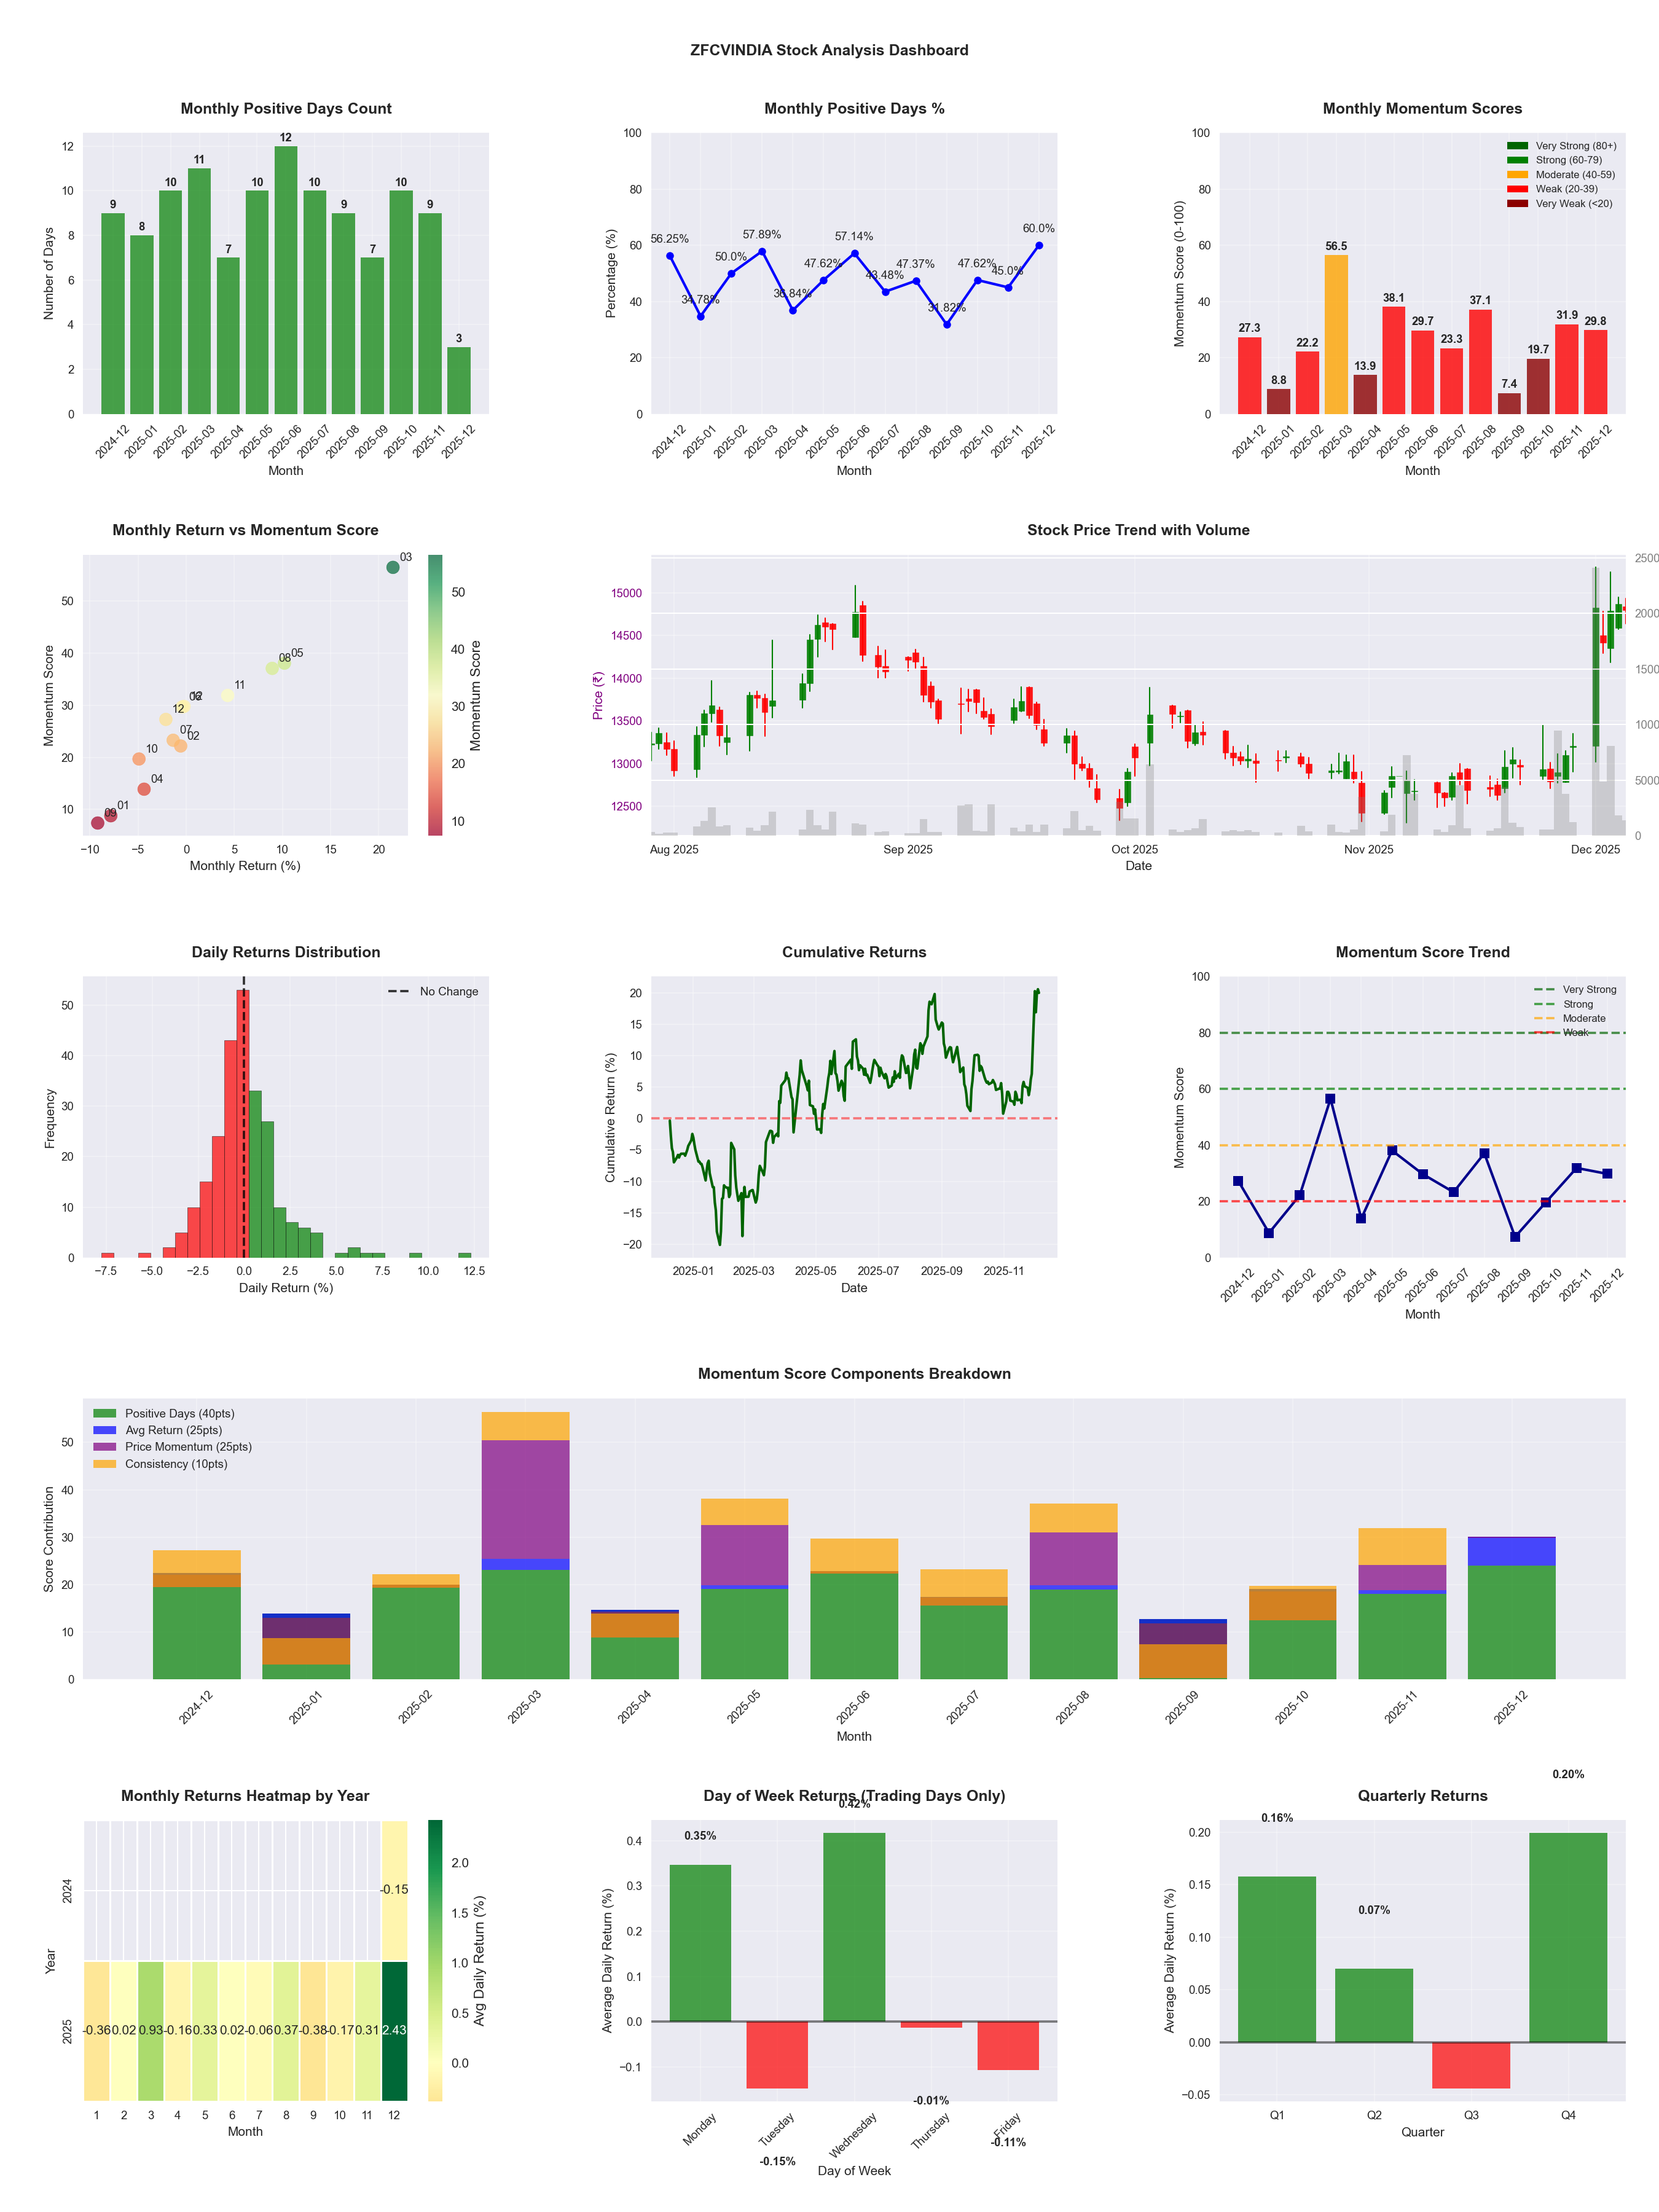
📊 Key Insights & Metrics
Symbol
📈 ZFCVINDIA
Date
📅 2026-04-11
Volatility
🟡 1.94%
Win Rate
⚠️ 45.1%
Avg Daily Return
📈 +0.08%
Max Drawdown
📉 -17.42%
IBD RS Score
📊 72.4
Strong
Market Rank
#136
Best Month
🏆 2025-05
Worst Month
📉 2025-09
Best Months to Trade
📅 Dec, Aug, May
Best Days to Trade
📅 Monday, Wednesday
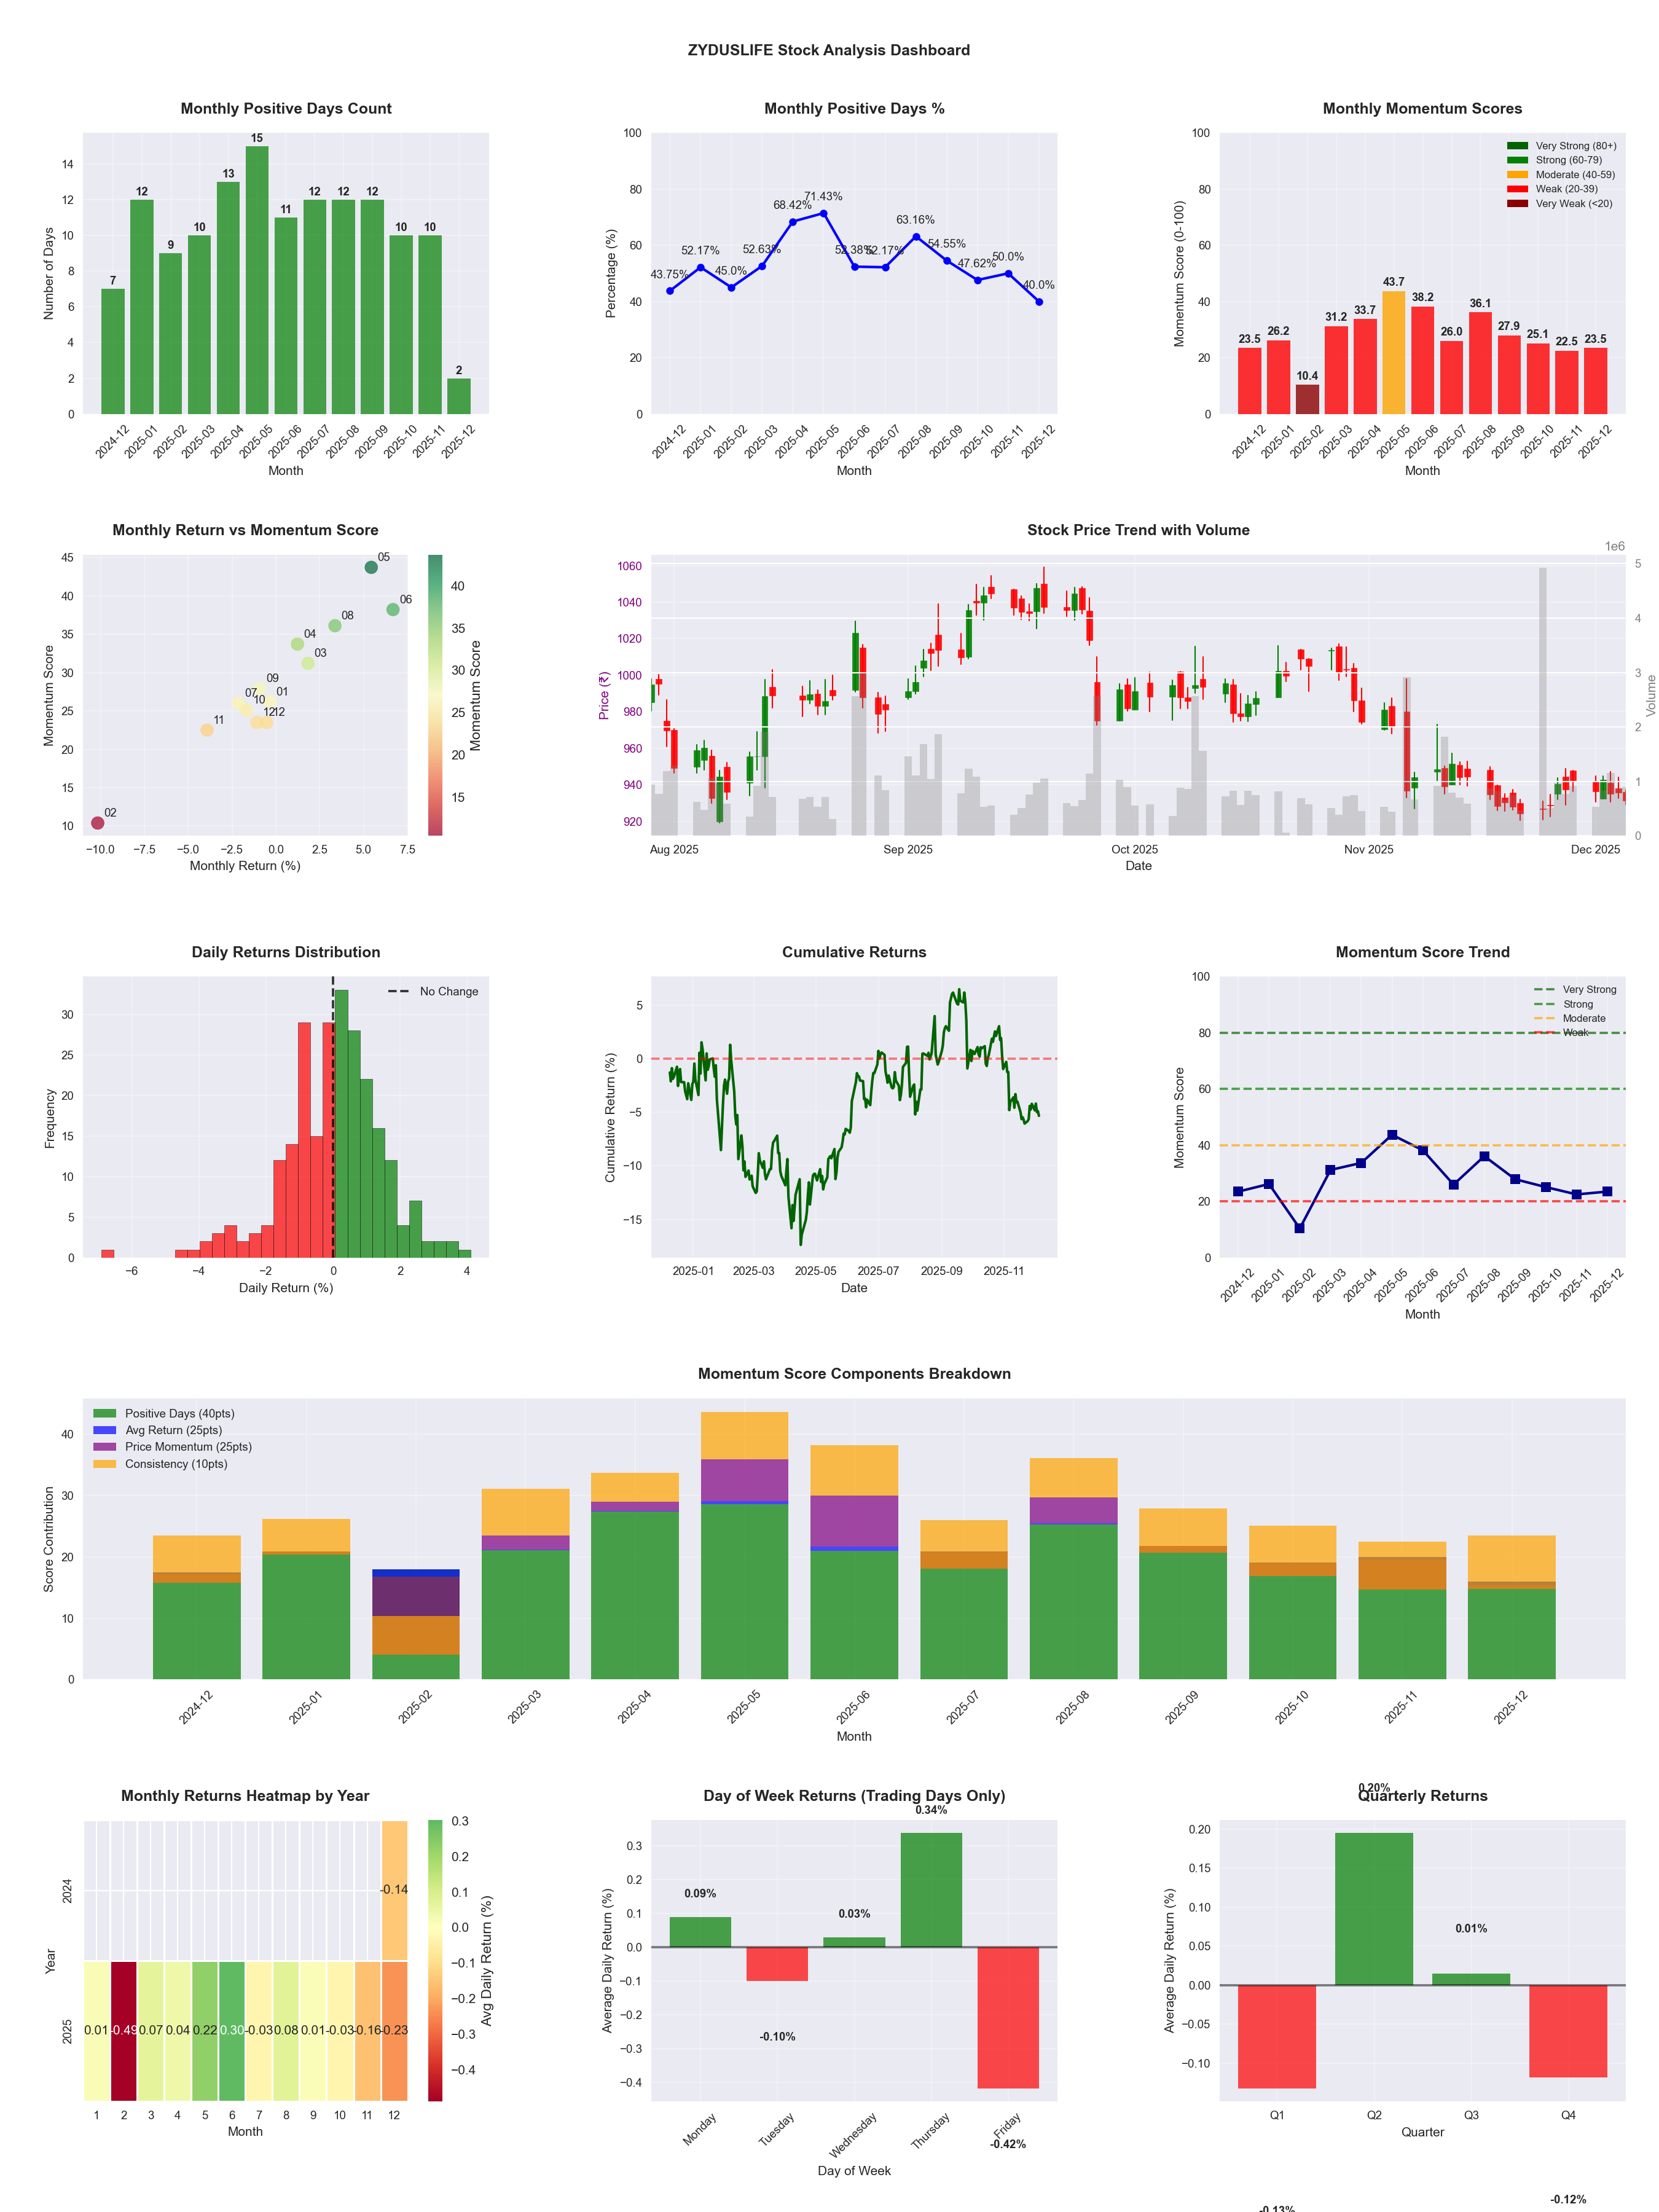
📊 Key Insights & Metrics
Symbol
📈 ZYDUSLIFE
Date
📅 2026-04-11
Volatility
🟢 1.36%
Win Rate
⚠️ 54.1%
Avg Daily Return
📈 +0.04%
Max Drawdown
📉 -17.87%
IBD RS Score
📊 64.7
Average
Market Rank
#174
Best Month
🏆 2026-04
Worst Month
📉 2026-03
Best Months to Trade
📅 Apr, Jun, May
Best Days to Trade
📅 Monday, Wednesday
📅 Monthly Seasonality Analysis
Statistical analysis across all months
| Month | Avg Return | Highest Positive | Highest Negative |
|---|---|---|---|
| Jan | -0.21% | 1.53% | -1.70% |
| Feb | 0.06% | 2.62% | -1.87% |
| Mar | -0.62% | 0.69% | -3.16% |
| Apr | 0.78% | 2.73% | -2.44% |
| May | 0.38% | 2.41% | -3.26% |
| Jun | 0.19% | 1.72% | -0.93% |
| Jul | -0.12% | 1.27% | -1.35% |
| Aug | -0.15% | 1.76% | -1.98% |
| Sep | 0.09% | 2.43% | -0.81% |
| Oct | 0.15% | 1.32% | -2.58% |
| Nov | -0.09% | 1.20% | -1.74% |
| Dec | -0.01% | 2.18% | -1.25% |
🏆 Key Findings
BEST MONTH: Apr (0.78% avg return)
WORST MONTH: Mar (-0.62% avg return)
📅 Day of Week Seasonality Analysis
Statistical analysis across all days of the week (excluding weekends)
| Day | Avg Return | Highest Positive | Highest Negative |
|---|---|---|---|
| Monday | 0.14% | 1.29% | -0.95% |
| Tuesday | 0.14% | 1.34% | -1.05% |
| Wednesday | 0.42% | 1.73% | -1.06% |
| Thursday | -0.23% | 0.69% | -2.36% |
| Friday | -0.30% | 0.82% | -1.45% |
🏆 Key Findings
BEST DAY: Wednesday (0.42% avg return)
WORST DAY: Friday (-0.30% avg return)
⚠️ Risk Profile Analysis
Risk assessment across all stocks
Volatility Distribution
High (>3%)
25
Medium (1.5-3%)
413
Low (<1.5%)
62
Average Volatility
2.07%
Min: 1.15% | Max: 4.90%
Average Max Drawdown
-31.87%
Min: -81.16% | Max: -9.44%
Average Daily Return
+0.04%
Min: -0.42% | Max: +0.49%
Stocks with Consistent 1+ Standard Deviation Movement
ABFRL
Volatility: 4.90%
RAYMOND
Volatility: 4.74%
SKFINDIA
Volatility: 3.90%
QUESS
Volatility: 3.83%
HINDCOPPER
Volatility: 3.55%
NETWEB
Volatility: 3.53%
GODFRYPHLP
Volatility: 3.50%
GRSE
Volatility: 3.49%
AVANTIFEED
Volatility: 3.42%
SWANENERGY
Volatility: 3.35%
Stock with Highest Movement
RAYMOND shows the highest price movement with a range of
78.38%
(Max: 13.62%,
Min: -64.76%)
Risk vs Return Analysis
📊 Relative Strength Analysis (IBD style)
| Rank | Symbol | IBD RS | Rating |
|---|---|---|---|
| 1 | NATIONALUM | 99.8 | Leader |
| 2 | GVT&D | 99.6 | Leader |
| 3 | POWERINDIA | 99.4 | Leader |
| 4 | HINDCOPPER | 99.2 | Leader |
| 5 | MCX | 99.0 | Leader |
| 6 | VEDL | 98.8 | Leader |
| 7 | FORCEMOT | 98.6 | Leader |
| 8 | KIRLOSENG | 98.4 | Leader |
| 9 | APARINDS | 98.2 | Leader |
| 10 | SCHNEIDER | 98.0 | Leader |
| 11 | BHARATFORG | 97.8 | Leader |
| 12 | CUMMINSIND | 97.6 | Leader |
| 13 | ANANDRATHI | 97.4 | Leader |
| 14 | GESHIP | 97.2 | Leader |
| 15 | NETWEB | 97.0 | Leader |
| 16 | INDIANB | 96.8 | Leader |
| 17 | BSE | 96.6 | Leader |
| 18 | GMDCLTD | 96.3 | Leader |
| 19 | CHENNPETRO | 96.1 | Leader |
| 20 | ADANIPOWER | 95.9 | Leader |
| 21 | SHRIRAMFIN | 95.7 | Leader |
| 22 | HINDALCO | 95.5 | Leader |
| 23 | CCL | 95.3 | Leader |
| 24 | UNIONBANK | 95.1 | Leader |
| 25 | FEDERALBNK | 94.9 | Leader |
| 26 | DATAPATTNS | 94.7 | Leader |
| 27 | GPIL | 94.5 | Leader |
| 28 | ABB | 94.3 | Leader |
| 29 | ABSLAMC | 94.1 | Leader |
| 30 | SYRMA | 93.9 | Leader |
| 31 | VTL | 93.7 | Leader |
| 32 | LAURUSLABS | 93.5 | Leader |
| 33 | TATASTEEL | 93.3 | Leader |
| 34 | MRPL | 93.1 | Leader |
| 35 | MAHABANK | 92.9 | Leader |
| 36 | JINDALSTEL | 92.7 | Leader |
| 37 | ASHOKLEY | 92.5 | Leader |
| 38 | SAIL | 92.3 | Leader |
| 39 | NATCOPHARM | 92.1 | Leader |
| 40 | ONGC | 91.9 | Leader |
| 41 | HONASA | 91.7 | Leader |
| 42 | RBLBANK | 91.5 | Leader |
| 43 | ADANIENSOL | 91.3 | Leader |
| 44 | KARURVYSYA | 91.1 | Leader |
| 45 | EMCURE | 90.9 | Leader |
| 46 | SONACOMS | 90.7 | Leader |
| 47 | NAVINFLUOR | 90.5 | Leader |
| 48 | AUBANK | 90.3 | Leader |
| 49 | DELHIVERY | 90.1 | Leader |
| 50 | TITAN | 89.9 | Strong |
| 51 | ABCAPITAL | 89.7 | Strong |
| 52 | NAM-INDIA | 89.5 | Strong |
| 53 | MUTHOOTFIN | 89.2 | Strong |
| 54 | SCI | 89.0 | Strong |
| 55 | SBIN | 88.8 | Strong |
| 56 | WELCORP | 88.6 | Strong |
| 57 | LTF | 88.4 | Strong |
| 58 | WAAREEENER | 88.2 | Strong |
| 59 | NMDC | 88.0 | Strong |
| 60 | J&KBANK | 87.8 | Strong |
| 61 | ANGELONE | 87.6 | Strong |
| 62 | CRAFTSMAN | 87.4 | Strong |
| 63 | SAILIFE | 87.2 | Strong |
| 64 | TIMKEN | 87.0 | Strong |
| 65 | TVSMOTOR | 86.8 | Strong |
| 66 | MOTHERSON | 86.6 | Strong |
| 67 | GLENMARK | 86.4 | Strong |
| 68 | APLAPOLLO | 86.2 | Strong |
| 69 | GRANULES | 86.0 | Strong |
| 70 | KEI | 85.8 | Strong |
| 71 | AUROPHARMA | 85.6 | Strong |
| 72 | LINDEINDIA | 85.4 | Strong |
| 73 | JBCHEPHARM | 85.2 | Strong |
| 74 | BEL | 85.0 | Strong |
| 75 | TORNTPHARM | 84.8 | Strong |
| 76 | OIL | 84.6 | Strong |
| 77 | BANKINDIA | 84.4 | Strong |
| 78 | HFCL | 84.2 | Strong |
| 79 | LUPIN | 84.0 | Strong |
| 80 | ASTRAL | 83.8 | Strong |
| 81 | SARDAEN | 83.6 | Strong |
| 82 | ASTERDM | 83.4 | Strong |
| 83 | EICHERMOT | 83.2 | Strong |
| 84 | LLOYDSME | 83.0 | Strong |
| 85 | KSB | 82.8 | Strong |
| 86 | CGPOWER | 82.6 | Strong |
| 87 | PFC | 82.4 | Strong |
| 88 | HEROMOTOCO | 82.2 | Strong |
| 89 | CANBK | 81.9 | Strong |
| 90 | INOXINDIA | 81.7 | Strong |
| 91 | SAMMAANCAP | 81.5 | Strong |
| 92 | CUB | 81.3 | Strong |
| 93 | THERMAX | 81.1 | Strong |
| 94 | COALINDIA | 80.9 | Strong |
| 95 | BHEL | 80.7 | Strong |
| 96 | GRAPHITE | 80.5 | Strong |
| 97 | NTPC | 80.3 | Strong |
| 98 | SIEMENS | 80.1 | Strong |
| 99 | NYKAA | 79.9 | Strong |
| 100 | POLYCAB | 79.7 | Strong |
| 101 | ACMESOLAR | 79.5 | Strong |
| 102 | PREMIERENE | 79.3 | Strong |
| 103 | HINDZINC | 79.1 | Strong |
| 104 | BAJAJ-AUTO | 78.9 | Strong |
| 105 | JSL | 78.7 | Strong |
| 106 | IFCI | 78.5 | Strong |
| 107 | AXISBANK | 78.3 | Strong |
| 108 | USHAMART | 78.1 | Strong |
| 109 | JSWSTEEL | 77.9 | Strong |
| 110 | ADANIGREEN | 77.7 | Strong |
| 111 | POWERGRID | 77.5 | Strong |
| 112 | GRSE | 77.3 | Strong |
| 113 | KAJARIACER | 77.1 | Strong |
| 114 | ELGIEQUIP | 76.9 | Strong |
| 115 | AKUMS | 76.7 | Strong |
| 116 | NLCINDIA | 76.5 | Strong |
| 117 | DMART | 76.3 | Strong |
| 118 | RRKABEL | 76.1 | Strong |
| 119 | AARTIIND | 75.9 | Strong |
| 120 | JKTYRE | 75.7 | Strong |
| 121 | INDUSTOWER | 75.5 | Strong |
| 122 | TORNTPOWER | 75.3 | Strong |
| 123 | MFSL | 75.1 | Strong |
| 124 | ENGINERSIN | 74.8 | Strong |
| 125 | LT | 74.6 | Strong |
| 126 | STARHEALTH | 74.4 | Strong |
| 127 | ZENTEC | 74.2 | Strong |
| 128 | NAVA | 74.0 | Strong |
| 129 | BANDHANBNK | 73.8 | Strong |
| 130 | AIAENG | 73.6 | Strong |
| 131 | LTFOODS | 73.4 | Strong |
| 132 | BOSCHLTD | 73.2 | Strong |
| 133 | KPIL | 73.0 | Strong |
| 134 | AJANTPHARM | 72.8 | Strong |
| 135 | TRIVENI | 72.6 | Strong |
| 136 | ZFCVINDIA | 72.4 | Strong |
| 137 | ADANIPORTS | 72.2 | Strong |
| 138 | HEG | 72.0 | Strong |
| 139 | HDFCAMC | 71.8 | Strong |
| 140 | TATAPOWER | 71.6 | Strong |
| 141 | PHOENIXLTD | 71.4 | Strong |
| 142 | JINDALSAW | 71.2 | Strong |
| 143 | CANFINHOME | 71.0 | Strong |
| 144 | MARICO | 70.8 | Strong |
| 145 | GICRE | 70.6 | Strong |
| 146 | NSLNISP | 70.4 | Strong |
| 147 | ATUL | 70.2 | Strong |
| 148 | MAHSEAMLES | 70.0 | Average |
| 149 | SUNTV | 69.8 | Average |
| 150 | SOLARINDS | 69.6 | Average |
| 151 | IDEA | 69.4 | Average |
| 152 | SCHAEFFLER | 69.2 | Average |
| 153 | SBILIFE | 69.0 | Average |
| 154 | BANKBARODA | 68.8 | Average |
| 155 | AMBER | 68.6 | Average |
| 156 | TIINDIA | 68.4 | Average |
| 157 | APOLLOHOSP | 68.2 | Average |
| 158 | ALKEM | 68.0 | Average |
| 159 | ASAHIINDIA | 67.7 | Average |
| 160 | CEATLTD | 67.5 | Average |
| 161 | FINCABLES | 67.3 | Average |
| 162 | CGCL | 67.1 | Average |
| 163 | GLAND | 66.9 | Average |
| 164 | GMRAIRPORT | 66.7 | Average |
| 165 | PAYTM | 66.5 | Average |
| 166 | SUPREMEIND | 66.3 | Average |
| 167 | INDIACEM | 66.1 | Average |
| 168 | NEULANDLAB | 65.9 | Average |
| 169 | HBLENGINE | 65.7 | Average |
| 170 | NESTLEIND | 65.5 | Average |
| 171 | IGIL | 65.3 | Average |
| 172 | M&MFIN | 65.1 | Average |
| 173 | DRREDDY | 64.9 | Average |
| 174 | ZYDUSLIFE | 64.7 | Average |
| 175 | METROPOLIS | 64.5 | Average |
| 176 | KIMS | 64.3 | Average |
| 177 | IPCALAB | 64.1 | Average |
| 178 | 3MINDIA | 63.9 | Average |
| 179 | FORTIS | 63.7 | Average |
| 180 | MANAPPURAM | 63.5 | Average |
| 181 | OBEROIRLTY | 63.3 | Average |
| 182 | M&M | 63.1 | Average |
| 183 | PFIZER | 62.9 | Average |
| 184 | INDUSINDBK | 62.7 | Average |
| 185 | FACT | 62.5 | Average |
| 186 | CARBORUNIV | 62.3 | Average |
| 187 | GRASIM | 62.1 | Average |
| 188 | HSCL | 61.9 | Average |
| 189 | IOC | 61.7 | Average |
| 190 | IRB | 61.5 | Average |
| 191 | AADHARHFC | 61.3 | Average |
| 192 | PNB | 61.1 | Average |
| 193 | IKS | 60.9 | Average |
| 194 | SUNDARMFIN | 60.6 | Average |
| 195 | RADICO | 60.4 | Average |
| 196 | MAHSCOOTER | 60.2 | Average |
| 197 | NTPCGREEN | 60.0 | Average |
| 198 | SHYAMMETL | 59.8 | Average |
| 199 | NUVAMA | 59.6 | Average |
| 200 | VIJAYA | 59.4 | Average |
| 201 | ENDURANCE | 59.2 | Average |
| 202 | BAYERCROP | 59.0 | Average |
| 203 | JKCEMENT | 58.8 | Average |
| 204 | TECHM | 58.6 | Average |
| 205 | ATGL | 58.4 | Average |
| 206 | JMFINANCIL | 58.2 | Average |
| 207 | LALPATHLAB | 58.0 | Average |
| 208 | CHOICEIN | 57.8 | Average |
| 209 | ITI | 57.6 | Average |
| 210 | SUNPHARMA | 57.4 | Average |
| 211 | CENTURYPLY | 57.2 | Average |
| 212 | CENTRALBK | 57.0 | Average |
| 213 | BALRAMCHIN | 56.8 | Average |
| 214 | TATACONSUM | 56.6 | Average |
| 215 | BAJFINANCE | 56.4 | Average |
| 216 | PERSISTENT | 56.2 | Average |
| 217 | TECHNOE | 56.0 | Average |
| 218 | CHOLAFIN | 55.8 | Average |
| 219 | WELSPUNLIV | 55.6 | Average |
| 220 | PTCIL | 55.4 | Average |
| 221 | BRITANNIA | 55.2 | Average |
| 222 | UNOMINDA | 55.0 | Average |
| 223 | ULTRACEMCO | 54.8 | Average |
| 224 | COROMANDEL | 54.6 | Average |
| 225 | JPPOWER | 54.4 | Average |
| 226 | MARUTI | 54.2 | Average |
| 227 | RELIANCE | 54.0 | Average |
| 228 | JSWENERGY | 53.8 | Average |
| 229 | CESC | 53.5 | Average |
| 230 | BIOCON | 53.3 | Average |
| 231 | GODIGIT | 53.1 | Average |
| 232 | DIVISLAB | 52.9 | Average |
| 233 | BHARTIARTL | 52.7 | Average |
| 234 | DALBHARAT | 52.5 | Average |
| 235 | OLECTRA | 52.3 | Average |
| 236 | MOTILALOFS | 52.1 | Average |
| 237 | ICICIGI | 51.9 | Average |
| 238 | JBMA | 51.7 | Average |
| 239 | ASTRAZEN | 51.5 | Average |
| 240 | CREDITACC | 51.3 | Average |
| 241 | MRF | 51.1 | Average |
| 242 | HCLTECH | 50.9 | Average |
| 243 | TATAINVEST | 50.7 | Average |
| 244 | RECLTD | 50.5 | Average |
| 245 | VOLTAS | 50.3 | Average |
| 246 | ICICIBANK | 50.1 | Average |
| 247 | BALKRISIND | 49.9 | Weak |
| 248 | DOMS | 49.7 | Weak |
| 249 | LICHSGFIN | 49.5 | Weak |
| 250 | RAMCOCEM | 49.3 | Weak |
| 251 | DCMSHRIRAM | 49.1 | Weak |
| 252 | MMTC | 48.9 | Weak |
| 253 | CAMS | 48.7 | Weak |
| 254 | RKFORGE | 48.5 | Weak |
| 255 | LICI | 48.3 | Weak |
| 256 | PVRINOX | 48.1 | Weak |
| 257 | MINDACORP | 47.9 | Weak |
| 258 | HOMEFIRST | 47.7 | Weak |
| 259 | PETRONET | 47.5 | Weak |
| 260 | NH | 47.3 | Weak |
| 261 | VGUARD | 47.1 | Weak |
| 262 | IOB | 46.9 | Weak |
| 263 | FLUOROCHEM | 46.7 | Weak |
| 264 | NIACL | 46.5 | Weak |
| 265 | AGARWALEYE | 46.2 | Weak |
| 266 | BSOFT | 46.0 | Weak |
| 267 | BPCL | 45.8 | Weak |
| 268 | CASTROLIND | 45.6 | Weak |
| 269 | NHPC | 45.4 | Weak |
| 270 | ASIANPAINT | 45.2 | Weak |
| 271 | UNITDSPR | 45.0 | Weak |
| 272 | OLAELEC | 44.8 | Weak |
| 273 | NIVABUPA | 44.6 | Weak |
| 274 | APOLLOTYRE | 44.4 | Weak |
| 275 | JUBLINGREA | 44.2 | Weak |
| 276 | IIFL | 44.0 | Weak |
| 277 | TRIDENT | 43.8 | Weak |
| 278 | INDIAMART | 43.6 | Weak |
| 279 | 360ONE | 43.4 | Weak |
| 280 | UPL | 43.2 | Weak |
| 281 | MAZDOCK | 43.0 | Weak |
| 282 | GODREJAGRO | 42.8 | Weak |
| 283 | WOCKPHARMA | 42.6 | Weak |
| 284 | HAL | 42.4 | Weak |
| 285 | AKZOINDIA | 42.2 | Weak |
| 286 | KPRMILL | 42.0 | Weak |
| 287 | MSUMI | 41.8 | Weak |
| 288 | CERA | 41.6 | Weak |
| 289 | GILLETTE | 41.4 | Weak |
| 290 | RCF | 41.2 | Weak |
| 291 | PIDILITIND | 41.0 | Weak |
| 292 | GAIL | 40.8 | Weak |
| 293 | INDGN | 40.6 | Weak |
| 294 | JSWINFRA | 40.4 | Weak |
| 295 | CAMPUS | 40.2 | Weak |
| 296 | ESCORTS | 40.0 | Weak |
| 297 | RAINBOW | 39.8 | Weak |
| 298 | MGL | 39.6 | Weak |
| 299 | PRAJIND | 39.4 | Weak |
| 300 | PAGEIND | 39.1 | Weak |
| 301 | GRAVITA | 38.9 | Weak |
| 302 | OFSS | 38.7 | Weak |
| 303 | BLUESTARCO | 38.5 | Weak |
| 304 | SAGILITY | 38.3 | Weak |
| 305 | CONCOR | 38.1 | Weak |
| 306 | COCHINSHIP | 37.9 | Weak |
| 307 | BAJAJFINSV | 37.7 | Weak |
| 308 | CHAMBLFERT | 37.5 | Weak |
| 309 | GODREJCP | 37.3 | Weak |
| 310 | CDSL | 37.1 | Weak |
| 311 | FINPIPE | 36.9 | Weak |
| 312 | KIRLOSBROS | 36.7 | Weak |
| 313 | BIKAJI | 36.5 | Weak |
| 314 | SOBHA | 36.3 | Weak |
| 315 | HINDUNILVR | 36.1 | Weak |
| 316 | GLAXO | 35.9 | Weak |
| 317 | PNBHOUSING | 35.7 | Weak |
| 318 | YESBANK | 35.5 | Weak |
| 319 | VBL | 35.3 | Weak |
| 320 | VMM | 35.1 | Weak |
| 321 | CAPLIPOINT | 34.9 | Weak |
| 322 | ADANIENT | 34.7 | Weak |
| 323 | TATACOMM | 34.5 | Weak |
| 324 | BLUEDART | 34.3 | Weak |
| 325 | BHARTIHEXA | 34.1 | Weak |
| 326 | ERIS | 33.9 | Weak |
| 327 | POONAWALLA | 33.7 | Weak |
| 328 | EIDPARRY | 33.5 | Weak |
| 329 | CHALET | 33.3 | Weak |
| 330 | BLS | 33.1 | Weak |
| 331 | EXIDEIND | 32.9 | Weak |
| 332 | IDFCFIRSTB | 32.7 | Weak |
| 333 | SBFC | 32.5 | Weak |
| 334 | POLICYBZR | 32.3 | Weak |
| 335 | BDL | 32.0 | Weak |
| 336 | PRESTIGE | 31.8 | Weak |
| 337 | INDHOTEL | 31.6 | Weak |
| 338 | COLPAL | 31.4 | Weak |
| 339 | ETERNAL | 31.2 | Weak |
| 340 | ACE | 31.0 | Weak |
| 341 | KOTAKBANK | 30.8 | Weak |
| 342 | UCOBANK | 30.6 | Weak |
| 343 | MAXHEALTH | 30.4 | Weak |
| 344 | KALYANKJIL | 30.2 | Weak |
| 345 | NUVOCO | 30.0 | Weak |
| 346 | MPHASIS | 29.8 | Weak |
| 347 | MANKIND | 29.6 | Weak |
| 348 | DABUR | 29.4 | Weak |
| 349 | ANANTRAJ | 29.2 | Weak |
| 350 | RITES | 29.0 | Weak |
| 351 | ELECON | 28.8 | Weak |
| 352 | ABBOTINDIA | 28.6 | Weak |
| 353 | BEML | 28.4 | Weak |
| 354 | TRENT | 28.2 | Weak |
| 355 | EIHOTEL | 28.0 | Weak |
| 356 | INDIGO | 27.8 | Weak |
| 357 | TRITURBINE | 27.6 | Weak |
| 358 | HYUNDAI | 27.4 | Weak |
| 359 | TBOTEK | 27.2 | Weak |
| 360 | BERGEPAINT | 27.0 | Weak |
| 361 | LTIM | 26.8 | Weak |
| 362 | ICICIPRULI | 26.6 | Weak |
| 363 | HAVELLS | 26.4 | Weak |
| 364 | CRISIL | 26.2 | Weak |
| 365 | BASF | 26.0 | Weak |
| 366 | CHOLAHLDNG | 25.8 | Weak |
| 367 | INFY | 25.6 | Weak |
| 368 | HINDPETRO | 25.4 | Weak |
| 369 | MEDANTA | 25.2 | Weak |
| 370 | HDFCBANK | 24.9 | Weak |
| 371 | RHIM | 24.7 | Weak |
| 372 | TITAGARH | 24.5 | Weak |
| 373 | JIOFIN | 24.3 | Weak |
| 374 | SJVN | 24.1 | Weak |
| 375 | AIIL | 23.9 | Weak |
| 376 | IGL | 23.7 | Weak |
| 377 | SHREECEM | 23.5 | Weak |
| 378 | PIIND | 23.3 | Weak |
| 379 | JYOTICNC | 23.1 | Weak |
| 380 | JUBLPHARMA | 22.9 | Weak |
| 381 | WIPRO | 22.7 | Weak |
| 382 | IEX | 22.5 | Weak |
| 383 | SUMICHEM | 22.3 | Weak |
| 384 | CROMPTON | 22.1 | Weak |
| 385 | HUDCO | 21.9 | Weak |
| 386 | NCC | 21.7 | Weak |
| 387 | GODFRYPHLP | 21.5 | Weak |
| 388 | GODREJIND | 21.3 | Weak |
| 389 | TATATECH | 21.1 | Weak |
| 390 | SUZLON | 20.9 | Weak |
| 391 | SUNDRMFAST | 20.7 | Weak |
| 392 | BAJAJHLDNG | 20.5 | Weak |
| 393 | TATACHEM | 20.3 | Weak |
| 394 | GODREJPROP | 20.1 | Weak |
| 395 | UTIAMC | 19.9 | Weak |
| 396 | APLLTD | 19.7 | Weak |
| 397 | DEEPAKNTR | 19.5 | Weak |
| 398 | IREDA | 19.3 | Weak |
| 399 | REDINGTON | 19.1 | Weak |
| 400 | AEGISLOG | 18.9 | Weak |
| 401 | UBL | 18.7 | Weak |
| 402 | NBCC | 18.5 | Weak |
| 403 | CIPLA | 18.3 | Weak |
| 404 | ITC | 18.1 | Weak |
| 405 | ALOKINDS | 17.8 | Weak |
| 406 | TEJASNET | 17.6 | Weak |
| 407 | DEEPAKFERT | 17.4 | Weak |
| 408 | RAILTEL | 17.2 | Weak |
| 409 | JWL | 17.0 | Weak |
| 410 | ECLERX | 16.8 | Weak |
| 411 | HDFCLIFE | 16.6 | Weak |
| 412 | IRCON | 16.4 | Weak |
| 413 | ONESOURCE | 16.2 | Weak |
| 414 | VENTIVE | 16.0 | Weak |
| 415 | SRF | 15.8 | Weak |
| 416 | KFINTECH | 15.6 | Weak |
| 417 | TCS | 15.4 | Weak |
| 418 | KAYNES | 15.2 | Weak |
| 419 | WHIRLPOOL | 15.0 | Weak |
| 420 | IRFC | 14.8 | Weak |
| 421 | LTTS | 14.6 | Weak |
| 422 | HONAUT | 14.4 | Weak |
| 423 | DLF | 14.2 | Weak |
| 424 | PATANJALI | 14.0 | Weak |
| 425 | TATAELXSI | 13.8 | Weak |
| 426 | BAJAJHFL | 13.6 | Weak |
| 427 | AFCONS | 13.4 | Weak |
| 428 | BBTC | 13.2 | Weak |
| 429 | AMBUJACEM | 13.0 | Weak |
| 430 | EMAMILTD | 12.8 | Weak |
| 431 | RVNL | 12.6 | Weak |
| 432 | PCBL | 12.4 | Weak |
| 433 | IRCTC | 12.2 | Weak |
| 434 | IDBI | 12.0 | Weak |
| 435 | AFFLE | 11.8 | Weak |
| 436 | ALKYLAMINE | 11.6 | Weak |
| 437 | TTML | 11.4 | Weak |
| 438 | ARE&M | 11.2 | Weak |
| 439 | BRIGADE | 11.0 | Weak |
| 440 | ZEEL | 10.8 | Weak |
| 441 | CYIENT | 10.5 | Weak |
| 442 | ABREL | 10.3 | Weak |
| 443 | ZENSARTECH | 10.1 | Weak |
| 444 | ACC | 9.9 | Weak |
| 445 | SIGNATURE | 9.7 | Weak |
| 446 | GSPL | 9.5 | Weak |
| 447 | SAREGAMA | 9.3 | Weak |
| 448 | SBICARD | 9.1 | Weak |
| 449 | PPLPHARMA | 8.9 | Weak |
| 450 | KEC | 8.7 | Weak |
| 451 | DIXON | 8.5 | Weak |
| 452 | HAPPSTMNDS | 8.3 | Weak |
| 453 | COFORGE | 8.1 | Weak |
| 454 | ITCHOTELS | 7.9 | Weak |
| 455 | LEMONTREE | 7.7 | Weak |
| 456 | FIRSTCRY | 7.5 | Weak |
| 457 | PGHH | 7.3 | Weak |
| 458 | GUJGASLTD | 7.1 | Weak |
| 459 | AAVAS | 6.9 | Weak |
| 460 | JUBLFOOD | 6.7 | Weak |
| 461 | POLYMED | 6.5 | Weak |
| 462 | SWIGGY | 6.3 | Weak |
| 463 | JYOTHYLAB | 6.1 | Weak |
| 464 | NAUKRI | 5.9 | Weak |
| 465 | APTUS | 5.7 | Weak |
| 466 | INTELLECT | 5.5 | Weak |
| 467 | AWL | 5.3 | Weak |
| 468 | FIVESTAR | 5.1 | Weak |
| 469 | SWANCORP | 4.9 | Weak |
| 470 | PGEL | 4.7 | Weak |
| 471 | DEVYANI | 4.5 | Weak |
| 472 | TARIL | 4.3 | Weak |
| 473 | LODHA | 4.1 | Weak |
| 474 | CLEAN | 3.9 | Weak |
| 475 | CONCORDBIO | 3.7 | Weak |
| 476 | SONATSOFTW | 3.4 | Weak |
| 477 | LATENTVIEW | 3.2 | Weak |
| 478 | DBREALTY | 3.0 | Weak |
| 479 | FSL | 2.8 | Weak |
| 480 | ABFRL | 2.6 | Weak |
| 481 | BATAINDIA | 2.4 | Weak |
| 482 | HEXT | 2.2 | Weak |
| 483 | SAPPHIRE | 2.0 | Weak |
| 484 | BLUEJET | 1.8 | Weak |
| 485 | INOXWIND | 1.6 | Weak |
| 486 | SYNGENE | 1.4 | Weak |
| 487 | MANYAVAR | 1.2 | Weak |
| 488 | KPITTECH | 1.0 | Weak |
| 489 | RPOWER | 0.8 | Weak |
| 490 | SKFINDIA | 0.6 | Weak |
| 491 | MAPMYINDIA | 0.4 | Weak |
| 492 | NEWGEN | 0.2 | Weak |
| 493 | RELINFRA | 0.0 | Weak |
🏆 RS Analysis Summary
🚀 Stock Breakouts
No breakouts found.
Prady ©